Submitted:
02 January 2026
Posted:
04 January 2026
You are already at the latest version
Abstract
The term “pristine interface” is used for differentiating emulsions that consist of only water and oil with no surfactant from the Pickering emulsions, which are also surfactant-free but stabilized with colloidal particles. We review 23 papers dedicated to such emulsions prepared from a wide variety of liquids.
We studied here the evolution of one of such emulsion, hexadecane-in-water at 4% vl, over a long period of time, from days to weeks. We discovered that the droplet size is growing with time with the rate that depends on mixing conditions, which supports a coalescence hypothesis. However, this coalescence is unusual because the size reaches a certain constant value, which contradicts typical coalescence behavior. In order to explain this peculiarity, we employ a theoretical model that was developed for pristine nano-bubbles stability.
We hypothesize the existence of a layer of structured water molecules at the interface, following Eastoe and Ellis (Adv in Colloid and Interface Sci., 134-135, 89-95, 2007) and many other prominent scientists. Then we point out that the Electric Double Layer exerts a force on the water dipole moments in this layer (dielectrostatic force) that compensates Kelvin’s pressure. The droplet size calculated using this model is close to the measured sizes. The second factor associated with this layer is the repulsion of the water dipole moments, which we show can compensate for surface tension parallel to the interface. After ruling out alternative hypotheses with our data, we conclude that the model suggested for explaining the stability of nano-bubbles is also consistent with our results for these “pristine emulsions”.
Keywords:
pristine emulsion
; droplet size
; zeta potential
; dielectrostatic force
; surface tension
; hydrophobic interaction
Introduction
There is an unusual type of emulsion described by several independent groups from different countries during the last 25 years [1,2,3,4,5,6,7,8,9,10,11,12,13,14,15,16,17,18,19,20,21,22]. These emulsions consist of only two liquids with no added surfactant. They are different from Pickering emulsions [23], which are stabilized with colloid particles. There is a term “surfactant-free emulsions” that is applied for classifying both of them, which might create confusion. This type of emulsion does not have any added surface stabilizing agent, in contrast to the Pickering emulsions. Perhaps this was a motivation for Beattie and Djerdjev to introduce a special term for such a liquid-liquid interface – “pristine” [10]. It would be logical to call such emulsions “pristine emulsions” for distinguishing them from Pickering emulsions [23].
This type of emulsion is very promising apparently for controlling chemical kinetics according to the extensive review by LaCour et all [19]. This review describes examples of many organic and redox reactions that occur with much faster kinetics in water microdroplets and oil−water emulsions than in bulk solution.
We have summarized all published papers that we knew or could find on this subject in Table 1, listing all liquids used for making such emulsions. Authors of the cited papers express consensus in the long-term stability of these emulsions, lasting days and weeks.
Table 1 listing all liquids used for making such emulsions. This list is quite diverse, which allows us to hypothesize that there is a common mechanism leading to these emulsions’ stability. One might assume that the lifespan of such “pristine emulsions” would be very short. They would be destroyed either by coalescence, or by Oswald ripening [24], or both. Surprisingly, they turn out to be much more stable with the emulsions demonstrating long-term stability, lasting for days and even weeks.
The first hypothesis for explaining this paradoxical longevity would be the presence of impurities in the oil phase. Such impurities could serve as a surfactant, reduce surface tension, and so promote stability. There have been publications along these lines for both nano-bubbles and pristine emulsions. However, detailed verification experiments conducted by many groups with very thorough purification confirmed that longevity remains independently of the degree of cleaning. We provide several more arguments against this hypothesis based on results of this study in Appendix 1.

Table 1.
Summary of publications on the “pristine emulsions”. All emulsions consist of water and oil. The oil phase might be different. We list these oils in the third column that is labeled “oil”.
Table 1.
Summary of publications on the “pristine emulsions”. All emulsions consist of water and oil. The oil phase might be different. We list these oils in the third column that is labeled “oil”.
| Year | Country (and affiliation) of authors [reference] | Oil |
| Oil-in-water emulsions | ||
| 1999-2018 | Japan [1,2,3,4,5,6] |
|
| 2003-2004 | University of California, USA [7,8] |
|
| 2004 | Bristol University, UK [9] |
|
| 2004, 2025 | Beattie and Djerdjev from Sydney University, Australia [10,11] |
|
| 2020 | China [17] |
|
| 2022 | Korea [12] |
|
| 2023 | China, Japan, Canada [16] |
|
| 2025 | USA and China [18] |
|
| 2018,2025 | France [20,21,22] |
|
| Water-in-oil emulsion | ||
| 2010-2018 | Japan [13,14,15] |
|
A second hypothesis is that an electric surface charge at the pristine interface contributes to the observed stability. There is seemingly consensus on this. However, there is still some uncertainty regarding the origin of the surface charge.
Most of the authors point towards adsorption of OH- ions as the major factor with vast supporting evidence collected mostly for degassed systems. There is another possibility in aqueous samples that are opened to atmosphere and consequently absorb CO2. Ionic composition of such systems is affected by the presence of bicarbonate anion, HCO3-, and the carbonate anion, CO3-2, as was shown for instance by Ninham and Nostro by measuring conductivity and phase separation [25]. Such opened to air pristine emulsions could be considered as aqueous carbonated systems [26,27] with carbonic acid ions adsorbed at the interface. There are some serious arguments supporting this viewpoint presented in the papers by Ganachaud et al [20,21,22].
No matter what ions determine pristine emulsions droplet charge their existence and longevity is paradoxical. Here are many statements in the papers cited above declaring such paradoxical longevity, but there is not sufficient data for quantifying it. That is the main subject of this paper.
We study here long-term longevity of well-studied hexadecane-in-water 4% vl pristine emulsion. In contrast to previous studies, we investigated evolution of this emulsion over time by measuring gradually growing droplet size continuously over days and even weeks. We discovered that the rate of this evolution depends on mixing conditions, which point to coalescence as the driving mechanism. The Ostwald ripening is too slow according to our calculations based on Lifshitz-Slyozov-Wagner (LSW) [28,29] theory, Appendix 2.
However, this coalescence is unusual because the emulsion droplet size seems to reach a constant submicron value. Explanation of this peculiarity is the second goal of this paper. Our explanation is based on similarity between paradoxical longevity of pristine emulsions and nano-bubbles [30,31]. There is a theoretical model that was developed for nano-bubbles in the paper [31]. We apply the same model here for pristine emulsions and even further develop it in the theoretical section in Discussion below. This model predicts constant droplet size that is quite close to the measured value.
Materials
We conducted an experiment with the hexadecane-in-water emulsion similar to Beattie and Djerdjev [10]. Their method of developing pristine emulsion contains a lot of chemical purification procedures and prevention of CO2 adsorption by using an N2 atmosphere. The motivation of such an approach is clear – elimination of impurities as possible surfactants. However, it creates an impression that pristine emulsions are a rare and exotic fluke. The authors of that paper wrote that they were able to replicate their results under conventional conditions when samples are open to air. That is what we wanted to test for removing a veil of mystery from pristine emulsions.
Therefore, we used initially hexadecane (HD) from Sigma-Aldrich with purity specified as ≥99%. We prepared several emulsions using this HD. We report the results of three of them, labeled as emulsions 1, 2 and 3. Then, after discussing results with several experts in the field, we were criticized that this HD is not sufficiently pure. Reference to the detailed Beattie and Djerdjev work [9] was not sufficient. Thus, we obtained cleaner HD on Sigma-Aldrich with purity specified as ≥99.8%, which was purified with all available methods by producer The potential amount of impurities is 5 times smaller. We calculated coverage of the droplet interfaces with this possible 0.2% impurities. These calculations reveal that it is not sufficient for surface coverage. For water we used store-bought distilled water.
Water ionic strength was adjusted to 0.001 M using NaCl from Sigma-Aldrich.
The pH was adjusted using a 0.1 N solution of NaOH.
Sample Preparation and Measurement Protocol
For preparing the initial sample mixture we added 3.7 g of hexadecane to 114.9 g of 0.001 M NaCl aqueous solution with high pH. This would ensure 4% vl emulsions assuming that we could mix these liquids. The initial pH value was close to 9 for emulsions 1, 2, and 3, and very close to 10 for emulsion 4. Emulsions 1,2 and 3 were prepared in separate glass vials. Emulsion 4 was prepared directly in the measurement cell of the measuring instrument.
We sonicated the mixture for 1 minute using a high-power 20 KHz horn sonic probe since it is known that sonication causes emulsification [32,33]. This method allows manual mixing of the sample and brought the top layers of the liquid into the sonic jet stream. This indeed leads to the formation of an opaque liquid with no visible phase border line. The pH value of the mixture drops, reflecting adsorption of OH- ions. Then we re-adjust pH back to the initial value (9 - 10 range) by adding small amounts of NaOH and sonicate for 1 minute again. Emulsions must be mixed by magnetic mixing or pumping to ensure the homogeneous spreading of NaOH.
After that we let the emulsion evolve for up to 24 hours keeping it mixed with a low power agitator, using a magnetic mixer. We repeat such cycles 3 times over 3 days, which allowed us to achieve the smallest droplet size of about 350 nm. Further sonication and equilibration is not effective in terms of droplet size reduction.
It turns out that the emulsion undergoes evolution of the droplet size after these initial 3 days. For monitoring this long-term evolution, we saved emulsions 1,2 and 3 in closed vials and measured them with intervals of 5 days. Emulsions 1, 2 and 3 stayed idle in the glass vial between measurements. They were mixed only during measurement when poured back into the measuring cell every 5 days. In contrary, emulsion 4 remained in the measuring cell and underwent continuous measurement of both the zeta potential and droplet size distribution. But we kept measuring this emulsion for two more days, just 5 measurements per day for monitoring long-term evolution of droplet size. Then we stopped because the droplet size reached a constant value.
Instruments
We used the Acoustic and Electroacoustic Spectrometer DT-1202. This instrument has an acoustic sensor for measuring ultrasound attenuation spectra within the frequency range from 3 MHz to 100 MHz. These spectra are the raw data used for calculating droplet size distribution.
This instrument also has an electroacoustic zeta potential probe that measures Colloid Vibration Current (CVI), which is the raw data for calculating droplet zeta potential. All details can be found in the book [34] and ISO standards [35,36,37,38]. This instrument can also measure conductivity, pH and temperature.
The functionality of Zeta potential probe was verified by measuring zeta potential of silica Ludox certified reference material [38] before and after every experiment.
This instrument has a built-in magnetic mixer that creates extra pressure on the bottom of the cell, which in turn pumps liquid through the cell. It is possible to adjust the rate of pumping by setting magnetic cross rotation to different speeds.
We use an ultrasonic probe by Sonic & Materials Inc operating at 20 KHz.
Experimental Results
The evolution of the median droplet diameter is shown for all four studied emulsion samples in Figure 1. We have only a few points for emulsions 2 and 3, which were earlier tries, because we did not realize the existence of long-term evolution at that time.
It is seen that all these droplet size-time dependences merge towards the same value around 650 nm.
The long-term evolution progresses affects only droplet size. Zeta potential remains constant after initial 3 days of the emulsion’s preparation, as shown in Table 1 for emulsions 3 and 4.
Discussion
The long-term evolution of the droplet size shown in Figure 1 points toward the existence of a stationary droplet size with a value around 650 nm. We propose using the theoretical model developed for bare (pristine) nano-bubbles, which also predicts the existence of the stationary nano-bubbles size [30].
This model employs the assumption of the existence of a structured water layer at the interface with oriented water molecule dipoles. This idea is very old. According to Lyklema [40], the first mention of the water structure in EDL was made by Hardy in 1915 [41]. Then, there were Frank and Evans in 1945 [42], and Bockris in 1963 [43]. It was experimentally verified using atomic force microscopy by Israelachvili, Pashley, Ninham and Craig [44,45,46], theoretically supported by Derjaguin et al. [47] and Mansui-Ruckenstein [48], and mentioned in the books by Lyklema [40] and Hunter [49]. Recent studies of dynamic surface tension of water [50], Raman spectroscopy of interfacial water layer [17], surface charge [51] and electrophoretic mobility [52] also indicate peculiarities in the water surface layer structure.
This hypothesis was suggested specifically for explaining the existence of pristine emulsions by Eastoe and Ellis [53]. Similar suggestion of the structured water interfacial layer affecting interaction of bubbles was introduced by Craig, Ninham and Pashley [54].
However, neither the structured water layer nor the electric surface charge could explain the constant droplet size when taken separately. It is known from Onsager-Samars theory [55] that electric double layer causes only a few percents change in the surface tension. On the other hand, interaction of the oriented water dipoles with the inhomogeneous electric field of the double layer offers such an explanation according to paper [31]. This interaction leads to two additional surface forces, one in the normal direction towards the interface and one in the lateral direction. We present theoretical models of these forces below.
Dielectrostatic Force Determines Stable Size
The first force is normal to the interface. Its origin is the gradient of inhomogeneous EDL electric field acting on dipole moments of the oriented water molecules. It is known that such a force induces motion of objects that possess a dipole moment – dielectrophoretic motion [56]. In this case water molecules do not move, which suggest a term “dielectrostatic” for this force. It was shown in Ref [31] that such force could compensate completely for the excessive pressure in nano-bubbles. The balance of these two forces leads to stable nano-bubbles size.
In case of emulsion droplets, the dielectrostatic force competes with excessive pressure caused by the interfacial curvature – Kelvin’s effect [57]. We could assume that this balance also leads to the observed stable droplet size of our studied emulsions at the end of long-term evolution.
We can verify this assumption by calculating the radius of such stable droplets (astable) using the following Equation derived in Ref [31]:
We can apply this equation to predict a presumably stable droplet size of hexadecane-in-water emulsion that we study here. The values of liquids properties can be found in the papers [58,59,60,61,62,63].
There are two parameters in Eq.1 with a high degree of uncertainty – the thickness of the structured water layer Lstr and the electric potential at the interface, assumed to be the zeta potential, ζ. We can assume that it consists of two water molecules layers and therefore L=0.48 *10-9 m. The electric potential at the interface is actually much larger than the measured zeta potential, ζ, because of the structured water layer, which is immobile. The measured absolute value of zeta potential is close to 40 mV. We assume here that the electric potential at the interface is twice higher – 80 mV. This assumption would require verification in later studies, but it is sufficient now for an approximate estimate.
Substituting these numbers into Eq.1 leads to the diameter of the stable emulsion droplet as 0.79 micron. This is a surprisingly reasonable value, close to the measured diameter of the stable droplet shown in Figure 3 which was ~ 0.65 micron. This is supportive of the hypothesis that the balance of normal forces between excessive Kelvin’s pressure and dielectrostatic force might indeed control the droplet size.
There is one more aspect associated with the dielectrostatic force. Introduction of this force disrupts the balance between Kelvin’s pressure and surface tension. There must be other factors that compete with surface tension at the stationary state. Such a factor was suggested in Ref [31] - repulsion of the water molecules dipole moments in the structured water interfacial layer. We suggest some calculation of the magnitude of the factor in the next section.
Repulsion of Oriented Water Dipoles
The dipole moments of the parallel oriented water molecules in the structured surface layer repel each other contributing to the lateral interactions at the interface. We can characterize it’s contribution to the surface tension and assign the symbol γstr. We will try to estimate the value of this contribution and compare it with the known experimental value of water-hexadecane surface tension 0.055 N/m.
We begin with a general definition of the surface tension γ that can be found in the Lyklema book [40], Eq. 2.4.5:
Let us assume that one water molecule with dipole moment dw comes into this layer. It would cause a change in the energy by ΔUdd due to interacting with other molecules dipole moments and increase the surface by ΔA. Therefore, the contribution to the surface tension approximately equals:
In order to estimate the energy of the dipole-dipole interaction we consider interactions only with the molecular nearest neighbors of the added molecule. Figure 2 illustrates the simplest symmetrical positioning of water molecules in the element of the interfacial layer. We’re using a simple square lattice and considering only the nearest 4 neighbors. Our calculation here is to check if the repulsion resulting from the parallel dipoles is at all comparable to the surface tension. The distance between molecules (L) is taken as constant. It is seen that the added molecule has roughly four neighboring molecules.
We also adopt a simple additive approach to estimating the interaction energy.
The interaction energy Udd of two parallel dipoles dw in a medium having dielectric constant ε is:
where ε0 is dielectric permittivity of vacuum, r is distance between centers of the dipoles.
Assuming that the added molecule interacts with 4 others as shown on Figure 4, the total change in surface energy due to this dipole-dipole interaction equals:
where we use r = L, according to Figure 4.
Variation in the surface area ΔA equals:
Substituting Eqs. 5 and 6 into Eq. 3 leads to Eq 7:
The average distance between water molecules can be estimated from the fact that 1 m3 of water contains 55,500 moles [(1000 kg / 0.018 kg/mol)]. The volume (L3) corresponding to the single molecule equals 1 m3 divided by 55500*NA. We find L from Eq 8:
Now we can estimate the value of γstr using values of all parameters from the papers [56,57,58,59,60]
It turns out that the potential contribution of oriented water dipoles repulsion to the surface tension can be close to the known value of hexadecane-water interface – 0.055 N/m.
This calculation underestimates dipole-dipole repulsion because we assumed the distance between them in the surface layer being the same as in the bulk – 0.3 nm. However, it should be smaller because of surface tension pushing them closer. A reduction of this distance even by a small amount would have a large impact on their repulsion due to the 5th power dependence. It turns out that there would be complete compensation of the two effects if the average distance between water dipoles in the structured layer reduces to 0.23 nm, which seems quite reasonable.
Balance of Forces at Pristine Interfaces with Structured Water Layer
It is usually assumed that only two forces are acting at the water-oil-interface of an emulsion droplet: surface tension and Kelvin’s pressure force due to curvature.
The existence of the electric double layer at the interface is an additional factor. However, it is not sufficient by itself to explain our experimental observation. That is why we employ the hypothesis of the structured water layer. This hypothesis leads to two more forces that counter-act with the classical ones. This new force balance is shown in Figure 3.
Figure 3.
Illustration of the force balance at pristine water-oil interface with structured layer of water molecules. Usually only two forces (Kelvin pressure and surface tension) are considered; however, we are hypothesizing the existence of two additional forces not previously recognized (dielectrostatic force and dipole-dipole repulsion).
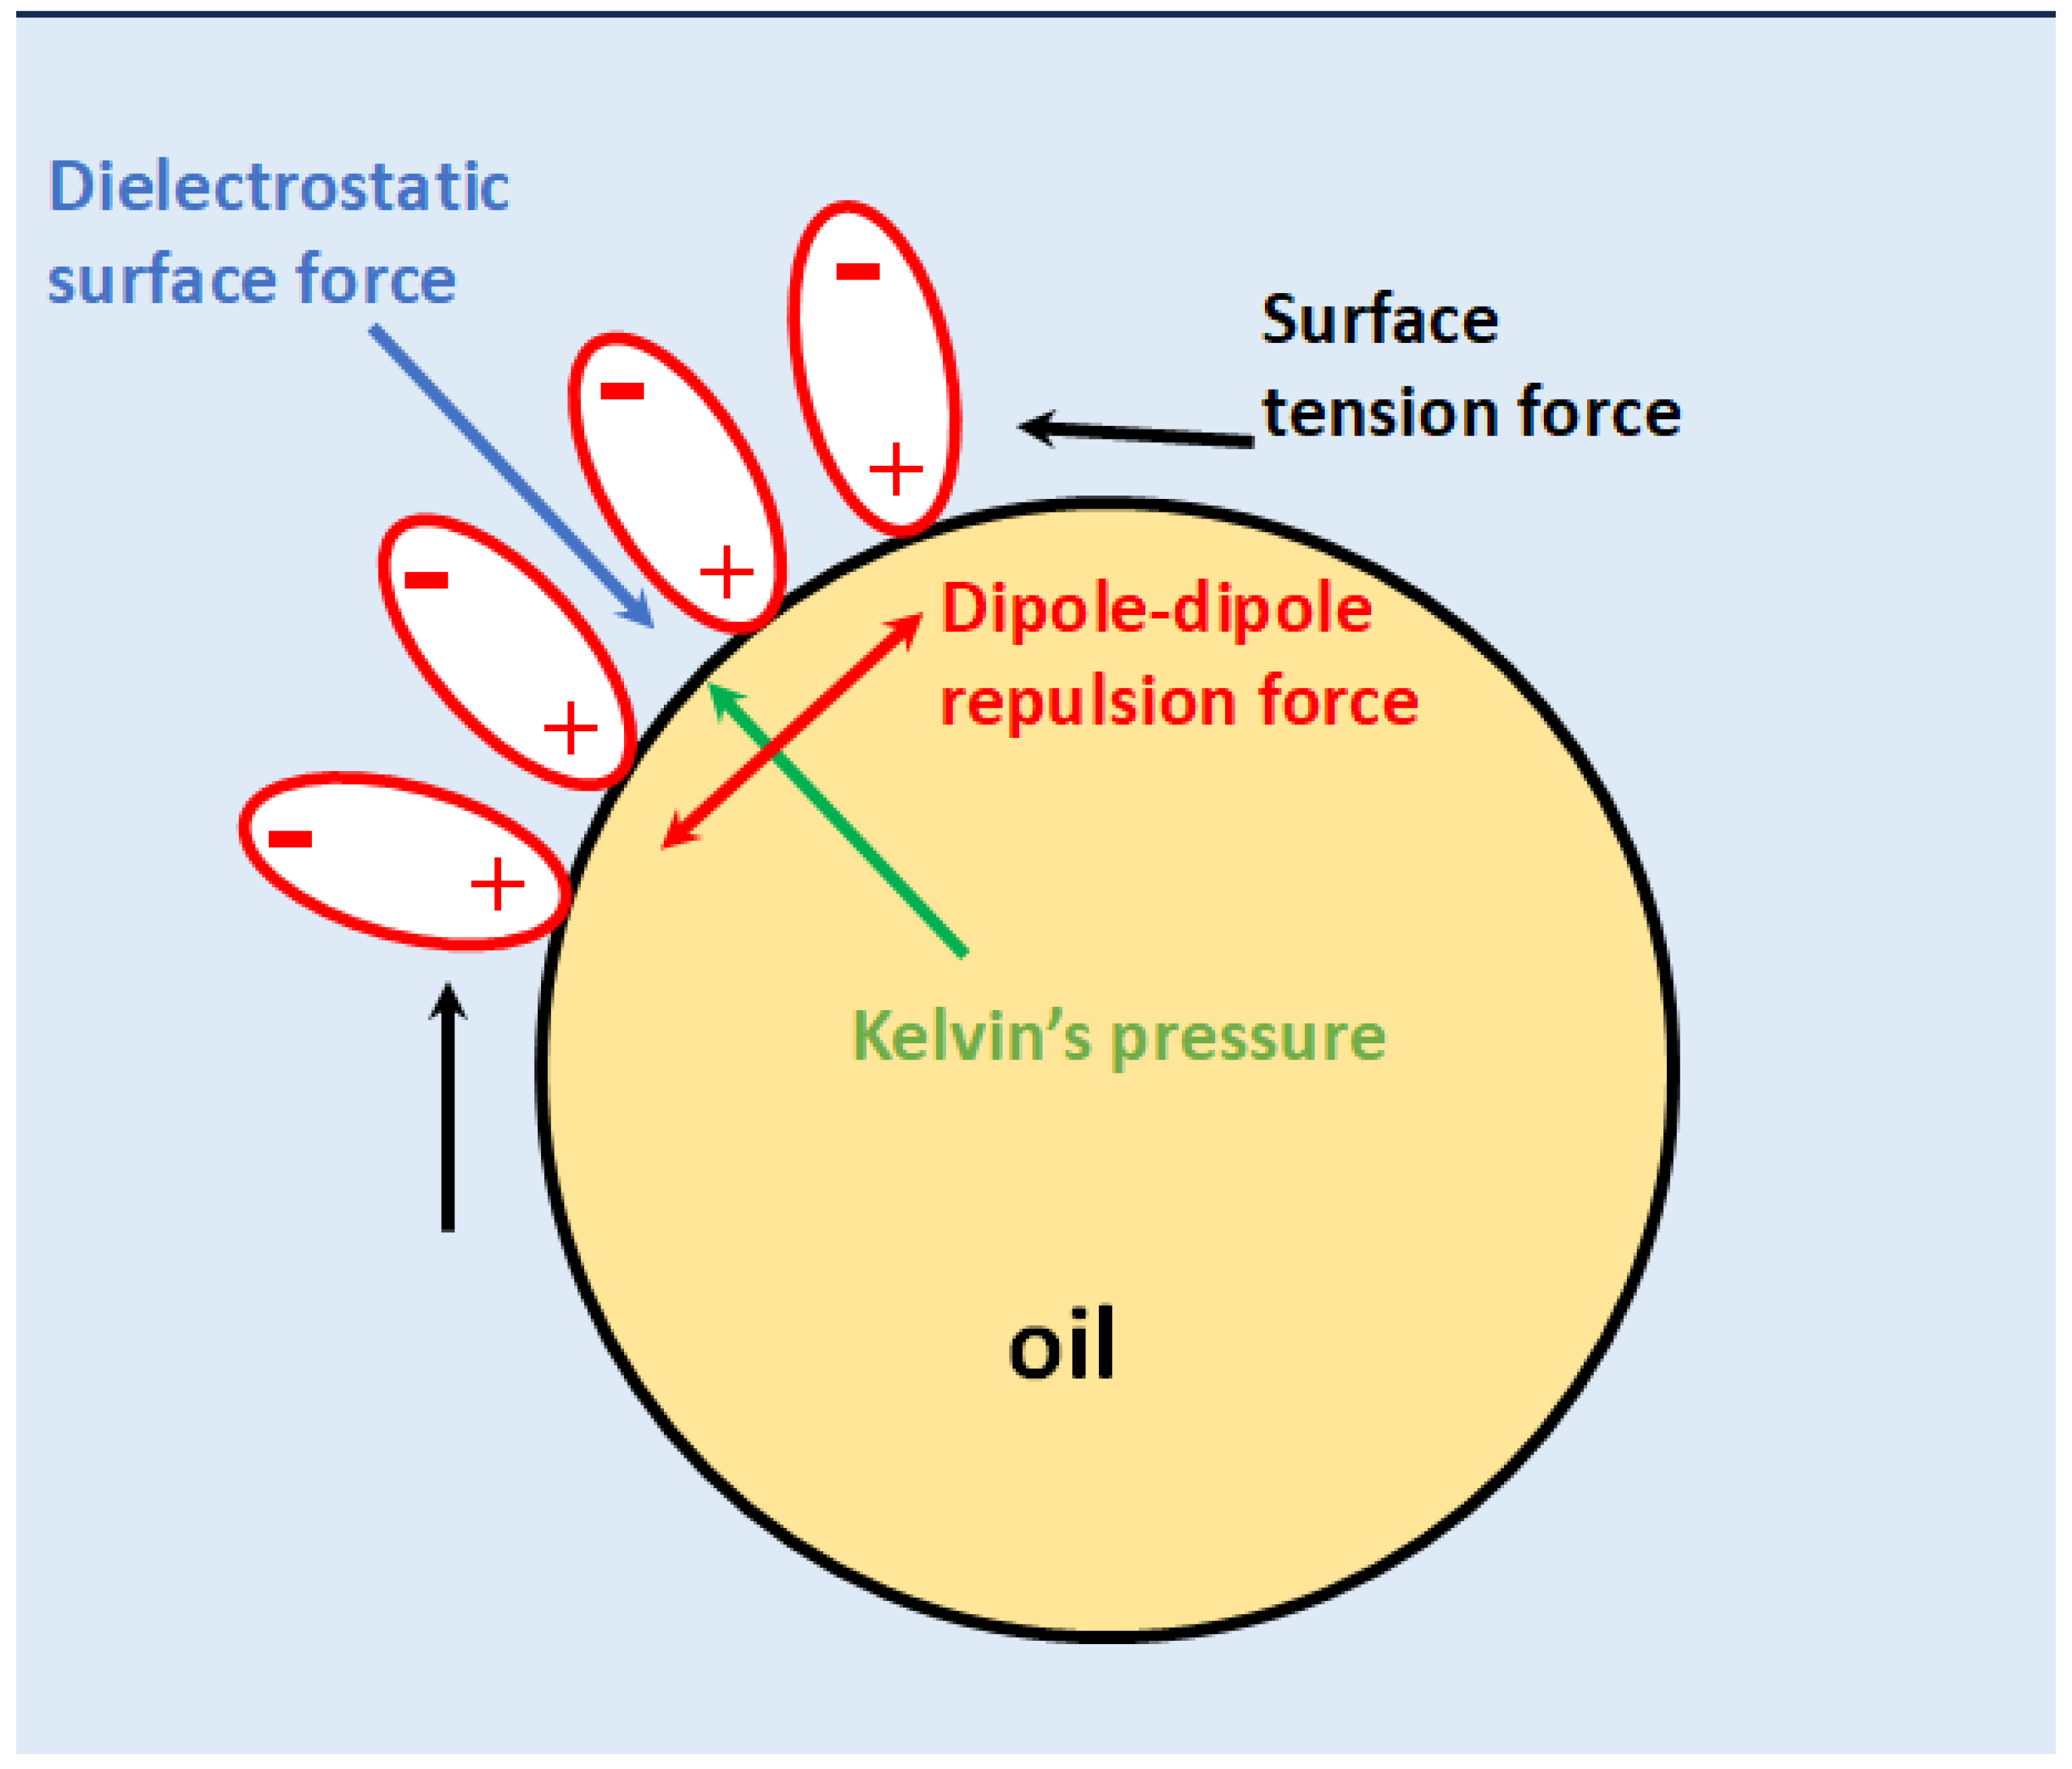
There are two normal forces: Kelvin’s pressure and dielectrostatic. They completely compensate each other at a particular droplet size, given with Eq. 1. There are two lateral forces at a given local position at the interface: surface tension and repulsion of water molecules dipole moments
What Liquids Could Form “Pristine Emulsion”
Not all liquids can form pristine emulsion. We tried, for instance, toluene and failed. It is possible that the capability of creating such pristine emulsion is linked simply to the small size of the toluene molecule. Larger molecules can have a more stable emulsion. The molecular weight of toluene 92 g/mol is much smaller than molecular weight of hexadecane 226 g/mol.
There is an insightful analysis of the water molecule’s structure building by non-polar molecules given by Frank and Evans [42]. They attributed insolubility of non-polar substances in water more to entropy effect, rather than internal energy. They wrote: …”Large, non-polar molecules have stronger van der Waals force fields around them than do small ones, and are more strongly held in any condense phase, including aqueous solutions. The larger they are, however, the larger the iceberg which they produce in water, and therefore the greater the loss in entropy involved in dissolving them…”.
It would benefit future studies of pristine emulsions to have a quick test that could predict whether a particular liquid is capable of creating such an emulsion. It seems that pristine emulsion would be possible if the pH of the mixture drops after the very first sonication. If it remains constant, above 9 as for the initial water used for the mixture preparation, then there is no adsorption of OH- ions, no interfacial charge change, and the mixture would not yield a stable emulsion.
Conclusions
There have been multiple studies indicating that certain liquids form stable oil-in-water and water-in-oil emulsion with a longevity on the scale of days, even weeks without surfactants or any other surface stabilizing substance. We adopt the term “pristine emulsion” for these mixtures following Beattie and Djerdjev [10]. We reproduced emulsions from that study (4% vl hexadecane-in-water) by adjusting the water pH above 9 and then applying sonication in several consecutive steps. We modified Beattie and Djerdjev approach somewhat. Instead of de-gassing it we did not isolate emulsion from CO2, which lead to the formation of carbonic acid in the water phase. We achieved full emulsification when all added hexadecane formed droplets. Such an emulsion remains relatively stable for hundreds of hours, but droplets properties exhibit certain evolution. The rate of the droplet size growth depends on the mixing conditions, which indicates coalescence as a driving mechanism. There is one peculiarity of this coalescence – droplet size reaches a constant value. This cannot be explained by the existence of the electric surface charge which does not explain the emulsification process because it does not ensure sufficient reduction of the surface tension. That is why we invoke the hypothesis of the structured water layer at the interface, as was suggested for such emulsions previously by Eastoe and Ellis [53] and for bubbles by Craig, Ninham and Pashley [54].
The structured water layer by itself is also insufficient for explaining observed long-term evolution patterns. However, their interaction of the electric double layer with structured water layer offers such explanation. It was shown in Ref [31] for nano-bubbles, another object with a “pristine interface”. It was shown there that the interaction of these two layers leads to two new surface forces – dielectrostic that acts in the normal direction and repulsion of water dipoles acting in the lateral direction. We suggested extending this model to pristine emulsions.
The dielectrostatic force could balance Kelvin’s pressure force and determine the observed droplet size of stable emulsion after long-term evolution. The calculated droplet size turns out to be close to the experimentally measured droplet size. The lateral force of repulsion between oriented water dipoles in the structed layer compensates for surface tension.
Appendix 1. Arguments Against Hypothesis of Impurities as Origin of Observed Emulsification
First of all, several authors specifically mentioned that high reproducibility of their experiments ruled out impurities as potential explanation of emulsification.
Secondly, we also tested this hypothesis by multiple sonication steps. If surfactant-like impurities are responsible for the observed emulsion stability, then a simple one step sonication would produce such emulsions. Instead, we observed that multiple sonication steps with pH adjustments and equilibration are required. We describe the full procedure in the section on Materials and Sample preparation. A similar preparation procedure was described by Beattie and Djerdiev [10]. The impurities hypothesis cannot explain why these multiple steps are required for preparing pristine emulsions.
Third, we design our experiments using hexadecane following the method of Beattie and Djerdjev [10], with >99.8% proof from Sigma-Aldrich. Here we present calculations indicating that 0.2% of surface-active impurity cannot provide sufficient surface coverage for emulsions with submicron droplet size. For all these reasons, we rule out the surfactant impurities hypothesis.
Let us calculate the amount of surfactant for complete coverage of the spherical droplet with radius adrop. We assume that surfactant molecules can be characterized approximately with radius asurf. Then the required volume fraction of surfactant φcr equals to the ratio of the spherical layer around the droplet with thickness 2*asurf to the droplet volume:
We have determined that the radius of the stable droplet size is about 300 nm, according to Figure 1.
For estimating the radius of the potential surface-active molecules that could be present in hexadecane samples as impurities we assume that it should have molecular weight similar to hexadecane. Otherwise, it would be eliminated by purification procedure. There is information of molecular size of substances with molecular weight that is close to the molecular weight of hexadecane (229) in the paper [58]. Radius of glucose molecules with molecular weight 180 is 0.33 nm, whereas radius of sucrose molecules with molecular weight 342 is 0.44 nm. Therefore, we can assume that the radius of the potential surface-active impurity asurf is about 0.4 nm. Substituting these numbers into Eq. A2.1 yields the following:
The cleanest hexadecane that we use contains only potential 0.2% of impurities. It means that in the worst case when all impurities are surface-active, they could cover only 25% of the droplet interface. This number overestimates surface coverage because in reality, not all impurities are located at interface. A significant part would stay in the droplet bulk for maintaining surface-bulk equilibrium. Therefore, impurities could not stabilize interface and explain observed effects.
Appendix 2. Calculation of Lifshitz-Slyozov-Wagner (LSW) [28,29] Time for Kinetics of Ostwald Ripening [24].
Ostwald ripening is a phenomenon observed in emulsions that involves the change of a droplet size over time due to transfer of emulsion droplet liquid from small droplets into the larger ones. This is a thermodynamically driven process caused by excessive pressure in the emulsion droplets due to curvature of their interfaces. It is usually referred to as Kelvin’s pressure [57]. This excessive pressure amplifies chemical potential of the molecules of the liquid that forms emulsion droplets. It becomes higher in the vicinity of smaller droplets compared to the vicinity of the larger droplets. Resulting diffusion flux moves these molecules from small droplets to larger ones. This description stresses the importance of polydispersity for Ostwald ripening [24]. However, it is possible to derive an equation for evolution of an average particle volume assuming some typical droplet size distribution. This was done by Lifshitz and Slyozov [28,29] who derived such equation for characterizing kinetics of Ostwald ripening:
Definitions of all symbols in this equation are:
- a is an average radius of the droplets in [m]
- t is time in [sec]
- D is diffusion coefficient of the emulsion droplet liquid in [m2/sec]
- Csol is solubility in [g/m3]
- γ is surface tension in [N/m]
- M is molecular weight in [g/mol]
- ρ is density in [g/m3]
- R is gas constant in [J/K0 mol]
- T is absolute temperature in K0.
This theory yields following equation predicting value of the droplet radius at the time moment t :
where a0 is an average droplet radius of the initial emulsion, at t=0.
Parameter tlsw equals:
This parameter tlsw (LSW time) can be considered as characteristic time of Oswald ripening because an average droplet volume doubles during this time according to Eq.A.4. Such definition of the characteristic time follows from the well-known theory of fast Brownian coagulation by Smolushowski [64]. Characteristic time is defined in that theory as the time required for double reduction in number of particles. In order to apply the same definition to Ostwald ripening theory we should convert it to particles volumes, because this is the main parameter changing over time due to the diffusion transfer of liquid from small droplets to the large ones. The reduction of particles number by factor of 2 can be achieved if particles volume increased by 2 times for the same total volume fraction. That is what we will use as characteristic time: time that is required for average particle volume to double, or an average droplet size increase by factor of 21/3 ≈1.26.
Parameter tlsw agrees with such definition of the critical coagulation time according to the Eq. A.4
We can calculate LSW time for 4%vl hexadecane-in-water emulsion. It is possible to find values of all required parameters of hexadecane in literature [58,59,60,61,62,63]. We could also assume the value of initial droplet radius of about 0.2 micron, or 0.2 *10-6 meter. The result is 38 days. This is much longer than the duration of our experiments. Therefore, we can conclude that Ostwald ripening does not affect observed emulsion evolution.
References
- Kamogawa, K; Matsumoto, M; Kobayashi, T; Sakai, T; Sakai, H; Abe, M. Langmuir 1999, 15, 1913–1919. [CrossRef]
- Sakai, T; Kamogawa, K; Harusawas, F; Momozawa, N; Sakai, H; Abe, M. “Direct observation of flocculation/coalescence of metastable oil droplets in surfactant-free oil/water emulsion by freeze-fracture electron microscopy”. Langmuir 2001, 17(2), 255–259. [Google Scholar] [CrossRef]
- Kamogawa, K; Akatsuka, H; Matsumoto, M; Yokoyama, S; Sakai, T; Sakai, H; Abe, M. “Surfactant-free o/w emulsion formation of oleic acid and its esters with ultrasonic dispersion”. Colloids and Surfaces, A 2001, 180, 41–53. [Google Scholar] [CrossRef]
- Sakai, T; Kamogawa, K; Nishiama, K; Sakai, H; Abe, M. “Molecular diffusion of oil/water emulsions in surfactant-free conditions”. Langmuir 2002, 18(6), 1985–1990. [Google Scholar] [CrossRef]
- Sakai, T; Takeda, Y; Mafune, F; Abe, M; Kondow, T. “Monitoring growth of surfactant-free nanodroplets dispersed in water by single-droplet detection”. J. Phys. Chem. 2003, 107(13), 2921–2926. [Google Scholar] [CrossRef]
- Sakai, T. “Surfactant-free emulsions”. Current Opinion Colloid Interface Science 2008, 13(4), 228–235. [Google Scholar] [CrossRef]
- Pashley, RM. “Effect of degassing on the formation and stability of surfactant-free emulsions and fine Teflon dispersions”. J. Phys. Chem. 2003, B 107, 1714–1720. [Google Scholar] [CrossRef]
- Maeda, N; Rosenberg, KJ; Israelachvili, JN; Pashley, RM. “Further studies on the effect of degassing on the dispersion and stability of surfactant-free emulsions”. Langmuir 2004, 20, 3129–3137. [Google Scholar] [CrossRef] [PubMed]
- Burnett, GR; Atkin, R; Hicks, S; Eastoe, J. “Surfactant-free “emulsions” generated by freeze-thaw”. Langmuir 2004, 20, 5673–5678. [Google Scholar] [CrossRef] [PubMed]
- Beattie, JK; Djerdjev, AM. “The Pristine Oil/Water Interface: Surfactant-Free Hydroxide-Charged Emulsions”. Angew. Chem. Int. Ed. 2004, 43, 3568–3571. [Google Scholar] [CrossRef]
- Djerdjev, AM; Beattie, JK. “Hydroxide and hydrophobic terabutylammonium ions at the hydrophobe-water interface”. Molecules 2025, 30, 875. [Google Scholar] [CrossRef]
- Hwanbo, SAH; Lee, SY; Kim, BA; Moon, CK. “Preparation of surfactant-free nano oil particles in water using ultrasonic system and mechanism of emulsion stability”. Nanomaterials 2022, 12, 1547. [Google Scholar] [CrossRef]
- Horikoshi, S.; Yu, Akao; Ogura, T; Sakai, H; Abe, M; Serpone, N. “On the stability of surfactant-free water-in-oil emulsions and synthesis of hollow SiO2 nanospheres”. Coll. Surf. A 2010, 372, 55–60. [Google Scholar] [CrossRef]
- Sakai, T; Seo, K. “Colloidal stability of emulsifier-free water-in-oil emulsions: effect of oil property”. J. Japan Soc Colloid Mater 2014, 87(11), 1–6. [Google Scholar] [CrossRef]
- Sakai, T; Oishi, T. “Colloidal stabilization of surfactant-free emulsion by control of molecular diffusion among droplets”. J. Taiwan Inst. Chem. Engin. 2018, 92, 123–128. [Google Scholar] [CrossRef]
- Alizadeh, A; Huang, Y; Liu, F; Daiguji, H; Wang, M. “A streaming-potential-based microfluidic measurement of surface charge at immiscible liquid-liquid interface”. Int. J. Mech. Sci. 2023, 247, 108200. [Google Scholar] [CrossRef]
- Xiong, H; Lee, JK; Zare, RN; Min, W. “Strong electric field observed at the interface of aqueous microdroplets”. The Journal of Physical Chemistry Letters 2020, 11, 7423–7428. [Google Scholar] [CrossRef] [PubMed]
- Shi, L; LaCour, RA; Oian, N; Heindel, JP; Lang, X; Zhao, R; Head-Gordon, T; Min, W. “Water structure and electric fields at the interface of oil droplets”. Nature 2025, 640, 87–93. [Google Scholar] [CrossRef] [PubMed]
- LaCour, RA; Heindel, JP; Zhao, R; Head-Gordon, G.T. “The role of interfaces and charge for chemical reactivity in microdroplets”. Journal of American Chemical Society 2025, 147, 6299–6317. [Google Scholar] [CrossRef]
- Ganachaud, F. “An alternative hypothesis of enhanced deep supercooling of water: nucleator inhibition via bicarbonate adsorption”. The Journal of Physical Chemistry Letters 2025, 16, 261–264. [Google Scholar] [CrossRef]
- Yan, X; Delgado, M; Aubry, J; Gribelin, O; Stocco, A; Cruz, FBD; Bernard, J; Ganachaud, F. “Central role of bicarbonate anions in charging water/hydrophobic interfaces”. The Journal of Physical Chemistry Letters 2018, 9, 96–103. [Google Scholar] [CrossRef]
- Yan, X; Stocco, A; Bernard, J; Ganachaud, F. “Freeze/thaw-induced carbon dioxide trapping promotes emulsification of oil in water”. The Journal of Physical Chemistry Letters 2018, 9, 5998–6002. [Google Scholar] [CrossRef]
- Pickering, Spencer Umfreville. Emulsions. Journal of the Chemical Society, Transactions 91, 2001–2021, 1907. [CrossRef]
- Ostwald, W. Studien über die Bildung und Umwandlung fester Körper" [Studies on the formation and transformation of solid bodies] (PDF). Zeitschrift für Physikalische Chemise 22, 289–33 1897.
- Ninham, BW; Nostro, PL. Unexpected Properties of Degassed Solutions. J Phys Chem B 2020, 124, 7872–8. [Google Scholar] [CrossRef]
- Snoeyink, VL; Jenkins, D. Water Chemistry; John Wiley & Sons: NY, 1980. [Google Scholar]
- Kowacz, M; Pollack, GH. “Moving Water Droplets: “The Role of Atmospheric CO2 and Incident Radiant Energy in Charge Separation at the Air−Water Interface”. J. Phys. Chem. B 2019, 123, 11003−11013. [Google Scholar] [CrossRef] [PubMed]
- Lifshitz, IM; Slyozov, VV. The Kinetics of Precipitation from Supersaturated Solid Solutions. Journal of Physics and Chemistry of Solids 1961, 19(1–2), 35–50. [Google Scholar] [CrossRef]
- Wagner, C. Theory of the aging of precipitates by dissolution-reprecipitation (Ostwald ripening). Zeitschrift für Elektrochemie 1961, 65(7), 581–591. [Google Scholar]
- Meegoda, JN; Hewage, SA; Batagoda, JH. “Stability of Nanobubbles”. Environ Eng Sci 2018, 35(11), 1216–1227. [Google Scholar] [CrossRef]
- Dukhin, AS; Xu, R. “A new approach to explain nano-bubbles paradoxical longevity”. Colloids and Surfaces, A 2024, 700, 134805. [Google Scholar] [CrossRef]
- Perrin, L; Desobry-Banon, S; Gillet, G; Desobry, S. “Review of High-Frequency Ultrasounds Emulsification Methods and Oil/Water Interfacial Organization in Absence of any Kind of Stabilizer”. Foods 2022, 11, 2194. [Google Scholar] [CrossRef]
- Gaikward, SG; Pandit, AB. “Ultrasound emulsification: Effect of ultrasonic and physicochemical properties on dispersed phase volume and droplet size”. Ultrasonic sonochemistry 2008, 15, 554–563. [Google Scholar] [CrossRef]
- Dukhin, AS; Goetz, JP. Characterization of Liquids, Nano- and Microparticulates, and Porous Bodies using Ultrasound Ed 3; Elsevier: London, 2017. [Google Scholar]
- ISO 20998-1; Measurement and characterization of particles by acoustic methods. Part 1. Concepts and procedures in ultrasonic attenuation spectroscopy. ISO: Geneva, 2006.
- ISO 20998-2; Measurement and characterization of particles by acoustic methods. Part 2 Guidelines for linear theory. ISO: Geneva, 2012.
- ISO 13099-1; Colloidal systems - Methods for zeta-potential determination - Part 1: Electroacoustic and electrokinetic phenomena. ISO: Geneva, 2012.
- ISO 13099-3; Colloidal systems - Methods for zeta potential determination - Part 3: Acoustic methods. ISO: Geneva, 2014.
- Dukhin, A.S.; Riesel, A. “Overlapping double layers in electrokinetics of concentrated dispersion”. J. of Colloid and interface Science 2022, 609, 664–674. [Google Scholar] [CrossRef] [PubMed]
- Lyklema, J. Fundamentals of Interface and Colloid Science, Volumes 1; Academic Press, 1993. [Google Scholar]
- Hardy, WB. “An application of the principle of dynamical similitude to molecular physics”. P R Soc Lond A-Cont 1915, 92, 82–100. [Google Scholar]
- Frank, HS; Evans, MW. “Free volume and entropy in condensed systems. III. Entropy in binary liquid mixtures; Partial molal entropy in dilute solutions; structure and thermodynamics in aqueous electrolytes”. Journal of Chemical Physics 13(11), 507–532, 1945. [CrossRef]
- Bockris, JO’M; Devanathan, MAV; Müller, K. “On the Structure of Charged Interfaces”. Proc R Soc Lon Ser-A 1963, 274(1356), 55–79. [Google Scholar] [CrossRef]
- Pashley, RM; Israelachvili, JN. “Molecular layering of water in thin films between mica surfaces and its relation to hydration forces”. J Colloid Interf Sci 1984, 101(2), 500–514. [Google Scholar] [CrossRef]
- Craig, VSJ; Ninham, BW; Pashley, RM. “Direct measurement of hydrophobic forces: a study of dissolved gas, approach rate, and neutron irradiation”. Langmuir 1999, 15, 1913–1919. [Google Scholar] [CrossRef]
- Ninham, BW; Pashley, RM; Nostro, PL. Surface forces: Changing concepts and complexity with dissolved gas, bubbles, salt and heat. Curr Opin Colloid In 2017, 27, 25–32. [Google Scholar] [CrossRef]
- Derjaguin, BV; Dukhin, SS; Yaroschuk, AE. “On the Role of the Electrostatic Factor in Stabilization of Dispersions Protected by Adsorption Layers of Polymers”. J Colloid Interface Sci 1987, 115(1), 234–239. [Google Scholar] [CrossRef]
- Mancui, M; Ruckenstein, E. “The Polarization Model for Hydration/Double Layer Interactions: The Role of the Electrolyte Ions”. Adv Colloid Interface Science 2004, 112(1-3), 109–128. [Google Scholar]
- Hunter, RJ. Zeta Potential in Colloid Science; Academic Press; 1986. [Google Scholar]
- Hauner, IM; Deblais, A; Beattie, JK; Kellay, H; Bonn, D. “The dynamic surface tension of water”. J Phys Chem Lett 2017, B, 1599–1603. [Google Scholar] [CrossRef]
- Anim-Danso, E.; Zhang, Y.; Dhinojwala, A. “Surface Charge Affects the Structure of Interfacial Ice”. Journal of Physical Chemistry C 2016, 120, 3741−3748. [Google Scholar] [CrossRef]
- Arias, FJ. “Comment on the paper ‘A new approach to explaining nano-bubbles paradoxical longevity’ Dukhin A and Xu R [Colloids Surf A 700 (2024) 34805”. Colloids and Surfaces A 2025, 727(2), 137962. [Google Scholar] [CrossRef]
- Eastoe, J; Ellis, C. “De-gassed water and surfactant-free emulsion. History, controversy, and possible application”. Adv in Colloid and Interface Sci. 2007, 134-135, 89–95. [Google Scholar] [CrossRef]
- Craig, VSJ; Ninham, BW; Pashley, RM. The effect of electrolytes on bubble coalescence in water. J Phys Chem 1993, 97, 10192–7. [Google Scholar] [CrossRef]
- Onsager, L; Samaras, NNT. The Surface Tension of Debye-Hückel Electrolytes. J Chem Phys 1934, 2, 628. [Google Scholar] [CrossRef]
- Pohl, HA. Dielectrophoresis: The Behavior of Neutral Matter in Nonuniform Electric Fields; Cambridge University Press: Cambridge, 1978. [Google Scholar]
- Thomson, William. “On the equilibrium of vapor at a curved surface of liquid”. Philosophical Magazine 1871, 4(42 (282)), 448–452. [Google Scholar]
- Goebel, A; Lunkenheimer, K. Interfacial tension of the water/n-Alkane interface. Langmuir 1997, 13, 369–372. [Google Scholar] [CrossRef]
- CRC Handbook of Chemistry and Physics, 95th Edition; Haynes, W.M., Ed.; CRC Press LLC: Boca Raton: FL; p. p. 3-294, 2014-2015.
- Klochko, L.; Noel, J.; Sgreva, NR.; Leclerc, S.; Metivier, C.; Lacroix, D.; Isaev, M. Thermophysical properties of n-hexadecane: Combined molecular dynamics and experimental investigation”. International communications in heat and mass transfer 2022, 137, 106234. [Google Scholar] [CrossRef]
- ECHA. Hexadecane (CAS 544-76-3) Registered Substances Dossier. European Chemical Agency, 2015.
- Coates, M. Environ Sci Technol 1985, 19, 628–32. [CrossRef] [PubMed]
- Boron, WF; Boulpaer, EL. Medical Physiology: A Cellular and Molecular Approach; Elsevier, 2005. [Google Scholar]
- Smoluchowski, M.Z. Phys.Chem 1917, 92, 129.
Figure 1.
Median diameter measured for all 4 emulsions over time. Emulsions 1 and 2 were measured before we recognized the long-term effect.
Figure 1.
Median diameter measured for all 4 emulsions over time. Emulsions 1 and 2 were measured before we recognized the long-term effect.
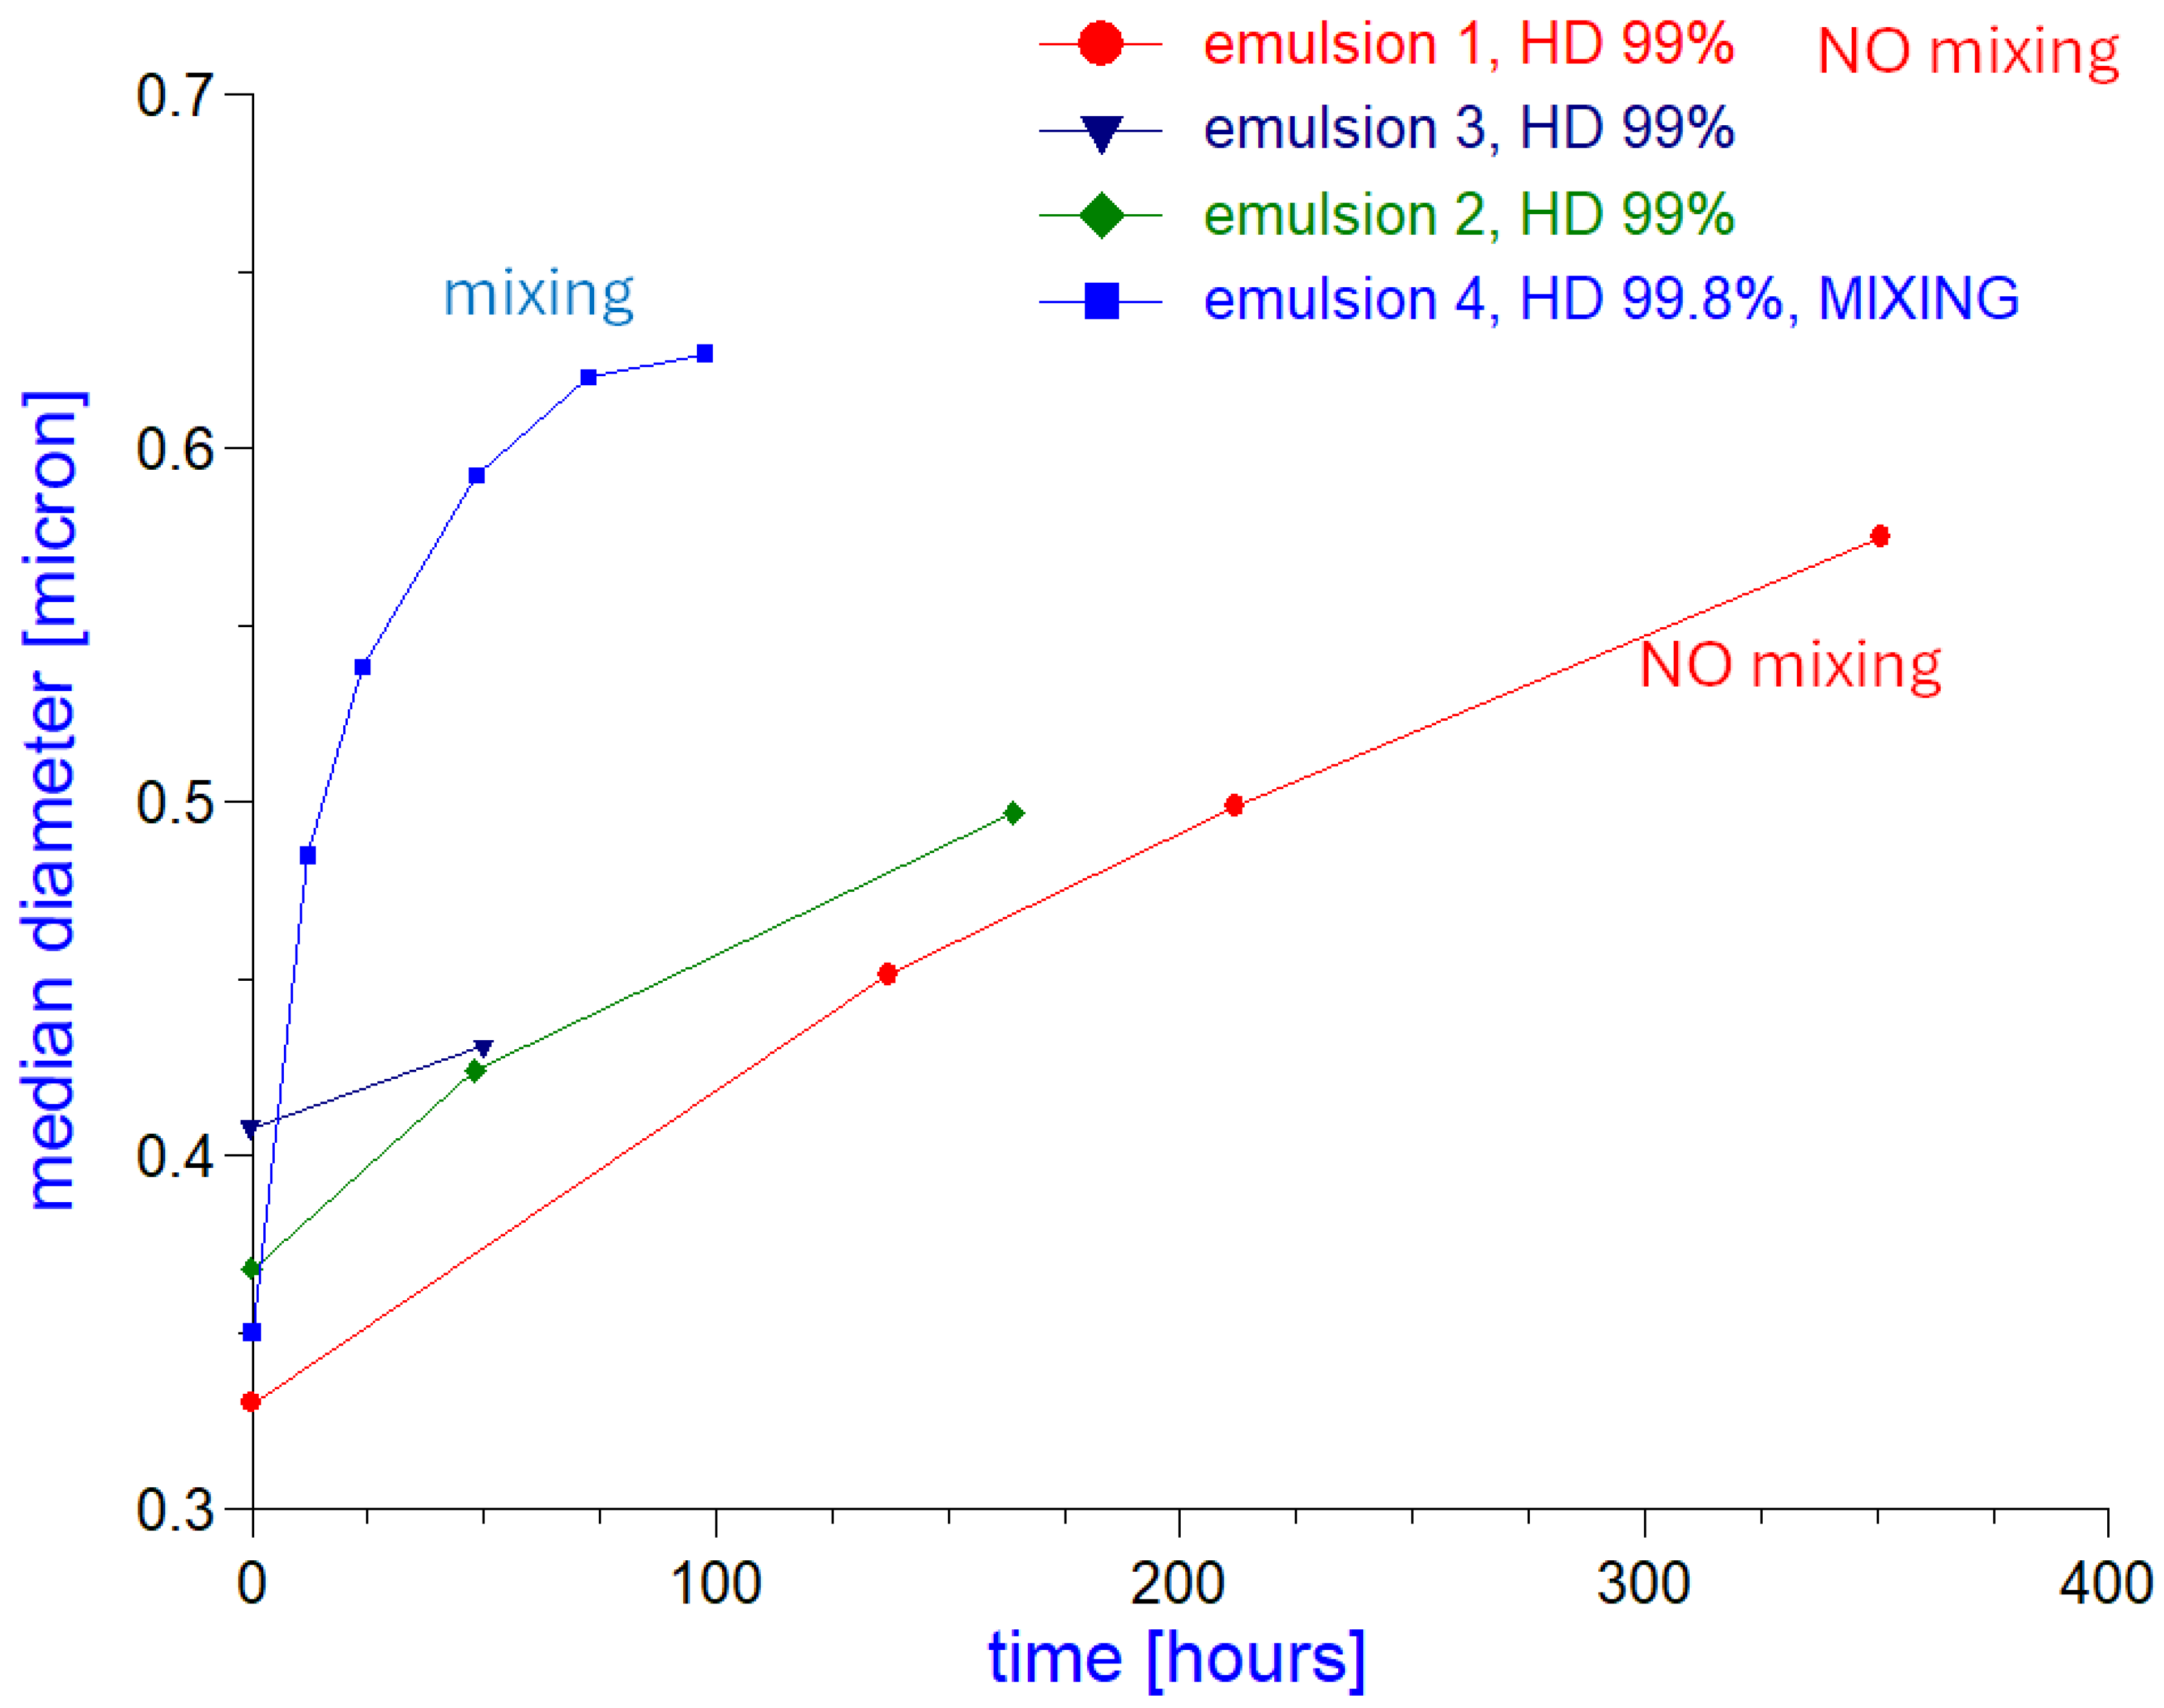
Figure 2.
Element of water-oil interface with blue circles symbolizing water molecules oriented perpendicularly to the interface. The red circle in the center is the added imaginary molecule. Shaded area around it illustrates ΔA.
Figure 2.
Element of water-oil interface with blue circles symbolizing water molecules oriented perpendicularly to the interface. The red circle in the center is the added imaginary molecule. Shaded area around it illustrates ΔA.
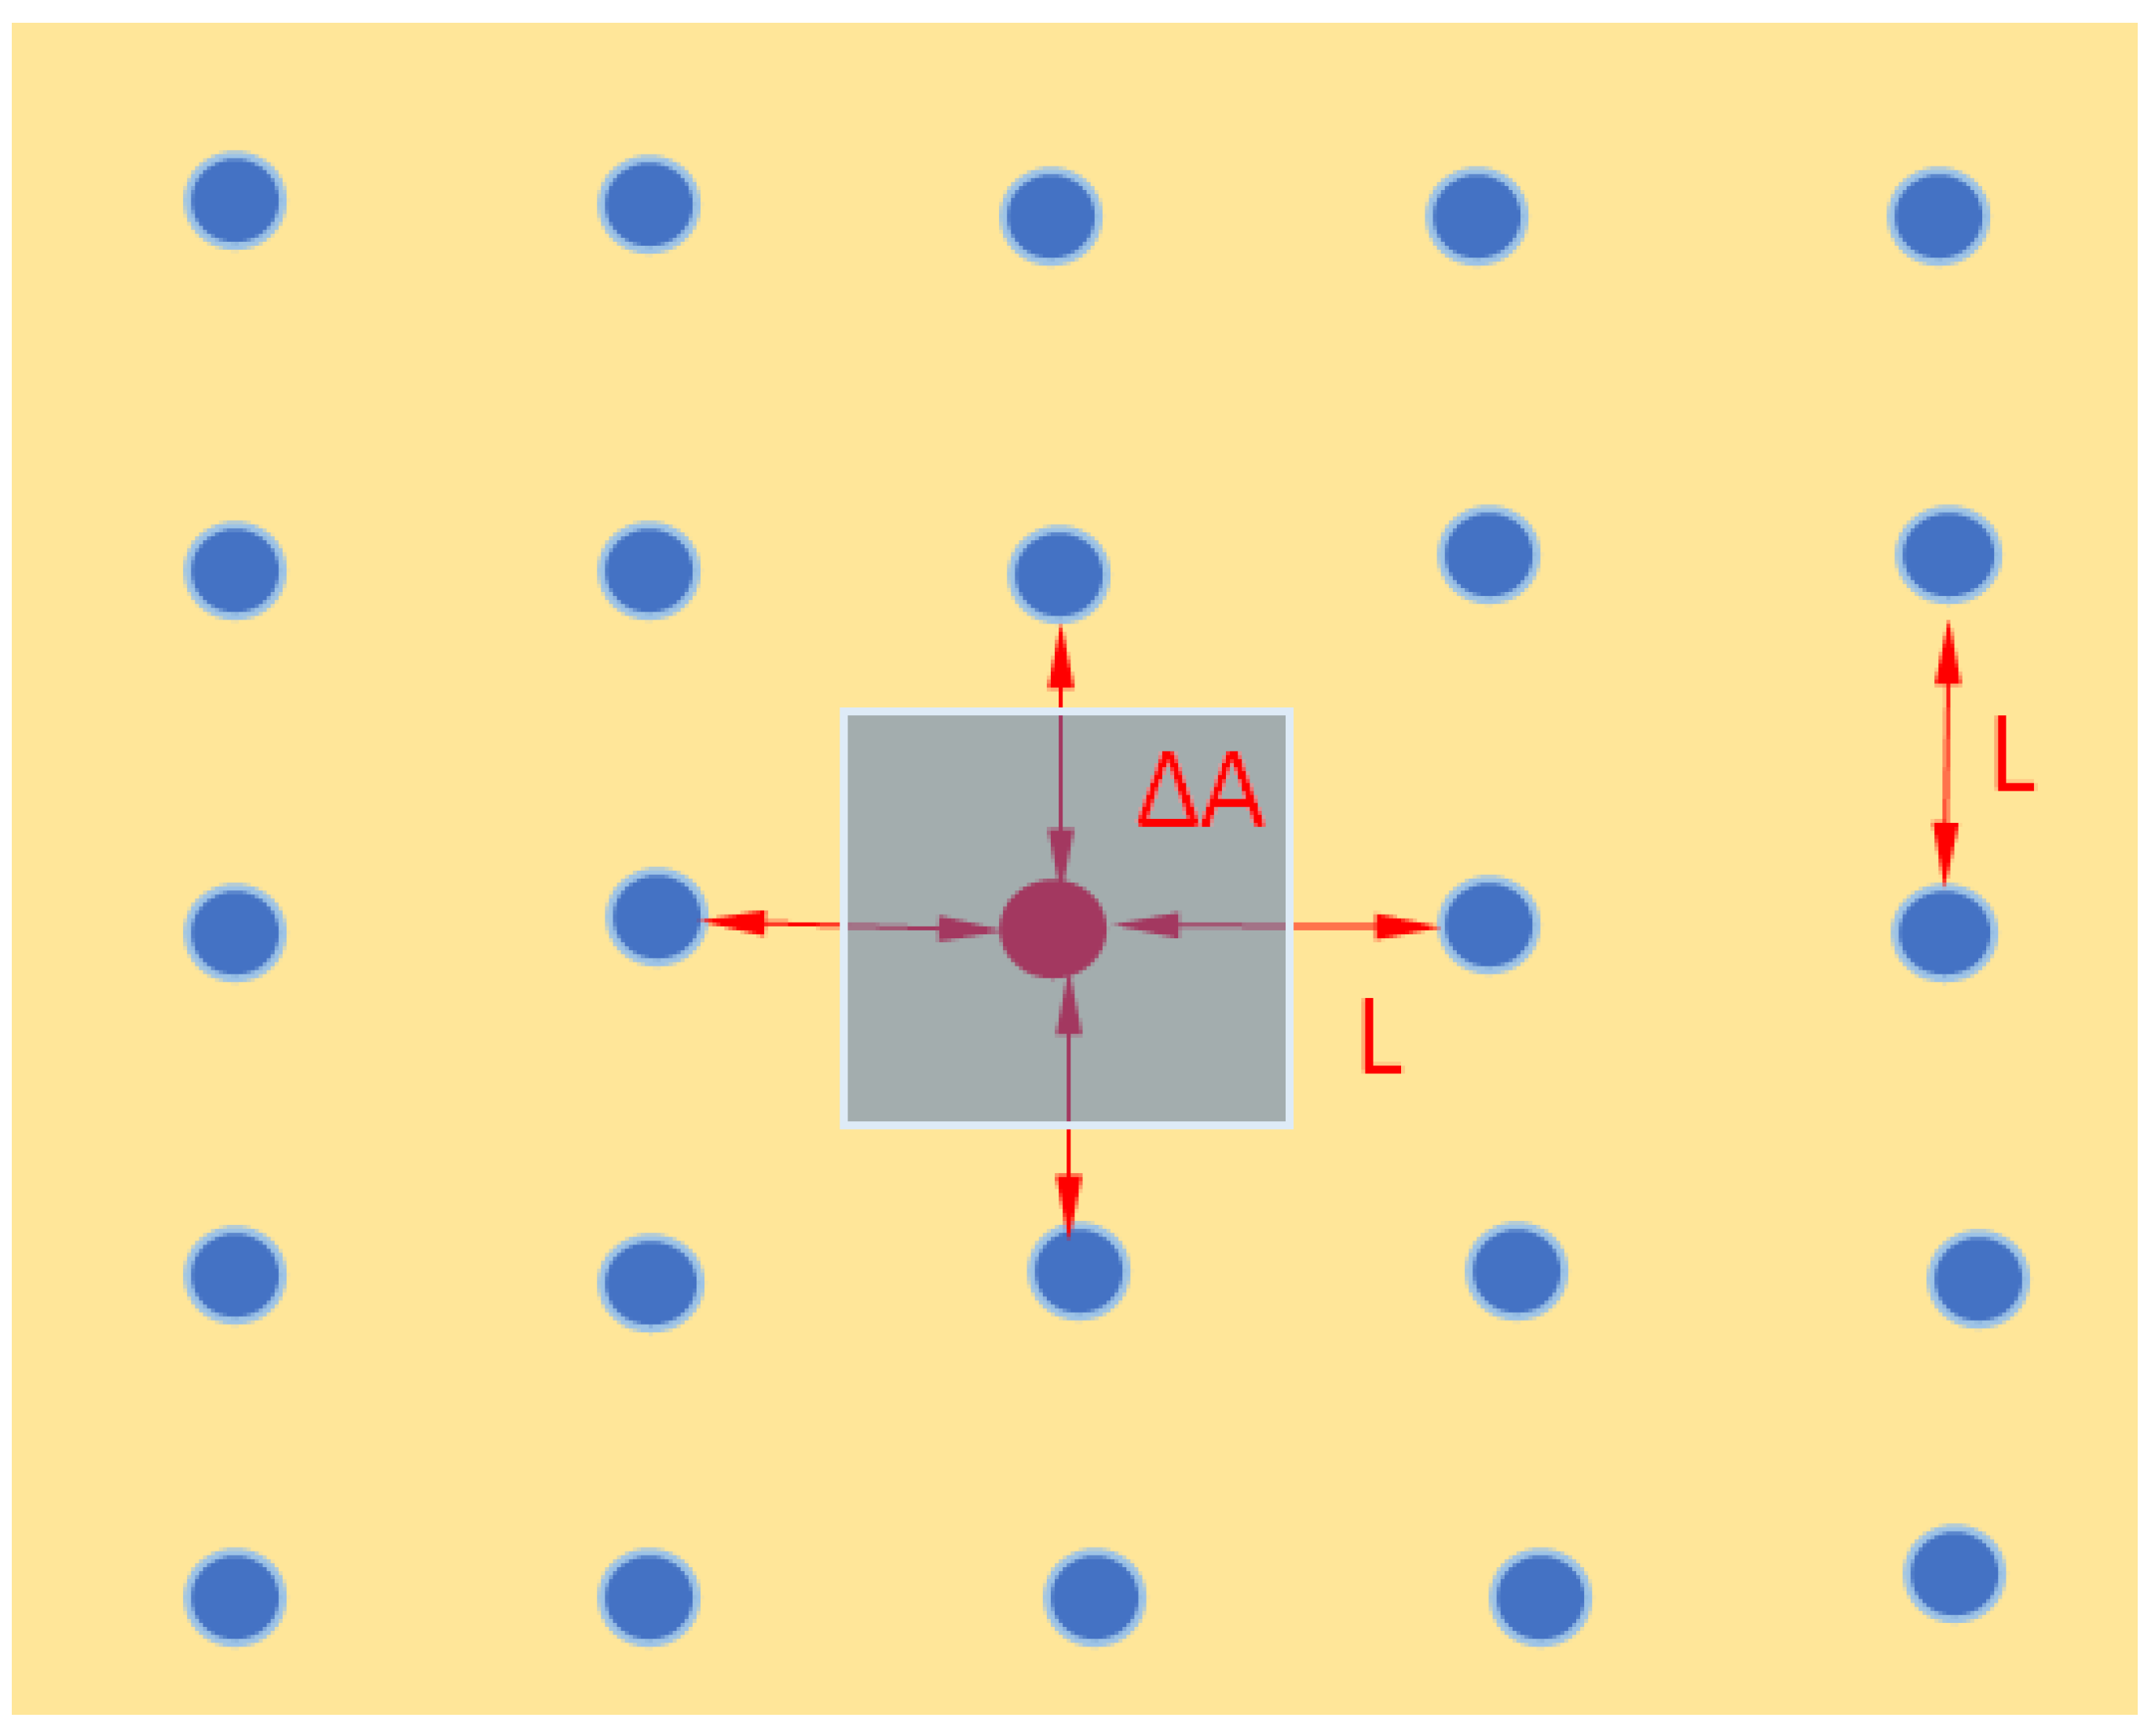
Table 1.
Values of zeta potential for emulsions 3 and 4 organized as experiments consisting of several consecutive measurements. Emulsion 3 was stored in closed vial, which was shacked before sample was poured into the measuring cell. Emulsion 4 was continuously mixed inside of the measuring cell even after initial steps of preparation.
| Emulsion 3 | Emulsion 4 | ||||
| Experiment Date | Measurement Date | Zeta [mV] | Experiment Date | Measurement Date | Zeta [mV] |
| 9/19/2024 14:36 | 9/19/2024 14:38 | -40.8 | 11/24/2024 13:14 | 11/24/2024 13:25 | -34.3 |
| 9/19/2024 14:41 | -40.4 | 11/24/2024 13:32 | -34.5 | ||
| 9/19/2024 14:43 | -40.8 | 11/24/2024 13:39 | -34.8 | ||
| 9/19/2024 15:22 | 9/19/2024 15:26 | -35.5 | 11/24/2024 13:48 | -34.2 | |
| 9/19/2024 15:28 | -34.2 | 11/24/2024 13:55 | -34.3 | ||
| 9/19/2024 15:31 | -35.2 | 11/25/2024 12:29 | 11/25/2024 12:39 | -36.3 | |
| 9/19/2024 15:33 | -34.6 | 11/25/2024 12:47 | -35.7 | ||
| 9/23/2024 9:43 | 9/23/2024 9:46 | -42.2 | 11/25/2024 12:55 | -35.4 | |
| 9/23/2024 9:48 | -40.8 | 11/25/2024 13:03 | -35.6 | ||
| 9/23/2024 9:50 | -40.4 | 11/25/2024 13:12 | -35.4 | ||
| 9/23/2024 9:53 | -40.6 | 11/26/2024 13:41 | 11/26/2024 13:52 | -35.1 | |
| 9/23/2024 9:55 | -43.3 | 11/26/2024 13:59 | -35.2 | ||
| 9/26/2024 10:31 | 9/26/2024 10:44 | -43.6 | 11/26/2024 14:06 | -35.4 | |
| 9/26/2024 10:54 | -38.4 | 11/26/2024 14:13 | -35.1 | ||
| 9/26/2024 11:04 | -43.9 | 11/26/2024 14:22 | -34.9 | ||
| 9/26/2024 11:13 | -43.2 | 11/27/2024 11:41 | 11/27/2024 11:52 | -36.2 | |
| 9/26/2024 11:22 | -38.3 | 11/27/2024 11:59 | -36.4 | ||
| 11/27/2024 12:07 | -35.9 | ||||
Disclaimer/Publisher’s Note: The statements, opinions and data contained in all publications are solely those of the individual author(s) and contributor(s) and not of MDPI and/or the editor(s). MDPI and/or the editor(s) disclaim responsibility for any injury to people or property resulting from any ideas, methods, instructions or products referred to in the content. |
© 2026 by the authors. Licensee MDPI, Basel, Switzerland. This article is an open access article distributed under the terms and conditions of the Creative Commons Attribution (CC BY) license (http://creativecommons.org/licenses/by/4.0/).
Copyright: This open access article is published under a Creative Commons CC BY 4.0 license, which permit the free download, distribution, and reuse, provided that the author and preprint are cited in any reuse.


