
Submitted:
31 December 2025
Posted:
02 January 2026
You are already at the latest version
Abstract
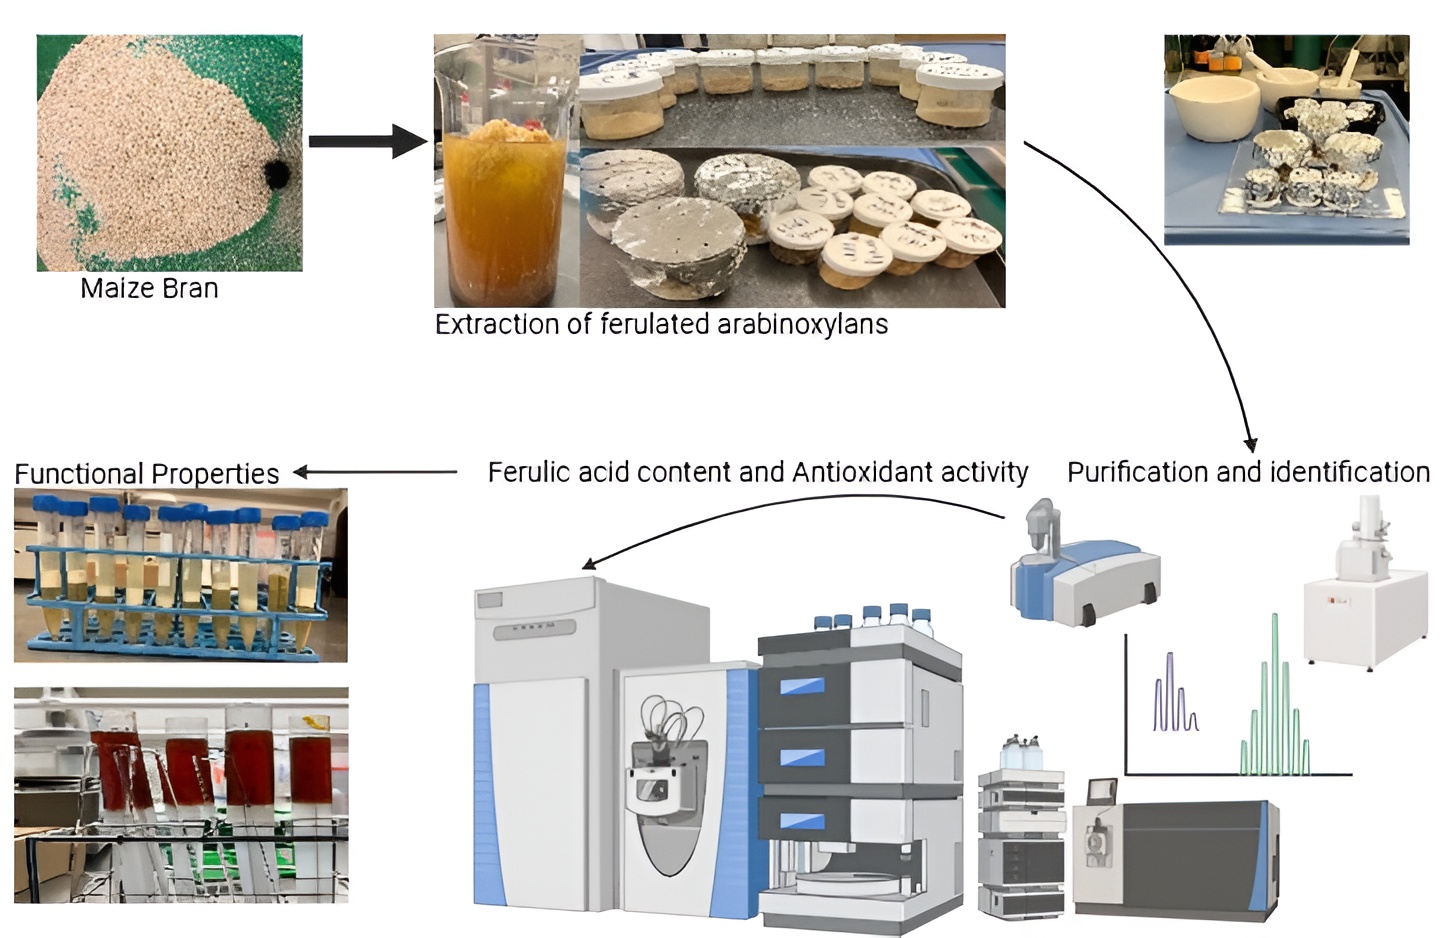
In this study, ferulated arabinoxylans (FAXs) were extracted from maize bran by optimizing al-kaline extraction method and explored their purification, identification and antioxidant potential. The current results showed that FAXs yield ranged from 14.7 to 18.9 % from maize bran. It was found that the FAXs were mainly composed neutral sugars including xylose (21–44%), arabinose (12–30%), galactose (2.7-7.4%) and glucose (4.6–9.4%), with an A/X ratio of 0.68–0.74. In addition, FAXs extracts showed significantly (p < 0.05) high content of ferulic acid in bound form as com-pared to free form. Furthermore, biopolymers FAXs possess powerful radical scavenging prop-erties due to their polyphenolic content and structural characteristics. FTIR spectra of maize bran extracted FAXs exhibited the presence of polysaccharide compounds. The corresponding bands were related to glycosidic linkage, which is assigned to the C-OH bend vibration in FAX. In functional characteristics, FAXs showed high water holding capacity, emulsion properties and emulsion stability in all treatments. In current research, FAXs have been comprehensively char-acterized, and several promising applications across the food, pharmaceutical, and agricultural industries can be explored based on these findings.
Keywords:
ferulated arabinoxylans
; ferulic acid
; maize bran
; alkaline extraction
; arabinose
; xylose
; glycosidic linkage
; polymers
; water absorption
; structural properties
; industrial applications
1. Introduction
Lignocellulosic materials represent the largest biomass resource worldwide. Cereal waste is predominantly lignocellulosic and consists mainly of lignin, cellulose, and hemicellulose, making it suitable for producing food and bioenergy, which is of great importance since there are limited agricultural areas and fossil fuels are expected to become scarcer in the future (Mujtaba et al., 2022). In recent years, cereal wastes have involved many studies for their biotechnological utilization, since a majority of their current usage is animal feed (Akin et al., 2025; Kendi et al., 2020).
In the world, maize bran is one of the most abundantly produced, inexpensive lignocellulosic materials. It contains mainly testa, pericarp, aleurone layer, and residual sclerenchyma. In the starch industry, maize bran is an abundant by-product that is either fed to animals or discarded. Nevertheless, maize bran is rich in dietary fibers and phenolic compounds (Lugo-Arias et al., 2024; Saeed et al., 2021). There are complex carbohydrate polymers in maize bran, including cellulose (20%), hemicellulose (30%), starch (92%–23%), protein (10%)–13%), crude oil (2%–3%), and phenolic acids (4%) (Liu, et al., 2024; Mule et al., 2024). As far as carbohydrate content is concerned, the different layers are dominated by polysaccharides, such as cellulose, hemicellulose, and lignin. Maize bran contains greater quantities of arabinoxylan (AX), the main hemicellulose in the grain than other cereal grains (Raza et al., 2023). As a major source of dietary fiber, arabinoxylans are a subject of interest because of their perceived health benefits. (Zannini et al., 2022). They resist digestion in the small intestine and undergo partial or complete fermentation in the large intestine by microbiota. In addition to its prebiotic activity, dietary fiber also improves lipid and fat metabolism and reduces the risk of various diseases. As a result of arabinoxylan consumption, chronic cardiovascular disease, intestinal cancer, type II diabetes and rheumatoid arthritis risk is reduced and pathogenic bacteria are prevented from overgrowing (Liu et al., 2024; Weng et al., 2022).
Cateigner-Boutin & Saulnier (2022) illustrated that ferulic acid dimers and trimers (ester-linked to the O-5 position of hydroxycinnamic acids), p-coumaric acid dimers, and dimers of ferulic acid. Recent studies have shown that phenolic compounds, particularly ferulic acid, are associated with arabinoxylans. However, the structure of Ferulated Arabinoxylans or Feraxans of the cell wall has not been clarified (Marquez-Escalante et al; 2023; Zhang et al., 2022; Valério et al., 2021). Polysaccharides are usually extracted from natural sources using conventional extraction methods. There are three types of extraction methods: aqueous extraction, enzyme extraction, and chemical solvent extraction. In chemical solvent extraction, alkali and acid solutions are used (AlYammahi, et al 2023).
The chemical solvent extraction methods achieved more arabinoxylans yield as compared to enzymatic and aqueous extraction methods. There is evidence that a small portion of cereal bran polysaccharides will degrade into some low molecular weight components when extensive acid hydrolysis occurs (Jiang et al., 2019). Most structural studies of Feraxans have extracted matrix polysaccharides with alkaline solutions (Munk et al., 2020). Alkaline extraction of ferulated arabinoxylans (FAXs) in which bran cell wall phenolic acids are attached to arabinoxylans (Weng et al., 2023) is used to extract FAXs. Previous literature showed that maize bran contains high content of biopolymers FAXs as compared to other cereal bran. Therefore, a comprehensive study of maize bran is very important for the extraction of FAXs.
Currently, biopolymers FAXs are extracted and purified using an economical and environmentally friendly process. The process involved hydrolysis of alkaline extraction under different solvent concentrations, time, and temperature conditions. Biochemical interactions were studied by analyzing purified material by chromatography, spectroscopy and chemical characterization. In addition, the current study investigated the antioxidant activity and functional properties of biopolymers FAXs.
2. Materials and Methods
The current research work was conducted at the Whistler Center for Carbohydrate Research, Department of Food Science, Purdue University, West Lafayette, IN 47907, USA. Maize bran was provided by Rafhan Maize Product Co Ltd. Faisalabad, Pakistan. Maize bran was commercially micronized (particle size <250 μm) by using the milling process. Chemicals were procured from Fischer chemical by Thermo Fischer Scientific USA.
2.1. Chemical Analysis
Maize bran sample was analyzed to determine moisture, fat, protein, fiber, and ash content. Methods of American Association of Cereal Chemists (2000) were used to determine moisture content (AACC method 44–15), Ash (AACC method 08–01), protein (AACC method 46–10), fat (AACC method 30–10), fiber (AACC method 32–10), while total carbohydrates were obtained as follows: total carbohydrates = 100% − (%moisture + %protein + %ash + %fat + %crude fiber). Insoluble dietary fiber, soluble dietary fibers were determined using heat-stable Enzyme kit Megazyme (K-TDFR-100A) based on the (AACC 2000, method 32–07).
2.2. Extraction of Ferulated Arabinoxylans
FAXs extracted from maize bran using different concentrations of potassium hydroxide, time, and temperature modes (Table 1). 50g sample was dried by using hot air oven and defatted the sample using hexane (1:5 w/v). The sample was boiled in deionized water for 1 hour to starch gelatinization, protein denaturation and enzymes inactivation. According to the previous method of Herrera-Balandrano et al. (2020) with some modification, supernatant was discarded and then the sample was dried for 12 hours at 60°C. For hydrolysis, sample suspended in alkaline solution (5, 6 and 7%), stirred at 150 rpm for different time periods (4, 5 and 6 hours), at temperatures (25, 30 and 35°C). The slurry cooled down at room temperature for 1 hour. Then, centrifuge the material at 5000 rpm for 20 minutes at 4°C. Supernatant was collected and precipitated in 70% v/v ethanol for overnight. The precipitated material was recovered by solvent exchange method (80% v/v acetone) and obtained crude extracted material. For purification, crude extracted dissolved to obtain a homogeneous aqueous solution (1 % W/V) and precipitated by sequential method (30 and 60% v/v) ethanol induced precipitation. The precipitates were again recovered by solvent exchange method and dried the sample using freeze drier and obtain purified FAXs. The dried extract was blended and converted into powder form for further characterization.
1.2. Yield
The yield of FAXs was calculated from the following Eq. (1):
Yield (%) = W1/W0×100
Where W1 is the weight of dried AX (g), W0 is the weight of dry bran (g).
1.3. Monosaccharaides Analysis
FAXs extracted from maize bran were analyzed for neutral sugars. Monosaccharides in the FAXs extracts were determined by hydrolyzing (1 M H2SO4, 100°C, 90 min) and converting them into alditol acetates following Pettolino et al. (2012). We used GC-MS (Agilent 6890) coupled with Agilent5973 Mass Selective Detector to quantify arabinose, xylose, galactose and glucose. The determination of arabinose, xylose, galactose, and glucose was done using gas chromatography–mass spectrometry (GC-MS) using an Agilent5890 and 5973 Mass Selective Detector. We used a 30 m long DB-5 fused silica capillary column with a film thickness of 1.0 mm and an inner diameter of 0.25 mm with methyl polysiloxane polymer phase. In this experiment, nitrogen was used as a carrier gas at a flow rate of approximately 1.5 mL/min. In order to quantify individual sugars, a 2-liter splitless sample of sugar was injected through the GC-MS in the electron impact mode with an ionization energy of 70 eV. For accuracy, monosaccharide experiments were repeated three times.
1.4. Arabinose to Xylose Ratio
Arabinose to xylose ratio was estimated by following formula:
1.5. Protein Content
The protein contents of FAXs samples were determined by ThermoScientific Flashsmart Elemental Analyzer N/Protein instrument. For sample preparation, the sample is dried and pressed into small tins to be weighed and inserted into the auto-sampler.
1.6. Total Phenolic Content
The total phenolic content was determined according to the method of Kulathunga and Simsek (2024) with some modifications. The Folin-Ciocalteau procedure was performed. The sample (30 ul) was added along with the Folin-Ciocalteu reagent (150 ul), and 7.5% Na2CO3 (120 ul) was added to a flat bottom 96-well plate. The plate was incubated at room temperature for thirty minutes in the dark. The absorbance was measured at 750 nm in a spectrophotometer. Ferulic acid was used to prepare the standard curve, and the results were expressed as ferulic acid equivalents.
1.7. Quantification of Ferulic Acid Content
We used the method of Barberousse, et al. 2009, with some modifications. Ferulic acid was quantified by HPLC analysis. Samples were filtered through 0.45 um nylon syringe filters before injection (10 ul) onto an Agilent 1260 Infinity II HPLC system with a diode array detector (Agilent Technologies Santa Clara, CA, USA). Separation was carried out on a Zorbax 300SB-C18 column (150 mm×4.6mmi.d., 3.5 μm, 300 Å, Agilent Technologies, Santa Clara, CA, USA). Elution and detection parameters were conducted according to the method of Barberousse et al. (2009).
1.8. Antioxidant Activity
ABTS
The reaction was initiated by mixing ABTS (7 mM) with potassium persulfate (2.45 mM), allowing the mixture to stand in the dark for 12 hours at room temperature. Mixing ABTS reagent (1 mL) with absolute ethanol (75 mL) was carried out the next day. Following this, absolute ethanol was added to the radical solution to dilute it to an absorbance of 0.7 at 750 nm. In the following step, the phenolic extract (20 µL) was mixed with the ABTS (230 µL) solution and allowed to stand for five minutes under darkness.
FRAP
In this study, the FRAP assay was used to measure the reducing power of polyphenolic extracts. Briefly, TPTZ (2,4,6- tripyridyl-s-triazine) and FeCl3.6H2O (iron (III) chloride hexahydrate) were dissolved in hydrochloric acid and deionized water prior to analysis. The FRAP working solution is prepared fresh each time and kept out of the light. After mixing the extract with the FRAP reagent (280 mL), it was allowed to stand for 30 minutes in the dark. In a microplate reader (Thermo Electron), samples were read at 595 nm and compared to a Trolox standard curve after 30 minutes.
DPPH
Extracts were evaluated for antioxidant activity using DPPH according to Brand-Williams et al. (1995) with some modification. DPPH radical was prepared by mixing DPPH reagent (2 mg) with 80 mL of methanol. In this experiment, the absorbance of the solution was adjusted to 0.7 at 515 nm. Microplate readers (Thermo Electron, Vantaa, Finland) were used to measure the absorbance of the samples at 515 nm. The results were measured according to the following formula;
DPPH radical scavenging activity (%) = 1 − (A sample − A control/A blank) × 100%
1.9. Fourier Transform Infrared Spectroscopy
Fourier-transform infrared (FT-IR) spectroscopy analysis on FAXs powder samples were recorded on an (Thermo-Nicolet 6700 Series FTIR, Thermo Fisher, USA). The FTIR spectroscopy was used to identify the characteristic absorption bands corresponding to functional groups present in the FAXs. The examined sample was scanned by infrared, where a computer-connected detector identified it as a continuous wave, reported its spectrum, and assessed its functional units. The lyophilized FAXs were converted into powder form with the help of a mortar and powdered samples (∼30 mg) were analyzed. FT-IR spectra were taken directly with the help of ATR diamond crystal at a 2 cm−1 scan resolution between 4000 and 500 cm−1 wavenumber ranges.
1.10. Scanning Electron Microscopy
FAX powder samples were analyzed for scanning electron microscopy. For the purpose, scanning electron microscope Model (FEI Teneo Volumescope SEM) instrument was used to obtain images with a field emission gun scanning electron microscope. The surface morphology was studied using scanning electron microscopy with high-intensity electron beam in high vacuum mode. The samples were analyzed with coating platinum at low voltage (5 kv). The images were obtained in secondary and backscattered electron image mode and a magnification of 2500× and 5000×.
1.11. Functional Properties of Ferulated arabinoxylans
Determination of water holding capacity (WHC)
The water holding capacity (WHC) of FAX isolated from maize bran was determined according to AACC Approved 88-04 method (AACC, 1995) and Kaur et al. (2021) with some modification. Briefly, FAXs (0.5 g) was taken in a centrifuge tube having a screw cap and 24.5 ml of distilled water added to each tube. The samples were sheared for 2 min at 10,000 rpm and 1 min at 15,000 rpm with high-speed polytron. Then the tubes were shaken at 100 rpm for 24 h at room temperature (37 °C) and centrifuged at 2000 rpm for 15 min. The excess water from centrifuge tubes were removed by decanting followed by inverting and each tube was weighed.
The WHC of the sample was calculated using the following equation:
WHC = gwater/gsample × 100
Where gwater (g) represents the weight of water held by the sample and gsample (g) is the original weight of the dry sample.
Oil Holding Capacity
Oil Holding Capacity was determined according to Robertson et al. (2000) with some modifications. Commercial soybean (25 mL) was added to 250 mg of dry sample, stirred and left at room temperature for 1 hour. After centrifugation, the residue was weighed. The oil holding capacity was expressed as g of oil held per g of sample.
Emulsifying Activity and Emulsion Stability
Emulsifying Activity and Emulsion Stability were evaluated according to Gannasin et al. (2012) with some modifications. A homogenizer was used to homogenize a 2% (w/v) sample suspension in water at 11,000 rpm for 30 s. Then, sunflower oil (100 mL) was added and homogenized for another 1 min. The emulsions were centrifuged in 15 mL graduated centrifuge tubes at 1,200 g for 5 min, and the volume of the emulsion left was measured. To determine the Emulsion Stability, emulsions were prepared by the above procedures, heated at 80 °C for 30 min in an oven, cooled at room temperature, and centrifuged at 1,200 g for 5 min. Emulsifying Activity and Emulsion Stability were calculated using the following equations:
1.12. Statistical Analysis
Minitab statistical software 2022 was used to conduct DOE experimental design on extraction of FAXs from maize bran by optimizing different modes; 1) concentration of KOH B) Time c) Temperature to obtain the maximum yield. Twenty-seven treatments were produced by the DOE as shown in Table 1. Each treatment was repeated three times. In addition, characterization data obtained for each parameter were analyzed by mean squares and standard deviations and the lettering of each parameter was conducted by least significant difference (LSD). In chemical characterization analysis, all trials were carried out in triplicates except ferulic acid quantification through HPLC.
3. Results and Discussion
3.1. Chemical Composition of Maize Bran
The chemical composition of maize bran is presented in Supplementary file 1 (Table 1). According to the current results, maize bran contains 59.4±0.04% total carbohydrates and 57.3±1.5% total dietary fibers (5.8±0.04% soluble dietary fibers fraction and 51.9±1.4% insoluble dietary fibers fraction). In addition, maize bran showed 10.2±0.04% moisture, 8.2±0.03% crude protein, 7.5±0.01% crude fiber, 4.2±0.02% crude fat and 1.4±0.01% ash contents. These results are correlated to previous study of Herrera-Balandrano et al. (2020), who reported that maize bran chemical composition showed moisture (7.47%), protein (7.6%), ash (1.22%), fat 0.34%, crude fiber 13.40%, total carbohydrates 69.97%, insoluble dietary fibers 54.9% and soluble dietary fibers (4.4%). However, this difference in chemical composition of maize bran was owing to various milling methods or cultivated region.
3.2. Extraction Yield of FAX from Maize Bran
Extraction yields of FAXs from maize bran by using different concentration of KOH (alkaline solution), time and temperature modes were shown in Table 1. Significant differences (p≤0.05) were observed in FAX2, FAX3, FAX5 FAX8 and FAX9 treatments due to different concentration, temperature and time modes among the AX yields based on the alkaline method. However, the average yield of FAX2 (18.9%) recovered from maize bran was higher than FAX1 (14.8%), FAX3 (16.2%), FAX4 (15.2%), FAX5 (16.1%), FAX6 (14.7%), FAX7 (15.8%), FAX8 (16.3%) and FAX9 (16.1%) respectively. In a previous study, Martínez-López et al. (2012) reported that FAX yield was 18% in nixtamalized maize bran. According to previous study Chanliaud et al. (1995) Alkali type (sodium, potassium, calcium hydroxide) affected yield significantly, but the exact role of cation remains unclear. Due to the rapid solubilization, the extraction time had little effect on the yield. General Factorial Regression: Yield FAX versus Treatments, KOH Conc. %, Time (hours), Temperature was shown in supplementary File 1. The interaction plot of alkaline concentration, temperature and time for the extraction yield of FAXs from maize bran was shown in Figure 1. The plot illustrates an interaction plot for the input variables chosen based on the extraction yield. Figure 1 provides the interplay among the control factors to increase the yield. The yield, represented on the vertical axis, is plotted against the control factors along the horizontal axis. In Fig. 1(a), the chart delineates the interaction between time and the concentration of KOH. Fig. 1(b) illustrates the interaction between temperature and the concentration of KOH, while Fig. 1(c) signifies the relationship between KOH concentration and time. Fig. 1(d) elucidates the connection between temperature and time. Figure 1(e) signifies the relationship between concentration of KOH and temperature while Fig 1(f) illustrates the interaction between time and temperature. In these figures, it is evident that a consistent pattern emerges. Notably, there are no instances of parallel lines observed throughout the figures. This observation strongly implies a significant relationship among all the factors and their collective impact on the yield of FAXs. To achieve a higher yield, certain combinations appear to be particularly advantageous. A parallel straight line does not reveal any interaction effects. At the same time, nonparallel lines display an interactional relationship. There is no discernible interaction between the KOH concentration and other parameters, and parallel lines for all values are shown in the interaction plot. However, there is considerable interaction between the 5% KOH solution and 25°C temperature and other input parameters, and no parallel line relationship exists between them. At all chosen levels, temperature, time, and KOH solution treatments values have substantial variable interactions.
3.3. Protein Content
The protein content of FAXs extracted from maize bran ranged from 0.96-3.58% (Table 2). The maximum protein content was showed in FAX1 (3.58±0.05%) followed by 2.86±0.06, 3.37±0.05, 0.96±0.04, 1.23±0.09, 1.51±0.02, 2.09±0.04, 2.01±0.08 and 1.8±0.06% in FAX2, FAX3, FAX4, FAX5, FAX6, FAX7, FAX8, and FAX9, respectively. The current results showed that FAX1 and FAX3 showed significantly (p≤0.05) higher protein content as compared to other treatments. The result of the current study is higher than data reported a previous study by Herrera-Balandrano et al. (2020), who revealed that protein content in feruloylated arabinoxylans extracts were 1.00%, 0.86% and 0.63% under alkaline conditions (0.5 N NaOH) at various times 2 h, 4 h and 6 h, respectively.
3.4. Monosaccharaides
FAXs were extracted from maize bran using an alkaline method varying concentrations, temperatures, and time modes. Based on different extraction conditions, arabinose, xylose, galactose, glucose contents, and Ara/Xyl ratio were shown in Table 2. FAXs showed significant influences on their monosaccharide composition due to the extraction conditions. As a result of the most effective combination of alkaline concentration, temperature, and time, FAX4 exhibited significantly (p ≤ 0.05) highest levels of arabinose (30.4±0.86%) and xylose (44.7±2.49%). These results indicated that optimized extraction conditions maximized the solubilization of these sugars, which contribute to the functional properties of arabinoxylans. However, FAX2 showed the lowest arabinose (12.7±1.74%) and xylose (18.3±2.63%) concentrations under less effective extraction conditions. To maximize yields, optimization of extraction parameters is vital. In most samples, the Ara/Xyl ratio ranged from 0.68 to 0.74, indicating a balanced presence of arabinose and xylose. The polysaccharides must have such ratios in order to remain structurally and functionally stable. Galactose and glucose concentrations were significantly (p ≤ 0.05) low as compared to arabinose and xylose in all treatments. However, FAX4 exhibiting the significantly (p ≤ 0.05) highest galactose (7.4±0.39%) and glucose (9.2±0.39%) concentrations. As a result of the arabinose and xylose ratio, arabinoxylans may be suitable for a variety of food applications due to their gelling and absorption properties (Mendez-Encinas et al., 2024).
Alkaline methods are used to extract FAXs from maize bran demonstrating that extracting conditions influence monosaccharide composition and yield significantly (Méndez et al., 2022). It is possible to increase the recovery of arabinose and xylose by optimizing these parameters, resulting in more functional arabinoxylans with potential applications in the food and nutraceutical industries (Zannini et al., 2023). It is important to investigate the functional characterization of these extracts in the future in order to better understand their potential health benefits and applications.
3.5. Total Phenolic Content
The current results regarding total phenolic content (TPC) in FAXs treatments were presented in Table 3. In current study, TPC was determined from free form, alkali and acid extracted, and bound form (fraction I and II) of different extracted materials of FAXs from maize bran. These results confirmed that alkaline extract showed higher TPC as compared to other fractions while free form TPC showed lower TPC content. TPC in FAX3 significantly (p<0.05) higher in free from (114.4±1.76 ug/g FAE), alkaline (978.8±2.7 ug/g FAE) and acid extracted (347.6±0.22 ug/g FAE) TPC as compared to other treatments. In fraction I bound form TPC, FAX1 showed significantly (p<0.05) higher TPC (107.2±0.48 ug/g FAE) as compared to other treatments while FAX7 showed significantly (p<0.05) higher TPC (292.8±3.09 ug/g FAE) in fraction II as compared to other treatments.
Based on the results presented in Table 3, there are significant differences in the total phenolic content of FAXs extracted from maize bran depending on the extraction method and treatment. TPC yields were highest with alkaline extraction, indicating this method is more effective at liberating phenolic compounds than acid and free extraction methods. Alkaline conditions may enhance phenolic compound solubility and extraction efficiency by disrupting cell wall structures, as suggested by previous studies (Sombutsuwan et al., 2024; Shi et al., 2022; Dai & Mumper, 2010). The results of a previous study by Huang, et al. (2023) demonstrated a significant increase in TPC in cereal byproducts, emphasizing the potential for alkaline extraction in optimizing phenolic extractions. The current study contributes to the understanding of how extraction methods and treatment variations influence phenolic compounds in maize bran, reinforcing the importance of optimizing extraction protocols to maximize TPC yields. There is a possibility that further studies will be conducted to investigate the bioactivity of these phenolic compounds and their potential health benefits.
3.6. Ferulic Acid Content
Free-form, alkaline & acidic extracts and fractions I & II were used to measure ferulic acid content in FAXs samples obtained from maize bran. A summary of these results is presented in Table 4 and HPLC graphs showed in Supplementary file 2. Ferulic acid content varies significantly between different treatments and extraction methods. As for free form ferulic acid, FAX3 had the highest amount of ferulic acid content (44.71 ug/g), while FAX5 and FAX7 had the lowest amounts at 0.34 ug/g and 0.44 ug/g respectively. The concentration of ferulic acid in alkaline extract of FAX3 was significantly higher (p<0.05) and showed 267.88 ug/g ferulic acid content than any other treatments. The acid-extracts generally showed lower ferulic acid contents, FAX3 showed significantly highest (p<0.05) ferulic acid content (11.62 ug/g) of the other treatments, while FAX4 had the lowest content 1.78 ug/g. In Fraction I, FAX1 showed the highest bound ferulic acid content (3.35 ug/g), whereas in Fraction II, FAX7 showed the highest concentration at 127.32 ug/g. Fractions I and II contain ferulic acid, suggesting that bound forms are present in maize bran FAXs, which can be extracted to free this compound. On the other hand, free form ferulic acid levels were generally low, especially in treatments such as FAX5 and FAX7. In this case, ferulic acid is mostly bound in maize bran, and could be released through appropriate extraction techniques. In Fraction II, FAX7 had a significant bound ferulic acid content (127.32 g/g), indicating that some treatments can enhance the retention of these compounds. Further research is needed to examine their bioavailability and health benefits. It is clear from these findings that optimal extraction methods are crucial for maximizing the health-promoting properties of maize bran, as they lead to a more comprehensive understanding of how extraction methods affect the yield of beneficial compounds such as ferulic acid.
The results of this study demonstrate that different extracts had significantly different levels of ferulic acid contents of FAXs from maize bran. The most efficient extraction method was alkaline extraction, consistently producing the highest levels of ferulic acid. FAX3 showed superior ferulic acid contents, indicating its potential as a valuable source of phenolic compounds. Based on previous literature Wang et al. (2022) illustrated that alkaline conditions disrupt cell wall structures and solubilize phenolic compounds, resulting in higher concentrations of ferulic acid in alkaline extracts. A previous study by Bauer et al. (2012) confirmed that ferulic acid is the major phenolic compound in corn fiber and wheat bran. According to the findings of this study, high amounts of bound ferulic acid were released during alkaline hydrolysis of corn fiber and wheat bran. The stability of ferulic acid against oxidative damage was not affected by alkaline hydrolysis.
3.7. Antioxidant Activity
In this study, FAXs from maize bran were assessed using three different assays such as FRAP, ABTS, and DPPH. A summary of the results is presented in Table 5. Each extraction treatment produced a different level of antioxidant activity, revealing that the extraction method and the form of the bioactive compounds exert significant influences on antioxidant activity.
Based on the FRAP results, the bound forms of arabinoxylans exhibit significantly higher antioxidant activity than the free forms, particularly when extracted using alkaline methods. An alkaline-extracted FAX1 yielded 894.7 g/g TE, whereas its free form yielded only 56.5 g/g TE. According to this trend, bound forms have enhanced antioxidant properties due to their structural properties. The FAX3 extract also showed high activity both in alkaline extraction (905.0 g/g TE) and fraction II (286.5 g/g TE), indicating that specific structural features may contribute to its activity.
FAX3 also showed superior antioxidant activity in the ABTS assay with a value of 428.7 g/g TE in its free form. These findings explored that FAX3 again demonstrated superior antioxidant activity in ABTS as compared to other treatments. Generally, the bound forms retained substantial antioxidant activity, with FAX6 reaching 705.7 g/g TE after alkaline extraction. Due to their polyphenolic content and structural characteristics, FAXs appear to possess potent radical scavenging properties. In the DPPH assay, FAX1 and FAX3 displayed notable antioxidant activity in their bound forms, demonstrating 511.5 and 560.1 g/g TE, respectively. A significant difference was observed between the bound and free forms of the compounds, highlighting the effectiveness of bound compounds as antioxidants. Among all treatments, FAX4 had the lowest DPPH activity, possibly due to reduced polyphenol content.
Based on these results, it is evident that FAXs extracted from maize bran have comparable antioxidant activity to other plant-derived antioxidants (Mendez-Encinas et al., 2018). According to previous studies, the antioxidant capacity of bound phenolic compounds was significantly enhanced due to their structural integrity and interaction with other compounds (Rocchetti et al., 2022). In addition to their antioxidant activity, bound FAXs have potential applications in food preservation and nutraceuticals. As a result of the superior activity of alkaline-extracted fractions, it is imperative that extraction methods be optimized so that greater amounts of beneficial compounds can be recovered. In the future, researchers should investigate the mechanisms underlying the antioxidant activity of these FAXs and the potential health benefits associated with their consumption.
3.8. Fourier Transform Infrared (FT-IR) Spectroscopy
Figure 2 showed the infrared spectrograms of FAX samples. In this study, FT-IR spectroscopy was used as a supplementary technique for the exploration of characteristic organic groups of polysaccharides. The FTIR spectra in the range 900–1,300 cm-1 are characteristic of functional groups in polysaccharides and nucleic acids. The spectra in this range most probably corresponded to polysaccharides. The FTIR spectra obtained from FAXs powder samples extracted from maize bran are shown in Supplementary file 1 (Figure 1). According to the results of Supplementary file 1, the FTIR results revealed almost similar configuration in their chemical structure, and the different extraction method did not change their molecular identity. However, the corresponding band was observed in FAXS samples sometime differing from each other’s. In general, the corresponding peak band at 704 cm-1 is shown in FAX1, FAX2, FAX3, FAX6, FAX7 and FAX8, which showed the polymer backbone. On the other hand, FAX9 showed this band at 710 cm-1 and FAX5 at 761 cm-1 and FAX4 at 708 cm-1. Furthermore, spectrum FAX1-FAX9 showed the corresponding peak band at 878, 880, and 881 cm-1. However, the corresponding band was observed at 880 cm-1, which is due to bending or stretching of bonds involving elements like silicon-oxygen (Si-O) in compounds like polymers in FAXs.
In addition, the corresponding peaks at 1024-1032 cm-1 showed in FAX1-FAX9, which are related to the glycosidic link and (1, 4) linkages between the sugar monomers and showed C-OH banding and C-O-C glycosidic bond vibration in FAXs. On the other hand, the principal band was observed at 1024 cm-1, which is assigned to the C-OH bend vibration in FAX. The bands due to C-O stretching vibrations are strong. The typical spectrum is the backbone of polymers and includes xylose-type polysaccharides. Arabinose side chain O-3 on xylose showed the band at 990 cm-1 to 1020 cm-1. Furthermore, the decrease in the intensity of 990 cm-1 to 1150 cm-1 peaks when the A/X increases. The AX characteristic region (1200–900 cm−1) includes a maximum absorption band that has been assigned to C-OH bending (around 1045 cm−1), a band related to asymmetric stretching of C-O-C glycosidic linkages (1163 cm−1), and the characteristic band of ⊎-(1–4) linkages (898 cm−1). The low intensity of the band at 1078 cm−1 has been related to the high substitution of xylose residue by arabinose in the position of C3. For the gel, the character of a wide triad of bands in the frequency range from 1200 to 900 cm–1 (maximums at 1112, 1045, 994 cm−1, which attributed to −С−С, С−О bending in alcohols. Similarly, the intensity of the weak band of bending vibrations of C–О–Н bonds in alcohol groups decreases (1357-1365 cm–1).
The bands 1550 cm-1 and 1670 cm-1 are associated with the amide I and amide II bands (Proteins), respectively, and the phenolic acids have specific absorption bands in the 1500-1800 cm−1 range (Ji et al., 2020). Signals between 1625 and 1542 cm−1 typically correspond to the carbonyl stretching of amide I and the N-H stretching of amide II in FAX. 1625 cm-1 was the stretching vibration of was the asymmetric stretching vibration of the carboxyl C=O bond and 1422 cm-1 were C-O symmetric stretching vibration, which corresponded to the uronic acid group in AX.
The absorption peak at 2925 cm−1 methylene groups. A clear observation of the FTIR spectrum of the cross-linked materials reveals that FAXs polymers are not significantly affected by the cross-linking process of arabinoxylans and ferulic acid (Hussain et al., 2022). The current results spectrum reported that the FAXs spectra band at 3281 cm−1 resembles the stretching of the OH groups and the band at 2922 cm−1 the CH2 groups, while FAXs of FAXs showed the band at 2922 cm−1 of CH2 groups, the same as FAXs spectra, but showed the stretching band of OH groups at 3272 cm−1. Table 5 explored the wave numbers and their associated functional groups on FT-IR spectra of FAXs extracted samples of current study.

Table 5.
Wave numbers and their associated functional groups on FT-IR spectra of different treatments of ferulated arabinoxylans extracted from maize bran.
Table 5.
Wave numbers and their associated functional groups on FT-IR spectra of different treatments of ferulated arabinoxylans extracted from maize bran.
| Wave Number (cm-1) | Functional groups | Current Results | Reference |
|---|---|---|---|
| 520-760 | Polymer backbone | Peaks confirmed | (Sohni, et al. 2024; Kaur et al. 2021) |
| 900-1300 | Polysaccharides and nucleic acids (С-О-Н bendings) | Peaks confirmed | Rehman et al. 2021; Brian-Jaisson |
| 1500-1700 | Proteins (amide I and amide II) | Peaks confirmed | Jiao et al. 2010; Tian et al. 2012) |
| 2100-2200 | alkynes or nitriles bond in polymer structure (Triple bond of C≡C and N=N=N in azides) | Peaks confirmed | Nandiyanto et al. 2023; Shurvell, 2006 |
| 2880, 2900-3100 | СН2 groups in glycerol; C–H stretching bond (aliphatic H) | Peaks confirmed | Peng et al. 2009; Coelho et al. 2009; Bokovets |
| 3100-3300 | Broad absorbance bands for –OH group stretching | Peaks confirmed | Bokovets et al. 2023; Ludwig, B. 2022 |
3.9. Scanning Electron Microscopy
SEM images of FAXs at magnifications of ×2500 and ×5000 was shown in Figure 3. The microstructure of FAXs exhibited thin filaments and spherical shapes intertwined. There was no significant difference were detected in all treatments. However, the structure of FAX4 and FAX6 was like a sponge network, and its surface morphology was like the formation of numerous sponges. Overall, FAXs had a loose structure with large gaps. FAXs with large gaps between them was more easily combined with water, increasing its surface area and improving solubility.
The alkaline extraction method has some depolymerization destructive effects on polysaccharide molecules by breaking hydrogen bonds and other chemical effects, resulting in finer fragments and fragments of larger molecules (Chen et al., 2022). The microstructural results confirmed that different extraction methods influenced the surface morphology and appearance of AX. Previous studies reported that the difference in AX microstructure was owing to various treatment methods or grain origins. It was also observed that FAX presented a more visible rough and irregular surface morphology with a porous surface except FAX5. FAX5 showed clear filaments and less irregular surface morphology. However, the microparticles of FAXs presented an uneven structure at 5000 magnifications, which showed the presence of pores on the surface of arabinoxylans.
3.10. Functional Properties
Ferulated arabinoxylan fraction is completely composed of dietary fiber arabinoxylans and phenolic compound (Ferulic acid), thus could be effectively used as a non- caloric texturizing and bulking agent in health-promoting food products designed for weight loss and controlling diabetes (Zannini et al., 2022; Schendel et al., 2016). Table 6 shows the water holding capacity of FAXs extracted from maize bran.
The water holding capacity depends upon the branching, molecular structure of fiber and carbohydrate composition. The water holding capacity of cellulose-rich fractions have been attributed to its inherent highly branched and porous nature. All treatments of FAXs showed high water holding capacity ranging from 8.2 to 9.7 g/g water absorb by the FAXs sample per g. FAX4 showed highest water holding capacity as compared to other treatments. The variation in water holding capacity among different FAXs could be due to their particularly inherent porosity, fibril arrangement and available surface area for hydrophilic interactions. The higher water holding capacity of FAX treatments from maize bran may be due to its larger pore size, more branched structure, looser fibril arrangement, higher hydrophilic interaction. Results regarding oil holding capacity of all treatments showed 2.96±0.01 to 3.78±0.03 g/g absorbed oil/sample in all treatments.
The results of emulsion properties of FAXs were shown in Table 6. The emulsifying activity indicates the oil quantity that a protein can emulsify per unit of water, while Emulsion stability (ES) refers to its ability to produce an emulsion that remains stable against droplet aggregation. The current results showed that FAXs showed 41±0.04 to 51±0.08% emulsifying activity at different treatments while emulsion stability ranged from 72.5±2.9 to 89.7±2.4% in all treatments. Previous literature showed that polysaccharides have good emulsifying properties and are commonly used in industrial production (Tang, & Huang, 2022; Bai et al., 2017). In current case, FAXs as polysaccharides emulsifying properties are due to the interaction between polysaccharides and their combined proteins. The proteins are hydrophobic, while the polysaccharide chains are hydrophilic. The FAXs moieties in protein-polysaccharide conjugates provide steric and electrostatic repulsions, which stabilize emulsions.
4. Conclusion
Maize bran is a good source of dietary fibers. FAXs extracted from maize bran are completely composed of biopolymers dietary fiber arabinoxylans (arabinose and xylose) and phenolic compounds (especially ferulic acid). AXs yields based on the alkaline method differ significantly (p≤0.05) depending on the concentration, temperature, and time. According to different extraction conditions, FAX4 displayed significant (p≤0.05) highest levels of arabinose (30.4±0.86%) and xylose (44.7±2.49%) contents. Based on the results of this study, different extracts of FAXs from maize bran contain significantly different amounts of ferulic acid. It was found in this study that alkaline hydrolysis of maize bran resulted in the release of high quantities of bound ferulic acid. Biopolymers FAXs extracted from maize bran have high antioxidant properties, based on these results. Bound FAXs have antioxidant properties in addition to being nutraceuticals. In addition, FTIR results of FAXs extracts revealed almost similar configuration in their chemical structure, and the different extraction method did not change their molecular identity. FTIR spectrum showed C-OH banding and C-O-C glycosidic bond vibration in FAX, which are related to glycosidic linkage and (1,4) linkages between sugar monomers. Most polymers are composed of xylose-type polysaccharides, which form the backbone of the polymer. The surface morphology of FAX was more visible on SEM images, showing roughness and irregularity. In all treatments, FAXs showed high water holding capacities, ranging from 8.2 to 9.7 g/g water absorbed per gram extract. Due to their highly branched and porous structure, ferulated arabinoxylan extracts are highly water absorbing. Furthermore, FAXs have good emulsifying properties. In light of the comprehensive characterization of FAXs, several promising applications can be explored across the food, pharmaceutical, and agricultural sectors. Based on these properties, researchers could develop functional food ingredients, innovative drug delivery systems, and sustainable agricultural practices by using agriculture resources. FAXs have unique characteristics that can enhance the efficacy of products and promote the development of these industries.
Supplementary Materials
The following supporting information can be downloaded at the website of this paper posted on Preprints.org, Figure S1: title; Table S1: title; Figure S2: title.
Author Contributions
Muzzamal Hussain and Senay Simsek have equally contributed to the current research as conceptualization, methodology, analysis, software, validation, investigation, resources, data curation, writing—original draft preparation, writing—review and editing, visualization, supervision, project administration, funding acquisition, and Kristin Whitney contributed in methodology, analysis of samples, software, validation, investigation, resources and data curation. All authors have read and agreed to the published version of the manuscript. All authors have read and agreed to the published version of the manuscript.
Funding
This research was funded by Higher Education Commission Pakistan under the program of “International Research Support Initiative Program (IRSIP)”.
Institutional Review Board Statement
Not applicable.
Informed Consent Statement
Not applicable.
Data Availability Statement
The data presented in this study are available on request from the corresponding author due to privacy.
Acknowledgments
Authors are thankful to Miss Elise Whitley for technical help, and thankful to Mr. Anton Terekhov for monosaccharides analysis.
Conflicts of Interest
The authors declare no conflicts of interest.
References
- Mujtaba, M.; Fraceto, L. F.; Fazeli, M.; Mukherjee, S.; Savassa, S. M.; de Medeiros, G. A.; Vilaplana, F. Lignocellulosic biomass from agricultural waste to the circular economy: a review with focus on biofuels, biocomposites and bioplastics. Journal of Cleaner Production 2023, 402, 136815. [Google Scholar] [CrossRef]
- Skendi, A.; Zinoviadou, K. G.; Papageorgiou, M.; Rocha, J. M. Advances on the valorisation and functionalization of by-products and wastes from cereal-based processing industry. Foods 2020, 9(9), 1243. [Google Scholar] [CrossRef] [PubMed]
- Akin, M.; Jukic, M.; Lukinac, J.; Yilmaz, B.; Özogul, F.; Rocha, J. M. Valorization and Functionalization of Cereal-Based Industry By-Products for Nutraceuticals. Nutraceutics from Agri-Food By-Products 2025, 173–222. [Google Scholar]
- Guo, Y.; Liu, G.; Ning, Y.; Li, X.; Hu, S.; Zhao, J.; Qu, Y. Production of cellulosic ethanol and value-added products from corn fiber. Bioresources and Bioprocessing 2022, 9(1), 81. [Google Scholar] [CrossRef]
- Saeed, F.; Hussain, M.; Arshad, M. S.; Afzaal, M.; Munir, H.; Imran, M.; Anjum, F. M. Functional and nutraceutical properties of maize bran cell wall non-starch polysaccharides. International Journal of Food Properties 2021, 24(1), 233–248. [Google Scholar] [CrossRef]
- Lugo-Arias, J.; Vargas, S. B.; Maturana, A.; González-Álvarez, J.; Lugo-Arias, E.; Rico, H. Nutrient Removal from Aqueous Solutions Using Biosorbents Derived from Rice and Corn Husk Residues: A Systematic Review from the Environmental Management Perspective. Water 2024, 16(11), 1543. [Google Scholar] [CrossRef]
- Liu, S.; Ding, W.; Yang, Q.; Rose, D. J. Alkali treatment of maize bran affects utilization of arabinoxylan and other non-digestible carbohydrates by the human gut microbiota in vitro in a dose-dependent manner. Food Hydrocolloids 2024, 151, 109764. [Google Scholar] [CrossRef]
- Mule, T. A.; Sawant, S. S.; Odaneth, A. A. Maize bran as a potential substrate for production of β-glucosidase. Biomass Conversion and Biorefinery 2024, 14(3), 4029–4039. [Google Scholar] [CrossRef]
- Raza, M. A.; Saeed, F.; Afzaal, M.; Imran, A.; Niaz, B.; Hussain, M.; Al Jbawi, E. Comparative study of cross-and uncross-linked arabinoxylans extracted from maize bran with special reference to their structural and antioxidant potential. International Journal of Food Properties 2022, 25(1), 2495–2504. [Google Scholar] [CrossRef]
- Zannini, E.; Bravo Núñez, Á.; Sahin, A. W.; Arendt, E. K. Arabinoxylans as functional food ingredients: A review. Foods 2022, 11(7), 1026. [Google Scholar] [CrossRef]
- Weng, V.; Cardeira, M.; Bento-Silva, A.; Serra, A. T.; Brazinha, C.; Bronze, M. R. Arabinoxylan from corn fiber obtained through alkaline extraction and membrane purification: Relating bioactivities with the phenolic compounds. Molecules 2023, 28(15), 5621. [Google Scholar] [CrossRef] [PubMed]
- Liu, Y.; Guo, C.; Wang, C. Biochemical characterization of an organic solvent-and salt-tolerant xylanase and its application of arabinoxylan-oligosaccharides production from corn fiber gum. International Journal of Biological Macromolecules 2024, 136146. [Google Scholar] [CrossRef] [PubMed]
- Chateigner-Boutin, A. L.; Saulnier, L. Ferulic and coumaric acids in the cereal grain: Occurrence, biosynthesis, biological and technological functions. In Advances in Botanical Research; Academic Press, 2022; Vol. 104, pp. 169–213. [Google Scholar]
- Zhang, Z.; Yang, P.; Zhao, J. Ferulic acid mediates prebiotic responses of cereal-derived arabinoxylans on host health. Animal Nutrition 2022, 9, 31–38. [Google Scholar] [CrossRef] [PubMed]
- Valério, R.; Crespo, J. G.; Galinha, C. F.; Brazinha, C. Effect of ultrafiltration operating conditions for separation of ferulic acid from arabinoxylans in corn fibre alkaline extract. Sustainability 2021, 13(9), 4682. [Google Scholar] [CrossRef]
- Marquez-Escalante, J. A.; Carvajal-Millan, E.; Martínez-López, A. L.; Martínez-Robinson, K. G.; Campa-Mada, A. C.; Rascon-Chu, A. Fine structural features and antioxidant capacity of ferulated arabinoxylans extracted from nixtamalized maize bran. Journal of the Science of Food and Agriculture 2023, 103(9), 4584–4591. [Google Scholar] [CrossRef]
- AlYammahi, J.; Rambabu, K.; Thanigaivelan, A.; Bharath, G.; Hasan, S. W.; Show, P. L.; Banat, F. Advances of non-conventional green technologies for phyto-saccharides extraction: current status and future perspectives. Phytochemistry Reviews 2023, 22(4), 1067–1088. [Google Scholar] [CrossRef]
- Jiang, Y.; Bai, X.; Lang, S.; Zhao, Y.; Liu, C.; Yu, L. Optimization of ultrasonic-microwave assisted alkali extraction of arabinoxylan from the corn bran using response surface methodology. International journal of biological macromolecules 2019, 128, 452–458. [Google Scholar] [CrossRef]
- Munk, L.; Muschiol, J.; Li, K.; Liu, M.; Perzon, A.; Meier, S.; Meyer, A. S. Selective enzymatic release and gel formation by cross-linking of feruloylated glucurono-arabinoxylan from corn bran. ACS sustainable chemistry & engineering 2020, 8(22), 8164–8174. [Google Scholar]
- Wang, Y. L.; Wang, W. K.; Wu, Q. C.; Yang, H. J. The release and catabolism of ferulic acid in plant cell wall by rumen microbes: A review. Animal Nutrition 2022, 9, 335–344. [Google Scholar] [CrossRef]
- Xiang, Z.; Runge, T. Emulsifying properties of succinylated arabinoxylan-protein gum produced from corn ethanol residuals. Food Hydrocolloids 2016, 52, 423–430. [Google Scholar] [CrossRef]
- Robertson, J. A.; de Monredon, F. D.; Dysseler, P.; Guillon, F.; Amado, R.; Thibault, J. F. Hydration properties of dietary fibre and resistant starch: a European collaborative study. LWT-Food Science and Technology 2000, 33(2), 72–79. [Google Scholar] [CrossRef]
- Kaur, A.; Singh, B.; Yadav, M. P.; Bhinder, S.; Singh, N. Isolation of arabinoxylan and cellulose-rich arabinoxylan from wheat bran of different varieties and their functionalities. Food Hydrocolloids 2021, 112, 106287. [Google Scholar] [CrossRef]
- Chemists, A. A. C. C. Approved methods of the AACC; The Association, 2000; p. 595. [Google Scholar]
- Gannasin, S. P.; Ramakrishnan, Y.; Adzahan, N. M.; Muhammad, K. Functional and preliminary characterisation of hydrocolloid from tamarillo (Solanum betaceum Cav.) puree. Molecules 2012, 17(6), 6869–6885. [Google Scholar] [CrossRef] [PubMed]
- AACC. Approved Methods of American Association of Cereal Chemists, 10th Ed. ed; American Association CerealChemists, Inc.; St. Paul, MN, 2000. [Google Scholar]
- Herrera-Balandrano, D. D.; Báez-González, J. G.; Carvajal-Millán, E.; Muy-Rangel, D.; Urías-Orona, V.; Martínez-López, A. L.; Niño-Medina, G. Alkali-extracted feruloylated arabinoxylans from nixtamalized maize bran byproduct: A synonymous with soluble antioxidant dietary fiber. Waste and Biomass Valorization 2020, 11, 403–409. [Google Scholar] [CrossRef]
- Sohni, S.; Begum, S.; Hashim, R.; Khan, S. B.; Mazhar, F.; Syed, F.; Khan, S. A. Physicochemical characterization of microcrystalline cellulose derived from underutilized orange peel waste as a sustainable resource under biorefinery concept. Bioresource Technology Reports 2024, 25, 101731. [Google Scholar] [CrossRef]
- Rehman, Z. U.; Vrouwenvelder, J. S.; Saikaly, P. E. Physicochemical properties of extracellular polymeric substances produced by three bacterial isolates from biofouled reverse osmosis membranes. Frontiers in microbiology 2021, 12, 668761. [Google Scholar] [CrossRef]
- Brian-Jaisson, F.; Molmeret, M.; Fahs, A.; Guentas-Dombrowsky, L.; Culioli, G.; Blache, Y.; Ortalo-Magné, A. Characterization and anti-biofilm activity of extracellular polymeric substances produced by the marine biofilm-forming bacterium Pseudoalteromonas ulvae strain TC14. Biofouling 2016, 32(5), 547–560. [Google Scholar] [CrossRef]
- Jiao, Y.; Cody, G. D.; Harding, A. K.; Wilmes, P.; Schrenk, M.; Wheeler, K. E.; Thelen, M. P. Characterization of extracellular polymeric substances from acidophilic microbial biofilms. Applied and environmental microbiology 2010, 76(9), 2916–2922. [Google Scholar] [CrossRef]
- Tian, K.; Shao, Z.; Chen, X. Investigation on thermally-induced conformation transition of soy protein film with variable-temperature FTIR spectroscopy. Journal of applied polymer science 2012, 124(4), 2838–2845. [Google Scholar] [CrossRef]
- Nandiyanto, A. B. D.; Ragadhita, R.; Fiandini, M. Interpretation of Fourier transform infrared spectra (FTIR): A practical approach in the polymer/plastic thermal decomposition. Indonesian Journal of Science and Technology 2023, 8(1), 113–126. [Google Scholar] [CrossRef]
- Shurvell, H. F. Spectra–structure correlations in the mid-and far-infrared; Handbook of vibrational spectroscopy, 2006. [Google Scholar]
- Brand-Williams, W.; Cuvelier, M.-E.; Berset, C. Use of a free radical method to evaluate antioxidant activity. LWT—Food Science and Technology 1995, 28(1), 25–30. [Google Scholar] [CrossRef]
- Peng, F.; Ren, J. L.; Xu, F.; Bian, J.; Peng, P.; Sun, R. C. Comparative study of hemicelluloses obtained by graded ethanol precipitation from sugarcane bagasse. Journal of agricultural and food chemistry 2009, 57(14), 6305–6317. [Google Scholar] [CrossRef] [PubMed]
- Coelho, R. R.; Hovell, I.; Moreno, E. L.; de Souza, A. L.; Rajagopal, K. Characterization of functional groups of asphaltenes in vacuum residues using molecular modelling and FTIR techniques. Petroleum science and technology 2007, 25(1-2), 41–54. [Google Scholar] [CrossRef]
- Bokovets, S. P.; Pertsevoi, F. V.; Murlykina, N. V.; Smetanska, I. M.; Borankulova, A. S.; Ianchyk, M. V.; Yarmosh, T. A. Investigation of infrared spectra of agar-based gel systems for the production of jelly bars. Journal of Chemistry and Technologies 2023, 31(1), 92–103. [Google Scholar]
- Ludwig, B. Infrared spectroscopy studies of aluminum oxide and metallic aluminum powders, part II: adsorption reactions of organofunctional silanes. Powders 2022, 1(2), 75–87. [Google Scholar] [CrossRef]
- Barberousse, Hélène; et al. Optimization of enzymatic extraction of ferulic acid from wheat bran, using response surface methodology, and characterization of the resulting fractions. Journal of the Science of Food and Agriculture 2009, 89.10, 1634–1641. [Google Scholar] [CrossRef]
- Kulathunga, J.; Simsek, S. Stone milling conditions and starter culture source influence phytic acid content and antioxidant activity in whole-grain sourdough bread. Cereal Chemistry 2024, 101(2), 313–322. [Google Scholar] [CrossRef]
- Dai, J.; Mumper, R. J. Plant phenolics: extraction, analysis and their antioxidant and anticancer properties. Molecules 2010, 15(10), 7313–7352. [Google Scholar] [CrossRef]
- Shi, L.; Zhao, W.; Yang, Z.; Subbiah, V.; Suleria, H. A. R. Extraction and characterization of phenolic compounds and their potential antioxidant activities. Environmental Science and Pollution Research 2022, 29(54), 81112–81129. [Google Scholar] [CrossRef]
- Sombutsuwan, P.; Durand, E.; Aryusuk, K. Effect of acidity/alkalinity of deep eutectic solvents on the extraction profiles of phenolics and biomolecules in defatted rice bran extract. PeerJ Analytical Chemistry 2024, 6, e29. [Google Scholar] [CrossRef]
- Huang, W.; Tian, F.; Wang, H.; Wu, S.; Jin, W.; Shen, W.; Liu, G. Comparative assessment of extraction, composition, and in vitro antioxidative properties of wheat bran polyphenols. LWT 2023, 180, 114706. [Google Scholar] [CrossRef]
- Tang, Q.; Huang, G. Improving method, properties and application of polysaccharide as emulsifier. Food chemistry 2022, 376, 131937. [Google Scholar] [CrossRef] [PubMed]
- Bai, L.; Huan, S.; Li, Z.; McClements, D. J. Comparison of emulsifying properties of food-grade polysaccharides in oil-in-water emulsions: Gum arabic, beet pectin, and corn fiber gum. Food Hydrocolloids 2017, 66, 144–153. [Google Scholar] [CrossRef]
- Schendel, R. R.; Meyer, M. R.; Bunzel, M. Quantitative profiling of feruloylated arabinoxylan side-chains from graminaceous cell walls. Frontiers in Plant Science 2016, 6, 1249. [Google Scholar] [CrossRef]
- Bauer, J. L.; Harbaum-Piayda, B.; Schwarz, K. Phenolic compounds from hydrolyzed and extracted fiber-rich by-products. LWT 2012, 47(2), 246–254. [Google Scholar] [CrossRef]
- Martínez-López, A. L.; Carvajal-Millan, E.; Lizardi-Mendoza, J.; Rascón-Chu, A.; López-Franco, Y. L.; Salas-Muñoz, E.; Ramírez-Wong, B. Ferulated arabinoxylans as by-product from maize wet-milling process: Characterization and gelling capability. Maize: Cultivation, uses and health benefits 2012, 65–74. [Google Scholar]
- Chanliaud, E.; Saulnier, L.; Thibault, J. F. Alkaline extraction and characterisation of heteroxylans from maize bran. Journal of Cereal Science 1995, 21(2), 195–203. [Google Scholar] [CrossRef]
- Mendez-Encinas, M. A.; Carvajal-Millan, E.; Rascon-Chu, A.; Astiazaran-Garcia, H. F.; Valencia-Rivera, D. E. Ferulated arabinoxylans and their gels: Functional properties and potential application as antioxidant and anticancer agent. Oxidative Medicine and Cellular Longevity 2018, 2018(1), 2314759. [Google Scholar] [CrossRef]
- Méndez, D. A.; Fabra, M. J.; Odriozola-Serrano, I.; Martín-Belloso, O.; Salvia-Trujillo, L.; López-Rubio, A.; Martínez-Abad, A. Influence of the extraction conditions on the carbohydrate and phenolic composition of functional pectin from persimmon waste streams. Food Hydrocolloids 2022, 123, 107066. [Google Scholar] [CrossRef]
- Ji, Y.; Yang, X.; Ji, Z.; Zhu, L.; Ma, N.; Chen, D.; Cao, Y. DFT-calculated IR spectrum amide I, II, and III band contributions of N-methylacetamide fine components. ACS omega 2020, 5(15), 8572–8578. [Google Scholar] [CrossRef]
- Hussain, M.; Saeed, F.; Niaz, B.; Imran, A.; Tufail, T. Biochemical and structural characterization of ferulated arabinoxylans extracted from nixtamalized and non-nixtamalized maize bran. Foods 2022, 11(21), 3374. [Google Scholar] [CrossRef]
- Pettolino, F. A.; Walsh, C.; Fincher, G. B.; Bacic, A. Determining the polysaccharide composition of plant cell walls. Nature protocols 2012, 7(9), 1590–1607. [Google Scholar] [CrossRef]
- Mendez-Encinas, M. A.; Carvajal-Millan, E.; Rascon-Chu, A.; Astiazaran-Garcia, H. F.; Valencia-Rivera, D. E. Ferulated arabinoxylans and their gels: Functional properties and potential application as antioxidant and anticancer agent. Oxidative Medicine and Cellular Longevity 2018, 2018(1), 2314759. [Google Scholar] [CrossRef]
- Rocchetti, G.; Gregorio, R. P.; Lorenzo, J. M.; Barba, F. J.; Oliveira, P. G.; Prieto, M. A.; Lucini, L. Functional implications of bound phenolic compounds and phenolics–food interaction: A review. Comprehensive Reviews in Food Science and Food Safety 2022, 21(2), 811–842. [Google Scholar] [CrossRef]
Figure 1.
Interaction plot of alkaline concentration, temperature and time for the extraction yield of ferulated arabinoxylans (FAXs) from maize bran. FAX; Ferulated arabinoxylans, Figure (a): Interaction between time and the concentration of KOH, Figure (b): Interaction between temperature and the concentration of KOH, Figure (c): Relationship between KOH concentration and time, Figure (d): Interaction between temperature and time, Figure (d): Relationship between concentration of KOH and temperature, Figure (f) Interaction between time and temperature.
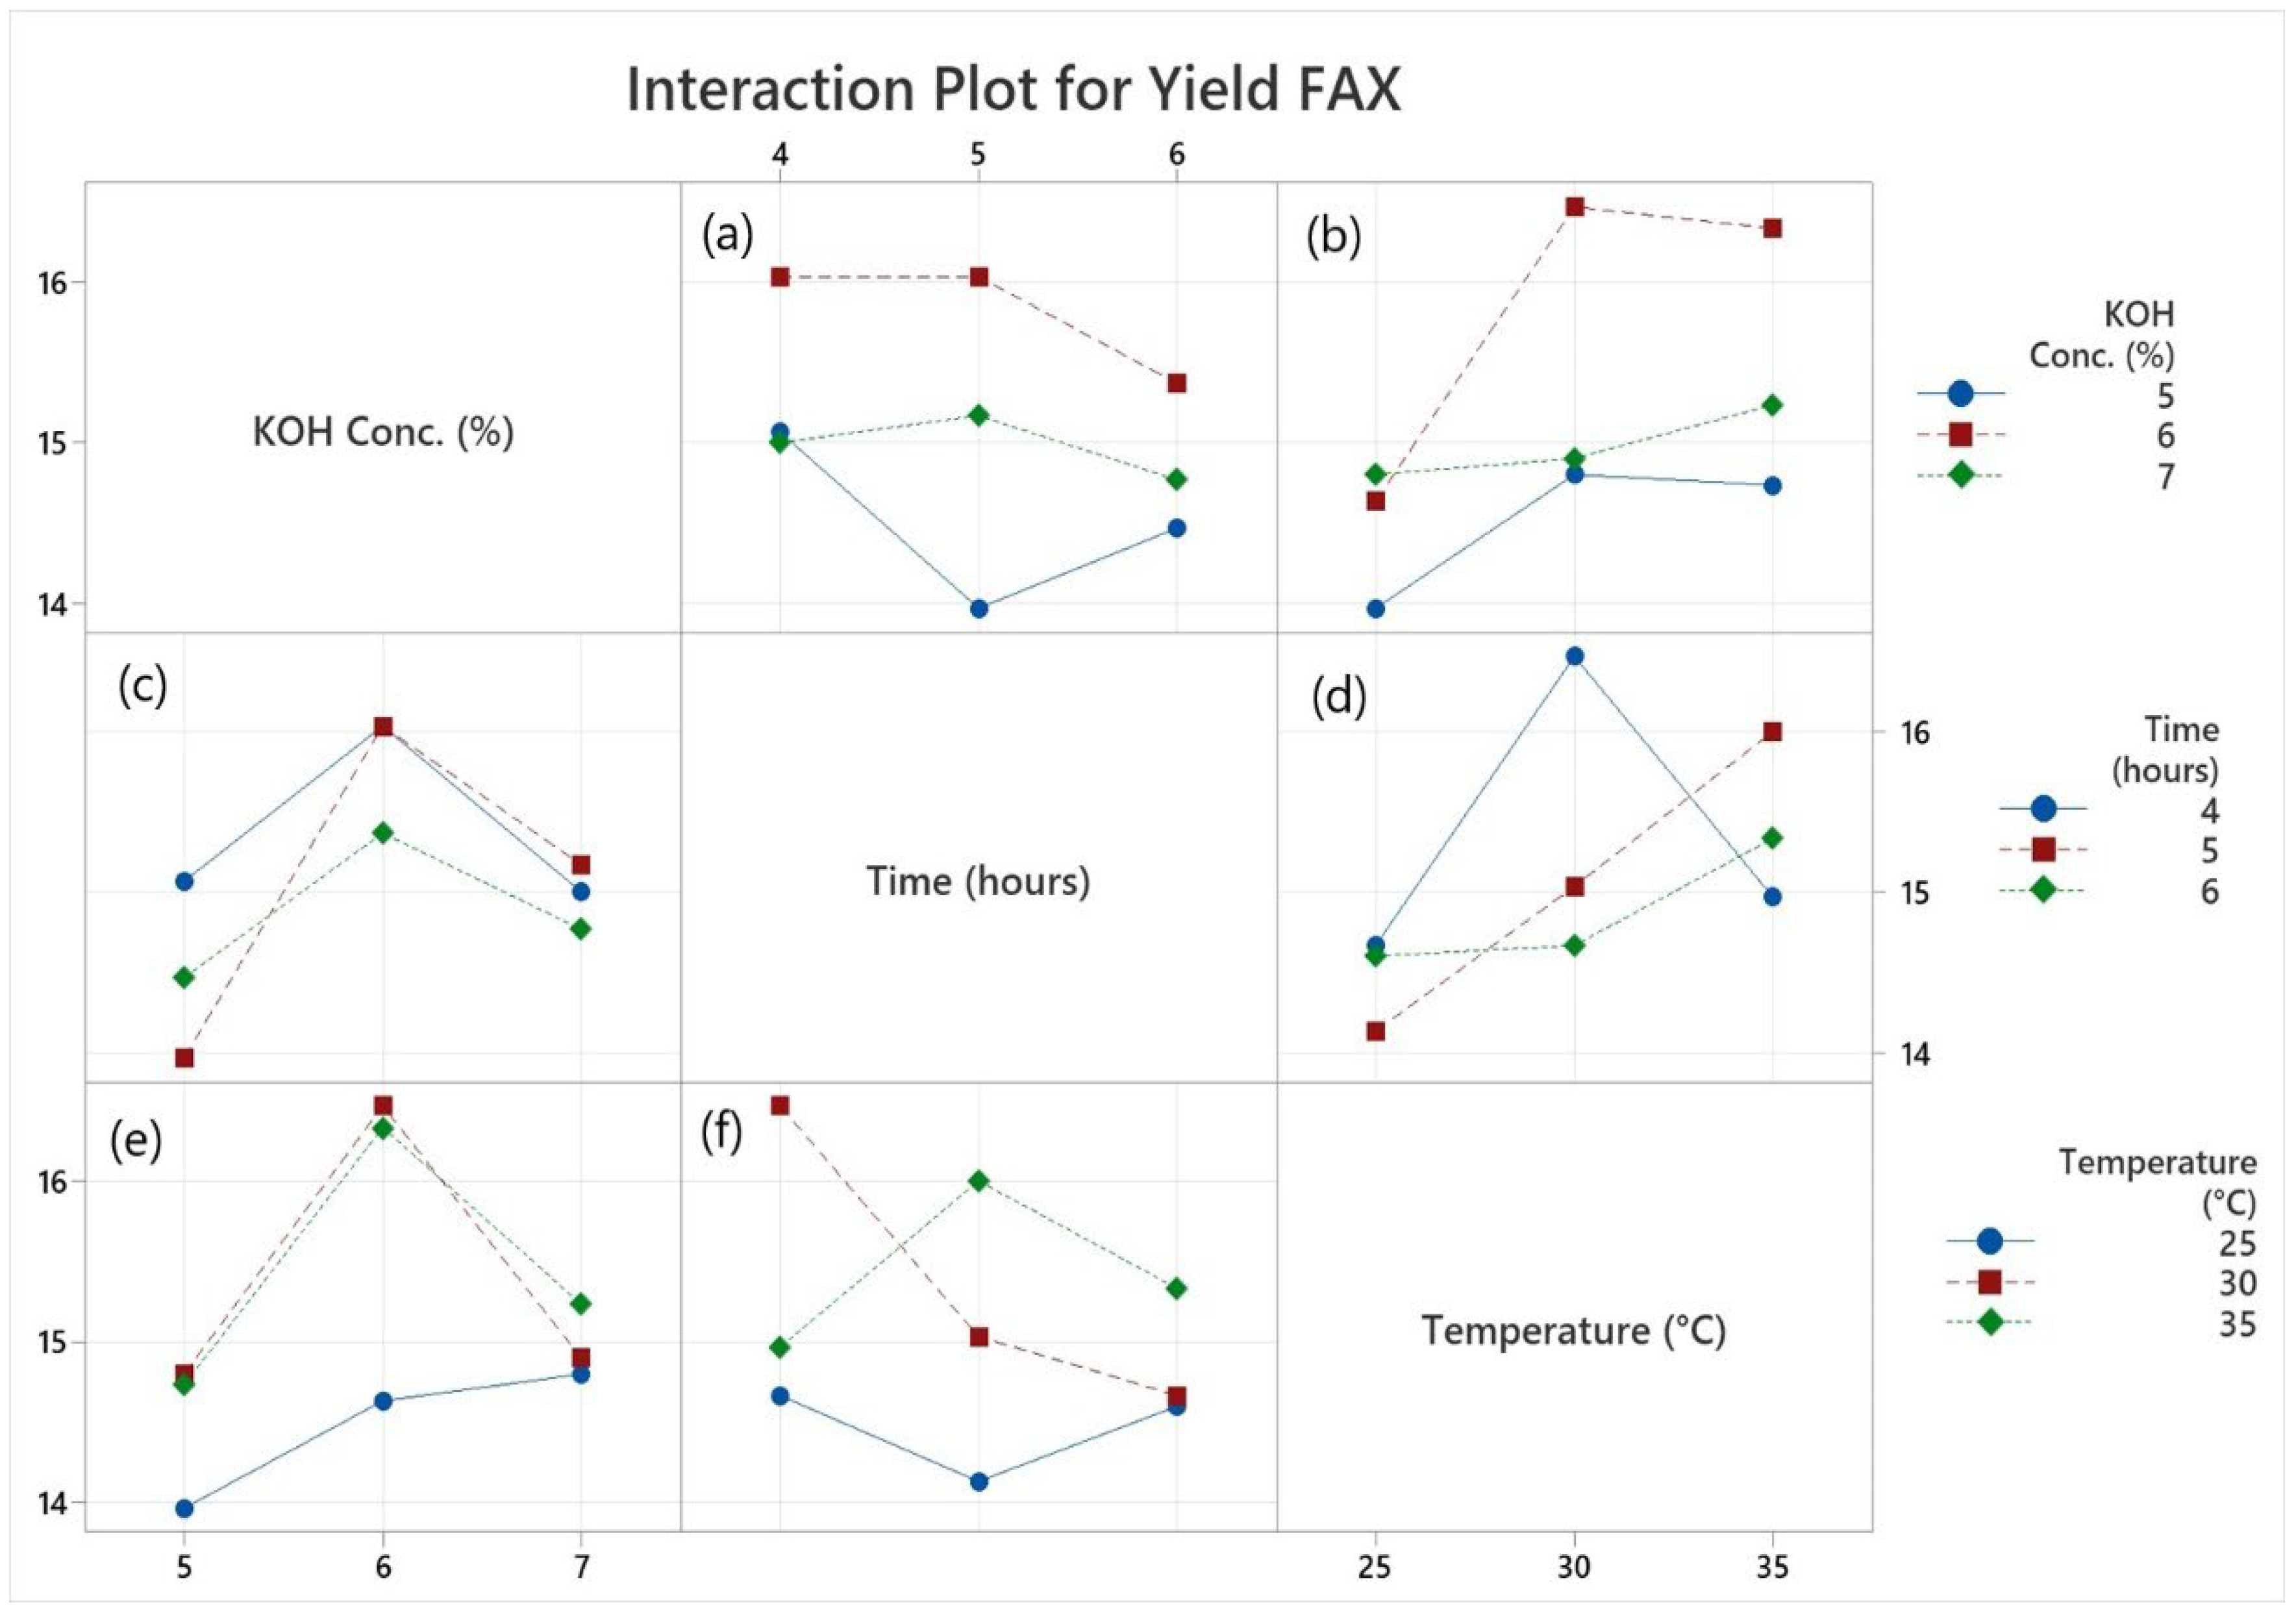
Figure 2.
infrared spectrograms of different treatments of ferulated arabinoxylans extracted from maize bran. FAX1: KOH Concentration 5%, Time 4 hours, Temperature 25, 30 and 35°C, FAX2: KOH Concentration 5%, Time 5 hours, Temperature 25, 30 and 35°C, FAX3: KOH Concentration 5%, Time 6 hours, Temperature 25, 30 and 35°C, FAX4: KOH Concentration 6%, Time 4 hours, Temperature 25, 30 and 35°C, FAX5: KOH Concentration 6%, Time 5 hours, Temperature 25, 30 and 35°C, FAX6: KOH Concentration 6%, Time 6 hours, Temperature 25, 30 and 35°C, FAX7: KOH Concentration 7%, Time 4 hours, Temperature 25, 30 and 35°C, FAX8: KOH Concentration 7%, Time 5 hours, Temperature 25, 30 and 35°C, FAX9: KOH Concentration 7%, Time 6 hours, Temperature 25, 30 and 35°C, Different letters (a-g) within the column indicated the interaction of treatments are significantly different (p ≤ 0.05). Same lettering showed non-significant difference from each other. Results are expressed as the mean value ± standard deviation (n = 2).
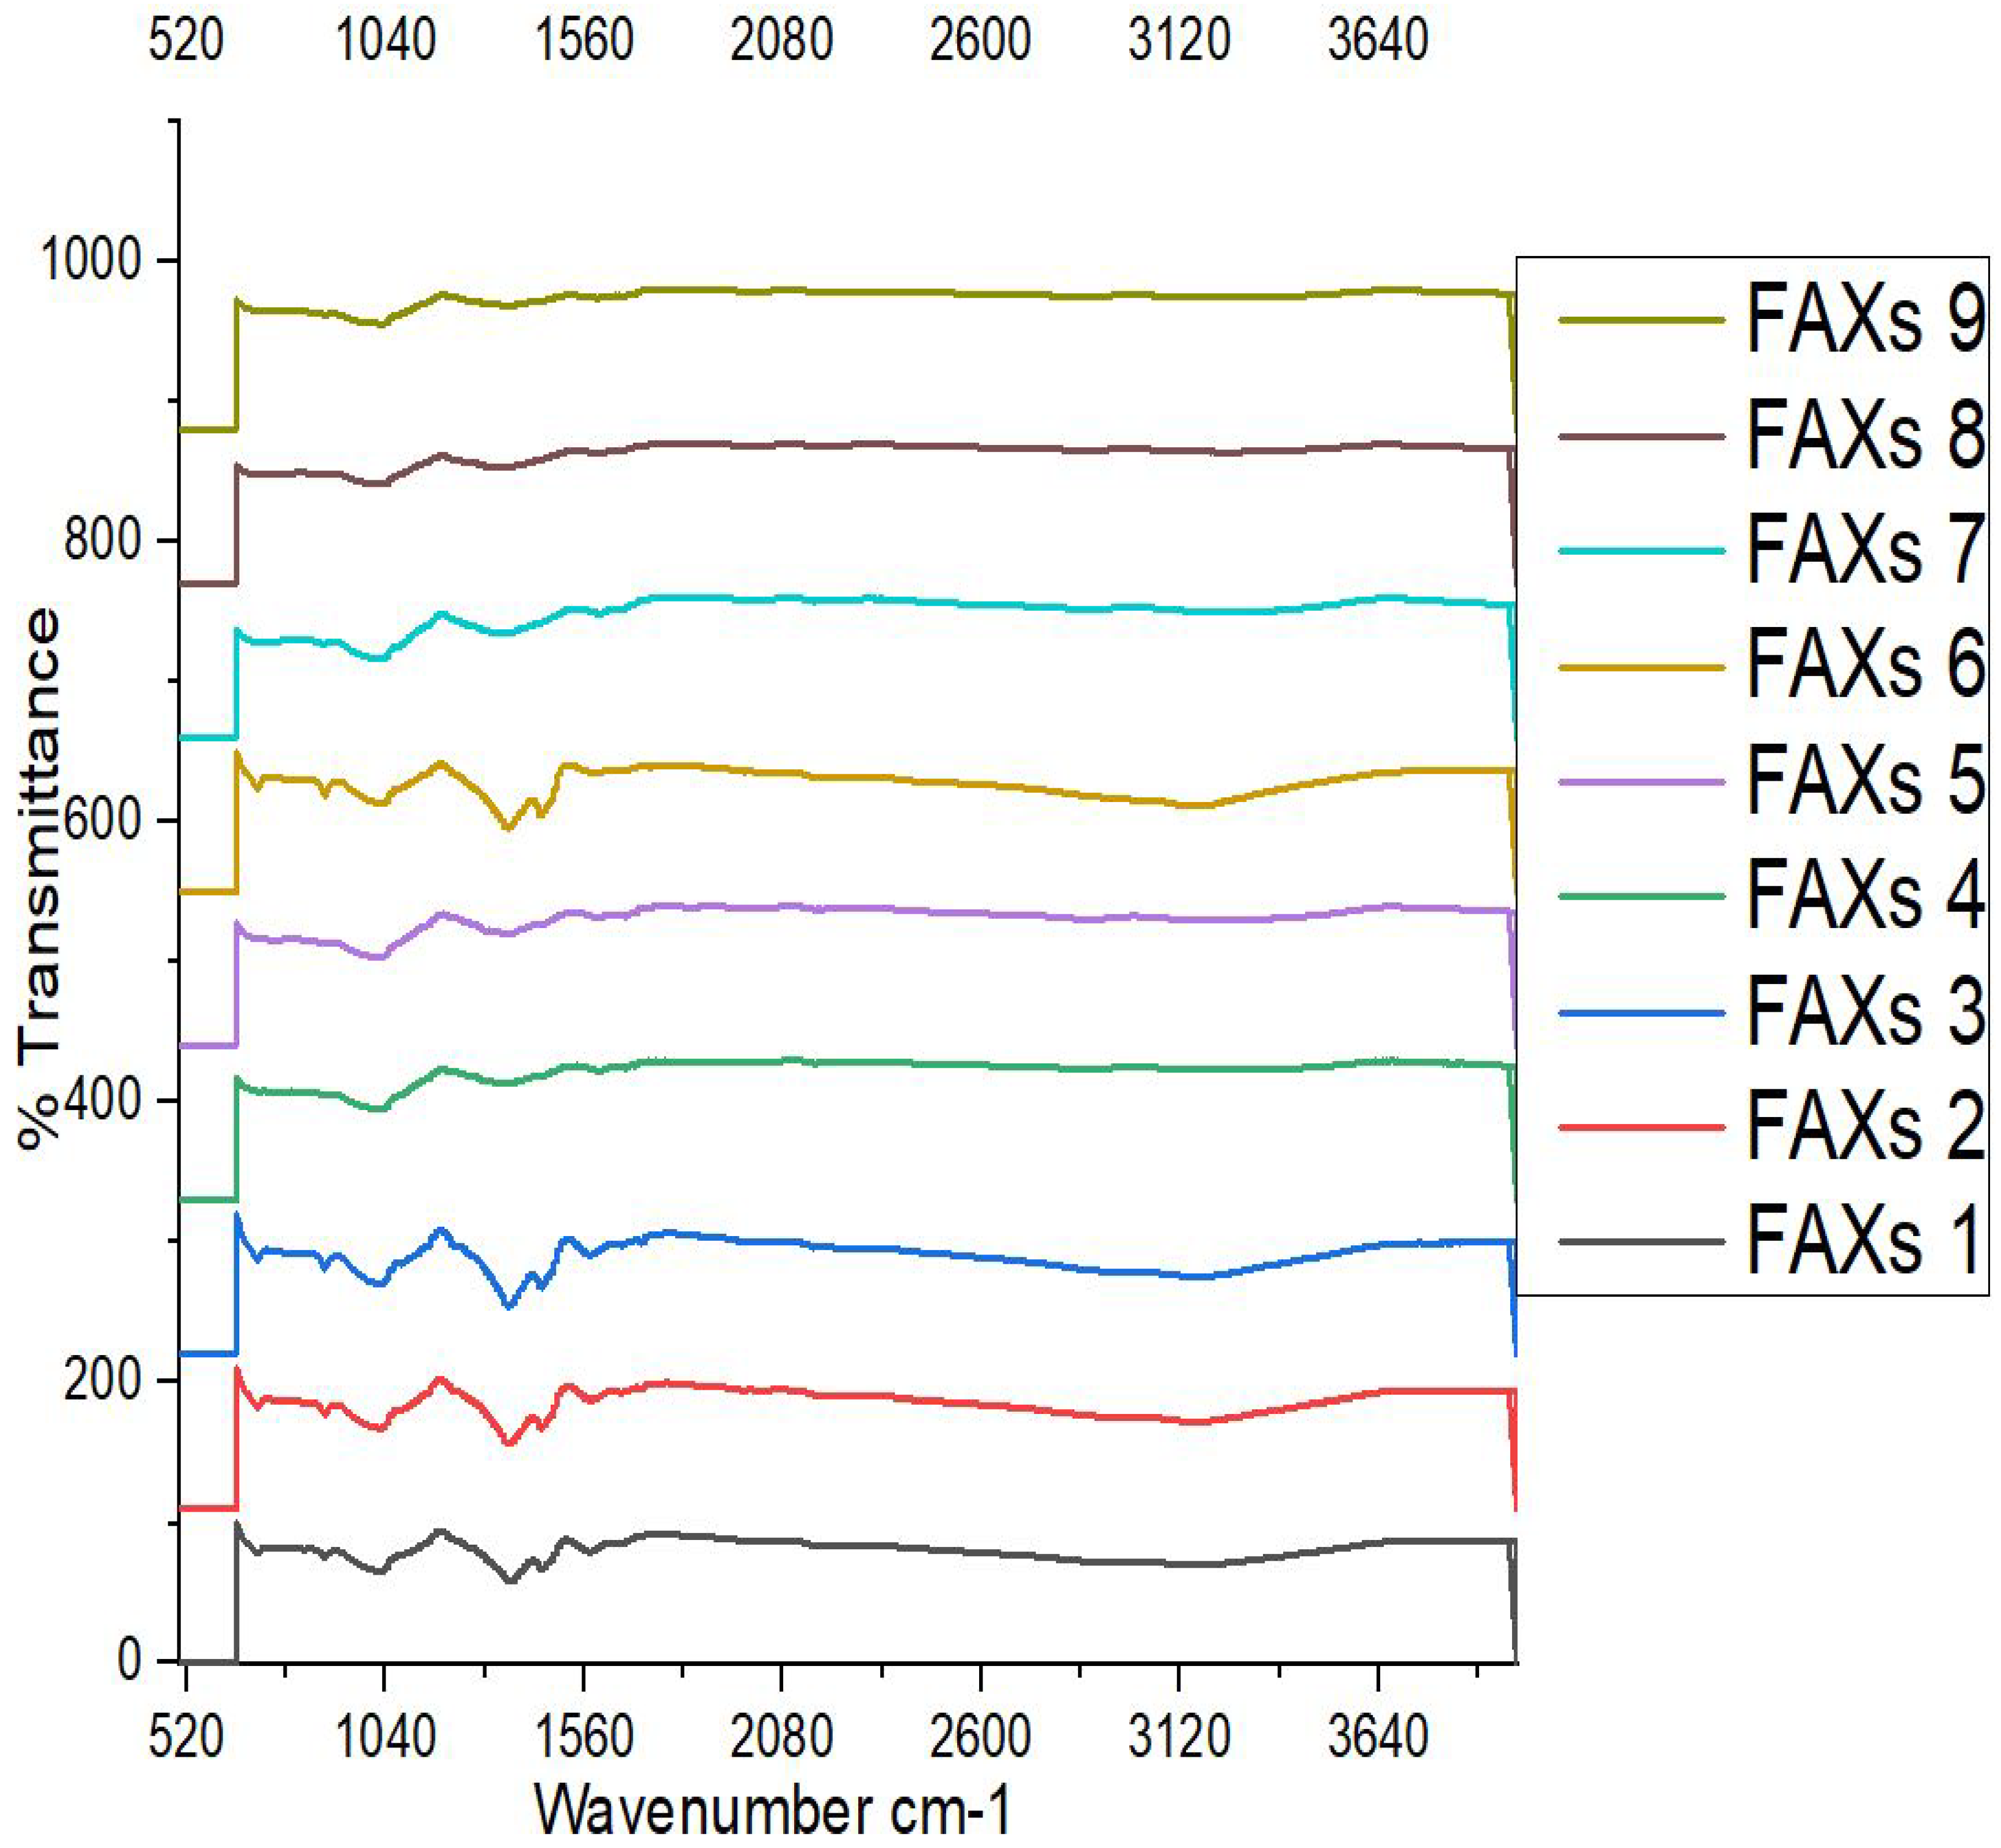
Figure 3.
SEM images of ferulated arabinoxylans from extracted from maize bran at magnifications of ×2500 and ×5000. A and a=FAX1, B and b= FAX2, C and c= FAX3, D and d=FAX4, E and e=FAX5, F and f=FAX6, G and g=FAX7, H and h=FAX8 and I and i=FAX9. FAX1: KOH Concentration 5%, Time 4 hours, Temperature 25, 30 and 35°C, FAX2: KOH Concentration 5%, Time 5 hours, Temperature 25, 30 and 35°C, FAX3: KOH Concentration 5%, Time 6 hours, Temperature 25, 30 and 35°C, FAX4: KOH Concentration 6%, Time 4 hours, Temperature 25, 30 and 35°C, FAX5: KOH Concentration 6%, Time 5 hours, Temperature 25, 30 and 35°C, FAX6: KOH Concentration 6%, Time 6 hours, Temperature 25, 30 and 35°C, FAX7: KOH Concentration 7%, Time 4 hours, Temperature 25, 30 and 35°C, FAX8: KOH Concentration 7%, Time 5 hours, Temperature 25, 30 and 35°C, FAX9: KOH Concentration 7%, Time 6 hours, Temperature 25, 30 and 35°C.
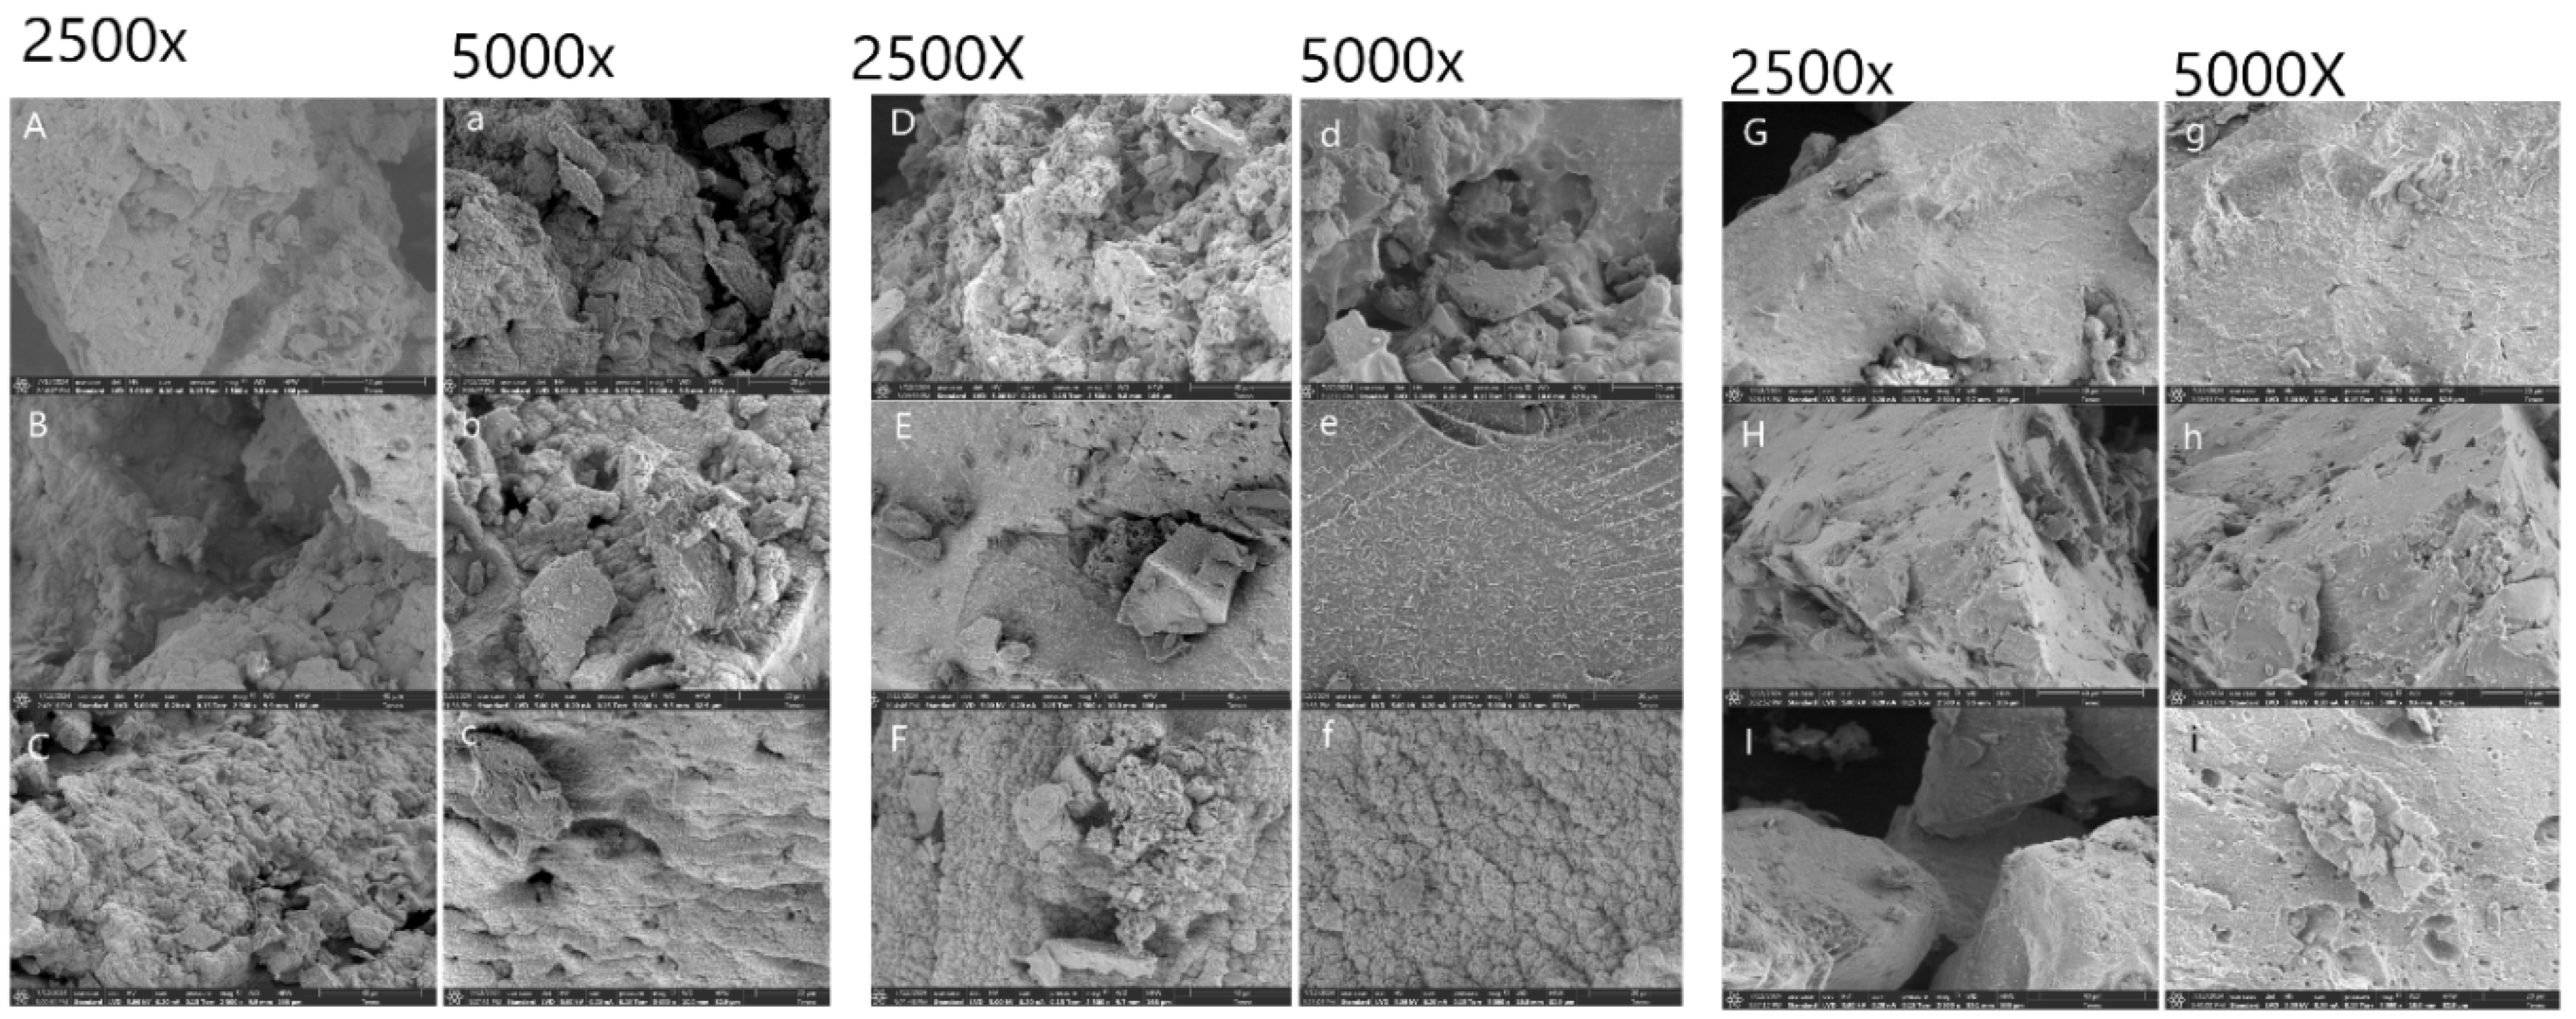
Table 1.
Extraction of ferulated arabinoxylans from maize bran at different KOH concentrations, time and temperatures.
Table 1.
Extraction of ferulated arabinoxylans from maize bran at different KOH concentrations, time and temperatures.
| Samples Run | Factors | Purified Yield of FAX (%) |
Coding of Selected Samples | ||
|---|---|---|---|---|---|
| KOH Conc. (%) | Time (hours) | Temperature (°C) | |||
| 1 | 5 | 4 | 25 | 14.50±0.04g | FAX1 |
| 2 | 5 | 4 | 30 | 14.50±0.04g | - |
| 3 | 5 | 4 | 35 | 14.55±0.05g | - |
| 4 | 5 | 5 | 25 | 18.90±0.05a | FAX2 |
| 5 | 5 | 5 | 30 | 18.90±0.04a | - |
| 6 | 5 | 5 | 35 | 18.90±0.04a | - |
| 7 | 5 | 6 | 25 | 16.20±0.04c | FAX3 |
| 8 | 5 | 6 | 30 | 16.20±0.04c | - |
| 9 | 5 | 6 | 35 | 16.20±0.04c | - |
| 10 | 6 | 4 | 25 | 15.20±0.04e | FAX4 |
| 11 | 6 | 4 | 30 | 15.20±0.04e | - |
| 12 | 6 | 4 | 35 | 15.20±0.04e | - |
| 13 | 6 | 5 | 25 | 16.10±0.02d | FAX5 |
| 14 | 6 | 5 | 30 | 16.10±0.03d | - |
| 15 | 6 | 5 | 35 | 16.10±0.04d | - |
| 16 | 6 | 6 | 25 | 14.70±0.02f | FAX6 |
| 17 | 6 | 6 | 30 | 14.70±0.04f | - |
| 18 | 6 | 6 | 35 | 14.70±0.04f | - |
| 19 | 7 | 4 | 25 | 15.80±0.05e | FAX7 |
| 20 | 7 | 4 | 30 | 15.80±0.04e | - |
| 21 | 7 | 4 | 35 | 15.80±0.04e | - |
| 22 | 7 | 5 | 25 | 16.30±0.04b | FAX8 |
| 23 | 7 | 5 | 30 | 16.30±0.04b | - |
| 24 | 7 | 5 | 35 | 16.30±0.04b | - |
| 25 | 7 | 6 | 25 | 16.10±0.04d | FAX9 |
| 26 | 7 | 6 | 30 | 16.10±0.04d | - |
| 27 | 7 | 6 | 35 | 16.10±0.04d | - |
FAX1: KOH Concentration 5%, Time 4 hours, Temperature 25, 30 and 35°C, FAX2: KOH Concentration 5%, Time 5 hours, Temperature 25, 30 and 35°C, FAX3: KOH Concentration 5%, Time 6 hours, Temperature 25, 30 and 35°C, FAX4: KOH Concentration 6%, Time 4 hours, Temperature 25, 30 and 35°C, FAX5: KOH Concentration 6%, Time 5 hours, Temperature 25, 30 and 35°C, FAX6: KOH Concentration 6%, Time 6 hours, Temperature 25, 30 and 35°C, FAX7: KOH Concentration 7%, Time 4 hours, Temperature 25, 30 and 35°C, FAX8: KOH Concentration 7%, Time 5 hours, Temperature 25, 30 and 35°C, FAX9: KOH Concentration 7%, Time 6 hours, Temperature 25, 30 and 35°C, Different letters (a-g) within the column indicated the interaction of treatments are significantly different (p ≤ 0.05). Same lettering showed non-significant difference from each other. Results are expressed as the mean value ± standard deviation (n = 2).
Table 2.
Monosaccharaides composition and protein content of Ferulated arabinoxylans extracted from maize bran.
Table 2.
Monosaccharaides composition and protein content of Ferulated arabinoxylans extracted from maize bran.
| Chemical components | FAX1 | FAX2 | FAX3 | FAX4 | FAX5 | FAX6 | FAX7 | FAX8 | FAX9 |
|---|---|---|---|---|---|---|---|---|---|
| Arabinose (%) | 16.0±1.29e | 12.7±1.74f | 17.2±4.12e | 30.4±0.86a | 25.5±6.10c | 15.7±1.43e | 27.4±4.54b | 23.9±2.20d | 26.2±1.33b |
| Xylose (%) | 22.4±2.82e | 18.3±2.63f | 23.3±6.52e | 44.7±2.49a | 36.0±9.85c | 21.8±1.92e | 38.1±6.28b | 32.1±2.82d | 33.5±1.26d |
| Galactose (%) | 3.1±0.09e | 2.7±0.40f | 3.9±0.66d | 7.4±0.39a | 5.8±1.52c | 3.5±0.20d | 6.6±1.26b | 5.6±0.53c | 6.1±0.30c |
| Glucose (%) | 6.1±0.37c | 4.8±0.54e | 7.3±0.85b | 9.2±0.39a | 7.3±1.61b | 4.6±0.36e | 6.5±1.17c | 5.9±0.59d | 6.0±0.23c |
| Ara/Xyl Ratio | 0.71±0.02d | 0.69±0.01e | 0.73±0.03b | 0.68±0.01f | 0.68±0.03f | 0.72±0.03c | 0.71±0.02d | 0.74±0.03a | 0.73±0.02b |
| Protein (%) | 3.58±0.05a | 2.86±0.06c | 3.37±0.05b | 0.96±0.04g | 1.23±0.09f | 1.51±0.02e | 2.09±0.04d | 2.01±0.08d | 1.8±0.06e |
FAX1: KOH Concentration 5%, Time 4 hours, Temperature 25, 30 and 35°C, FAX2: KOH Concentration 5%, Time 5 hours, Temperature 25, 30 and 35°C, FAX3: KOH Concentration 5%, Time 6 hours, Temperature 25, 30 and 35°C, FAX4: KOH Concentration 6%, Time 4 hours, Temperature 25, 30 and 35°C, FAX5: KOH Concentration 6%, Time 5 hours, Temperature 25, 30 and 35°C, FAX6: KOH Concentration 6%, Time 6 hours, Temperature 25, 30 and 35°C, FAX7: KOH Concentration 7%, Time 4 hours, Temperature 25, 30 and 35°C, FAX8: KOH Concentration 7%, Time 5 hours, Temperature 25, 30 and 35°C, FAX9: KOH Concentration 7%, Time 6 hours, Temperature 25, 30 and 35°C. Different letters (a-g) within the row indicated the interaction of treatments are significantly different (p ≤ 0.05). Same lettering showed non-significant difference from each other. Results are expressed as the mean value ± standard deviation (n = 3).
Table 3.
Total phenolic content of different treatments of ferulated arabinoxylans extracted from maize bran.
Table 3.
Total phenolic content of different treatments of ferulated arabinoxylans extracted from maize bran.
| Total Phenolic content | FAX1 | FAX2 | FAX3 | FAX4 | FAX5 | FAX6 | FAX7 | FAX8 | FAX9 |
|---|---|---|---|---|---|---|---|---|---|
| Free form of TPC (ug/g FAE) | 75.7±0.83bE | 39.4±0.08dD | 114.4±1.76aD | 23.5±0.44eE | 17.7±1.10fE | 48.1±0.08cE | 9.0±0.13gE | 18.3±0.13fE | 9.8±0.08gE |
| Alkaline extracted TPC (ug/g FAE) | 909.7±1.32bA | 592.8±0.44dA | 978.8±2.7aA | 155.0±5.3iA | 408.8±4.4gA | 634.4±3.5cA | 566.9±5.3eA | 536.3±0.9fA | 303.4±2.2hB |
| Acid extracted TPC (ug/g FAE) | 291.1±1.0cB | 264.3±0.7eB | 347.6±0.22aB | 105.4±0.22iB | 184.1±0.57hC | 281.0±0.75dB | 225.3±0.97fC | 188.2±0.13gC | 308.8±0.04bA |
| Fraction I, bound TPC (ug/g FAE) | 107.2±0.48aD | 27.1±0.13iE | 90.2±0.39dE | 100.8±0.26bC | 55.0±0.53hD | 88.5±0.44eD | 79.8±0.13fD | 67.5±0.30gD | 99.4±0.44cC |
| Fraction II, bound TPC (ug/g FAE) | 253.8±10.6bC | 255.9±10.1bC | 196.9±1.76eC | 58.1±1.76gD | 223.8±4.41dB | 186.3±5.30fC | 292.8±3.09aB | 230.9±3.09cB | 48.8±0.00hD |
FAX1: KOH Concentration 5%, Time 4 hours, Temperature 25, 30 and 35°C, FAX2: KOH Concentration 5%, Time 5 hours, Temperature 25, 30 and 35°C, FAX3: KOH Concentration 5%, Time 6 hours, Temperature 25, 30 and 35°C, FAX4: KOH Concentration 6%, Time 4 hours, Temperature 25, 30 and 35°C, FAX5: KOH Concentration 6%, Time 5 hours, Temperature 25, 30 and 35°C, FAX6: KOH Concentration 6%, Time 6 hours, Temperature 25, 30 and 35°C, FAX7: KOH Concentration 7%, Time 4 hours, Temperature 25, 30 and 35°C, FAX8: KOH Concentration 7%, Time 5 hours, Temperature 25, 30 and 35°C, FAX9: KOH Concentration 7%, Time 6 hours, Temperature 25, 30 and 35°C, TPC; Total phenolic content, Different letters (a-i) within the row indicated the interaction of treatments are significantly different (p ≤ 0.05). Different letters (A-E) within the column indicated the interaction of extracts are significantly different (p ≤ 0.05). Results are expressed as the mean value ± standard deviation (n = 2).
Table 4.
Quantification of ferulic acid contents through HPLC in different treatments of ferulated arabinoxylans extracted from maize bran.
Table 4.
Quantification of ferulic acid contents through HPLC in different treatments of ferulated arabinoxylans extracted from maize bran.
| Ferulic acid | FAX1 | FAX2 | FAX3 | FAX4 | FAX5 | FAX6 | FAX7 | FAX8 | FAX9 |
|---|---|---|---|---|---|---|---|---|---|
| FFFA (ug/g) | 16.33 | 5.05 | 44.71 | 3.56 | 0.34 | 4.25 | 0.44 | 0.53 | 2.73 |
| Alkaline extracted FA (ug/g) | 252.21 | 165.56 | 267.88 | 63.49 | 140.59 | 262.5 | 204.36 | 181.56 | 115.93 |
| Acid extracted FA (ug/g) | 8.68 | 7.18 | 11.62 | 1.78 | 2.45 | 2.85 | 6.43 | 4.62 | 7.49 |
| Fraction I BFFA (ug/g) | 3.35 | 1.25 | 2.09 | 2.96 | 2.78 | 1.58 | 2.31 | 2.01 | 4.11 |
| Fraction II BFFA (ug/g) | 75.88 | 78.77 | 70.29 | 28.56 | 92.3 | 66.48 | 127.32 | 83.85 | 48.54 |
FAX1: KOH Concentration 5%, Time 4 hours, Temperature 25, 30 and 35°C, FAX2: KOH Concentration 5%, Time 5 hours, Temperature 25, 30 and 35°C, FAX3: KOH Concentration 5%, Time 6 hours, Temperature 25, 30 and 35°C, FAX4: KOH Concentration 6%, Time 4 hours, Temperature 25, 30 and 35°C, FAX5: KOH Concentration 6%, Time 5 hours, Temperature 25, 30 and 35°C, FAX6: KOH Concentration 6%, Time 6 hours, Temperature 25, 30 and 35°C, FAX7: KOH Concentration 7%, Time 4 hours, Temperature 25, 30 and 35°C, FAX8: KOH Concentration 7%, Time 5 hours, Temperature 25, 30 and 35°C, FAX9: KOH Concentration 7%, Time 6 hours, Temperature 25, 30 and 35°C, FFFA; Free form ferulic acid, FA, Ferulic acid, BFFA; bound form ferulic acid, HPLC; High Performance Liquid Chromatography.
Table 5.
Antioxidant activity of ferulated arabinoxylans extracts.
| Treatments | FAX1 | FAX2 | FAX3 | FAX4 | FAX5 | FAX6 | FAX7 | FAX8 | FAX9 |
|---|---|---|---|---|---|---|---|---|---|
| Ferric Reducing Antioxidant Power (FRAP) | |||||||||
| Free form of bioactive in FAXs extract ug/g TE | 56.5±0.19b | 49.5±0.12c | 122.6±0.24a | 29.4±0.19d | 11.6±0.05i | 19.5±0.01f | 16.5±0.19g | 25.7±0.01e | 13.2±0.01h |
| Alkaline extracted (Bound form extract) ug/g TE | 894.7±1.99b | 616.1±0.34e | 905.0±3.55a | 214.5±0.04i | 384.2±0.87g | 727.5±1.55c | 624.3±0.92d | 594.7±1.60f | 374.7±0.48h |
| Acid extracted (Bound form extract) ug/g TE | 246.7±3.39c | 223.6±2.36d | 260.0±0.75a | 119.8±0.83h | 177.1±0.54g | 245.2±0.47c | 217.8±0.40e | 205.9±2.28f | 256.1±1.41b |
| Fraction I (Bound form extract) ug/g TE | 108.6±0.20a | 25.3±0.06h | 94.3±0.12b | 81.3±0.20d | 46.7±0.01g | 83.6±0.36c | 63.6±0.13e | 48.0±0f | 80.5±0.20e |
| Fraction II (Bound form extract) ug/g TE | 298.6±1.07d | 310.5±1.07c | 286.5±0.43e | 118.7±0.43i | 283.7±0.53f | 242.3±1.16g | 367.9±1.36a | 318.8±0.48b | 188.3±0.24h |
| 2,2′-azinobis-(3-ethylbenzothiazoline-6-sulfonic acid) (ABTS) | |||||||||
| Free form of bioactive in FAXs extract ug/g TE | 75.1±0.01c | 74.7±0.03c | 428.7±4.19b | 74.0±0.11b | 29.3±0.31d | 73.7±0.12c | 34.0±0.25e | 40.5±0.30d | 74.2±0.16c |
| Alkaline extracted (Bound form extract) ug/g TE | 596.0±10.6c | 376.7±2.53a | 578.1±2.37a | 413.6±1.97a | 627.5±4.19a | 705.7±2.05a | 549.3±2.05a | 534.2±3.87a | 491.5±2.45a |
| Acid extracted (Bound form extract) ug/g TE | 71.7±0.18d | 68.0±0.29d | 74.5±0.03d | 51.5±0.37d | 60.8±0.27c | 67.6±0.23d | 65.7±0.30c | 61.8±0.34c | 70.3±0.19d |
| Fraction I (Bound form extract) ug/g TE | 39.3±1.03e | 11.0±0.63e | 35.1±0.55e | 37.0±0.45e | 14.8±0.25e | 46.9±0.42e | 45.5±0.33d | 32.0±0.30e | 40.7±0.49e |
| Fraction II (Bound form extract) ug/g TE | 250.2±3.00b | 264.2±3.24b | 266.6±2.45c | 67.9±2.21c | 200.7±3.16b | 146.4±3.32b | 220.3±3.32b | 221.6±4.03b | 136.2±4.11b |
| 2,2-diphenyl-1-picrylhydrazyl (DPPH) | |||||||||
| Free form of bioactive in FAXs extract ug/g TE | 20.6±0.23e | 21.1±0.58e | 64.4±3.74e | 13.4±0.49e | 13.7±0.03e | 4.8±0.35e | 12.3±0.04e | 9.3±0.02e | 2.9±0.21e |
| Alkaline extracted (Bound form extract) ug/g TE | 511.5±1.14a | 292.6±1.66a | 560.1±2.59a | 140.1±2.07b | 251.7±0.72a | 435.9±2.28a | 397.8±2.28a | 373.0±1.14a | 236.1±0.31a |
| Acid extracted (Bound form extract) ug/g TE | 73.6±0.29d | 67.6±0.34d | 80.7±0.18c | 43.3±0.17d | 55.5±0.31d | 68.2±0.41c | 60.1±0.31c | 60.8±0.38c | 71.5±0.36c |
| Fraction I (Bound form extract) ug/g TE | 78.6±0.27c | 74.5±0.32c | 79.6±0.23d | 69.3±0.32c | 59.5±0.39c | 34.8±0.20d | 34.2±0.13d | 32.6±0.21d | 43.1±0.31d |
| Fraction II (Bound form extract) ug/g TE | 200.8±2.59b | 212.4±2.59b | 197.2±2.91b | 180.7±1.66a | 246.0±3.63b | 289.0±3.95b | 241.5±2.80b | 223.1±4.78b | 196.8±2.28b |
FAX1: KOH Concentration 5%, Time 4 hours, Temperature 25, 30 and 35°C, FAX2: KOH Concentration 5%, Time 5 hours, Temperature 25, 30 and 35°C, FAX3: KOH Concentration 5%, Time 6 hours, Temperature 25, 30 and 35°C, FAX4: KOH Concentration 6%, Time 4 hours, Temperature 25, 30 and 35°C, FAX5: KOH Concentration 6%, Time 5 hours, Temperature 25, 30 and 35°C, FAX6: KOH Concentration 6%, Time 6 hours, Temperature 25, 30 and 35°C, FAX7: KOH Concentration 7%, Time 4 hours, Temperature 25, 30 and 35°C, FAX8: KOH Concentration 7%, Time 5 hours, Temperature 25, 30 and 35°C, FAX9: KOH Concentration 7%, Time 6 hours, Temperature 25, 30 and 35°C, FFFA; Free form ferulic acid, FA, Ferulic acid, BFFA; bound form ferulic acid, HPLC; High Performance Liquid Chromatography.
Table 6.
Functional characteristics of ferulated arabinoxylans extracted from maize bran.
| Treatments | Water holding capacity (g/g) | Oil holding capacity (g/g) | Emulsion activity (%) |
Emulsion stability (%) |
|---|---|---|---|---|
| FAX 1 | 9.2±0.05a | 2.96±0.01f | 51±0.08a | 89.7±2.4a |
| FAX 2 | 8.2±0.04b | 3.62±0.02b | 45±0.06b | 82.6±2.3b |
| FAX 3 | 8.9±0.06a | 3.42±0.02c | 49±0.07a | 88.7±2.9a |
| FAX 4 | 9.7±0.03a | 3.28±0.03d | 41±0.04c | 72.5±2.9d |
| FAX 5 | 8.6±0.05b | 3.64±0.05b | 43±0.05c | 77.2±2.2c |
| FAX 6 | 8.5±0.04b | 3.78±0.03a | 45±0.09b | 79.6±2.1c |
| FAX 7 | 8.3±0.06b | 3.44±0.04c | 46±0.04b | 82.5±1.8b |
| FAX 8 | 8.8±0.07a | 3.54±0.05c | 45+0.08b | 80.2±2.4b |
| FAX 9 | 9.4±0.03a | 3.12±0.03e | 42±0.07c | 81.6±3.2b |
FAX1: KOH Concentration 5%, Time 4 hours, Temperature 25, 30 and 35°C, FAX2: KOH Concentration 5%, Time 5 hours, Temperature 25, 30 and 35°C, FAX3: KOH Concentration 5%, Time 6 hours, Temperature 25, 30 and 35°C, FAX4: KOH Concentration 6%, Time 4 hours, Temperature 25, 30 and 35°C, FAX5: KOH Concentration 6%, Time 5 hours, Temperature 25, 30 and 35°C, FAX6: KOH Concentration 6%, Time 6 hours, Temperature 25, 30 and 35°C, FAX7: KOH Concentration 7%, Time 4 hours, Temperature 25, 30 and 35°C, FAX8: KOH Concentration 7%, Time 5 hours, Temperature 25, 30 and 35°C, FAX9: KOH Concentration 7%, Time 6 hours, Temperature 25, 30 and 35°C, Different letters (a-f) within the column indicated the interaction of treatments are significantly different (p ≤ 0.05). Same lettering showed non-significant difference from each other. Results are expressed as the mean value ± standard deviation (n = 3).
Disclaimer/Publisher’s Note: The statements, opinions and data contained in all publications are solely those of the individual author(s) and contributor(s) and not of MDPI and/or the editor(s). MDPI and/or the editor(s) disclaim responsibility for any injury to people or property resulting from any ideas, methods, instructions or products referred to in the content. |
© 2026 by the authors. Licensee MDPI, Basel, Switzerland. This article is an open access article distributed under the terms and conditions of the Creative Commons Attribution (CC BY) license (http://creativecommons.org/licenses/by/4.0/).
Copyright: This open access article is published under a Creative Commons CC BY 4.0 license, which permit the free download, distribution, and reuse, provided that the author and preprint are cited in any reuse.


