
Submitted:
25 December 2025
Posted:
02 January 2026
You are already at the latest version
Abstract
Monitoring behavioural drift, the sustained shift in an individual’s daily activity, sleep, or social patterns offers a significant lens for early mental health intervention. However, detecting these drifts in free-living settings remains challenging due to the absence of ground-truth labels, the temporal complexity of human behaviour, and fragmentation across heterogeneous sensing modalities. This paper proposes a multimodal approach to quantify and detect behavioural drift using longitudinal data from over 500 university students in the NetHealth cohort. We extract personalised, longitudinal features spanning three behavioural domains physical activity, sleep hygiene, and communication diversity and model deviations relative to rolling, individual-specific statistical baselines. To differentiate transient anomalies from meaningful behavioural change, we introduce a sustained streak mechanism that identifies persistent drift episodes. We evaluate three temporal modelling strategies Isolation Forest, Convolutional Neural Networks, and Long Short-Term Memory networks across both single-modality and fused approaches. Our findings indicate that recurrent models offer the strongest performance, highlighting the necessity of capturing temporal dependencies in behavioural data. Furthermore, we find that cross-modal correlations between drift signals are weak, confirming that activity, sleep, and communication provide complementary, non-redundant insights into an individual's wellbeing. This work establishes a robust methodological basis for integrating multimodal sensing data to monitor mental health trajectories, providing a scalable path toward early intervention in digital health.
Keywords:
behavioural drift
; anomaly detection
; unsupervised detection
; digital phenotyping
; multimodal
1. Introduction
The past decade has witnessed a rapid transformation in the study of human behaviour, driven by the ubiquity of smartphones and wearable devices. This paradigm, frequently referred to as digital phenotyping, allows for the continuous, unobtrusive collection of behavioural and physiological signals in real-world environments [1,2,3]. Unlike traditional clinical assessments that provide a static "snapshot" of health, passive sensing captures the high-resolution "video" of an individual’s daily life, encompassing physical activity for example movement variance, step counts, sleep hygiene including onset, interruptions, duration, and social connectivity including call/SMS frequency and contact diversity. The adoption of these technologies is now nearly universal, particularly among young adults. As of 2023, 98% of UK residents aged 16–24 own a smartphone [4], while the use of wearables such as Fitbit and Apple Watch has transitioned from niche fitness tracking to mainstream health monitoring. For university populations, a demographic notoriously prone to fluctuating stress levels and burgeoning mental health challenges, this creates a unique opportunity for large-scale, real-time monitoring. However, the true value of these data streams lies not in their volume, but in our ability to detect meaningful departures from an individual’s unique "status quo."
Despite the potential of digital sensing, much of the current computational landscape remains ill-suited to detect the gradual, cumulative changes that often characterise early psychological decline. In sensor-based behavioural analysis, Human Activity Recognition (HAR) has long been the predominant approach. These systems typically segment data into short windows for example 10–60 seconds to classify discrete activities such as walking or sitting [5,6]. While effective for identifying momentary states, HAR is limited for understanding sustained behavioural change; it assumes independence among segments and overlooks the long-term temporal continuity that defines human habit.
To bridge this gap, this paper introduces the concept of Behavioural Drift. While an anomaly might represent a single night of sleep deprivation or an isolated social event, drift refers to a sustained and gradual shift in the baseline itself. In a mental health context, drift may manifest as a progressive reduction in social entropy, a subtle but consistent delay in sleep onset, or a creeping decline in physical mobility all of which are documented precursors to depressive or anxious episodes. The urgency of developing drift detection mechanisms is underscored by a worsening global mental health crisis. According to the World Health Organization [7], mental disorders affect more than one in four adults and represent 14% of the global disease burden. Among young adults, the figures are particularly stark: in the United Kingdom, nearly 28% of individuals aged 16–29 reported moderate to severe depressive symptoms in late 2022 [8]. Traditional monitoring relying on episodic clinical visits or retrospective self-reports is often "too little, too late." By the time a student seeks help, they may have been experiencing behavioural drift for weeks. Detecting these deviations as they occur offers a path toward proactive, rather than reactive, intervention.
There is a significant need for computational approaches that can synthesise multimodal data to detect these longitudinal shifts. This paper addresses this need by designing and evaluating an approach for behavioural drift detection using the NetHealth dataset, which contains over 500 university students’ longitudinal data. The proposed approach models individual baselines and flags deviations across physical, social, and circadian domains to provide methodological insights for proactive health monitoring. This paper makes three primary contributions:
- We propose a per-user modelling approach using sliding temporal windows to construct stable, intra-individual behavioural baselines.
- We provide a comparative analysis of three modelling strategies, Isolation Forest, Convolutional Neural Networks, and Long Short-Term Memory networks to determine which architecture best captures the "memory" of human behaviour under real-world conditions.
- We introduce a late-fusion approach that integrates drift signals from disparate modalities (activity, sleep, and communication) to produce interpretable alerts, demonstrating that while these signals are weakly correlated, they are highly complementary.
The remainder of this paper is structured as follows. Section 2 reviews related work on behavioural modelling and drift detection. Section 3 details the methodology, including the NetHealth dataset and our preprocessing pipelines. Section 4 presents our experimental findings, followed by a discussion of implications and future work in Section 5.
2. Related Work
Human Activity Recognition (HAR) provides the foundational framework for modeling sensor-based behaviour, focusing primarily on the detection and classification of physical actions via smartphones and wearables [5,9]. Early HAR systems utilised short-window architectures, typically segmenting high-frequency data from accelerometers and gyroscopes into 10–60 second intervals for independent analysis through statistical feature extraction and classical classifiers like Random Forest or Support Vector Machines [10,11]. While effective at identifying immediate activity states, these traditional approaches suffer from a significant structural limitation in that they treat activity segments as independent events. Consequently, the higher-order temporal continuity and routine context such as circadian regularities and behavioural transitions remain largely invisible to these models, making them ill-suited for detecting the gradual and cumulative behavioural shifts that often precede psychological decline [12,13].
Recent advances in deep learning have improved feature extraction and short-term temporal modeling through Convolutional Neural Networks (CNNs) and Long Short-Term Memory (LSTM) networks, which excel at capturing local patterns and sequential dependencies in behavioural signals [14,15,16]. CNNs are particularly effective at extracting local temporal features from multi-modal data to identify structured activity states [17], while LSTMs extend these capabilities by retaining information over longer periods to model periodic behaviours [18]. More recently, transformer architectures and pretrained Large Language Models (LLMs) have been introduced to wearable sensing to leverage attention mechanisms for modelling global dependencies across entire sequences [19]. Despite these improvements, most deep learning systems remain restricted by their reliance on supervised learning and high-fidelity labels. In free-living mental health monitoring, ground-truth annotations of behavioural decline are scarce, forcing a shift toward semi-supervised or unsupervised approaches that can adapt to new users with minimal intervention [20].
Beyond deep learning, researchers have explored sequential models such as Bag-of-Words (BoW) and process mining to capture the higher-order dynamics of daily routines. BoW frameworks summarise activity streams as frequency histograms of discrete events within fixed intervals, successfully capturing inter-individual differences in routine structure [21,22]. However, BoW approaches discard the specific order and transitions of activities, which may encode critical signatures of behavioural change. Conversely, process mining aim to recover temporal dependencies and routine structures by analysing event logs to detect disruptions in sequential patterns [23]. While powerful for domains with clean, structured event logs, process mining remains computationally intensive and less resilient to the inherent noise of wearable and smartphone data, limiting its scalability in unconstrained longitudinal studies [24].
Current drift detection literature operationalises behavioural shifts as statistically atypical patterns relative to personalised baselines. Unlike sudden anomalies, behavioural drift refers to gradual, sustained changes in routine that persist beyond expected cyclical variations, such as weekend effects or academic holidays [25,26]. To address the limitations of population-level thresholds, recent studies utilise sliding window techniques to track deviations from individual-specific means and variances over multi-day or multi-week intervals [27,28]. As summarised in Table 1, the design axis for these systems centers on day-scale windowing strategies that stabilise behavioural variance. Furthermore, the grouping of drift days into contiguous "streaks" or episodes has emerged as a vital mechanism for distinguishing meaningful disruption from stochastic noise, aligning with clinical perspectives on relapse where the duration and persistence of change are critical markers of health status [29]. Despite the progress in single-modality drift detection, there remains a notable gap in testing whether these deviations co-occur across heterogeneous streams, motivating the need for the multimodal late-fusion approach proposed in this study.
Recent advances on specific sensor modalities further underscores the transition from static averages to dynamic, context-aware modeling. In the domain of physical activity, which remains the most frequently utilised input in behavioural sensing, research has moved beyond simple daily step counts and movement intensities to emphasise temporal context. While early studies reduced physical behaviour to daily averages, thereby obscuring the nuance of sedentary periods and movement patterns [31], unsupervised methods now address this by comparing adjacent multi-day windows or tracking the mixtures of "day-types" over time [26,29]. U-BEHAVED [28] demonstrate that employing rolling baselines with robust dispersion significantly improves sensitivity to gradual shifts in habits while filtering out routine weekly fluctuations. Similarly, sleep patterns serve as critical markers of emotional dysregulation, with metrics such as duration, onset, and efficiency providing a window into stress and fatigue. Recent unsupervised approaches have begun to move away from aggregate sleep summaries toward tracking circadian structure and within-person phase shifts using change-point detection (CPD) methods, which target the level changes that static averages often fail to capture [32,33].
Social behaviour and communication represent another vital dimension, where social withdrawal is a primary hallmark of psychological distress. Passive sensing of communication logs allows for the inference of social rhythm stability, with studies showing that reduced phone interaction and social entropy correlate strongly with mood instability [34,35]. Shannon entropy, originally derived from information theory [36], has been successfully adapted to characterise ego-network diversity, providing a proxy for the stability of social ties that extends beyond raw event volume [37]. A decline in contact entropy often signals social withdrawal and isolation risk, even when total interaction counts remain stable, yet many existing implementations still prioritise mobility metrics over these complex communication structures [30,38].
The inherent multimodality of human behaviour involving movement, sleep, and social interaction suggests that relying on a single data stream risks overlooking critical patterns of strain. While reduced physical activity might stem from various causes, its co-occurrence with disrupted sleep and social withdrawal provides a far more robust indicator of psychological decline. However, the integration of these heterogeneous streams poses significant technical challenges, particularly regarding scale heterogeneity and data missingness [39]. Early fusion strategies, which concatenate streams before modeling, are often vulnerable to these issues, whereas recent work suggests that decision-level late fusion is more effective. This strategy allows modality-specific models to be trained independently, preserving the distinct statistical properties of each domain while enabling flexible integration through neural network architectures or weighted ensembles [40].
Despite these advances, several critical gaps remain in the current state of behavioural drift research. A primary challenge is the absence of standardised ground-truth labels for evaluating behavioural change, which undermines the comparability and generalisability of proposed systems [41,42]. Furthermore, most existing frameworks continue to rely on pooled models or cross-user normalisation, implicitly assuming that deviations can be assessed against population averages. Evidence from human activity recognition suggests that such models often fail to generalise, reinforcing the need for truly individualised historical baselines [41,43]. There is also a persistent lack of temporal sensitivity; while deep sequence models like recurrent neural networks have been applied in adjacent fields like affect recognition, their application in unsupervised drift detection remains limited. Finally, most models still treat behavioural domains in isolation, overlooking the joint evolution and temporal alignment of activity, sleep, and social patterns. This lack of integration prevents the identification of cross-domain signatures of drift and limits the interpretability of automated alerts in clinical settings.
3. Proposed Methodology
The proposed behavioural drift detection approach is illustrated in Figure 1. Building on the motivation outlined in Section 1, the methodology is designed to support personalised detection of behavioural change in longitudinal sensing data by defining adaptive individual baselines, preserving the temporal structure of heterogeneous behavioural modalities, and integrating modality-specific signals through decision-level fusion.
As shown in Figure 1, heterogeneous sensing streams Fitbit-derived physical activity and sleep records and smartphone-based communication events are first harmonised by aggregation to a common daily resolution. This alignment produces a unified, per-user longitudinal timeline that preserves contextual richness and enables cross-modal comparison of behavioural dynamics. For each user u and day t, multimodal daily behaviour is represented by a feature vector . Personalised behavioural baselines are then constructed using rolling statistical windows days, which are continuously updated to remain sensitive to both transient anomalies and gradual long-term behavioural shifts. Deviations from these individual-specific baselines are quantified over time and aggregated into contiguous drift streaks, allowing sustained behavioural change to be distinguished from isolated short-term fluctuations. Drift detection is performed independently within each modality in order to preserve their distinct temporal and statistical properties. The resulting modality-specific drift signals are subsequently integrated using a decision-level late fusion strategy, generating interpretable behavioural drift indicators and fusion alerts at the individual level.
3.1. Problem Formulation
To formalise the detection of behavioural drift, we represent the longitudinal data as a set of time-ordered observations for each individual. Let denote the set of participants. For each user , we define a multivariate time series:
where is a d-dimensional feature vector representing daily metrics across the physical activity, sleep, and communication domains at time t. Unlike traditional point-anomaly detection, which seeks to identify isolated outliers, our objective is to identify sustained departures from a rolling baseline. We define a "drift day" as a day where the observed behaviour significantly deviates from the established intra-individual distribution. To capture the cumulative nature of these shifts, we introduce the drift-streak label, . This label is defined as:
We define as the length of the current streak, we encode the temporal persistence of the deviation directly into the target variable. This allows the model to differentiate between a "one-off" disruption for example a single night of poor sleep and a developing trend such as a week-long decay in sleep efficiency. The primary computational task is to learn a mapping function that predicts the state of behavioural drift based on recent history. Given a look-back window of size , the goal is to learn:
where ingests the sequence of feature vectors over the preceding days and outputs the drift-streak magnitude for the current day t. This formulation allows for the evaluation of various architectural strategies such as the memory less Isolation Forest or the sequence-aware LSTM to determine their efficacy in mapping raw behavioural patterns to sustained longitudinal drift.
3.2. Dataset Description
For experimental purposes, we utilise the NetHealth dataset [44], a longitudinal repository comprising Fitbit and smartphone-derived sensing data collected from a large cohort of undergraduate students between Fall 2015 and Spring 2019 at the University of Notre Dame. Recruitment was conducted in a three-tier strategy, as detailed in Table 2, starting with an initial cohort of 698 participants in the first year. While 686 participants remained active by the second year, the cohort experienced natural attrition due to non-compliance and graduation, reducing to approximately 320 by the fourth year [44]. The study was conducted under strict institutional IRB protocols, ensuring informed consent and the de-identification of all participants via case codes. To provide environmental context, the dataset includes an academic calendar containing semester dates, holidays, and exam periods, which allow the approach to distinguish between academic-induced stress and underlying behavioural drift.
The approach leverages three primary behavioural modalities to quantify drift. Physical activity data were captured via wrist-worn Fitbit devices with Charge HR and Charge 2, providing daily step counts and intensity minutes. These are used to derive Moderate-to-Vigorous Physical Activity (MVPA) and sedentary duration, with data quality controlled by a wear-compliance metric based on valid heart rate minutes. Sleep hygiene is similarly derived from Fitbit logs, where individual sleep segments separated by less than 30 minutes are merged into a primary daily episode. This provides granular metrics including sleep onset, waking time, efficiency, and Wake-After-Sleep-Onset (WASO), serving as proxies for circadian stability. Social and communication dynamics were monitored through a background smartphone application. This application recorded over 60 million timestamped events, including incoming and outgoing calls and SMS messages. These logs enable the construction of daily interaction counts and Social Entropy a measure of contact diversity and social balance based on Shannon entropy [45].
3.3. Data Processing Pipelines
To transform raw sensing logs into the structured feature vector defined in Section 4, each modality underwent a rigorous preprocessing pipeline. All streams were first validated against the official NetHealth codebooks for temporal consistency and identifier integrity. To ensure data fidelity, we excluded days with a compliance of device wear-time below 80%, a threshold standard for avoiding spurious drift detections caused by poor compliance [46].
3.3.1. Physical Activity Pipeline
The activity pipeline processes daily summaries of step counts and intensity. We applied plausibility thresholds to remove sensor artifacts based on established Fitbit validation studies [47,48]. Missing data were not imputed but were explicitly flagged; in longitudinal monitoring, the absence of data can serve as a meaningful indicator of behavioural disengagement rather than random sensor failure [49]. Outliers were identified using the Interquartile Range (IQR) rule - . To reduce dimensionality, we calculated MVPA as a health-relevant composite of fairly-active-minutes and very-active-minutes [50].
3.3.2. Sleep Hygiene Pipeline
The sleep pipeline extracts nightly metrics (duration, onset, efficiency, and WASO). To maintain temporal alignment, all sleep records were keyed to the "wake date." We applied standard sleep hygiene formulas to verify metric consistency:
Records indicating a "Time in Bed" of less than 5 minutes or exceeding 24 hours were removed as erroneous.
3.3.3. Communication and Social Pipeline
Smartphone logs were aggregated at the daily per-user level. To quantify social diversity, we calculated Social Entropy () based on the distribution of unique communication partners:
where represents the proportion of events with contact i on day t. This metric distinguishes between concentrated interactions with a single primary contact (low entropy) and broad social engagement across a diverse network (high entropy) [38]. To distinguish between wellbeing-related drift and academic-induced stress, each participant-day was merged with an academic calendar. We integrated binary flags for weekends and holidays, alongside categorical variables for semester phases for example orientation, midterms and finals. This allows the subsequent models to adjust for population-wide shifts in behaviour during exam periods [51].
3.4. Machine Learning Architectures and Fusion Strategy
To address the challenge of unsupervised drift detection across heterogeneous sensing streams, we implemented a multi-stage modeling pipeline. This pipeline transitions from a non-parametric statistical baseline to deep sequential architectures capable of capturing complex temporal dependencies.
3.4.1. Baseline Modeling: Isolation Forest
Following the rolling window feature transformation, we implemented an Isolation Forest as a baseline for daily drift detection. Models were trained independently for each participant to ensure that anomalies were defined relative to a person’s own historical behaviour. The Isolation Forest was selected for its computational efficiency and its ability to identify outliers in high-dimensional feature spaces without requiring labeled ground truth a critical requirement for digital phenotyping where labeled outcomes are often sparse [52,53]. The model assigns anomaly scores based on the path length required to reach a specific instance, effectively flagging behavioural days that sit at the periphery of the user’s typical distribution by isolating observations through random partitioning.
3.4.2. Deep Sequence Architectures
While the Isolation Forest treats days as independent events, behavioural drift often manifests as a sustained decay of routine. To capture these temporal motifs, we implemented Convolutional and Recurrent neural networks.
The CNN architecture comprised two 1D convolutional layers with varied kernel sizes to capture multi-scale local motifs, such as sudden drops in communication volume or bursts of sedentary activity. Each layer was followed by ReLU activation and dropout for regularisation. A global average pooling layer was utilised to summarise the temporal context before a dense sigmoid output layer. CNNs are particularly effective for identifying stationary temporal patterns in behavioural time series while remaining computationally more straightforward to train than fully recurrent architectures [13].
To model longer-term dependencies and cumulative shifts, we utilised a stacked model with hidden units . LSTMs are specifically designed to overcome the vanishing gradient problem, allowing the model to retain "memory" of gradual behavioural patterns that may span several weeks. In the context of mental health monitoring, this temporal continuity is vital, as a slow transition toward social withdrawal may be more clinically significant than an isolated spike in interaction [12].
3.4.3. Multimodal Fusion Strategy
A central challenge in multimodal learning is the integration of information from disparate sources. In this paper, we adopted Decision-Level Late Fusion. This choice was motivated by three technical considerations. First, it prevents the statistical noise of one modality from distorting the signal of a stable modality. Second, it provides a robust mechanism for handling missing data; if a participant forgets to wear their Fitbit, a drift alert can still be reliably inferred from their smartphone entropy. Finally, late fusion ensures interpretability, allowing clinicians to audit which specific behavioural domain activity, sleep, or communication triggered a high-confidence alert. For each user-day, the modality-specific models generated a drift probability. To synthesise these into a global alert, we applied a Max-Fusion operator. This approach prioritises sensitivity by raising an alert if any single modality strongly signals drift. This ensures that domain-specific behavioural decay is not "suppressed" or averaged out by stability in other domains, a strategy aligned with the requirements of early-warning systems in clinical health.
4. Experiments and Results
This section details the empirical evaluation of the behavioural drift detection approach across three distinct experiments. All computational tasks were performed in a Python-based environment using an Anaconda distribution. While primary activity and sleep processing occurred on a standard workstation (16 GB RAM), the high-velocity smartphone communication logs exceeding 60 million records necessitated a dedicated secondary machine to handle the significant I/O and processing load required for feature engineering.
To ensure a unified analysis, all raw sensing streams were temporally aligned into a consistent daily representation. Fitbit-derived metrics and smartphone event logs were summarised into daily indices of volume, diversity (Shannon entropy), and quality. Quality control was enforced by excluding days with wearable compliance below 80% to prevent the detection of spurious anomalies. Missing data were not discarded but were explicitly flagged, under the assumption that a lack of sensor activity may represent behavioural disengagement rather than a technical failure.
We conducted a series of experiments based on the analysis of behavioural constructs (Experiment I), followed by an assessment of temporal look-back windows on baseline stability (Experiment II). The final evaluation (Experiment III) benchmarks statistical and deep learning models to determine the efficacy of multimodal fusion in identifying sustained behavioural drift.
4.1. Experimemnt I: Exploratory Data Analysis and Feature Selection
We conducted an Exploratory Data Analysis to establish the latent structure of the multimodal dataset and identify redundant behavioural constructs. This step is critical to ensure that subsequent deep learning models are not biased by multicollinearity or high-dimensional noise. The analysis of physical activity and sleep metrics revealed significant feature overlap. As shown in the activity correlation matrix in Figure 2, several feature pairs exhibited high collinearity, particularly between intensity categories and caloric expenditure. Similarly, the sleep domain analysis as depicted in Figure 3a demonstrated that Time in Bed and Total Sleep Time were nearly identical in their variance (), while Wake After Sleep Onset (WASO) and Sleep Efficiency showed a strong inverse relationship ().
To quantify this redundancy, Principal Component Analysis (PCA) was applied. The results for sleep, visualised in Figure 3b, confirmed that just two components account for 80% of the domain’s variance, while the first four activity components explain 75% of total variance.
Following the identification of redundant features, we utilised ANOVA F-scores to rank the discriminative power of the remaining behavioural predictors across all modalities. As illustrated in Figure 4, this univariate analysis highlighted the features most sensitive to state changes, such as sedentary minutes in activity, sleep efficiency, and contact entropy in communication. Based on the combined insights from the correlation matrices, PCA, and F-score rankings, we executed a feature reduction step, removing highly collinear variables like veryactiveminutes and peakcal. This reduction ensures a parsimonious input for the LSTM and CNN architectures, focusing the models on independent dimensions like circadian stability and general activity load.
The social interaction logs revealed a diverse range of social phenotypes within the student cohort. The distribution of Daily Contact Entropy (Figure 5) indicates a broad peak between 1.0 and 3.5, suggesting moderate contact diversity on a daily basis. However, a significant density of user-days is clustered at low entropy levels, reflecting days dominated by communication with only one or two primary contacts. The relationship between social volume and diversity is non-linear; as illustrated in Figure 6, contact entropy increases with communication events until a saturation point (∼1,000 events), suggesting a "social ceiling" regarding the active ties students can maintain daily.
Furthermore, temporal trend analysis (Figure 7) reveals distinct social behaviours: User 51495 maintains consistently high entropy and event volume, indicating broad and regular social engagement. In contrast, User 90905 exhibits long periods of social withdrawal (low entropy) punctuated by sudden, transient spikes in interaction. These distinct profiles underscore the necessity of the personalised baseline approach defined in our methodology, as a "normal" social day for one user may represent a significant "drift" for another.
4.2. Experiment II: Temporal Sensitivity Analysis
This experiment evaluates the impact of the look-back window parameter on the stability and discriminative power of the drift detection approach. The choice of determines the temporal resolution of the individual baseline. To maintain a scale-invariant comparison across heterogeneous features for example steps vs. minutes of sleep, we transformed raw observations into rolling z-scores.
4.2.1. Dynamic Standardisation and Composite Scoring
For each user u, day t, and feature f, the observation was standardised relative to its local historical distribution:
where and represent the rolling mean and standard deviation, respectively, over the preceding days. To capture the magnitude of deviation irrespective of its direction (e.g., both hypersomnia and insomnia), we utilised the absolute z-score. To synthesise these signals into a single indicator per modality, we calculated a daily composite drift score :
4.2.2. Drift-Streak Identification and Window Impact
The approach identifies a "drift day" when the composite score exceeds a participant-specific quantile threshold. However, to distinguish sustained behavioural shifts from stochastic noise, we introduced a streak detection mechanism. A drift episode is defined as a contiguous sequence of k drift days:
where is the individual threshold.As shown in Table 3, the choice of the rolling window size significantly influences the morphology and frequency of these episodes, revealing a critical sensitivity-stability trade-off. Short windows of , yielded the highest frequency of episodes ( for communication) but were susceptible to "flickering," a phenomenon where a single day of baseline recovery prematurely terminates a valid drift streak. Conversely, longer windows of produced the most stable episodes but introduced a "lag effect." In this scenario, the moving average slowly absorbs the shifted behaviour into the baseline, eventually causing the z-score to return to zero even if the behaviour remains fundamentally altered. Consequently, a 14-day window was identified as optimal for this population, as it spans two full weekend-weekday cycles to filter out cyclic routine variance while remaining responsive to sustained behavioural decay.
The 14-day window was identified as the optimal configuration for student populations, as it spans two full weekend-weekday cycles. This provides a sufficiently robust reference to filter out weekly routine variances while remaining responsive to the behavioural "decay" patterns visualised in the sample user trajectory in Figure 8. The streak logic ensures that the approach ignores isolated spikes such as a single late-night party but flags the third or fourth consecutive day of social withdrawal as a high-confidence drift episode.
4.3. Experiment III: Multimodal Fusion and Model Performance Analysis
Experiment III evaluates the predictive performance and cross-modal complementarity of the proposed approach. By comparing a non-parametric baseline with deep sequence architectures, we quantify the value of temporal memory in drift detection. This analysis culminates in a late-fusion strategy that synthesises heterogeneous behavioural streams into a unified individual-level alert.
As part of this, we performed an initial benchmarking using the Isolation Forest algorithm, which provides a non-parametric assessment of daily drift. By modeling users independently with a split for training, validation, and testing, the algorithm identifies anomalies based on their isolation in the feature space. To ensure comparability across diverse behavioural profiles, we applied a per-user calibration mapping raw anomaly scores derived via the score_samples function to probability-like scores where the median represents baseline behaviour and the 95th percentile anchors extreme deviations.As detailed in Table 4, the Isolation Forest proved most effective in the sleep domain, achieving an Accuracy of and an ROC-AUC of . However, its performance in activity and communication was more conservative, with PR-AUC scores of and , respectively. These results highlight a fundamental limitation of static anomaly detectors: they treat each day as an independent event, frequently failing to capture the cumulative temporal decay characteristic of behavioural drift.
To address the temporal limitations of the statistical baseline, we implemented 1D-CNN and LSTM architectures. These models transform daily records into fixed-length windows, using an stratified split to preserve class balance and prevent target leakage. Class weights were dynamically computed to handle the inherent sparsity of drift labels. The comparative results in Table 5 demonstrate that sequence modeling significantly improves detection sensitivity across all modalities.
In the activity domain, the LSTM achieved the highest ranking performance with a PR-AUC of , a substantial improvement over the Isolation Forest’s . Similarly, the LSTM’s ability to model long-range dependencies provided the most balanced metrics in the communication domain, yielding an ROC-AUC of . Across all modalities, while the CNN was adept at identifying short-term motifs, the LSTM was consistently superior in detecting gradual, longitudinal shifts. Consequently, the LSTM was selected as the primary input for the multimodal fusion layer.
4.3.1. Multimodal Late Fusion and Complementarity
The decision-level late fusion was executed by aligning the modality-specific LSTM probabilities for each participant-day. Prior to fusion, we assessed the Pearson correlation between sensing streams. The results revealed near-zero correlations between activity, sleep, and communication (), statistically confirming that drift in one domain rarely overlaps immediately with another. This cross-modal independence validates our use of a Max-Fusion rule:
By adopting this operator, the system ensures that a significant drift signal in any single modality is preserved rather than averaged out. As demonstrated in the Confusion Matrix (Figure 9), this strategy optimises the detector for sensitivity, which is vital for clinical early-warning systems. The fused model achieved a high Recall of and a PR-AUC of , indicating a robust ability to flag true drift days across diverse student behaviours.
The qualitative advantage of this fusion is visualised in Figure 10, where the aggregate drift score provides a smoothed, interpretable trajectory. The fused score consistently rises during periods of high disruption, even when individual modalities provide fluctuating signals. This provides a robust individual-level "wellbeing trajectory" that accounts for the weak association between sensing streams while leveraging their collective predictive power.
The global effectiveness of the fused approach is summarised in Table 6, which aggregates the longitudinal performance across the entire test cohort. The system achieved a Recall of 0.871, a critical result for behavioural health applications where the cost of a "false negative" (failing to detect a burgeoning crisis) significantly outweighs the cost of a false alarm. This high sensitivity ensures that the "Max-Fusion" logic successfully captures drift episodes even when they are manifest in only a single behavioural domain.While the Accuracy () and Precision () reflect the inherent noise and "class imbalance" of real-world sensing data, the ranking metrics provide a more robust picture of the model’s reliability. The ROC-AUC of 0.831 and PR-AUC of 0.836 indicate that the model maintains a strong discriminatory boundary between stable and drifting states. Specifically, the high PR-AUC confirms that the model’s "Top-K" drift alerts are highly likely to be true positives, making it a viable tool for prioritising which students might require a wellness check-in from university support services.
Ultimately, these metrics demonstrate that by leveraging the weakly correlated nature of activity, sleep, and social data (), the approach achieves a level of robustness that single-modality systems cannot. The high recall suggests that the "drift-streak" logic, combined with LSTM temporal memory, effectively filters out the stochastic "noise" of student life while remaining highly attuned to the sustained behavioural decay that characterises shifts in mental wellbeing.
5. Discussion
The results of this study demonstrate that adaptive, user-specific baselines, when integrated with deep temporal modeling and decision-level fusion, can robustly identify both transient anomalies and sustained behavioural shifts without the need for labeled outcomes. These findings align with and extend the current consensus in digital phenotyping, which emphasises that individualised reference frames and temporal continuity are paramount for meaningful behavioural monitoring in ecological settings.
5.1. Personalised Baselines and Temporal Sensitivity
A central pillar of the proposed approach is the hypothesis that behavioural change must be evaluated relative to an individual’s historical patterns rather than population-level norms. By operationalising this through rolling statistical windows, we allowed behavioural baselines to update dynamically. The stability of drift detection across multiple window lengths () suggests a robust methodology that is not overly sensitive to specific temporal configurations. This consistency supports prior research indicating that medium-term baselines are sufficient to capture meaningful deviations in student populations without the overhead of exhaustive labeling [26,28].Furthermore, the identification of contiguous "drift streaks" represents a significant methodological shift from standard anomaly detection. Visual inspection of these trajectories for example in Figure 8 indicates that the approach successfully separates isolated stochastic noise common in a university environment from prolonged episodes of behavioural decay. This distinction is critical, as sustained clusters of anomalies have been shown to be far more predictive of clinical deterioration than single-day spikes [29].
5.2. The Value of Sequential Memory in Deep Modeling
Our comparison between static and sequence-based models confirmed the hypothesis that the latter are superior for capturing the gradual, cumulative nature of behavioural change. While the Isolation Forest provided a conservative and stable statistical baseline, the 1D-CNN and LSTM architectures consistently improved recall and ranking performance (PR-AUC) across all modalities. The superior performance of LSTMs specifically supports the observation that behavioural "drift" rarely manifests as an abrupt event; instead, it unfolds as a multi-day decay of routine.This finding is particularly relevant for preventative mental health monitoring, where the ability to detect subtle, long-range temporal dependencies in activity or sleep may allow for intervention before a behavioural shift reaches a crisis threshold. The results reinforce the growing consensus in the field that temporal continuity is not merely a feature, but a requirement for high-fidelity behaviour change detection [12,13].
5.3. Modality Independence and the Rationale for Max-Fusion
The investigation into multimodal integration revealed a striking lack of correlation between drift signals across activity, sleep, and communication (). This statistical independence is one of the most compelling findings of the study, indicating that each modality serves as a distinct, non-redundant sensor for specific behavioural phenotypes. Such modality independence has been suggested in prior literature where different physiological and social streams respond to stressors in complementary, rather than synchronous, ways [31,51].Given this lack of cross-modal association, our choice of decision-level Max-Fusion proved technically and clinically sound. By prioritising the strongest evidence of drift from any single modality, we achieved a high Recall (0.871), ensuring that significant disengagement in one domain is not suppressed by stability in others. This approach provides a clear path to interpretability; the fused trajectory (Figure 10) allows practitioners to trace a global "wellbeing alert" back to its source modality be it a collapse in social entropy or a shift in physical MVPA enabling targeted rather than generalised interventions.
5.4. Contextualising Performance in Real-World Deployment
While the proposed work demonstrates strong ranking performance of PR-AUC of 0.836, the precision (0.630) acknowledges the inherent difficulty of differentiating between pathological drift and benign lifestyle shifts. However, in the context of university counseling and early warning systems, the cost of a false negative far outweighs that of a false positive. By providing a consistent and reliable ordering of days by drift likelihood, this approach serves as a viable decision-support tool, helping wellness services prioritise students whose behavioural signatures deviate most significantly from their established norms.
5.5. Limitations
This study presented a methodological exploration of personalised, multimodal drift detection using multimodal wearable and smartphone data. However, several limitations must be acknowledged. First the absence of ground truth. The evaluation relied on proxy drift labels generated from rolling-window baselines rather than externally validated annotations. This is a common constraint in unsupervised behavioural sensing [26,28], and it allowed systematic comparison of modelling approaches. However, it also introduces a degree of circularity, as performance metrics primarily reflect consistency with statistical heuristics rather than true behavioural or clinical outcomes. Second, the dataset was drawn from a single university student population, whose daily routines are structured by the academic calendar. As a result, it does limit the generalisability of findings to other populations, such as older adults, working professionals, or patients in clinical care. Third, for reasons of comparability, all modalities were aggregated to the day level. This simplification enabled alignment across activity, sleep, and communication but removed finer-grained dynamics that may precede behavioural change. Finally, the models do not yet explain why change occurs. Moreover, the analysis was retrospective, meaning that questions of real-time scalability, robustness to missing data, and ethical deployment remains open.
6. Conclusion
This paper has successfully demonstrated that a personalised, multimodal approach can effectively identify behavioural drift within a university student cohort using passive sensing data from wearables and smartphones. By shifting the focus from population-level anomalies to individual-level "drift-streaks," we have shown that temporal context modelled through user-specific rolling baselines and deep sequential architectures is essential for capturing the gradual decay of behavioural routines. Our experimental results, which compared static Isolation Forest baselines with deep 1D-CNN and LSTM architectures, highlight that sequence-based models are significantly more capable of modeling the cumulative nature of behavioural change. Specifically, the high sensitivity achieved by the late-fusion LSTM model, which reached a Recall of 0.871, underscores the potential of this approach to act as a robust decision-support tool. This high performance is driven by the approach’s ability to leverage the striking lack of correlation between drift signals in activity, sleep, and communication, proving that behavioural disengagement is a sparse, cross-domain phenomenon that requires multimodal integration to be fully captured.
Ultimately, this research provides a scalable, unsupervised methodology for longitudinal monitoring in environments where labeled clinical outcomes are scarce. By adopting a "Max-Fusion" strategy, the system remains interpretable and actionable, allowing practitioners to trace global alerts back to specific behavioural domains. This provides a transparent "wellbeing trajectory" that respects individual baseline variations while maintaining the sensitivity required for early-warning applications. As digital phenotyping moves toward real-time clinical integration, the "drift-streak" concept offers a promising bridge between raw sensor data and the identification of meaningful psychological or lifestyle shifts.
Future research should prioritise the integration of self-reports and clinical evaluations to move beyond proxy labels and establish the diagnostic relevance of flagged drift episodes. There is also significant potential in adopting routine-aware modeling through process mining and conformance checking, which would allow for a more granular understanding of how daily event logs deviate from established structures. Furthermore, the development of multi-scale temporal models using finer-grained, sub-daily features could enhance the approach’s ability to detect micro-patterns that anticipate broader drift episodes. Technical advancements such as GRU-D architectures or attention-based fusion mechanisms should be explored to improve robustness against missing data and irregular sampling. Finally, ensuring the ethical deployment of these systems through federated learning and improved model interpretability will be essential for fostering trust among clinicians and end-users in sensitive health contexts.
Author Contributions
Conceptualisation E.T.; methodology, E.T. and I.K.I; software, E.T. and I.K.I; validation, E.T., P.M., S.Y., A.L. and I.K.I; formal analysis, E.T., P.M., S.Y., A.L. and I.K.I; investigation, E.T., P.M., S.Y., A.L. and I.K.I; writing - original draft preparation, I.K.I and M.M.S.; writing, review and editing, E.T. P.M., S.Y., A.L. and I.K.I; visualisation, E.T., P.M., S.Y., A.L. and I.K.I; supervision, I.K.I All authors have read and agreed to the published version of the manuscript.
Funding
This research received no external funding.
Institutional Review Board Statement
Not applicable.
Informed Consent Statement
All the participating authors have signed and given informed consent statements.
Data Availability Statement
The dataset for this study is publicly available.
Conflicts of Interest
The authors declare no conflict of interest.
References
- Mendes, J.P., Moura, I.R., Van de Ven, P., Viana, D., Silva, F.J., Coutinho, L.R., Teixeira, S., Rodrigues, J.J. and Teles, A.S. Sensing apps and public data sets for digital phenotyping of mental health: systematic review. Journal of medical Internet research, 24(2), 2022, p.e28735.
- Montag, C. and Baumeister, H., 2023. Digital phenotyping and mobile sensing. In Digital Phenotyping and Mobile Sensing. 2nd ed. Springer International Publishing Cham, Switzerland, 2023,.
- Insel, T.R. Digital phenotyping: Technology for a new science of behavior. JAMA 2017, 318, 1215–1216.
- Statista. Smartphone penetration rate in the United Kingdom (UK). Available online: https://www.statista.com (accessed 2023).
- Wang, J.; Chen, Y.; Hao, S.; Peng, X.; Hu, L. Deep learning for sensor-based activity recognition: A survey. Pattern Recognit. Lett. 2019, 119, 3–11.
- Zeng, M.; Nguyen, L.T.; Yu, B.; Mengshoel, O.J.; Zhu, J.; Wu, P.; Zhang, J. Convolutional neural networks for human activity recognition using mobile sensors. In Proceedings of the 6th International Conference on Mobile Computing, Applications and Services; IEEE: Austin, TX, USA, 2014; pp. 197–205.
- World Health Organization. Depression and other common mental disorders: Global health estimates. WHO: Geneva, Switzerland, 2023.
- Office for National Statistics. Cost of living and depression in adults, Great Britain. Available online: https://www.ons.gov.uk (accessed 2022).
- Lara, O.D.; Labrador, M.A. A survey on human activity recognition using wearable sensors. IEEE Commun. Surv. Tutor. 2012, 15, 1192–1209.
- Kwapisz, J.R.; Weiss, G.M.; Moore, S.A. Activity recognition using cell phone accelerometers. ACM SIGKDD Explor. Newsl. 2011, 12, 74–82.
- Reiss, A.; Stricker, D. Introducing a new benchmarked dataset for activity monitoring. In Proceedings of the IEEE International Symposium on Wearable Computers; IEEE: Newcastle, UK, 2012; pp. 108–109.
- Mohr, D.C.; Zhang, M.; Schueller, S.M. Personal sensing: Understanding mental health using ubiquitous sensors. Annu. Rev. Clin. Psychol. 2017, 13, 23–47.
- Hammerla, N.Y.; Halloran, S.; Plötz, T. Deep, convolutional, and recurrent models for human activity recognition. arXiv 2016, arXiv:1604.08880.
- Murad, A.; Pyun, J.Y. Deep recurrent neural networks for human activity recognition. Sensors 2017, 17, 2556.
- Guan, Y.; Plötz, T. Ensembles of deep LSTM learners for activity recognition using wearables. Proc. ACM IMWUT 2017, 1, 1–28.
- Ihianle, I.K., Nwajana, A.O., Ebenuwa, S.H., Otuka, R.I., Owa, K. and Orisatoki, M.O., A deep learning approach for human activities recognition from multimodal sensing devices. Ieee Access, 8, 2020; pp.179028-179038.
- Ignatov, A. Real-time human activity recognition from accelerometer data using convolutional neural networks. Appl. Soft Comput. 2018, 62, 915–922.
- Greff, K.; Srivastava, R.K.; Koutník, J.; Steunebrink, B.R.; Schmidhuber, J. LSTM: A search space odyssey. IEEE Trans. Neural Netw. Learn. Syst. 2016, 28, 2222–2232.
- Ferrara, E. Large language models for wearable sensor-based human activity recognition and health monitoring. Sensors 2024, 24, 5045.
- Deng, S.; Hua, W.; Wang, B.; Wang, G.; Zhou, X. Few-shot human activity recognition on noisy wearable sensor data. In Proceedings of the International Conference on Database Systems for Advanced Applications; Springer: Cham, Switzerland, 2020; pp. 54–72.
- Kheirkhahan, M.; Mehta, S.; Nath, M.; Wanigatunga, A.A.; Corbett, D.B.; Manini, T.M.; Ranka, S. A bag-of-words approach for assessing activities of daily living using wrist accelerometer data. In Proceedings of the IEEE International Conference on Bioinformatics and Biomedicine (BIBM); IEEE: Kansas City, MO, USA, 2017; pp. 678–685.
- Ihianle, I.K., Naeem, U. and Tawil, A.R., Recognition of activities of daily living from topic model. Procedia Computer Science, 2016; 98, pp.24-31.
- Zheng, J.; Papapanagiotou, P.; Fleuriot, J.D.; Hillston, J. Process-aware human activity recognition. arXiv 2024, arXiv:2411.08814.
- Winter, M.; Langguth, B.; Schlee, W.; Pryss, R. Process mining in mHealth data analysis. NPJ Digit. Med. 2024, 7, 299.
- Prenkaj, B.; Velardi, P. Unsupervised detection of behavioural drifts with dynamic clustering and trajectory analysis. IEEE Trans. Knowl. Data Eng. 2023, 36, 2257–2270.
- Sprint, G.; Cook, D.J.; Schmitter-Edgecombe, M. Unsupervised detection of changes in everyday physical activity. J. Biomed. Inform. 2016, 63, 54–65.
- Dawadi, P.N.; Cook, D.J.; Schmitter-Edgecombe, M. Modeling patterns of activities using activity curves. Pervasive Mob. Comput. 2016, 28, 51–68.
- Diaz, C.; Caillaud, C.; Yacef, K. Unsupervised early detection of physical activity behaviour changes. Sensors 2022, 22, 8255.
- Barnett, I.; Torous, J.; Staples, P.; Sandoval, L.; Keshavan, M.; Onnela, J.-P. Relapse prediction in schizophrenia through digital phenotyping. Neuropsychopharmacology 2018, 43, 1660–1666.
- Berrouiguet, S.; Perez-Rodriguez, M.M.; Larsen, M.; Baca-García, E.; Courtet, P.; Oquendo, M. From eHealth to iHealth: Transition to participatory and personalized medicine in mental health. J. Med. Internet Res. 2018, 20, e2.
- Saeb, S.; Zhang, M.; Karr, C.J.; Schueller, S.M.; Corden, M.E.; Kording, K.P.; Mohr, D.C. Mobile phone sensor correlates of depressive symptom severity in daily-life behavior: An exploratory study. J. Med. Internet Res. 2015, 17, e4273.
- Chen, S.; Sun, X. Validating CircaCP: A generic sleep–wake cycle detection algorithm for unlabelled actigraphy data. R. Soc. Open Sci. 2024, 11, 231468.
- Minaeva, O.; Riese, H.; Booij, S.H.; Lamers, F.; Giltay, E.J.; Scheer, F.A.J.L.; Hu, K. Fractal motor activity during wakefulness and sleep: A window into depression recency and symptom recurrence. Psychol. Med. 2024, 54, 4429–4437.
- Abdullah, S.; Matthews, M.; Frank, E.; Doherty, G.; Gay, G.; Choudhury, T. Automatic detection of social rhythms in bipolar disorder. J. Am. Med. Inform. Assoc. 2016, 23, 538–543.
- Harari, G.M.; Lane, N.D.; Wang, R.; Crosier, B.S.; Campbell, A.T.; Gosling, S.D. Using smartphones to collect behavioral data in psychological science: Opportunities, practical considerations, and challenges. Perspect. Psychol. Sci. 2016, 11, 838–854.
- Shannon, C.E. A mathematical theory of communication. Bell Syst. Tech. J. 1948, 27, 379–423.
- Eagle, N.; Pentland, A.; Lazer, D. Inferring friendship network structure by using mobile phone data. Proc. Natl. Acad. Sci. USA 2009, 106, 15274–15278.
- Blair, D.S.; Miller, R.L.; Calhoun, V.D. A dynamic entropy approach reveals reduced functional network connectivity trajectory complexity in schizophrenia. Entropy 2024, 26, 545.
- Vaizman, Y.; Weibel, N.; Lanckriet, G. Context recognition in-the-wild: unified model for multi-modal sensors and multi-label classification. Proc. ACM Interact. Mob. Wearable Ubiquitous Technol. 2018, 1, 122.
- Khoo, L.S.; Lim, M.K.; Chong, C.Y.; McNaney, R. Machine learning for multimodal mental health detection: A systematic review of passive sensing approaches. Sensors 2024, 24, 348.
- Vos, G.; Trinh, K.; Sarnyai, Z.; Azghadi, M.R. Generalizable machine learning for stress monitoring from wearable devices: A systematic literature review. Int. J. Med. Inform. 2023, 173, 105026.
- Shen, S.; Qi, W.; Zeng, J.; Li, S.; Liu, X.; Zhu, X.; Dong, C.; Wang, B.; Shi, Y.; Yao, J.; Wang, B. Passive sensing for mental health monitoring using machine learning with wearables and smartphones: A scoping review. J. Med. Internet Res. 2025, 27, e77066.
- Yu, L.; Ge, Y.; Ansari, S.; Imran, M.; Ahmad, W. Multimodal sensing-enabled large language models for automated emotional regulation: A review of current technologies, opportunities, and challenges. Sensors 2025, 25, 4763.
- University of Notre Dame. NetHealth Study Dataset and Documentation, 2015–2019. Available online: https://sites.nd.edu/nethealth/ (accessed on 10 January 2025).
- Faust, L.; Purta, R.; Hachen, D.; Striegel, A.; Poellabauer, C.; Lizardo, O.; Chawla, N.V. Exploring compliance: Observations from a large-scale Fitbit study. In Proceedings of the 2nd International Workshop on Social Sensing; ACM: Pittsburgh, PA, USA, 2017; pp. 55–60.
- Migueles, J.H.; Cadenas-Sanchez, C.; Ekelund, U.; Delisle Nyström, C.; Mora-Gonzalez, J.; Löf, M.; Labayen, I.; Ruiz, J.R.; Ortega, F.B. Accelerometer data collection and processing criteria to assess physical activity and other outcomes: A systematic review and practical considerations. Sports Med. 2017, 47, 1821–1845.
- Case, M.A.; Burwick, H.A.; Volpp, K.G.; Patel, M.S. Accuracy of smartphone applications and wearable devices for tracking physical activity data. JAMA 2015, 313, 625–626.
- Wang, C.; Lizardo, O.; Hachen, D.S. Using Fitbit data to examine factors that affect daily activity levels of college students. PLoS One 2021, 16, e0244747.
- Currey, S.; Doherty, K.; Doherty, G. Missing data in digital phenotyping: A review of reporting and handling methods. J. Am. Med. Inform. Assoc. 2023, 30, 1486–1496.
- Alzahrani, H. Dose–response association between physical activity and health-related quality of life in the general population. Healthcare 2022, 10, 1460.
- Wang, R.; Chen, F.; Chen, Z.; Li, T.; Harari, G.; Tignor, S.; Zhou, X.; Ben-Zeev, D.; Campbell, A.T. StudentLife: Assessing mental health, academic performance and behavioral trends of college students using smartphones. In Proceedings of the ACM International Joint Conference on Pervasive and Ubiquitous Computing; ACM: Seattle, WA, USA, 2014; pp. 3–14.
- Liu, F.T.; Ting, K.M.; Zhou, Z.-H. Isolation forest. In Proceedings of the IEEE International Conference on Data Mining; IEEE: Pisa, Italy, 2008; pp. 413–422.
- Tabassum, M.; Mahmood, S.; Bukhari, A.; Alshemaimri, B.; Daud, A.; Khalique, F. Anomaly-based threat detection in smart health using machine learning. BMC Med. Inform. Decis. Mak. 2024, 24, 347.
Figure 1.
Schematic representation of the proposed multimodal drift detection approach, illustrating the pipeline from raw sensor ingestion and daily data aggregation to personalised baseline modelling and late-fusion alert generation.
Figure 1.
Schematic representation of the proposed multimodal drift detection approach, illustrating the pipeline from raw sensor ingestion and daily data aggregation to personalised baseline modelling and late-fusion alert generation.
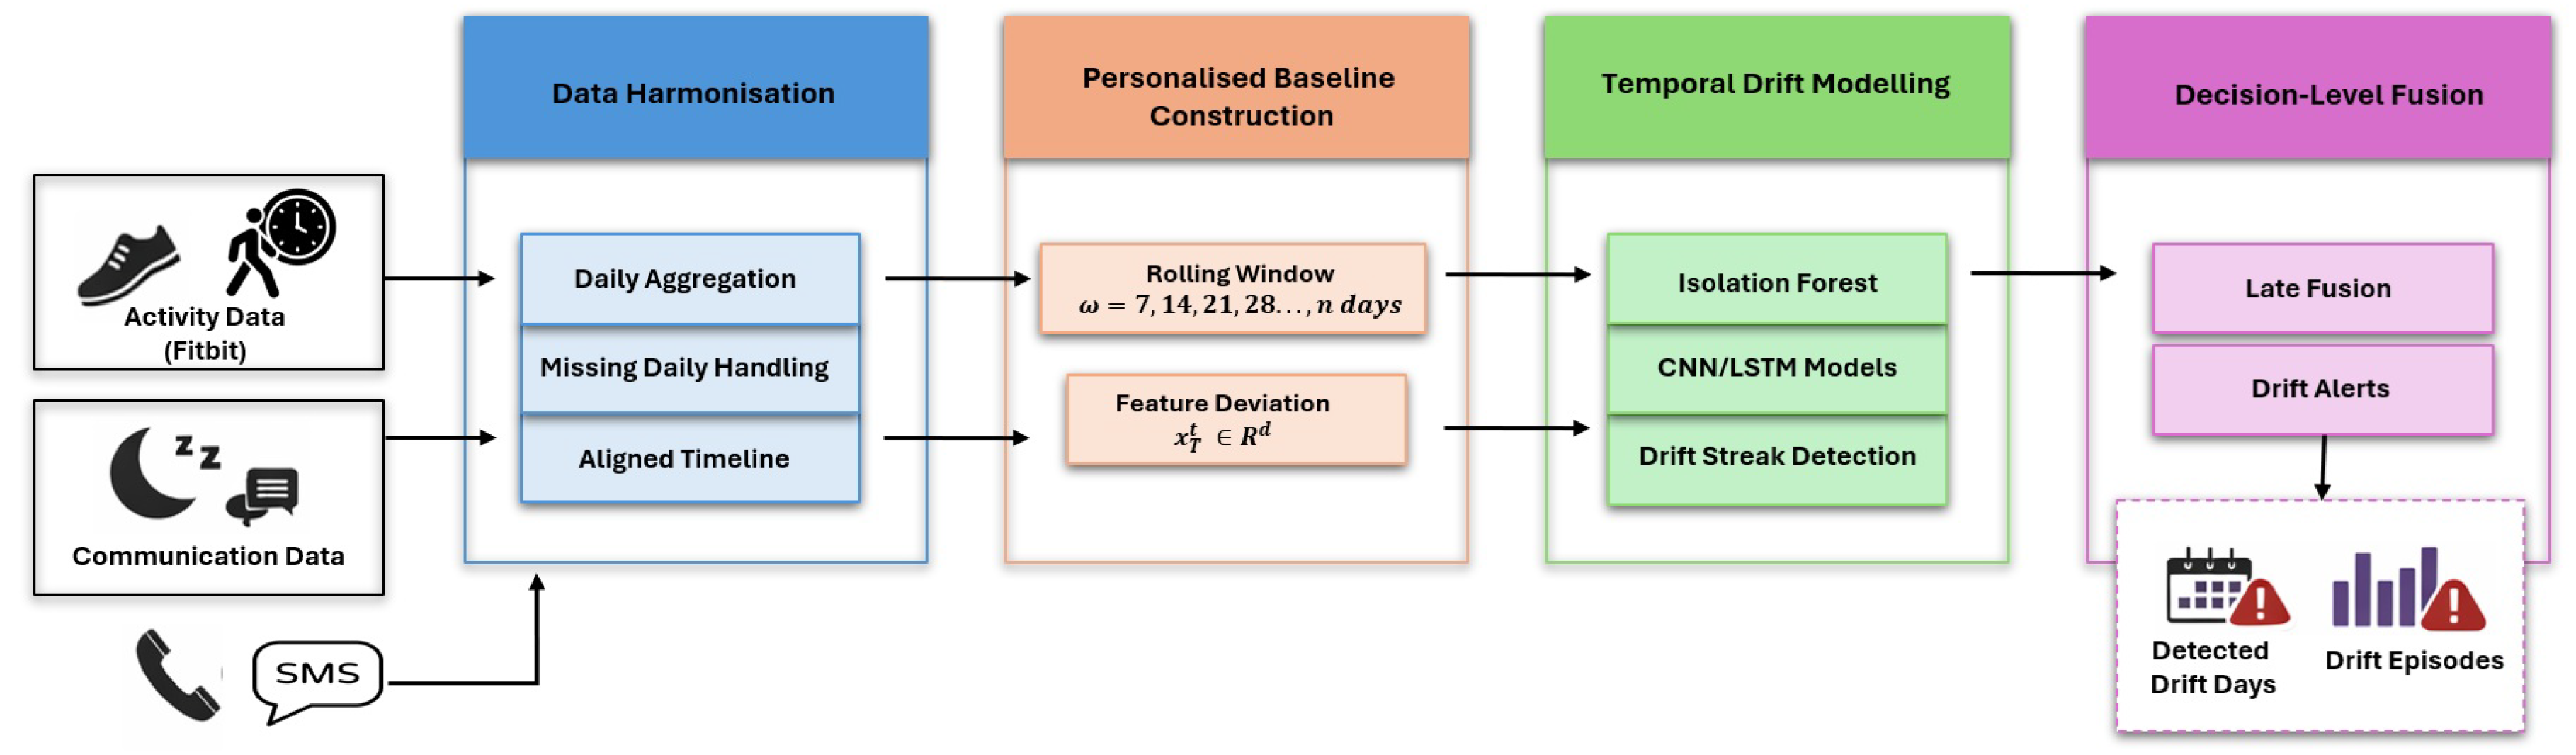
Figure 2.
Correlation matrix of physical activity features, identifying overlapping constructs in movement intensity and energy expenditure.
Figure 2.
Correlation matrix of physical activity features, identifying overlapping constructs in movement intensity and energy expenditure.
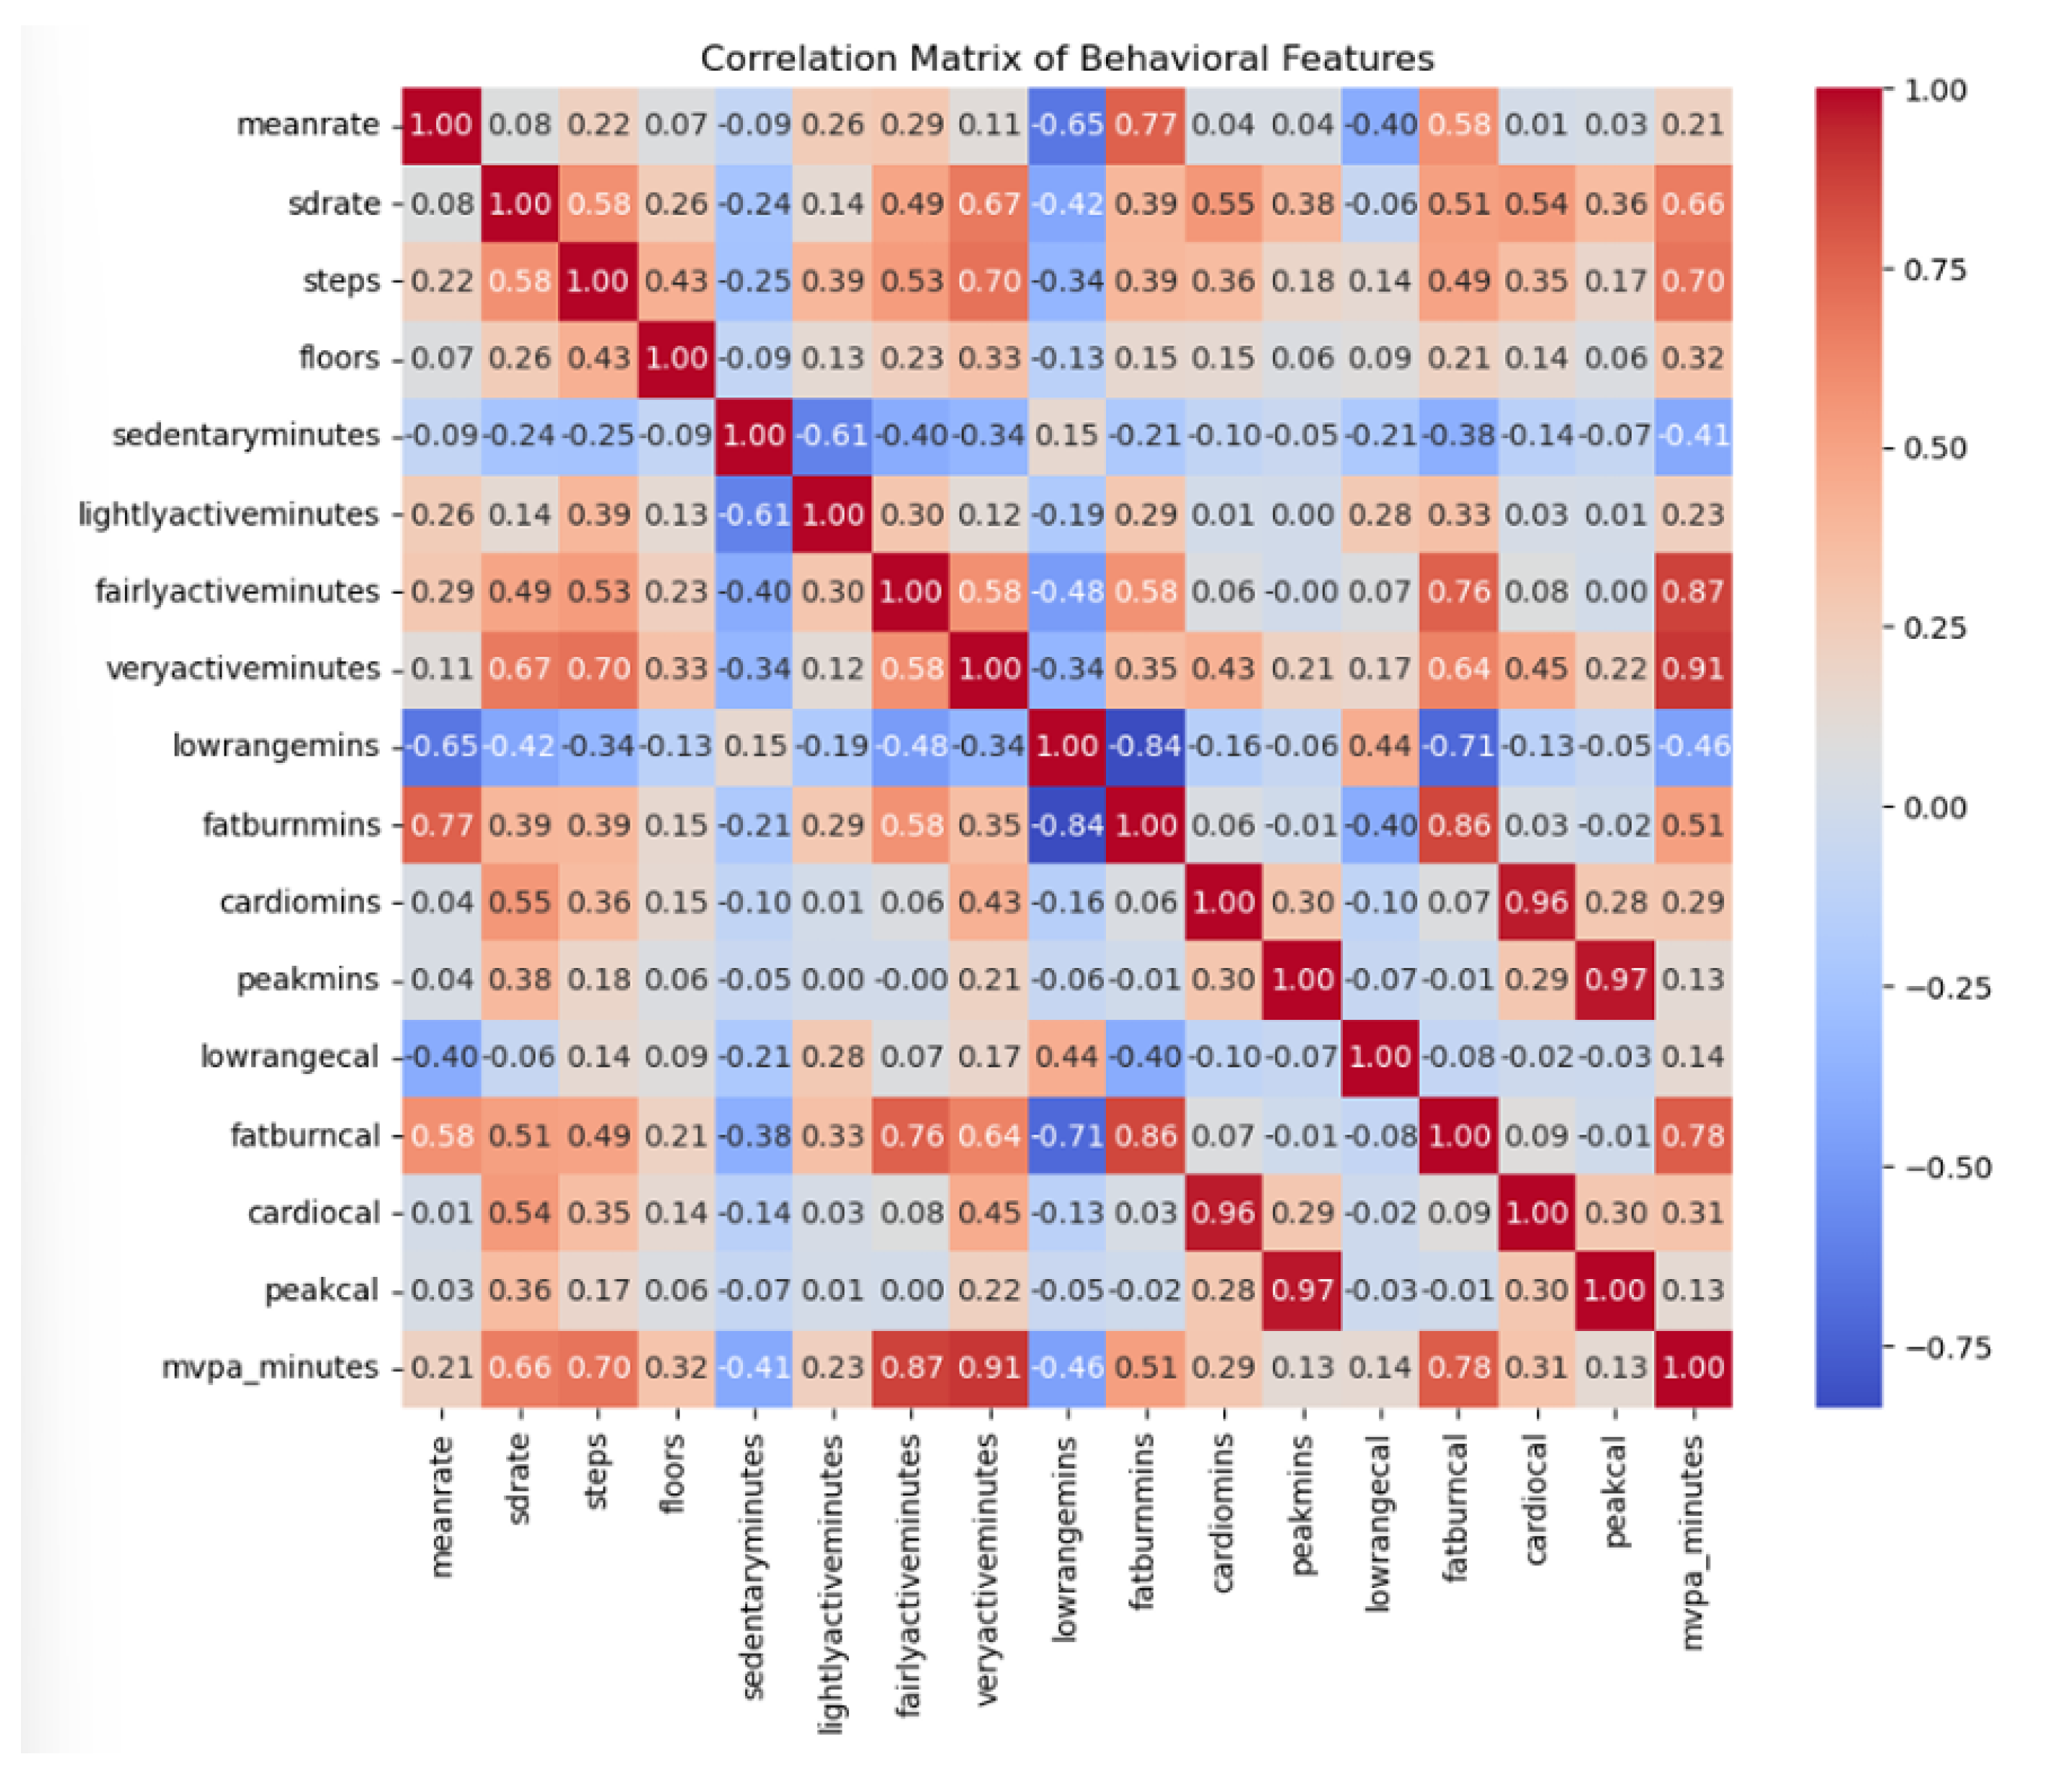
Figure 3.
Pairwise correlation and PCA for sleep data to identify redundant features: (a) Correlation Matrix (b) PCA Variance Plot.
Figure 3.
Pairwise correlation and PCA for sleep data to identify redundant features: (a) Correlation Matrix (b) PCA Variance Plot.
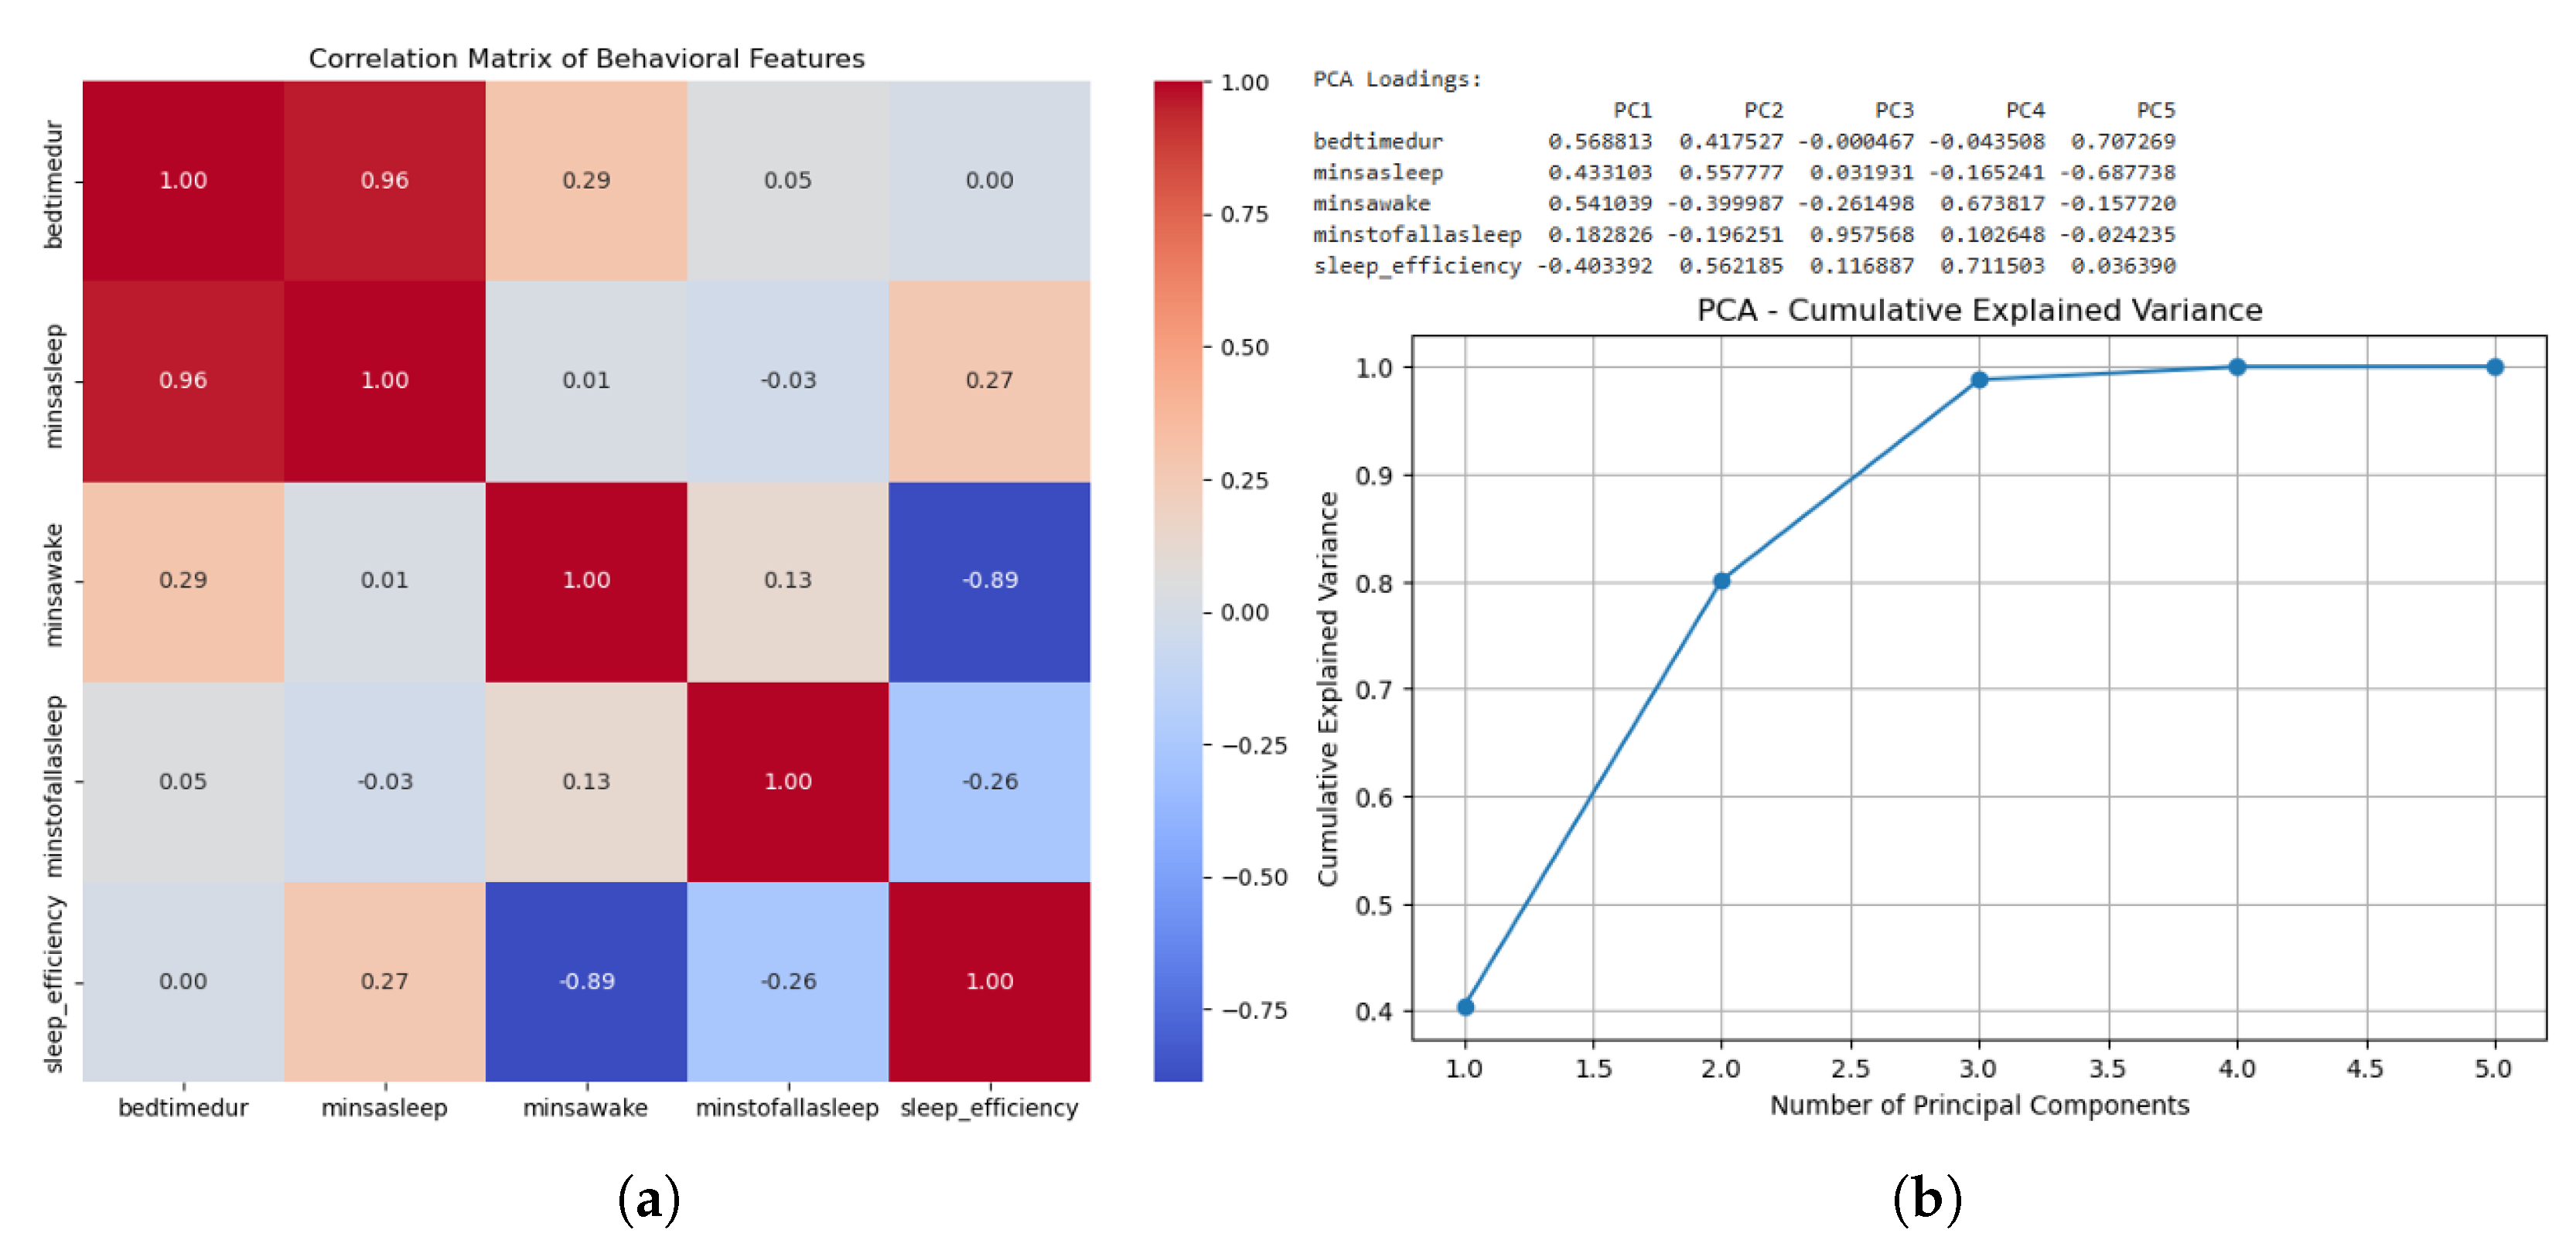
Figure 4.
ANOVA F-score top-ranked predictors for each modality: (a) Activity Data (b) Sleep Data (c) Communication Data.
Figure 4.
ANOVA F-score top-ranked predictors for each modality: (a) Activity Data (b) Sleep Data (c) Communication Data.
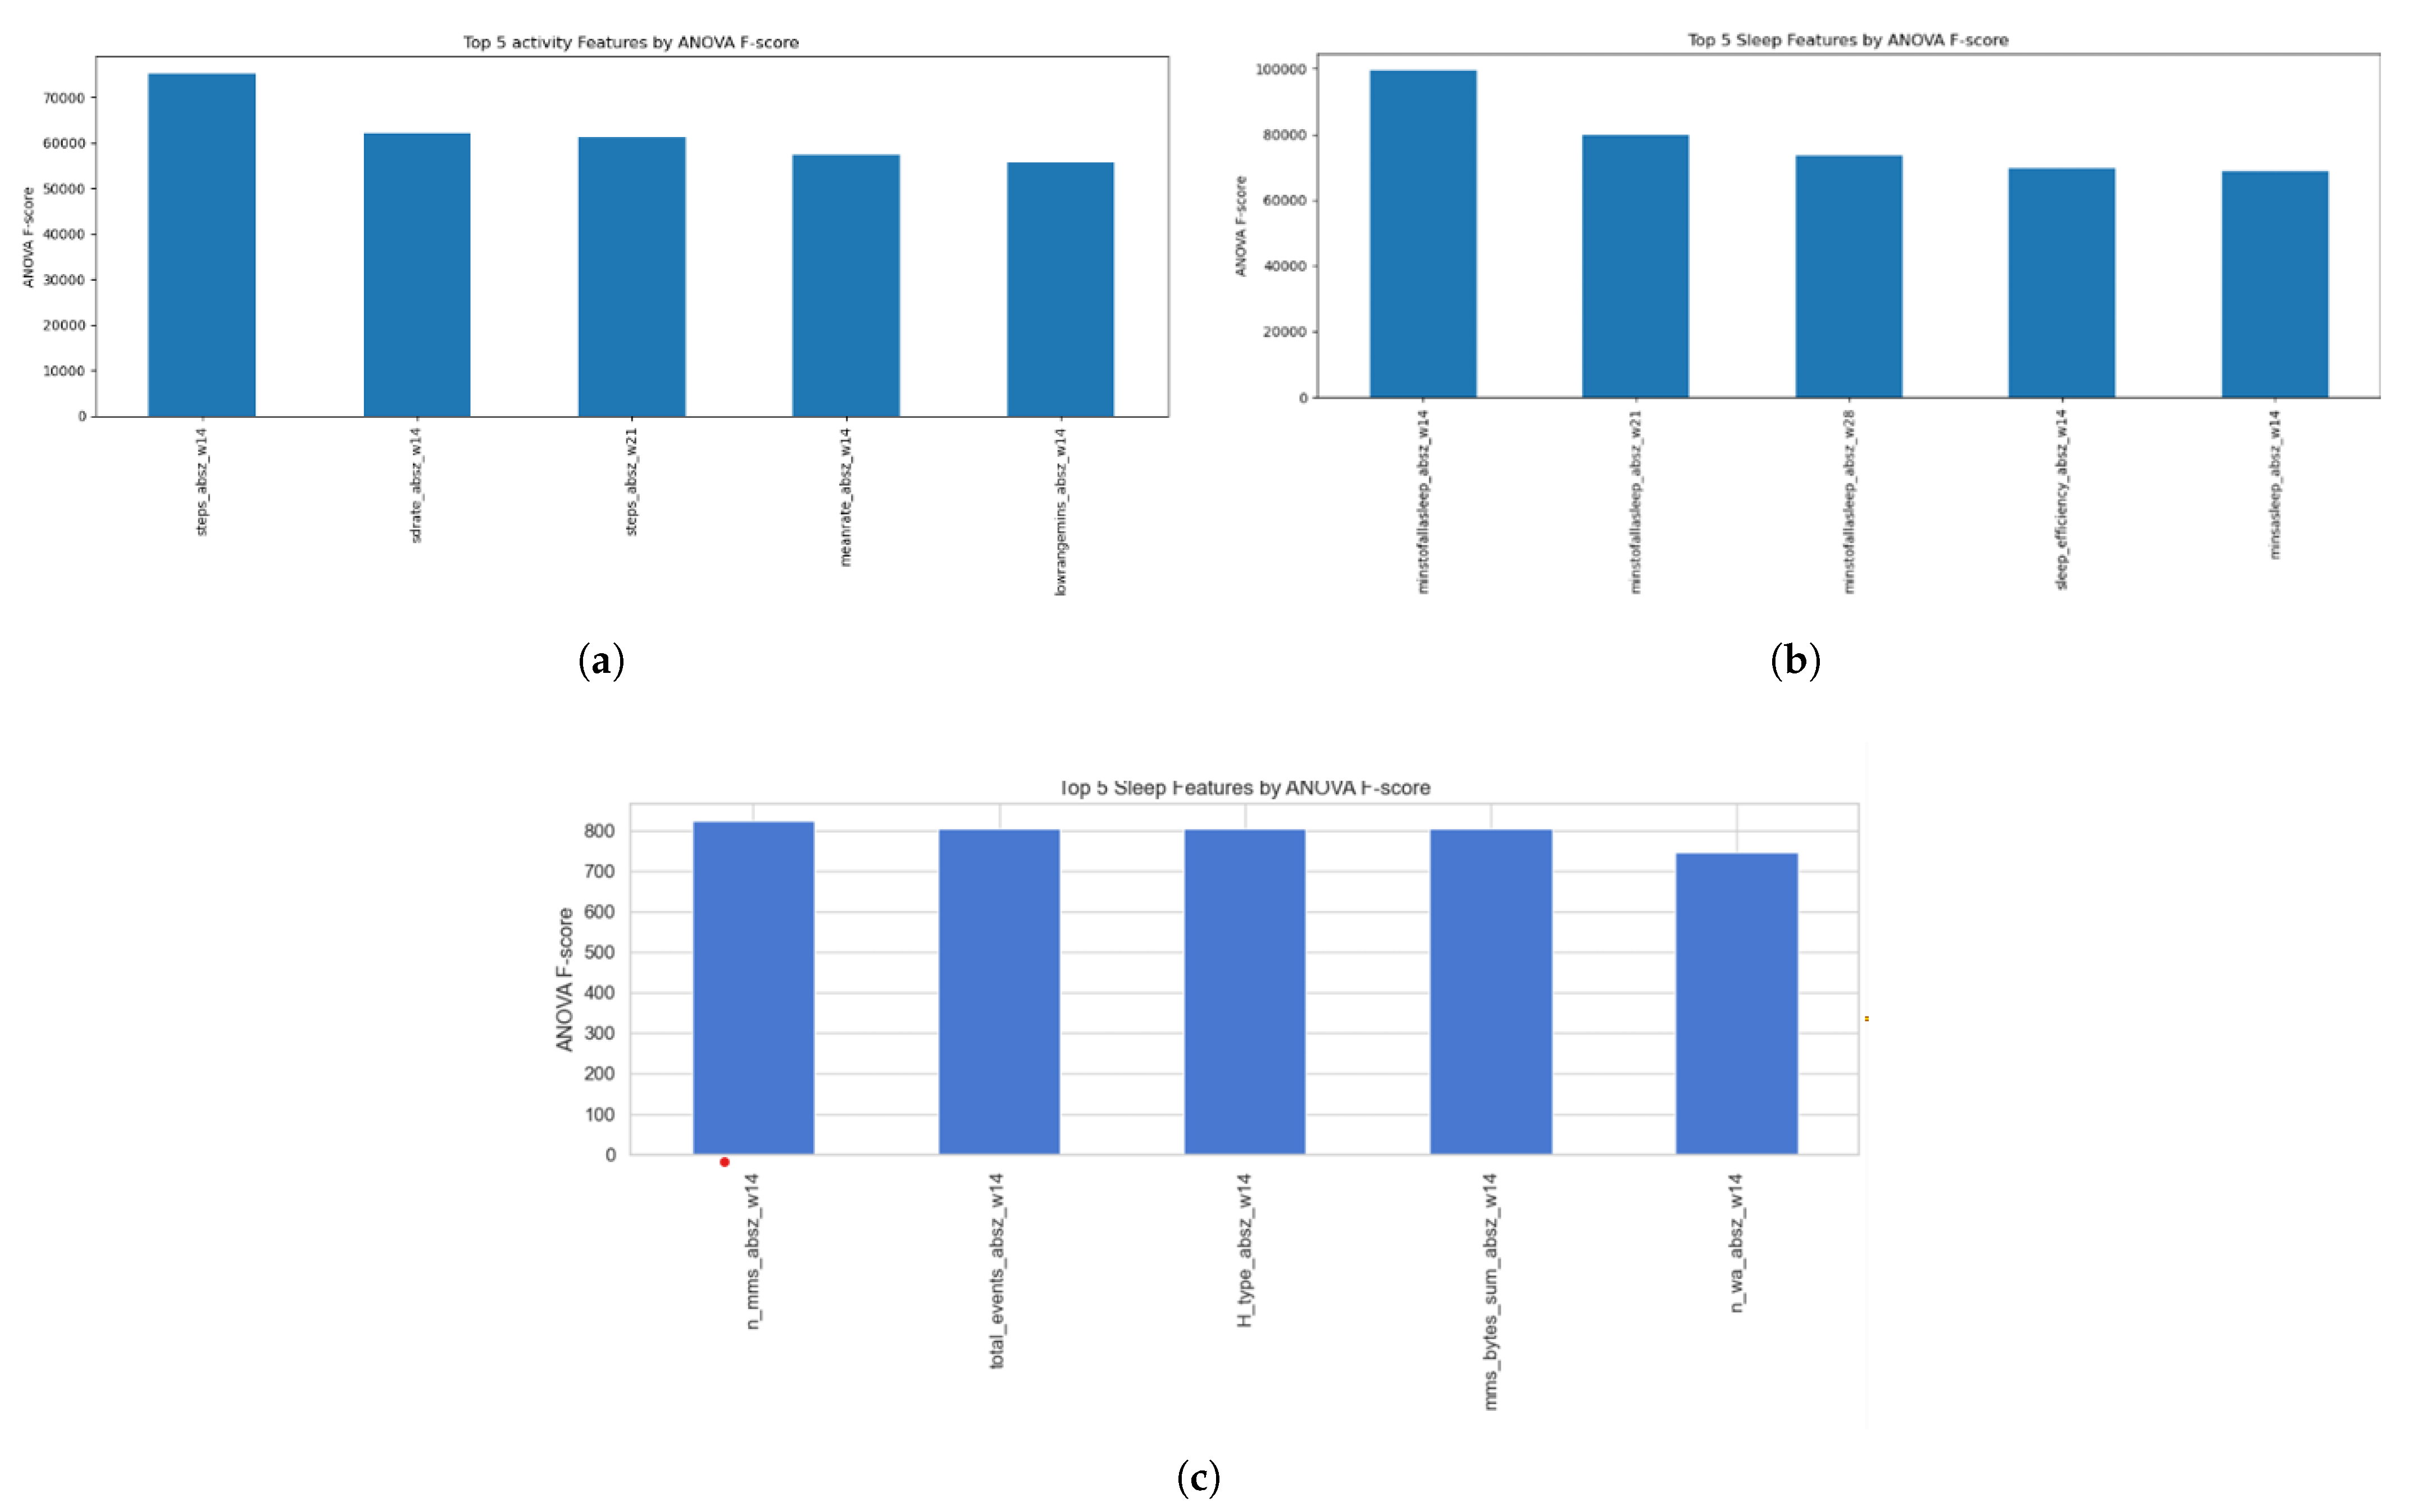
Figure 5.
Distribution of Daily Contact Entropy across the student cohort.
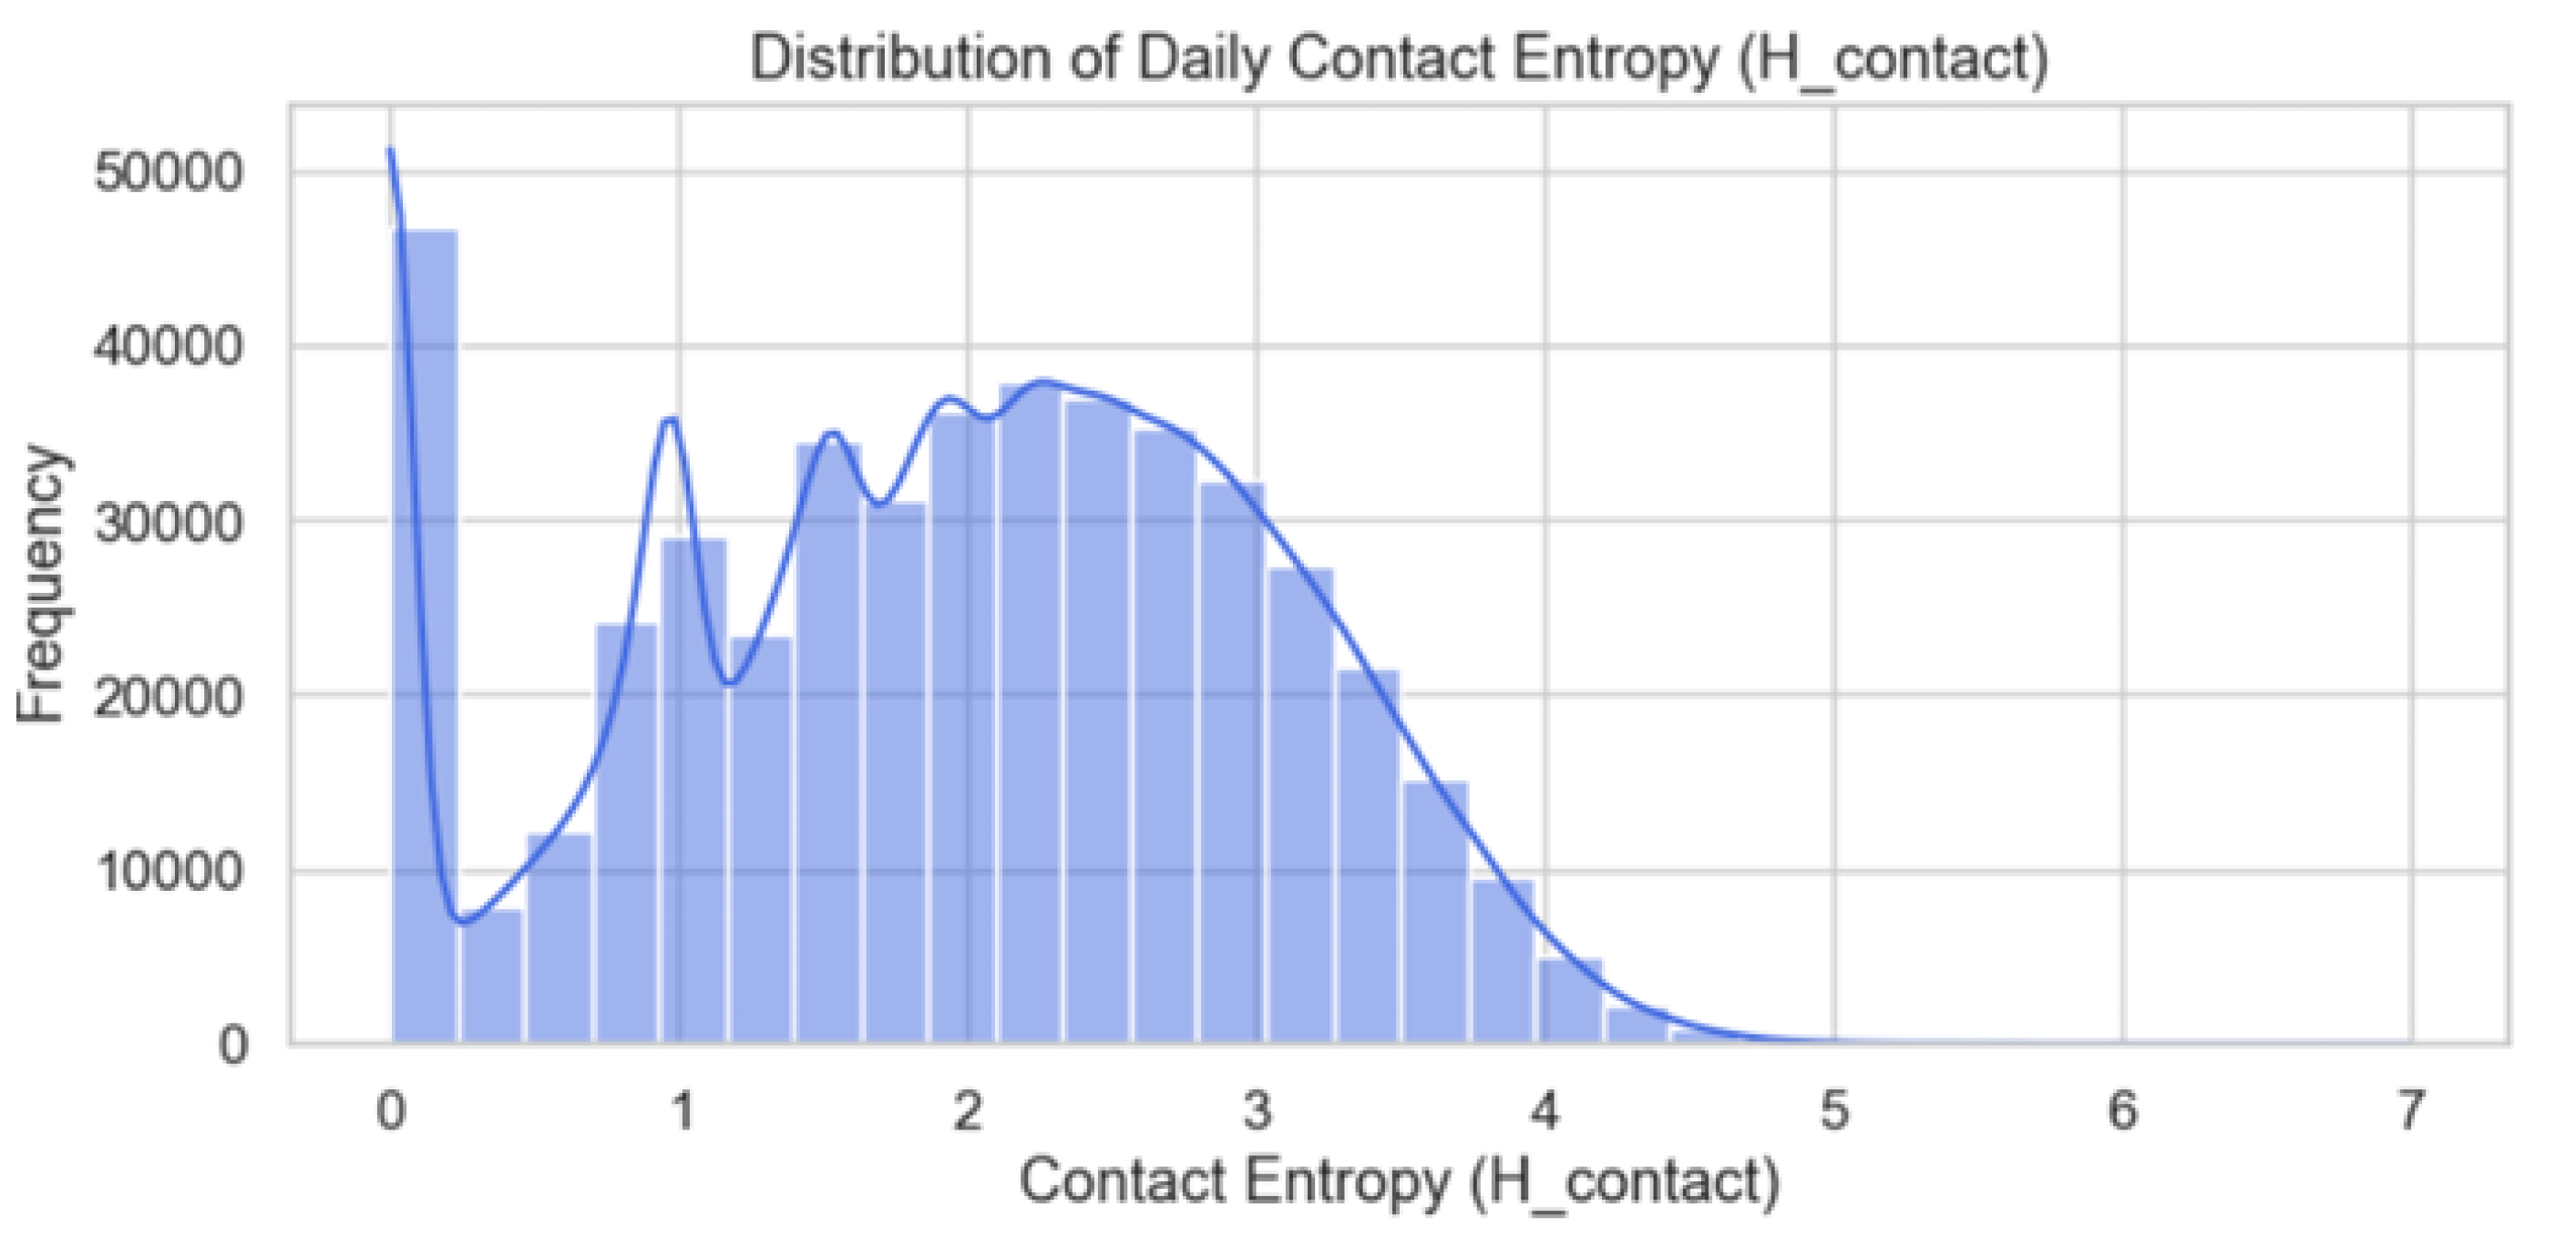
Figure 6.
Relationship between daily communication volume and contact entropy.
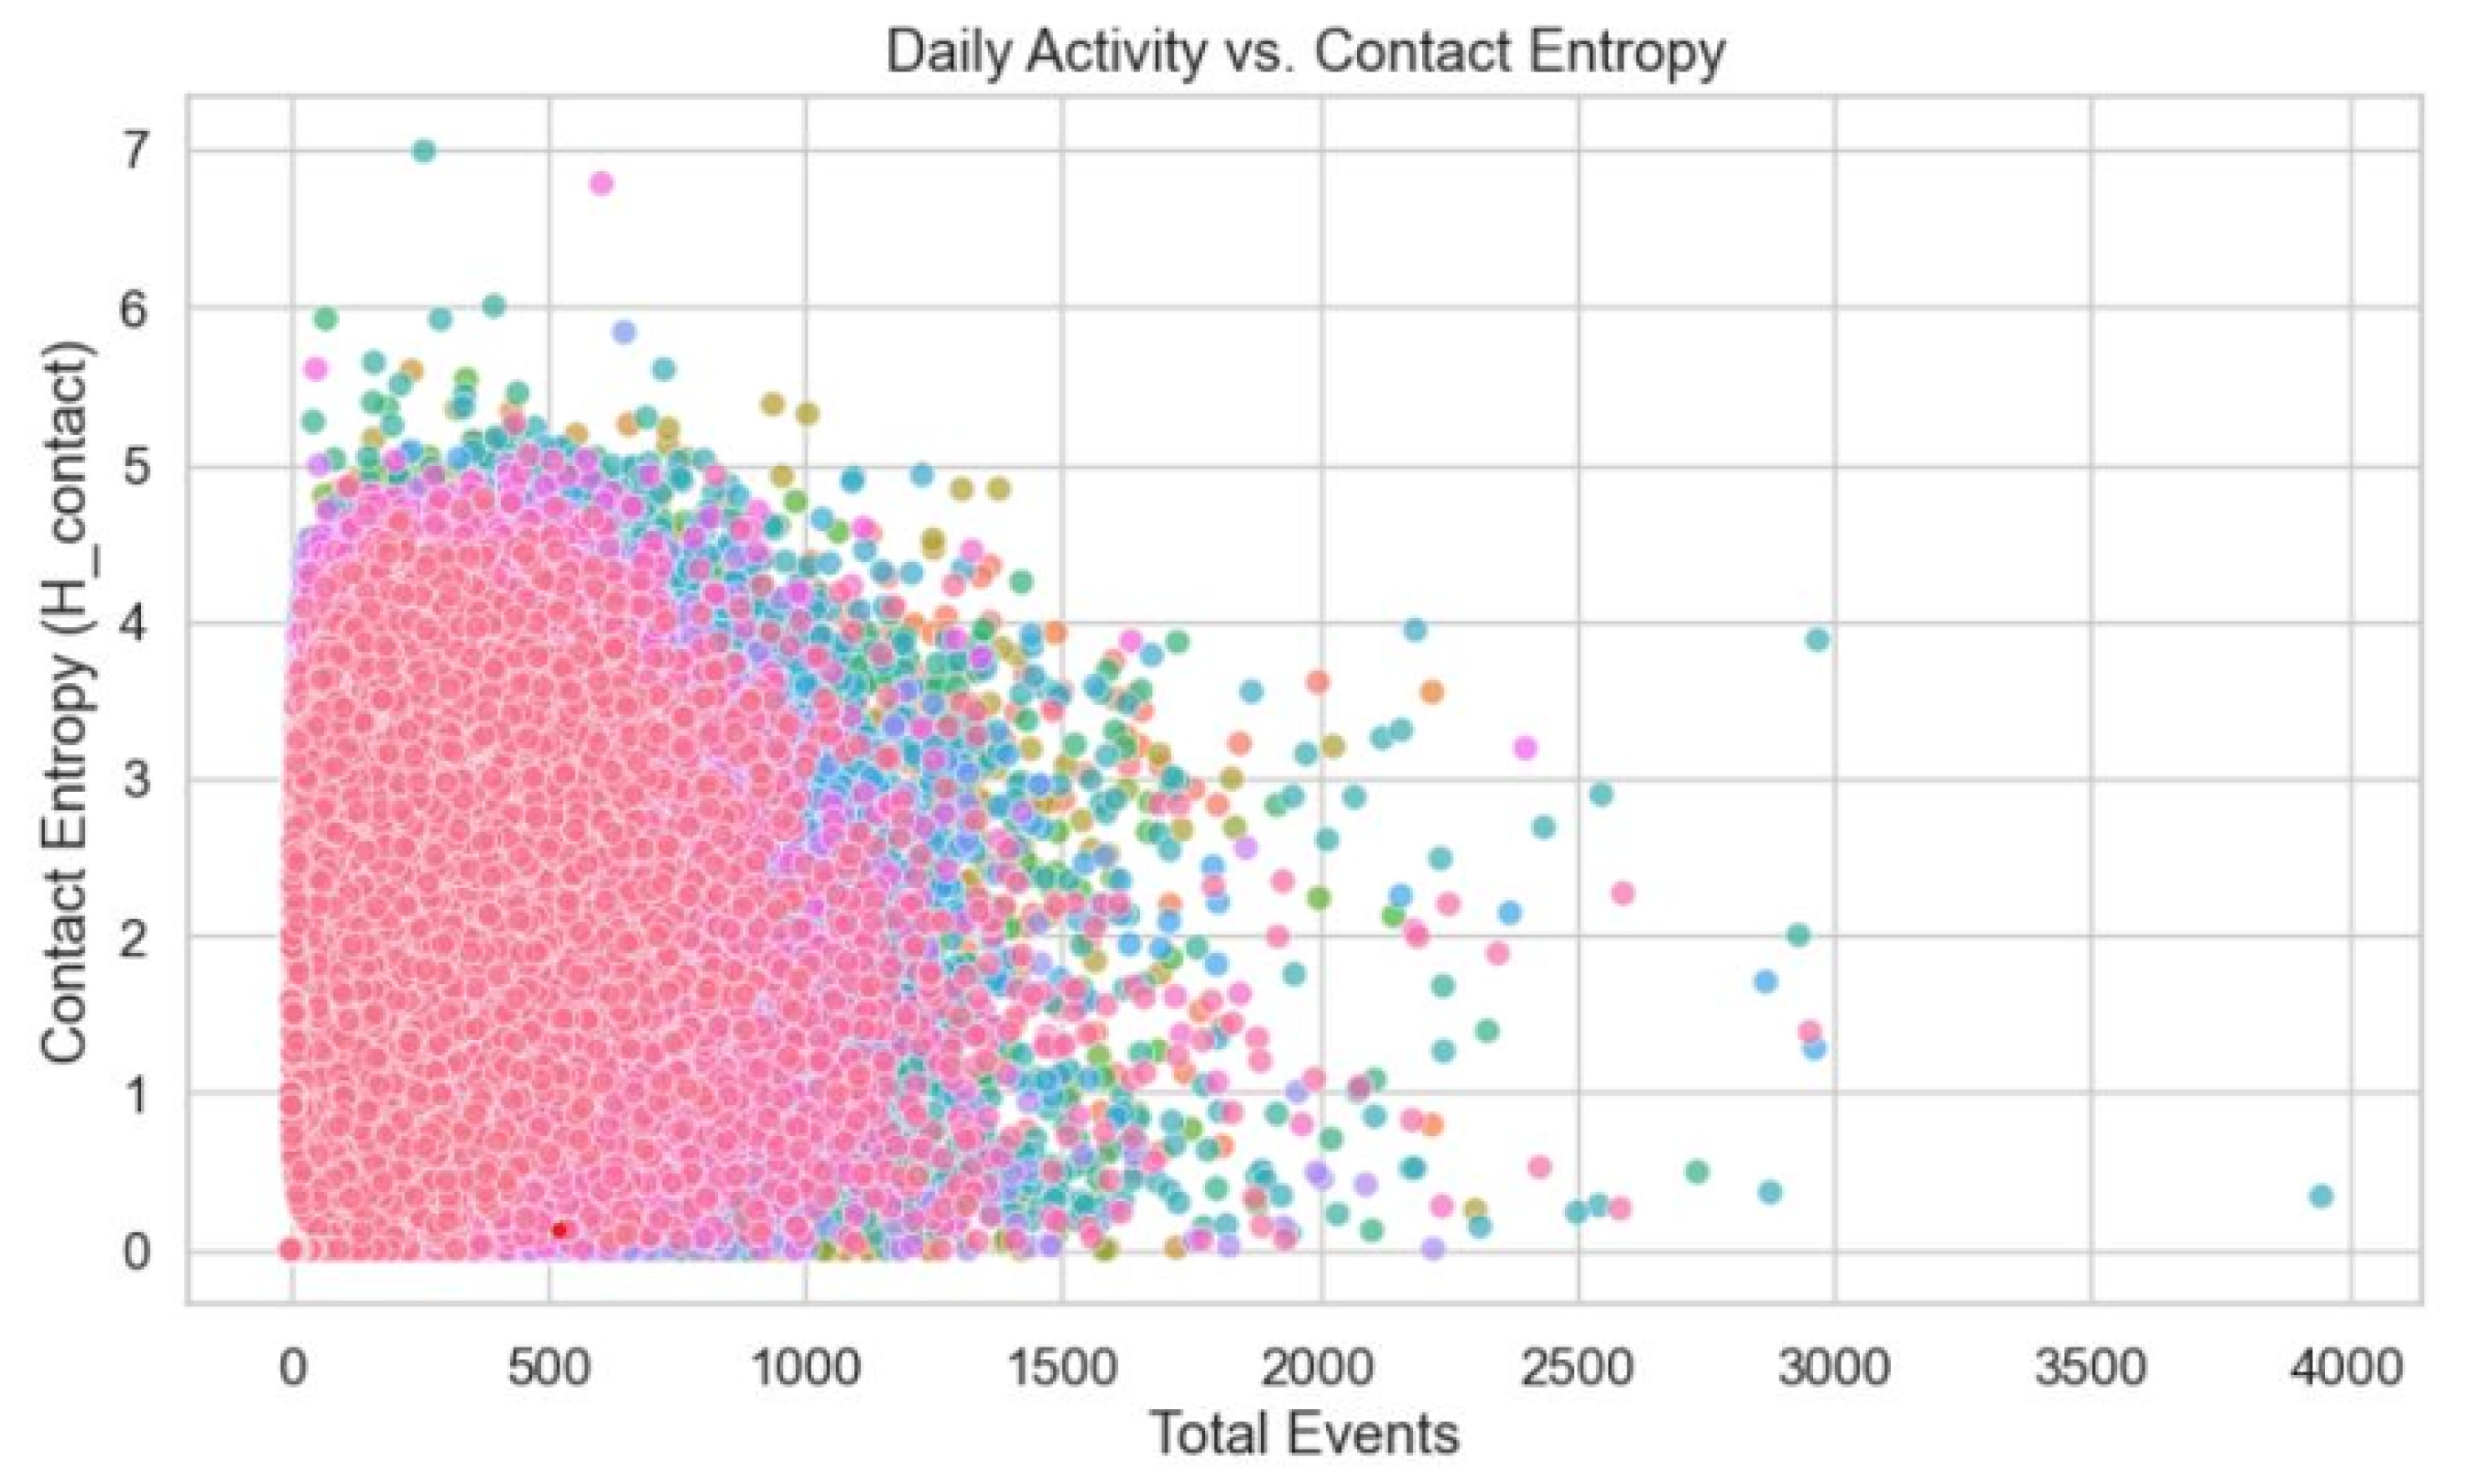
Figure 7.
Temporal social trends for two sample users, illustrating high-diversity versus withdrawal-spike phenotypes.
Figure 7.
Temporal social trends for two sample users, illustrating high-diversity versus withdrawal-spike phenotypes.
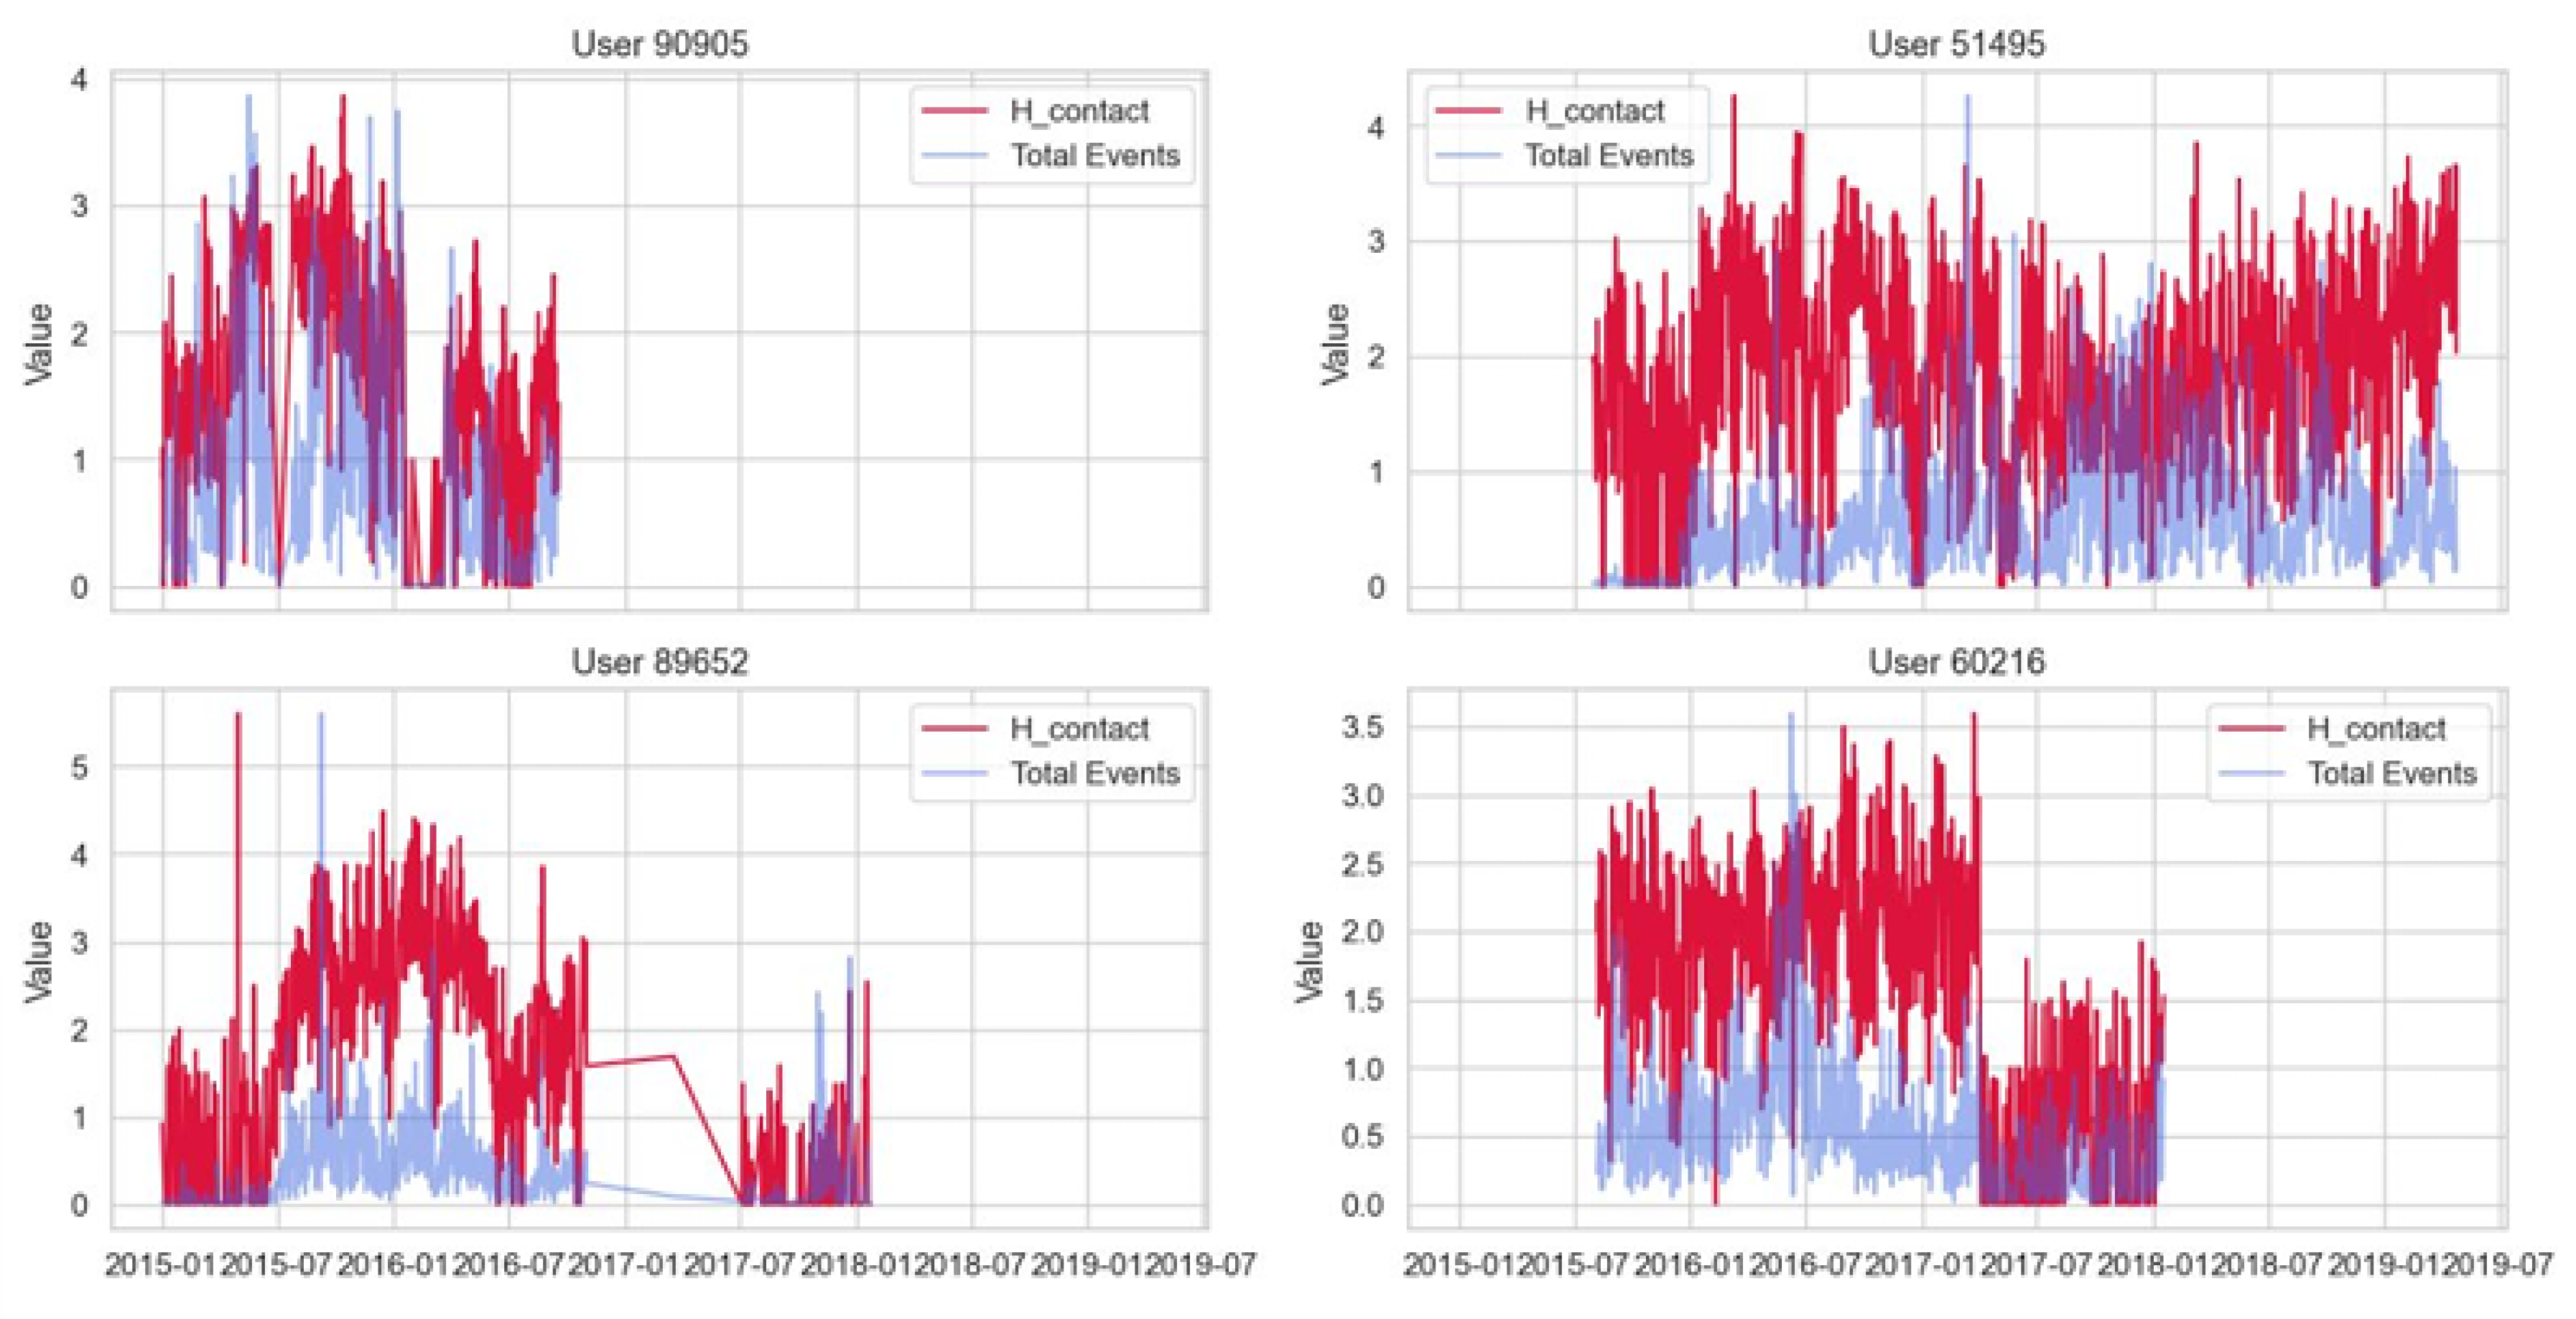
Figure 8.
Sample drift streak score for a sample user for Sleep data
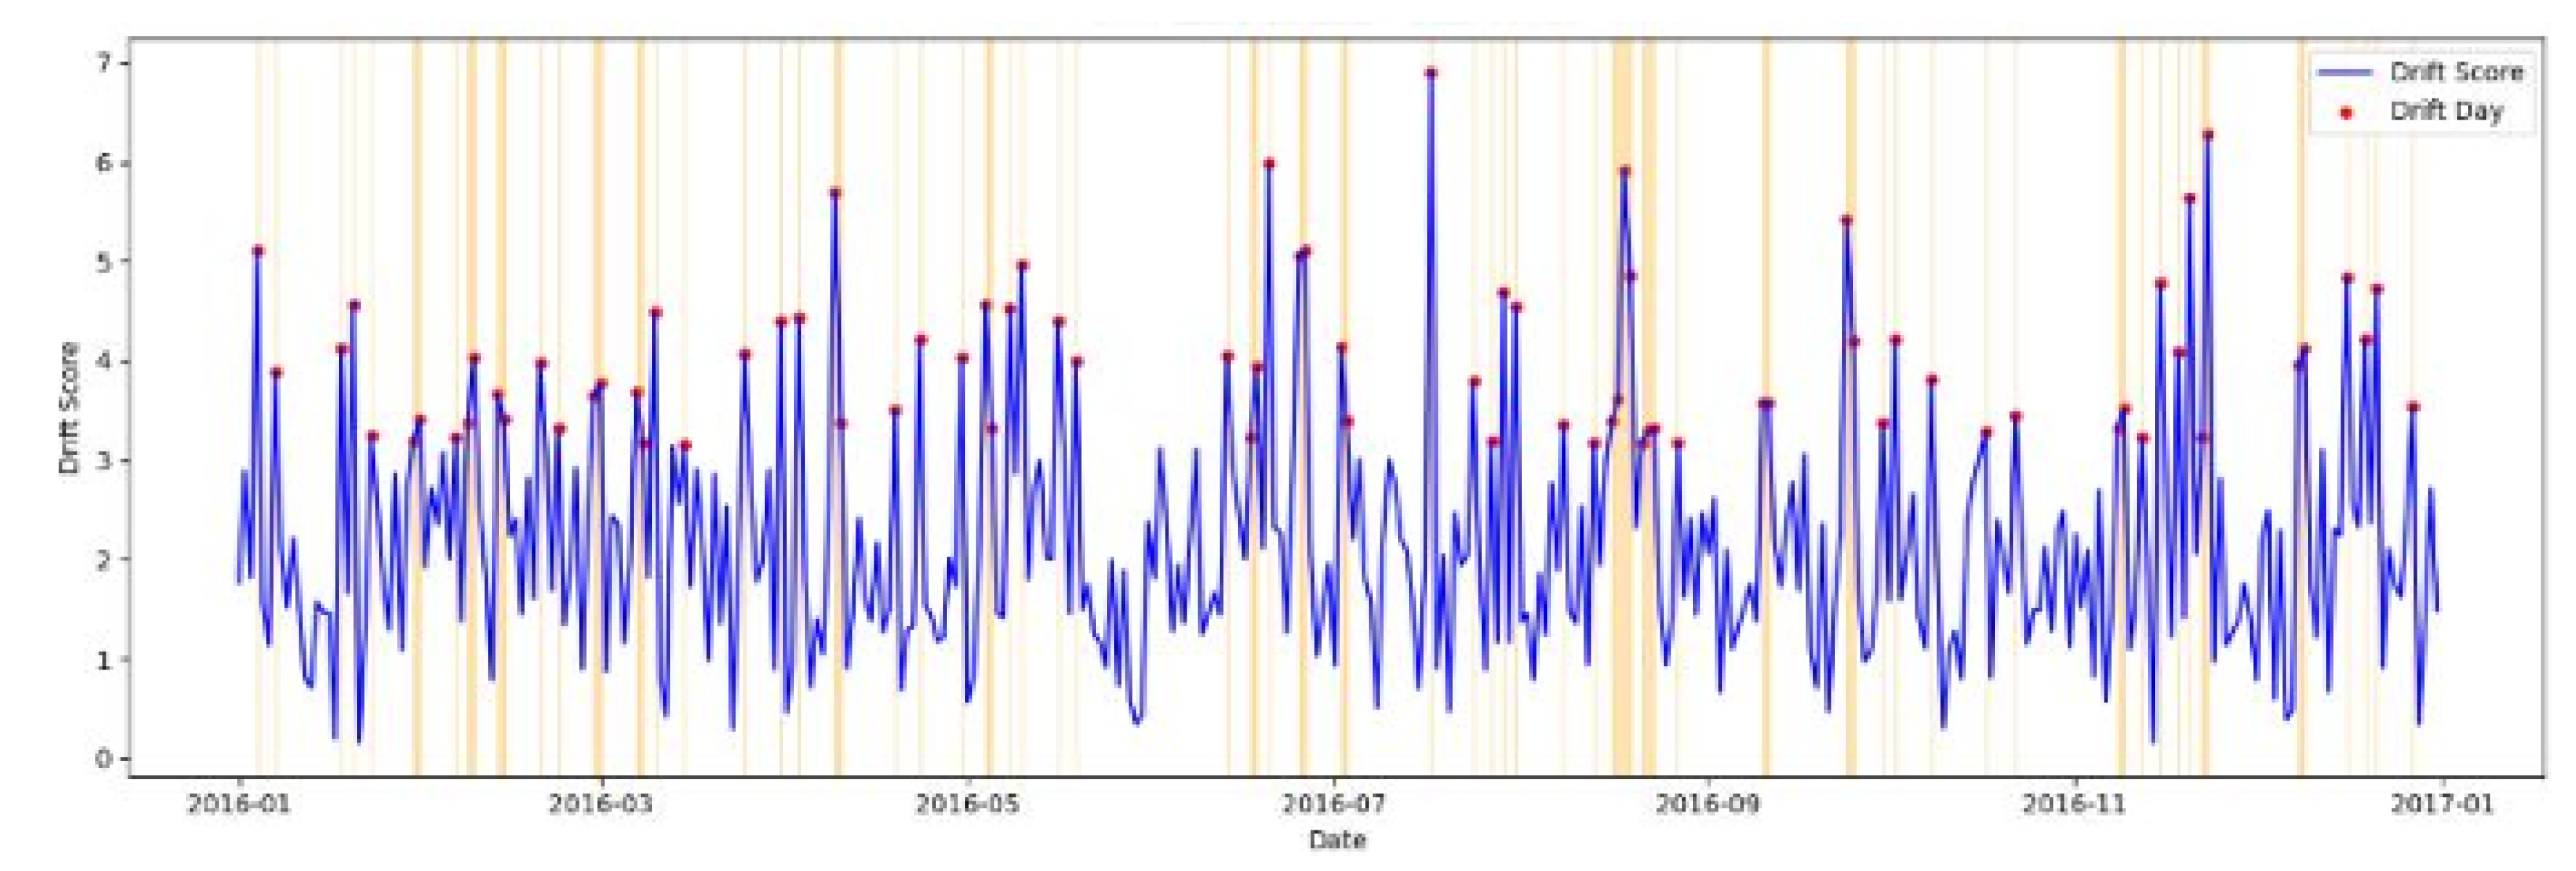
Figure 9.
Late Fusion Confusion Matrix, demonstrating high sensitivity to behavioural drift events.
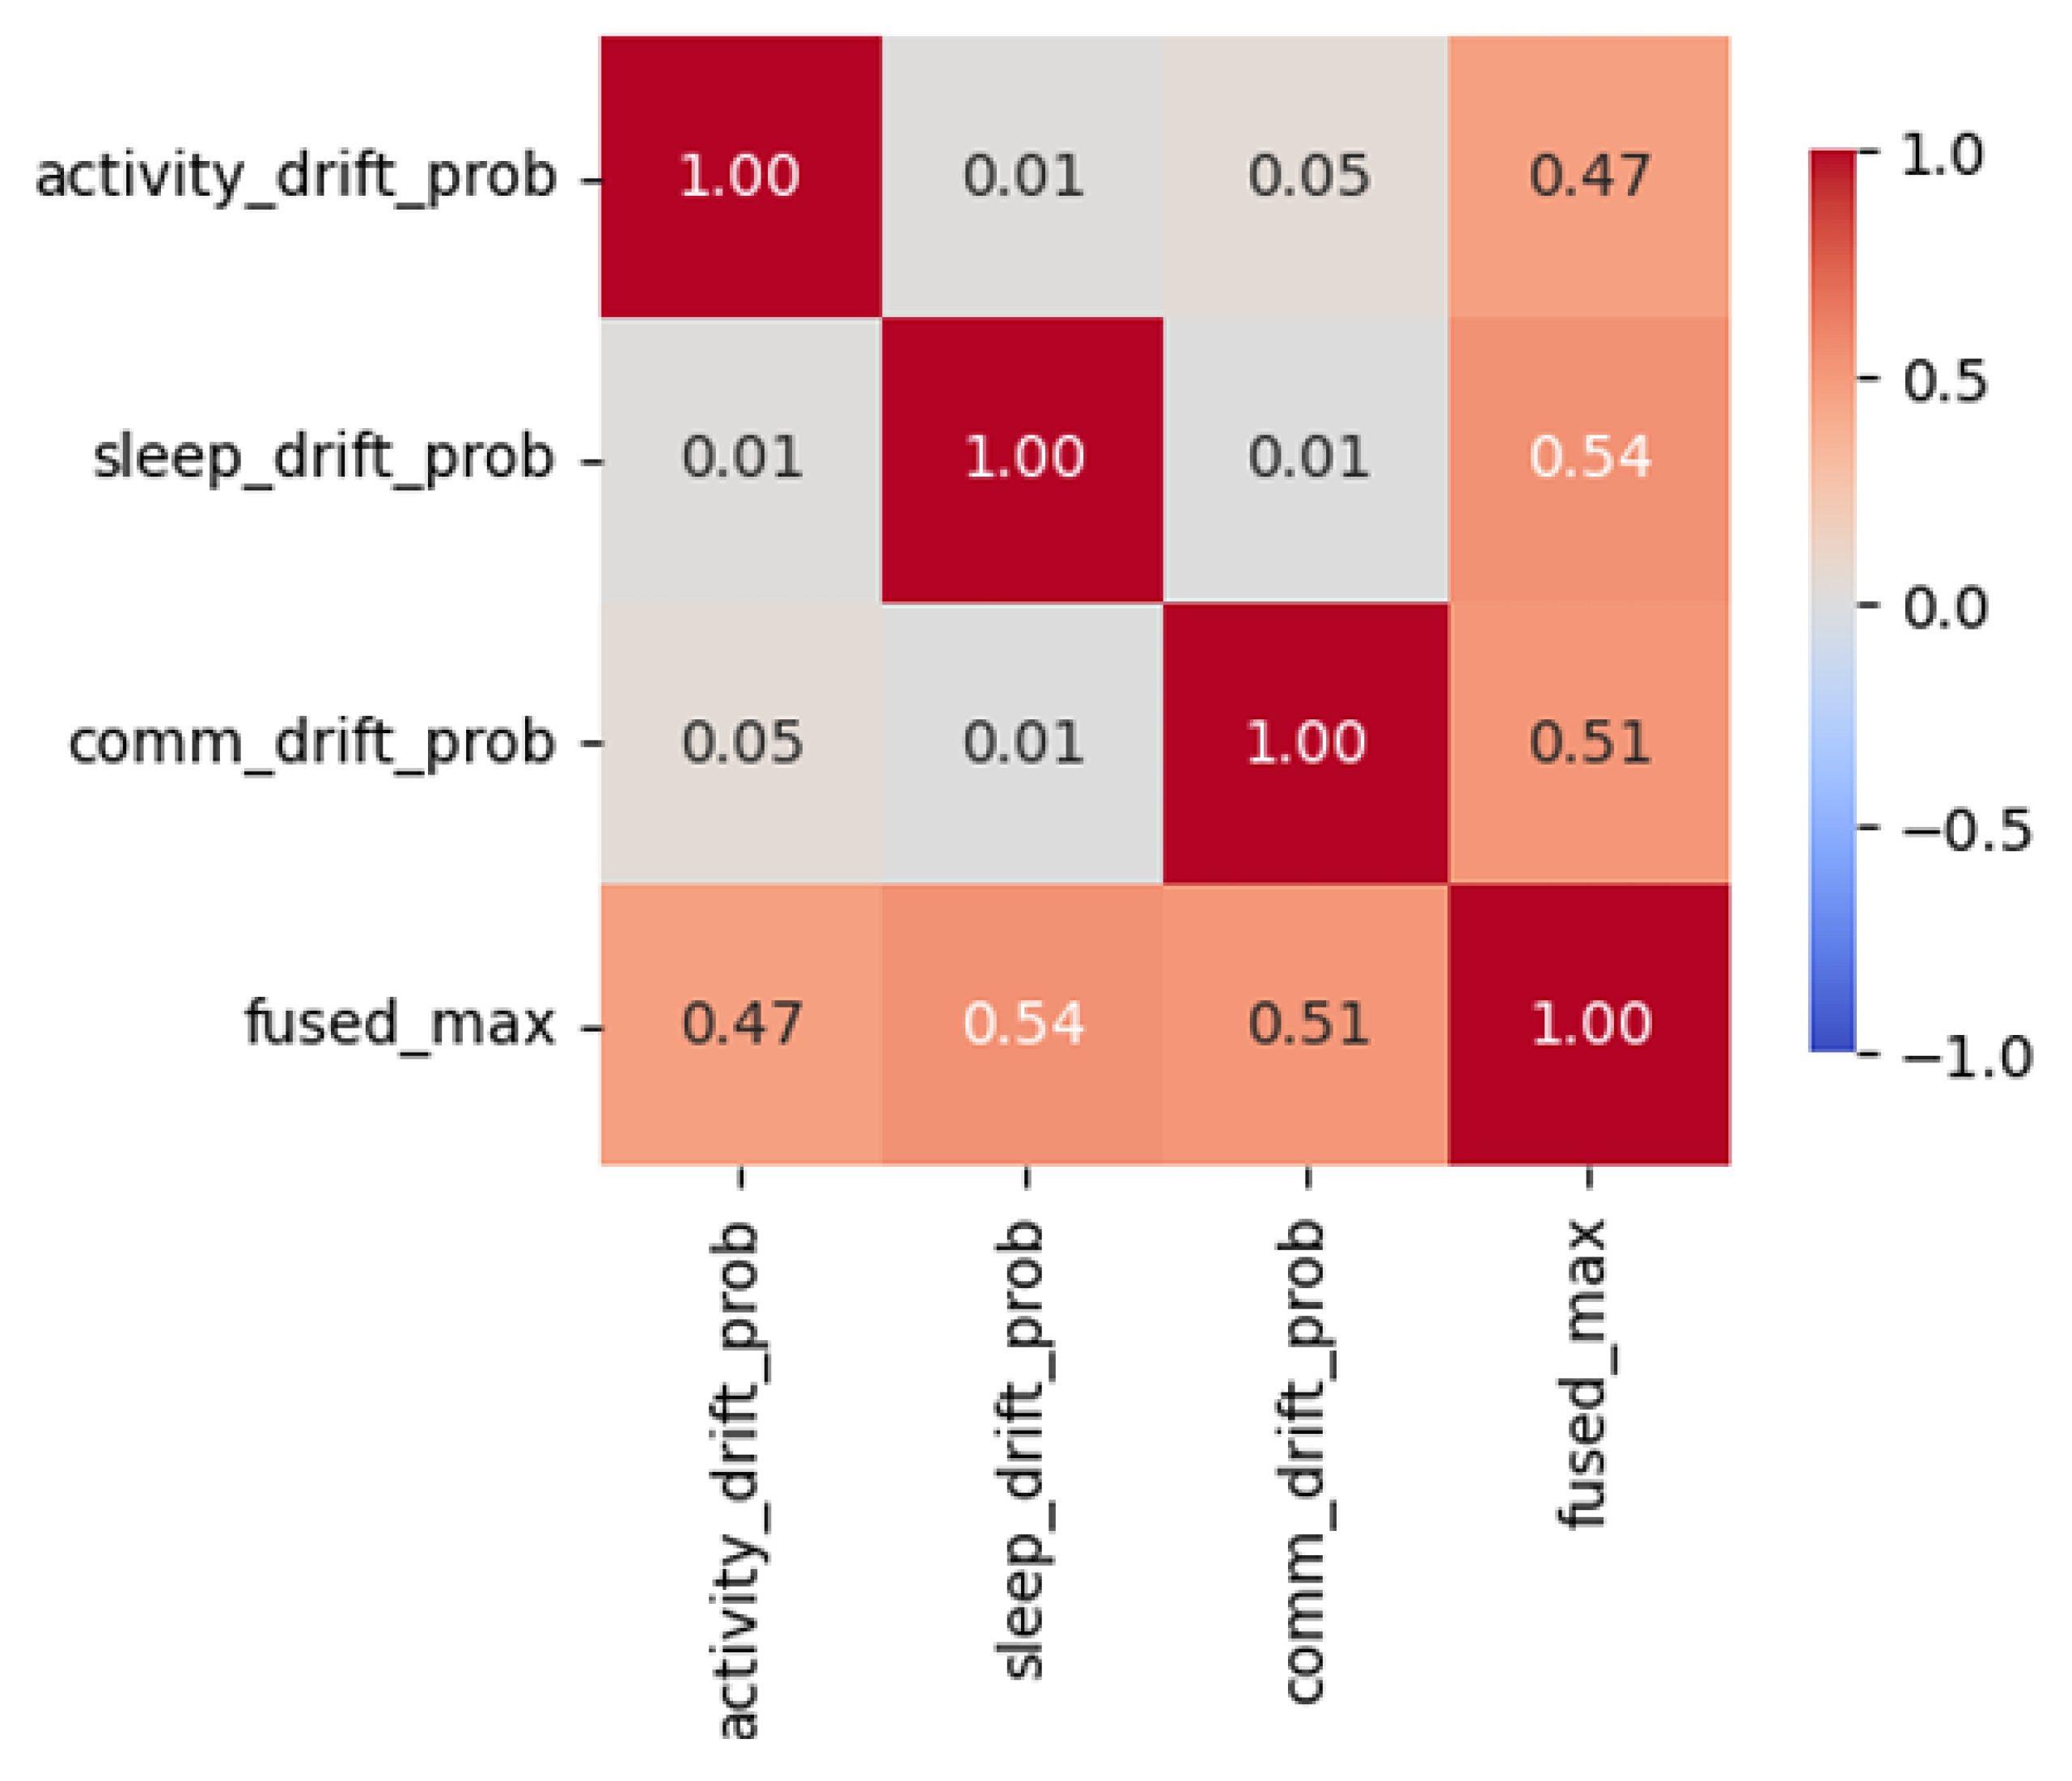
Figure 10.
Longitudinal trajectory of the multimodal fused drift score for a representative participant. The fused signal (red line) integrates independent evidence from activity, sleep, and communication streams to identify sustained drift episodes relative to the 0.5 decision threshold.
Figure 10.
Longitudinal trajectory of the multimodal fused drift score for a representative participant. The fused signal (red line) integrates independent evidence from activity, sleep, and communication streams to identify sustained drift episodes relative to the 0.5 decision threshold.
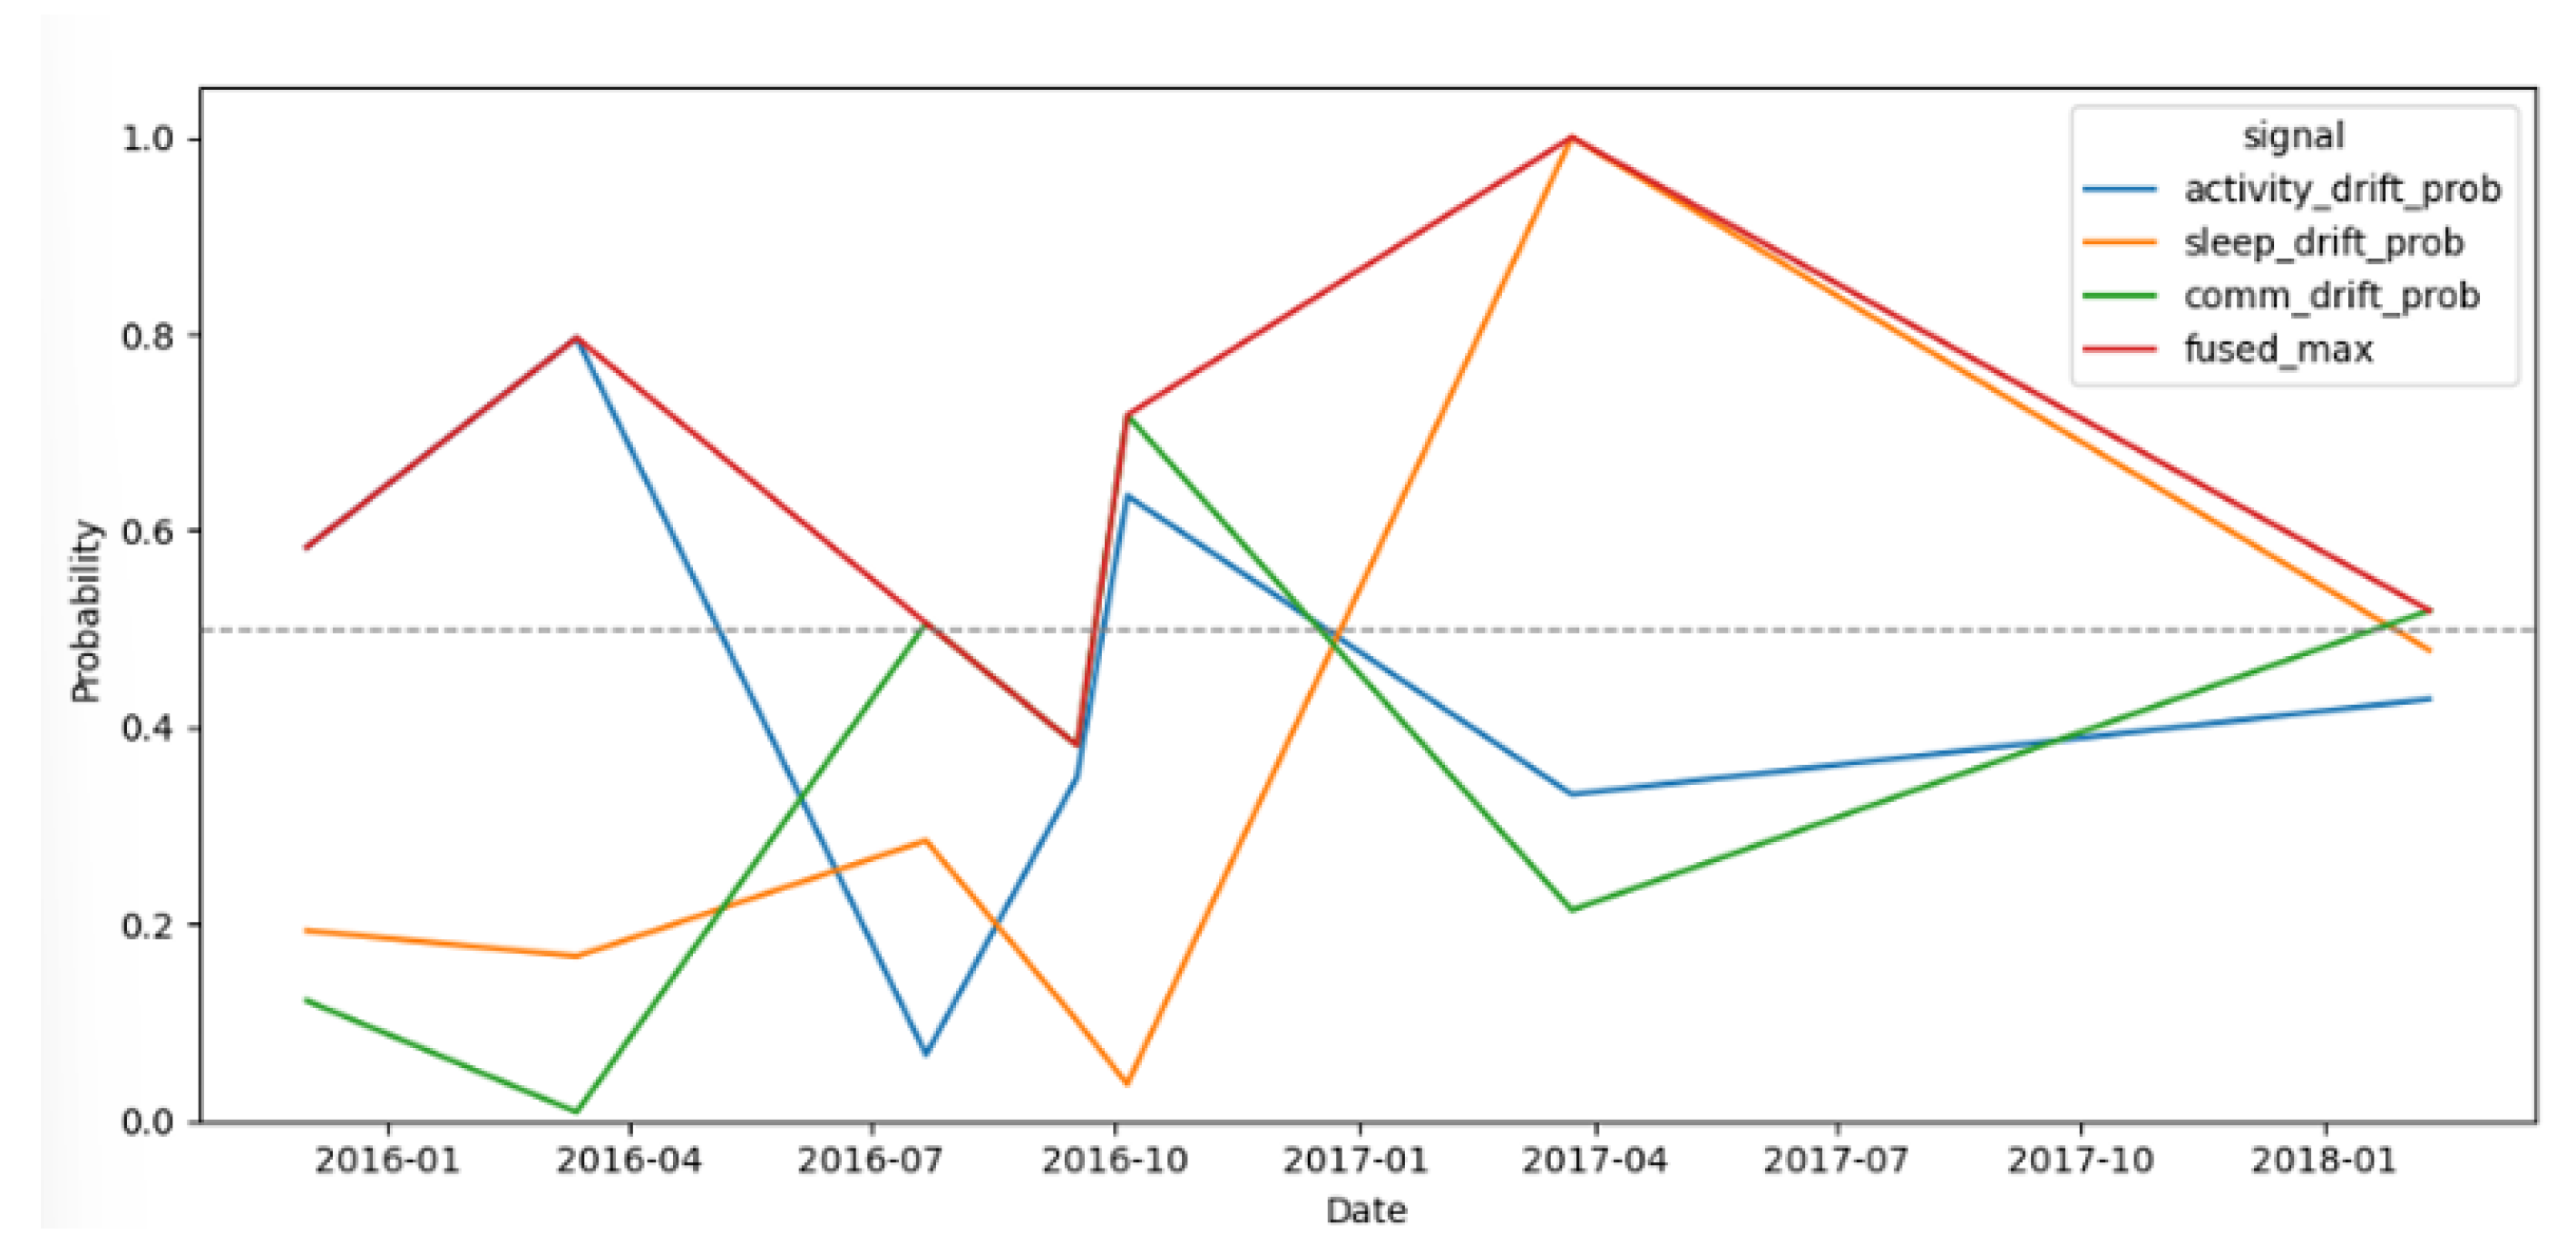

Table 1.
Approaches with day-scale windowing methods
| Approach | Window size | Preprocessing | Reference |
|---|---|---|---|
| U-BEHAVED | 3-day rolling baseline (configurable) | Aggregate steps/hour; compute rolling mean and IQR; flag consecutive outliers | [28] |
| DynAmo | Configurable length | Dynamic clustering to capture trends | [25] |
| PCAR | Multi-month windows | HAR aggregation into daily activity curves | [27] |
| PCAR | ≤ 7 days | KL-divergence on day-level step summaries with smoothing to avoid zeros | [26] |
| eB2 feasibility study (GPS) | > 1 month | Clustering of daily profiles; change point detection on profile probabilities | [30] |
| Daily multivariate anomaly detection | Daily features over months; analysis focuses on two weeks pre-relapse | Daily mobility and sociability features; anomaly detection on multivariate daily vectors | [29] |
Table 2.
NetHealth dataset cohort dynamics: Recruitment phases and longitudinal participant retention over the four-year study period.
Table 2.
NetHealth dataset cohort dynamics: Recruitment phases and longitudinal participant retention over the four-year study period.
| Longitudinal Retention | Timeline | Participants (n) |
|---|---|---|
| Year 1 | 2015–2016 | 698 |
| Year 2 | 2016–2017 | 686 |
| Year 3 | 2017–2018 | ∼435 |
| Year 4 | 2018–2019 | ∼320 |
Table 3.
Drift streak episodes across rolling window sizes and modalities.
| Modality | Window (days) | Episodes detected | Drift days flagged / Valid days |
|---|---|---|---|
| Activity | 7 | 225 | 54,936 / 274,679 |
| 14 | 234 | 54,936 / 274,679 | |
| 21 | 221 | 54,936 / 274,679 | |
| 28 | 215 | 54,936 / 274,679 | |
| Sleep | 7 | 232 | 59,472 / 297,357 |
| 14 | 222 | 59,472 / 297,357 | |
| 21 | 226 | 59,472 / 297,357 | |
| 28 | 241 | 59,472 / 297,357 | |
| Communication | 7 | 367 | 92,480 / 471,110 |
| 14 | 363 | 92,832 / 471,110 | |
| 21 | 364 | 93,000 / 471,110 | |
| 28 | 357 | 93,116 / 471,110 |
Table 4.
Test-set performance of Isolation Forest across modalities
| Modality | Accuracy | Precision | Recall | ROC–AUC | PR–AUC |
|---|---|---|---|---|---|
| Activity | 0.829 | 0.614 | 0.476 | 0.789 | 0.561 |
| Sleep | 0.932 | 0.878 | 0.783 | 0.981 | 0.926 |
| Communication | 0.828 | 0.514 | 0.515 | 0.770 | 0.495 |
Table 5.
Test-set performance comparison of CNN and LSTM models across activity, sleep, and communication modalities.
Table 5.
Test-set performance comparison of CNN and LSTM models across activity, sleep, and communication modalities.
| Modality | Model | Accuracy | Precision | Recall | ROC–AUC | PR–AUC |
|---|---|---|---|---|---|---|
| Activity | CNN | 0.814 | 0.535 | 0.726 | 0.857 | 0.690 |
| LSTM | 0.806 | 0.520 | 0.759 | 0.867 | 0.703 | |
| Sleep | CNN | 0.852 | 0.610 | 0.772 | 0.896 | 0.797 |
| LSTM | 0.868 | 0.655 | 0.753 | 0.915 | 0.813 | |
| Communication | CNN | 0.755 | 0.435 | 0.753 | 0.831 | 0.578 |
| LSTM | 0.771 | 0.457 | 0.747 | 0.844 | 0.606 |
Table 6.
Global performance metrics for the decision level Late Fusion
| Metric | Accuracy | Precision | Recall | ROC–AUC | PR–AUC |
|---|---|---|---|---|---|
| Value | 0.700 | 0.630 | 0.871 | 0.831 | 0.836 |
Disclaimer/Publisher’s Note: The statements, opinions and data contained in all publications are solely those of the individual author(s) and contributor(s) and not of MDPI and/or the editor(s). MDPI and/or the editor(s) disclaim responsibility for any injury to people or property resulting from any ideas, methods, instructions or products referred to in the content. |
© 2026 by the authors. Licensee MDPI, Basel, Switzerland. This article is an open access article distributed under the terms and conditions of the Creative Commons Attribution (CC BY) license (http://creativecommons.org/licenses/by/4.0/).
Copyright: This open access article is published under a Creative Commons CC BY 4.0 license, which permit the free download, distribution, and reuse, provided that the author and preprint are cited in any reuse.


