
Submitted:
31 December 2025
Posted:
01 January 2026
You are already at the latest version
Abstract
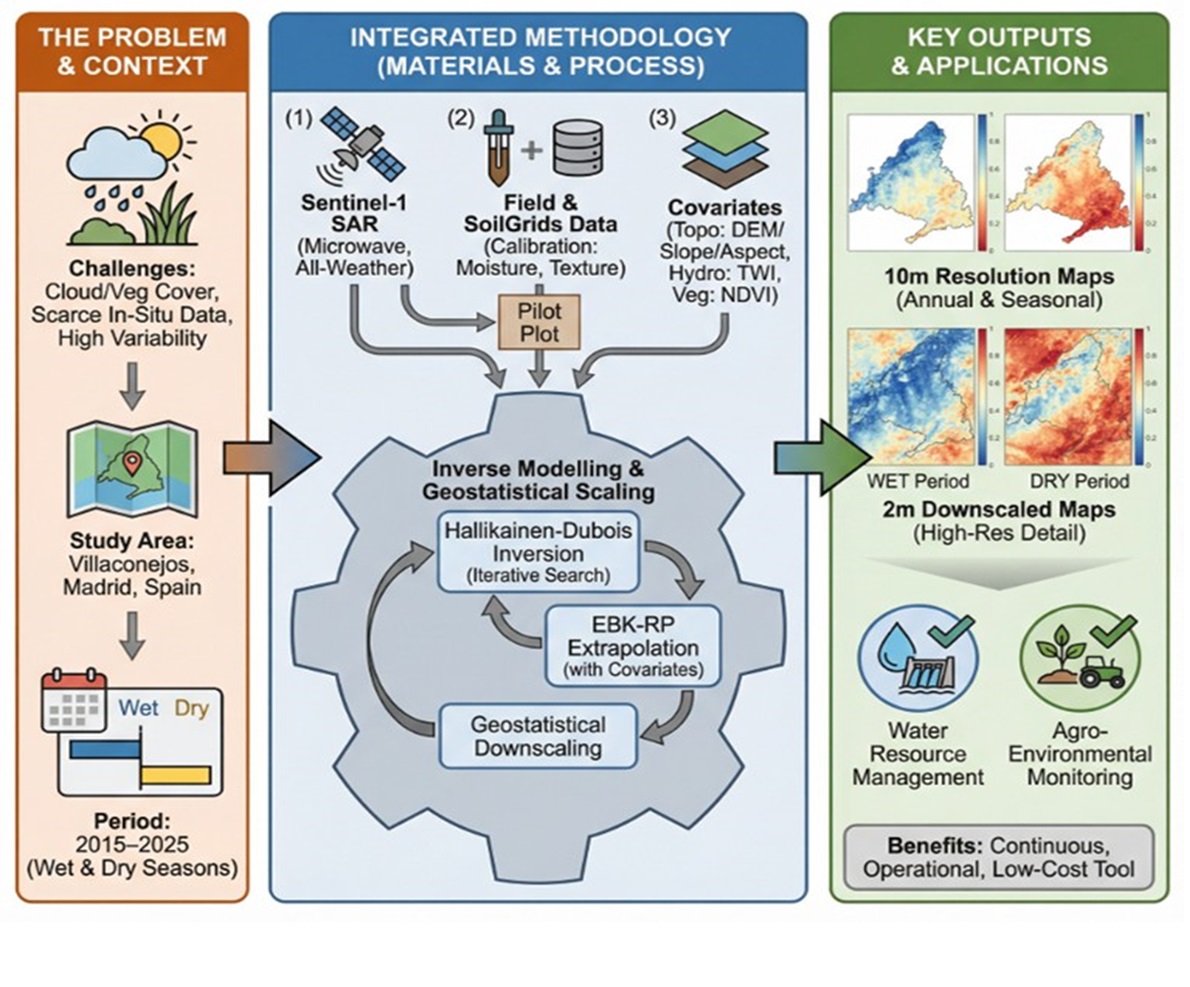
Estimating surface soil moisture in semi-arid regions is challenging due to its high spatial and temporal variability, the scarcity of in-situ measurements, and the limitations of optical sensors in the presence of cloud cover and vegetation cover. Synthetic Aperture Radar (SAR) sensors, such as Sentinel-1, overcome these constraints by operating in the microwave domain and providing high-resolution data regardless of atmospheric conditions or daylight availability. This enables the application of inverse semi-empirical models, notably the Hallikainen model for the soil dielectric constant and the Dubois model for backscattering. This study proposes an integrated methodology applied to the municipality of Villaconejos (Madrid, Spain) over the period 2015–2025. The approach was initially calibrated on a pilot plot near Balcón del Tajo using field measurements of soil moisture and soil texture data (sand and clay content) obtained from the SoilGrids platform. Starting from Sentinel-1 VV and VH backscatter coefficients, the combined Hallikainen–Dubois model is inverted through an iterative search over a range of volumetric soil moisture values (0.02–0.45 m* m*) and surface roughness values (0.85–2 cm), selecting the parameter pair that minimises the difference between modelled and observed backscatter. The calibrated methodology is then extrapolated across the entire municipality of Villaconejos using Empirical Bayesian Kriging Regression Prediction (EBK-RP), incorporating topographic covariates (digital elevation model, slope, aspect), hydrological covariates (Topographic Wetness Index, TWI), and vegetation covariates (NDVI). The results include annual and seasonal maps of near-surface volumetric soil moisture (0–5 cm depth) at 10 m resolution and, after a geostatistical downscaling procedure, at 2 m resolution. Additional outputs comprise analyses of temporal variations between wet and dry periods and spatial patterns related to land use and topography. The developed methodology provides continuous, high-resolution, operational, and low-cost soil moisture estimates, representing a valuable tool for water resource management and agro-environmental monitoring in semi-arid regions.
Keywords:
soil moisture
; synthetic aperture radar
; Sentinel-1
; hallikainen model
; dubois model
; EBK regression prediction
; downscaling
1. Introduction
Surface soil moisture (SSM) is one of the most significant edaphic parameters for understanding the hydrological, ecological, and agronomic processes occurring in terrestrial systems. This parameter directly controls infiltration, evapotranspiration, surface runoff, and the energy balance between the soil surface and the atmosphere; it also influences vegetation development, agricultural productivity, and the ecological stability of the land (Jackson et al., 1996; Porta Casanellas et al., 2019). In agricultural contexts, surface moisture levels near field capacity improve water-use efficiency and reduce crop water stress, whereas prolonged deficits can trigger irreversible soil degradation processes (Porta Casanellas et al., 2019). In semi-arid Mediterranean regions, such as the southeast of the Community of Madrid, SSM exhibits high spatial and temporal variability due to irregular precipitation, climate seasonality, and the progressive increase in temperatures associated with climate change (IPCC, 2021). Under these conditions, monitoring soil moisturethrough traditional in situ techniques is insufficient, both due to high costs and the limited spatial representativeness of point sampling (Hillel, 2004). Radar remote sensing has established itself as an effective alternative for the indirect and multitemporal estimation of surface soil moisture. SAR (Synthetic Aperture Radar) sensors provide spatially distributedinformation regardless of cloud cover or lighting conditions, demonstrating high sensitivity to the dielectric properties of the soil, which are directly related to water content (Zribi et al., 2020; Salgado et al., 2021). Within this framework, the Sentinel-1 satellite, part of the Copernicus program, provides C-band imagery with a spatial resolution of 10 m and a revisit frequency of 6 days—features that are particularly suited for the regular monitoring of SSM in agricultural landscapes (Buah et al., 2020; El Hajj et al., 2017). This study stems from the need to develop a validatable and repeatable methodology for estimating surface soil moisture in Mediterranean agricultural landscapes using Sentinel-1 imagery, following approaches similar to those proposed by Ma et al. (2021) and Graldi et al. (2023). The primary objective is to integrate semi-empirical radar backscatter models with advanced spatial analysis techniques to generate high-resolution SSM mapping with practical utility for sustainable soil management.
2. Study Area
The study area is located in the municipality of Villaconejos, situated in the Las Vegas region in the southeast of the Community of Madrid. This territory is representative of the traditional rain-fed (secano) agricultural systems of the central Iberian Peninsula, characterized by the presence of olive groves, herbaceous crops, Mediterranean scrubland, anextensive areas of bare soil. From a pedological perspective, loamy-clay soils predominate, with moderate to low infiltration capacity, which influences surface moisture retention (Departamento de Edafología, Universidad de Granada, n.d.). The local hydrography consists mostly of temporary streams and ravines that are active only after heavy rainfall, exhibiting a clearly seasonal behavior. At an agro-economic level, Villaconejos maintains an economy historically linked to agriculture, with a predominance of traditional olive groves, family-run farms, and a majority use of rain-fed farming (SIGPAC). This territory shows a marked susceptibility to soil degradation, erosion, and desertification processes, making it an especially suitable setting for the application and evaluation of surface moisture estimation methodologies through remote sensing (Salgado, 1998; European Commission, 2019; Ministry for the Ecological Transition and the Demographic Challenge, 2025).
Figure 1.
Location of the pilot plot (A), the municipality of Villaconejos (B), and the Community of Madrid (C).
Figure 1.
Location of the pilot plot (A), the municipality of Villaconejos (B), and the Community of Madrid (C).
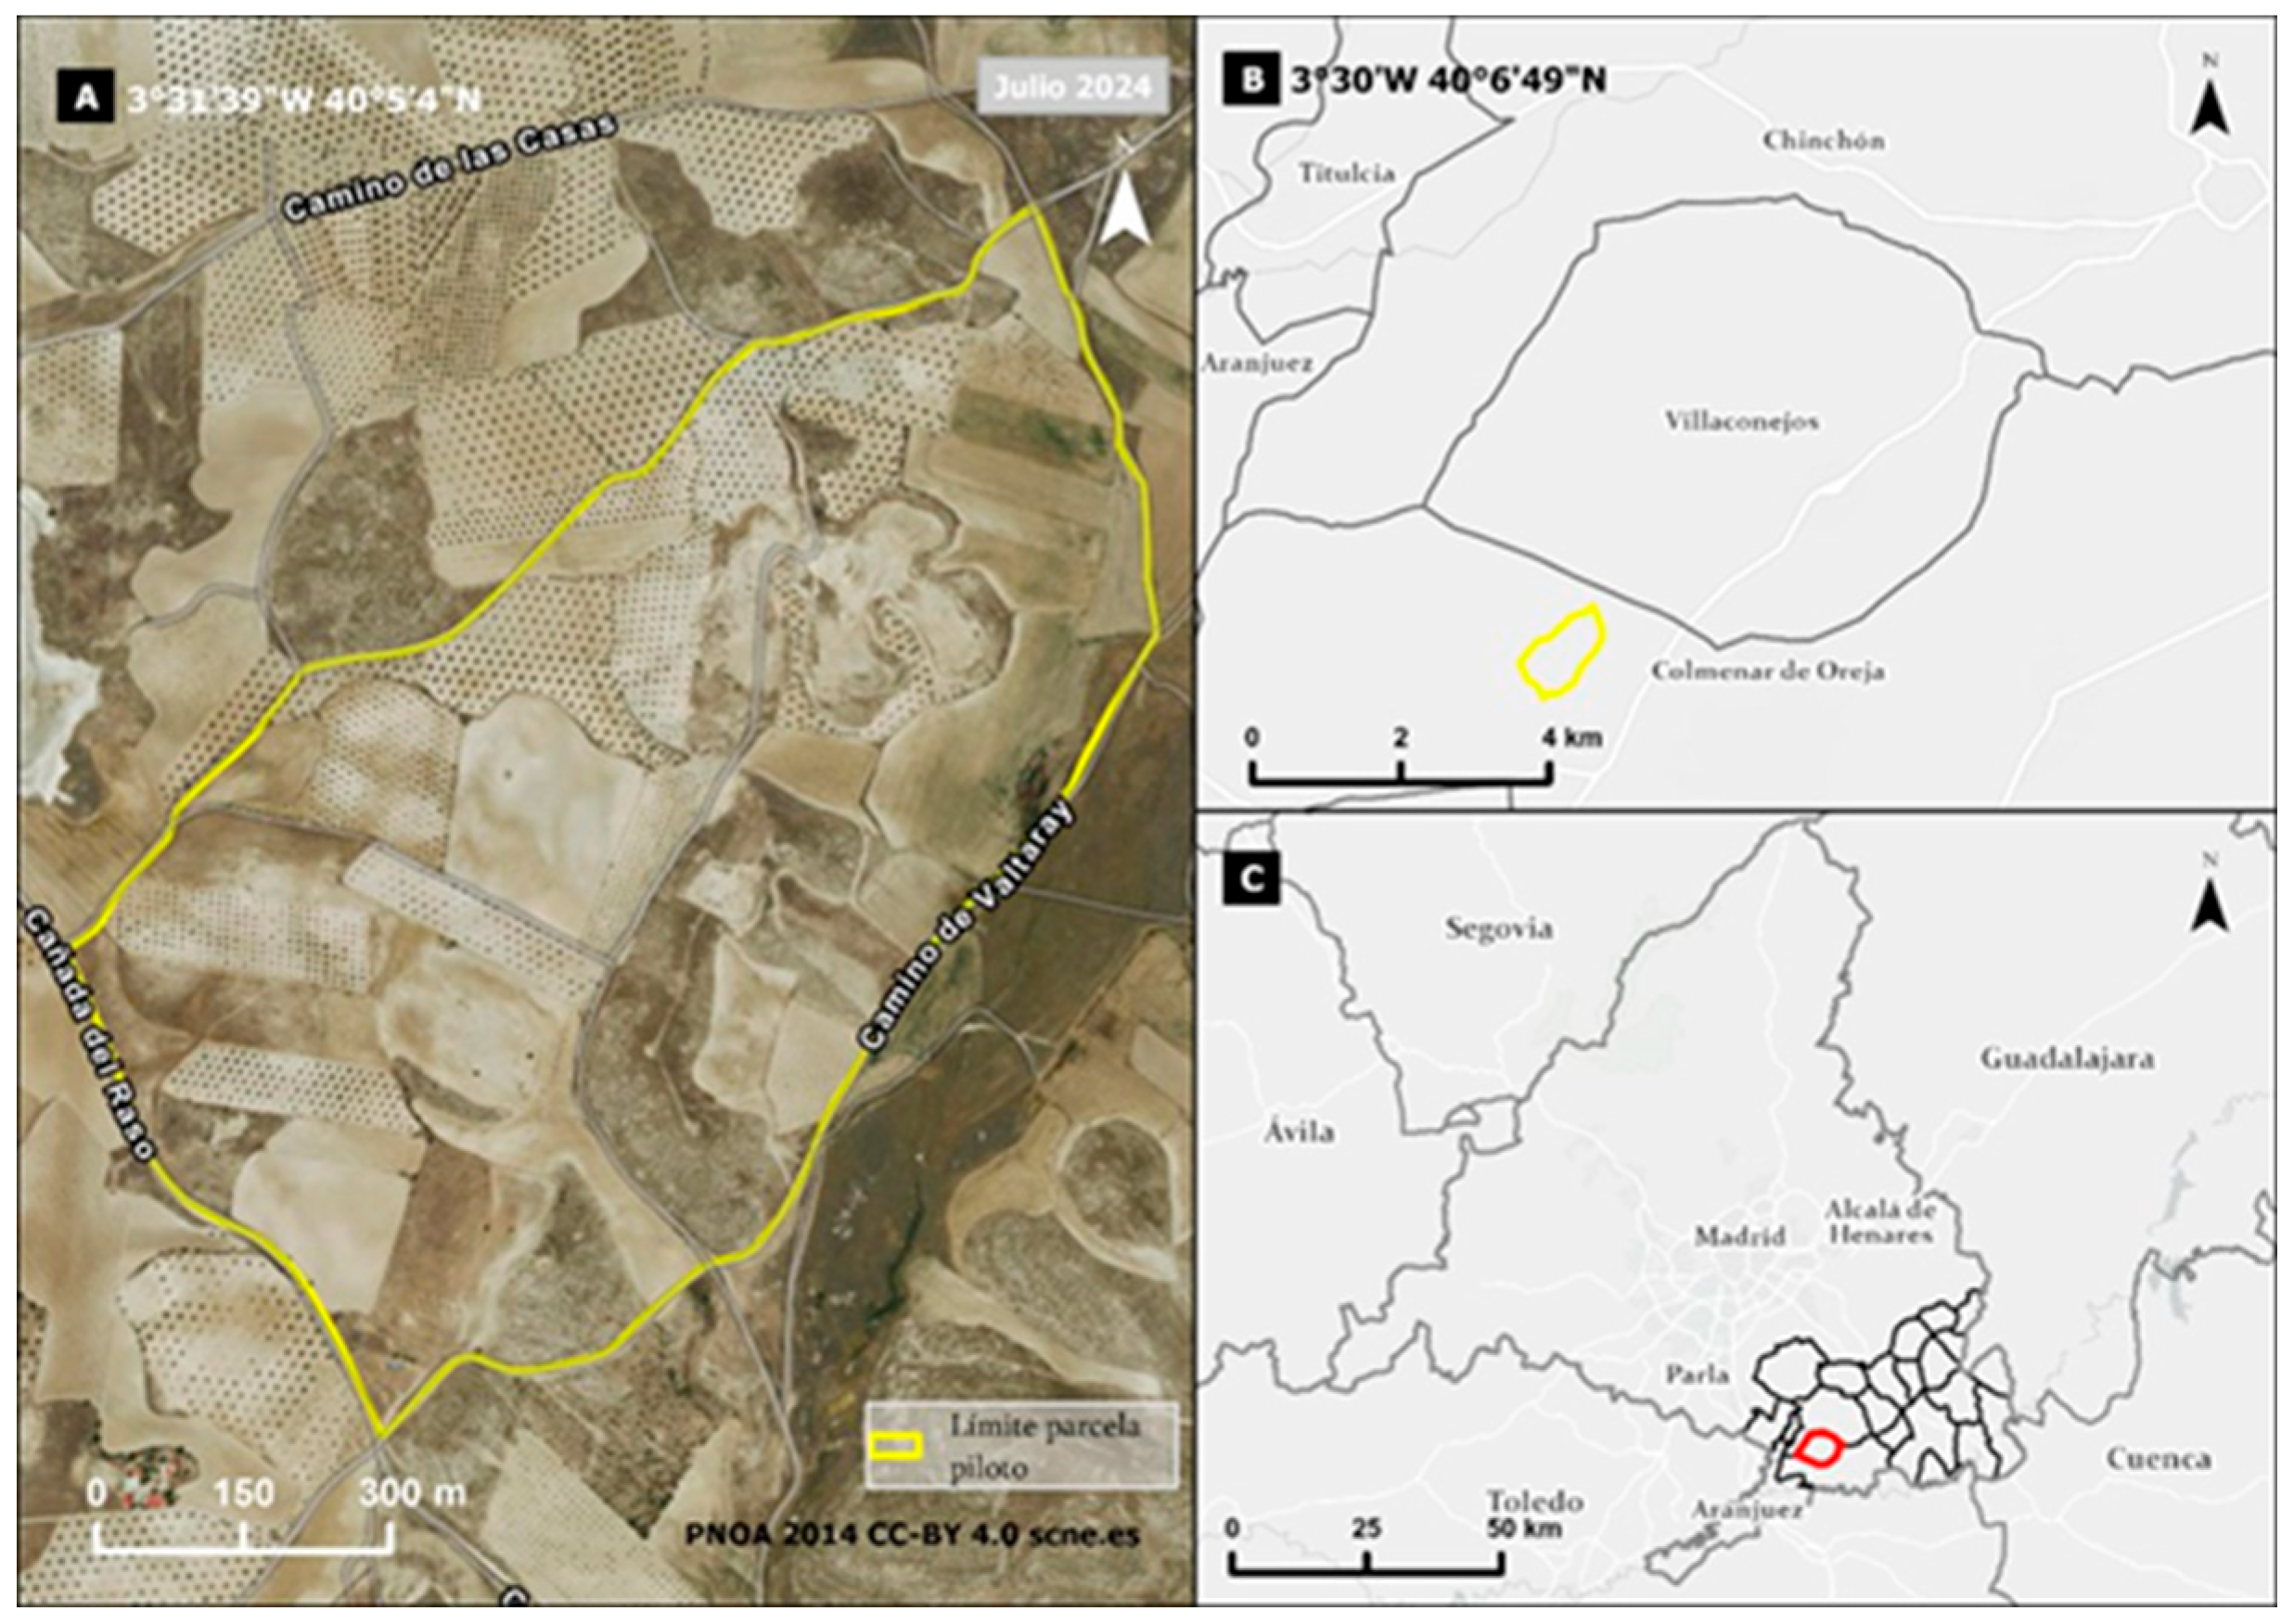
Figure 2.
Land use of the study plot (sioseAR 2016-2018 CC-BY 4.0).
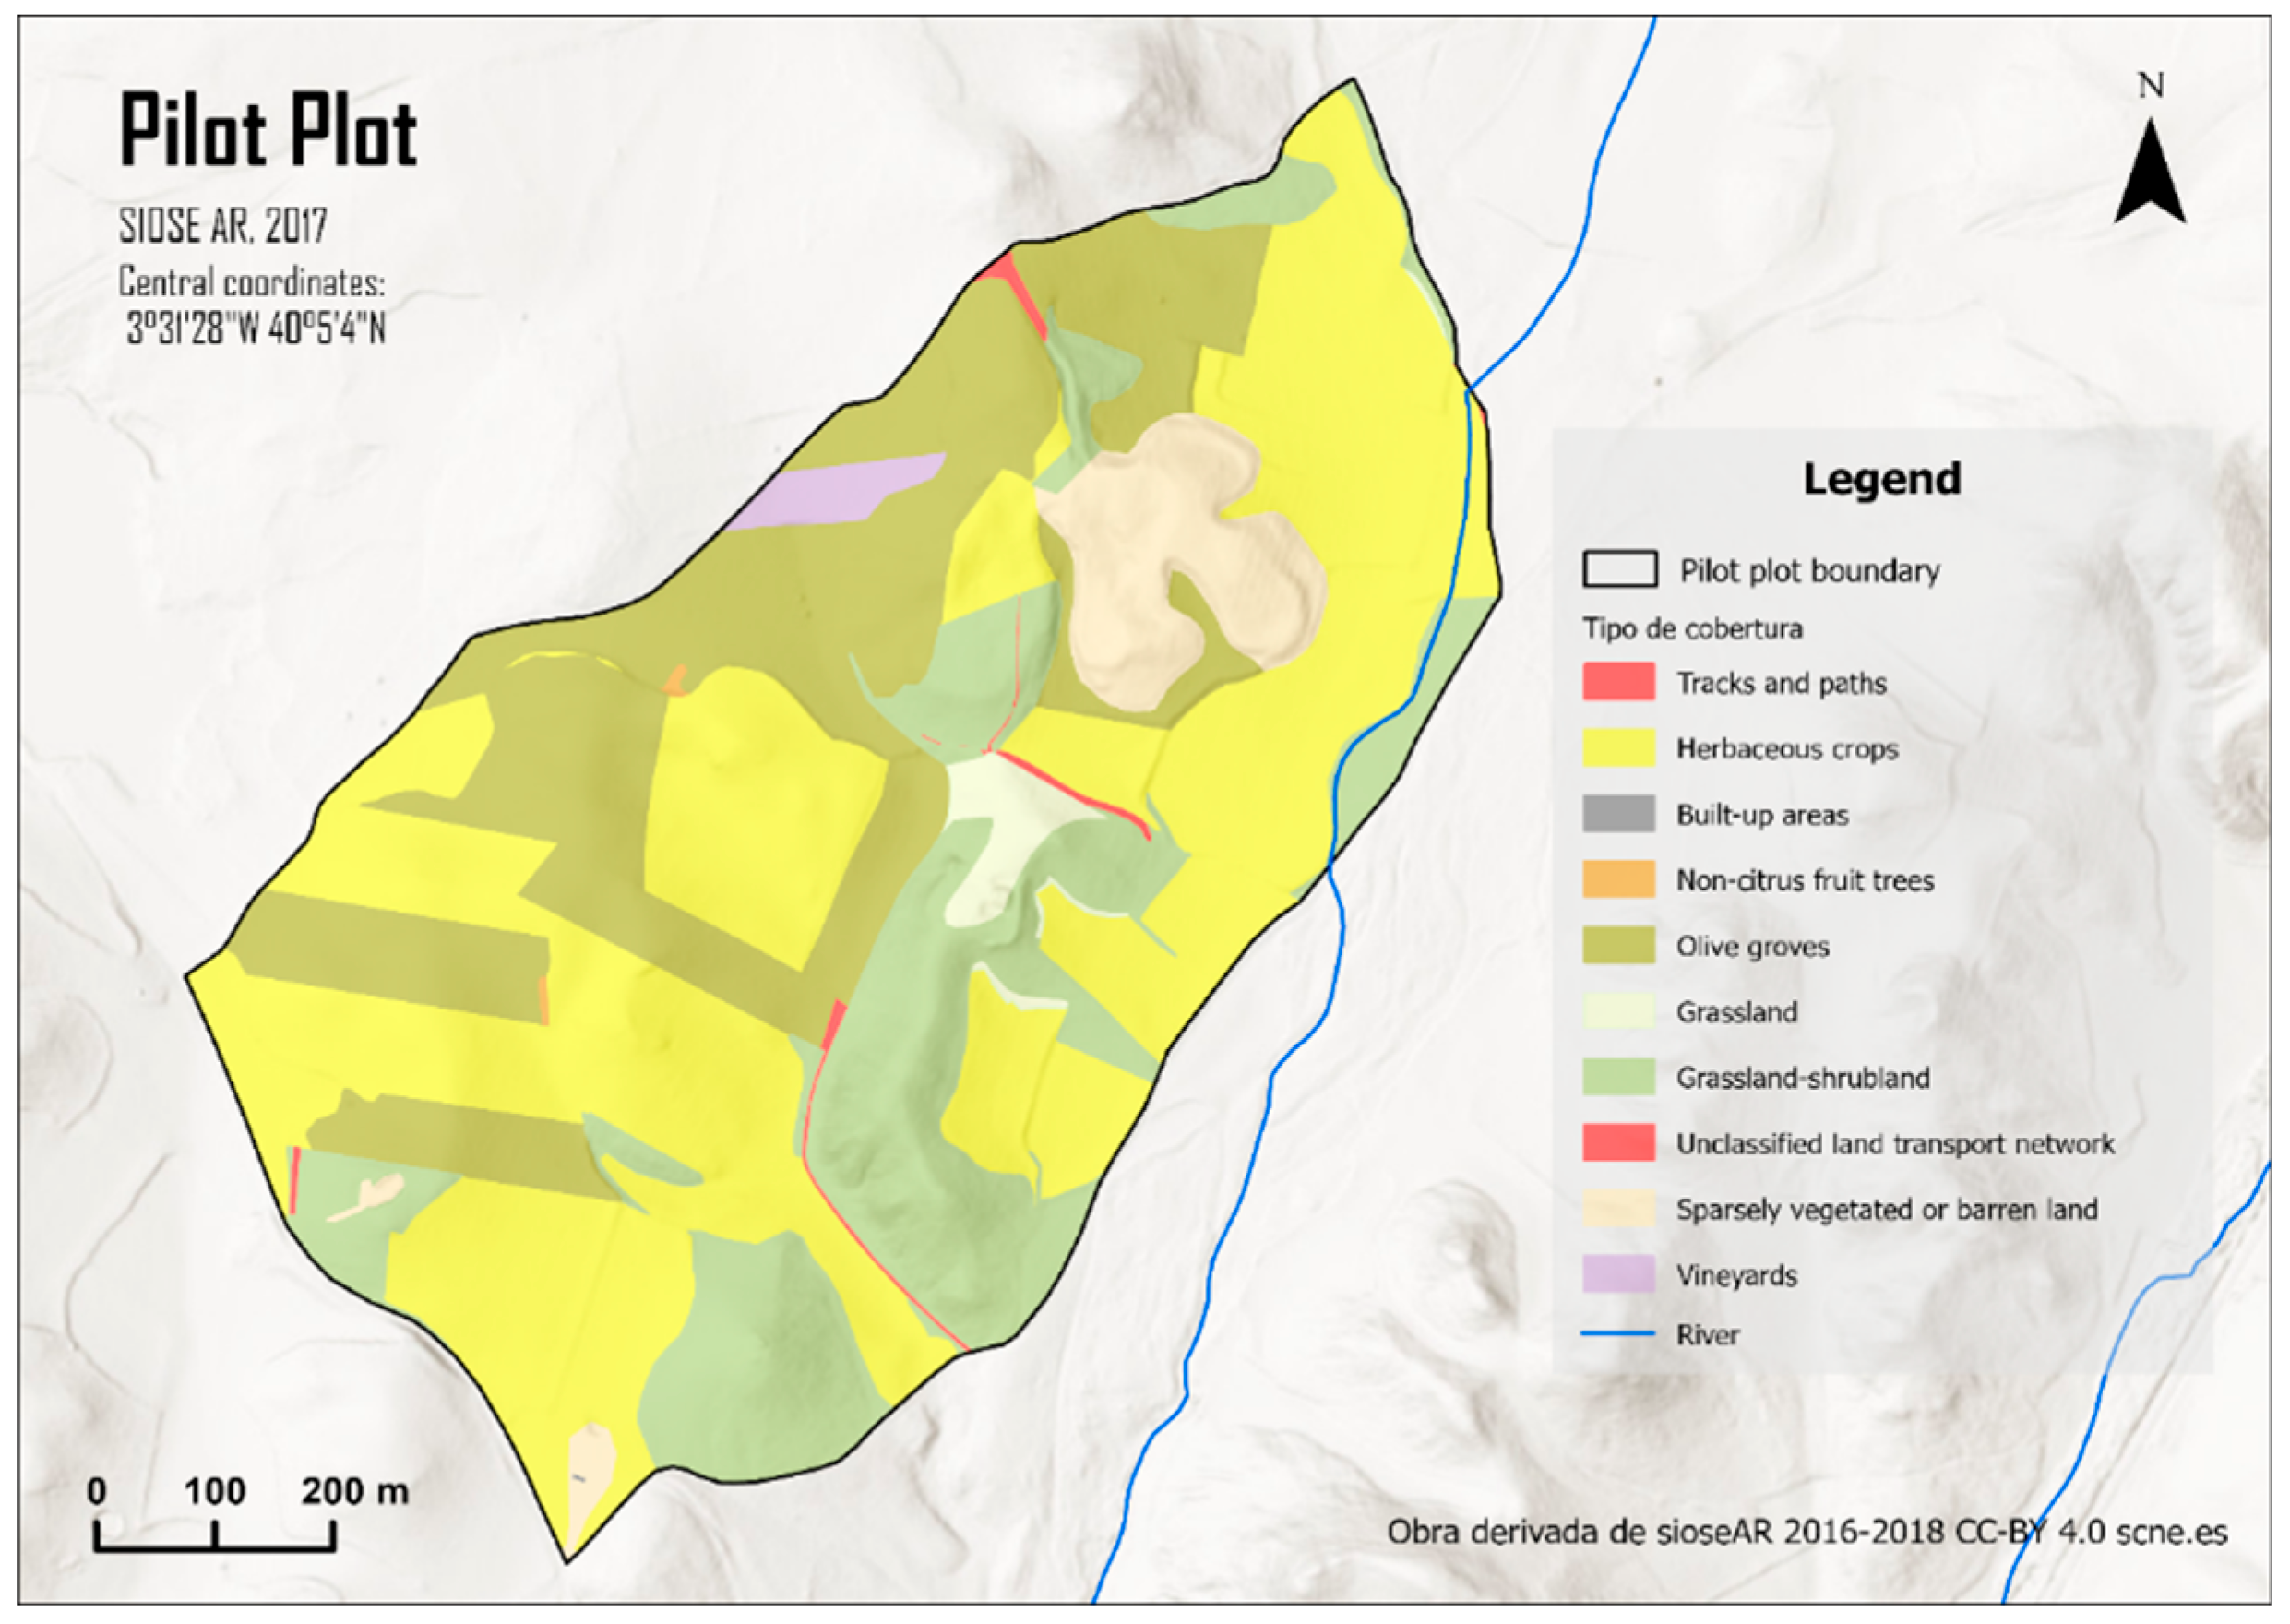
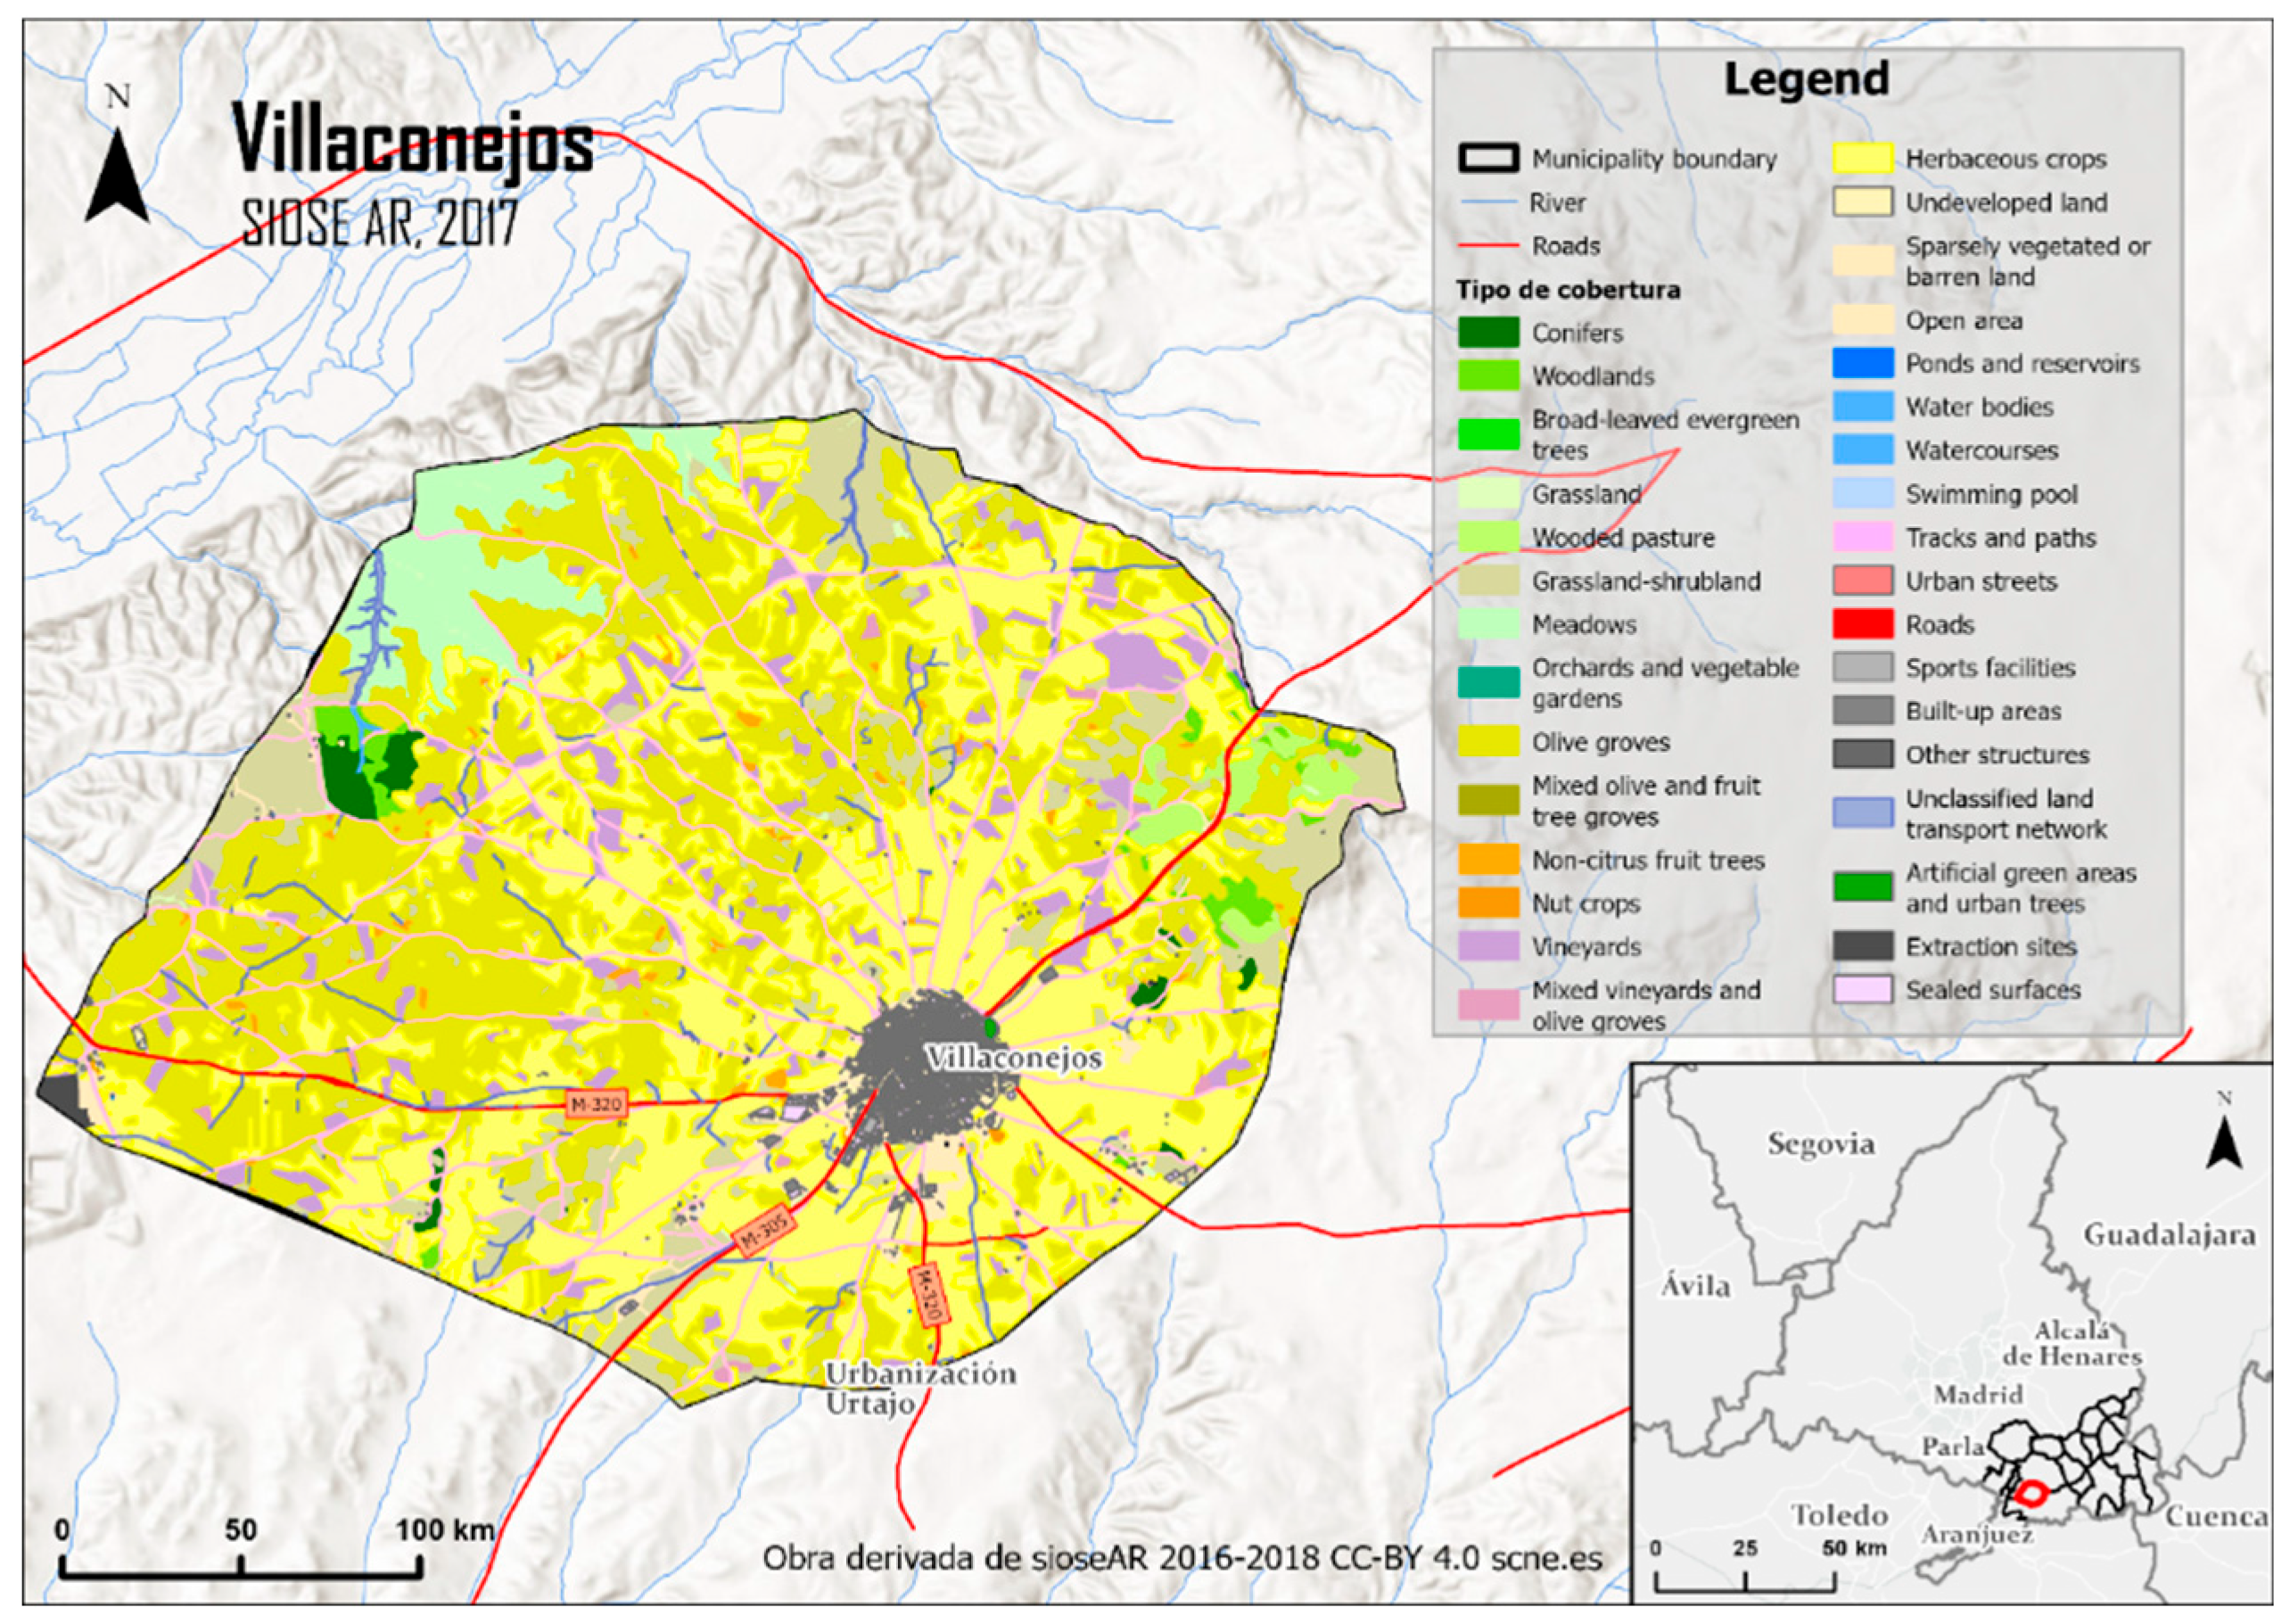
Figure 3.
Land use of the municipality of Villaconejos (sioseAR 2016-2018 CC-BY 4.0).
3. Materials and Methods
3.1. Data Sources
For the development of this study, 12 Sentinel-1 radar images and 12 Sentinel-2 multispectral images were used, downloaded via the Copernicus Browser platform. The Sentinel-1 images correspond to the GRD (Ground Range Detected) product, featuring VV polarization, incidence angles of approximately 39°–40°, and C-band frequency (Sentinel-1 Team, 2013). Additionally, digital terrain models, PNOA orthophotographs, SIGPAC data, SIOSE AR land cover layers, and edaphic properties from the SoilGrids platform were employed. Sand (335 g/kg) and clay (208 g/kg) values were obtained from SoilGrids at a spatial resolution of 250 m, based on digital soil mapping and machine learning techniques (Poggio et al., 2021; ISRIC, 2020).
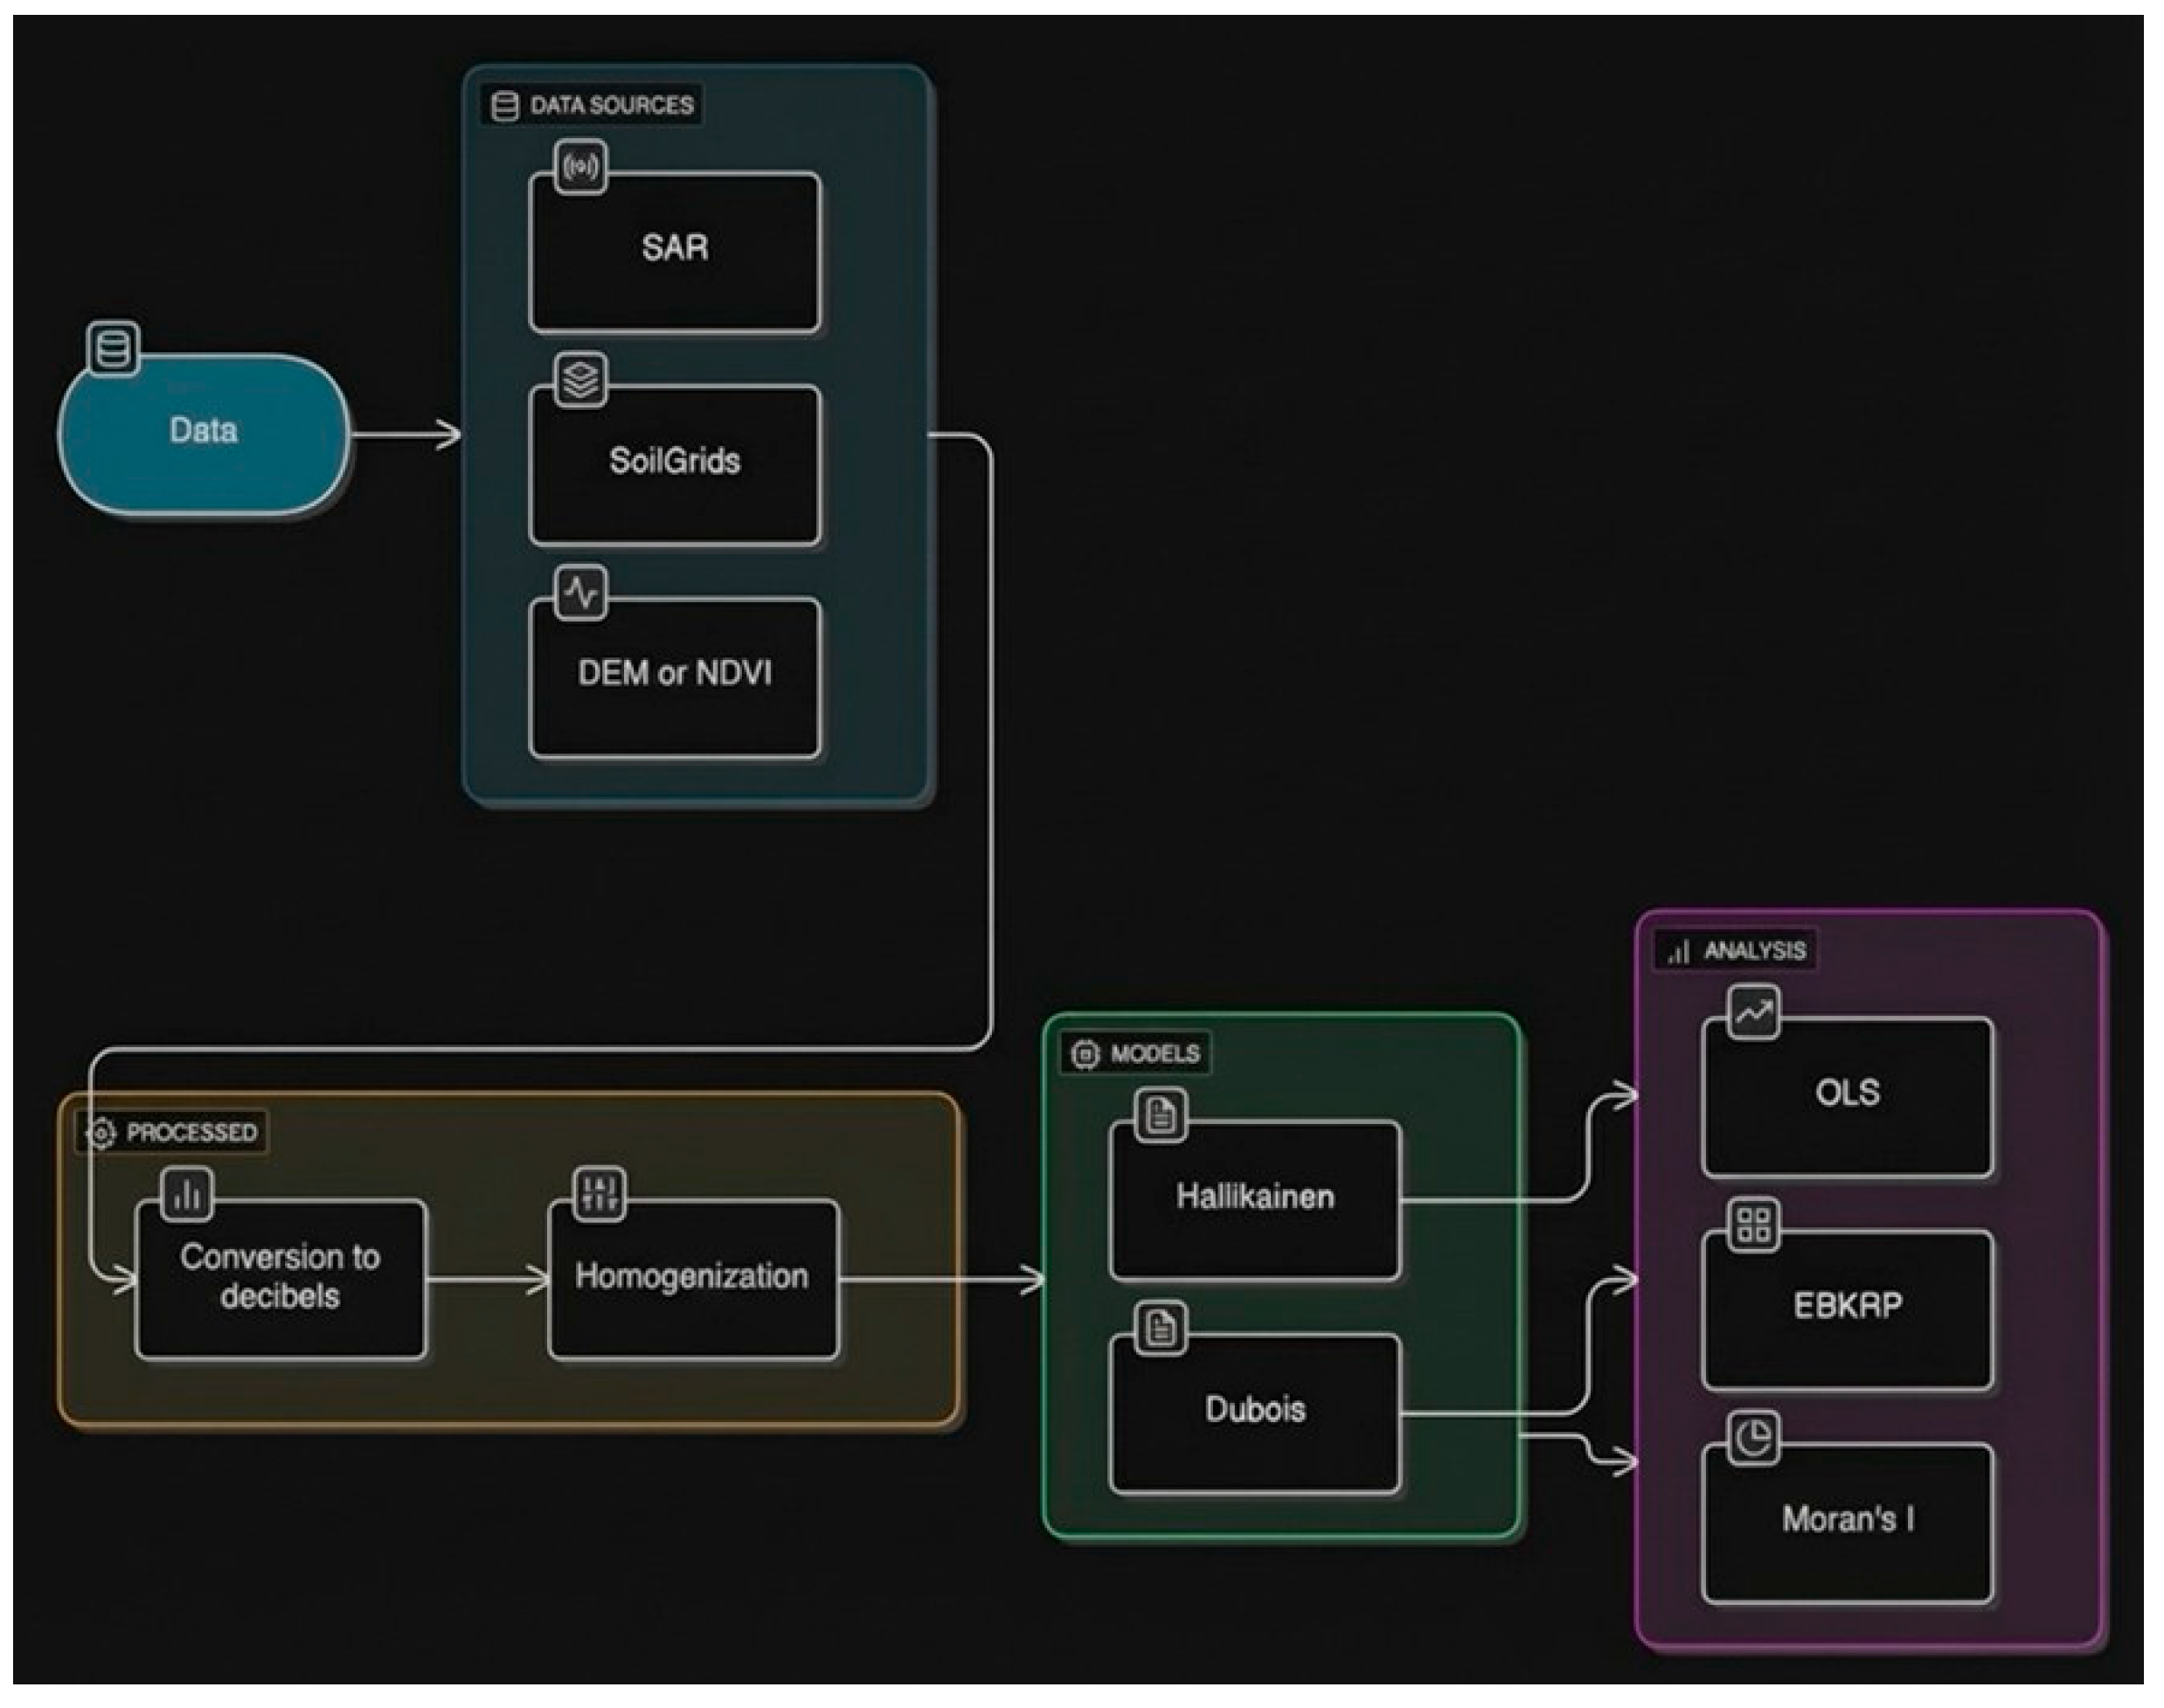
Figure 4.
Workflow diagram of the study.
3.2. SAR Images Preprocessing
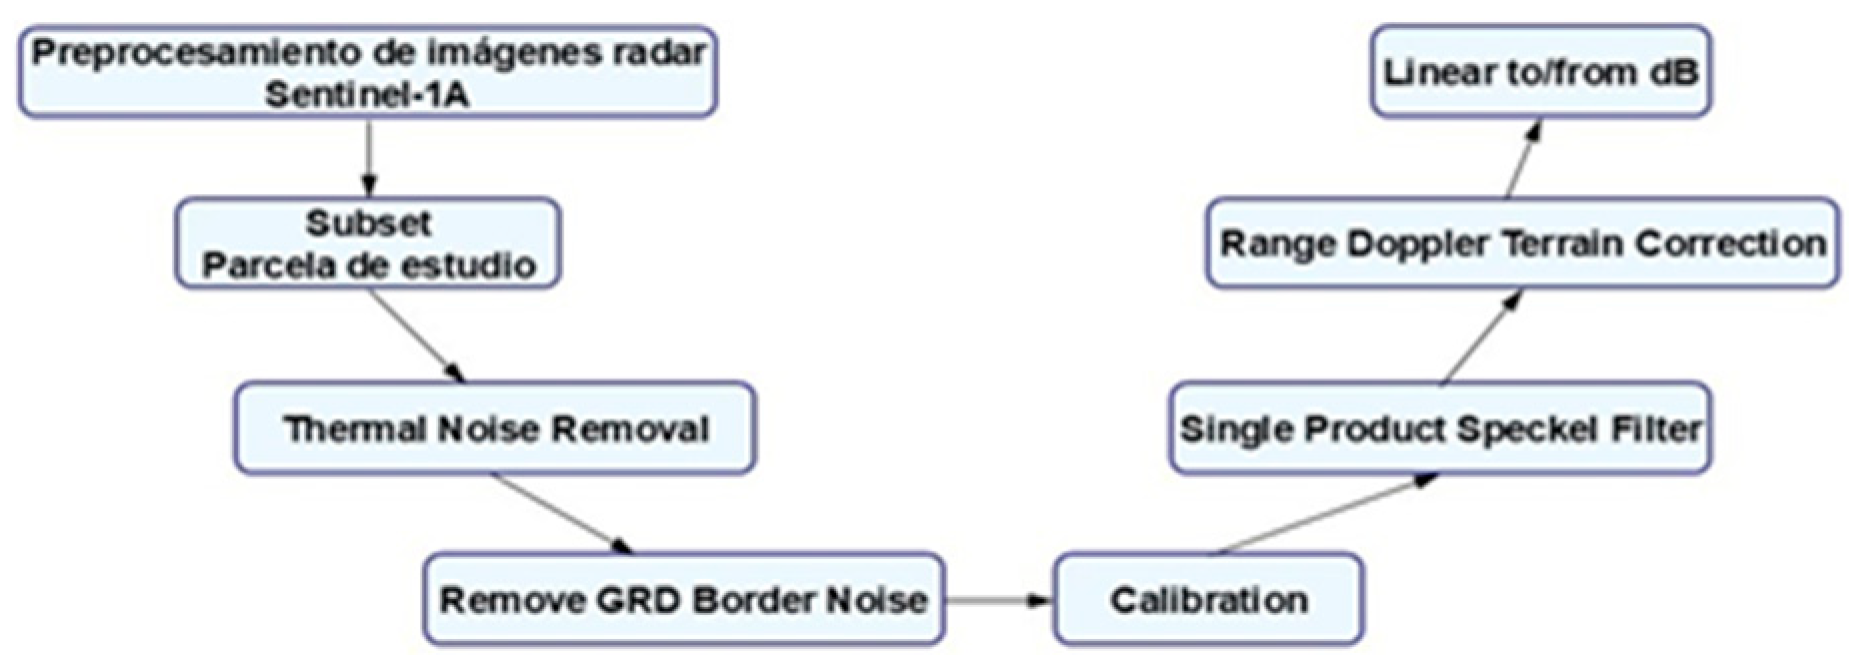
SAR images exhibit a characteristic type of noise known as speckle noise, which appears as a random granular pattern and complicates both visual interpretation and quantitative analysis (Santana, 2016). To mitigate this effect, a Single Product Speckle Filter was applied using the SNAP software. Furthermore, Range Doppler Terrain Correction was performed using SRTM digital elevation models to correct geometric distortions resulting from topography and the sensor’s acquisition angle (ESA, 2023). Finally, the backscatter values were converted from linear units to decibels (dB) to facilitate their analysis, comparison, and cartographic representation.
Figure 5.
Workflow diagram for Sentinel-1A image preprocessing in SNAP. Source: Author.
3.3. Selection of Wet and Dry Periods
The image acquisition dates were selected by distinguishing between a wet period (February–May) and a dry period (June–August), taking into account the absence or presence of prior precipitation based on historical data from AEMET (Annex 9.2).
3.4. Surface Moisture Estimation
The estimation of SSM was carried out by combining the Hallikainen and Dubois semi-empirical models. The Hallikainen model allows for relating the soil dielectric constant to its moisture content, while the Dubois model links radar backscatter to soil moisture and surface roughness. Given that moisture is an unknown variable, the Hallikainen model was applied inversely through an iterative process.
sin3 θ
ε′ = (a0 + a1S + a2C) + (b0 + b1S + b2C)mv + (c0 + c1S + c2C)m2
σ0(VV) = 10−2.35 cos3θ 100.046ε tan θ (ks sin θ)1.1λ0.7
3.5. Geostatistical Analysis and Downscaling
To improve the spatial resolution of the estimates, regression and geostatistical techniques were applied. First, an Ordinary Least Squares (OLS) regression was used as a diagnostic analysis. Subsequently, the Empirical Bayesian Kriging Regression Prediction (EBK-RP) method was implemented, incorporating explanatory variables such as slope, aspect, DEM, TWI, and NDVI (Krivoruchko, 2012).
4. Results
The results obtained show high spatial and temporal variability of surface soil moisture across the study area. The estimated values ranged from 0.02 to 0.45 m*/m*, which is consistent with the typical ranges found in semi-arid agricultural soils (Santana, 2016).
4.1. Radar Backscatter Analysis
Backscatter values in decibels were mostly within low to moderate ranges (below -10 dB), which is consistent with rain-fed agricultural surfaces and soils of medium roughness. The comparison of the observed values with the thresholds proposed by Santana (2016) allowed for the validation of the consistency of the results obtained.

Table 1.
Backscatter coefficient levels for typical scenarios (Santana, 2016).
| Backscatter Level | Typical Scenario |
| Very High (> −5 dB) | Anthropic structures, mountains, slopes facing the sensor. |
| High (−10 to 0 dB) | Rough surface. Dense vegetation (forests). |
| Moderate (−20 to −10 dB) | Intermediate vegetation. Agricultural crops. |
| Low (< −20 dB) | Flat surfaces, calm water, roads, dry sand. |
Table 2.
Observed backscatter ranges for each captured image.
| Image Acquisition Date | Observed Backscatter Range (dB) |
| 2015-03-22 | (-14,17 a 1,28) |
| 2015-07-26 | (-17,42 a 0,27) |
| 2017-05-04 | (-19,88 a -2,93) |
| 2017-08-08 | (-16,95 a -1,29) |
| 2019-04-24 | (-13,96 a 1,02) |
| 2019-06-29 | (-16,08 a 0,3) |
| 2021-04-25 | (-16,96 a -1,9) |
| 2021-08-05 | (-16,19 a -1,34) |
| 2023-05-27 | (-16,49 a -2,08) |
| 2023-08-19 | (-16,71 a -0,68) |
| 2025-03-11 | (-16,43 a -1,09) |
| 2025-06-03 | (-17,04 a -1,61) |
4.2. Spatial Estimation of Surface Moisture
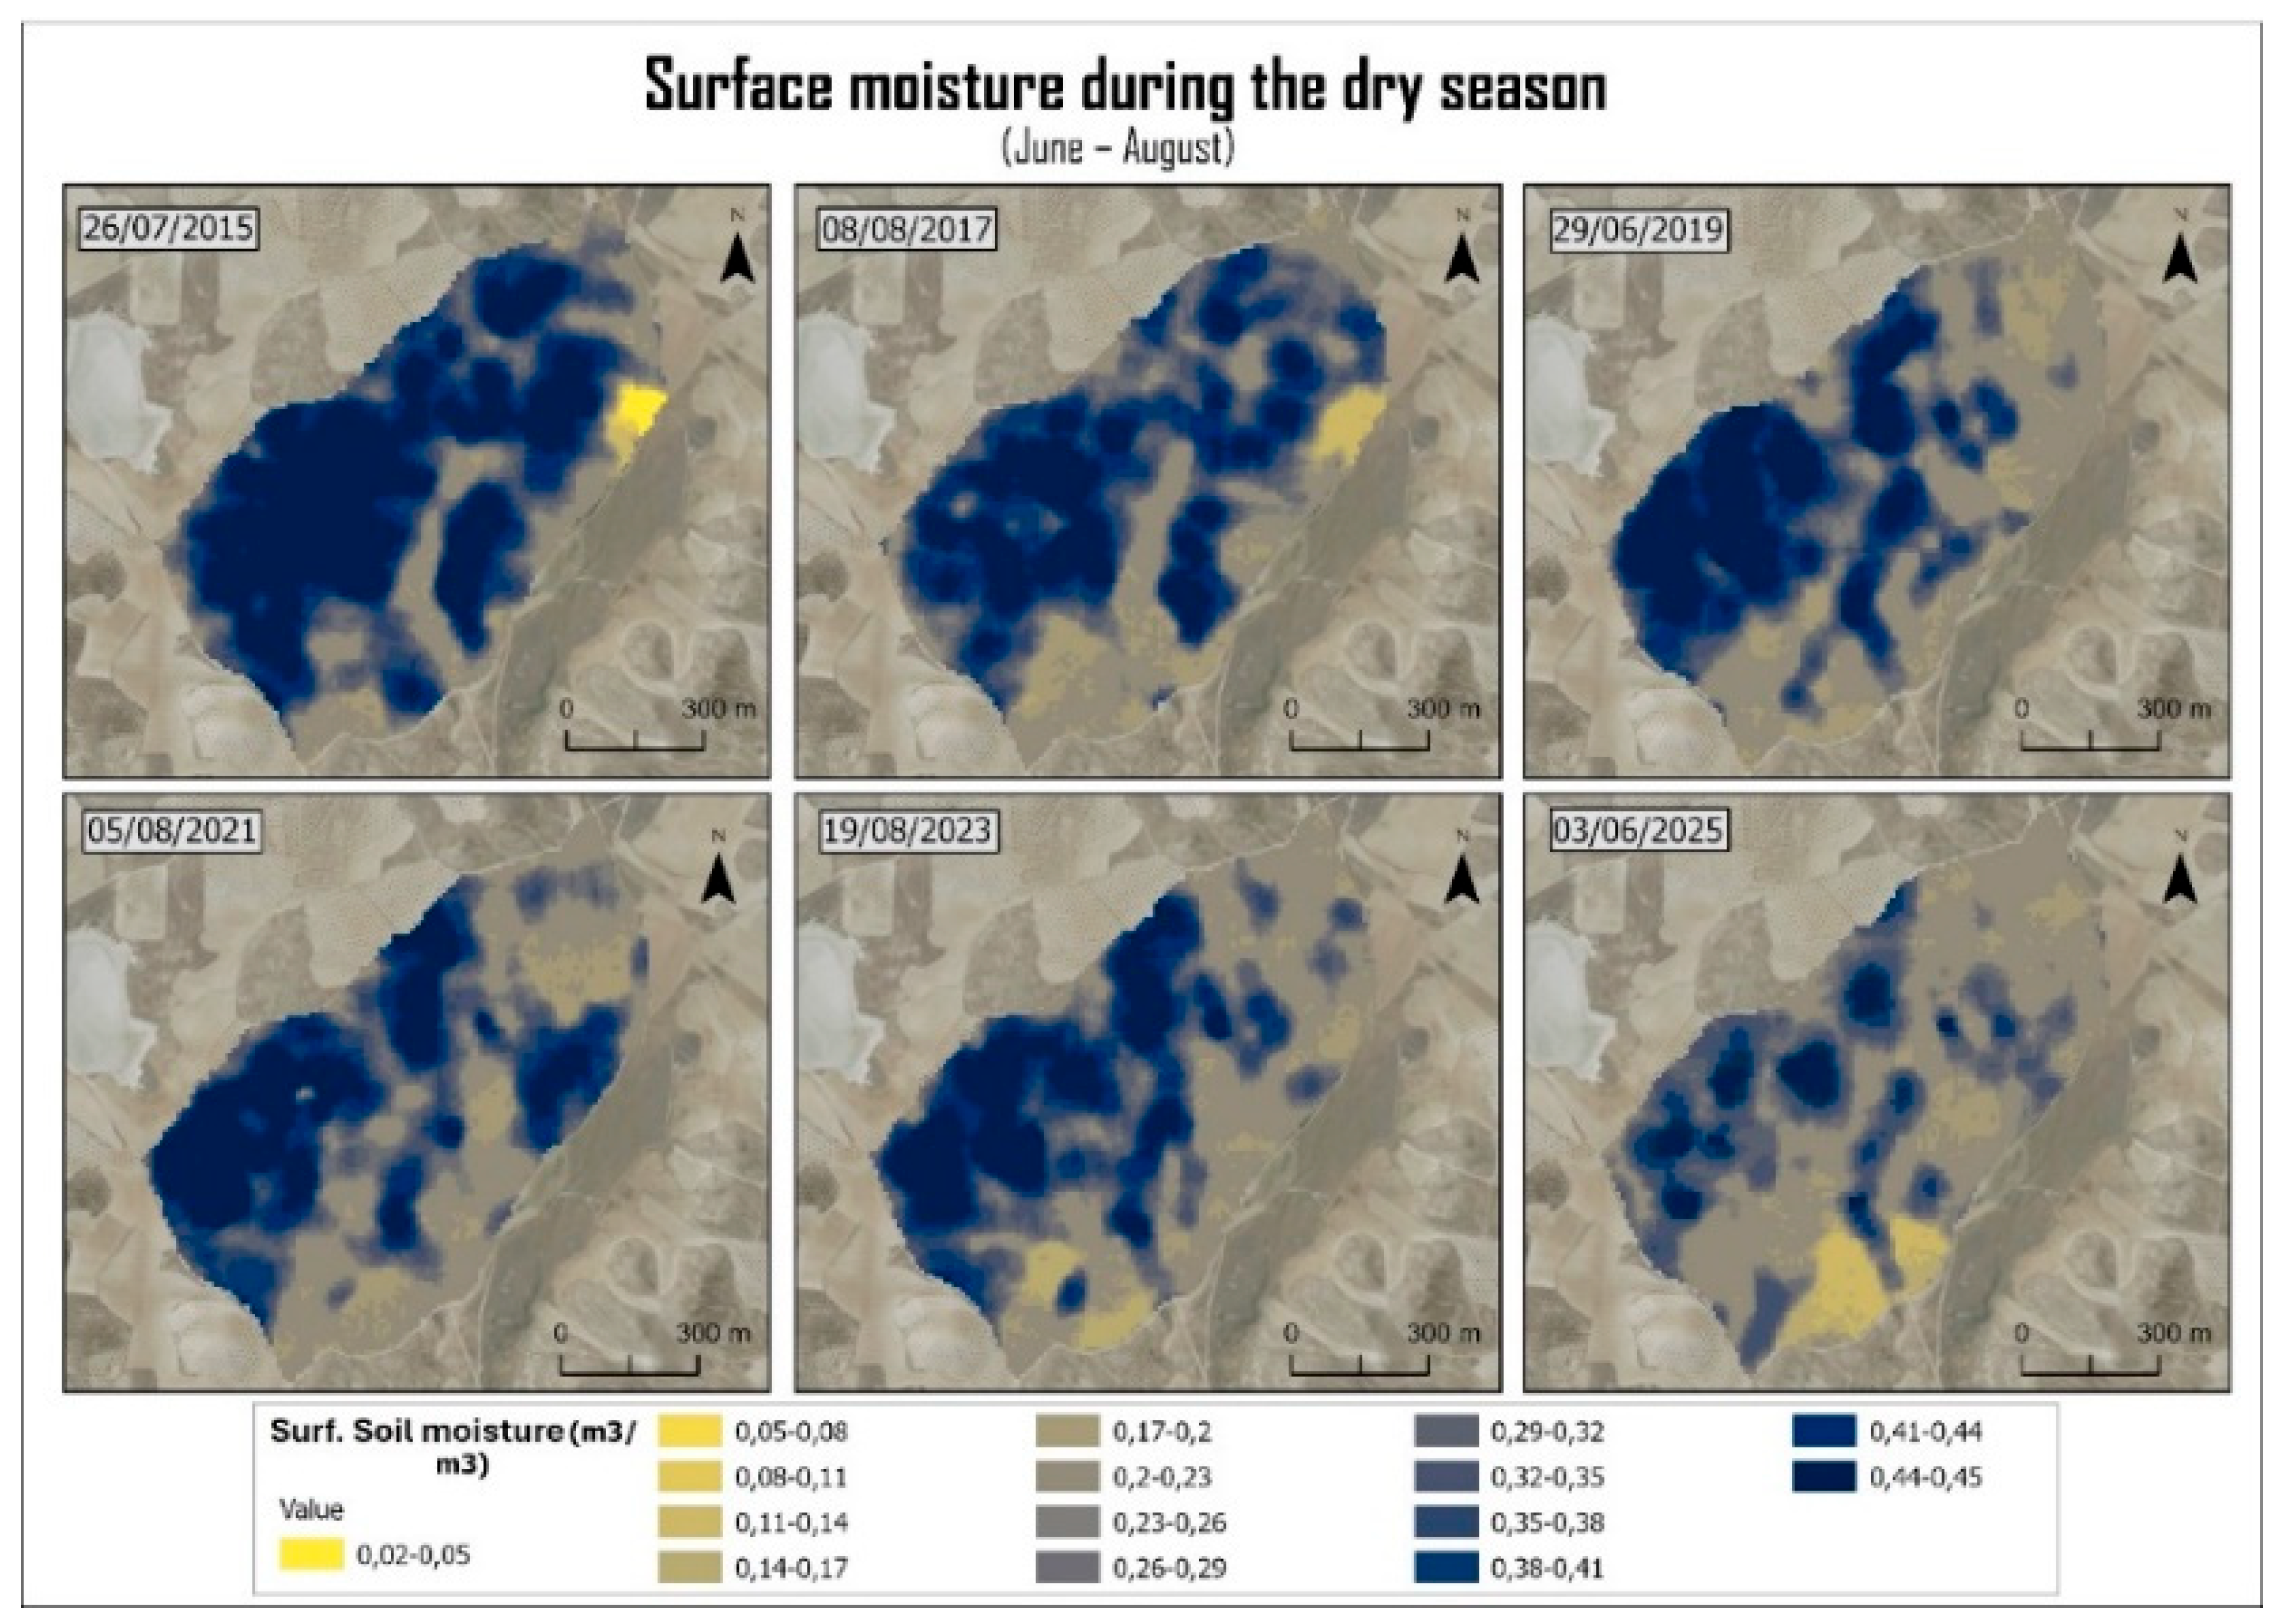
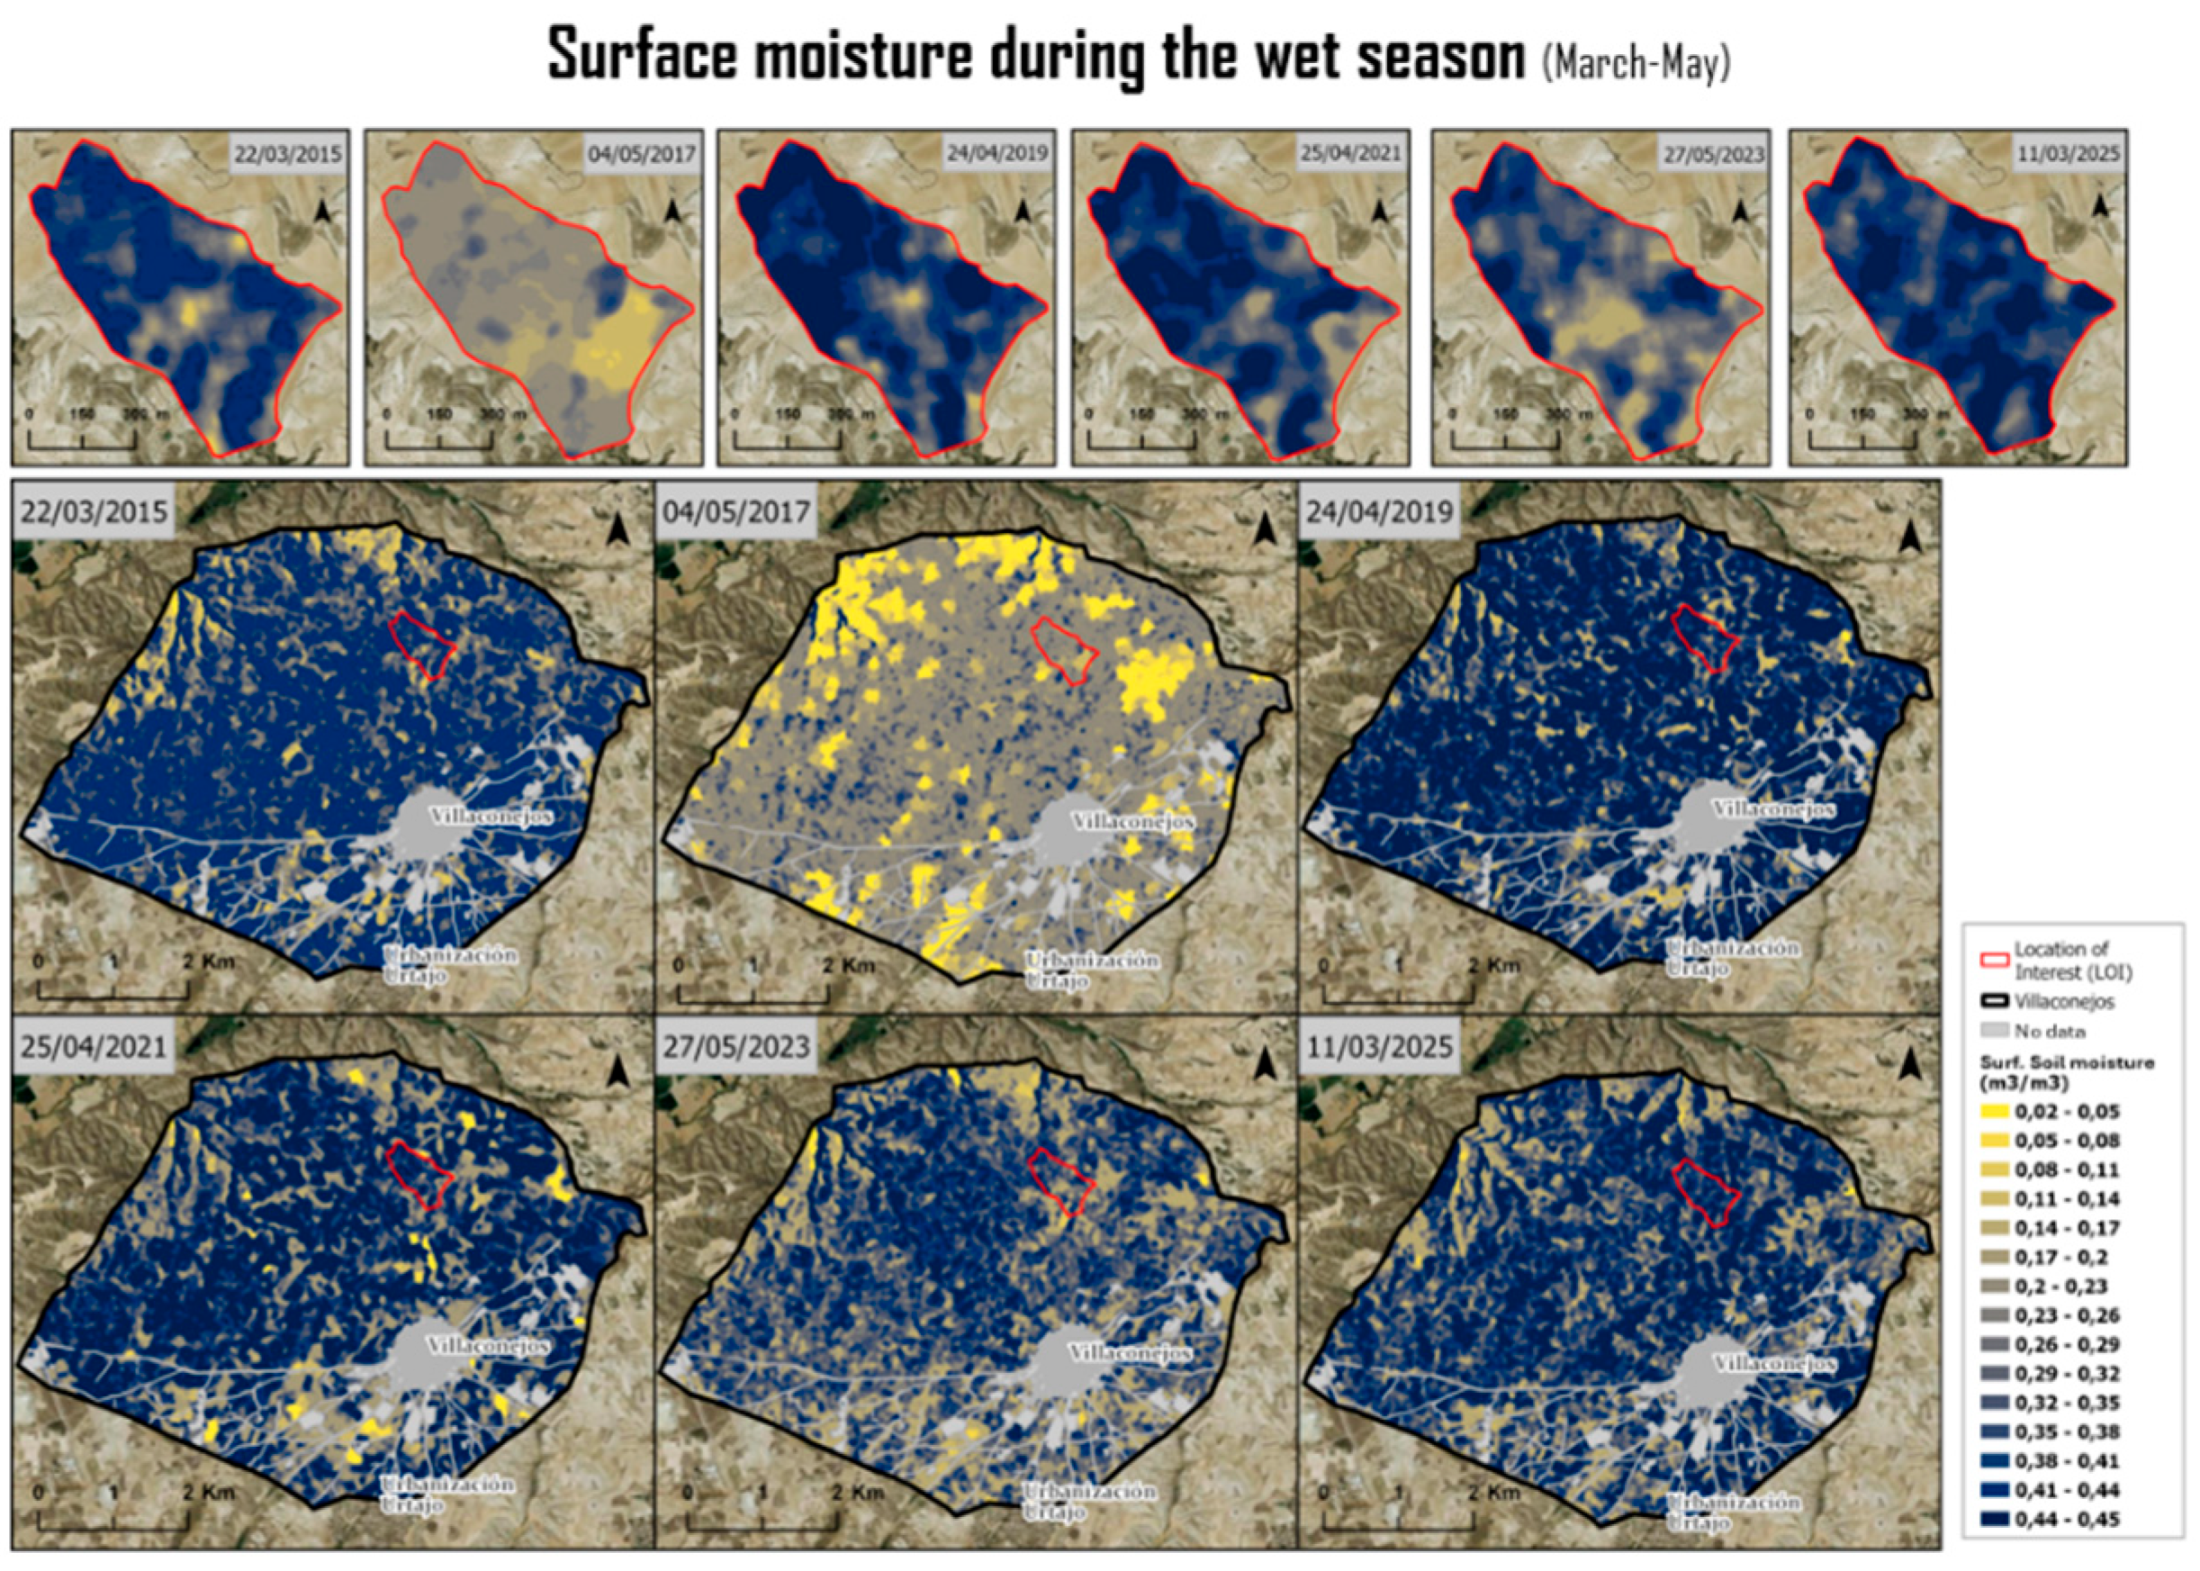
The application of the Hallikainen and Dubois models enabled the generation of continuous SSM maps for each analyzed date. During wet periods (February–May), mean values ranged between 0.33 and 0.45 m*/m*, whereas in dry periods, they decreased to values between 0.02 and 0.20 m*/m*. In the pilot plot, a direct response of SSM to precipi- tation events was observed; however, when scaling the analysis to the municipality level, complex spatial patterns were detected, with higher moisture values in topographically convergent areas and lower values on exposed slopes.
Figure 6.
Cartographic composition of surface moisture during the dry period in the study plot.
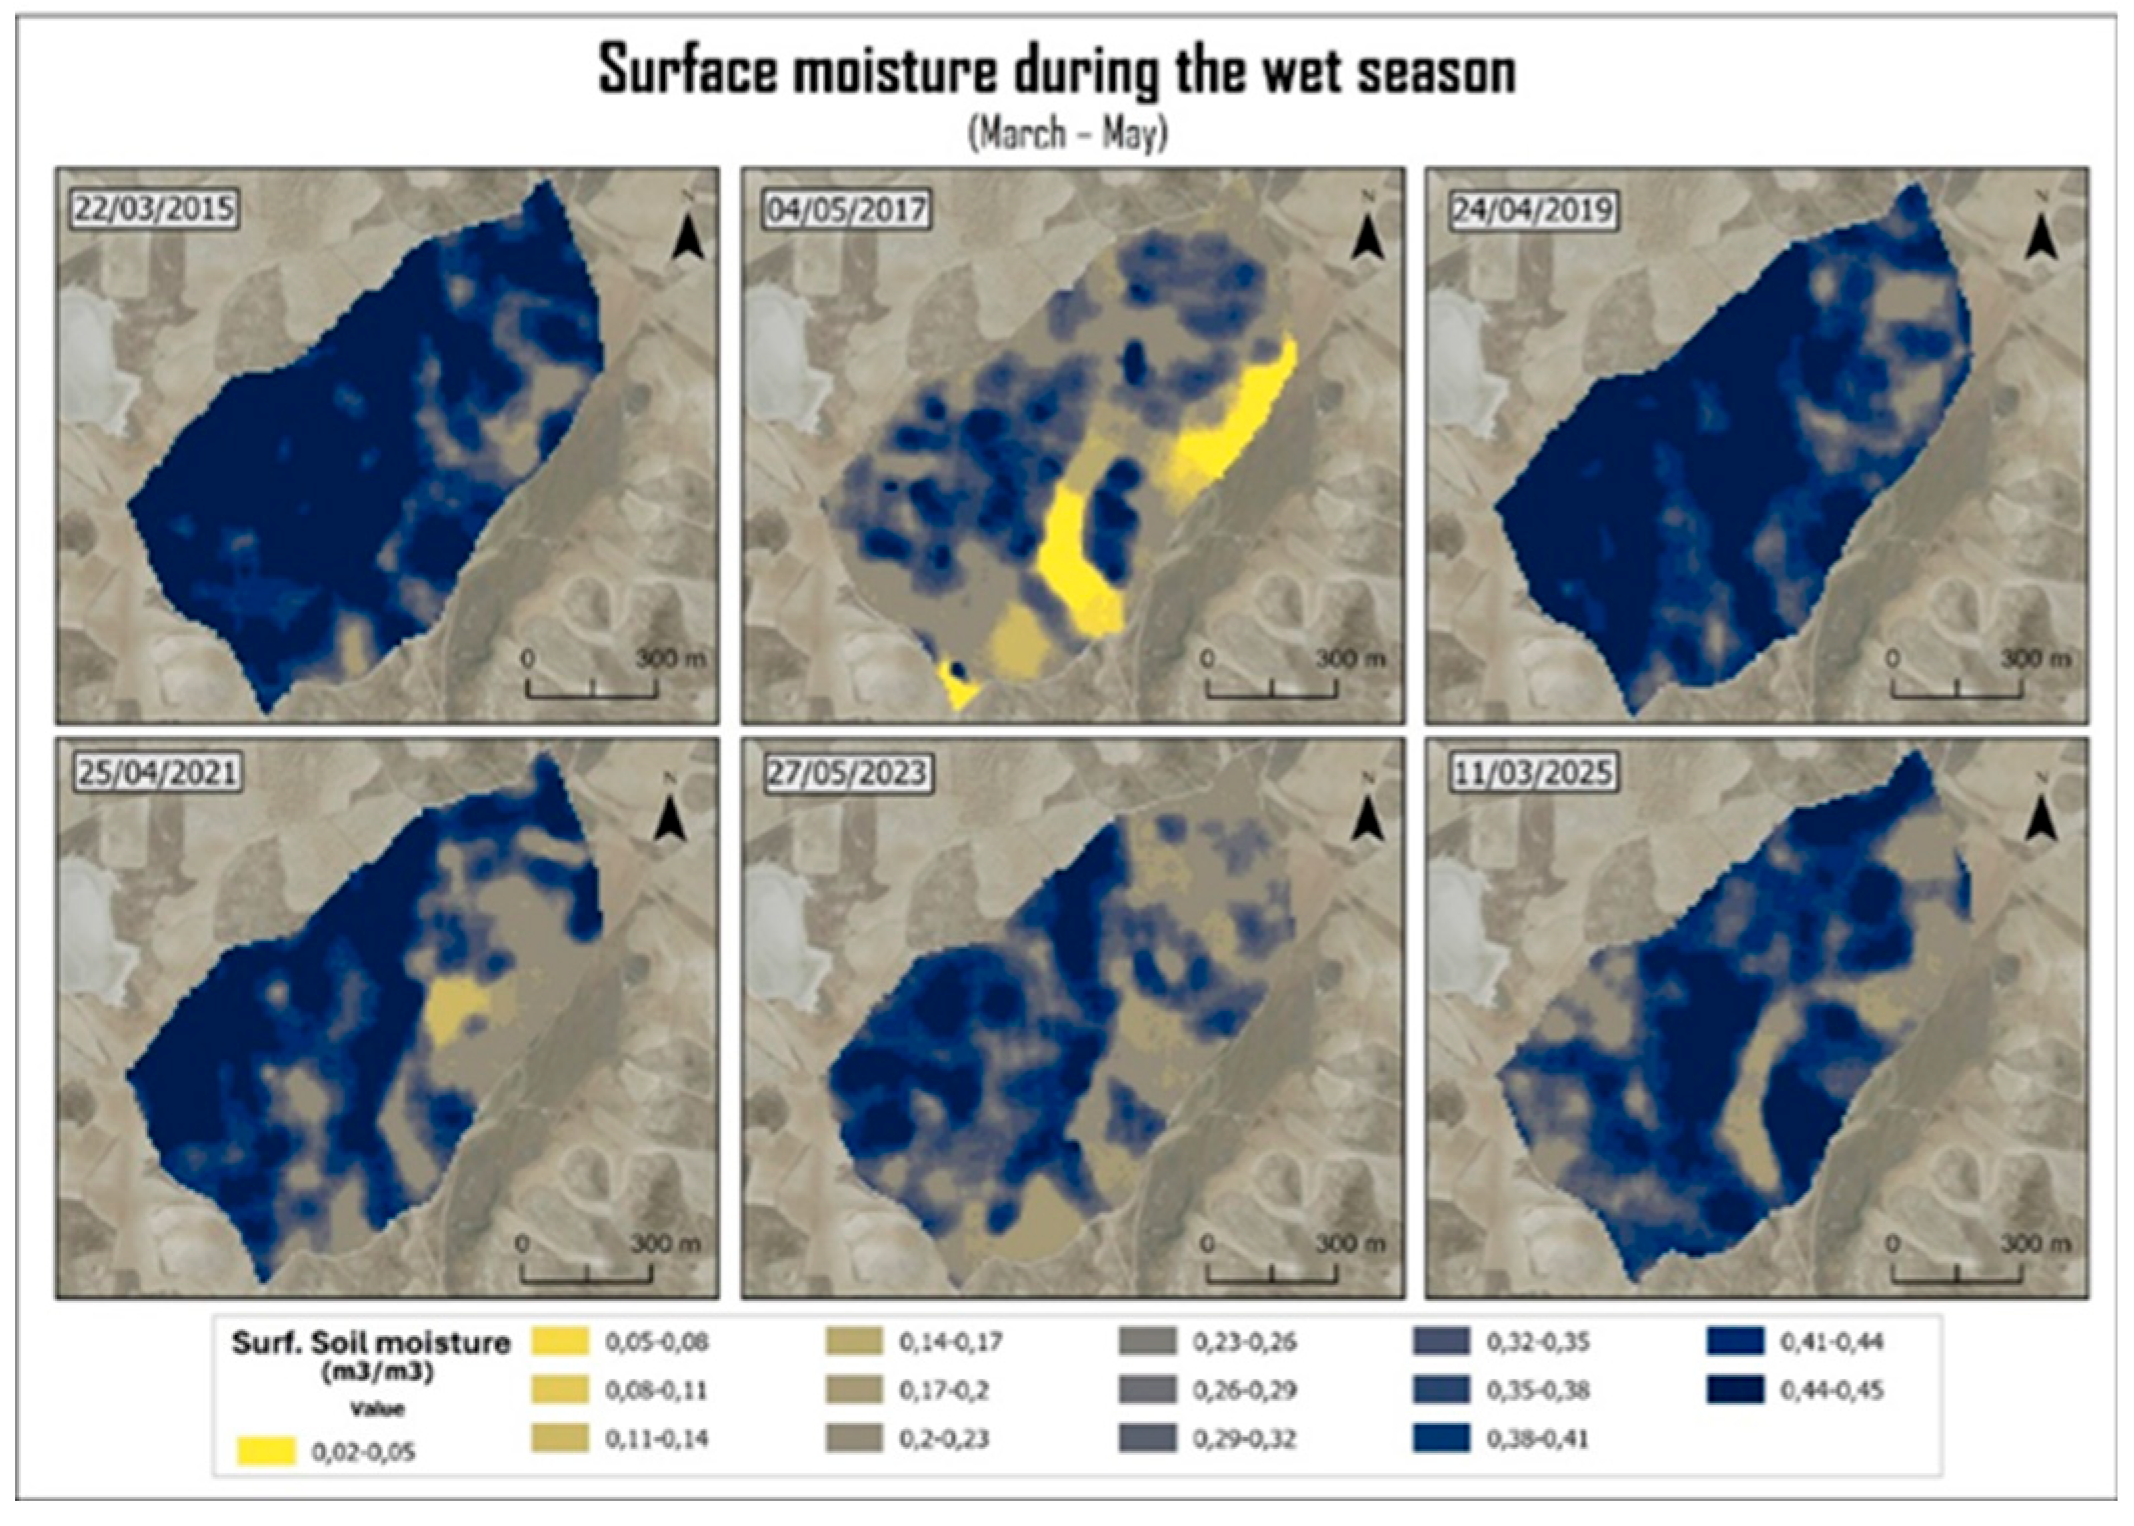
Figure 7.
Cartographic composition of surface moisture during the wet period in the study plot.
4.3. Multitemporal Analysis
The multitemporal analysis revealed a general trend toward progressively drier conditions between 2015 and 2025, especially during the summer months. The years 2023 and 2025 showed mean reductions of 0.15–0.20 m*/m*, associated with prolonged drought episodes and increased evaporation, in line with the findings described by Singh et al. (2020).
4.4. Geostatistical Analysis
The OLS analysis confirmed that all explanatory variables exert a statistically significant influence on SSM, although with low overall explanatory power (maximum adjustedR2 of 0.03). The Moran’s I analysis evidenced the presence of spatial autocorrelation in the residuals, indicating that the spatial structure of the phenomenon was not adequately represented. The application of the EBK-RP model allowed for a substantial improvement in predictive capacity, generating SSM maps with a spatial resolution of 2 m, capturing local variability with greater precision (Krivoruchko, 2012).
Figure 8.
Cartographic composition of surface moisture maps at the municipal level during the wet period.
Figure 8.
Cartographic composition of surface moisture maps at the municipal level during the wet period.
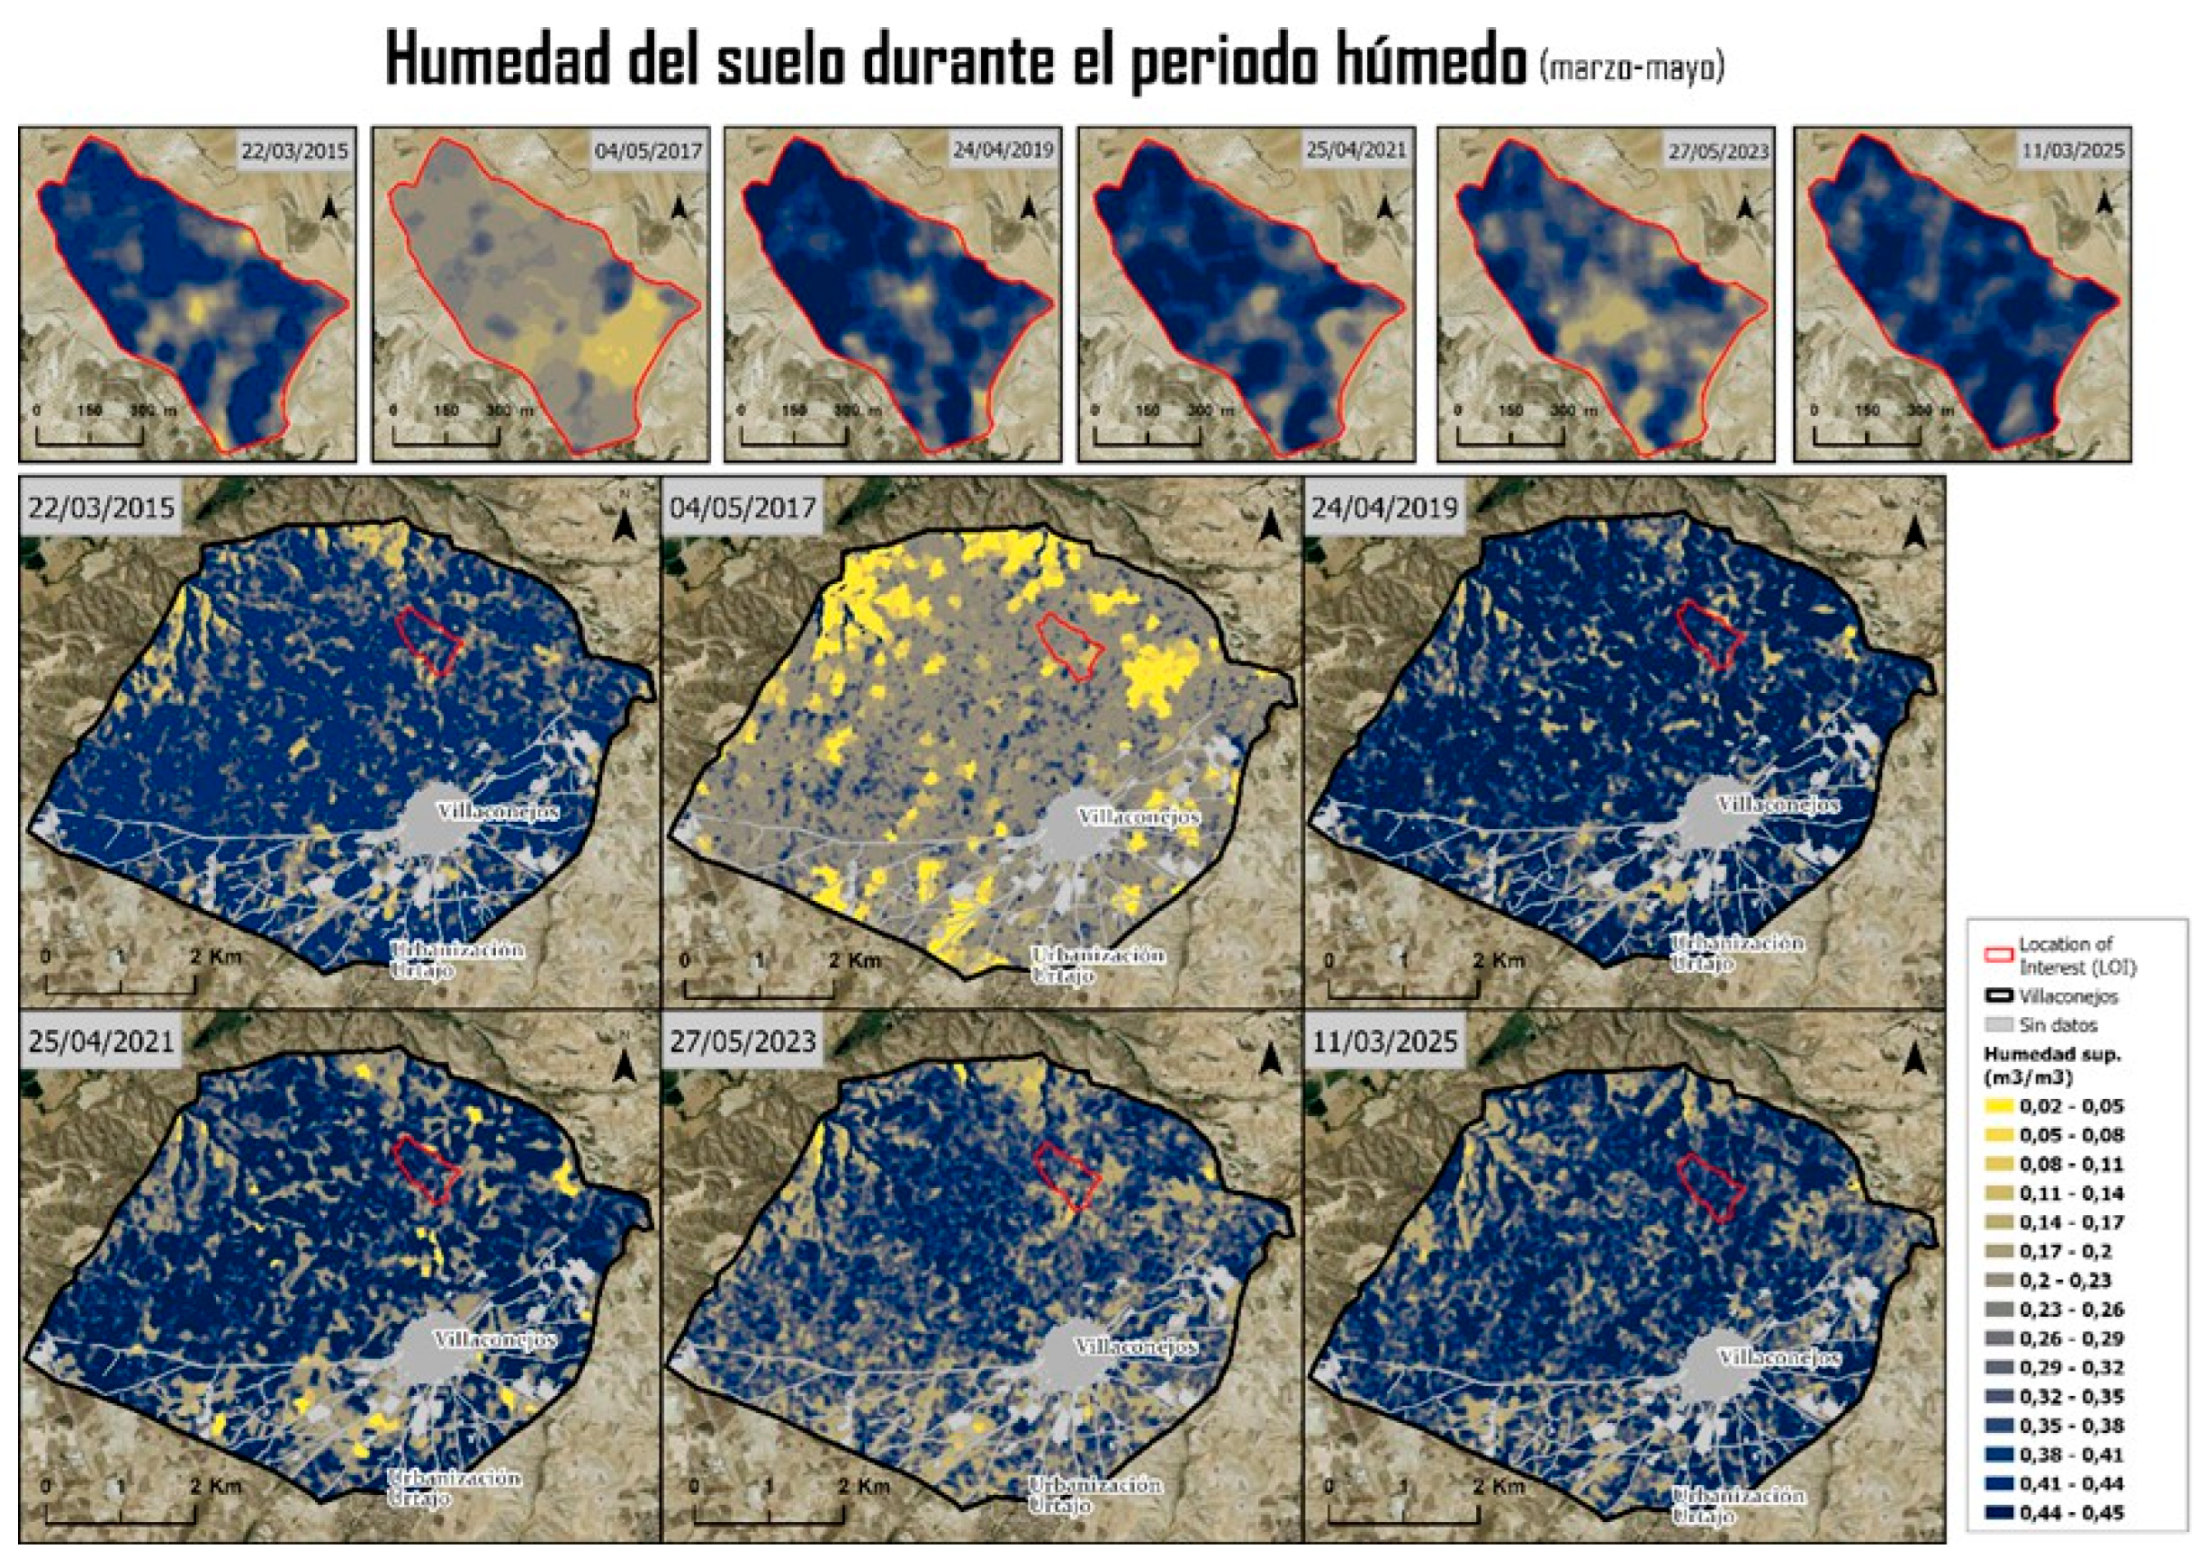
Figure 9.
Enter CaptioCartographic composition of surface moisture maps at the municipal level during the dry period.
Figure 9.
Enter CaptioCartographic composition of surface moisture maps at the municipal level during the dry period.
5. Discussion
The results obtained confirm the suitability of radar remote sensing, and specifically Sentinel-1 imagery in VV polarization, for estimating surface soil moisture (SSM) in semiarid agricultural environments under Mediterranean climates. The sensitivity of radar backscatter to the soil’s dielectric properties has enabled the generation of continuous moisture maps with high spatial and temporal consistency, aligning with the findings of Zribi et al. (2020) and Salgado et al. (2021). The positive correlation between backscatter values (dB) and estimated surface mois- ture supports the validity of the semi-empirical models employed, particularly on bare soil surfaces or areas with sparse vegetation cover, where the SAR signal responds directly to variations in water content (Buah et al., 2020; El Hajj et al., 2017). However, a systematic underestimation of soil moisture was observed in areas with significant vegetation presence, 156 due to the attenuation and volume scattering of the radar signal, as noted by Solorza (2013) 157 and Singh et al. (2020). This result highlights the necessity of applying NDVI masks or 158 models that explicitly integrate the contribution of the vegetation canopy. From a methodological standpoint, the combination of the Hallikainen and Dubois models allowed for moisture estimates within physically plausible ranges (0.02–0.45 m*/m*), consistent with semi-arid agricultural soils (Santana, 2016). Nevertheless, the inherent limitations of both models—such as the dependence on coefficients calibrated for specific contexts and the restriction of the Dubois model to moisture levels below 35%—must be considered when interpreting the results, especially during wet periods (Quan et al., 2014). The multitemporal analysis conducted between 2015 and 2025 reveals a general trend toward progressively drier conditions, particularly during the summer months, with decreases in surface moisture associated with declining precipitation, increased evaporation, and potential soil degradation processes, in line with the scenarios described by the IPCC (2021). Nonetheless, the high interannual variability observed demonstrates that soil moisture dynamics respond to the complex interaction of climatic, edaphic, and topographic factors (Gaur & Mohanty, 2016; Scholz et al., 2024). The statistical analysis using OLS regression showed a significant influence of the to- pographic and spectral variables considered, albeit with limited overall explanatory power and the presence of spatial autocorrelation in the residuals. In this context, the application of the Empirical Bayesian Kriging Regression Prediction (EBK-RP) method represented a substantial improvement by capturing the spatial structure of surface moisture and gener- ating high-resolution maps (2 m), in accordance with the proposals of Krivoruchko (2012) and Bauer-Marschallinger et al. (2018). Overall, the discussion emphasizes that, despite the inherent limitations of the models and the indirect nature of radar estimation, the proposed methodology constitutes a robust and transferable tool for monitoring surface soil moisture in semi-arid agricultural environments, with high potential to support sustainable land management and climate change adaptation (European Commission, 2019).
6. Conclusions
This study has developed and validated an integrated methodology for the estimation and multitemporal mapping of surface soil moisture (SSM) in semi-arid Mediterranean agricultural environments. The combination of physical radar backscatter models (Hallikainen and Dubois) with advanced geostatistical techniques (EBK-RP) has enabled the generation of SSM maps with spatial resolutions of up to 2 m, overcoming the limitations of traditional in situ and optical methods. The results evidence significant spatial and tempo- ral variability of SSM and an interannual trend toward drier conditions between 2015 and 2025, associated with climatic factors and land-use patterns. The proposed methodology constitutes a valuable tool for sustainable soil management and climate change adaptation in vulnerable agricultural regions.
Funding
This research received no external funding.
Informed Consent Statement
Not applicable
Conflicts of Interest
The authors declare no conflicts of interest.
Appendix A
AEMET Precipitation Data
The main precipitation data obtained from the Aranjuez meteorological station (the closest to the study area) are presented.
Table A1.
Precipitation and temperature data from Aranjuez station (Wet periods).
| Year | 2015 | 2017 | 2019 |
| Status | Wet | Wet | Wet |
| Date | 2015-03-20 | 2017-04-29 | 2019-04-22 |
| Altitude (m) | 540 | 540 | 540 |
| Tmean (ºC) | 10.7 | 12.2 | 12.7 |
| Prec. (mm) | 4.5 | 7.8 | 1.4 |
| Tmin (ºC) | 6.8 | 8.1 | 5.9 |
| Time Tmin | 07:00 | 05:00 | 04:30 |
| Tmax (ºC) | 14.6 | 16.2 | 19.5 |
| Time Tmax | 13:50 | 18:40 | 16:10 |
| Date | 2015-03-21 | 2017-04-30 | 2019-04-23 |
| Tmean (ºC) | 10.0 | 12.2 | 10.0 |
| Prec. (mm) | 4.8 | 1.3 | 5.6 |
| Tmin (ºC) | 7.9 | 8.9 | 6.0 |
| Time Tmin | 07:00 | 01:20 | 23:50 |
| Tmax (ºC) | 12.0 | 15.5 | 14.0 |
| Time Tmax | 15:00 | 17:10 | 14:20 |
| Date | 2015-03-22 | - | 2019-04-24 |
| Tmean (ºC) | 12.0 | - | 10.2 |
| Prec. (mm) | 5.7 | - | 15.9 |
| Tmin (ºC) | 7.8 | - | 5.1 |
| Time Tmin | 06:50 | - | 03:30 |
| Tmax (ºC) | 16.1 | - | 15.2 |
| Time Tmax | 13:20 | - | 14:00 |
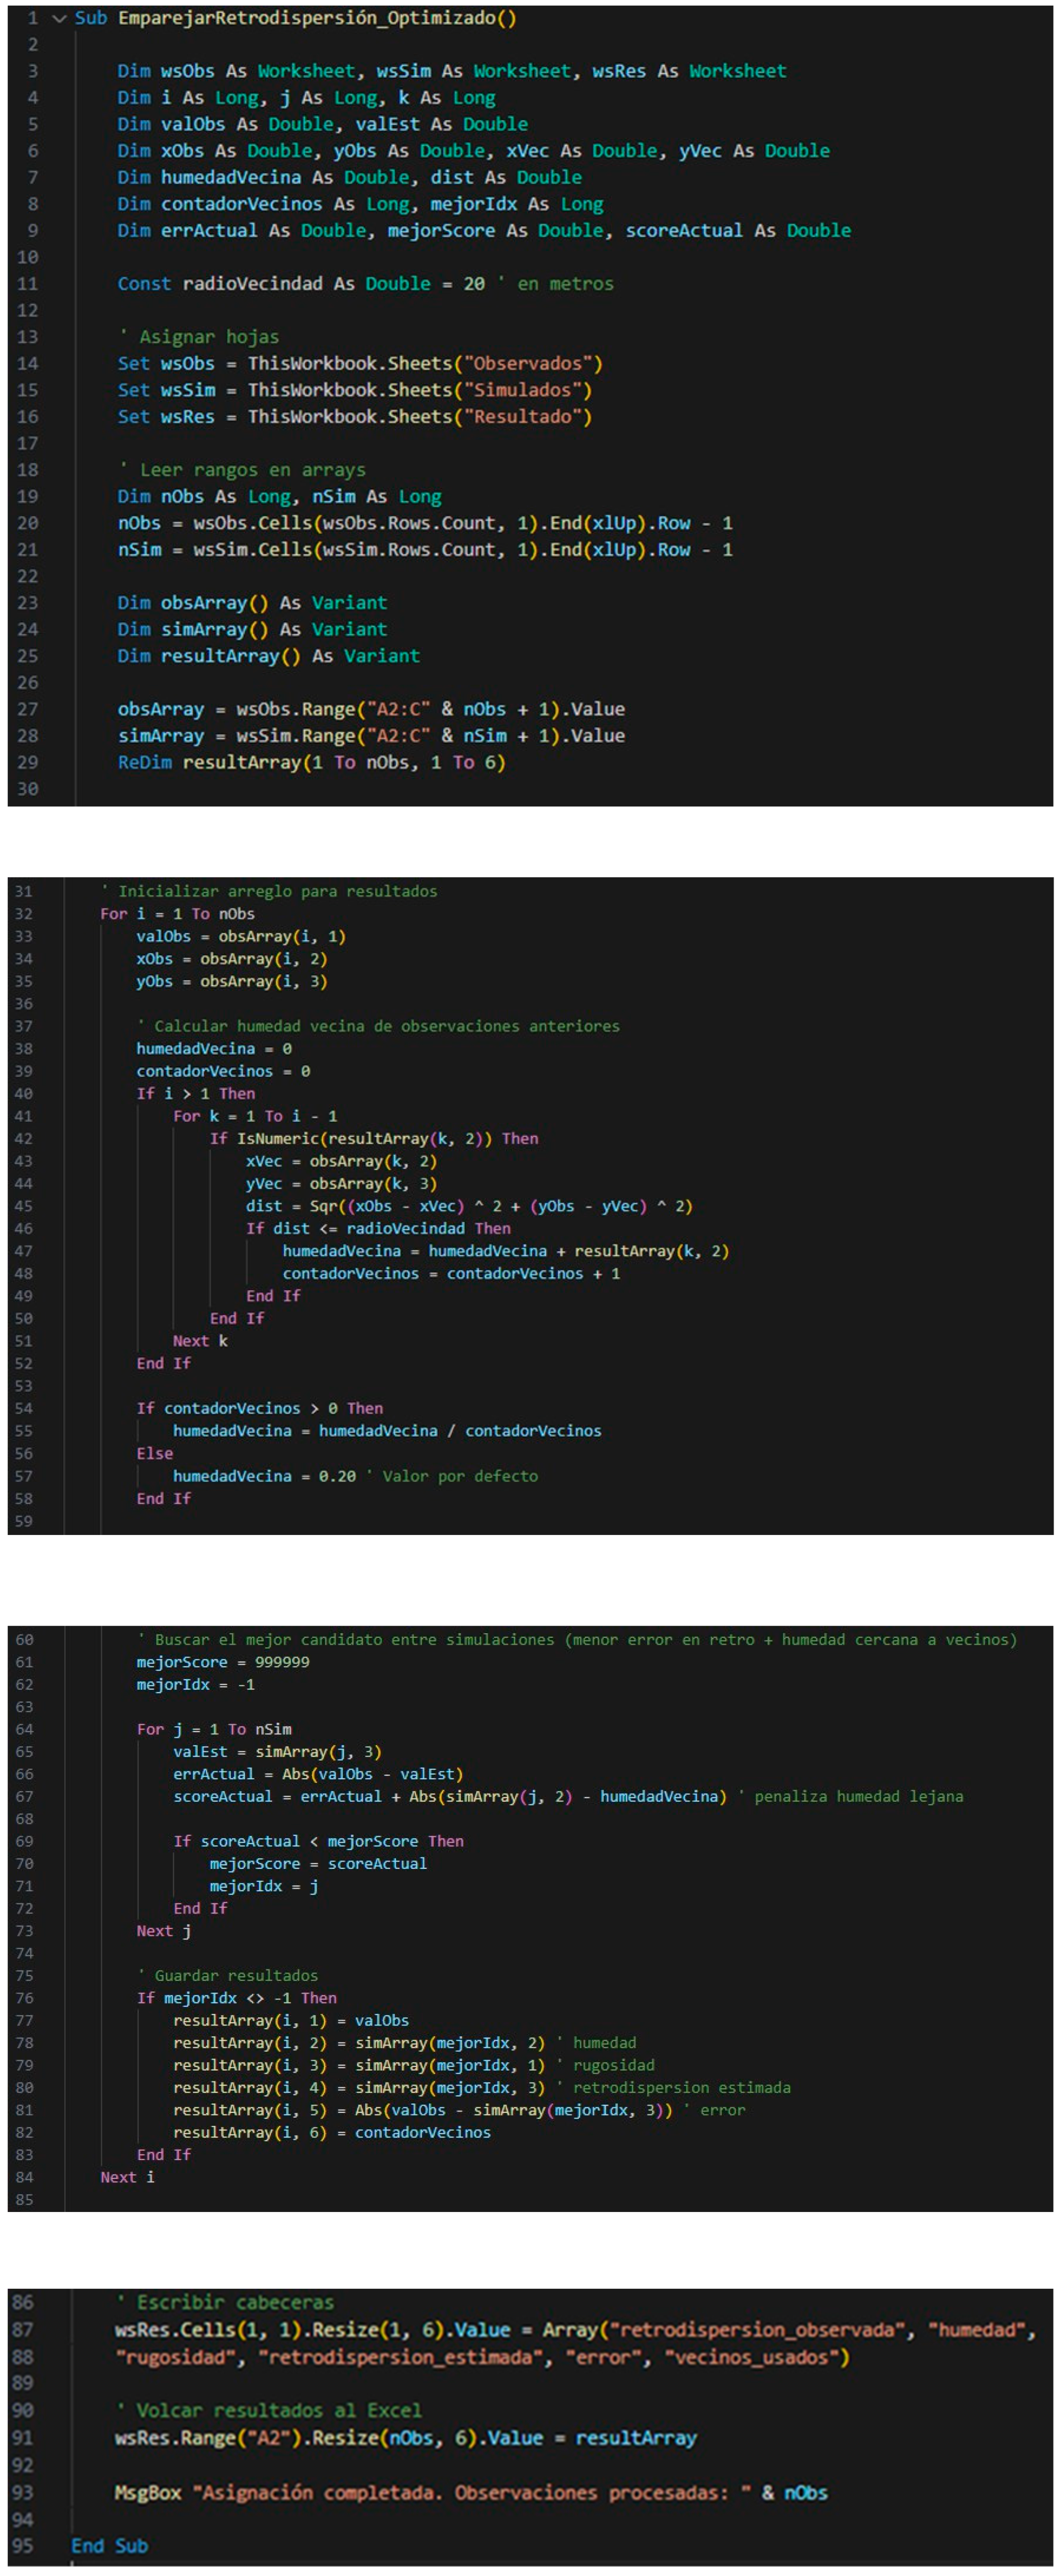
Appendix B. VBA Script for Pairing Observed and Estimated Backscatter
Figure A1.
VBA Code for pairing observed vs. estimated backscatter.
References
- Agencia Espacial Europea (ESA). (s.f.). El programa Copérnico. Recuperado de https://www.esa.int/Space_in_Member_States/Spain/El_programa_Copernico.
- AHMADI, M., KAMANGAR, M., MOLANAZAR, G. AND MADANI, B. (2022). Evaluation of OLS regression models and GWR regression for modeling Spatial Soil Moisture, Case Study: Fars Province. Journal of Environmental Studies, 48(3), 403-418. [CrossRef]
- LVAREZ-MOZOS, J., CASALÍ, J., & GONZÁLEZ-AUDÍCANA, M. (2005). Teledetección radar como herramienta para la estimación de la humedad superficial del suelo en cuencas agrícolas. Revista de Teledetección, 23, 27–42.
- LVAREZ-MOZOS, J., CASALÍ, J., GONZÁLEZ-AUDÍCANA, M., & LÓPEZ, J. J. (2005). Estimación de la humedad superficial del suelo mediante teledetección radar en presencia de una cubierta de cereal. En F. J. Samper Calvete & A. Paz González (Eds.), Estudios de la Zona No Saturada del Suelo Vol VII.
- Alvarez-Mozos, J.; Casali, J.; Gonzalez-Audicana, M.; Verhoest, N. Assessment of the operational applicability of RADARSAT-1 data for surface soil moisture estimation. IEEE Trans. Geosci. Remote. Sens. 2006, 44, 913–924. [CrossRef]
- BAGHDADI, N., CRESSON, R., EL HAJJ, M., LUDWIG, R., & LA JEUNESSE, I. (2012). Estimation of soil parameters over bare agriculture areas from C-band polarimetric SAR data using neural networks. Hydrology and Earth System Sciences, 16(6), 1607–1621.
- Bao, H.; Lann, T.; Ao, X.; Yang, L.; Lan, H.; Peng, J. Evolution characteristic of soil water in loess slopes with different slope angles. Geoenvironmental Disasters 2024, 11, 1–29. [CrossRef]
- BARANIAN KABIR, E., BASHARI, H., BASSIRI, M., & MOSADDEGHI, M. R. (2020). Effects of land-use/cover change on soil hydraulic properties and pore characteristics in a semi-arid region of central Iran. Soil and Tillage Research, 197, 104478.
- Behari, J. Microwave Dielectric Behavior of Wet Soils; Springer Nature: Durham, NC, United States, 2005; ISBN: 9781402032714.
- Benninga, H.-J.F.; van der Velde, R.; Su, Z. Impacts of Radiometric Uncertainty and Weather-Related Surface Conditions on Soil Moisture Retrievals with Sentinel-1. Remote. Sens. 2019, 11, 2025. [CrossRef]
- Bohn, V.Y. Variabilidad espacio-temporal de la humedad superficial del suelo en el sur de la llanura pampeana argentina. Investig. Geogr. 2024, 85–104. [CrossRef]
- BOUSBIH, S., ZRIBI, M., EL HAJJ, M., BAGHDADI, N., LILI-CHABAANE, Z., GAO, Q., & FANISE, P. (2018). Soil Moisture and Irrigation Mapping in A Semi-Arid Region, Based on the Synergetic Use of Sentinel-1 and Sentinel-2 Data. Remote Sensing, 10(12), 1953.
- BUAH, P. A., YINGBIN, Z., MANTE, G., AKWASI, T.-A., & GYAMI, C. A. (2020). Soil moisture retrieval using SAR. Global Scientific Journals, 8(9).
- Calabia, A.; Molina, I.; Jin, S. Soil Moisture Content from GNSS Reflectometry Using Dielectric Permittivity from Fresnel Reflection Coefficients. Remote. Sens. 2020, 12, 122. [CrossRef]
- Camps, A.; Vall·llossera, M.; Park, H.; Portal, G.; Rossato, L. Sensitivity of TDS-1 GNSS-R Reflectivity to Soil Moisture: Global and Regional Differences and Impact of Different Spatial Scales. Remote. Sens. 2018, 10, 1856. [CrossRef]
- Comisión Europea. (2019). El Pacto Verde Europeo (COM/2019/640 final). Oficina de Publicaciones de la Unión Europea. Confederación Hidrográfica del Tajo. (2022).
- Plan Hidrológico de la parte española de la Demarcación Hidrográfica del Tajo (2022-2027). Organismo de Cuenca.
- Dubois, P.; Van Zyl, J.; Engman, T. Measuring soil moisture with imaging radars. IEEE Trans. Geosci. Remote Sens. 1995, 33, 915–926. [CrossRef]
- EL HAJJ, M., BAGHDADI, N., ZRIBI, M., & BAZZI, H. (2017). Synergic use of Sentinel-1 and Sentinel-2 images for operational soil moisture mapping at high spatial resolution over agricultural areas. Remote Sensing, 9(12), 1292.
- Hallikainen, M.T.; Ulaby, F.T.; Dobson, M.C.; El-Rayes, M.A.; Wu, L.-K. Microwave Dielectric Behavior of Wet Soil-Part 1: Empirical Models and Experimental Observations. IEEE Trans. Geosci. Remote. Sens. 1985, GE-23, 25–34. [CrossRef]
- IPCC. (2021). Climate change 2021: The physical science basis. Cambridge University Press.
- Poggio, L.; de Sousa, L.M.; Batjes, N.H.; Heuvelink, G.B.M.; Kempen, B.; Ribeiro, E.; Rossiter, D. SoilGrids 2.0: producing soil information for the globe with quantified spatial uncertainty. SOIL 2021, 7, 217–240. [CrossRef]
- Zribi, M.; Albergel, C.; Baghdadi, N. Editorial for the Special Issue “Soil Moisture Retrieval using Radar Remote Sensing Sensors”. Remote. Sens. 2020, 12, 1100. [CrossRef]
Disclaimer/Publisher’s Note: The statements, opinions and data contained in all publications are solely those of the individual author(s) and contributor(s) and not of MDPI and/or the editor(s). MDPI and/or the editor(s) disclaim responsibility for any injury to people or property resulting from any ideas, methods, instructions or products referred to in the content. |
© 2026 by the authors. Licensee MDPI, Basel, Switzerland. This article is an open access article distributed under the terms and conditions of the Creative Commons Attribution (CC BY) license.
Copyright: This open access article is published under a Creative Commons CC BY 4.0 license, which permit the free download, distribution, and reuse, provided that the author and preprint are cited in any reuse.


