
Submitted:
31 December 2025
Posted:
01 January 2026
You are already at the latest version
Abstract
Correlation of in vivo morphological and functional changes in the degenerating retina in a large animal model of retinitis pigmentosa (RP) has not been characterized longitudinally. Herein, spectral domain optical coherence tomography (SD-OCT) was used to monitor the dynamic morphological changes in the Pro23His rhodopsin transgenic (TgP23H) pig model of RP and was correlated with electroretinography (ERG) in the rapid, early phase of photoreceptor degenera-tion. TgP23H and wild type (Wt) hybrid pig littermates at the ages of P30, P60, and P90 were studied. The thickness of different retinal layers was quantified using SD-OCT and compared with histology. Retinal function was evaluated with ERG at corresponding time points. In the Wt pig, retinal morphology on SD-OCT was consistent throughout the observation period. In the TgP23H pig, the retinal thickness decreased significantly from P30 to P90. Moreover, the relative intensity of the ellipsoid zone (EZ) progressively decreased, while the intensity of the interdigita-tion zone-retinal pigment epithelium (IZ-RPE) progressively increased during this period. Mor-phological changes in SD-OCT corresponded with histology, as well as the progressively de-creased amplitude of the ERG photopic a- and b-waves in TgP23H pigs. Thus, retinal degenera-tion can be quantified using SD-OCT by measuring retinal thickness and the intensity of the EZ and IZ-RPE bands in the TgP23H pig. The SD-OCT results correspond with the histologic and ERG assessments of retinal degeneration. These data provide a foundation for future preclinical studies investigating potential new therapeutic strategies in a large animal model of retinitis pigmentosa.
Keywords:
pig
; animal model
; retinitis pigmentosa
; OCT
; electroretinography
1. Introduction
Retinitis pigmentosa (RP) refers to a heterogeneous group of inherited retinal degenerative diseases that result in progressive photoreceptor cell death, characterized by visual field constriction and night blindness. Mutations in the rhodopsin gene (RHO) account for about 30-40% of autosomal dominant forms of RP in the United States [1]. A proline-histidine substitution at the 23rd amino acid residue of rhodopsin (Pro23His) is the most common rhodopsin mutation and accounts for about 40% of the rhodopsin-induced cases and 10% of all autosomal dominant RP [2,3,4,5].
Although multiple rodent animal models with retinopathy derived from proline to histidine substitution in codon 23 (P23H) have been created and studied [6,7,8,9,10,11], the porcine model presents multiple advantages over the rodent model. Compared to the rodent, the pig retina includes a cone-dense region [12], which may yield more acute vision, comparable to the human macula [13]. Because the eyeball size and anatomy of the porcine eye are similar to the human eye, different porcine models of RP have been established to investigate the mechanisms of retinal degeneration and dysfunction and to test potential therapeutic interventions [14,15,16,17,18]. To better understand the pathophysiology of retinal degeneration caused by the P23H mutation in pigs, a miniature swine model with the P23H RHO mutation was developed recently and found to exhibit functional and morphologic characteristics similar to the human form of the disease [19,20].
Previous studies have documented the progressive photoreceptor degeneration in the P23H swine model using histologic analysis [20,21]. Although postmortem histologic analyses may document morphological characteristics of the retinal degeneration in an animal model at a particular point in time, a longitudinal study of the course of retinal degeneration over time in an animal subject is precluded. Spectral domain optical coherence tomography (SD-OCT) has proved to be a valuable approach to accurately measure retinal thickness and assess morphological changes in vivo in multiple animal models by our research group and others [22,23,24,25]. SD-OCT facilitates the longitudinal study of disease-related retinal alterations and allows for improved clinical evaluations in RP [26,27,28,29].
We previously described the correlation of SD-OCT and histology of the porcine retina in the domestic pig, and we found that SD-OCT images correlate well with histomorphometric data in the porcine retina [30,31]. However, limited SD-OCT information is currently available concerning the retinal morphologic changes at different time points of retinal degeneration in the pig. Herein, we characterized the progressive photoreceptor degeneration in the P23H swine model by using SD-OCT to trace the changes in the same region of the retina during the first 3 months after birth, in which the most rapid progression of retinal degeneration has been reported [20].
2. Results
2.1. Sd-Oct Imaging
As shown in Figure 1, different retinal layers were clearly identified in the SD-OCT images of the Wt and TgP23H pig retina at P30. The nerve fiber layer (NFL), inner plexiform layer (IPL), outer plexiform layer (OPL), ELM, EZ, IZ, and RPE are displayed as hyperreflective bands, whereas the ganglion cell layer (GCL), inner nuclear layer (INL), and ONL are displayed as hyporeflective bands. The SD-OCT image of the Wt pig showed that the structure of the retina was consistent throughout the observation period in both the superior and inferior retina. The EZ and IZ-RPE were consistently visualized as 2 distinct hyperreflective bands in Wt pig SD-OCT images.
In the superior retina of the TgP23H pig, the inner retinal layers were mostly preserved and the IPL and INL were easily identified throughout the course of degeneration. The ONL became progressively thinned from P30 to P60 and was still detectable at P90. The EZ was clearly observed at P30. At P60, the EZ became attenuated and discontinuous. By P90, the EZ hyperreflective band was unidentifiable. In contrast, the IZ-RPE was detectable at P30 and became diffusely hyperreflective at P90. In the inferior retina of the TgP23H pig, the inner retinal layers were preserved between P30 and P90. The ONL corresponded to a very thin hyporeflective band at P30 and remained identifiable at P90. The EZ could not be identified at P30; however, the hyperreflective IZ-RPE layer persisted from P30 to P90 in the inferior retina.
2.2. Quantitative Analysis of Sd-Oct Image
To characterize the progression of the retinal degeneration, SD-OCT imaging was performed at the same retinal locations with the aid of an eye-tracking system (Figure 2A). The thickness of retinal layers was measured in both Wt and TgP23H pigs by manual segmentation at different time points. In the Wt pig, the thickness of different retinal layers in both the superior and inferior retina did not change between P30 and P90. No difference was observed in the total retinal thickness (TRT) in the superior retina between Wt and TgP23H pig at P30; however, the TRT gradually decreased from P30 to P90 in the TgP23H pig (Figure 2B). The retinal thickness measured from NFL to IPL was constant between P30 and P90 in the TgP23H pig (Figure 2C). Compared to the Wt pig, the INL thickness in the TgP23H pig was increased by 64% at P30, whereas the INL thickness was comparatively decreased in the TgP23H pig by 38% at P90 (Figure 2D). Compared to the Wt pig, the thickness measured from ONL to IZ-RPE was decreased by 41% in the TgP23H pig at P30, and the ONL to IZ-RPE thickness continued to decrease from P30 to P90 (by 69% at P90) in the TgP23H pig (Figure 2E).
Spidergrams of the superior and inferior retina show that the TRT and ONL to IZ-RPE thickness decreased over time in the TgP23H pig in the superior retina, while these measurements did not change significantly over time in the inferior retina (Figure 2F and 2G). Compared to the superior retina, the TRT and ONL to IZ-RPE thickness in the inferior retina were significantly decreased at different time points (Figure 2F and 2G).
The densities of the EZ and IZ-RPE bands were measured to further characterize the degeneration of the photoreceptors and RPE. As shown in Figure 3A, the representative intensity was measured at different time points. The relative reflective densities of the EZ and IZ-RPE of the Wt pig were consistent from P30 to P90. The relative density of the EZ was decreased by 51% in the TgP23H pig at P30, with gradual attenuation to the point of being unidentifiable at P90 (Figure 3A and 3B). In the TgP23H pig, the relative density of the IZ-RPE was decreased by 52% at P30. In contrast, during the progression of retinal degeneration, the reflective density of the IZ-RPE increased by about 110% from P30 to P90 (Figure 3C).
2.3. Histology and Sd-Oct Correlation
Retinal histologic sections from the TgP23H pig were compared to locally matched SD-OCT images (Figure 4). Compared to the Wt pig, the number of photoreceptor nuclei was significantly decreased at P30 in the TgP23H pig retina. The outer segments of the photoreceptors were disorganized. At P60, the ONL thickness and nuclear density were significantly decreased, with good correspondence between retinal histology and SD-OCT. By P90, the ONL contained only a single cell layer of cone nuclei on histologic sections, corresponding to the detectable hyporeflective ONL band on SD-OCT imaging. At this time point, the cone photoreceptors lacked distinct inner and outer segments, corresponding to the loss of the EZ in the SD-OCT images. The melanin/melanolipofuscin granules of the RPE appear more numerous and aggregated in the apical cytoplasm of the RPE with progression of the retinal degeneration from P30 to P90 in TgP23H pigs.
Compared to the superior retina, the total retinal thickness of the inferior retina was thinner, with only 1-2 rows of photoreceptor nuclei in the ONL at P30. With progression of the retinal degeneration, the EZ band became thinner and the intensity of IZ-RPE band increased. At all time points (P30-P90) in the Wt and TgP23H pigs, a hyperreflective band was observed with SD-OCT in the middle of the hyporeflective INL band (Figure 1 and Figure 2). This hyperreflective band in the INL correlated histologically with the apical cytoplasm of large horizontal cells (Figure 4).
2.4. Erg Recordings
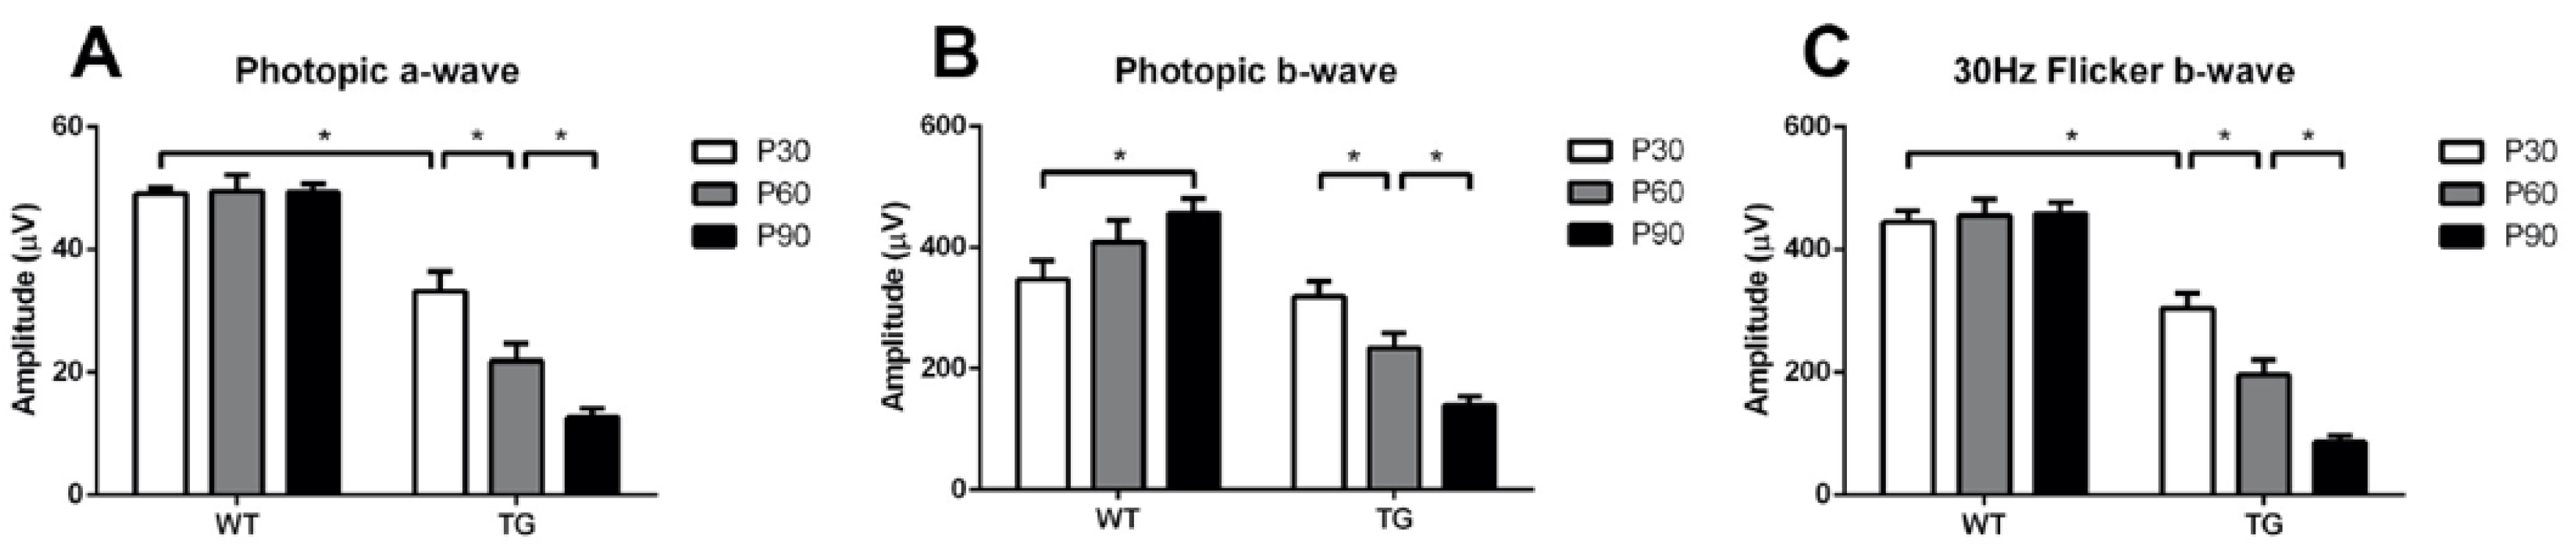
Full field ERG was recorded to characterize the cone function in Wt and TgP23H pigs, since the rod function does not develop in the TgP23H pig. The cone response was measured by photopic ERG (3.0 cd·s·m-2) and 30Hz flicker ERG (3.0 cd·s·m-2). In the Wt pig, the amplitude of the a-wave was stable between P30 and P90 (Figure 5A), while the b-wave increased from P30 to P90 (Figure 5B). In contrast, in the TgP23H pig, the amplitude of the photopic a- and b-waves decreased gradually from P30 to P90. Compared to the Wt pig, the a-wave in the TgP23H pig was decreased by 32% at P30. The a- and b-waves further decreased by 62% and 56%, respectively, at P90 (Figure 5A and 5B). The 30Hz b-wave decreased by 31% in the TgP23H pig compared to the Wt pig at P30 (Figure 5C) and further decreased by 71% from P30 to P90 in the TgP23H pig (Figure 5C). These ERG changes corresponded with the decreased outer retinal thickness, decrease in the density/number of cone cell nuclei, and decreased intensity of the EZ band observed with SD-OCT during the same time period. These ERG results also correlated with the histological findings, which showed progressive attenuation and loss of the photoreceptor outer segments and the number of cone cell nuclei.
3. Discussion
In the present study, we documented the SD-OCT findings of a recently developed porcine model of inherited retinal degeneration with P23H mutation. SD-OCT imaging was correlated with longitudinal assessments of histology and retinal function as measured by ERG during the early and rapidly progressive stages of photoreceptor degeneration. We demonstrated that the progression of cone photoreceptor degeneration can be characterized by SD-OCT, by measuring the thickness of the outer retinal layers and relative intensities of the EZ and IZ-RPE bands to the ELM band in the TgP23H pig. The correlation of SD-OCT data with ERG amplitudes suggests that SD-OCT is able to yield accurate and reliable longitudinal assessments of the morphological changes in this large animal model.
Histologic analysis has been used as a gold standard for characterizing retinal structure in different animal models of retinal degeneration. However, SD-OCT imaging offers a noninvasive, alternative method to assess morphologic changes of disease progression without potential artifacts caused by histological processing. Although the OCT imaging varies in different animal models using OCT instruments from different manufacturers, the interpretation of the longitudinal OCT changes provides a new method to monitor and assess the pathophysiologic progression of retinal degeneration [22,34,35,36,37].
As a recently developed large animal model of RP, TgP23H pigs exhibit very early rod photoreceptor degeneration, which allows for the investigation of mechanisms of secondary cone photoreceptor degeneration and potential new therapeutic strategies to enhance cone photoreceptor survival. Therefore, it is important to document the SD-OCT findings in this large animal model and establish a baseline that is applicable to retinal degeneration in humans. Because the progression of retinal degeneration is slow with relative stability after P90 [21], in the current study, we investigated the SD-OCT changes in TgP23H pigs from P30 to P90, a period of rapid ONL degeneration. A recently published study demonstrated the OCT features of a 6-week-old TgP23H pig with one eye imaged in vivo (i.e., one-time point assessment without repeat experiments or longitudinal imaging of photoreceptor degeneration) [38]. Two recent studies have further emphasized the utility of longitudinal assessments of the outer retina in the pig model, including the TgP23H pig, with OCT imaging [39,40]. However, SD-OCT morphological data were not compared with retinal functional data in these previous studies. It is critical to establish a correlation between the SD-OCT imaging, histology, and ERG functional data in this large animal model of retinal degeneration. In the present longitudinal study, we report the first monitoring of the retinal degeneration in the TgP23H pig with those parameters. We also first report that the changes in EZ and IZ-RPE band densities with SD-OCT imaging may serve as a new index to evaluate the retinal degeneration in this animal model.
Based on the OCT findings, the thickness of the NFL to IPL remained consistent between P30 and P90, whereas the thickness of the nuclear layers (INL, ONL) decreased significantly during retinal degeneration (Figure 1 and Figure 2). The loss of nuclei in the retina (i.e., the INL and ONL) is the major contributing factor to the decrease in total retinal thickness, an interpretation supported by the histologic data. The thickness of the axonal or plexiform layers of the retina appeared to remain stable during this period of retinal degeneration. In the TgP23H pig, we also observed an additional hyperreflective band in the INL (Figure 1 and Figure 2), corresponding to the presence of abundant mitochondria in horizontal cell processes and adjacent bipolar cells on transmission electron microscopy as reported in our previous study in normal domestic pigs [30,31]. We observed an increase in INL thickness in TgP23H pigs compared to Wt pigs at P30, which is consistent with the previously reported human patients and Rho transgenic mouse model of retinitis pigmentosa [41]. In addition to photoreceptor dysfunction, retinal remodeling also occurs and involves second-order retinal neuronal cells, such as bipolar cells, horizontal cells, and Müller cells, in the setting of retinal degeneration [42,43]. Common histologic findings in the remodeling process include cell body migration and sprouting of ectopic processes on horizontal and bipolar cells, as well as thickening of the cytoplasmic processes and translocation of Müller cells [44,45]. The migration of the second-order retinal neurons in this remodeling might contribute to the increased INL thickness in the TgP23H pig compared to the Wt pig as early as P30. With the progression of retinal degeneration, the degenerated cell bodies and resorption of second-order neurons may cause a decrease in INL thickness as measured by OCT. However, further studies are needed to understand the contribution of cellular remodeling to the changes in INL thickness in this large animal model.
We found that the thickness of the ONL, EZ, and outer segments of the photoreceptors progressively decreased with time in the TgP23H pig (Figure 2 and Figure 3). By P90, only one layer of photoreceptor nuclei remained in the superior retina (Figure 4), which was identified as a thin hyporeflective ONL in SD-OCT imaging. Although we used high-resolution SD-OCT imaging in the current study, it remains challenging to measure the thickness of the ONL manually during the course of rapid retinal degeneration in this model. To enable consistent measurements at different time points (P30, P60, and P90), we measured the thickness from the inner margin of the ONL to the inner margin of the IZ-RPE. The decrease in ONL to IZ-RPE thickness as measured on SD-OCT (Figure 2 and Figure 3) corresponded to a decreased number of cone photoreceptor nuclei and shorter inner and outer segments as observed histologically (Figure 4). It is unclear why the inferior retina displayed more severe retinal degeneration in the TgP23H pig; however, as suggested by other investigators, phototoxicity from overhead light may contribute to this differential finding in the inferior retina [46,47].
The reflectivity of OCT bands can be affected by many factors, such as tear film quality, lens opacities and vitreous floaters. To minimize this variation and normalize the optical intensity, several references were selected when quantifying the intensity of the EZ band in OCT analysis, such as vitreous [48], RNFL [48], ELM [33,49], RPE [50], or mean value of the whole retina [51]. Because vitreous detachment or floaters may present during OCT imaging, we avoided the use of vitreous as a reference. Furthermore, changes in the RNFL and RPE during the progression of RP may potentially change the reflectivity of these bands. The reflectivity of the whole retina may also change with retinal gliosis or remodeling of synapses in the plexiform layers during the course of retinal degeneration. However, as a nonneural membrane, the ELM exhibits relatively constant intensity regardless of age or retinal degeneration [52,53], and may serve as a good reference to quantify the intensity of the EZ band.
The densely packed mitochondria in the EZ of the photoreceptor inner segment may serve as a biomarker of disease severity in retinal degeneration [32,49,54]. Mitochondria in the inner segment of the photoreceptor have been proposed to be the main light-scattering organelles, which contribute to the hyperreflective band of the EZ in OCT images of the outer retina [55,56]. A decrease in the EZ intensity may indicate a reduction in healthy or functional mitochondria in the photoreceptor inner segment, and thus abnormal photoreceptor function. We found that the relative intensity of the EZ band measured with SD-OCT decreased in the TgP23H pig from P30 to P90 (Figure 3), and this corresponded to the decreased number of cone photoreceptors observed histologically (Figure 4). Our findings are consistent with other studies in patients with photoreceptor dysfunction [26,32,57,58] and in rat models of retinal degeneration [37] which have reported a decreased EZ band intensity with OCT. The EZ thickness on SD-OCT has been suggested to be a significant predictor of best-corrected visual acuity in patients with RP [58].
The precise cellular origin of the third outer hyperreflective band is still controversial. Initially, this band was described as a contact cylinder of RPE that encases part of the photoreceptor outer segment [52]. Subsequently, this band was interpreted as the RPE interdigitation zone [59] or as cone outer segment tips [60]. A recent study proposed that this third band is generated by the phagosome zone of the RPE [61]. Due to the intimate relationship with the RPE, this third band is not easily distinguishable from the RPE layer (fourth outer hyperreflective band) in OCT in some animal models. In domestic pigs, we have previously shown that the third and most reflective band in the porcine outer retina correlated with the IZ and RPE cells [30]. In the current study, the relative intensity of the IZ-RPE band in TgP23H pigs was decreased when compared to Wt pigs at P30 (Figure 3), which correlated with photoreceptor dysfunction/degeneration in this animal model. However, from P30 to P90, we observed an increase in the relative intensity of this band on SD-OCT in the TgP23H pig. Histologically, we found that the IZ-RPE band correlated with an increased number and aggregation of melanin/melanolipofuscin granules in the apical RPE cytoplasm in this animal model of retinitis pigmentosa (Figure 4). Migration and aggregation of melanin is frequently observed in retinitis pigmentosa [62]. Although melanin is not the only contributor to the RPE hyperreflective band on SD-OCT and the cellular/subcellular origin of the outer retinal hyperreflective bands on OCT remains controversial [61,63], the apical translocation of melanin in RPE cells is believed to contribute to the increased band density of the RPE in OCT imaging [64,65,66,67]. An alternative explanation for the apparent thickening of the outermost retinal hyperreflective band (i.e., IZ-RPE band) on OCT might be the inadequate resolution of the EZ band due to photoreceptor inner and outer segment loss and “fusion” of the EZ and RPE bands. A “true” IZ at or after P90 in the TgP23H porcine retina is not visualized on OCT imaging, because there are no or only rare and degenerated photoreceptor outer segments as observed histologically.
In the present study, in addition to the strong correlation between morphological changes observed with SD-OCT and histology in the TgP23H pig, we found that changes in SD-OCT imaging (Figure 1, Figure 2 and Figure 3) correlated well with concurrent decreases in the ERG amplitudes (Figure 5) in this large animal model. Our findings are consistent with other studies in the rodent model and suggest a close correspondence between retinal structure and function with longitudinal alteration of morphology as assessed by SD-OCT [37,68]. Interestingly, Scott and coworkers [21] observed an increase in the photopic b-wave amplitude between P30 and P90 in the Wt control pigs, similar to our findings (Figure 5). The same investigators reported an increase in the flicker ERG amplitude in the Wt control pigs between P30 and P90; however, the flicker ERG amplitude in the current study was not significantly different between P30 and P90 in the Wt pig (Figure 5). Of note, Scott et al. [21] reported that the cone and flicker ERG responses were similar in the Wt and TgP23H pigs up to 2 months with a decline in these parameters thereafter in the TgP23H pig. In our study, however, we observed a statistically significantly decreased flicker ERG response and progressively decreasing cone and flicker ERG responses from P30 to P90 in the TgP23H pig compared to the Wt pig (Figure 5). The reason for this inconsistent observation is unknown; however, it might be attributable to genetic variability in the P23H Tg minipig-WT minipig cross reported by Scott et al. versus the P23H Tg minipig-WT domestic pig cross used in our studies.
Although several rodent models of retinal degeneration have been developed, it is challenging to obtain detailed anatomical information on the retina with SD-OCT due to the small size of the rodent eye [69]. However, commercially available OCT instruments can obtain high-resolution retinal imaging in the porcine model, since the pig eye is similar in size to the human eye. It should be noted that photoreceptor degeneration rates may be different between the posterior and peripheral retina in the TgP23H pig [21]. In addition, we observed differential rates of photoreceptor degeneration in the superior versus inferior retina in this RP model (Figure 1 and Figure 2, and 4). Our study focused on the posterior retina centered on the optic nerve head, as it is less reliable to use the 30-degree OCT lens to study the peripheral retina. With the advent of wide-field SD-OCT imaging, additional studies on the peripheral retina and topographical variability in photoreceptor degeneration may provide additional baseline data in this retinal degeneration model.
In summary, we characterized the SD-OCT changes in the TgP23H pig throughout the course of rapid photoreceptor degeneration (i.e., P30 to P90). Our results demonstrate that progression of photoreceptor cell loss as measured by SD-OCT corresponds to light microscopic analysis and ERG changes in the TgP23H pig over time. Herein, we have demonstrated that SD-OCT can be employed for longitudinal assessment of retinal degeneration in natural history or observational studies of disease progression as well as preclinical studies of emerging novel treatments for inherited retinal degeneration using the porcine model.
4. Materials and Methods
4.1. Animals
Male and female TgP23H and Wt hybrid littermates were produced by inseminating domestic swine with semen from TgP23H mini-swine (Founder line 53-1) as previously described [20] and obtained from the National Swine Resource and Research Center at the University of Missouri in Columbia, MO. All pigs were kept under a 12-hour on/12-hour off light/dark schedule with free access to food and water. All procedures were performed with approval by the Institutional Animal Care and Use Committee of Baylor Scott & White Health (AUP# 2014-008) and adhered to the ARVO Statement for the Use of Animals in Ophthalmic and Vision Research.
4.2. Spectral Domain Optical Coherence Tomography (Sd-Oct)
The Heidelberg Spectralis HRA+OCT was used to document the microarchitecture of the retina in animal subjects as we previously described [30,31]. Male and female TgP23H and Wt pigs were imaged at postnatal days 30, 60, and 90 (P30, P60, P90). The images were acquired from at least 6 eyes from 6 pigs of each group at each time point. Before imaging, the animals were sedated and all experimental protocols were performed under 2% to 4% isoflurane anesthesia. Pupils were dilated with 1% tropicamide eye drops (Bausch & Lomb Inc, Tampa, FL) before image acquisition. Artificial tears (Refresh Optive®, Allergan Inc, Irvine, CA) were administered throughout the procedure to maintain corneal hydration. The images were taken with the equipment set at 30° field of view and analyzed with the software Heidelberg Eye Explorer (HEYEX version 6.6, Heidelberg, Germany).
With the standardized fundus image, the position of the eye was maintained using the orientation of the optic disc and all SD-OCT scans were acquired in the same position. Seven vertical scans with an inter-scan distance at 240 µm were obtained along the vertical meridian through the optic disc by SD-OCT. To increase the signal-to-noise ratio, 100 frames were averaged per B-scan and signal quality was greater than 25 db with a scan speed of 40,000 A-scans per second. The high-resolution mode was used with axial resolution at 3.9 µm digital and lateral resolution at 6 µm digital.
To obtain measurements from the SD-OCT B-scan, layer lines automatically defined by Heidelberg software were manually adjusted. For segmentation analysis, total retinal thickness (TRT) was measured from the internal limiting membrane (ILM) to the interdigitation zone (IZ)-retinal pigment epithelium (RPE). The thickness of the outer nuclear layer (ONL) to IZ-RPE was measured to provide consistent measurements across all time points, because the ONL thickness decreased rapidly by P90. The thickness was measured on B-scans at 500 µm intervals along the vertical meridian from the optic disc and across the full length of the SD-OCT scan in the superior (7000 µm) and inferior (6000 µm) retina.
The reflective densities of the ellipsoid zone (EZ) and IZ-RPE bands were measured as previously described [32,33]. SD-OCT B-scans were exported and converted into 8-bit grayscale images. Images were then processed with the ImageJ software package (Version 1.51j8; National Institutes of Health, Bethesda, MA), and relative EZ or IZ-RPE intensities were measured as band intensity value divided by the external limiting membrane (ELM) intensity value along the vertical meridian from the optic disc and across the full length (7000 µm) of the SD-OCT scan in the superior retina.
The average thickness and reflective density were calculated by averaging the 6 measurements obtained at 500 µm intervals from 2,500 µm to 5000 µm from the superior edge of the optic disc in the superior retina in each eye. The overall average retinal layer thickness and reflective density were calculated from 6 different eyes at each time point and presented as mean ± SEM.
4.3. Tissue Preparation for Morphological Analyses
Pigs were euthanized via exsanguination under isoflurane anesthesia after SD-OCT image acquisition. The eyes were enucleated and immediately placed in 4% paraformaldehyde (PFA). The anterior segment, lens, and vitreous were removed, leaving a posterior eyecup that contained the sclera, choroid, RPE, and neural retina. Every effort was made to avoid separation of the neuronal retina from the RPE during dissection and processing of the posterior eyecup. The posterior segment was then post-fixed by immersion in 2% PFA/2% glutaraldehyde in phosphate-buffered saline (PBS) at 4°C for 48 h. Then, a 3-mm-wide strip of retinal tissue was dissected along the vertical meridian to include the optic disc and ora serrata. Following rinsing, secondary fixation in buffered 1% osmium tetroxide, final rinsing, and dehydration, the tissue was embedded in Eponate 12 resin (Ted Pella, Redding, CA). Blocks of retinal tissue were cut into 500-nm-thick sections using the RMC PowerTome X Ultramicrotome (Boeckeler Instruments, Tucson, AZ), stained with 1% toluidine blue (Sigma-Aldrich, St. Louis, MO), covered with a coverslip, and examined with light microscopy. Four eyes were processed for epoxy resin-embedded light microscopy at each time point.
4.4. Electroretinography (Erg)
Full field electroretinograms (ERG) of the pigs were recorded at P30, P60, and P90 with the ESPION System (Diagnosys LLC). After sedation and induction with isoflurane anesthesia, two contact ear electrodes were placed with conducting gel on the right and left ears. A contact lens electrode with lubricant gel was placed on the cornea of each eye. After 10 minutes of light adaptation, the photopic ERG was recorded to strobe flash intensity of 3.0 cd·s·m-2 with an interstimulus interval of 1 second. The 30Hz flicker ERG (3.0 cd·s·m-2) was then recorded. An averaged response was constructed based on 5-10 presentations.
4.5. Data Analysis
All data are presented as mean ± SEM and were analyzed using GraphPad Prism 6.0 (GraphPad Software, Inc., LaJolla, CA). Two-way ANOVA followed by Tukey’s test was used in multiple group comparisons. Differences were considered significant at P<0.05.
Author Contributions
Conceptualization, RHR; Conducting Experiments, WX, MZ, ST, RHR, MGS, LBP; Methodology, RHR, TWH, LK, WX, MZ, LBP; Data Analysis, WX, MZ, RHR. Writing-Original Draft Preparation, WX, MZ; Writing – Review & Editing, RHR, TWH, LK, NJR; Funding Acquisition, RHR, LK, TWH. All authors read and approved the final version of the manuscript.
Funding
Supported by the Liles Macular Degeneration Research Fund (RHR), Kruse Chair Endowment (LK), Baylor Scott & White-Central Texas Foundation (RHR, LK), Ophthalmic Vascular Research Program of Baylor Scott & White Health (LK), Retina Research Foundation (LK), NIH NEI R01EY024624 (TWH) and R21EY024406 (TWH).
Institutional Review Board Statement
The experimental procedures and protocols were carried out under the guidance of the Animal Care and Use Committee at Baylor Scott & White Health.
Informed Consent Statement
Not applicable.
Data Availability Statement
The datasets generated and/or analyzed for the current study are available from the corresponding authors upon reasonable request.
Conflicts of Interest
All authors declare that they have no conflicts of interest. The funders had no role in the design of the study; in the collection, analyses, or interpretation of data; in the writing of the manuscript, or in the decision to publish the results.
References
- Daiger, S.P. RetNet - Retinal Information Network. Available online: https://retnet.org/disease#67 (accessed on December 11, 2025).
- Dryja, T.P.; McGee, T.L.; Reichel, E.; Hahn, L.B.; Cowley, G.S.; Yandell, D.W.; Sandberg, M.A.; Berson, E.L. A point mutation of the rhodopsin gene in one form of retinitis pigmentosa. Nature 1990, 343, 364-366. [CrossRef]
- Vaithinathan, R.; Berson, E.L.; Dryja, T.P. Further screening of the rhodopsin gene in patients with autosomal dominant retinitis pigmentosa. Genomics 1994, 21, 461-463. [CrossRef]
- Dryja, T.P.; McEvoy, J.A.; McGee, T.L.; Berson, E.L. Novel rhodopsin mutations Gly114Val and Gln184Pro in dominant retinitis pigmentosa. Invest Ophthalmol Vis Sci 2000, 41, 3124-3127.
- Sohocki, M.M.; Daiger, S.P.; Bowne, S.J.; Rodriquez, J.A.; Northrup, H.; Heckenlively, J.R.; Birch, D.G.; Mintz-Hittner, H.; Ruiz, R.S.; Lewis, R.A.; et al. Prevalence of mutations causing retinitis pigmentosa and other inherited retinopathies. Hum Mutat 2001, 17, 42-51. [CrossRef]
- Olsson, J.E.; Gordon, J.W.; Pawlyk, B.S.; Roof, D.; Hayes, A.; Molday, R.S.; Mukai, S.; Cowley, G.S.; Berson, E.L.; Dryja, T.P. Transgenic mice with a rhodopsin mutation (Pro23His): a mouse model of autosomal dominant retinitis pigmentosa. Neuron 1992, 9, 815-830. [CrossRef]
- Naash, M.I.; Hollyfield, J.G.; al-Ubaidi, M.R.; Baehr, W. Simulation of human autosomal dominant retinitis pigmentosa in transgenic mice expressing a mutated murine opsin gene. Proc Natl Acad Sci U S A 1993, 90, 5499-5503. [CrossRef]
- Goto, Y.; Peachey, N.S.; Ripps, H.; Naash, M.I. Functional abnormalities in transgenic mice expressing a mutant rhodopsin gene. Invest Ophthalmol Vis Sci 1995, 36, 62-71.
- Lewin, A.S.; Drenser, K.A.; Hauswirth, W.W.; Nishikawa, S.; Yasumura, D.; Flannery, J.G.; LaVail, M.M. Ribozyme rescue of photoreceptor cells in a transgenic rat model of autosomal dominant retinitis pigmentosa. Nat Med 1998, 4, 967-971. [CrossRef]
- Machida, S.; Kondo, M.; Jamison, J.A.; Khan, N.W.; Kononen, L.T.; Sugawara, T.; Bush, R.A.; Sieving, P.A. P23H rhodopsin transgenic rat: correlation of retinal function with histopathology. Invest Ophthalmol Vis Sci 2000, 41, 3200-3209.
- Sakami, S.; Kolesnikov, A.V.; Kefalov, V.J.; Palczewski, K. P23H opsin knock-in mice reveal a novel step in retinal rod disc morphogenesis. Hum Mol Genet 2014, 23, 1723-1741. [CrossRef]
- Beauchemin, M.L. The fine structure of the pig's retina. Albrecht Von Graefes Arch Klin Exp Ophthalmol 1974, 190, 27-45. [CrossRef]
- Chandler, M.J.; Smith, P.J.; Samuelson, D.A.; MacKay, E.O. Photoreceptor density of the domestic pig retina. Vet Ophthalmol 1999, 2, 179-184. [CrossRef]
- Petters, R.M.; Alexander, C.A.; Wells, K.D.; Collins, E.B.; Sommer, J.R.; Blanton, M.R.; Rojas, G.; Hao, Y.; Flowers, W.L.; Banin, E.; et al. Genetically engineered large animal model for studying cone photoreceptor survival and degeneration in retinitis pigmentosa. Nat Biotechnol 1997, 15, 965-970. [CrossRef]
- Li, Z.Y.; Wong, F.; Chang, J.H.; Possin, D.E.; Hao, Y.; Petters, R.M.; Milam, A.H. Rhodopsin transgenic pigs as a model for human retinitis pigmentosa. Invest Ophthalmol Vis Sci 1998, 39, 808-819.
- Sommer, J.R.; Estrada, J.L.; Collins, E.B.; Bedell, M.; Alexander, C.A.; Yang, Z.; Hughes, G.; Mir, B.; Gilger, B.C.; Grob, S.; et al. Production of ELOVL4 transgenic pigs: a large animal model for Stargardt-like macular degeneration. Br J Ophthalmol 2011, 95, 1749-1754. [CrossRef]
- Noel, J.M.; Fernandez de Castro, J.P.; Demarco, P.J., Jr.; Franco, L.M.; Wang, W.; Vukmanic, E.V.; Peng, X.; Sandell, J.H.; Scott, P.A.; Kaplan, H.J.; et al. Iodoacetic acid, but not sodium iodate, creates an inducible swine model of photoreceptor damage. Exp Eye Res 2012, 97, 137-147. [CrossRef]
- Scott, P.A.; Kaplan, H.J.; McCall, M.A. Prenatal Exposure to Curcumin Protects Rod Photoreceptors in a Transgenic Pro23His Swine Model of Retinitis Pigmentosa. Transl Vis Sci Technol 2015, 4, 5. [CrossRef]
- Ross, J.W.; Fernandez de Castro, J.P.; Zhao, J.; Samuel, M.; Walters, E.; Rios, C.; Bray-Ward, P.; Jones, B.W.; Marc, R.E.; Wang, W.; et al. Generation of an inbred miniature pig model of retinitis pigmentosa. Invest Ophthalmol Vis Sci 2012, 53, 501-507. [CrossRef]
- Fernandez de Castro, J.P.; Scott, P.A.; Fransen, J.W.; Demas, J.; DeMarco, P.J.; Kaplan, H.J.; McCall, M.A. Cone photoreceptors develop normally in the absence of functional rod photoreceptors in a transgenic swine model of retinitis pigmentosa. Invest Ophthalmol Vis Sci 2014, 55, 2460-2468. [CrossRef]
- Scott, P.A.; de Castro, J.P.; DeMarco, P.J.; Ross, J.W.; Njoka, J.; Walters, E.; Prather, R.S.; McCall, M.A.; Kaplan, H.J. Progression of Pro23His Retinopathy in a Miniature Swine Model of Retinitis Pigmentosa. Transl Vis Sci Technol 2017, 6, 4. [CrossRef]
- Ryals, R.C.; Andrews, M.D.; Datta, S.; Coyner, A.S.; Fischer, C.M.; Wen, Y.; Pennesi, M.E.; McGill, T.J. Long-term Characterization of Retinal Degeneration in Royal College of Surgeons Rats Using Spectral-Domain Optical Coherence Tomography. Invest Ophthalmol Vis Sci 2017, 58, 1378-1386. [CrossRef]
- Tsai, S.H.; Xie, W.; Zhao, M.; Rosa, R.H., Jr.; Hein, T.W.; Kuo, L. Alterations of Ocular Hemodynamics Impair Ophthalmic Vascular and Neuroretinal Function. Am J Pathol 2018, 188, 818-827. [CrossRef]
- Zhao, M.; Xie, W.; Tsai, S.H.; Hein, T.W.; Rocke, B.A.; Kuo, L.; Rosa, R.H., Jr. Intravitreal Stanniocalcin-1 Enhances New Blood Vessel Growth in a Rat Model of Laser-Induced Choroidal Neovascularization. Invest Ophthalmol Vis Sci 2018, 59, 1125-1133. [CrossRef]
- Rosa, R.H., Jr.; Xie, W.; Zhao, M.; Tsai, S.H.; Roddy, G.W.; Su, M.G.; Potts, L.B.; Hein, T.W.; Kuo, L. Intravitreal Administration of Stanniocalcin-1 Rescues Photoreceptor Degeneration with Reduced Oxidative Stress and Inflammation in a Porcine Model of Retinitis Pigmentosa. Am J Ophthalmol 2022, 239, 230-243. [CrossRef]
- Lima, L.H.; Sallum, J.M.; Spaide, R.F. Outer retina analysis by optical coherence tomography in cone-rod dystrophy patients. Retina 2013, 33, 1877-1880. [CrossRef]
- Ziccardi, L.; Giannini, D.; Lombardo, G.; Serrao, S.; Dell'Omo, R.; Nicoletti, A.; Bertelli, M.; Lombardo, M. Multimodal Approach to Monitoring and Investigating Cone Structure and Function in an Inherited Macular Dystrophy. Am J Ophthalmol 2015, 160, 301-312 e306. [CrossRef]
- Kominami, T.; Ueno, S.; Kominami, A.; Nakanishi, A.; Yasuda, S.; Piao, C.H.; Okado, S.; Terasaki, H. Associations Between Outer Retinal Structures and Focal Macular Electroretinograms in Patients With Retinitis Pigmentosa. Invest Ophthalmol Vis Sci 2017, 58, 5122-5128. [CrossRef]
- Yoon, C.K.; Yu, H.G. Ganglion cell-inner plexiform layer and retinal nerve fibre layer changes within the macula in retinitis pigmentosa: a spectral domain optical coherence tomography study. Acta Ophthalmol 2018, 96, e180-e188. [CrossRef]
- Xie, W.; Zhao, M.; Tsai, S.H.; Burkes, W.L.; Potts, L.B.; Xu, W.; Payne, H.R.; Hein, T.W.; Kuo, L.; Rosa, R.H., Jr. Correlation of spectral domain optical coherence tomography with histology and electron microscopy in the porcine retina. Exp Eye Res 2018, 177, 181-190. [CrossRef]
- Xie, W.; Zhao, M.; Tsai, S.H.; Burkes, W.L.; Potts, L.B.; Xu, W.; Payne, H.R.; Hein, T.W.; Kuo, L.; Rosa, R.H., Jr. Data on SD-OCT image acquisition, ultrastructural features, and horizontal tissue shrinkage in the porcine retina. Data Brief 2018, 21, 1019-1025. [CrossRef]
- Hood, D.C.; Zhang, X.; Ramachandran, R.; Talamini, C.L.; Raza, A.; Greenberg, J.P.; Sherman, J.; Tsang, S.H.; Birch, D.G. The inner segment/outer segment border seen on optical coherence tomography is less intense in patients with diminished cone function. Invest Ophthalmol Vis Sci 2011, 52, 9703-9709. [CrossRef]
- Ha, A.; Kim, Y.K.; Jeoung, J.W.; Park, K.H. Ellipsoid Zone Change According to Glaucoma Stage Advancement. Am J Ophthalmol 2018, 192, 1-9. [CrossRef]
- Pennesi, M.E.; Michaels, K.V.; Magee, S.S.; Maricle, A.; Davin, S.P.; Garg, A.K.; Gale, M.J.; Tu, D.C.; Wen, Y.; Erker, L.R.; et al. Long-term characterization of retinal degeneration in rd1 and rd10 mice using spectral domain optical coherence tomography. Invest Ophthalmol Vis Sci 2012, 53, 4644-4656. [CrossRef]
- Cuenca, N.; Fernández-Sánchez, L.; Sauvé, Y.; Segura, F.J.; Martínez-Navarrete, G.; Tamarit, J.M.; Fuentes-Broto, L.; Sanchez-Cano, A.; Pinilla, I. Correlation between SD-OCT, immunocytochemistry and functional findings in an animal model of retinal degeneration. Front Neuroanat 2014, 8, 151. [CrossRef]
- Orhan, E.; Dalkara, D.; Neuillé, M.; Lechauve, C.; Michiels, C.; Picaud, S.; Léveillard, T.; Sahel, J.A.; Naash, M.I.; Lavail, M.M.; et al. Genotypic and phenotypic characterization of P23H line 1 rat model. PLoS One 2015, 10, e0127319. [CrossRef]
- Adachi, K.; Takahashi, S.; Yamauchi, K.; Mounai, N.; Tanabu, R.; Nakazawa, M. Optical Coherence Tomography of Retinal Degeneration in Royal College of Surgeons Rats and Its Correlation with Morphology and Electroretinography. PLoS One 2016, 11, e0162835. [CrossRef]
- Cheng, J.; Sohn, E.H.; Jiao, C.; Adler, K.L.; Kaalberg, E.E.; Russell, S.R.; Mullins, R.F.; Stone, E.M.; Tucker, B.A.; Han, I.C. Correlation of Optical Coherence Tomography and Retinal Histology in Normal and Pro23His Retinal Degeneration Pig. Transl Vis Sci Technol 2018, 7, 18. [CrossRef]
- Huckenpahler, A.L.; Carroll, J.; Salmon, A.E.; Sajdak, B.S.; Mastey, R.R.; Allen, K.P.; Kaplan, H.J.; McCall, M.A. Noninvasive Imaging and Correlative Histology of Cone Photoreceptor Structure in the Pig Retina. Transl Vis Sci Technol 2019, 8, 38. [CrossRef]
- Soukup, P.; Maloca, P.; Altmann, B.; Festag, M.; Atzpodien, E.A.; Pot, S. Interspecies Variation of Outer Retina and Choriocapillaris Imaged With Optical Coherence Tomography. Invest Ophthalmol Vis Sci 2019, 60, 3332-3342. [CrossRef]
- Aleman, T.S.; Cideciyan, A.V.; Sumaroka, A.; Windsor, E.A.; Herrera, W.; White, D.A.; Kaushal, S.; Naidu, A.; Roman, A.J.; Schwartz, S.B.; et al. Retinal laminar architecture in human retinitis pigmentosa caused by Rhodopsin gene mutations. Invest Ophthalmol Vis Sci 2008, 49, 1580-1590. [CrossRef]
- Strettoi, E.; Pignatelli, V. Modifications of retinal neurons in a mouse model of retinitis pigmentosa. Proc Natl Acad Sci U S A 2000, 97, 11020-11025. [CrossRef]
- Marc, R.E.; Jones, B.W.; Watt, C.B.; Strettoi, E. Neural remodeling in retinal degeneration. Prog Retin Eye Res 2003, 22, 607-655. [CrossRef]
- Phillips, M.J.; Otteson, D.C.; Sherry, D.M. Progression of neuronal and synaptic remodeling in the rd10 mouse model of retinitis pigmentosa. J Comp Neurol 2010, 518, 2071-2089. [CrossRef]
- Jones, B.W.; Pfeiffer, R.L.; Ferrell, W.D.; Watt, C.B.; Marmor, M.; Marc, R.E. Retinal remodeling in human retinitis pigmentosa. Exp Eye Res 2016, 150, 149-165. [CrossRef]
- Naash, M.L.; Peachey, N.S.; Li, Z.Y.; Gryczan, C.C.; Goto, Y.; Blanks, J.; Milam, A.H.; Ripps, H. Light-induced acceleration of photoreceptor degeneration in transgenic mice expressing mutant rhodopsin. Invest Ophthalmol Vis Sci 1996, 37, 775-782.
- Zhao, J.; Ueda, K.; Riera, M.; Kim, H.J.; Sparrow, J.R. Bisretinoids mediate light sensitivity resulting in photoreceptor cell degeneration in mice lacking the receptor tyrosine kinase Mer. J Biol Chem 2018, 293, 19400-19410. [CrossRef]
- Borrelli, E.; Abdelfattah, N.S.; Uji, A.; Nittala, M.G.; Boyer, D.S.; Sadda, S.R. Postreceptor Neuronal Loss in Intermediate Age-related Macular Degeneration. Am J Ophthalmol 2017, 181, 1-11. [CrossRef]
- Gin, T.J.; Wu, Z.; Chew, S.K.; Guymer, R.H.; Luu, C.D. Quantitative Analysis of the Ellipsoid Zone Intensity in Phenotypic Variations of Intermediate Age-Related Macular Degeneration. Invest Ophthalmol Vis Sci 2017, 58, 2079-2086. [CrossRef]
- Toprak, I.; Yildirim, C.; Yaylali, V. Impaired photoreceptor inner segment ellipsoid layer reflectivity in mild diabetic retinopathy. Can J Ophthalmol 2015, 50, 438-441. [CrossRef]
- Gong, Y.; Chen, L.J.; Pang, C.P.; Chen, H. Ellipsoid zone optical intensity reduction as an early biomarker for retinitis pigmentosa. Acta Ophthalmol 2021, 99, e215-e221. [CrossRef]
- Spaide, R.F.; Curcio, C.A. Anatomical correlates to the bands seen in the outer retina by optical coherence tomography: literature review and model. Retina 2011, 31, 1609-1619. [CrossRef]
- Sundaram, V.; Wilde, C.; Aboshiha, J.; Cowing, J.; Han, C.; Langlo, C.S.; Chana, R.; Davidson, A.E.; Sergouniotis, P.I.; Bainbridge, J.W.; et al. Retinal structure and function in achromatopsia: implications for gene therapy. Ophthalmology 2014, 121, 234-245. [CrossRef]
- Tao, L.W.; Wu, Z.; Guymer, R.H.; Luu, C.D. Ellipsoid zone on optical coherence tomography: a review. Clin Exp Ophthalmol 2016, 44, 422-430. [CrossRef]
- Stone, J.; van Driel, D.; Valter, K.; Rees, S.; Provis, J. The locations of mitochondria in mammalian photoreceptors: relation to retinal vasculature. Brain Res 2008, 1189, 58-69. [CrossRef]
- Litts, K.M.; Zhang, Y.; Freund, K.B.; Curcio, C.A. Optical coherence tomography and histology of age-related macular degeneration support mitochondria as reflectivity sources. Retina 2018, 38, 445-461. [CrossRef]
- Nakanishi, A.; Ueno, S.; Kawano, K.; Ito, Y.; Kominami, T.; Yasuda, S.; Kondo, M.; Tsunoda, K.; Iwata, T.; Terasaki, H. Pathologic Changes of Cone Photoreceptors in Eyes With Occult Macular Dystrophy. Invest Ophthalmol Vis Sci 2015, 56, 7243-7249. [CrossRef]
- Sousa, K.; Fernandes, T.; Gentil, R.; Mendonça, L.; Falcão, M. Outer retinal layers as predictors of visual acuity in retinitis pigmentosa: a cross-sectional study. Graefes Arch Clin Exp Ophthalmol 2019, 257, 265-271. [CrossRef]
- Staurenghi, G.; Sadda, S.; Chakravarthy, U.; Spaide, R.F. Proposed lexicon for anatomic landmarks in normal posterior segment spectral-domain optical coherence tomography: the IN•OCT consensus. Ophthalmology 2014, 121, 1572-1578. [CrossRef]
- Jonnal, R.S.; Gorczynska, I.; Migacz, J.V.; Azimipour, M.; Zawadzki, R.J.; Werner, J.S. The Properties of Outer Retinal Band Three Investigated With Adaptive-Optics Optical Coherence Tomography. Invest Ophthalmol Vis Sci 2017, 58, 4559-4568. [CrossRef]
- Cuenca, N.; Ortuño-Lizarán, I.; Pinilla, I. Cellular Characterization of OCT and Outer Retinal Bands Using Specific Immunohistochemistry Markers and Clinical Implications. Ophthalmology 2018, 125, 407-422. [CrossRef]
- Szamier, R.B.; Berson, E.L.; Klein, R.; Meyers, S. Sex-linked retinitis pigmentosa: ultrastructure of photoreceptors and pigment epithelium. Invest Ophthalmol Vis Sci 1979, 18, 145-160.
- Curcio, C.A.; Sparrow, J.R.; Bonilha, V.L.; Pollreisz, A.; Lujan, B.J. Re: Cuenca et al.: Cellular characterization of OCT and outer retinal bands using specific immunohistochemistry markers and clinical implications (Ophthalmology. 2018;125;407-422). Ophthalmology 2018, 125, e47-e48. [CrossRef]
- Wilk, M.A.; Huckenpahler, A.L.; Collery, R.F.; Link, B.A.; Carroll, J. The Effect of Retinal Melanin on Optical Coherence Tomography Images. Transl Vis Sci Technol 2017, 6, 8. [CrossRef]
- Lapierre-Landry, M.; Huckenpahler, A.L.; Link, B.A.; Collery, R.F.; Carroll, J.; Skala, M.C. Imaging Melanin Distribution in the Zebrafish Retina Using Photothermal Optical Coherence Tomography. Transl Vis Sci Technol 2018, 7, 4. [CrossRef]
- Harper, D.J.; Konegger, T.; Augustin, M.; Schützenberger, K.; Eugui, P.; Lichtenegger, A.; Merkle, C.W.; Hitzenberger, C.K.; Glösmann, M.; Baumann, B. Hyperspectral optical coherence tomography for in vivo visualization of melanin in the retinal pigment epithelium. J Biophotonics 2019, 12, e201900153. [CrossRef]
- Meleppat, R.K.; Zhang, P.; Ju, M.J.; Manna, S.K.; Jian, Y.; Pugh, E.N.; Zawadzki, R.J. Directional optical coherence tomography reveals melanin concentration-dependent scattering properties of retinal pigment epithelium. J Biomed Opt 2019, 24, 1-10. [CrossRef]
- Wang, R.; Jiang, C.; Ma, J.; Young, M.J. Monitoring morphological changes in the retina of rhodopsin-/- mice with spectral domain optical coherence tomography. Invest Ophthalmol Vis Sci 2012, 53, 3967-3972. [CrossRef]
- Pinilla, I.; Fernández-Sánchez, L.; Segura, F.J.; Sánchez-Cano, A.I.; Tamarit, J.M.; Fuentes-Broto, L.; Eells, J.T.; Lax, P.; Cuenca, N. Long time remodeling during retinal degeneration evaluated by optical coherence tomography, immunocytochemistry and fundus autofluorescence. Exp Eye Res 2016, 150, 122-134. [CrossRef]
Figure 1.
Representative SD-OCT images acquired approximately 4000 µm from the optic nerve head in the superior and inferior retina in Wt and TgP23H pigs. Abbreviations: NFL, nerve fiber layer; GCL, ganglion cell layer; IPL, inner plexiform layer; INL, inner nuclear layer; OPL, outer plexiform layer; ONL, outer nuclear layer; ELM, external limiting membrane; EZ, ellipsoid zone; IZ-RPE, interdigitation zone-retinal pigment epithelium. Note the hyperreflective band in the INL (arrowheads) which correlates with abundant mitochondria in horizontal cell processes and adjacent bipolar cells [30,31]. Scale bar: 50 microns.
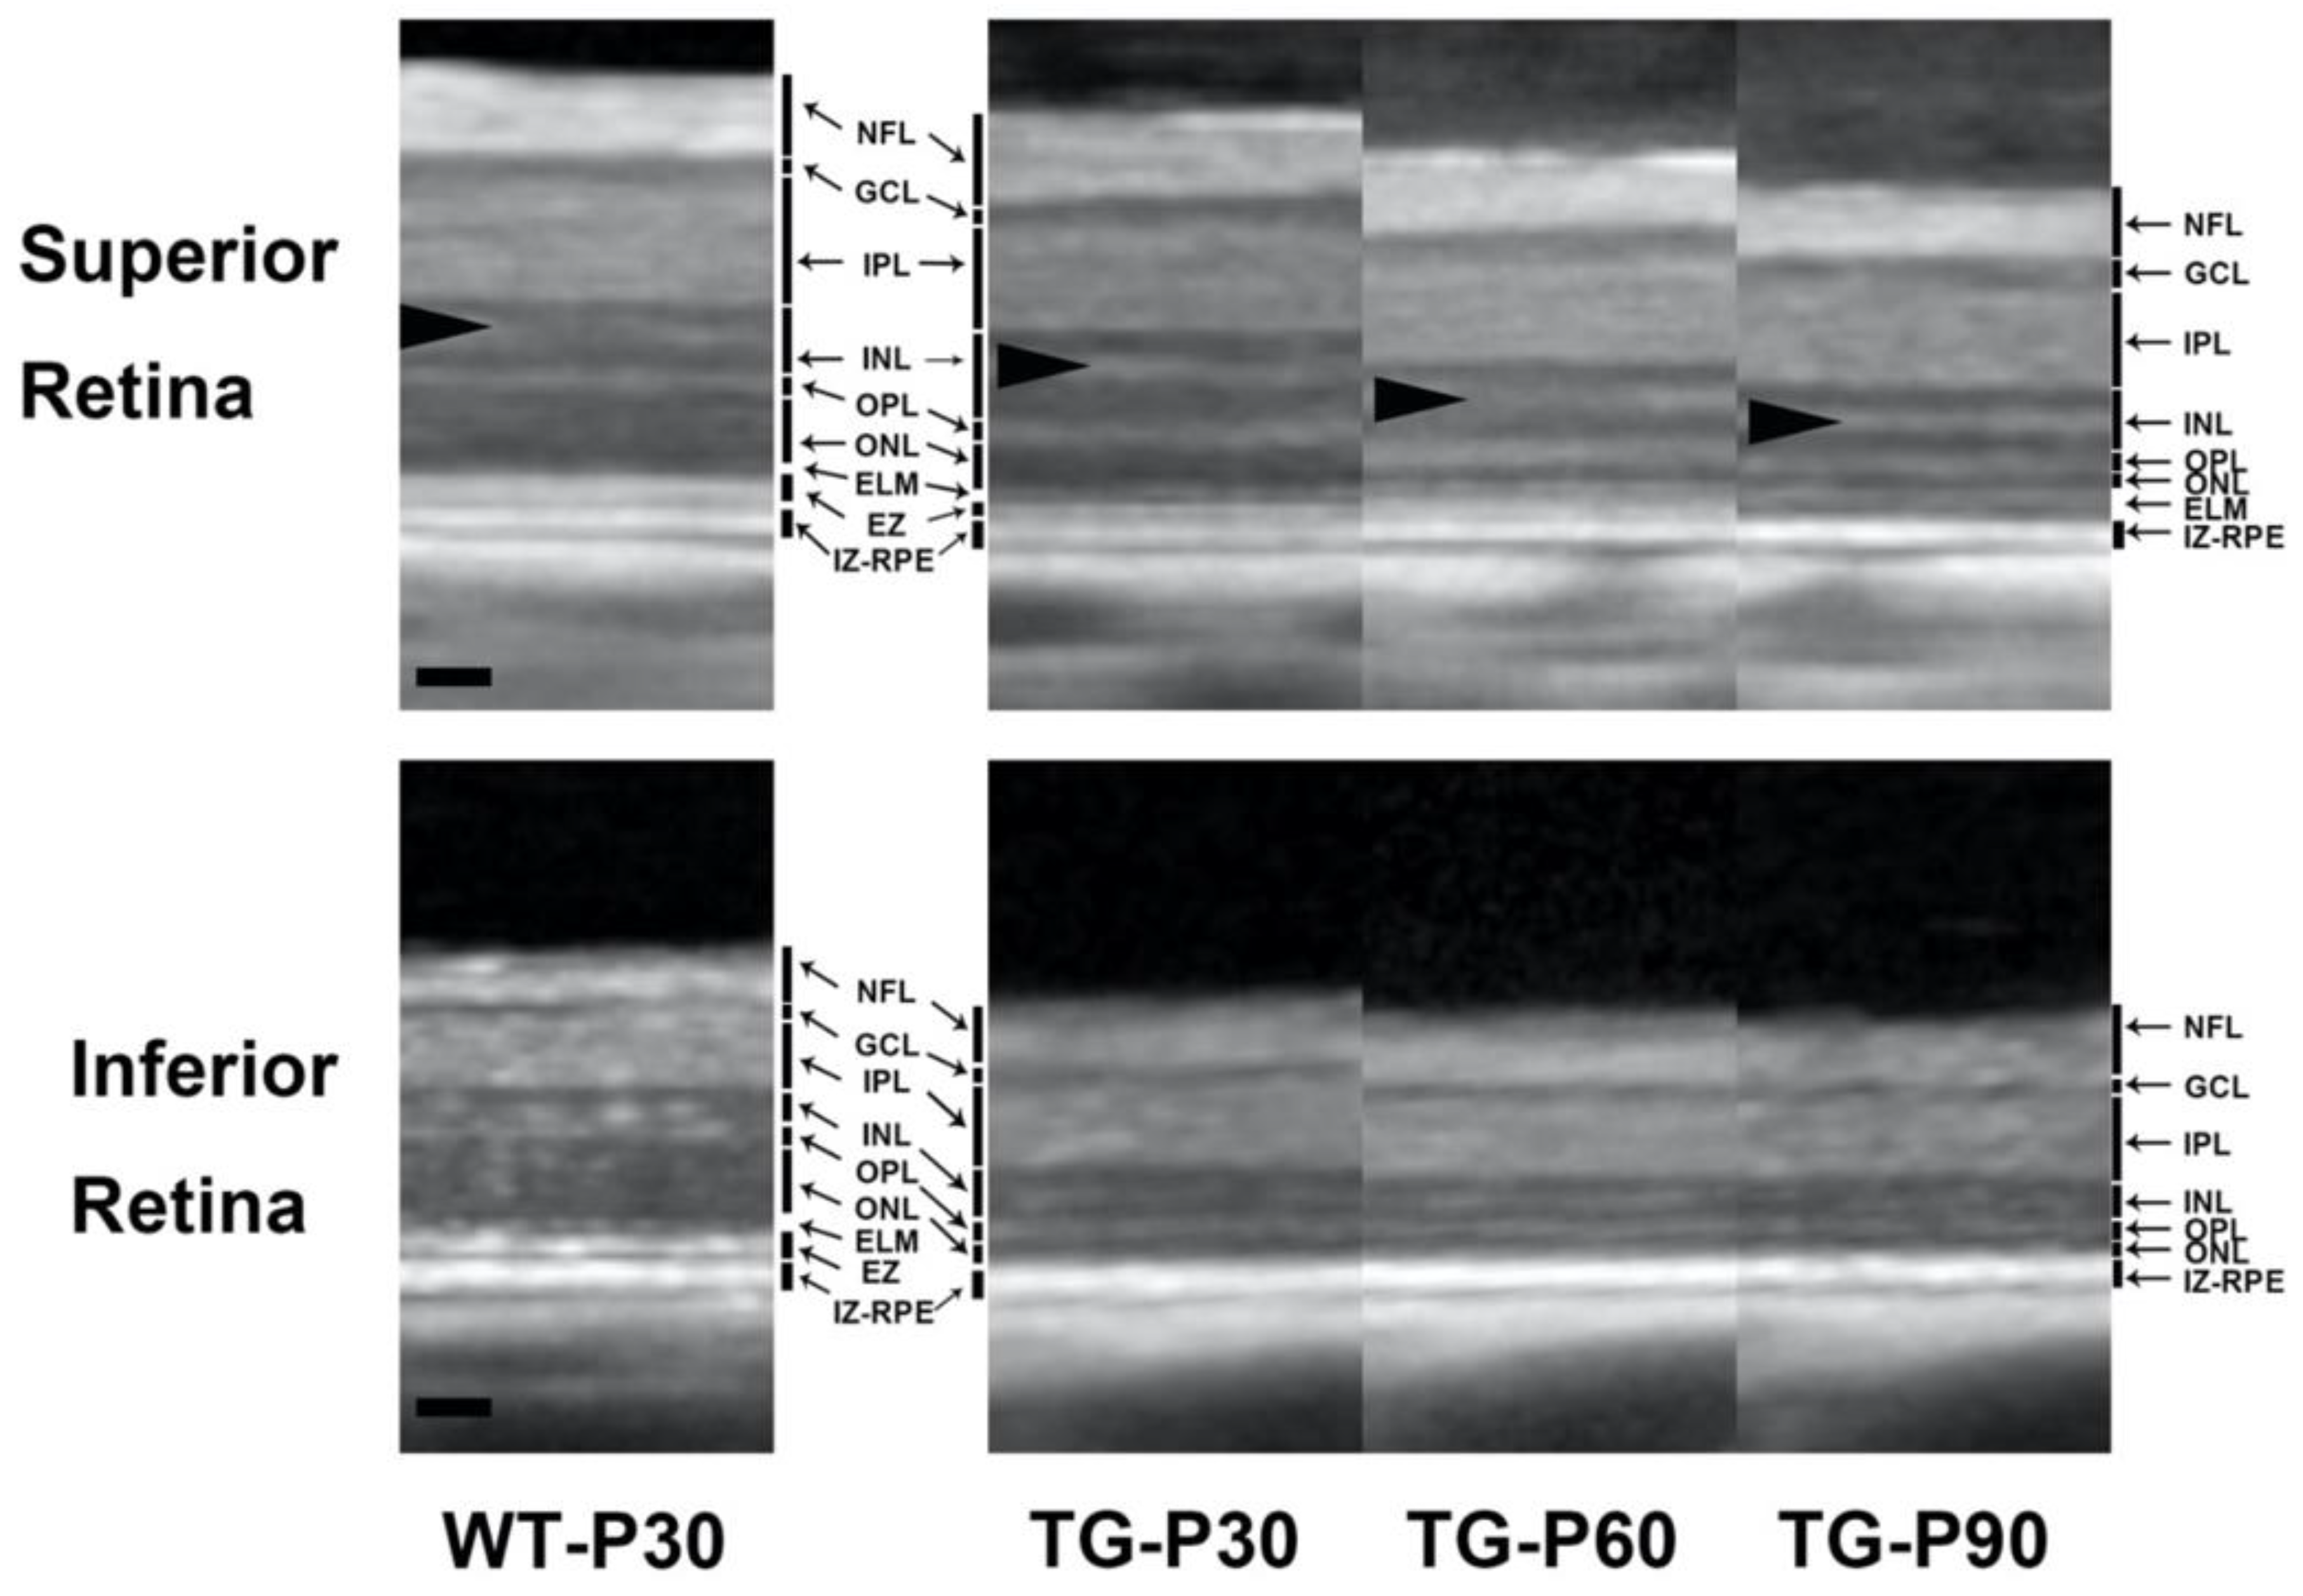
Figure 2.
Representative SD-OCT scan of the superior retina from the Wt and TgP23H pigs (A). The right panels show a higher magnification of SD-OCT image about 4000 µm from the optic nerve head. The thickness of the total retina (B), ILM to IPL (C), INL (D), ONL to EZ (E) was measured by averaging 6 measurements obtained at 500 µm intervals from 2500 µm to 5000 µm from the superior edge of the optic disc in the superior retina in each eye of the Wt and TgP23H pigs. Note the hyperreflective retinal vessel (white arrow) in the TgP23H pig OCT images, indicating repeatability of imaging analysis. Note also the hyperreflective band in the INL (arrowheads). Two-way ANOVA multiple comparison was used to compare the retinal layer thickness between the animals at each time point. Spidergrams were constructed to plot the total retinal thickness (F) and ONL to IZ-RPE thickness (G) which were obtained by averaging the inferior and superior SD-OCT scans, respectively, against the distance from the optic nerve head. *P<0.05. N=6 eyes. Scale bar: 200 microns.
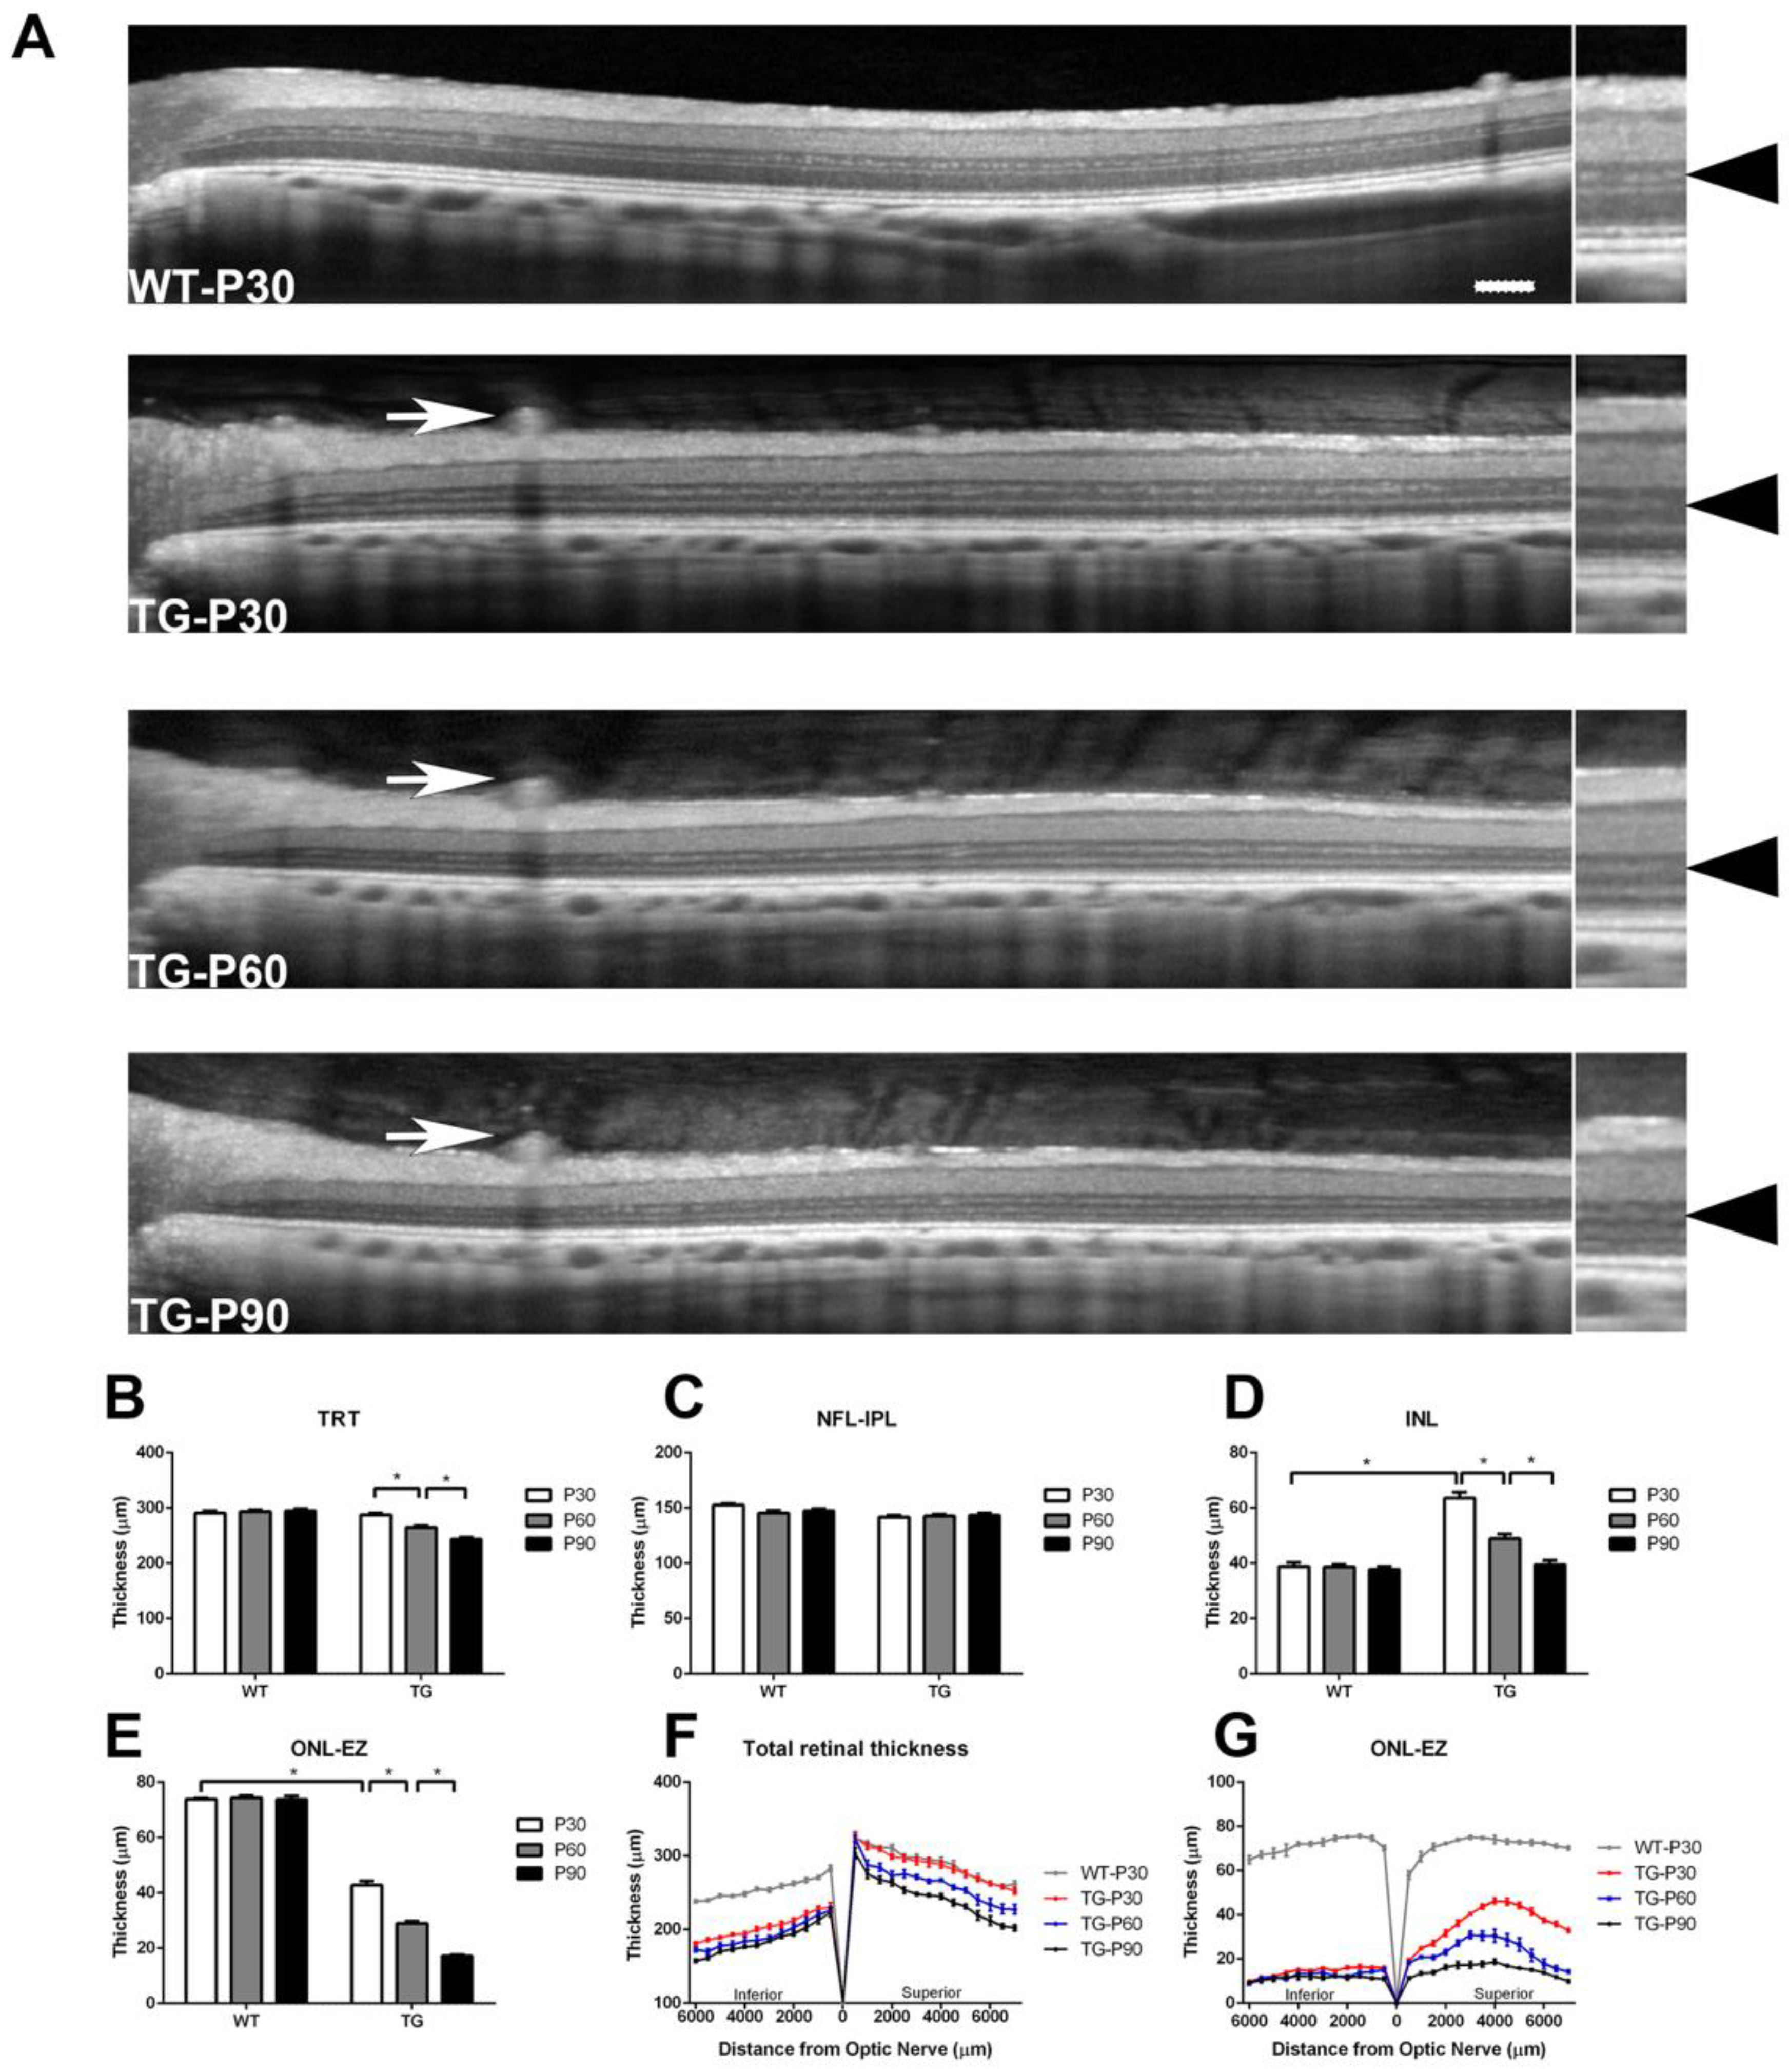
Figure 3.
Representative SD-OCT scans with the intensity profile of the outer retina acquired about 4000 µm from the optic nerve head in the superior retina in Wt and TgP23H pigs (A). The intensity of EZ and IZ-RPE was measured by averaging 6 measurements (each sample was 100 µm in width) obtained at 500 µm intervals from 2500 µm to 5000 µm from the superior edge of the optic disc in the superior retina in each eye of the Wt and TgP23H pigs. The relative EZ (B) and IZ-RPE (C) intensity was then divided by the value of the ELM intensity in corresponding regions of the retina. *P<0.05. N=6 eyes. Scale bar: 50 microns.
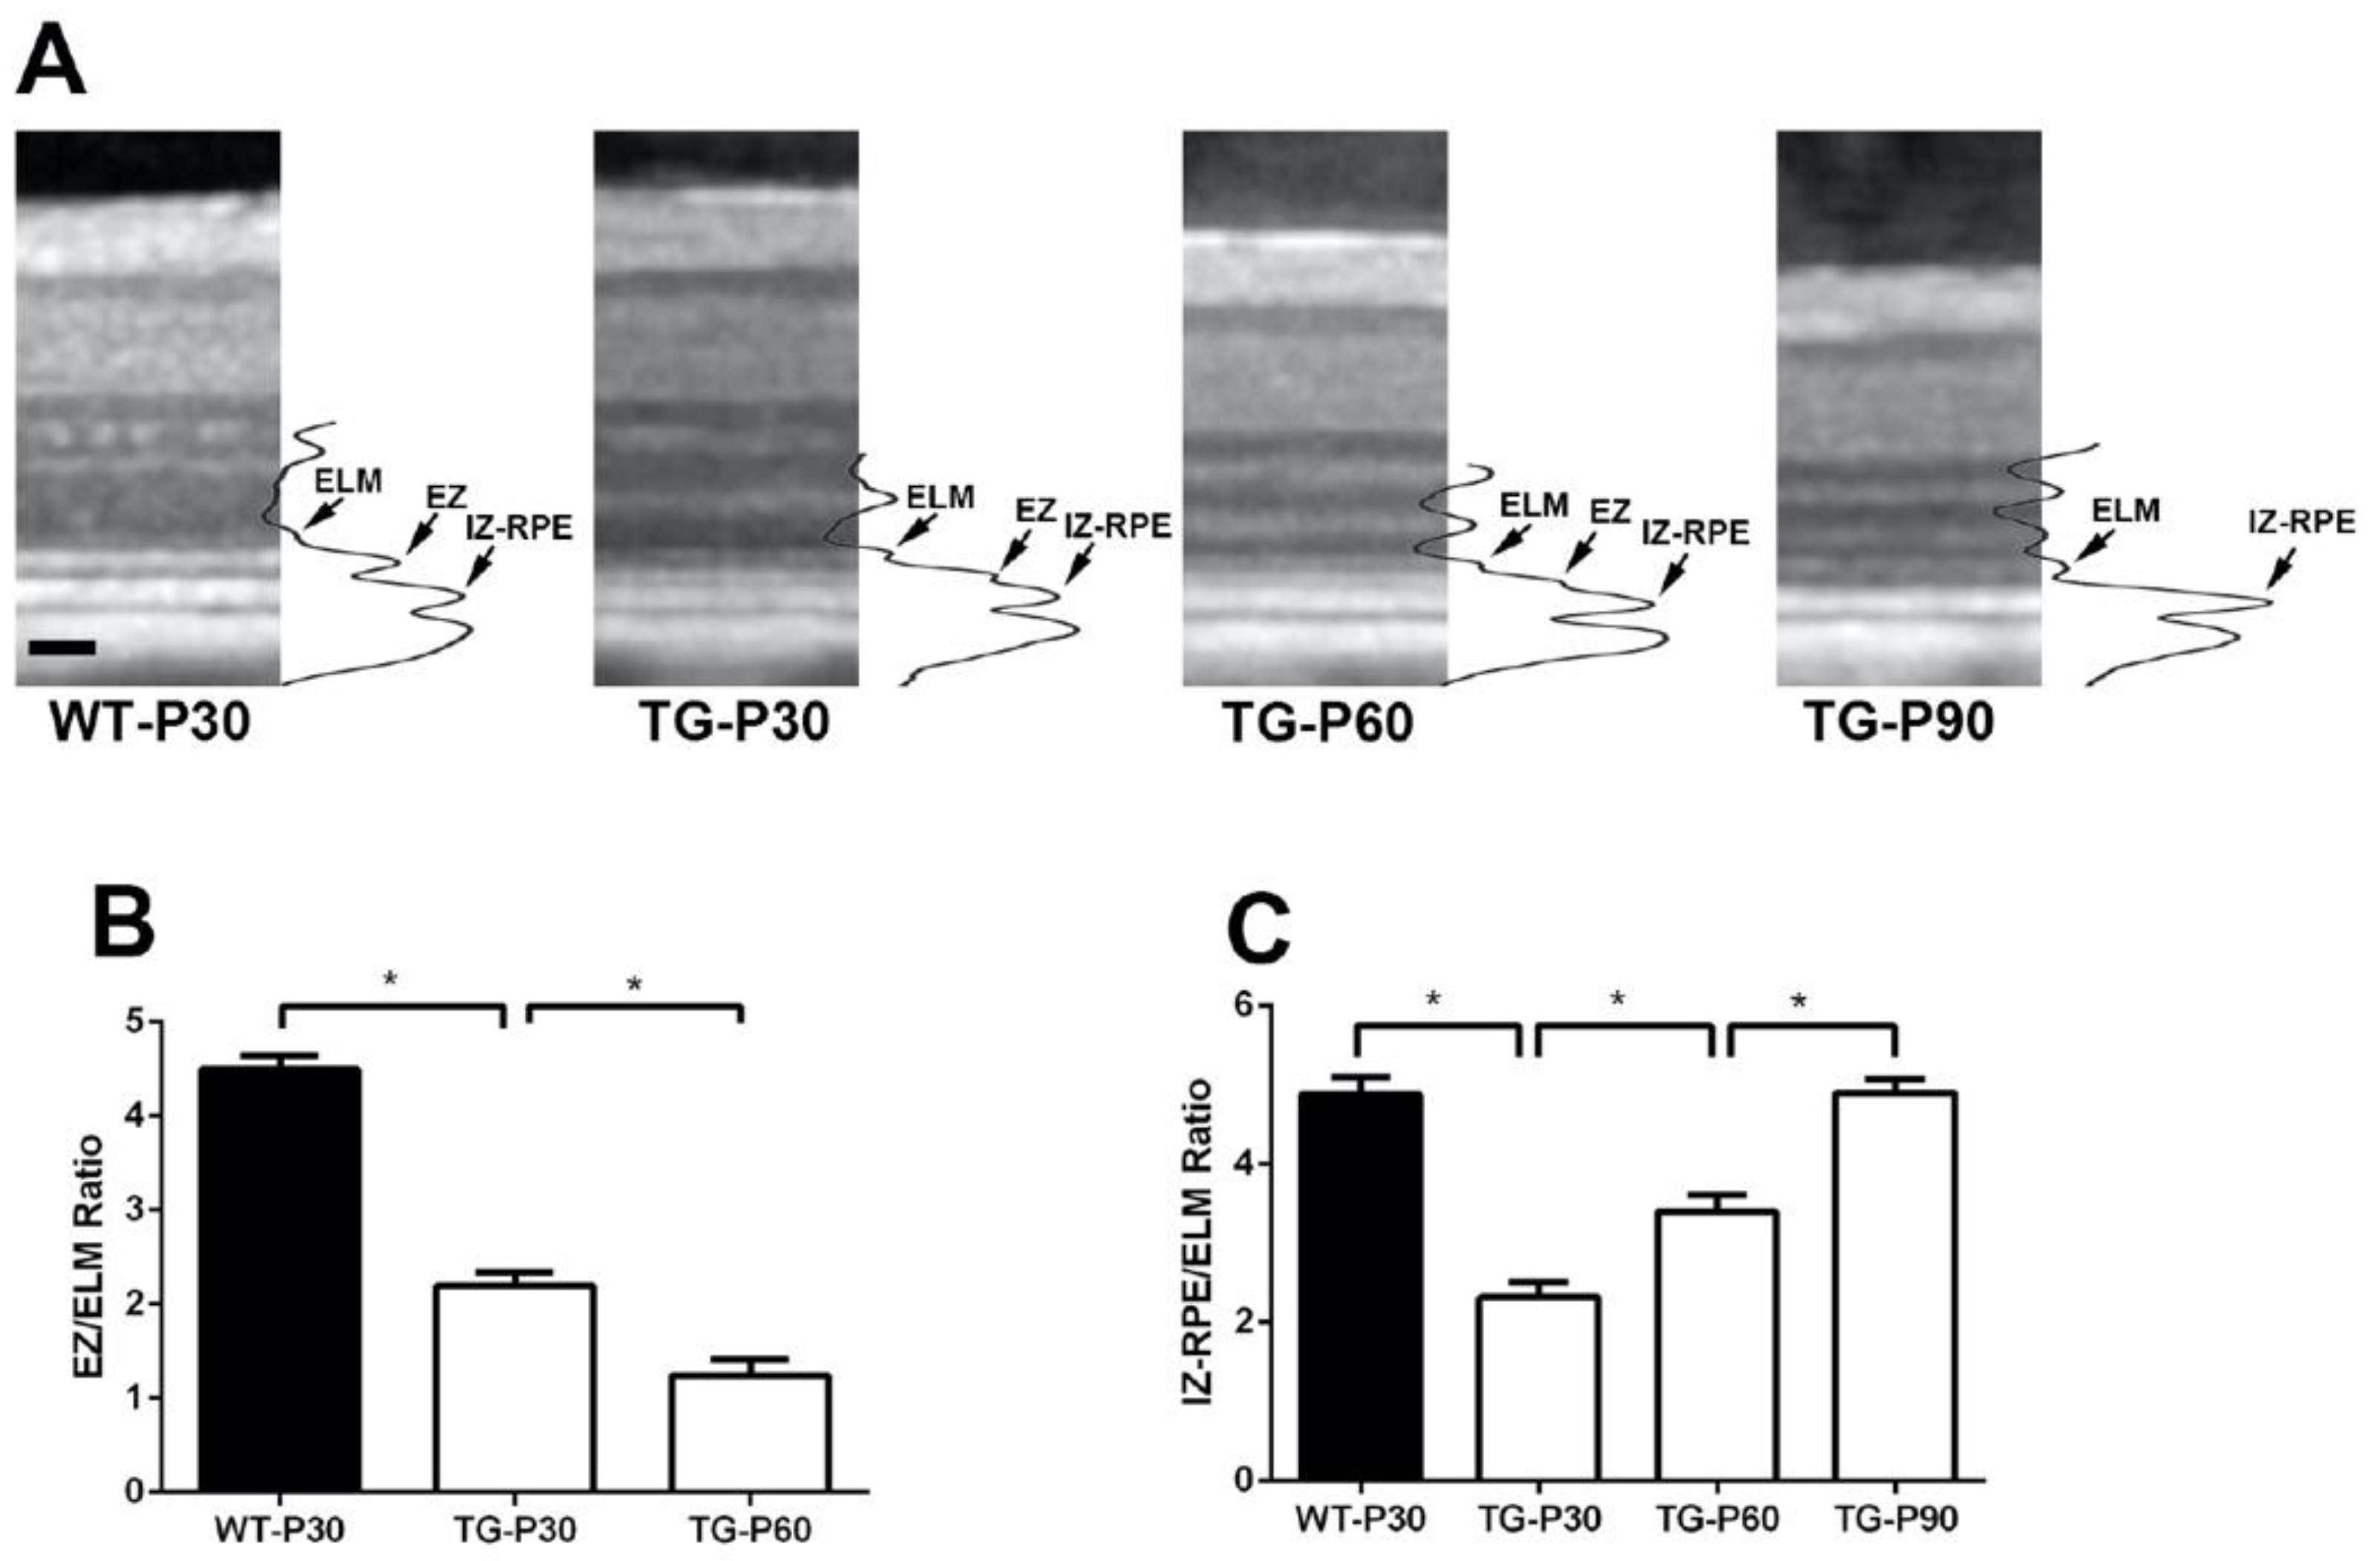
Figure 4.
Representative photomicrographs of the retina acquired about 4000 µm from the optic nerve head in the superior and inferior retina in Wt and TgP23H pigs. The TgP23H pig retina exhibited marked loss of photoreceptor outer segments and significant attenuation of the ONL to 1 cell layer thick at P90. Note the differential rate of photoreceptor degeneration and ONL cell body loss in the superior versus inferior retina, with more marked structural changes and greater cell loss in the inferior retina at all time points between P30 and P90 in the TgP23H pig retina. Note the apical cytoplasm of the large horizontal cells (asterisks) that correspond to the hyperreflective SD-OCT band in the INL in Figure 1 and Figure 2. The RPE exhibits increased number and aggregation of melanin/melanolipfuscin granules in the apical cytoplasm with progression of photoreceptor degeneration from P30 to P90. Scale bar: 20 microns.
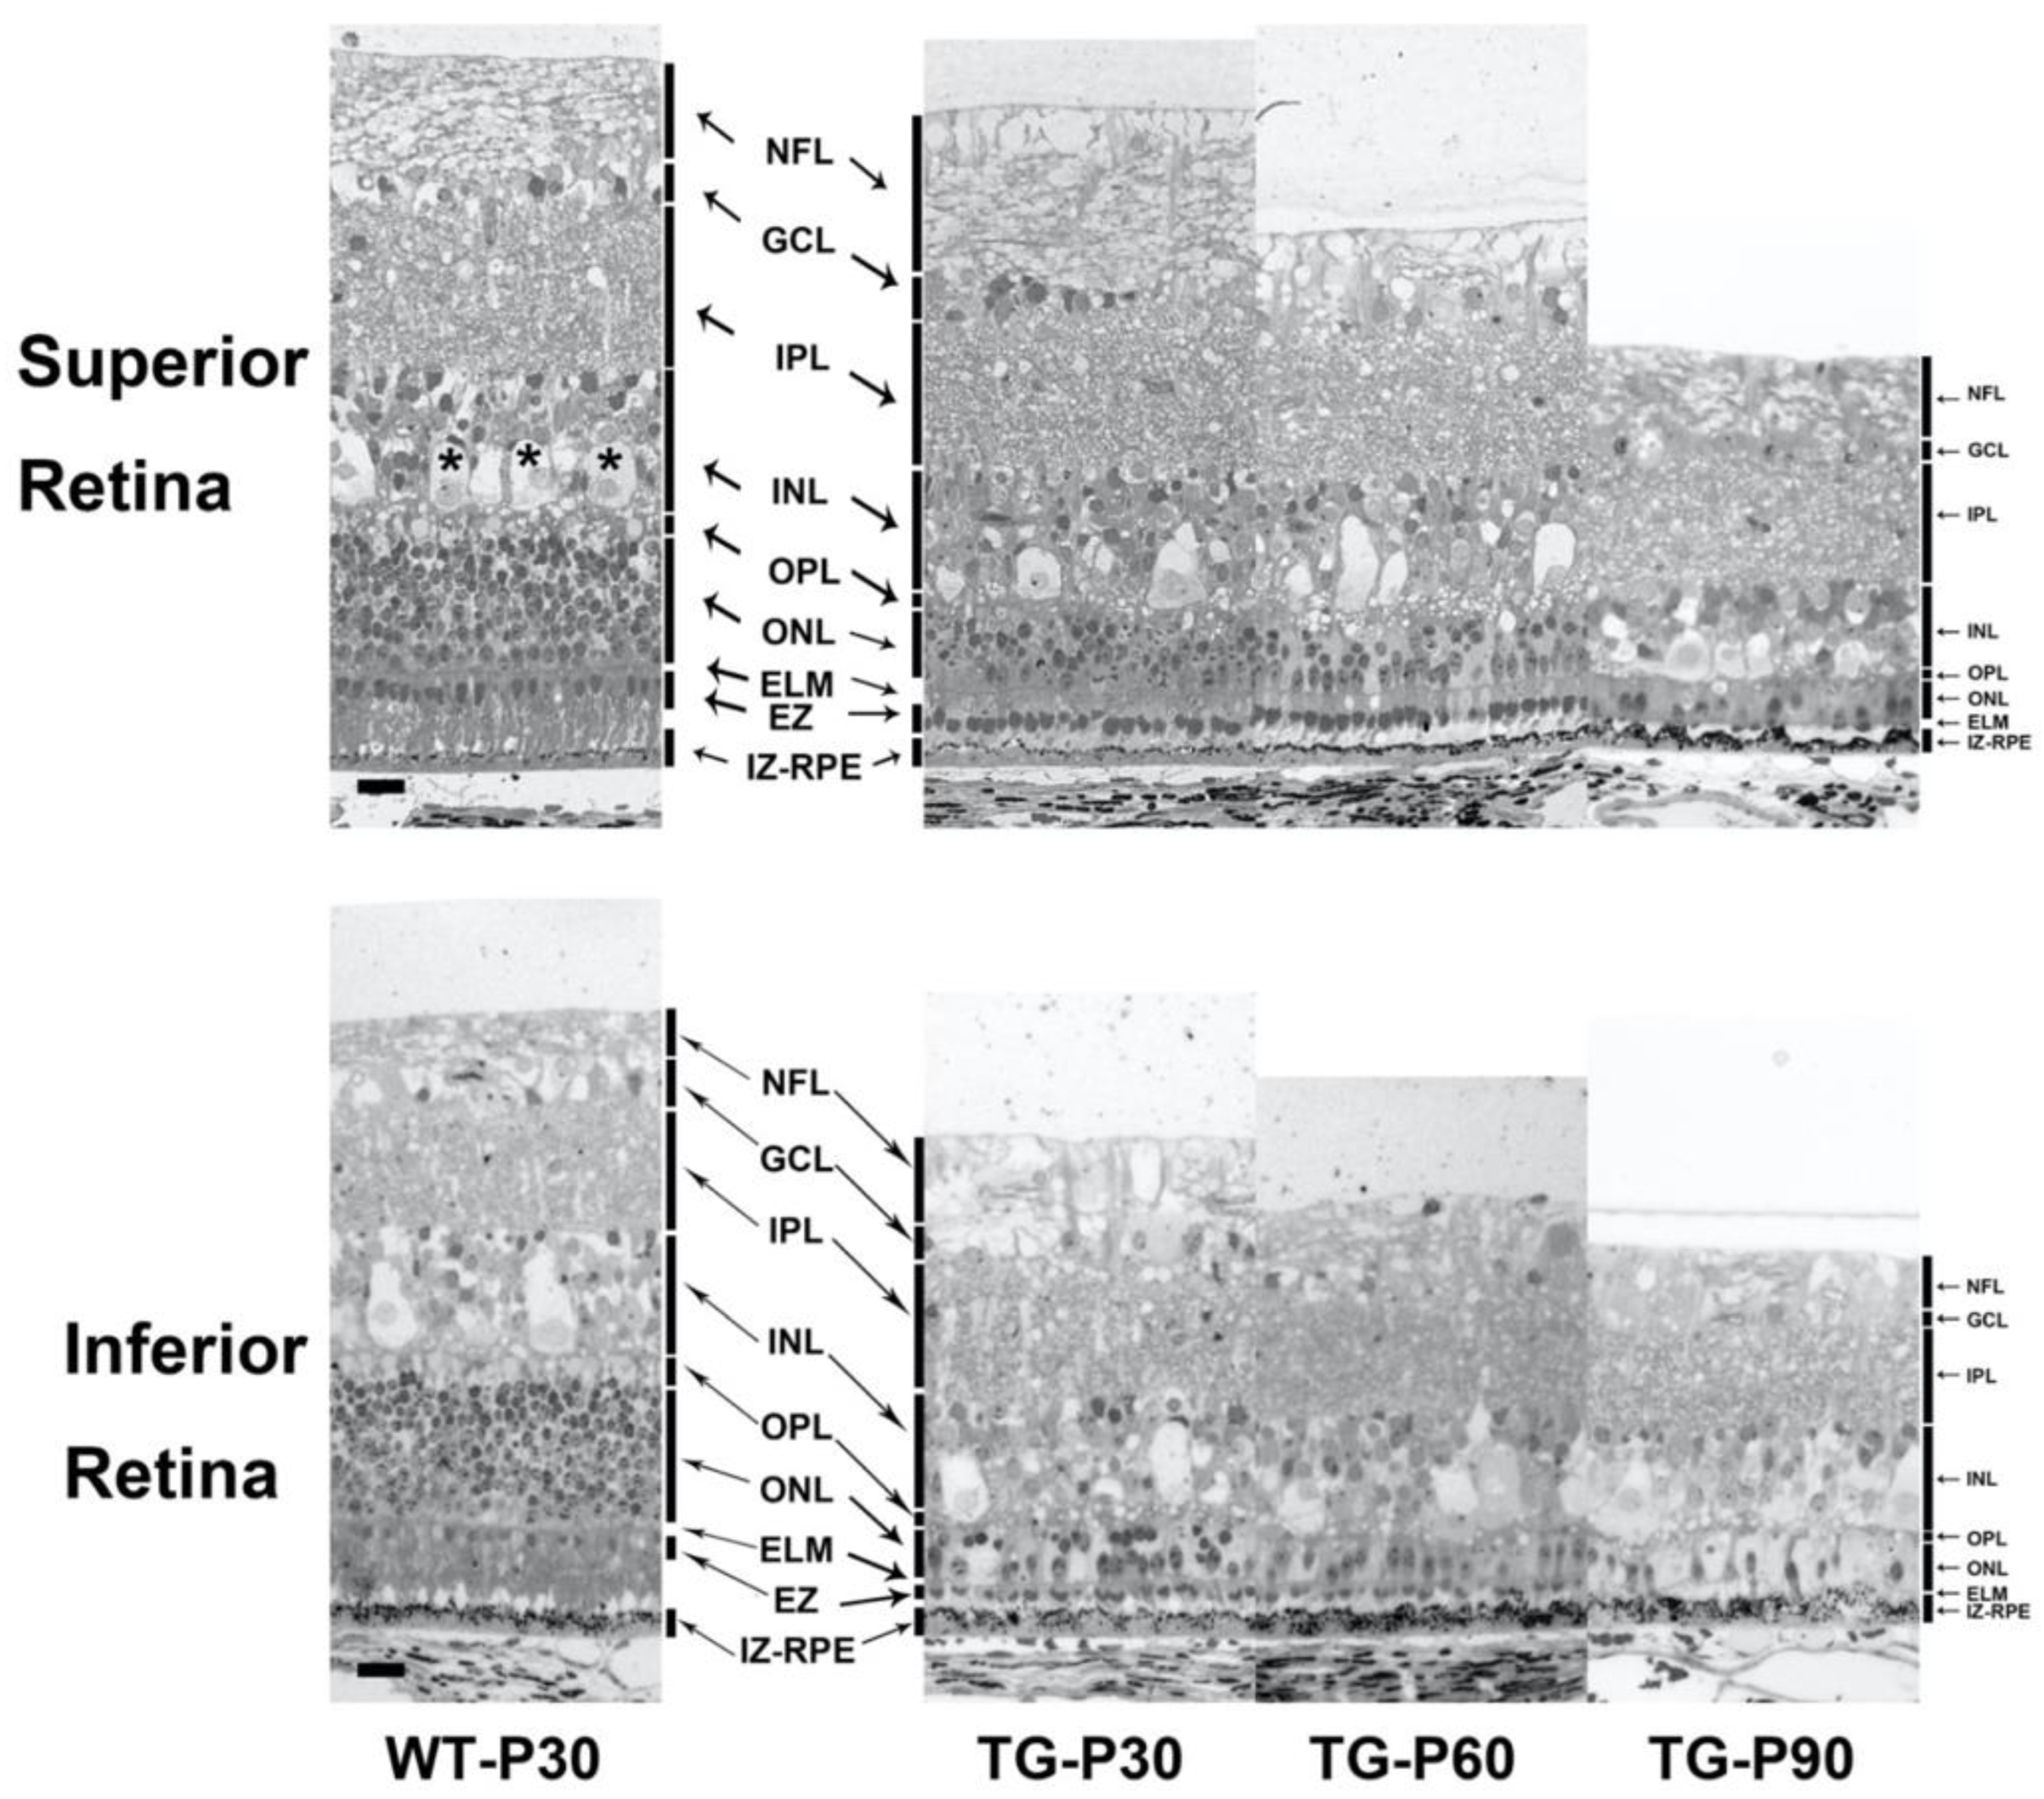
Figure 5.
Photopic ERG in Wt and TgP23H pigs. The mean photopic ERG a-wave and 30Hz flicker b-wave amplitudes (at a light stimulus of 3.0 cd·s·m-2) were similar at all time points (P30-P90) in the Wt pig. The mean photopic b-wave in the Wt pig increased between P30 and P90. In the TgP23H pig, the amplitudes of the photopic a- and b-waves and 30Hz flicker b-wave gradually decreased from P30 to P90. *P<0.05. N=6 eyes.
Disclaimer/Publisher’s Note: The statements, opinions and data contained in all publications are solely those of the individual author(s) and contributor(s) and not of MDPI and/or the editor(s). MDPI and/or the editor(s) disclaim responsibility for any injury to people or property resulting from any ideas, methods, instructions or products referred to in the content. |
© 2026 by the authors. Licensee MDPI, Basel, Switzerland. This article is an open access article distributed under the terms and conditions of the Creative Commons Attribution (CC BY) license.
Copyright: This open access article is published under a Creative Commons CC BY 4.0 license, which permit the free download, distribution, and reuse, provided that the author and preprint are cited in any reuse.


