Submitted:
31 December 2025
Posted:
01 January 2026
You are already at the latest version
Abstract
Understanding customer purchasing behavior is essential for businesses to optimize marketing strategies and improve customer retention. This study employs machine learningbased clustering techniques to segment customers based on transactional data. By leveraging Recency, Frequency, and Monetary (RFM) analysis, the study compares multiple clustering algorithms to identify distinct customer groups. Experimental results demonstrate that the proposed approach effectively categorizes customers, enabling data-driven decision-making for targeted marketing. These findings highlight the potential of unsupervised learning methods in enhancing business intelligence and customer relationship management.
Keywords:
customer segmentation
; customer purchasing behavior
; unsupervised learning
; machine learning
; clustering techniques
; rfm analysis
; k-means clustering
; dbscan
; transactional data analysis
; marketing analytics
; business intelligence
; customer relationship management
; data-driven decision making
; retail analytics
; e-commerce analytics
1. Introduction
Customer segmentation is a strategic process that enables businesses to identify and understand their ideal customers. By analyzing different customer groups based on their needs, preferences, and behaviors, companies can tailor their products and services to meet specific demands effectively. This targeted approach not only enhances customer satisfaction but also optimizes marketing efforts by focusing on the most relevant audience. Instead of promoting a new product to an entire customer base, businesses can concentrate their resources on the segment most likely to make a purchase. A well-defined segmentation strategy ensures efficient resource allocation, strengthens customer relationships, and drives long-term business success.
Customer segmentation plays a crucial role in understanding consumer behavior, and among various approaches, behavioral segmentation stands out as the most practical and efficient. One of the most widely used techniques in this category is RFM analysis, which evaluates customers based on three key factors: Recency, Frequency, and Monetary value. By analyzing these metrics, businesses can predict future customer behavior and tailor marketing strategies accordingly.
RFM analysis enables organizations to classify customers into distinct segments, such as high-value customers, loyal patrons, significant spenders, and those at risk of disengagement. This data-driven approach empowers marketing teams to design personalized campaigns that align with actual consumer behaviors, including purchasing patterns and browsing history. By leveraging the RFM scoring system, businesses can enhance customer engagement, optimize retention strategies, and drive overall profitability.
2. Related Work
Our research was inspired by the work of Anthony O. Otiko, Odey, and Inyang (2019) [1], which focused on market segmentation using an online retail dataset to examine customer purchasing behavior during pre-Christmas sales. Their study leveraged association rule mining with SAS to uncover relationships between different stock codes, identifying patterns where the purchase of one product increased the likelihood of buying another related item. To enhance these insights, hierarchical clustering was applied, utilizing the complete linkage method with the hclust function. A dendrogram with five clusters was generated, revealing that items with consecutive stock codes were frequently grouped together. This pattern suggests that such products share similarities, likely due to their co-occurrence in customer shopping baskets.
Mohamad Abdul Kadir and Adrian Achyar (2019) [2] conducted a study utilizing an online retail dataset to explore consumer purchasing behavior, segment customers, and analyze customer locations for bukku.id. Their research employed the RFM (Recency, Frequency, Monetary) methodology alongside K-Means clustering to categorize customers into distinct groups. Additionally, they applied Pareto Analysis to determine which authors or distributors contributed the highest sales volume. This approach enables businesses to strategically market and promote high-demand products, thereby optimizing profitability.
A study by A. Joy Christy, A. Umamakeswari, L. Priyatharsini, and colleagues (2018) [3] explored customer segmentation using an online retail dataset to enhance organizational revenue. The authors emphasized that retaining existing customers is more valuable than acquiring new ones. To achieve this, they implemented targeted marketing strategies tailored to specific customer segments. Their approach involved RFM analysis along with K-Means and Fuzzy-C clustering techniques to categorize customers efficiently. A key focus of their research was optimizing the selection of centroids in the K-Means algorithm to minimize iterations and computational time, thereby improving the efficiency of customer segmentation.
Anitha P. and Malini M. Patil (2019) [4] explored the application of the K-Means clustering algorithm in segmenting potential customers within the retail industry using business intelligence. Their research focused on predicting customer purchasing behavior by leveraging the Recency, Frequency, and Monetary (RFM) model. By employing segmentation principles, they implemented K-Means clustering to group customers based on purchasing patterns. To determine the optimal number of clusters, they utilized silhouette scores to evaluate the clustering performance across different values of K.
Schellong Daniel, Kemper Jan, and Brettel Malte (2016) [5] analyzed an extensive and distinctive dataset of off-site clickstream data from a major online fashion retailer operating across Europe. Their research explored various online marketing and engagement channels, including display advertising, SEO, SEM, affiliate marketing, social media, and email campaigns. The study’s primary objective was to categorize customer search behaviors and identify their online shopping goals. To achieve this, the authors applied clustering techniques, segmenting customers based on their browsing patterns. Specifically, they ran K-Means clustering 20 times for different cluster numbers, utilizing the “elbow” method to determine the optimal number of clusters.
Hadeel Ahmad, Bassam Kasasbeh, and colleagues (2022) [6] introduced a class-balancing framework for detecting credit card fraud. Their study utilized real transaction data from European cardholders recorded in September 2013. A key aspect of their research involved customer segmentation to refine marketing strategies. The dataset comprised approximately 9,000 active credit card users, capturing their transaction behaviors over a six-month period.
Similarly, Wann Yih Wu, Phan Thi Phu Quyen, and Adriana A. Amaya Rivas (2016) [7] explored the influence of e-servicescapes on consumer online shopping behavior. Their study examined the impact of website trustworthiness, website attitude, brand perception, e-WOM intention, and purchase intent. Additionally, they investigated how online purchasing experience and gender differences moderated the relationships between e-servicescape elements, trust, and user attitudes.
Danuta Zakrzewska and Jan Murlewski [14] explored market segmentation, emphasizing cluster analysis as the predominant methodology in this domain. Their study contrasts high-dimensional data with noise and evaluates clustering techniques, utilizing three algorithms: density-based DBSCAN, K-Means, and a two-phase clustering approach. Among the various clustering methods applied to market segmentation, K-Means remains the most widely used, with numerous modifications examined in previous research. This paper specifically investigates a two-phase clustering technique that integrates a modified K-Means in the first phase with hierarchical agglomerative clustering in the second. The study compares its effectiveness against K-Means and density-based clustering, considering key factors such as scalability, outlier detection, and suitability for large, multidimensional bank customer datasets.
Shahadat Hossain (2017) [8] conducted a study on customer segmentation using clustering techniques, specifically the centroid-based K-Means algorithm and the density-based DBSCAN algorithm. The research focused on comparing their efficiency and performance in segmenting customers. The findings indicated that DBSCAN required more computational time than K-Means when applied to the given dataset.
Similarly, Nassim Dehouche (2020) [9] explored customer engagement on Facebook Live using Principal Component Analysis. The study examined engagement patterns by comparing Facebook Live with other content types, such as text, videos, and images. Additionally, statistical analyses were performed to assess engagement seasonality at different time intervals (hourly, daily, and monthly). The research also identified outlier posts for qualitative examination, focusing on their sales strategies and activities. Engagement metrics were summarized through descriptive statistics, including mean, standard deviation, and maximum values, while scatter plots visualized customer interaction trends across various Facebook sellers.
Kayalvily Tabianan, Shubashini Velu, and Vinayakumar Ravi emphasize the importance of customer segmentation for e-commerce businesses to target the most profitable clients effectively. By classifying customers into groups based on various factors such as demographics, psychographics, behavior, and geography, companies can offer tailored products and services that align with consumer needs, thus improving overall revenue. In particular, the study focuses on clustering methods to analyze customer behavior and predict purchasing patterns. The goal is to maximize the distinction between clusters while ensuring that the similarities within each cluster are as high as possible. This research highlights the use of K-Means clustering to segment customers based on shared characteristics, allowing businesses to identify the most profitable segments and optimize marketing strategies.
Gaurav Mishra and Sraban Kumar Mohanty, on the other hand, critique existing clustering algorithms, pointing out their limitations when faced with datasets containing clusters of varying sizes, shapes, and densities. To address these issues, they propose a graph-based hybrid clustering approach that utilizes a divide-and-conquer strategy. In the divide phase, the data is split into smaller groups based on dispersion levels, while in the conquer phase, each sub-cluster’s minimum spanning tree (MST) is constructed using techniques like Prim’s or Kruskal’s algorithms. The final step combines the sub-clusters based on cohesion and internal similarity. Their results demonstrate that the proposed algorithm outperforms conventional clustering methods such as K-Means, Hierarchical, DBSCAN, and others in terms of both cluster accuracy and execution speed, as evaluated across seven different datasets.
Vinaya Manchaiah, Amyn M. Amlani, Christina M. Bricker, Clayton T. Whitfield, and Pierre Ratinaud [11] conducted an in-depth analysis to explore the advantages and drawbacks of direct-to-consumer hearing devices (DCHDs) by examining a substantial text corpus sourced from Amazon customer reviews. A total of 11,258 verified reviews for 62 different DCHDs were manually collected from the Amazon.com platform. The researchers applied both quantitative and qualitative analysis techniques, which resulted in the identification of seven distinct clusters. These clusters included issues related to fit and comfort (15%), recommendations from friends and family (11.8%), sound quality concerns (11.9%), listening and conversation experiences (16.1%), positive customer service (12.1%), general usage and customer service (14.7%), and cost and affordability (17.3%). Their findings, derived through text mining techniques, provide valuable insights into the pros and cons of DCHDs available in the U.S. market. These results align with previous electroacoustic analysis studies on similar products, offering clinicians useful information that can be shared with patients during consultations.
Daqing Chen, Kun Guo, and Bo Li [10] explored the Recency, Frequency, and Monetary (RFM) model to analyze a real transactional dataset from a UK-based retail business. The analysis generated a monthly RFM time series for each customer, and segmentation was performed using k-means clustering into high, medium, or low profitability groups based on their RFM values. A total of twelve models, including regression, multilayer perceptron (MLP), and Naive Bayes, were employed to predict how customers’ membership in profitability groups might evolve over time, both in open-loop and closed-loop modes. Their comparative analysis demonstrated strong predictive accuracy for customer profitability measures and highlighted how business context could aid in interpreting the modeling results.
In their research, Jun Wu, Li Shi, Wen-Pin Lin, Sang-Bing Tsai, Yuanyuan Li, Liping Yang, and Guangshu Xu tackle a real-world enterprise issue by employing customer segmentation and value analysis. They utilize online sales data along with the RFM (Recency, Frequency, and Monetary) model and K-means clustering technique. Their approach divides customers into four distinct types based on purchasing behavior, offering a foundation for various CRM strategies aimed at enhancing customer satisfaction. The effectiveness of these strategies is demonstrated through improved performance metrics, including increased active consumers, total purchase volume, and overall consumption amount. The process is structured in four main steps: data preparation and preprocessing, normalization of RFM indices, weight analysis of these indices, and customer segmentation via K-means clustering.
Building on the framework of customer segmentation, the current study computes the recency, frequency, and monetary (RFM) values from the raw dataset. The K-means algorithm is then applied using various distance metrics to assess the formation of customer clusters for different values of K. In this context, the value of K refers to the number of clusters chosen, which plays a crucial role in the quality of segmentation. To evaluate the quality of the clusters formed, Silhouette Analysis is employed, offering an objective measure of how well-defined and separated the clusters are. This allows for a thorough comparison of the clustering performance for different values of K, guiding the determination of the optimal number of clusters.
Furthermore, the study extends the analysis by implementing the DBSCAN (Density-based Spatial Clustering of Applications with Noise) algorithm on the same dataset. DBSCAN, unlike K-means, does not require the specification of the number of clusters beforehand and is capable of identifying clusters of arbitrary shapes, along with effectively handling noise and outliers in the data. A comparative analysis between the K-means and DBSCAN clustering techniques is conducted, focusing on their respective strengths and weaknesses in the context of customer segmentation. The study concludes by discussing the performance of both algorithms and providing insights into their practical implications for clustering tasks in retail data analysis.
3. The methodology
The customer segmentation process is a vital step for understanding consumer behavior and improving targeted marketing strategies. In this study, the segmentation is performed using a transactional dataset collected from the customers of an online retail company. The primary objective is to categorize customers based on the Recency, Frequency, and Monetary (RFM) analysis. RFM is a widely used method for measuring customer engagement and behavior by considering three key aspects:
- Recency (R): How recently a customer has made a purchase.
- Frequency (F): How often a customer makes a purchase.
- Monetary (M): How much a customer spends on purchases.
To facilitate the segmentation process, two clustering methods are employed to group customers based on these three variables. The dataset comprises eight variables, each providing unique information related to a customer’s transaction history. These variables are:
- InvoiceNo: A six-digit, automatically generated number assigned to each transaction. This number is unique and increments with every new sale.
- StockCode: A unique identifier automatically assigned to each product sold. It is a discrete value that differentiates one product from another in the system.
- Description: The name or description of the product being sold in a particular transaction.
- Quantity: The quantity of the product purchased in a single transaction. It indicates how many units of the product were bought in that particular order.
- InvoiceDate: The timestamp indicating the exact date and time when the invoice was generated. This is crucial for understanding the recency of customer purchases.
- UnitPrice: The price per unit of the product purchased. This value represents the production cost of each item sold.
- CustomerID: A unique identifier assigned to each customer. This number is automatically incremented and is essential for distinguishing between different customers in the dataset.
- Country: The name of the country in which the customer resides. This provides geographic information and can help in segmenting customers by region.
These variables are integral for performing RFM analysis, which serves as the foundation for the clustering methods applied in this study. By analyzing these factors, the segmentation process enables the identification of distinct customer groups, each with unique buying behaviors, thus allowing the company to tailor its marketing and sales strategies accordingly.
Figure 1.
Sample Data from Online Retail Dataset.
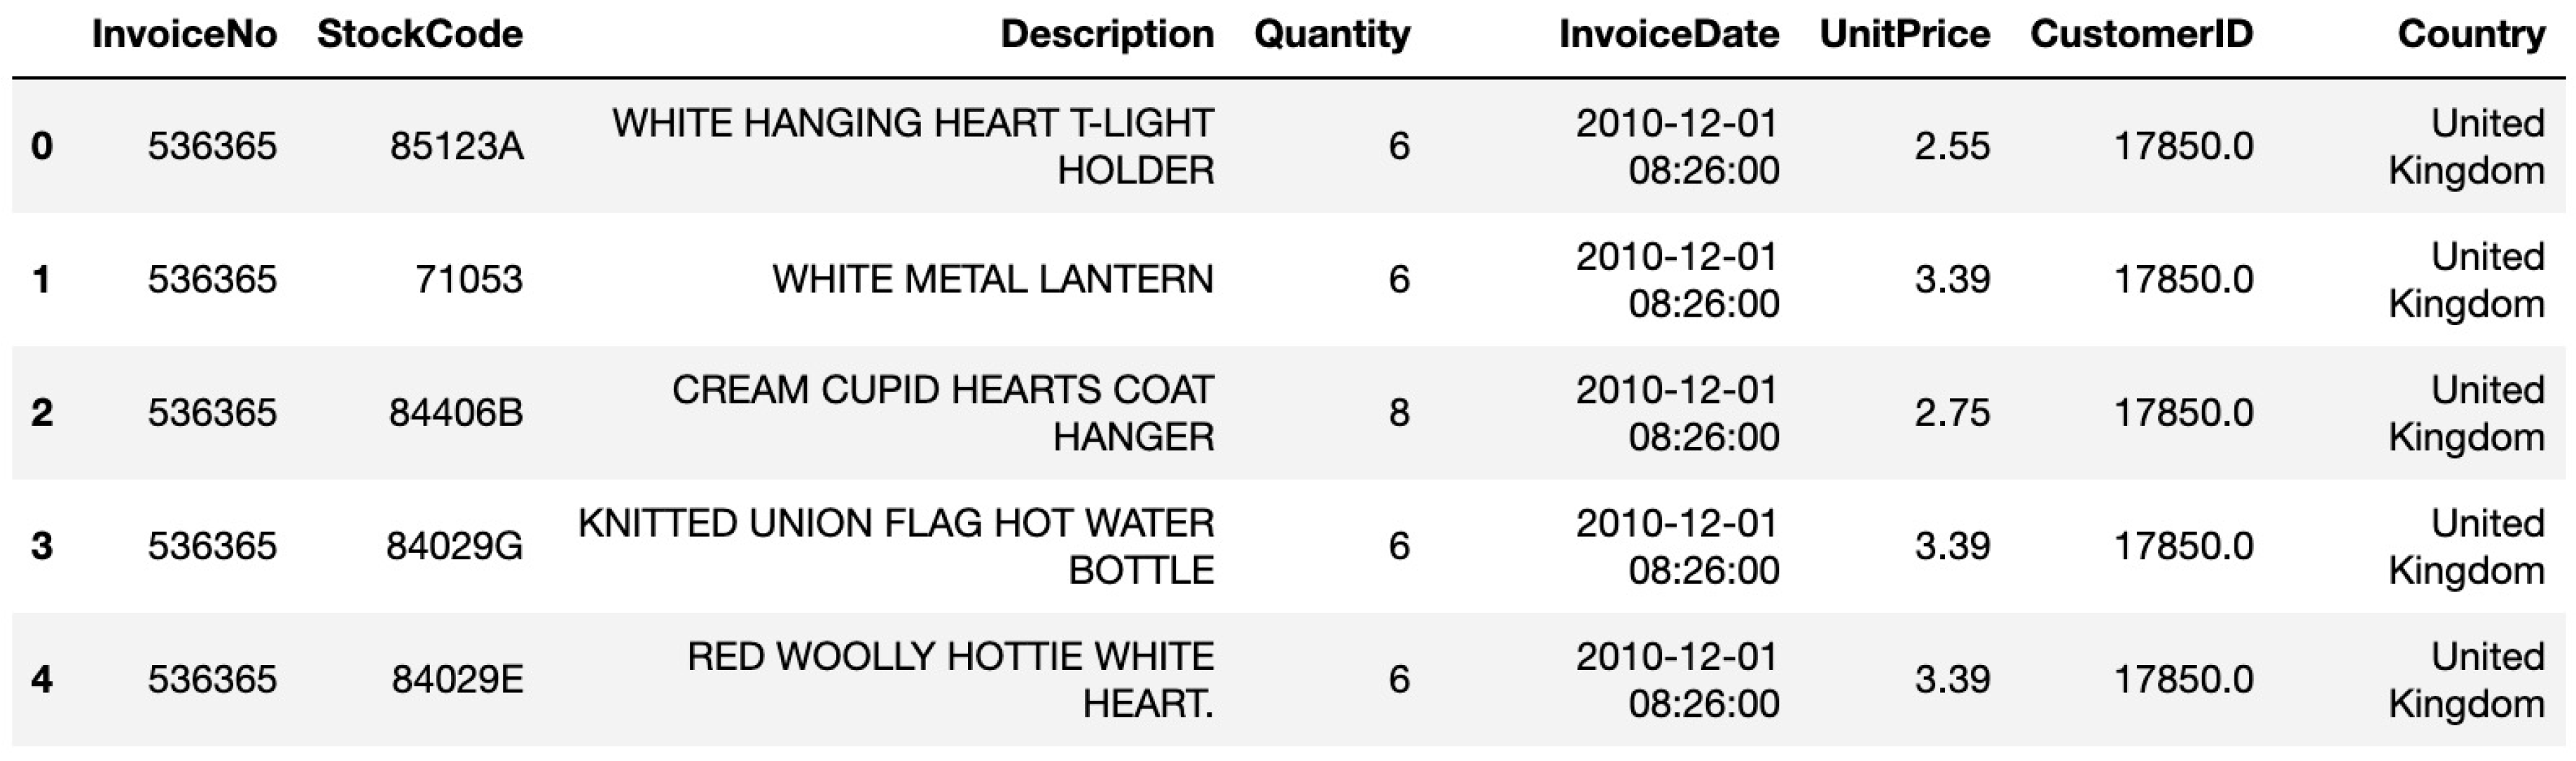

Table 1.
Online Retail Dataset Statistics.
| Quantity | UnitPrice | CustomerID | |
| count | 541,909 | 541,909 | 406,829 |
| mean | 9.552250 | 4.611114 | 15,287.69057 |
| std | 218.081158 | 96.759853 | 1,713.600303 |
| min | -80,995 | -11,062.06 | 12,346 |
| 25% | 1 | 1.25 | 13,953 |
| 50% | 3 | 2.08 | 15,152 |
| 75% | 10 | 4.13 | 16,791 |
| max | 80,995 | 38,970 | 18,287 |
3.1. RFM Analysis
The Recency, Frequency, and Monetary (RFM) analysis is a widely used and highly effective research methodology for customer segmentation. It categorizes customers based on their historical interactions with a business, allowing companies to tailor marketing strategies effectively. This methodology helps in identifying patterns and behaviors, which can then be used to create targeted marketing campaigns.
3.2. Recency
Recency refers to the most recent interaction a customer has had with a business, providing valuable insight into their likelihood of making a future purchase. It plays a crucial role in understanding customer behavior and predicting future purchasing decisions. A lower recency value suggests that a customer engages with the brand frequently, either through visits or purchases, signaling a higher likelihood of future interactions. This frequent engagement indicates the customer has an ongoing interest in the brand and may be more likely to continue their relationship. On the other hand, a higher recency value indicates that the customer has not interacted with the business recently, making them less likely to engage again in the short term. This may point to a decrease in interest, a shift in preferences, or a reduced connection with the brand, requiring businesses to take actions to re-engage such customers.
3.3. Frequency
Frequency measures the number of times a customer interacts with a brand, particularly through purchases, within a given period. It is an important metric for assessing customer loyalty and engagement. A higher frequency value indicates that the customer regularly returns to make purchases, suggesting strong brand loyalty, satisfaction, and a consistent demand for the products or services offered. These customers tend to exhibit high engagement, which is valuable for businesses as they represent a reliable source of revenue. Conversely, a low frequency score suggests that the customer does not make purchases as often, which could point to a decline in interest, changes in preferences, or the need for improved customer retention strategies. Understanding frequency patterns helps businesses identify their most loyal customers, as well as those who may require targeted efforts to increase engagement and foster long-term loyalty.
3.4. Monetary
Monetary value refers to the total amount of money a customer spends with a business within a specific time period. This metric is crucial as it offers a clear indication of the revenue generated from individual customers. A higher monetary value suggests that the customer is contributing significantly to the business’s revenue, demonstrating a strong purchasing power and likely a deeper relationship with the brand. On the other hand, a lower monetary value indicates that the customer’s spending is below average, which could imply limited engagement or a lower level of loyalty, requiring attention to convert them into higher-spending customers.
3.5. Loyal Customers
Loyal customers are the backbone of any business, marked by an above-average frequency of transactions and higher-than-average monetary spending. These customers not only purchase more often but also tend to spend more per transaction, showcasing strong engagement and trust in the brand. They exhibit repeat purchasing behaviors, and their consistent interactions signify a deep connection with the business. Focusing on nurturing and retaining loyal customers is essential, as they are likely to generate sustainable long-term value and often act as brand advocates. Special attention should be given to these customers through personalized offers, rewards, and exceptional service to maintain their loyalty and prevent them from drifting away.
3.6. Lost Customers
Lost customers are those who have made fewer transactions and have spent less money than the average customer, signaling a decline in engagement. These customers may have once interacted with the brand but have stopped making recent purchases, which could mean they are no longer interested or have found alternatives. They represent a potential lost revenue stream and may require targeted re-engagement efforts, such as personalized offers, promotions, or updates about new products and services. If re-engagement efforts are not successful, these customers may signify a segment that has drifted away entirely, and the business may need to assess why these customers left and what can be done to prevent a similar churn in the future.
3.7. New Customers
New customers are those who have recently made their first purchase but have not yet reached the frequency or spending levels of average or loyal customers. These customers are still in the early stages of their journey with the business, and it’s essential to focus on nurturing these relationships. Personalized marketing efforts, introductory offers, and exceptional customer service can help increase their engagement and encourage repeat purchases. Tracking their behavior is crucial, as their future purchasing patterns will reveal whether they will transition into loyal customers or fade away as one-time buyers. The key here is to enhance their experience and guide them towards becoming a part of the brand’s long-term customer base.
3.8. Prospect Customers
Prospect customers are individuals who have recently made a purchase and exhibit a relatively high frequency of transactions, but their overall spending is still below average. These customers demonstrate interest in the business but may need additional strategies to increase their purchasing volume and convert them into high-value customers. By offering targeted incentives, loyalty programs, or upsell opportunities, businesses can work to elevate the spending of these prospects. With the right approach, they have the potential to become loyal, high-spending customers, contributing significantly to long-term revenue growth. Properly nurturing these prospects is essential for expanding the customer base and increasing overall profitability.
RFM (Recency, Frequency, and Monetary) scores are essential for customer segmentation in marketing analytics. These scores combine three key variables—recency (how recently a customer has made a purchase), frequency (how often they make purchases), and monetary (how much they spend). These scores help in categorizing customers into different segments based on their purchasing behavior. In a five-category rating system for RFM, there are approximately 125 unique possible combinations, with 555 representing the maximum conceivable RFM score. This allows businesses to classify customers into distinct groups, making it easier to target them with personalized marketing initiatives. For example, customers with high recency, frequency, and monetary scores are often the most valuable to a business, while those with low scores may require different marketing strategies to re-engage them.
3.9. Clustering Algorithms for Segmentation
Clustering is a type of unsupervised learning technique that is used to categorize data into distinct groups based on similarities in their features. This technique is particularly useful in customer segmentation as it helps businesses identify different groups of customers based on shared characteristics. The goal of clustering is to divide the dataset into fewer clusters, where data points within each cluster are very similar to one another and significantly different from data points in other clusters. By finding these natural groupings in the data, businesses can tailor their marketing efforts more effectively.
3.10. K-Means Clustering Algorithm
Among the many clustering techniques, K-Means is one of the most widely used unsupervised learning algorithms, particularly for large datasets. It is an iterative, partitioning-based algorithm that attempts to divide a set of data points into K distinct clusters. Initially, K cluster centers are randomly chosen, and each data point is then assigned to the closest center based on a distance measure, often Euclidean distance. This process continues iteratively, adjusting the cluster centers by recalculating the mean of all points within each cluster.
The value of K represents the number of clusters, which is a critical parameter for the algorithm. A key challenge is determining the appropriate value of K. One way to determine K is through the use of self-organizing maps (SOMs), a data visualization technique that can transform high-dimensional data into a lower-dimensional space. By visualizing the data in this reduced space, the self-organizing map can help identify natural groupings and assist in determining an optimal value for K.
3.11. Self-Organizing Maps (SOMs)
SOMs are a class of artificial neural networks that operate in an unsupervised learning framework. These networks are highly effective for tasks like dimensionality reduction and data visualization, as they enable the transformation of complex, high-dimensional data into a simplified, lower-dimensional representation. In clustering applications, SOMs can be instrumental in determining the optimal number of clusters by grouping similar data points based on their inherent characteristics. After identifying the ideal number of clusters, denoted as K, this value can be used as input for the K-Means algorithm, thereby enhancing both its performance and the accuracy of the clustering results.
To quantify the proximity or dissimilarity between data points, the Euclidean distance metric is frequently used across various clustering techniques. In particular, K-Means relies on the Euclidean distance to compute the separation between a data point and the centroid of a cluster. This distance function, which forms the foundation of the K-Means algorithm, is mathematically represented as:
where E represents the total error (distance), is the center of the i-th cluster, and denotes the set of data points assigned to the i-th cluster.
3.12. DBSCAN Algorithm: A Density-Based Clustering Approach
The DBSCAN (Density-Based Spatial Clustering of Applications with Noise) algorithm, in contrast to K-Means, does not require the number of clusters to be specified in advance. Instead, it relies on two important parameters: the epsilon () value and the minimum number of points (MinPts) that define the density of a cluster. The key steps of the DBSCAN algorithm are as follows:
- Selection of Core Points: The algorithm starts by selecting any random point from the dataset as a candidate for the core point. A core point is defined as a point that has at least MinPts neighboring points within the -radius (the epsilon neighborhood).
- Cluster Formation: If the selected point satisfies the core point criteria, a new cluster is formed around it. This cluster includes the selected core point and its directly reachable neighbors within the -radius. The Euclidean distance is used to determine whether two points are neighbors. The distance between any two points x and y is calculated as:where and represent the coordinates of two points in an n-dimensional space.
- Iteration Over Remaining Points: After forming the initial cluster, the algorithm proceeds to the next unvisited point in the dataset. If the point is found to be a core point, a new cluster is formed in the same manner. If the point is not a core point, it is marked as noise or as a border point if it lies within the -neighborhood of a core point but does not have enough neighbors to be a core point itself.
- Termination: This process continues until all points in the dataset have been examined and assigned to a cluster or marked as noise.
The DBSCAN algorithm is particularly effective at identifying clusters of arbitrary shapes and can handle noise effectively. It is commonly used in applications where the data contains regions of varying density, making it a flexible and powerful clustering tool.
4. Tools and Techniques
This research focuses on customer segmentation, utilizing a variety of advanced machine learning and deep learning techniques. The process is implemented using several tools to ensure a comprehensive and accurate segmentation. Among the most widely used languages for this purpose is Python, which facilitates effective visualization of the segmentation process. In this study, customer segmentation is carried out through a comparative analysis of two prominent clustering algorithms: K-Means and DBSCAN. Both of these techniques are powerful in identifying customer groups based on their purchasing behavior.
For data analysis and manipulation, the pandas library is employed, providing robust support for handling and preprocessing large datasets. Numpy, another important Python library, is utilized to manage multi-dimensional arrays, which is crucial for representing and processing complex data structures. Data visualization is enhanced with Seaborn, a library that offers aesthetically pleasing themes for visual representation of the data, and Matplotlib, which is used to generate detailed graphical plots for a deeper understanding of the customer segments.
Time-based data manipulation is performed using the DateTime module, which is essential for extracting and working with date and time-related attributes, such as the time of purchase or product consumption. The entire analysis and implementation process is conducted in a web-based environment, Jupyter Notebook, which is favored for its ease of use and the ability to visualize code output interactively, enhancing the analysis workflow. This integrated environment allows for seamless execution of code, immediate feedback, and the ability to visualize segmentation results in real-time (Chindyana et al., 2021).
5. Data Collection
Data collection plays a pivotal role in customer segmentation, as it forms the basis for differentiating among various customer groups. In this study, the dataset used is sourced from online retail transactions, providing detailed information on customer purchases. The data is verified to ensure its authenticity, with all entries coming from legitimate customers of the online retail companies. This verification process ensures that the insights derived from the data are reflective of real-world customer behavior.
The dataset includes key attributes, such as invoice numbers, stock codes, customer names, purchased product details, quantities of products, and the date of the invoice. Additionally, information such as the customer’s country and a unique customer ID are critical for segmenting the customers based on their purchasing patterns. The comprehensive nature of this dataset allows for a deep analysis of customer behavior, enabling a more accurate understanding of their needs and preferences. By focusing on these attributes, the segmentation process aims to uncover distinct groups of customers with similar characteristics, helping businesses tailor their strategies and improve customer engagement.
5.1. Data Analysis
Clustering algorithms are widely used for segmentation in various data mining tasks, with over one hundred algorithms available for this purpose. However, only a few have gained significant popularity due to their effectiveness and ease of implementation. Among these, K-means and Density-Based Spatial Clustering of Applications with Noise (DBSCAN) are two of the most commonly used clustering methods in data mining. Both approaches offer unique advantages depending on the nature of the data and the segmentation goals.
The K-means algorithm is particularly effective when dealing with unsupervised and iterative data. It follows a straightforward process to cluster data points based on their similarity. The key advantage of K-means lies in its efficiency in handling large datasets. By iterating through the dataset, K-means assigns each data point to the nearest cluster centroid. This iterative process refines the clusters by minimizing the sum of squared distances between each data point and its assigned centroid. Unlike machine learning methods that require extensive training over time for accuracy, K-means provides a relatively quick and efficient clustering solution. The centroid-based approach of K-means makes it particularly well-suited for clustering data into spherical-shaped groups, which is ideal for datasets with clear cluster boundaries.
On the other hand, DBSCAN offers a more flexible and sophisticated approach to clustering. Unlike K-means, DBSCAN does not require the number of clusters to be predefined, making it an ideal choice for datasets where the number of clusters is not known in advance. DBSCAN is capable of identifying arbitrarily shaped clusters, as it relies on density-based criteria rather than fixed cluster centroids. This method works by identifying dense regions of data points and forming clusters within those regions, while points in low-density regions are treated as noise. The algorithm defines two key parameters: “epsilon” and “minPoints”. The parameter “epsilon” determines the radius of the neighborhood around each data point, which is used to measure the density of points within that radius. The parameter “minPoints” specifies the minimum number of data points required to form a dense region. DBSCAN’s ability to detect clusters of varying densities makes it highly suitable for datasets where the clusters may have irregular shapes or differing densities.
While both K-means and DBSCAN serve the purpose of clustering, their application depends on the structure and characteristics of the data. K-means is preferred when the clusters are expected to be of roughly equal size and spherical in shape, while DBSCAN is ideal when dealing with data that has varying densities or irregular shapes. Each algorithm offers distinct advantages and limitations, and the choice between them should be made based on the specific requirements of the data and the segmentation task at hand (Shirole et al., 2021).
6. Results
To perform the data analysis in this study, a variety of Python library functions are utilized. These libraries are essential for handling data, performing complex mathematical operations, and visualizing results. The following figure provides an overview of the library functions imported for the analysis, such as the NumPy library. NumPy is an essential Python library that offers powerful tools for working with arrays, matrices, and numerical computations, including linear algebra and Fourier transforms (Marisa et al., 2019).
Figure 2.
Importing Library Functions.
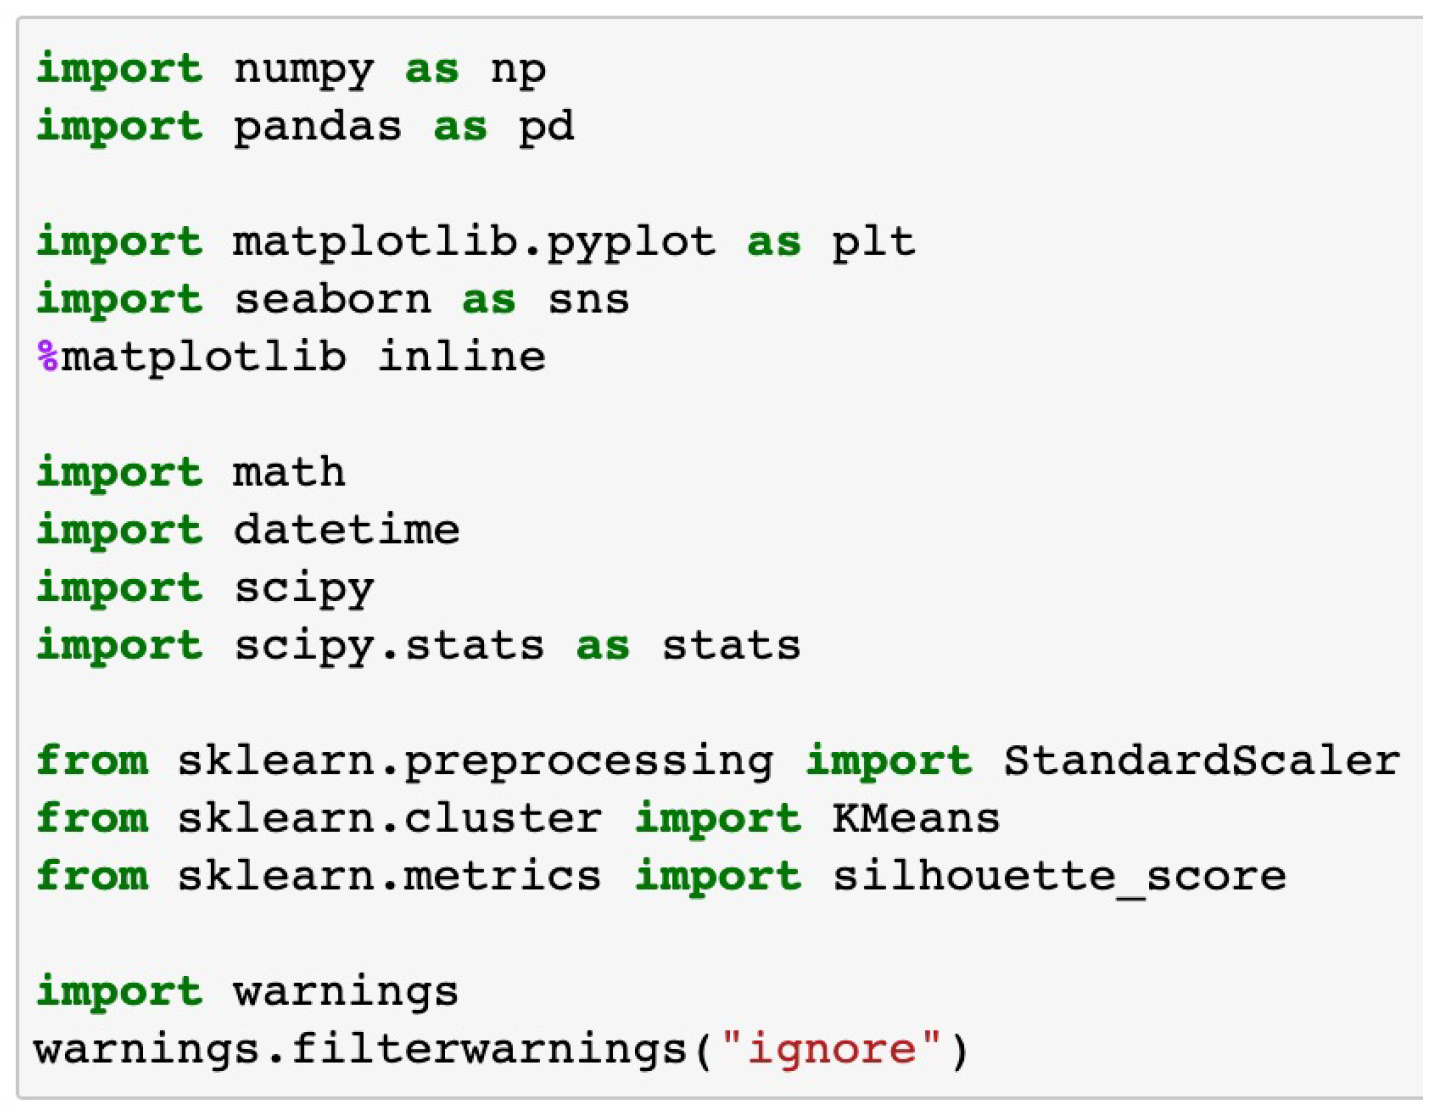
NumPy, created by Travis Oliphant in 2005, is an open-source project that has become a cornerstone for scientific computing in Python. In this work, NumPy is abbreviated as `np` to simplify its usage throughout the analysis. Another key library used in this project is pandas, referred to as `pd` in this study. Pandas is a powerful library for data manipulation and analysis, specifically useful for creating data frames, importing CSV files, and preparing datasets for analysis (Koul et al., 2021).
In addition, for visualizing the processed data, the Matplotlib library is employed, referred to as `plt` in this work. Matplotlib is a comprehensive library used for creating static, animated, and interactive visualizations in Python. This function is particularly important in presenting the results of the data analysis clearly and effectively, enabling the interpretation of complex datasets through visual representation. By leveraging these libraries, the analysis becomes efficient, organized, and easy to interpret, providing valuable insights for further study.
Figure 3.
Country Distribution Analysis.
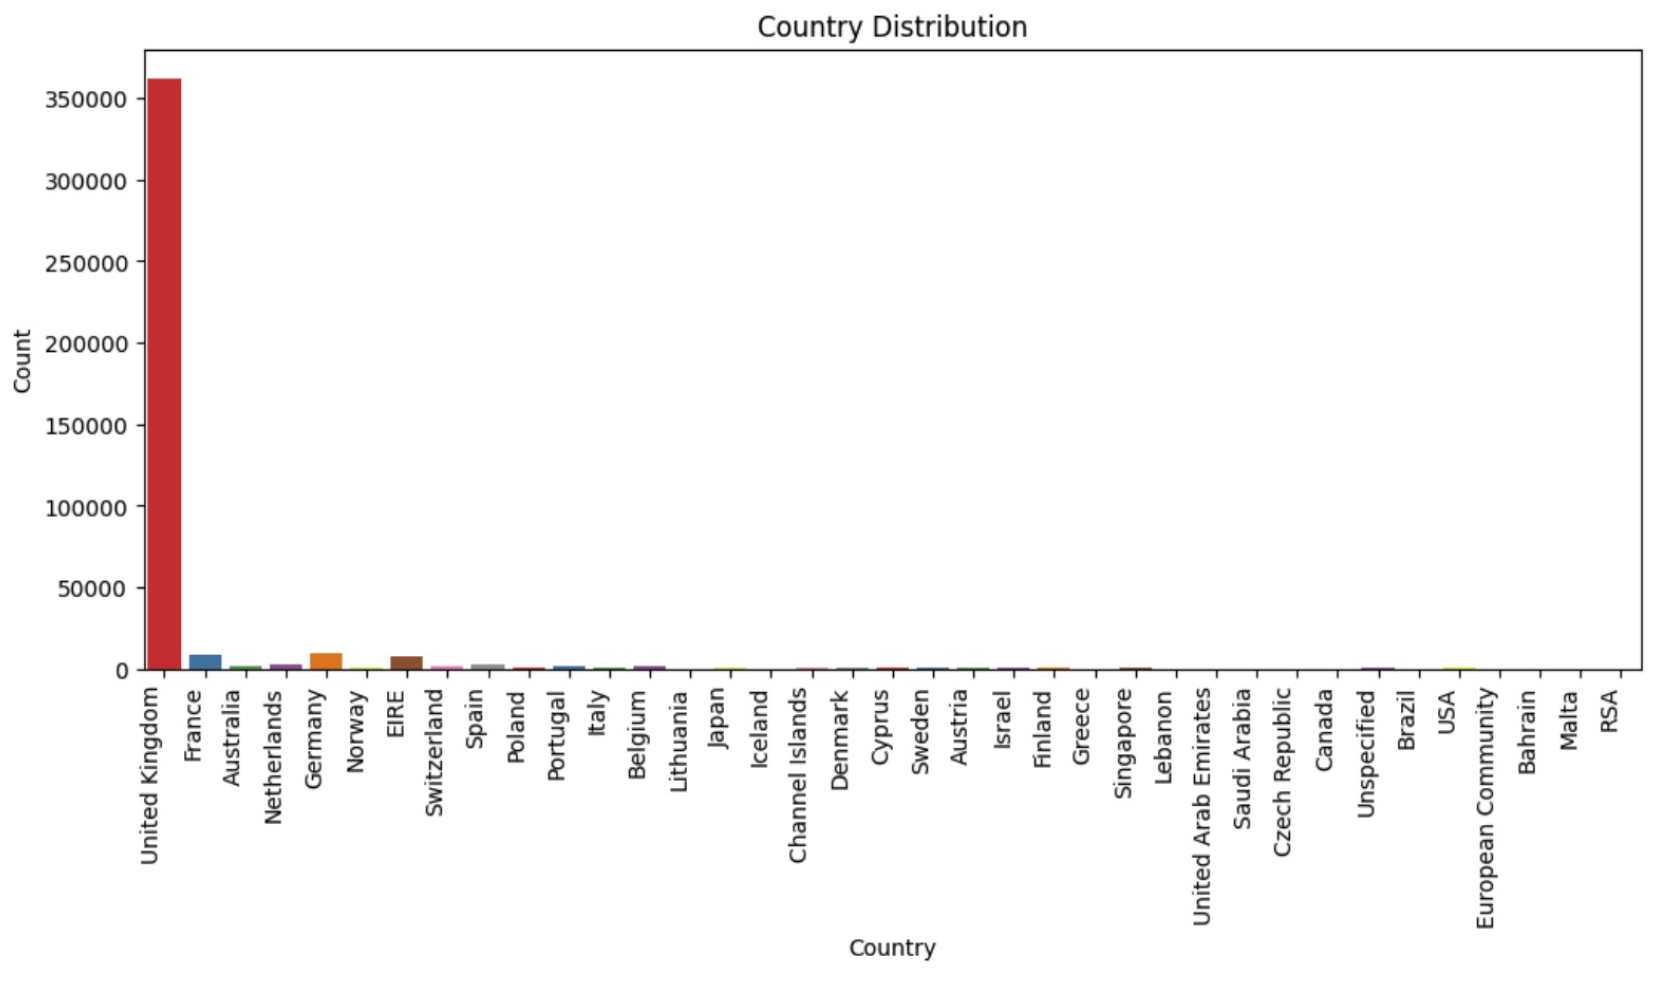
Figure 4.
Year Distribution Analysis.
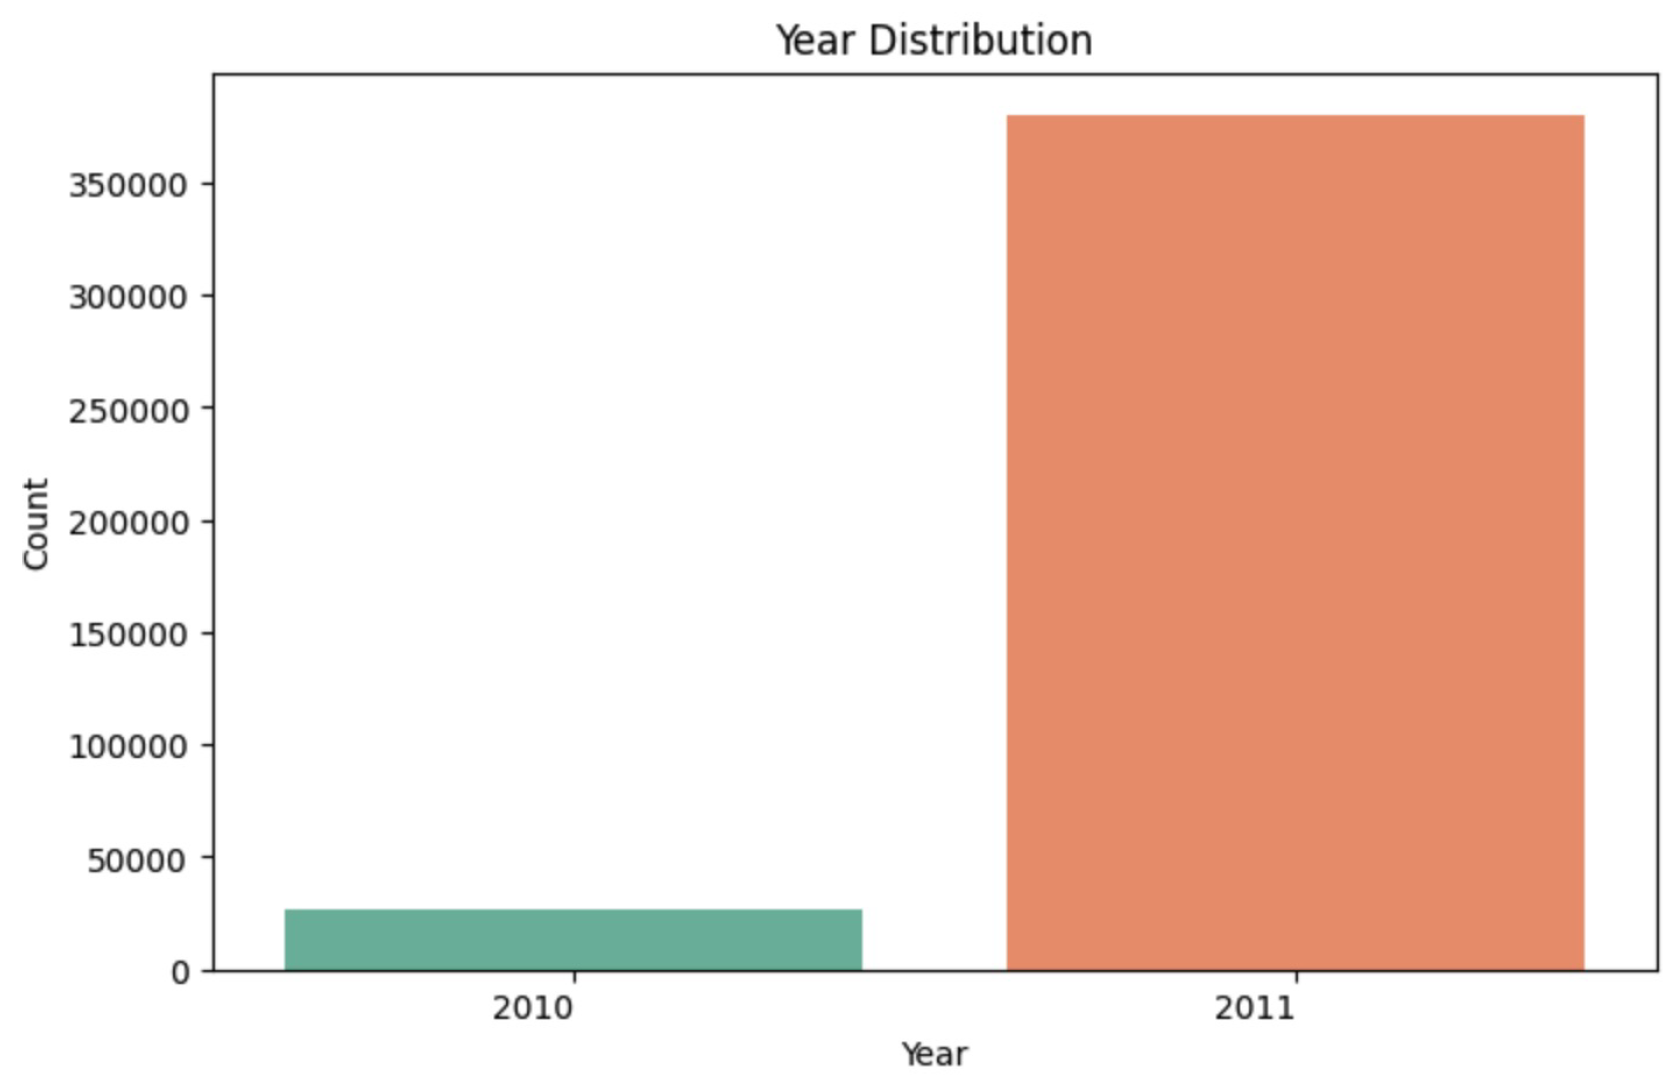
Figure 5.
Monthly Distribution Analysis.
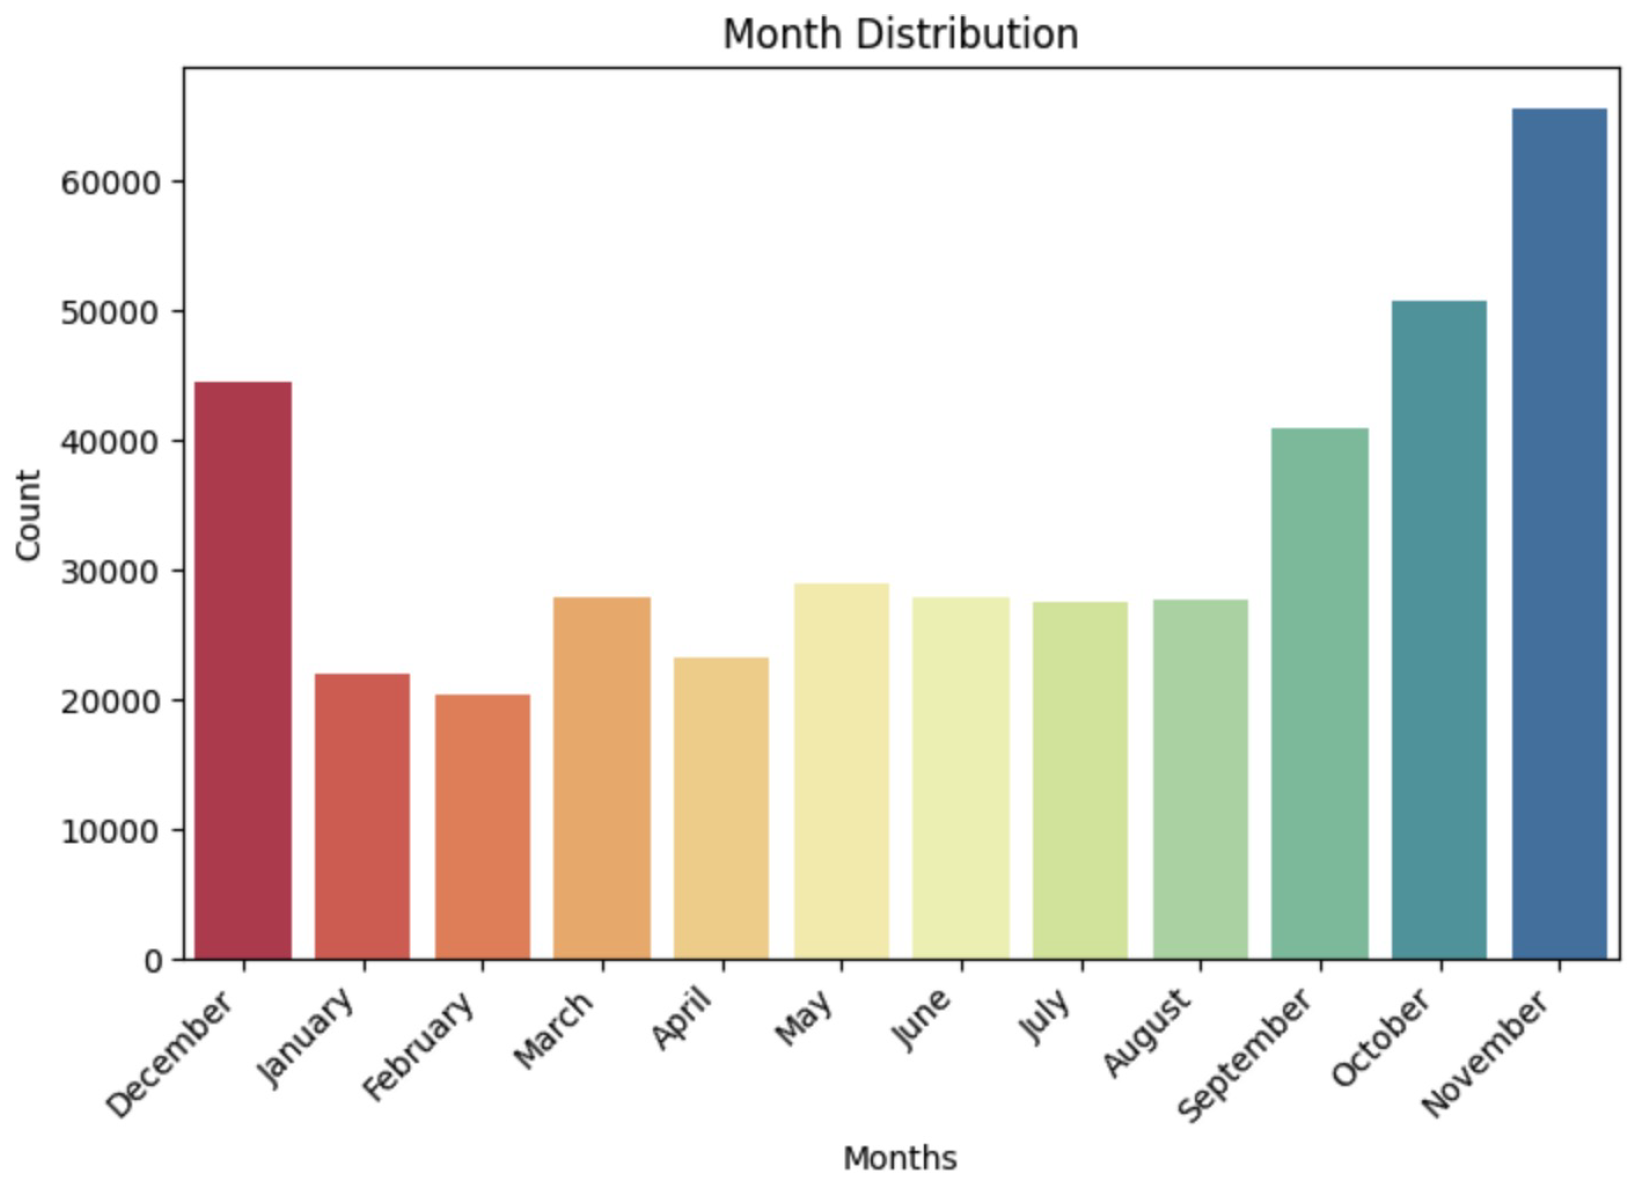
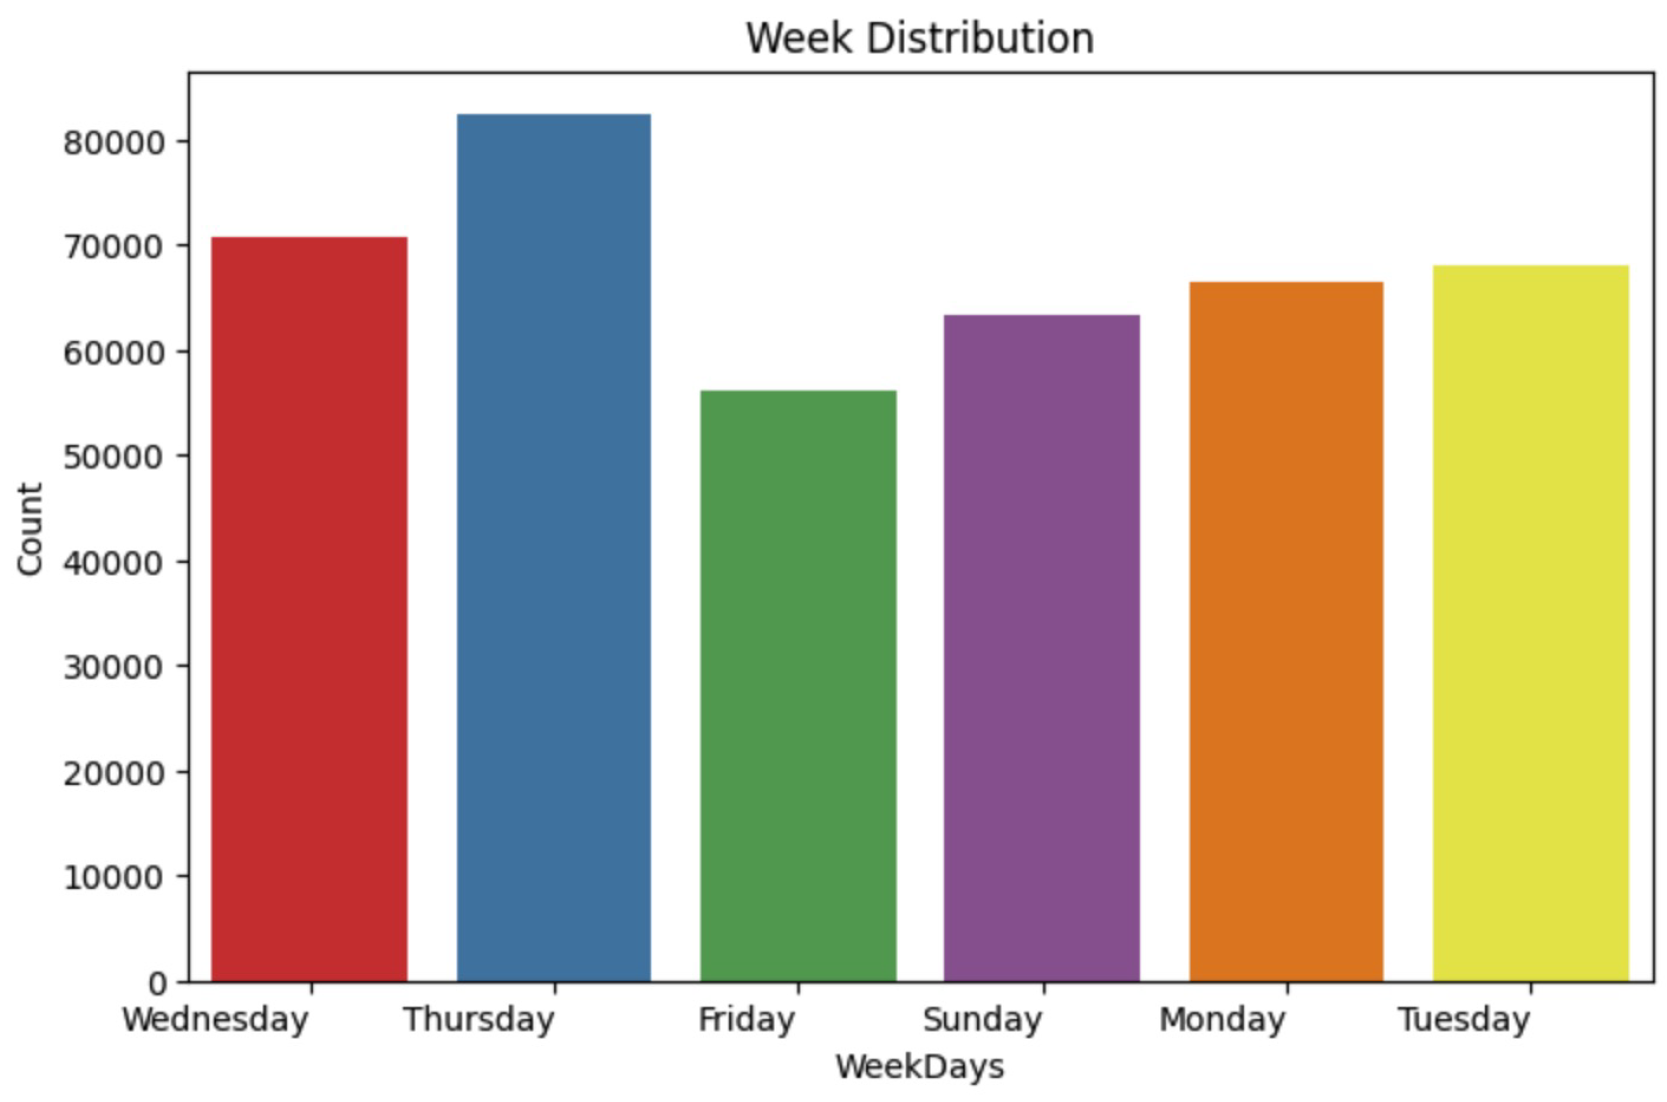
Figure 6.
Daywise Distribution Analysis.
In this research, the analysis of the online retail dataset has been conducted and visualized through a series of diagrams, which were all generated using Jupyter Notebook. The analysis covers different aspects of the dataset, including weekly, monthly, yearly, and country-wise distributions.
The weekly distribution analysis reveals that Thursdays exhibit the highest distribution, represented by a distinct blue color. Following Thursday, Wednesdays show the second-highest distribution, indicated in red. This weekly distribution provides valuable insights into the patterns of the data throughout the week.
For the monthly analysis, the highest distribution is observed in November, which is represented by a deep blue color. October follows as the second-highest month, shown in a specified color for comparison. The monthly distribution analysis continues to show the respective data for the remaining months, giving a comprehensive view of the sales patterns over the course of the year.
The yearly distribution analysis focuses on data from 2010 and 2011. The highest distribution is recorded in 2011, with the graph only reflecting data for these two years. This provides a clearer understanding of the sales trends within this limited time frame.
In the country-wise analysis, the United Kingdom is identified as having the highest distribution of data among the other countries in the dataset. This finding suggests that the United Kingdom is the primary contributor to the overall sales in the dataset.
In Figure ??, the relationship between the number of clusters and the Sum of Squared Differences (SSD) is presented. The graph shows that the SSD starts to settle at an optimal value when the number of clusters, n, reaches 2. The K-Means algorithm was implemented for a range of values starting from up to . For each value of n, the silhouette scores were calculated to evaluate the quality of each clustering. Both the SSD figure and the silhouette score analysis suggest that the optimal cluster size is , as it yields the best balance between compactness and separation in the clusters.
Figure 7.
Cluster vs SSD.
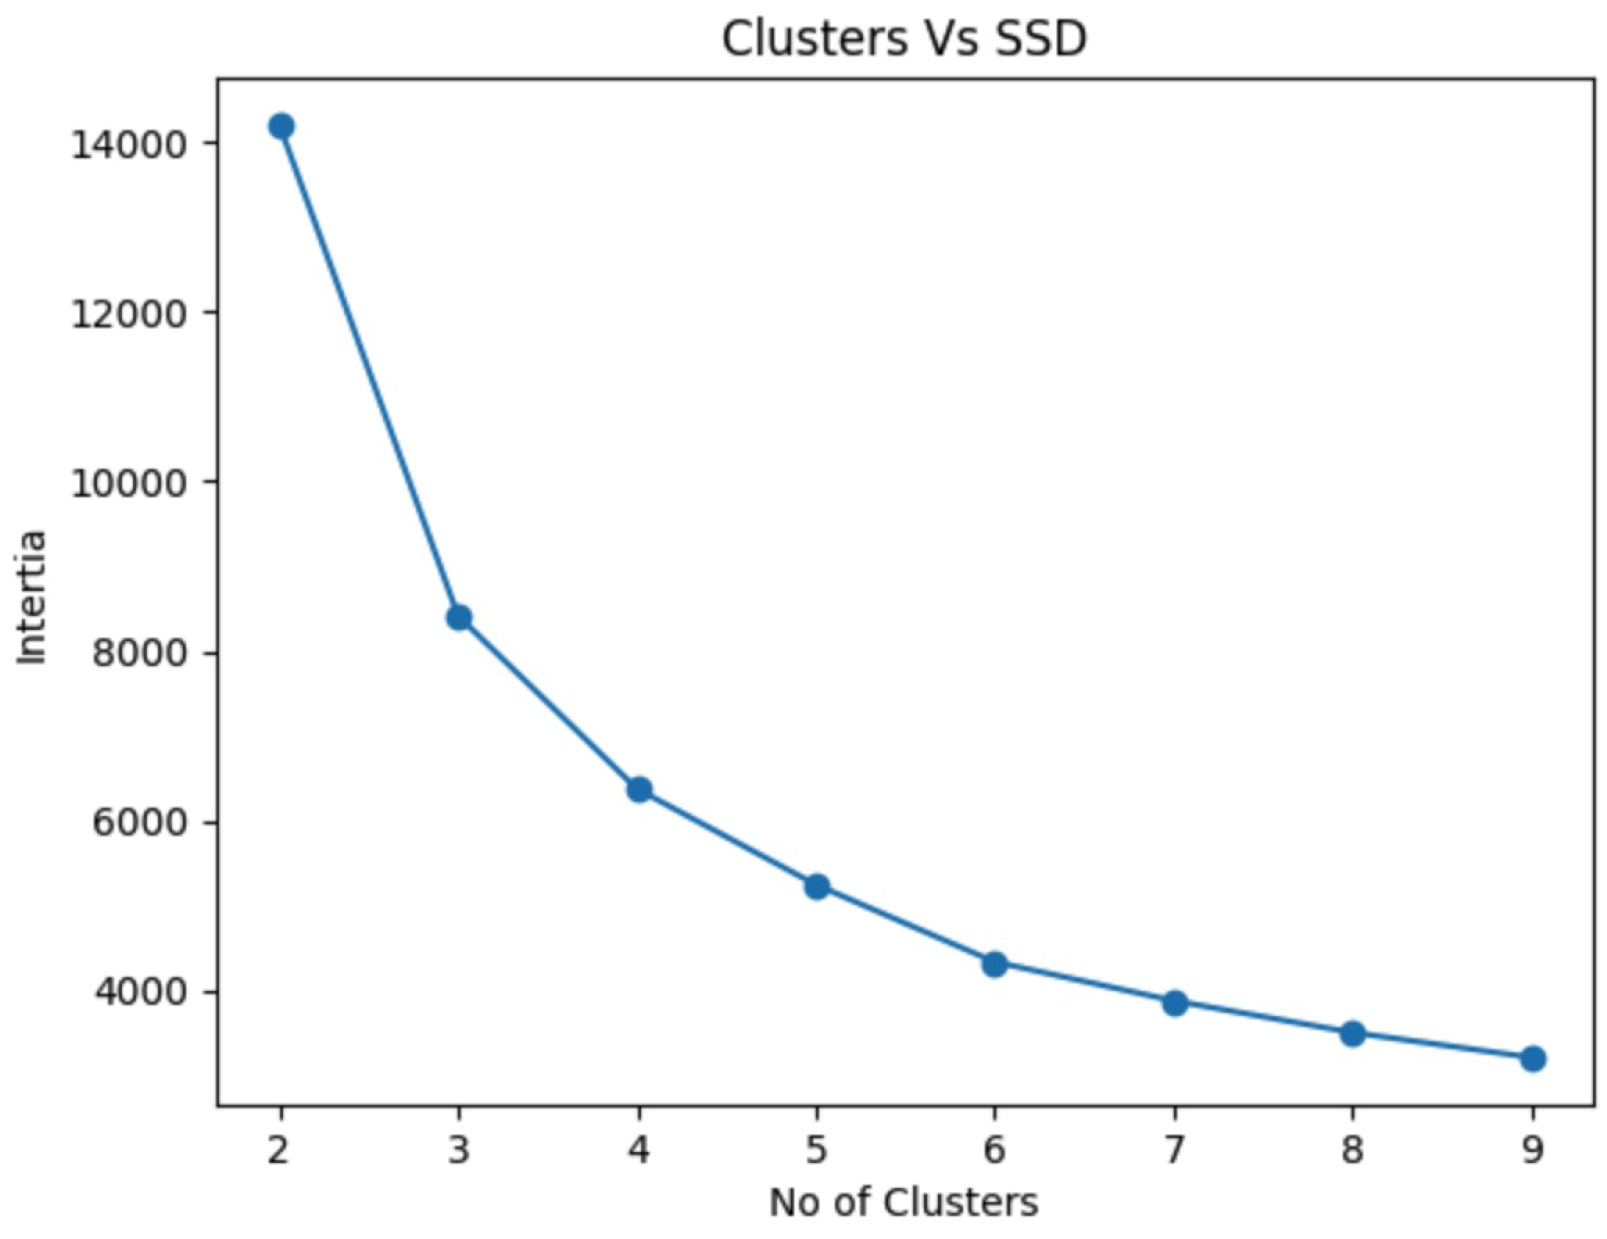
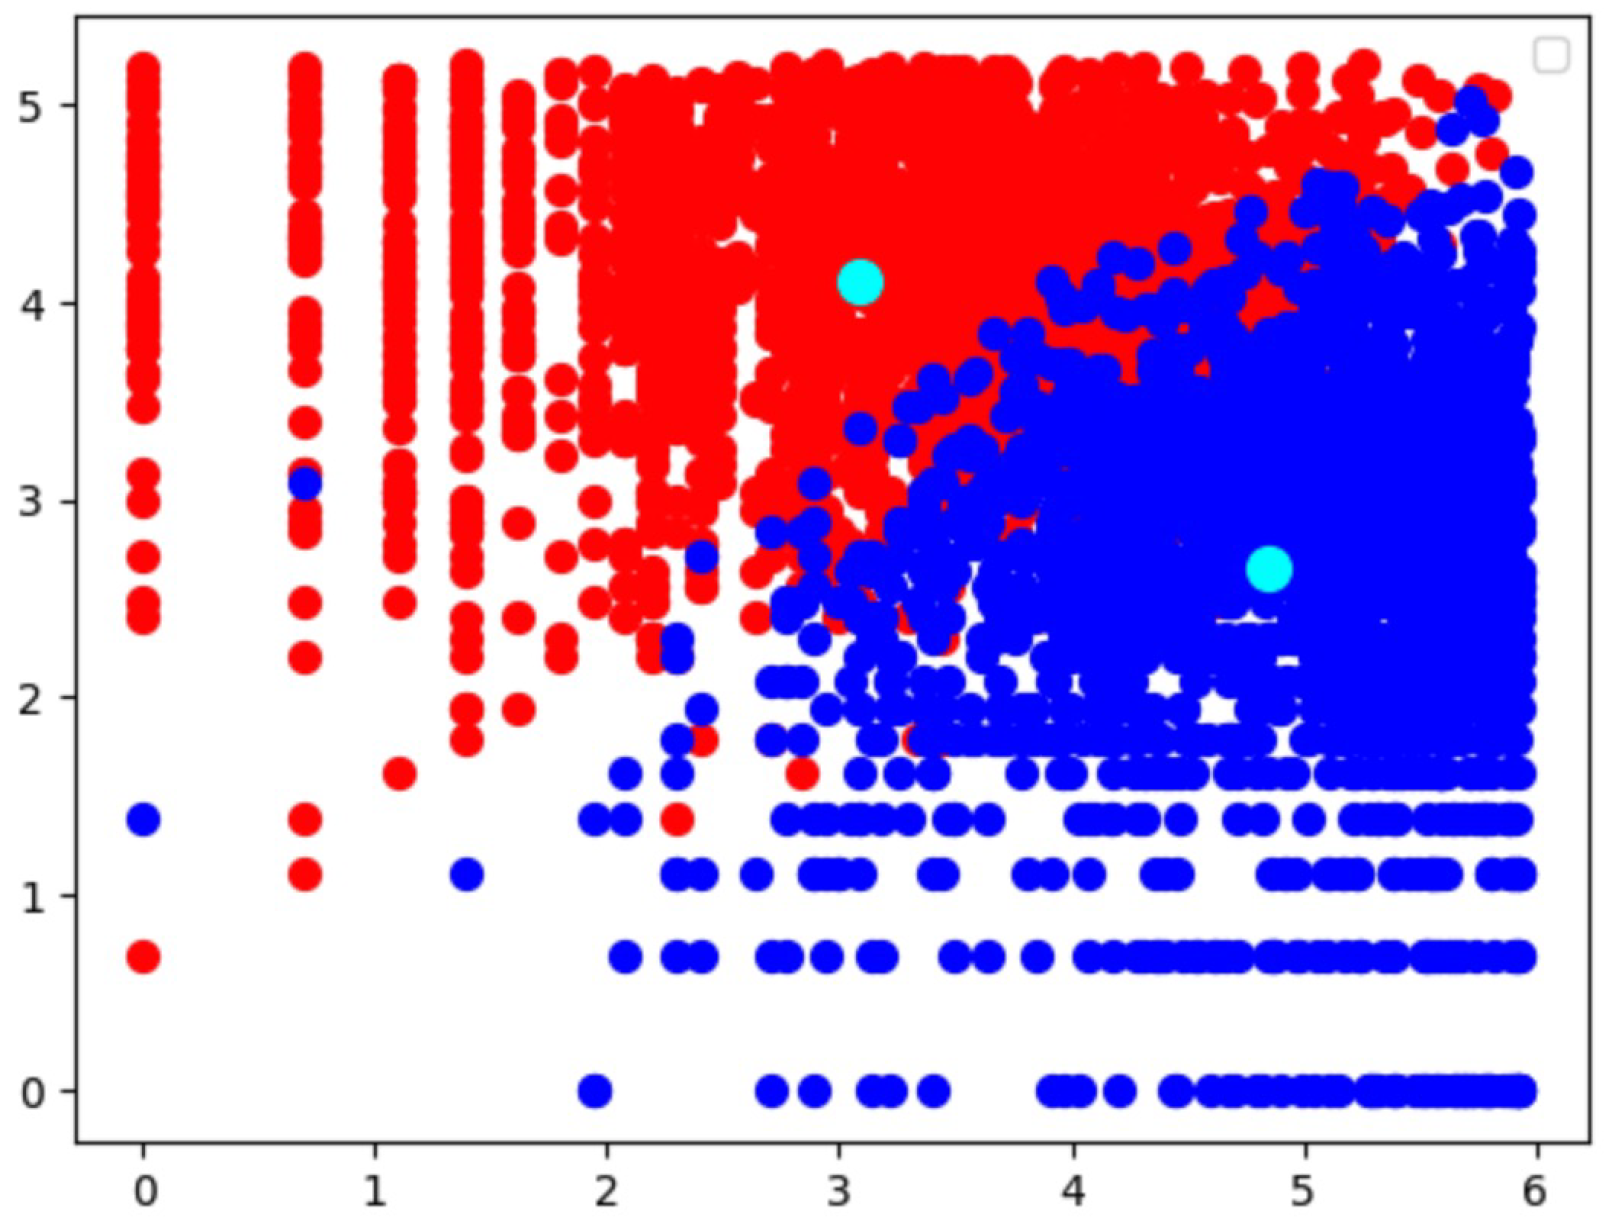
Figure 8.
K-Means Clustering (2 Clusters with their centroids).
In today’s highly competitive business environment, understanding customer preferences is crucial for the development of targeted products and services. Companies are increasingly focusing on customer segmentation to tailor their offerings to different demographic and behavioral factors such as age, occupation, gender, taste, culture, geography, and preferences. The ability to segment customers effectively enables companies to design products that resonate with specific customer groups, leading to improved customer retention and satisfaction. This study investigates the application of clustering techniques, specifically K-Means and DBSCAN, for segmenting customers based on a retail dataset. These techniques analyze the patterns within the data to classify customers into distinct groups, providing valuable insights for businesses aiming to enhance their marketing strategies and operational efficiency.
For the segmentation of customers, two popular clustering algorithms were applied to the dataset: K-Means and DBSCAN. Both algorithms offer unique ways of identifying groups within the data. K-Means divides the dataset into a predefined number of clusters by minimizing the within-cluster variance, while DBSCAN, a density-based clustering algorithm, identifies clusters by grouping together data points that are closely packed and marking points in low-density regions as outliers. These algorithms were applied to the same processed dataset that had been prepared using the Recency, Frequency, and Monetary (RFM) model, which is widely used for customer segmentation in e-commerce.
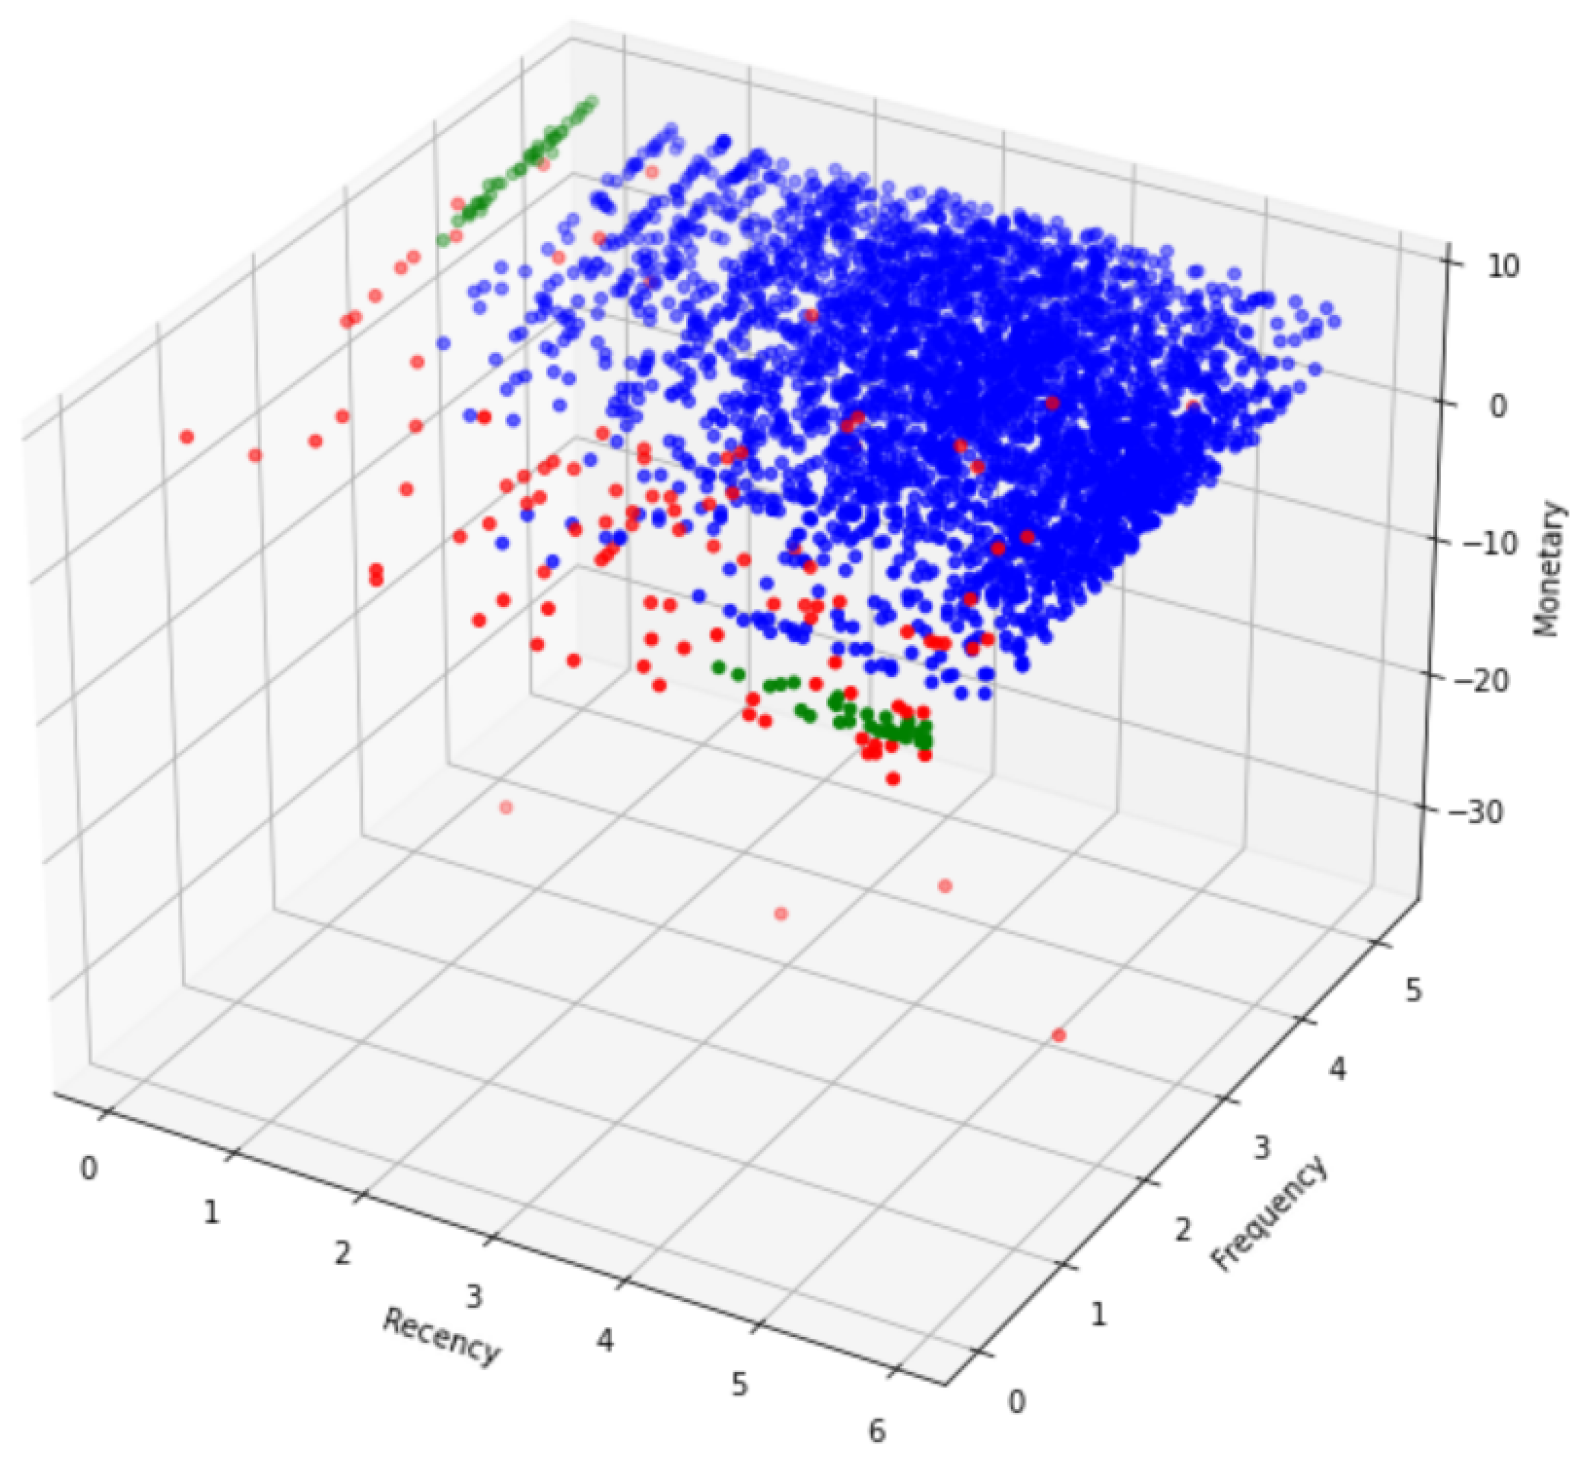
The K-Means algorithm generated well-defined clusters, resulting in a clear classification of customers. On the other hand, DBSCAN predicted four distinct clusters, with the majority of the data points belonging to a single cluster. While DBSCAN was able to identify some noise points, the silhouette score for DBSCAN was lower compared to K-Means, indicating that the clusters formed by DBSCAN were less cohesive. Furthermore, the runtime for DBSCAN was comparatively longer than K-Means, suggesting that DBSCAN may not be as efficient for this specific dataset.
Figure 9.
DBSCAN Clusters.
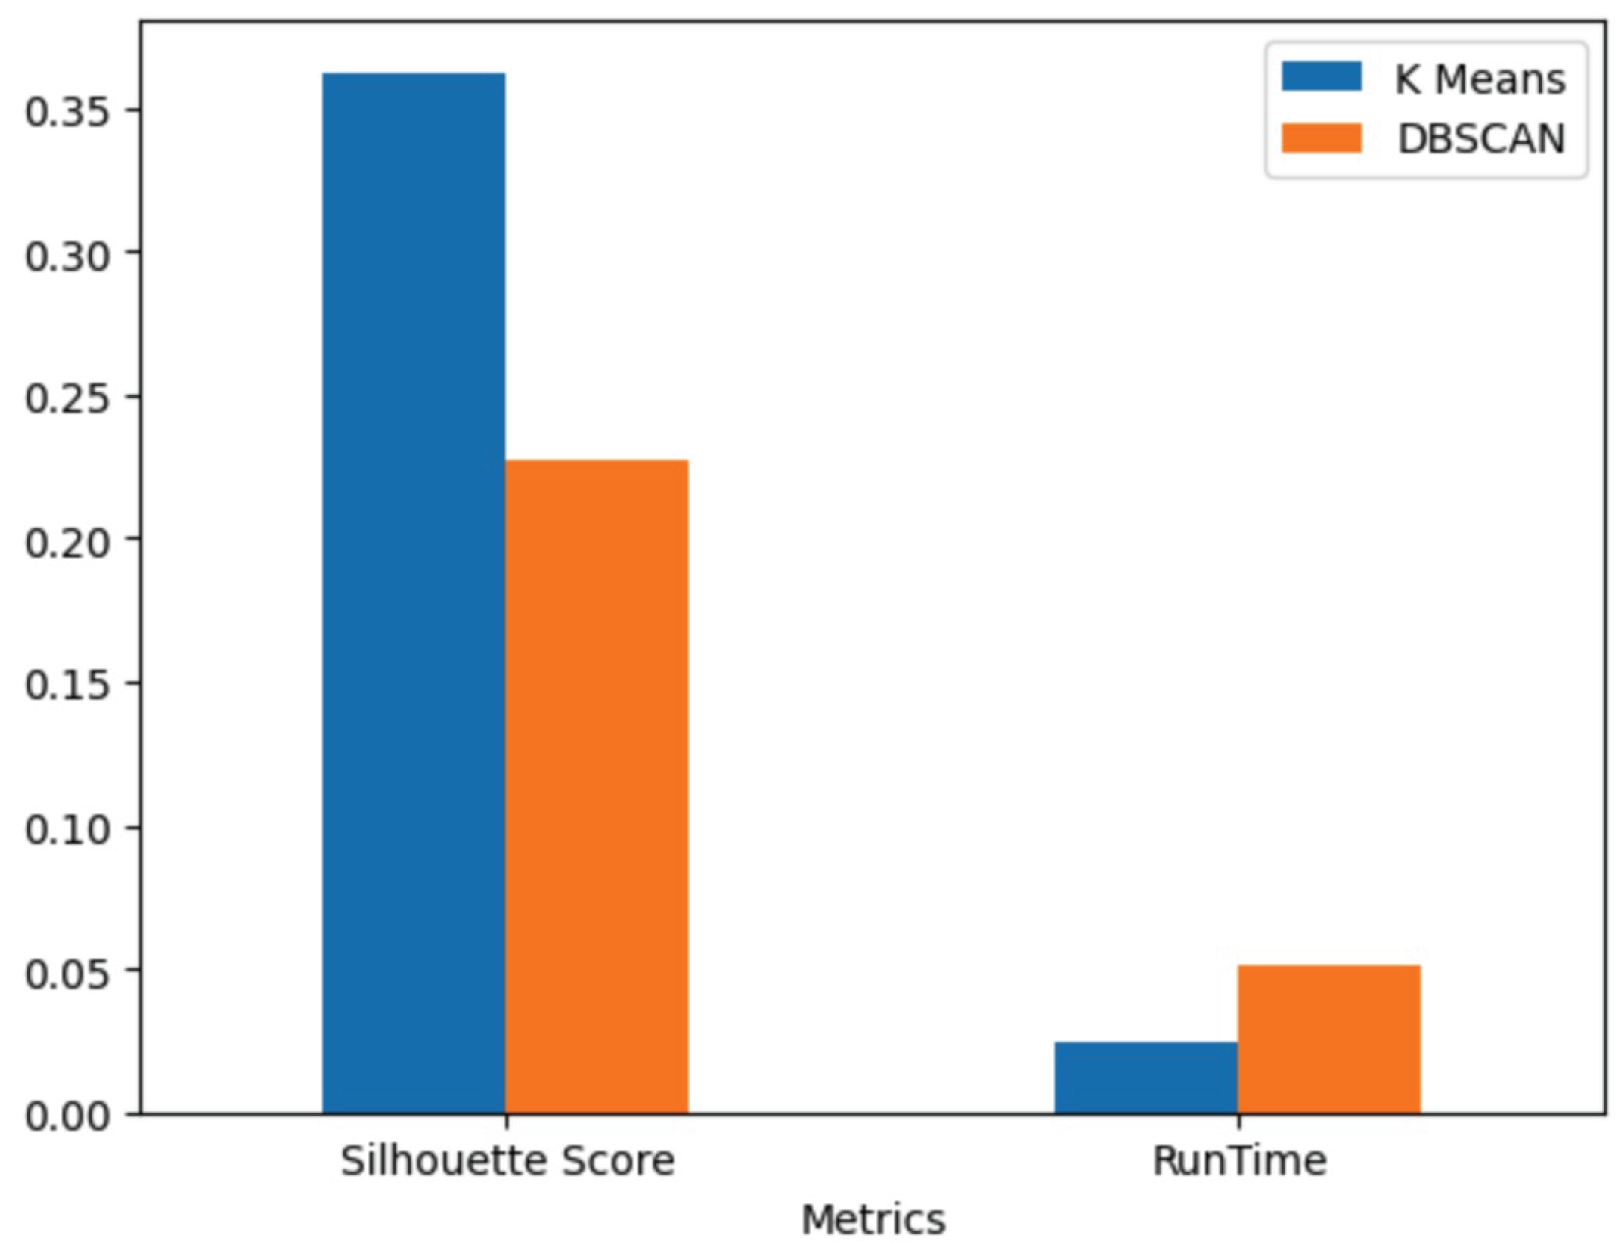
The comparison between the two algorithms, K-Means and DBSCAN, is shown in Figure ??. The figure illustrates the silhouette scores and the average runtime for each algorithm when fitting the model to the dataset. As depicted, K-Means outperforms DBSCAN in terms of both silhouette score and efficiency.
Figure 10.
K-Means vs DBSCAN Comparison.
7. Conclusions
Customer segmentation plays a pivotal role in the development of effective marketing strategies. By analyzing customer behavior and characteristics through clustering, businesses can tailor their products, optimize pricing models, and refine distribution channels to better meet consumer needs. This research aimed to evaluate the effectiveness of two widely used clustering algorithms, K-Means and DBSCAN, in the context of customer segmentation using an online retail dataset. The study demonstrated that the K-Means algorithm outperformed DBSCAN in terms of both cluster definition and computational efficiency. Specifically, K-Means was able to generate well-defined and compact clusters, which are essential for precise segmentation in marketing strategies. On the other hand, DBSCAN, which is designed to detect outliers and form clusters based on density, showed its strengths in identifying noise and irregularly shaped clusters. However, its performance in this particular dataset was not as favorable as K-Means, largely due to the relatively uniform density of the dataset and the absence of significant noise.
This outcome suggests that, for companies aiming to implement customer segmentation on datasets similar to the one used in this study, K-Means offers a more reliable and computationally efficient solution. Its ability to generate distinct clusters quickly makes it a preferred choice in most practical applications. Nonetheless, DBSCAN may still be a valuable tool in scenarios where the dataset contains substantial noise or clusters with varying densities that cannot be easily captured by K-Means. Therefore, while K-Means is generally more suitable for customer segmentation in structured datasets, DBSCAN should not be overlooked, especially when dealing with complex or irregular data distributions.
8. Future Work
While this study provides valuable insights into the comparison of K-Means and DBSCAN for customer segmentation, several areas remain unexplored that could further enhance the accuracy and applicability of clustering algorithms in marketing contexts. First, future work could focus on incorporating additional features such as customer transaction history, demographic data, and social media activity, which may provide deeper insights into customer segmentation patterns. This would require exploring more advanced clustering techniques like hierarchical clustering, Gaussian Mixture Models (GMM), or even deep learning-based approaches that can capture complex relationships within large datasets.
Second, the performance of K-Means and DBSCAN could be evaluated in more diverse datasets, including those with significant noise, varying cluster densities, or complex non-linear relationships. Furthermore, comparing the performance of these algorithms in real-time applications could provide valuable insights into their practical viability for dynamic customer segmentation. Additionally, hybrid approaches that combine the strengths of both K-Means and DBSCAN, such as using DBSCAN for outlier detection followed by K-Means for core clustering, could be explored to improve segmentation outcomes.
Lastly, the integration of interpretability methods for clustering models could be an interesting direction for future research. Understanding the "why" behind the clustering decisions made by these algorithms could improve the transparency of the segmentation process and assist businesses in making data-driven marketing decisions with greater confidence.
References
- Anthony O. Otiko, John A. Odey and Gabriel A. Inyang. “Conceptualization of Market Segmentation and Patterns for Pre-Christmas Sales in an Online Retail Store.” Journal of Science, Engineering and Technology, Vol. 6 (1), pages 51-59, 2019.
- Mohamad Abdul Kadir and Adrian Achyar. “Customer Segmentation on Online Retail using RFM Analysis: Big Data Case of Bukku.id.” International Conference on Environmental Awareness for Sustainable Development in conjunction with International Conference on Challenge and Opportunities Sustainable Environmental Development. 2019.
- A. Joy Christy, A. Umamakeswari, L.Priyatharsini and A. Neyaa. “RFM ranking – An effective approach to customer segmentation.“ Journal of King Saud University – Computer and Information Sciences. 2018.
- P. Anitha and Malini M. Patil. RFM model for Customer purchase behavior using K-Means Algorithm. Journal of King Saud University – Computer and Information Sciences. 2019.
- Schellong Daniel , Kemper Jan and Brettel Malte. “Clickstream Data as a source to uncover consumer shopping types in a large scale online setting.” 2016.
- Hadeel Ahmed, Bassam Kasasbeh, Balqees Aldabaybah and Enas Rawashdeh. “Class balancing framework for credit card fraud detection based on clustering and similarity-based selection (SBS).” 2022.
- Wann Yih Wu, Phan Thi Phu Quyen and Adriana A. Amaya Rivas. “How e-servicescapes affect customer online shopping intention: the moderating effects of gender and online purchasing experience.” 2016.
- ASM Shahadat Hossain. “Customer Segmentation using Centroid Based and Density Based Clustering Algorithms.” International Conference on Electrical Information and Communication. 2017.
- Nassim Dehouche. “Dataset on usage and engagement patterns for Facebook Live Sellers in Thailand.” 2020.
- Daqing Chen, Kun Guo and Bo Li. “Predicting Customer Profitability Dynamically over Time: An Experimental Comparative Study”. 2019.
- Vinaya Manchaiah, Amyn M. Amlani, Christina M.Bricker, Clayton T. Whitfield and Pierre Ratinaud. “Benefits and Shortcomings of Directto-Consumer Hearing Devices: Analysis of Large Secondary Data Generated from Amazon Customer Reviews.” Journal of Speech, Language, and Hearing Research. 2019.
- Gaurav Mishra and Sraban Kumar Mohanty. “A fast hybrid clustering technique based on local nearest neighbor using minimum spanning tree.” 2019.
- Kayalvily Tabianan, Shubashini Velu and Vinayakumar Ravi. “K-Means Clustering Approach for Intelligent Customer Segmentation Using Customer Purchase Behavior Data”. 2022.
- Danuta Zakrzewska and Jan Murlewski. “Clustering Algorithms for Bank Customer Segmentation”. 2005.
- Jun Wu, Wen-Pin Lin, Sang-Bing Tsai, Yuanyuan Li, Liping Yang and Guangshu Xu. “An Empirical Study on Customer Segmentation by Purchase Behaviors sing a RFM Model and K-Means Algorithm.” 2020.
Disclaimer/Publisher’s Note: The statements, opinions and data contained in all publications are solely those of the individual author(s) and contributor(s) and not of MDPI and/or the editor(s). MDPI and/or the editor(s) disclaim responsibility for any injury to people or property resulting from any ideas, methods, instructions or products referred to in the content. |
© 2026 by the authors. Licensee MDPI, Basel, Switzerland. This article is an open access article distributed under the terms and conditions of the Creative Commons Attribution (CC BY) license (http://creativecommons.org/licenses/by/4.0/).
Copyright: This open access article is published under a Creative Commons CC BY 4.0 license, which permit the free download, distribution, and reuse, provided that the author and preprint are cited in any reuse.


