Submitted:
29 December 2025
Posted:
31 December 2025
Read the latest preprint version here
Abstract
Hydrogen is a versatile energy carrier essential for decarbonizing hard-to-abate sectors and long-duration storage. This study presents a unified techno-economic comparison of major production pathways—grey/blue steam methane reforming, biomass gasification, thermochemical cycles, biological methods, and solar-powered electrolysis—using 2025 benchmarks. Focus is on a 100 kW off-grid PV-electrolyzer system with realistic assumptions (PV performance ratio 0.85, electrolyzer efficiency 70% LHV). In Iran's high-insolation regions (PSH ≥ 5.15 kWh/kWp/day), annual yields reach 3.2–3.4 tonnes H₂—55–60% higher than northern Europe—with round-trip efficiency of 23.8%. Solar electrolysis offers zero direct emissions and 51–55 kWh/kg H₂ consumption. Scaling to multi-MW coastal hybrids with renewable desalination projects LCOH of 3.0–4.0 USD/kg by 2030, positioning Iran as a competitive exporter. A reproducible model and phased roadmap provide actionable insights.
Keywords:
green hydrogen
; solar-powered electrolysis
; techno-economic analysis
; levelized cost of hydrogen
; renewable desalination
; Iran
I. Introduction
Hydrogen has become a central pillar in global decarbonization strategies due to its potential to serve as a clean and versatile energy carrier across multiple sectors, including transportation, electricity storage, heavy industries, and chemical production. Currently, hydrogen is produced through several pathways that differ significantly in their feedstocks, efficiencies, costs, and environmental footprints. Conventional fossil-based routes such as steam methane reforming (SMR) dominate global production because of their maturity and relatively low cost; however, they are responsible for substantial CO₂ emissions and are incompatible with long-term climate commitments. Efforts to mitigate these emissions have led to the development of blue hydrogen, where SMR is combined with carbon capture and storage (CCS), though challenges related to capture efficiency, long-term storage integrity, and added costs remain unresolved.
In contrast, renewable-based pathways—particularly water electrolysis powered by solar or wind energy—offer a sustainable route toward “green hydrogen” with near-zero lifecycle emissions. Among these, solar-powered water electrolysis is of growing interest due to rapid reductions in photovoltaic (PV) costs, the scalability of electrolyzer technologies, and the strong solar potential in many regions of the world. Despite these advantages, the integration of electrolyzers with intermittent renewable sources introduces operational complexities, including variable power input, lower capacity factors, and efficiency degradation over time. Additionally, factors such as water availability, system-level energy losses, and the high cost of electrolyzers continue to challenge widespread adoption.
Although numerous review studies have assessed hydrogen production routes, several critical gaps persist. First, many existing works lack a unified, quantitative comparison of hydrogen production pathways under consistent assumptions. Second, few studies perform a detailed performance assessment of solar-powered electrolysis based on realistic photovoltaic output, peak sun hours, and conversion efficiencies. Third, despite the high solar potential in countries such as Iran, the implications of climatic conditions—such as ambient temperature, dust intensity, and water scarcity—on system performance are not adequately addressed in current literature.
This study aims to bridge these gaps by providing a comprehensive comparative analysis of major hydrogen production methods including SMR (grey), SMR with CCS (blue), biomass gasification, thermochemical cycles, biological methods, and solar-driven water electrolysis under a unified evaluation framework. A detailed performance model of a 100 kW PV–electrolyzer system is developed to estimate daily and annual hydrogen output under varying solar irradiance scenarios. The analysis includes energy conversion efficiency, round-trip electricity losses, and system integration considerations. Furthermore, the influence of Iran’s high solar irradiance and environmental constraints on solar hydrogen production is examined to highlight regional opportunities and challenges.
Additionally, the levelized cost of hydrogen (LCOH) is calculated under realistic 2025–2030 cost trajectories and Iran-specific constraints (high irradiance, dust, water scarcity, and coastal desalination integration) to provide policymakers and investors with a clear economic competitiveness roadmap.
The main contributions (novelties) of this work are as follows:
- A unified technical comparison of all major hydrogen production routes based on efficiency, environmental impact, and technology readiness.
- Development of a quantitative performance model for a 100-kW solar-powered water electrolysis system using realistic PV and electrolyzer assumptions.
- Analysis of round-trip efficiency, highlighting the implications of hydrogen reconversion to electricity.
- Evaluation of solar hydrogen potential in Iran, considering climatic factors such as high irradiance, dust, and water scarcity.
While Saudi Arabia’s NEOM project has attracted global attention with its ambitious 4 GW target by 2030, Iran’s combination of superior solar–wind hybrid potential, existing ammonia export infrastructure, and lower projected desalination costs offers a compelling alternative pathway to achieve even lower LCOH in the same timeframe.
Figure 1.
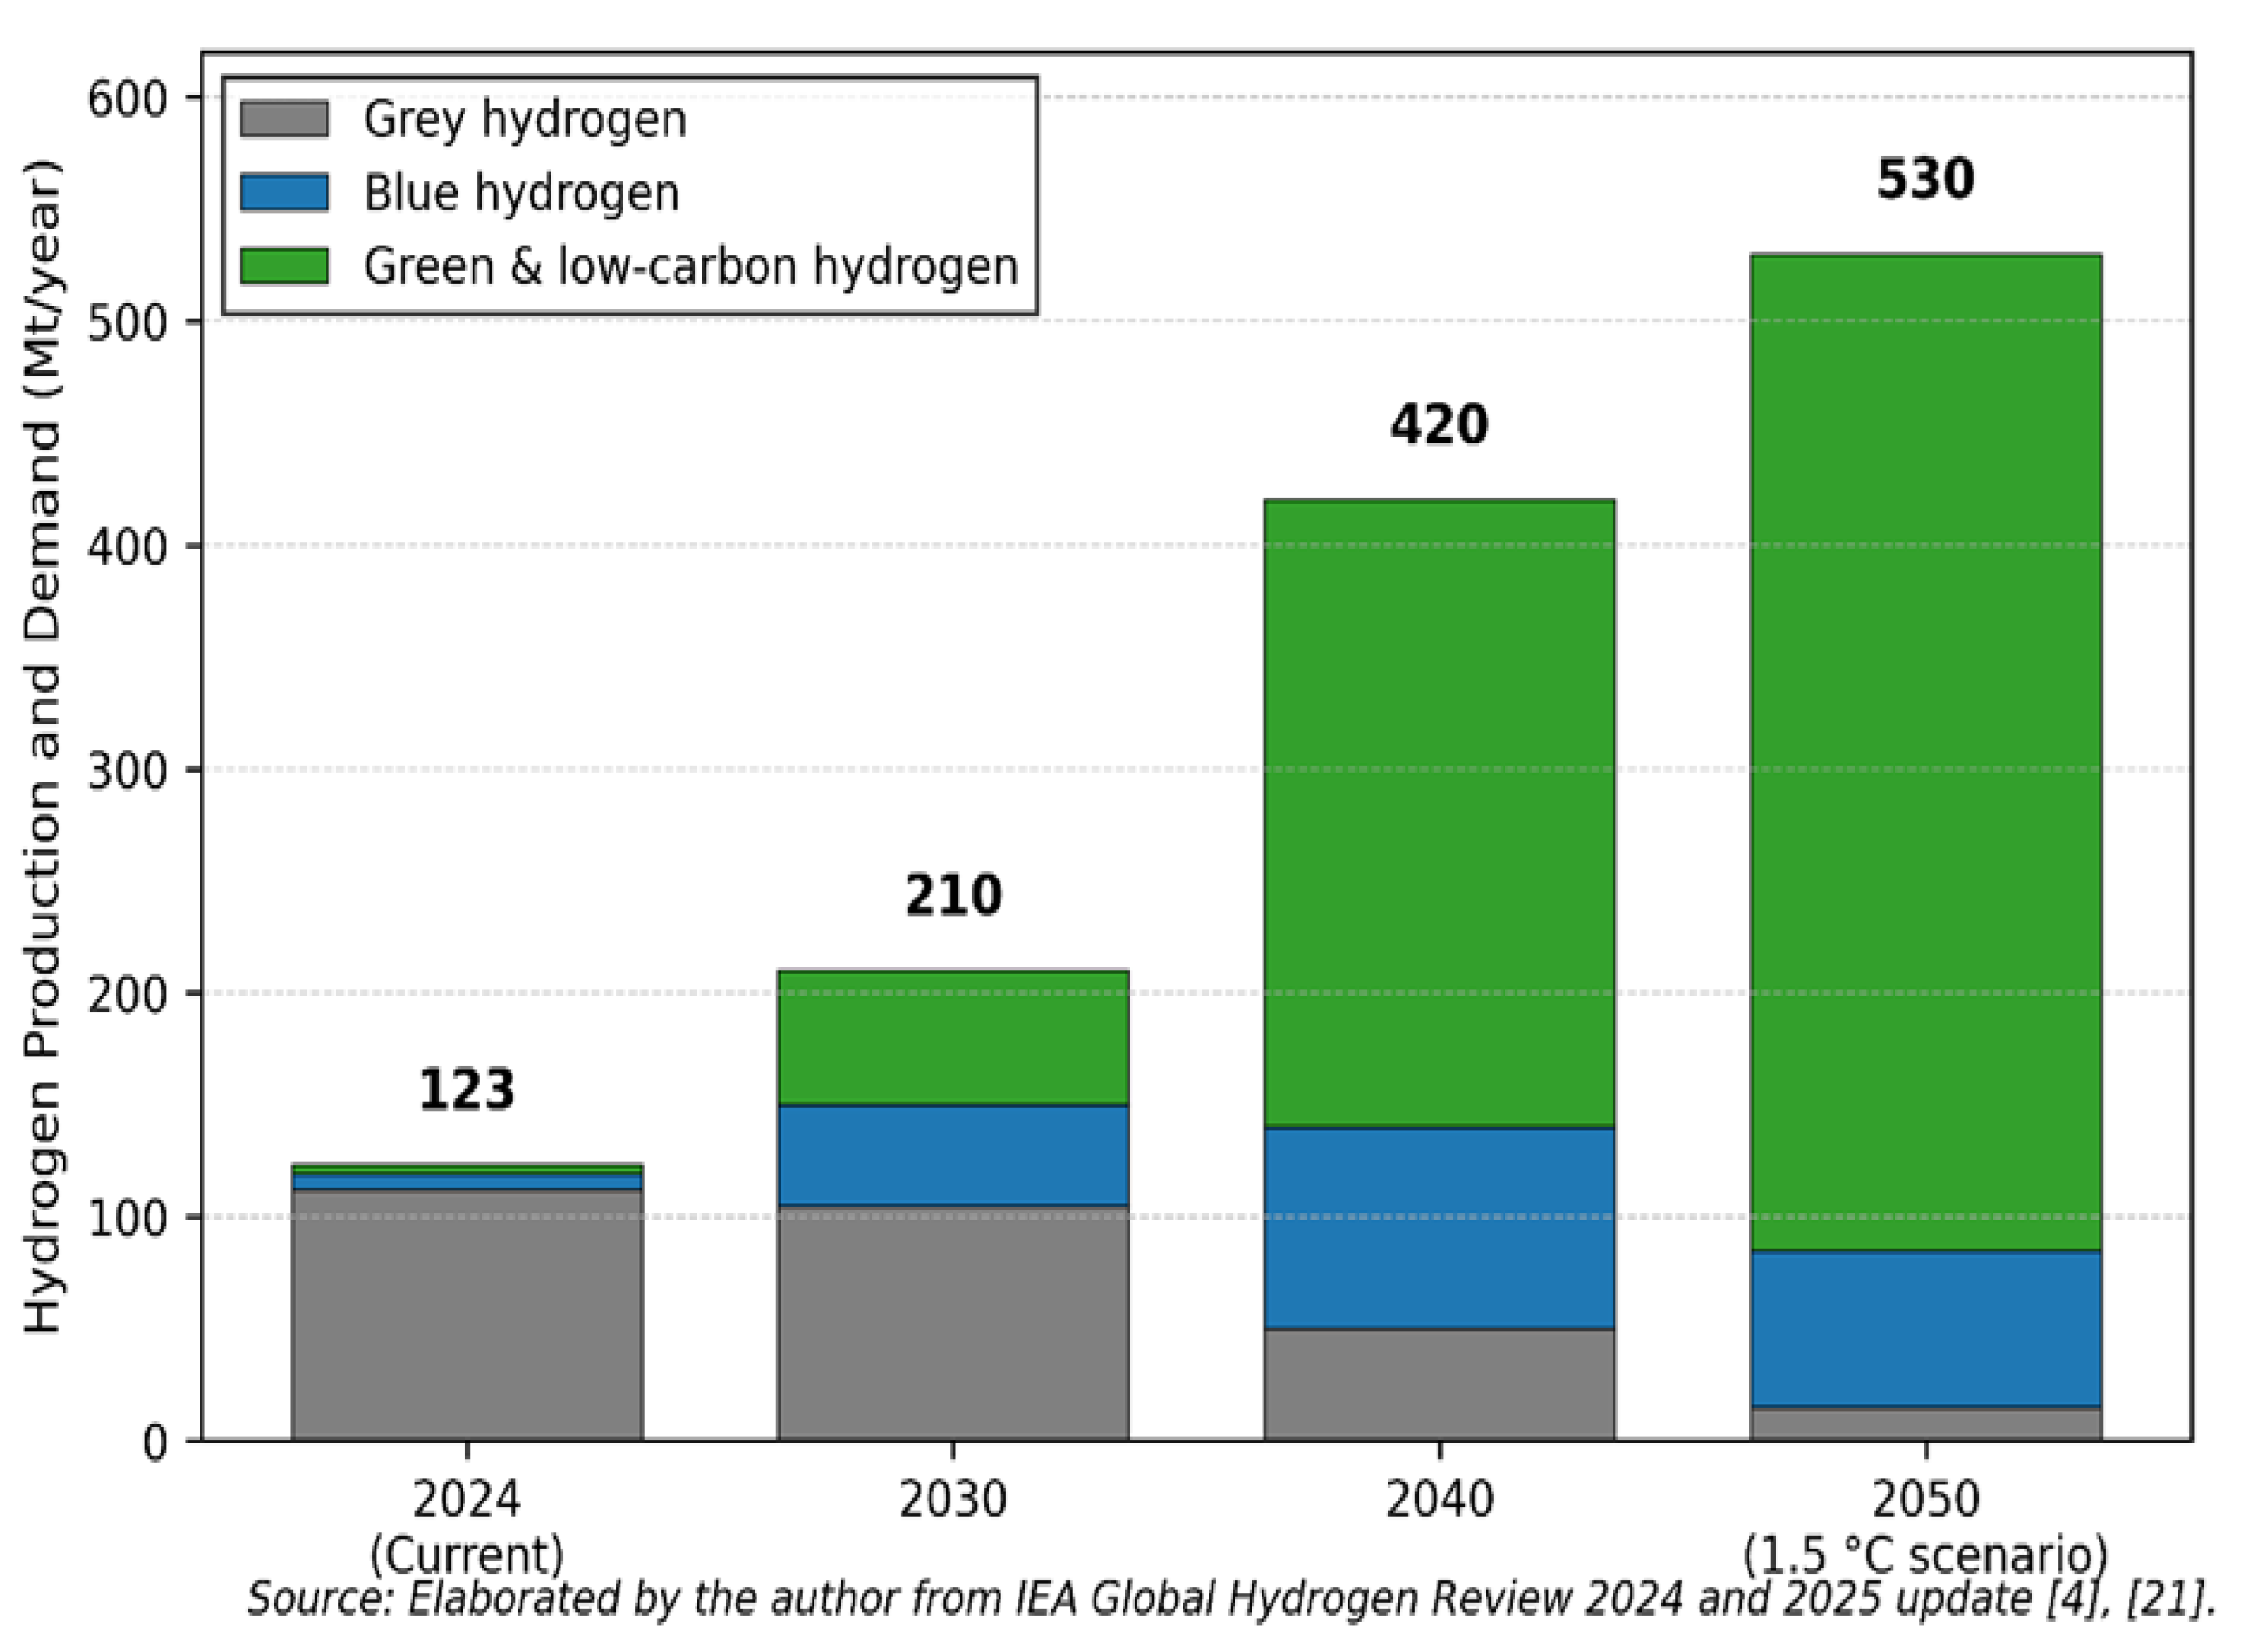
Global hydrogen production in 2024 and projected demand in the IEA Net Zero Emissions by 2050 (NZE) Scenario. More than 98\% of current production is grey hydrogen from fossil fuels without CCS. Low-carbon hydrogen (blue + green) must increase from ~5 Mt in 2024 to over 520 Mt by 2050 to meet climate goals. Source: Author's elaboration based on IEA Global Hydrogen Review 2024 and 2025 update \cite{IEA2025}.
Figure 1.
Global hydrogen production in 2024 and projected demand in the IEA Net Zero Emissions by 2050 (NZE) Scenario. More than 98\% of current production is grey hydrogen from fossil fuels without CCS. Low-carbon hydrogen (blue + green) must increase from ~5 Mt in 2024 to over 520 Mt by 2050 to meet climate goals. Source: Author's elaboration based on IEA Global Hydrogen Review 2024 and 2025 update \cite{IEA2025}.
Overall, this study provides an integrated and data-driven assessment intended to support engineers, policymakers, and researchers in evaluating hydrogen production strategies and optimizing future renewable hydrogen infrastructures.

Table I.
Comparison of this work with recent review studies on hydrogen production pathways.
Reference Unified
Table I.
Comparison of this work with recent review studies on hydrogen production pathways.
Reference Unified
| Reference | Unified comparison | 100 kW-scale modeling | Round-trip efficiency | Iran-specific analysis |
|---|---|---|---|---|
| [11] (2023) | Yes | No | No | No |
| [12] (2024) | Yes | No | No | No |
| [13] (2025) | Partial | No | Partial | No |
| This work | Yes | Yes | Yes | Yes |
The following subsections detail each pathway's technical principles, performance metrics, and current TRL.
II. Hydrogen Production Technologies
This section provides an overview of major hydrogen production pathways, emphasizing their underlying principles, energy conversion efficiencies, environmental footprints, and Pathways readiness levels (TRLs) on a scale of 1–9, where TRL 9 denotes full commercial maturity. Pathways are categorized into fossil-based, renewable-based, and emerging routes, drawing on recent 2025 assessments from the IEA and other sources. The analysis incorporates updates on efficiencies and emissions, reflecting advancements in catalysts, process integration, and carbon capture.
A. Fossil-Based Pathways
Fossil-derived methods dominate current global hydrogen supply (>95%), but their high CO₂ emissions necessitate mitigation strategies for alignment with net-zero goals.
Grey Hydrogen via Steam Methane Reforming (SMR):
The predominant industrial process (>76% of production) involves reforming natural gas (primarily CH₄) with steam at 700–1000°C and 3–25 bar pressure, catalyzed by nickel: CH₄ + H₂O → CO + 3H₂, followed by water-gas shift (CO + H₂O → CO₂ + H₂). Overall efficiency: 70–85% (LHV basis). Specific emissions: 8–12 kg CO₂-eq/kg H₂, equivalent to ~9 tones CO₂ per tonne H₂. TRL: 9 (fully commercial, with >100 Mt/year global capacity). Dominant cost driver: natural gas price (~$1.5–3/kg H₂ in 2025). Advantages include low CAPEX ($500–800/kW) and scalability; limitations encompass fossil dependency and emissions.
Blue Hydrogen via SMR with Carbon Capture and Storage (CCS):
Identical to grey SMR but integrates CCS (e.g., amine scrubbing or membranes) to capture 71–95% of CO₂ for geological sequestration. Residual emissions: 0.5–4.5 kg CO₂-eq/kg H₂ at 90% capture. Efficiency penalty: 8–15% due to energy for capture/compression (4.6 MJ/kg CO₂ captured). TRL: 8 (early commercial; >10 GW projects operational or under construction by 2025). Cost: $2.2–3.8/kg H₂, 20–60% higher than grey due to CCS (~$50–100/tonne CO₂ avoided). Recent advances include ship-based CCS for LNG carriers, reducing onboard emissions by 90%.
B. Renewable-Based Pathways
These zero-direct-emission routes leverage biomass or renewables, offering lifecycle CO₂ neutrality when sustainably sourced.
Green Hydrogen via Solar-Powered Water Electrolysis:
Electrolysis decomposes deionized water using renewable electricity: 2H₂O → 2H₂ + O₂ (ΔH = 286 kJ/mol H₂). Key variants:
- Alkaline Electrolysis (AEC):
Mature liquid KOH electrolyte (20–30 wt%) at
60–80°C; efficiency 62–75% LHV (50–54 kWh/kg H₂); stack CAPEX $400–600/kW in
2025. TRL: 9.
- Proton Exchange Membrane (PEM):
Solid polymer electrolyte (e.g., Nafion) at 50–80°C; efficiency 65–82% LHV (45–52 kWh/kg H₂); excels in dynamic loads (>50% partial load) but higher CAPEX ($800–1100/kW) due to Ir/Pt catalysts, . TRL: 9 (expected full maturity by 2030).
- Solid Oxide Electrolysis (SOE):
Ceramic electrolyte at 700–900°C; efficiency 75–90% LHV (with heat integration, ~40 kWh/kg H₂); leverages waste heat for 84% electrical efficiency. TRL: 6–7 (pilots scaling to 500 MW/yr by 2025). Advantages: >99.999% H₂ purity, intermittent renewable compatibility; electricity demand: 45–58 kWh/kg H₂. Limitations: High CAPEX and degradation under variable loads (<5% penalty with advanced controls). Cost driver: Electricity (~$3–5.5/kg H₂ in 2025). Advances include non-precious catalysts and AEM hybrids for PEM-like performance at lower cost.
Biomass Gasification:
Partial oxidation of biomass (e.g., wood residues) at 800–1000°C produces syngas (H₂ + CO), followed by water-gas shift and purification. Yield: ~100 kg H₂/tonne dry biomass; efficiency: 35–55% LHV (feedstock-dependent). Emissions: Near-zero net CO₂ if sustainable; challenges include NOx/tar (mitigated via CCS, TRL 3–5 integrated). TRL: 6–8 (pilots at 5–6 standalone; commercial for syngas, H₂ scaling by 2030). Cost: $2–4/kg H₂; driver: Feedstock logistics. Steam gasification yields highest H₂ (40–50% in syngas).
C. Emerging and Novel Routes
These hold long-term potential but require R&D for viability.
Thermochemical Water Splitting:
High-temperature (>700°C) redox cycles (e.g., sulfur-iodine, Cu-Cl) driven by solar/nuclear heat split water in multi-steps. Theoretical efficiency: >50% solar-to-H₂; demonstrated: 28–45%. TRL: 3–5 (lab/pilot; ETH Zurich demo operational but intermittent). Emissions: Zero direct. Cost driver: High-temperature reactors. Advances: Integration with CSP for 50% efficiency by 2030.
Biological and Photocatalytic Routes:
- Biological (e.g., dark/photo-fermentation, microbial electrolysis):
Bacteria/enzymes convert biomass/water to H₂ at ambient conditions; efficiency: 1–25% (dark: 10–25%, photo: <10%). TRL: 1–4 (lab/early pilot; yields ~0.01–0.1 for photo). Emissions: Zero; low yield limits scale.
- Photocatalytic:
Semiconductor catalysts (e.g., TiO₂) split water via sunlight; efficiency: 1–20%. TRL: 1–3 (research stage). Cost driver: Low productivity; genetic engineering boosts yields 2–5x by 2030. Hybrid bio-thermochemical integration targets 40–70% efficiency.
Figure 2.
Classification of hydrogen production pathways by primary energy source, color code (grey/blue/green), and TRL (2025 status; data from IEA and recent reviews). Source: Author's elaboration based on IEA (2025), IRENA (2024), and Bloomberg NEF (2025).
Figure 2.
Classification of hydrogen production pathways by primary energy source, color code (grey/blue/green), and TRL (2025 status; data from IEA and recent reviews). Source: Author's elaboration based on IEA (2025), IRENA (2024), and Bloomberg NEF (2025).
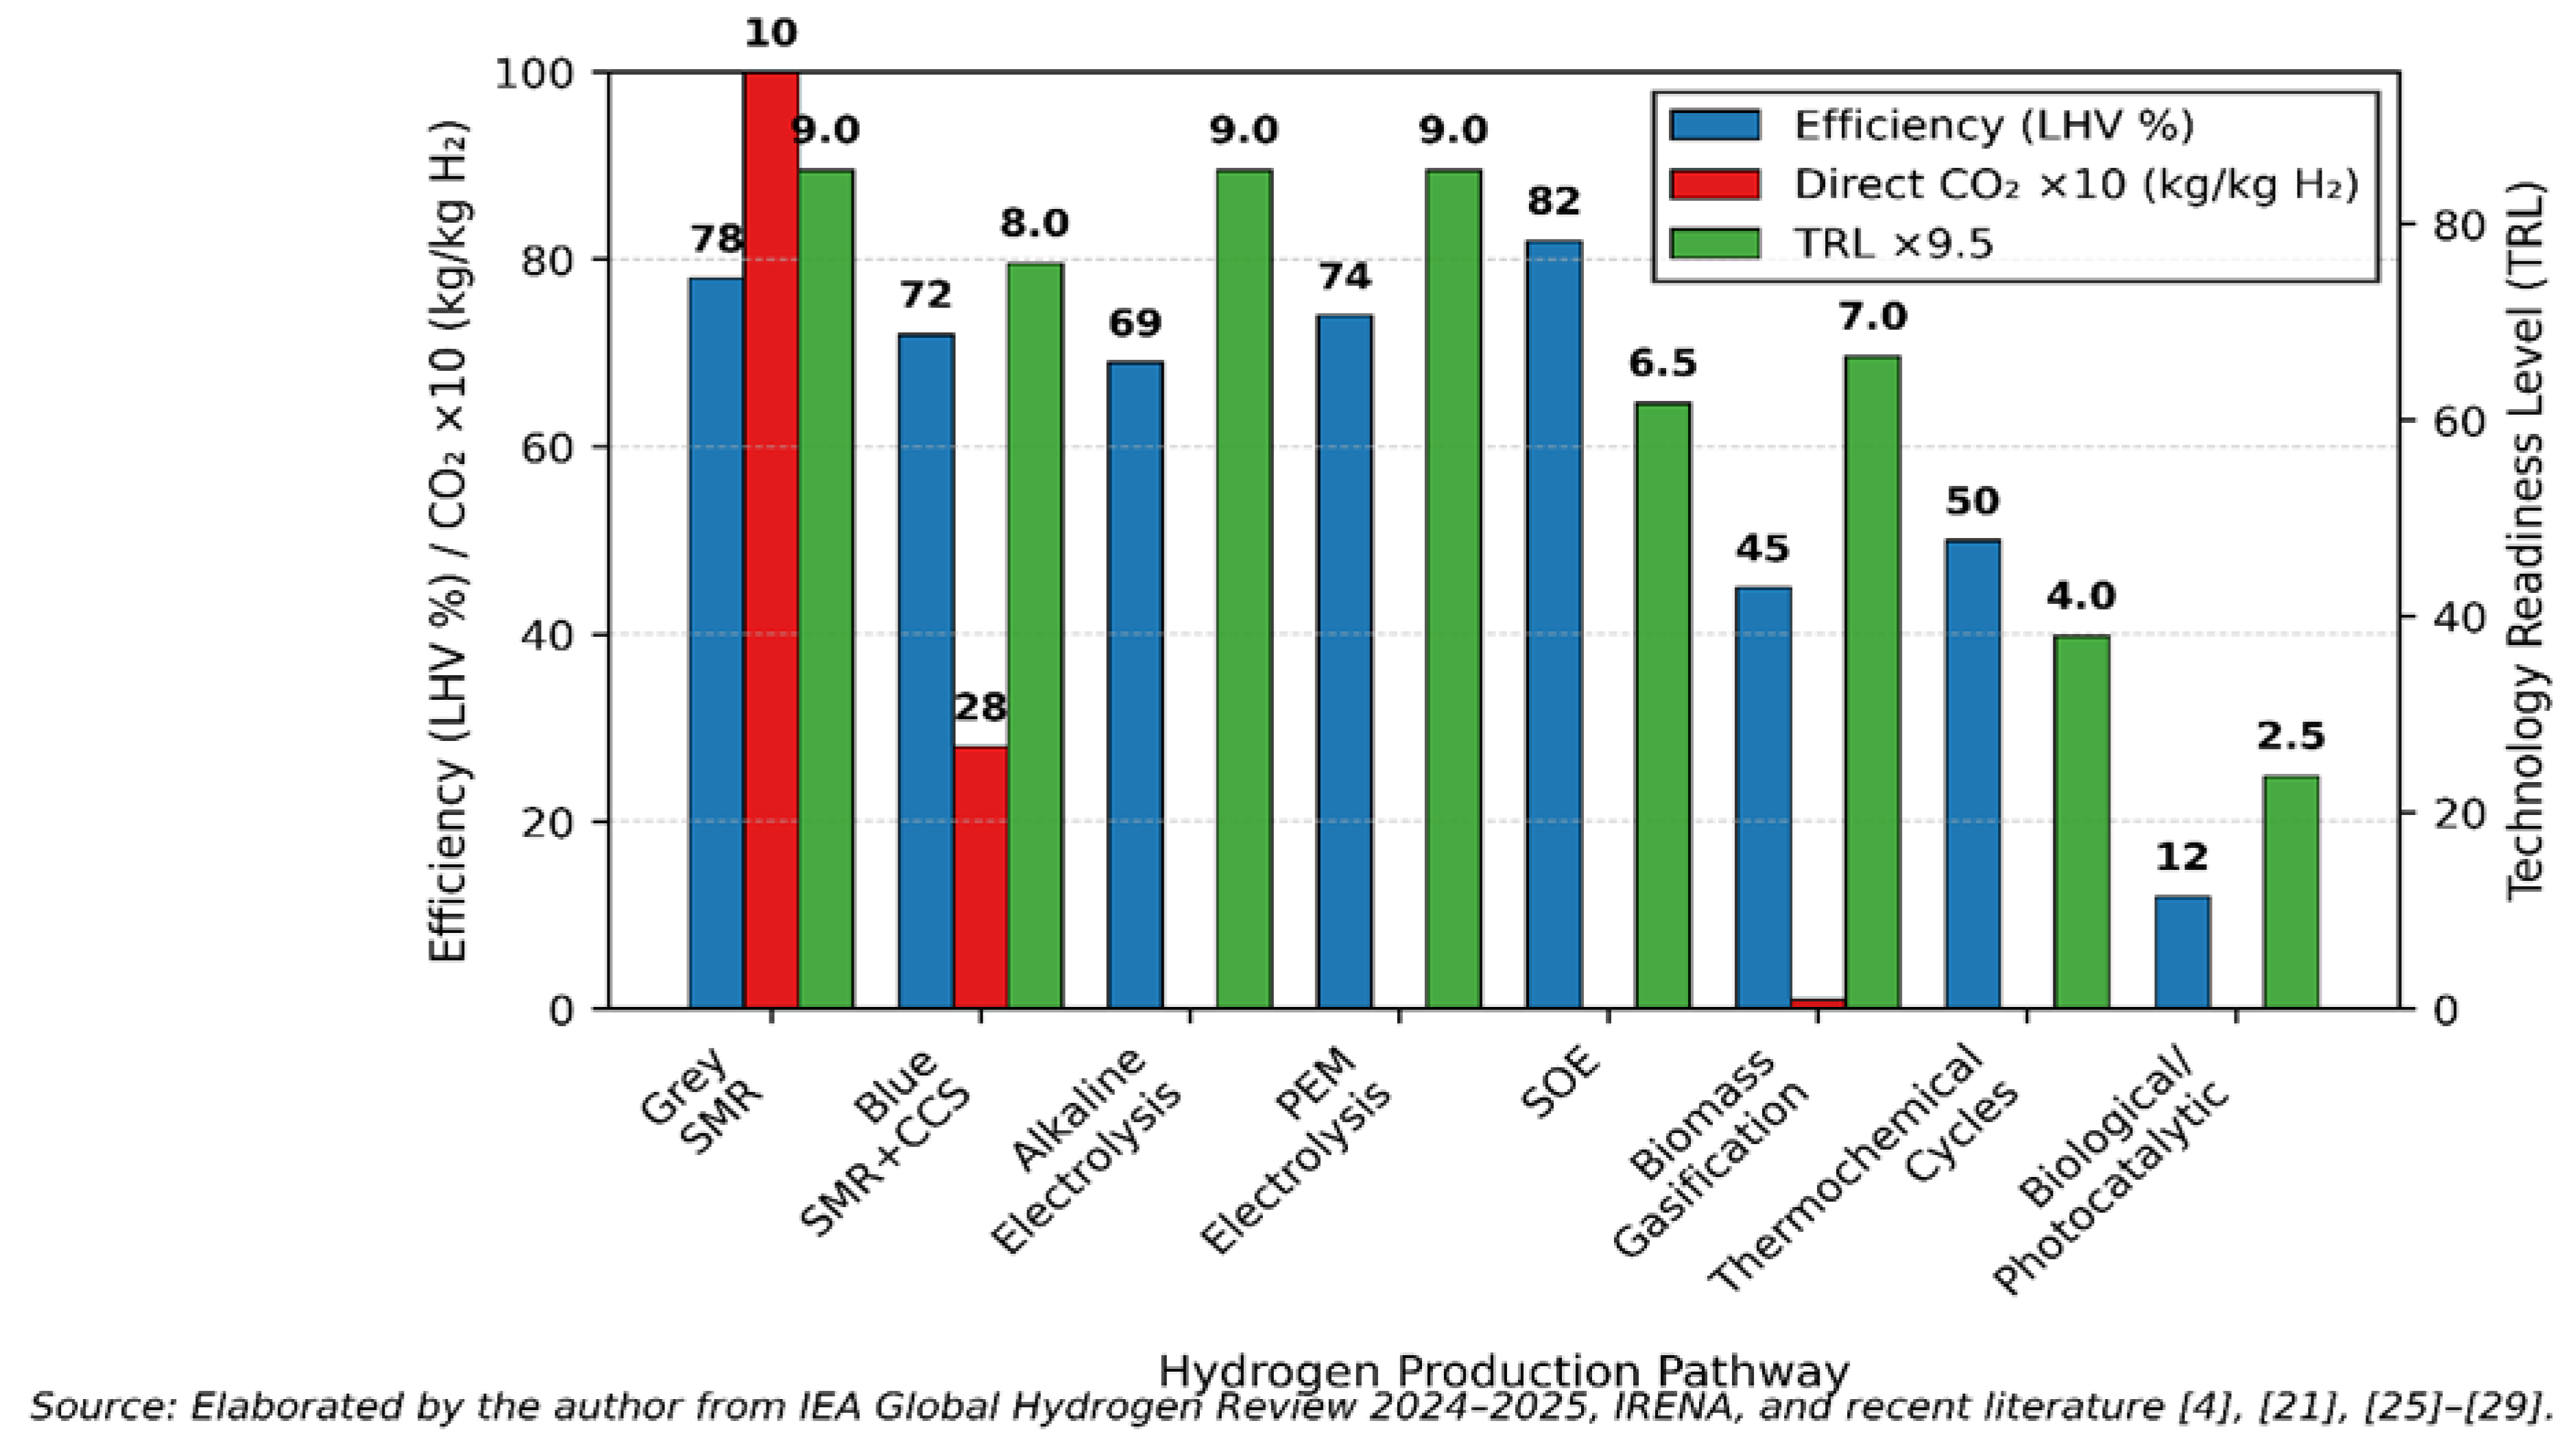
Table II.
Technical comparison of hydrogen production pathways (2025 status).
| Main Cost Driver |
TRL
(2025) |
Direct CO₂
(kg/kg H₂) |
Efficiency (LHV, %) |
Pathway |
|---|---|---|---|---|
| Natural gas | 9 | 8–12 | 70–85 | Grey SMR |
| CCS + gas | 8 | 0.5–4.5 | 65–80 |
BlueSMR + CCS |
| Electricity | 9 | 0 | 62–75 | Alkaline Electrolysis (AEC) |
| PEM Electrolysis | 65–82 | 0 | 9 | Electrolyzer CAPEX |
| Solid Oxide Electrolysis (SOE) | 75–90* | 0 | 6–7 | High-temperature materials |
| Biomass Gasification | 35–55 | ≈0† | 6–8 | Feedstock logistics |
| Thermochemical Cycles (solar/nuclear) | 45–55 | 0 | 3–5 | High-temperature reactors |
| Biological / Photocatalytic | 1–25 | 0 | 1–4 | Very low productivity |
*
With high-temperature heat integration;† Sustainable biomass; CCS integration can yield negative emissions; Source: Author elaboration – IEA 2024–2025, IRENA, BloombergNEF 2025.
III. System Modeling and Performance Evaluation
This section presents a detailed quantitative assessment of solar-powered water electrolysis performance, focusing on a 100 kWₚ off-grid photovoltaic (PV)-electrolyzer system. The model incorporates realistic 2025 benchmarks for component efficiencies and costs, validated against recent IEA and IRENA data [4,21,30]. Comparisons with other hydrogen production pathways are provided to contextualize the results. All assumptions are transparent and sourced from authoritative references, with sensitivity to regional factors like Iran's high solar irradiance.
Figure 3.
Block diagram of the 100 kW off-grid solar-powered hydrogen production system, illustrating key components, system-level efficiencies (MPPT/DC-DC: 95%; electrolyzer: 70% LHV), water purification input, and oxygen by-product. Source: Author's elaboration based on IRENA (2025) and commercial PEM/alkaline electrolyzer layouts [21,30].
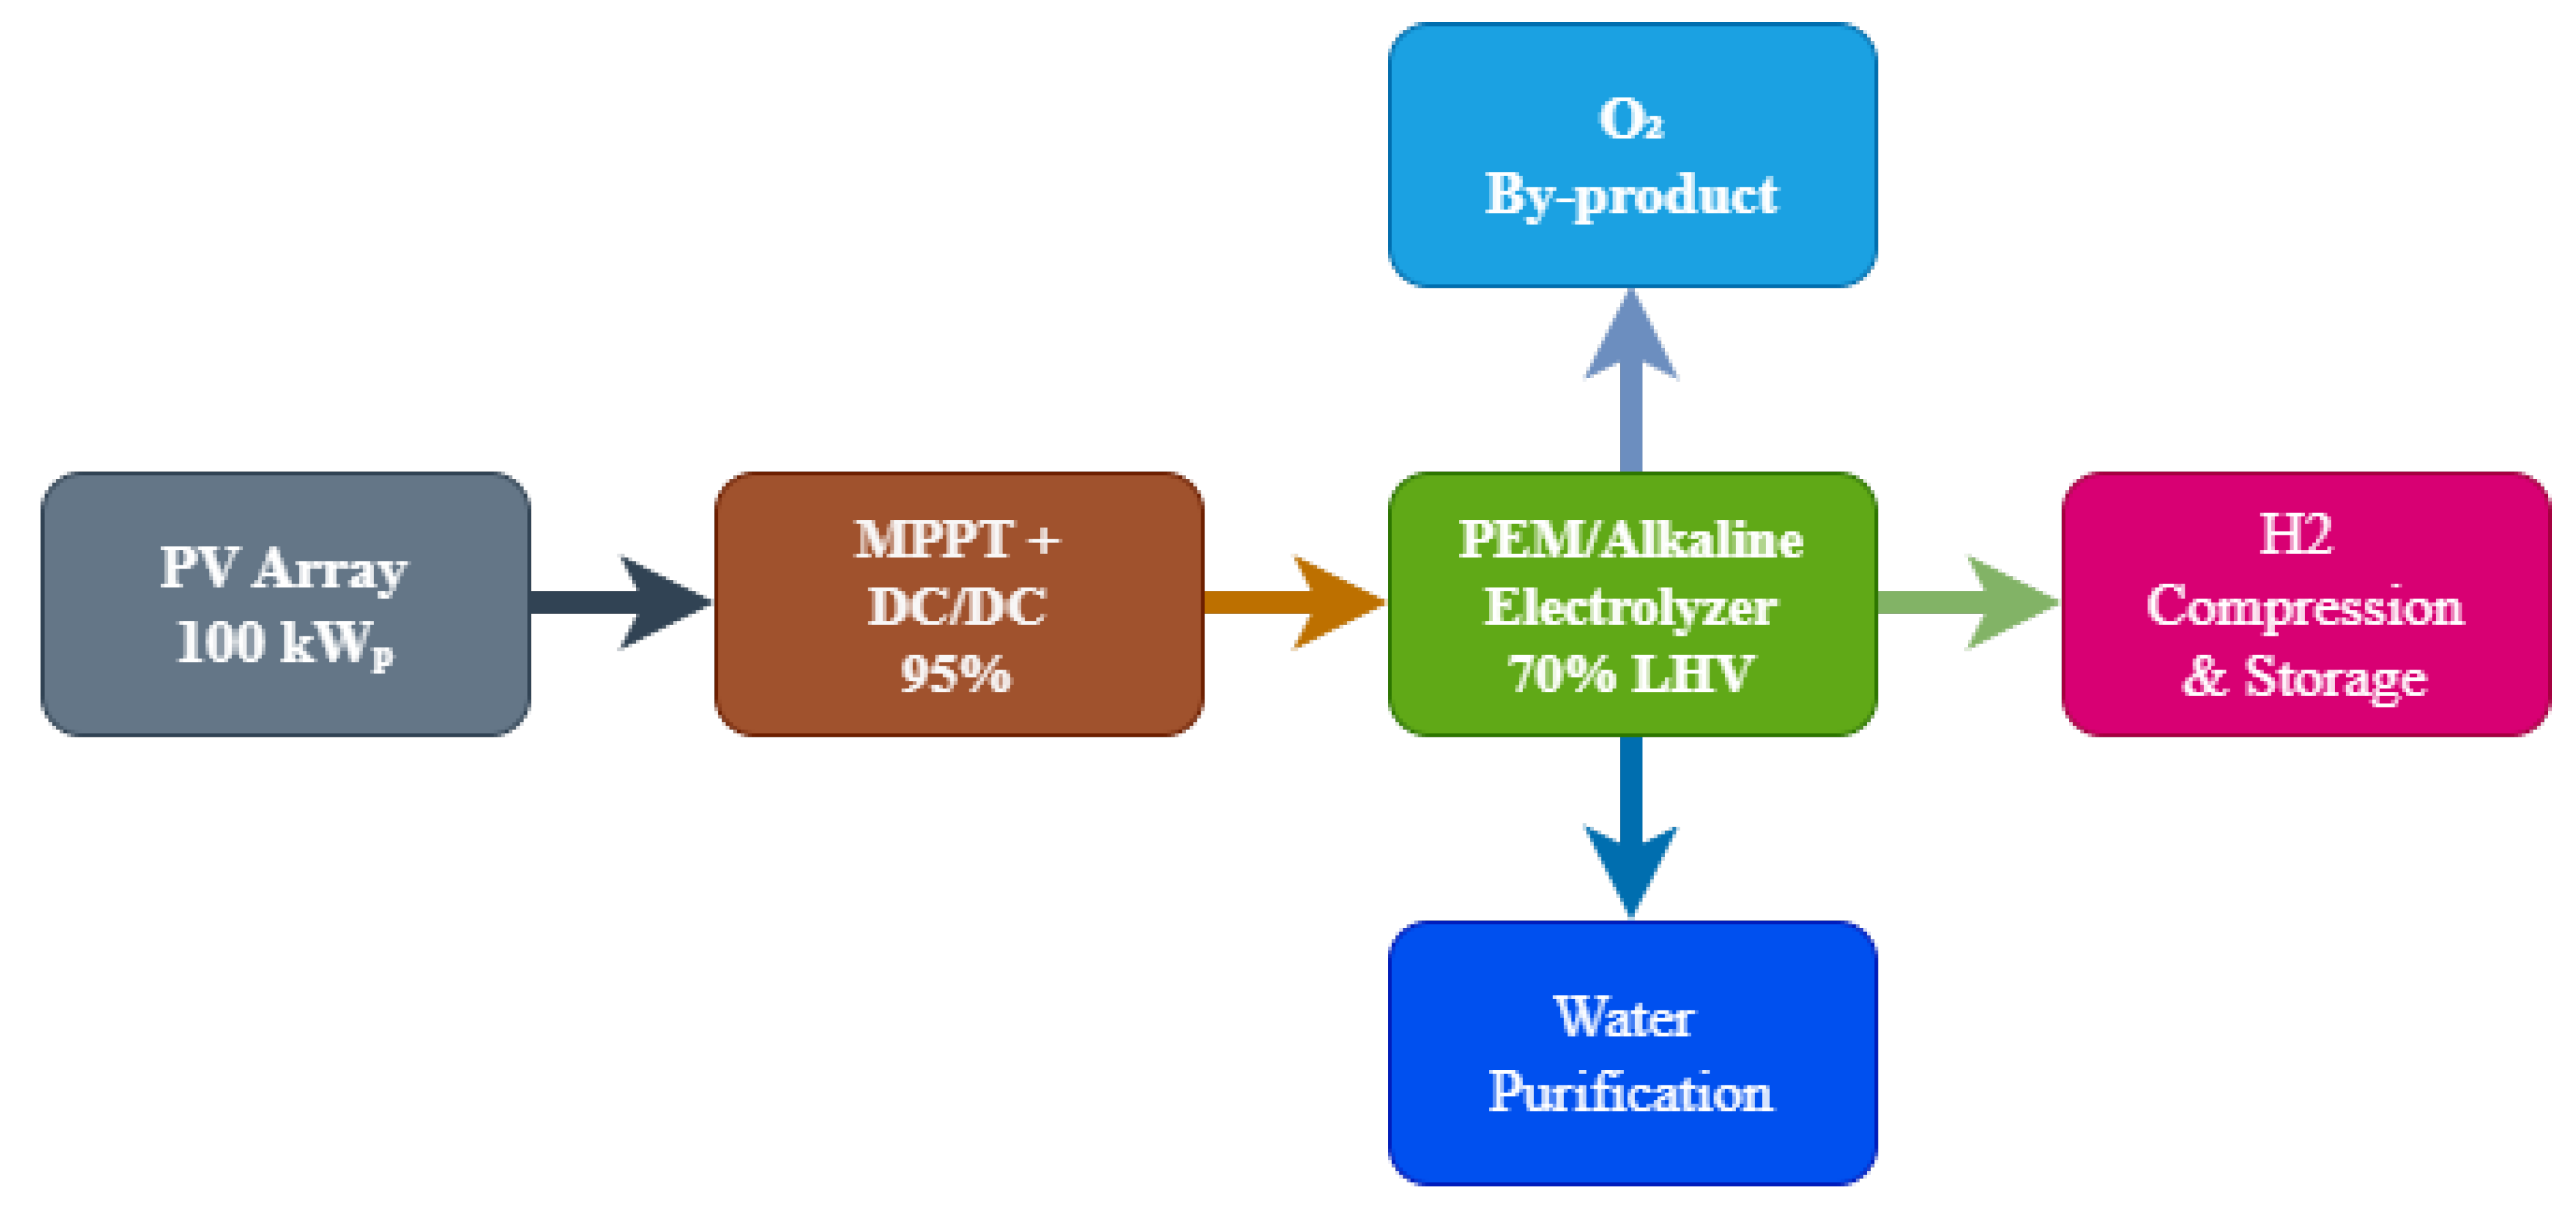
Table III.
Base Assumptions for 100 kWₚ PV–Electrolyzer System Model (2025 Benchmarks).
| Parameter | Value | Justification / Source |
|---|---|---|
| PV system capacity | 100 kWₚ | Nominal DC rating for small-scale off-grid demonstration [21] |
| Performance ratio (PR) | 0.85 | Typical fixed-tilt in sunny climates (dust-adjusted for Iran) [4,30] |
| Electrolyzer system efficiency (η_elz, LHV) | 70 % (47 kWh/kg H₂) | Mid-range commercial PEM/AEC 2025; realistic range 65–80 % [25,27,29] |
| Hydrogen LHV | 33.3 kWh/kg (120 MJ/kg) | Standard thermodynamic value [21] |
| Fuel cell system efficiency (η_FC, H₂ → AC) | 40 % | System-level incl. compression & BOP (Toyota Mirai Gen2 ≈ 40 %, Ballard 38–42 %) [20,23] |
| Peak sun hours (PSH) range | 3.5 – 5.5 kWh/kW/day | Europe (low) to Iran (high, DNI 5.2–5.4 kWh/m²/day) [13,14] |
| Electrolyzer CAPEX (2025) | 600 – 800 USD/kW | Down from >1000 USD/kW in 2023; IRENA/Bloomberg NEF projection [15,19] |
| Annual degradation (average) | 1.5 %/year | PV 0.5 %/yr + electrolyzer stack 1 %/yr [30] |
| System availability | 95 % | Typical for well-maintained systems |
A. Photovoltaic System Modeling the PV array is modeled with a fixed-tilt configuration and a performance ratio of 0.85, accounting for temperature, soiling, and wiring losses typical of sunny and dusty regions such as Iran [4,30].
B. Electrolyzer Efficiency and Operating Characteristics A commercial PEM or alkaline electrolyzer with system-level LHV efficiency of 70 % (47 kWh/kg H₂) is assumed, representing the mid-range of 2025 technology (realistic range 65–80 %) [25,27,29].
C. Balance-of-Plant and Auxiliary Losses Auxiliaries include DC-DC conversion (95 %), water purification and deionization (≈5 % energy penalty), gas drying/separation, and compression to 30 bar (≈10 % penalty), resulting in total BOP losses of 10–15 %.
D. Round-Trip Efficiency Assessment Round-trip efficiency is defined as the fraction of initial solar electricity that is recovered as AC electricity after hydrogen production and subsequent reconversion in a fuel cell. Using system-level efficiencies of PR = 0.85, η_elz = 70 %, and η_FC = 40 % (including compression, inversion, and balance-of-plant losses), the round-trip efficiency is calculated as:
η_RT = 0.85 × 0.70 × 0.40 = 0.238
This value remains constant across the entire PSH range.
E. Detailed Calculation Methodology
Daily energy and hydrogen yields are calculated as:
E_PV = 100 × PSH × 0.85 (kWh/day)
m_H₂ = (E_PV × 0.70) / 33.3 ≈ 1.79 × PSH (kg/day)
Annual production = m_H₂ × 365 × 0.95 / 1000 (tones/year)
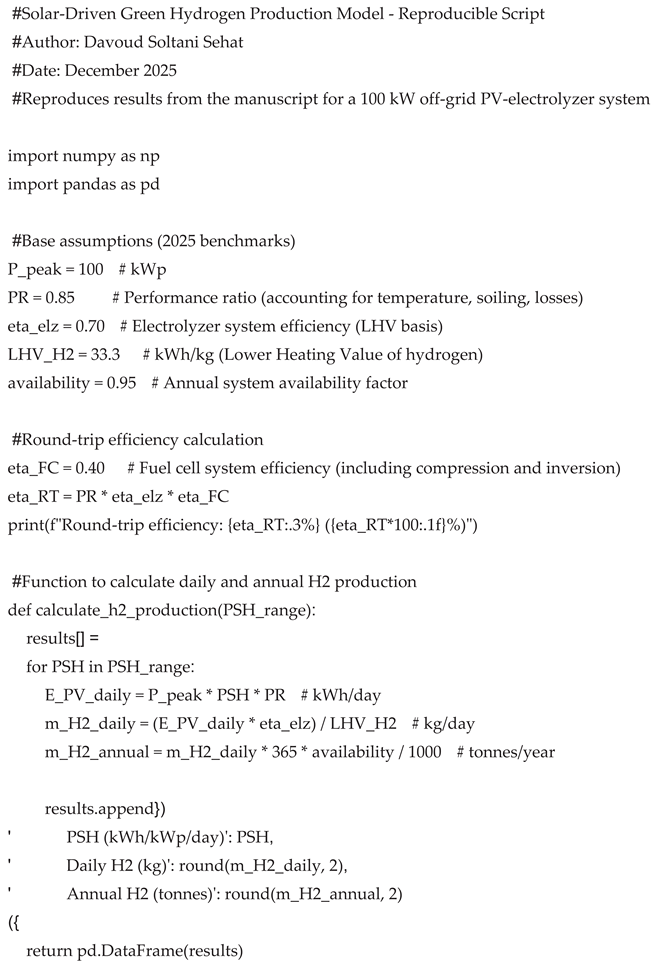
All equations were implemented and validated in Python 3.11 (source code and full numerical output provided in Supplementary Material S1).
When the produced hydrogen is reconverted to electricity using a state-of-the-art PEM fuel cell system (η_FC = 40 % including compression and inversion losses), only 23.8 % of the original solar-derived electricity is recovered (η_RT = 23.8 %). This relatively low round-trip efficiency confirms that hydrogen is not suitable for short-term or daily electricity cycling in off-grid applications. Instead, its primary value lies in seasonal energy storage, industrial decarbonization, and export as green ammonia or liquid organic hydrogen carriers (LOHC).
Detailed calculation scripts (implemented in Python 3.11) that exactly reproduce all hydrogen production and recovered electricity values are provided as Supplementary Material S1 to ensure full reproducibility of the results.
Table IV.
Calculated hydrogen production and recovered electricity for different solar resource levels (100 kWp
off-grid system, 2025 benchmarks).
Table IV.
Calculated hydrogen production and recovered electricity for different solar resource levels (100 kWp
off-grid system, 2025 benchmarks).
| Parameter | Value | Justification / Source |
|---|---|---|
| PV system capacity | 100 kWₚₚ | Nominal DC rating |
| Performance ratio (PR) | 0.85 | Typical for fixed-tilt systems in sunny climates (IRENA 2024, NREL 2024) |
| Electrolyzer system efficiency | 70 % (LHV) | Mid-range commercial PEM/AEC 2024–2025 (49–52 kWh/kg H₂ → 70 % at 33.3 kWh/kg LHV) |
| Performance ratio (PR) | 0.85 | Typical for fixed-tilt systems in sunny climates (IRENA 2024, NREL 2024) |
| Electrolyzer system efficiency | 70 % (LHV) | Mid-range commercial PEM/AEC 2024–2025 (49–52 kWh/kg H₂ → 70 % at 33.3 kWh/kg LHV) |
| Hydrogen LHV | 33.3 kWh/kg (120 MJ/kg) | Standard value |
| Fuel cell system efficiency (H₂ → AC electricity) | 40 % | Realistic system-level (including compression, inversion, BOP); PEMFC commercial 2025 (Toyota Mirai Gen2 ~40 %, Ballard/Plug Power stationary 38–42 %) |
| Peak Sun Hours (PSH) range | 3.5 – 5.5 kWh/kW/day | Covers moderate to excellent locations (e.g., Central Europe → Central/Southern Iran) |
Source:
This study (calculations reproducible via Python script in Supplementary Material S1).
F Levelized Cost of Hydrogen (LCOH) Methodology
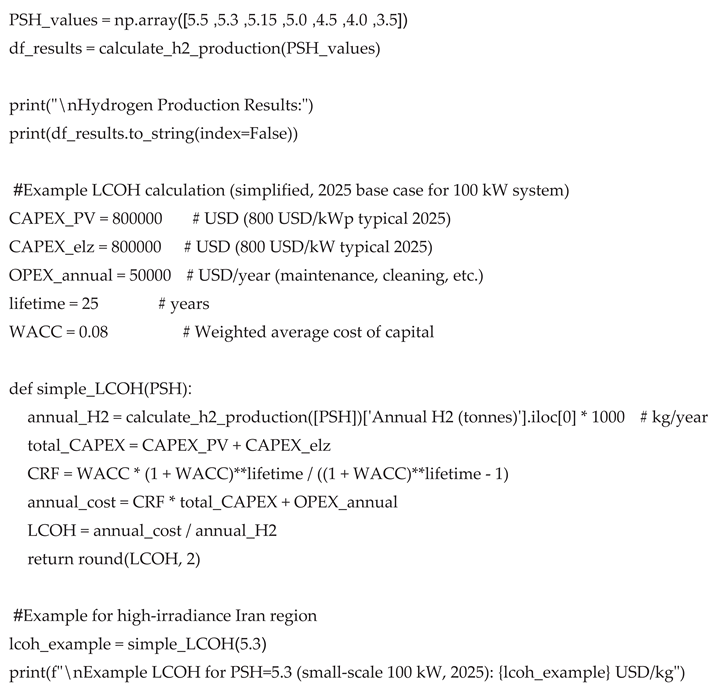
The levelized cost of hydrogen (LCOH) is calculated as the net present value of the total lifetime costs divided by the total hydrogen produced over the project lifetime (25 years), expressed in 2025 USD per kilogram of H₂. The key economic assumptions are summarized in Table V.
The performance ratio of 0.85 represents an optimistic yet achievable scenario with regular cleaning and advanced controls; sensitivity to soiling losses (15–25%) is discussed in Section 5.4.
Table V.
Economic Assumptions for LCOH Calculation (2025 Base Year, Iran Context).
| Parameter | Value (2025) | Projection 2030 | Source / Justification |
|---|---|---|---|
| PV system cost | 650 USD/kWₚ | 400 USD/kWₚ | BloombergNEF 2025, IRENA 2025 |
| Electrolyzer CAPEX (PEM/AEC average) | 700 USD/kW | 450 USD/kW | IRENA 2025 high-case, BNEF Q4 2025 |
| Desalination + water transport | 0.7–1.1 USD/m³ | 0.5–0.8 USD/m³ | Saudi NEOM & UAE projects scaling |
| O&M (PV + electrolyzer + desalination) | 1.8 % of CAPEX/yr | 1.5 % of CAPEX/yr | IEA 2025, IRENA |
| Weighted average cost of capital (WACC) | 7 % (real) | 6.5 % | Typical for renewable projects in Middle East 2025 |
| System lifetime | 25 years | – | Standard for LCOH studies |
| Replacement of electrolyzer stack | Every 10 years (80 000 h) | – | Manufacturer data 2025 |
Source:
Author's elaboration based on BloombergNEF (2025), IRENA (2025), IEA (2025), and manufacturer data for electrolyzer stack replacement.
IV. Challenges, System Integration, and Deployment Prospects for Solar-Driven Green Hydrogen in Iran
Although solar-powered electrolysis is technically mature at the 100 kWₚ–MW scale, several barriers still hinder cost-competitive deployment. This section examines the key technical, economic, water-related, and regulatory challenges, with particular focus on the Iranian context.
4.1. Technical and Integration Challenges
- Electrolyzer durability and dynamic operation: Commercial PEM and alkaline stacks in 2025 typically achieve 65–80 % LHV efficiency, but frequent start–stop cycles and partial-load operation under direct PV coupling accelerate catalyst and membrane degradation. High ambient temperatures in Iran (>45 °C in summer) further increase cooling demand and can shorten stack lifetime if active thermal management is not implemented.
- Balance-of-plant losses: Water deionization, gas drying, and compression to 30–200 bar consume 8–12 % of input electricity, often underestimated in early studies.
4.2. Water Availability – The Critical Constraint in Arid Regions
Iran’s highest solar resources (DNI 5.2–5.8 kWh/m²/day in Yazd, Kerman, and Sistan-Baluchestan) coincide with severe water stress. Producing 1 kg of H₂ requires ≈ 10–12 L of pure water plus 30–50 L of raw water when reverse-osmosis desalination is included. For a 100 MWₚ plant operating at PSH = 5.3 kWh/kW/day, annual water demand reaches 180 000–250 000 m³ — comparable to the consumption of a small town. Integrated solar-driven desalination (PV-RO + electrolysis) is technically feasible but increases LCOH by 0.4–0.8 USD/kg in water-scarce regions [33].
Given Iran’s extensive southern coastline along the Persian Gulf and Gulf of Oman (>5800 km), seawater desalination powered by renewable energy offers a viable and increasingly attractive solution for supplying both electrolysis-grade water and co-producing fresh water for local use. A 100 MWₚ solar-powered electrolyzer plant in southern provinces (e.g., Hormozgan, Bushehr, or Sistan-Baluchestan) would require approximately 180 000–250 000 m³ of desalinated water annually. Integrating photovoltaic- or wind-driven reverse osmosis (RO) units can meet this demand while simultaneously generating surplus fresh water for agriculture, industry, or municipal supply [34,35]. Recent techno-economic studies indicate that solar/wind-powered desalination in southern Iran can reduce the water-related component of LCOH by 0.4–0.8 USD/kg compared to trucking or long-distance pipeline transport of fresh water [33,36].
Furthermore, hydrogen combustion or fuel-cell operation produces ultra-pure water as a by-product (≈ 9 kg H₂O per kg H₂). Although round-trip energy losses render large-scale water recovery from hydrogen combustion inefficient, localized recovery in integrated desalination–electrolysis hubs can marginally improve the overall water balance and enhance system sustainability in water-stressed coastal regions [37].
Thus, co-locating large-scale green hydrogen projects with renewable-powered desalination along Iran’s southern coast not only resolves the water constraint but also creates significant co-benefits through fresh-water co-production and reduced environmental impact of brine discharge when properly managed.
4.3. Economic and Policy Barriers in Iran
- Absence of carbon pricing and subsidies on natural gas keep grey hydrogen (SMR) below 1.5 USD/kg, while current green H₂ LCOH in Iran remains 4.5–6.5 USD/kg.
- Limited long-term power purchase agreements (PPAs) and currency risk deter international financing.
- Electrolyzer and high-purity component imports face sanctions-related delays and 30–50 % cost premiums.
4.4. Future Prospects and Recommended Pathways for Iran
- Hybrid solar–wind configurations in coastal (wind) + desert (solar) corridors) to raise electrolyzer capacity factor from ~25 % (solar-only) to >45 %.
- Co-location with existing industrial clusters (Bandar Abbas, Assaluyeh, and Isfahan refineries) to utilize waste heat, cooling water, and pipeline infrastructure.
- Ammonia as export carrier: Iran already possesses large ammonia/urea plants; green ammonia synthesis from solar H₂ can leverage existing port and shipping infrastructure.
-
Policy recommendations
- ○
- Introduce feed-in tariffs or Contracts-for-Difference (CfD) for green hydrogen/ammonia.
- ○
- Establish national low-carbon hydrogen certification and guarantees of origin.
- ○
- Create “Green Hydrogen Valleys” in high-resource, water-constrained provinces with mandatory solar desalination integration.
4.5. Rationale for the Two-Phase Green Hydrogen Valley Deployment Strategy in Southern Iran
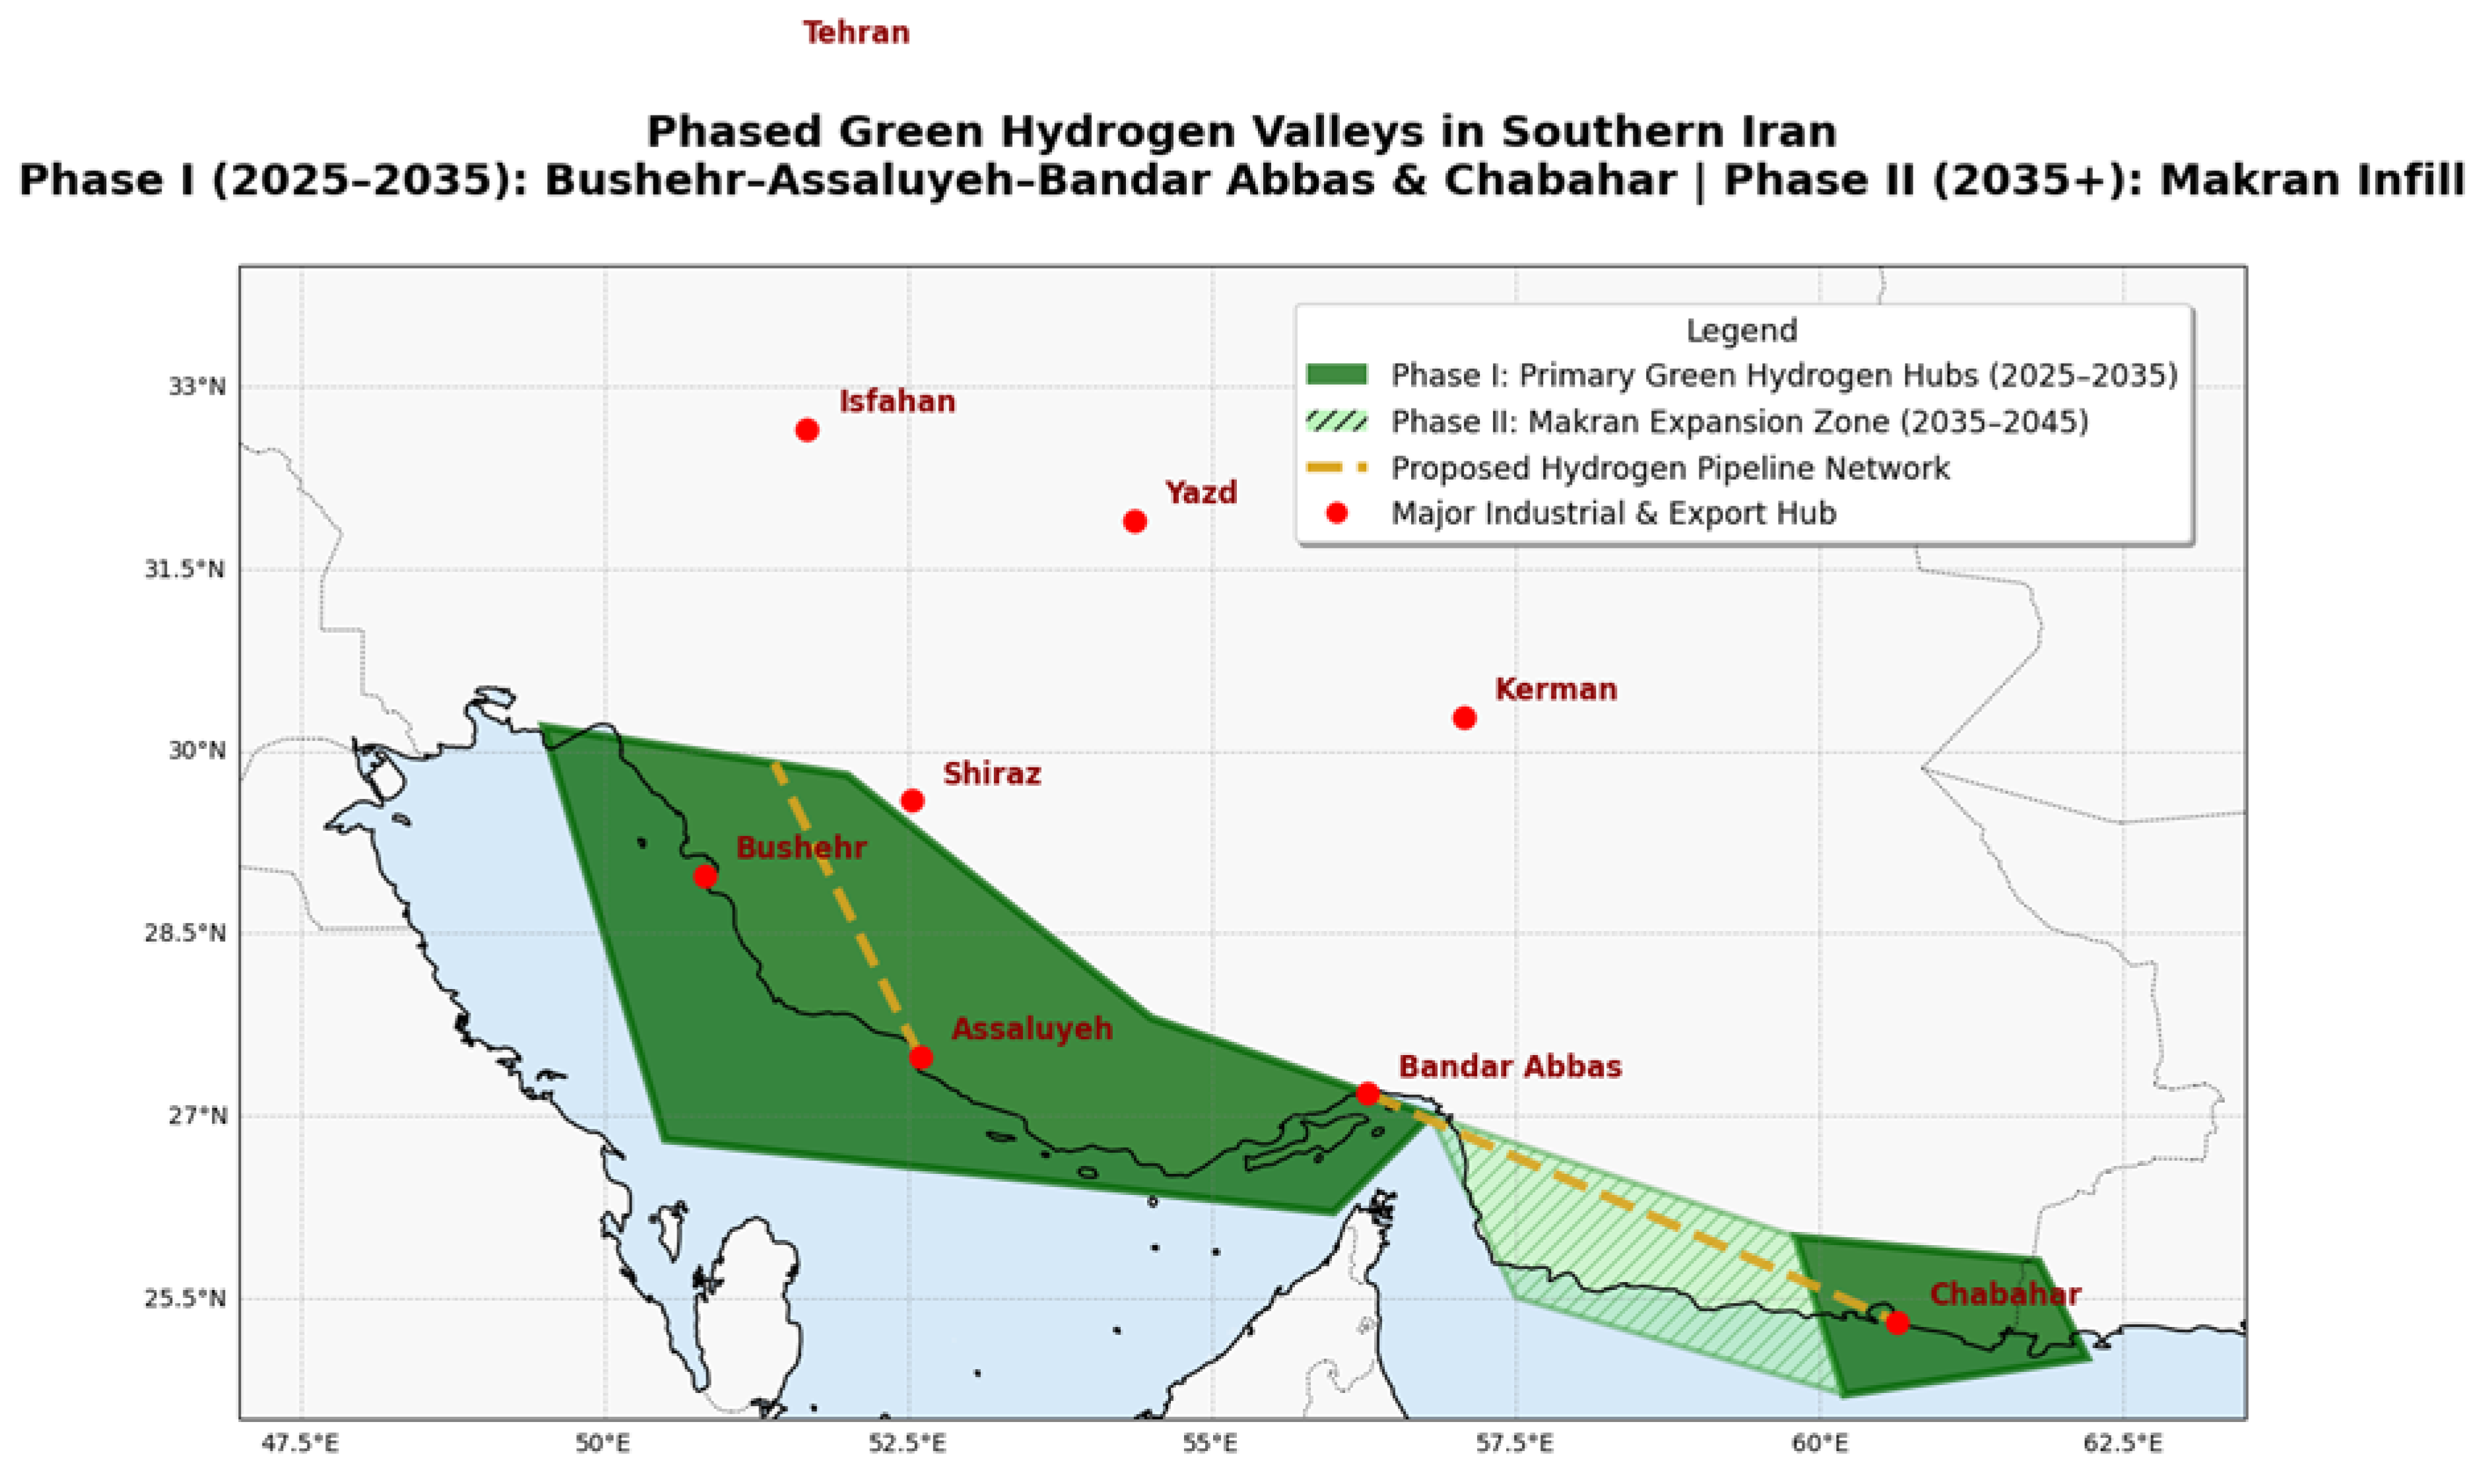
The proposed Green Hydrogen Valleys are deliberately concentrated in two primary hubs (Persian Gulf Corridor and Chabahar) rather than a continuous coastal strip. This strategic choice is driven by four evidence-based technical, economic, and infrastructural considerations (Figure 7):
- Solar–Wind Hybrid Resource Complementarity
While solar irradiance remains uniformly high across the entire Makran coast (5.2–5.5 peak sun hours/day), onshore wind speeds in the intermediate Makran region (between Bandar Abbas and Chabahar) are significantly lower, typically below 6.5 m/s at 100 m hub height, resulting in solar-only dominated hybrid capacity factors (<30 %) [51,52]. In contrast, the Persian Gulf corridor and Chabahar benefit from stronger and more consistent coastal wind regimes, enabling capacity factors exceeding 45 % in hybrid configurations.
- 2.
- Proximity to Existing Industrial and Export Infrastructure
The Bushehr–Assaluyeh–Bandar Abbas cluster already hosts the world’s largest gas processing facilities, multiple ammonia/urea plants, and deep-water export terminals, allowing rapid integration of green hydrogen into existing value chains. Chabahar, as Iran’s only oceanic port, offers direct access to high-growth Asian markets. Intermediate Makran sites currently lack comparable industrial clusters and port infrastructure [38,50].
- 3.
- Water and Hydrogen Transport Economics
Although seawater is universally available, transporting either desalinated water or compressed/liquefied hydrogen over distances exceeding 400 km from intermediate sites to the nearest consumption or export hub would add 0.6–1.2 USD/kg to the levelized cost — rendering such locations economically unattractive in the 2025–2035 timeframe [33,45].
- 4.
- Risk-Managed, Phased Scaling Strategy
Focusing initial gigawatt-scale investments on two proven locations minimizes technology, financing, and offtake risks while generating early revenue streams. This hub-and-spoke approach mirrors successful precedents in Saudi Arabia (NEOM → progressive coastal expansion) and Australia (Pilbara core → gradual regional infill), ensuring LCOH below 3 USD/kg by 2030 before nationwide Makran infill post-2035 [5,16].
Thus, the deliberate gap between Bandar Abbas and Chabahar reflects a deliberate, economically optimal sequencing rather than a resource limitation, transforming apparent geographic constraints into a competitive first-mover advantage.
To translate the identified potential into a realistic national deployment strategy, Figure 7 presents a two-phase roadmap for Green Hydrogen Valleys in southern Iran. Phase I prioritizes two high-impact hubs with existing industrial clusters and superior wind–solar complementarity, while Phase II targets progressive development of the Makran coast once supporting infrastructure matures (Section 4.5).
Figure 7.
Proposed phased deployment of Green Hydrogen Valleys along Iran’s southern coastline. Phase I (2025–2035, dark green) focuses on two strategic hubs: (i) the Persian Gulf Energy Corridor (Bushehr–Assaluyeh–Bandar Abbas), leveraging existing gas infrastructure, strong coastal wind resources, and ammonia export terminals; and (ii) Chabahar, Iran’s only oceanic port for direct access to Asian markets. Phase II (2035–2045, light green with hatching) envisages gradual infill of the intermediate Makran coast as long-distance hydrogen pipelines, HVDC transmission, and large-scale offshore desalination become economically viable. This staged approach minimizes initial capital risk while establishing Iran as one of the world’s lowest-cost exporters of green hydrogen and ammonia by 2035–2040. Source: Author's elaboration.
4.6. Conclusion on Iranian Context
Iran combines world-class solar resources (average PSH 4.8–5.5 across 70 % of territory) with acute water scarcity of freshwater and continued heavy subsidization of fossil fuels. Under these unique conditions, solar-driven hydrogen can become competitive only when (i) water supply is secured through renewable desalination or wastewater reuse, (ii) electrolyzers are sized for hybrid renewable input, and (iii) strong policy instruments close the cost gap with grey hydrogen. If these three conditions are met, Iran has the potential to evolve from a fossil hydrogen producer into one of the lowest-cost green/ammonia exporters by 2035–2040.
V. Results and Discussion
5.1. Hydrogen Production Performance of the 100 kW Solar-Powered System
Daily and annual hydrogen production rates for the 100 kWₚ off-grid PV-electrolyzer system were calculated across a wide range of peak sun hours (PSH: 3.5–5.5 kWh/kWp/day), covering conditions from moderate European locations to Iran's high-irradiance regions (detailed numerical results are fully reproducible using the Python script provided in Supplementary Material S1).
In locations representative of central Iran (PSH ≈ 5.0–5.15 kWh/kWp/day), the system produces 8.94–9.22 kg of hydrogen per day, equivalent to 3.10–3.20 tonnes annually at 95% availability. In the sunniest provinces of southern Iran (Yazd, Kerman, Fars, and Sistan-Baluchestan), where average PSH exceeds 5.3 kWh/kWp/day, daily production reaches approximately 9.8 kg H₂ and annual output approaches 3.4 tonnes. These yields are 55–60% higher than identical systems in northern/central Europe (PSH ≈ 3.5 kWh/kWp/day), clearly highlighting the substantial advantage of Iran’s superior solar resource.
5.2. Round-Trip Efficiency and Implications for Energy Storage
A consistent round-trip efficiency of 23.8% is obtained across all studied solar resource levels. This value highlights the substantial energy losses inherent in hydrogen-based electricity storage and is consistent with current commercial system-level performance. It underscores that hydrogen is best suited for long-duration and seasonal storage rather than short-term or daily cycling in off-grid applications.
Figure 4 presents a unified comparison of specific energy consumption and CO₂ emissions for the major hydrogen production pathways discussed in Section II, using 2025 benchmarks. Solar-powered electrolysis in high-irradiance Iranian conditions requires approximately 51–55 kWh of solar electricity per kg of H₂ (including balance-of-plant and 15% average soiling/temperature losses). This is competitive with the best European projects (55–60 kWh/kg) and significantly better than wind-powered electrolysis in low-capacity-factor offshore sites (>65 kWh/kg).
Figure 4.
Unified comparison of specific energy consumption (kWh/kg H₂) and direct CO₂ emissions (kg CO₂-eq/kg H₂) for major hydrogen production pathways (2025 benchmarks). Solar-powered electrolysis in high-irradiance Iranian conditions is highlighted. Source: Author's elaboration based on IEA Global Hydrogen Review 2025 and IRENA (2025).
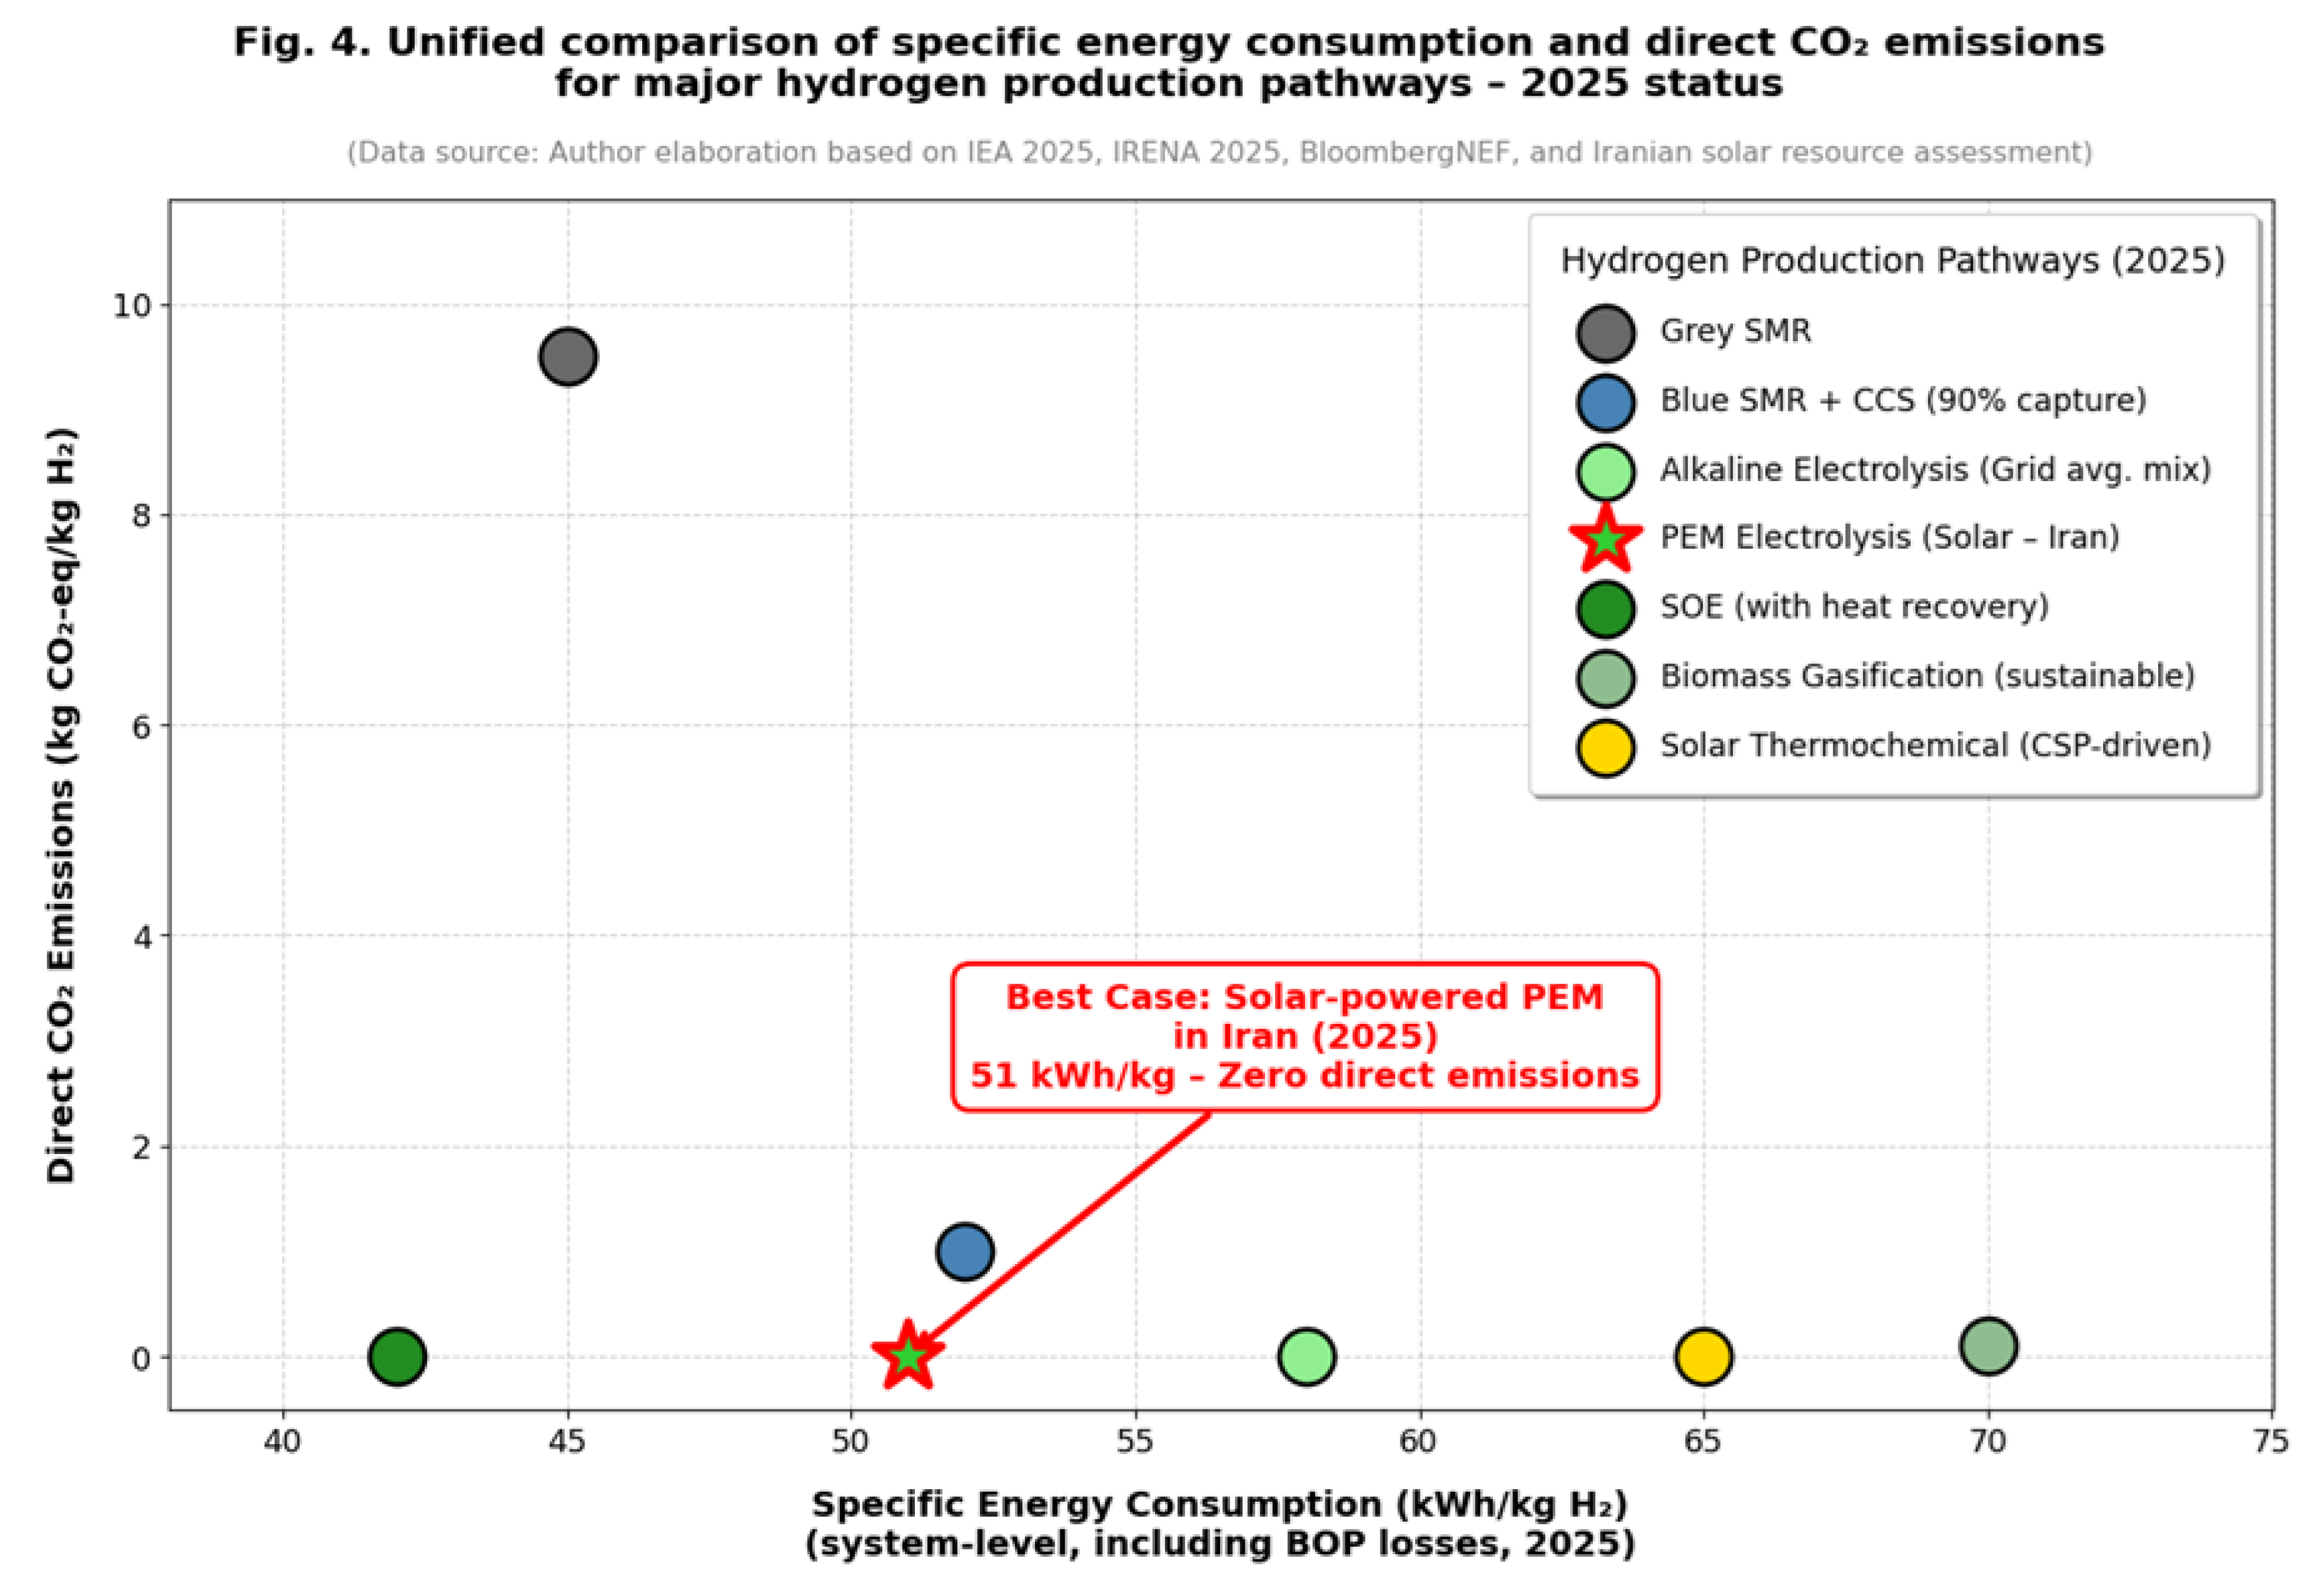
Despite higher primary energy consumption per kg of H₂ compared with grey SMR (≈ 40–45 kWh natural gas equivalent), solar electrolysis achieves zero direct emissions and near-zero lifecycle emissions when PV manufacturing impacts are amortized over 30 years.
5.3. Comparative Performance Against Other Pathways
Figure 4 illustrates that while grey and blue SMR pathways currently exhibit the lowest specific energy consumption (≈40–45 kWh natural gas equivalent per kg H₂), they carry significant direct CO₂ emissions. In contrast, renewable-based routes like biomass gasification offer near-zero net emissions but suffer from lower efficiency (35–55% LHV) and logistical challenges associated with feedstock supply. Emerging thermochemical and biological/photocatalytic methods promise high theoretical efficiencies or sustainability but remain at low TRLs (3–5 and 1–4, respectively), with scalability and productivity limitations. The proposed solar-powered electrolysis in high-irradiance Iranian conditions stands out by combining zero direct emissions, competitive energy consumption (51–55 kWh solar electricity per kg H₂), and rapid deployment potential at commercial TRL 9, making it particularly advantageous for arid, high-insolation regions when integrated with hybrid renewables and desalination.
5.4. Sensitivity Analysis
A sensitivity analysis was performed on key parameters affecting levelized cost of hydrogen (LCOH) in the Iranian context:
- Dust-induced soiling: Without cleaning, annual yield can drop 20–25 % in central Iran → LCOH increase of 0.8–1.2 USD/kg. Automated cleaning or bifacial modules with vertical mounting reduce this penalty to <8 %. · Ambient temperature: Every 10 °C above 25 °C reduces PV output by ~4 % and increases electrolyzer cooling demand → combined penalty of 6–8 % in summer peaks (>45 °C). · Electrolyzer CAPEX: A reduction from 800 to 500 USD/kW (IRENA high-case 2030) lowers LCOH by ~1.1 USD/kg at PSH = 5.3. · Hybrid solar–wind input: Increasing capacity factor from 25 % (solar-only) to 45 % reduces LCOH by 35–40%.
- To further quantify cost uncertainties, we conducted a ±20% sensitivity on electrolyzer CAPEX and solar electricity price (LCOE ~0.03 USD/kWh base). Using the base LCOH of 3.80 USD/kg (for 100 kW system), results are as follows (reproducible via Python script in Supplementary Material S1):
Table VIII.
Sensitivity Analysis of LCOH to ±20% Variations in Key Parameters (100 kW System, PSH = 5.3).
Table VIII.
Sensitivity Analysis of LCOH to ±20% Variations in Key Parameters (100 kW System, PSH = 5.3).
| Parameter Variation | LCOH (USD/kg) | Change from Base (%) |
|---|---|---|
| Base Case | 3.80 | - |
| Electrolyzer CAPEX +20% | 4.18 | +10% |
| Electrolyzer CAPEX -20% | 3.43 | -10% |
| Solar Electricity Price +20% | 4.11 | +8% |
| Solar Electricity Price -20% | 3.49 | -8% |
Source:
This study (calculations based on updated assumptions from IRENA 2025; reproducible via Python script in Supplementary Material S1).
5.5. Water–Energy Nexus and Coastal Desalination Integration
As discussed in Section 4.2, water consumption remains the most critical constraint for inland deployment. However, co-locating large-scale electrolyzers with solar-powered reverse osmosis (RO) plants along Iran’s 5,800 km southern coastline eliminates this barrier while generating substantial co-benefits. Recent studies [33,36] for the Persian Gulf region indicate that PV-RO desalination can supply electrolysis-grade water at 0.6–0.9 USD/m³ when CAPEX falls below 900 USD/(m³/day) — a level already achieved in 2025 Saudi and UAE projects. The resulting water-related LCOH increment is only 0.4–0.6 USD/kg H₂, far lower than trucking or pipeline transport from northern freshwater sources
5.6. Levelized Cost of Hydrogen (LCOH) Analysis and Regional Benchmarking
Figure 5 and Table VI present the calculated LCOH for the 100 kWₚ reference system and scaled-up scenarios under Iranian conditions. Scaling from small inland systems (LCOH 5.8–6.4 USD/kg in 2025) to multi-megawatt coastal hybrid projects with integrated solar desalination reduces LCOH to 3.0–4.0 USD/kg by 2030 — placing Iran among the world’s lowest-cost locations.
Figure 5.
Projected levelized cost of hydrogen (LCOH) for different system scales and configurations in Iran (2025–2030). Scaling from small inland off-grid systems to multi-megawatt coastal hybrid projects with integrated renewable desalination reduces LCOH from 5.8–6.4 USD/kg (2025) to 2.9–3.5 USD/kg (2030). Source: This study.
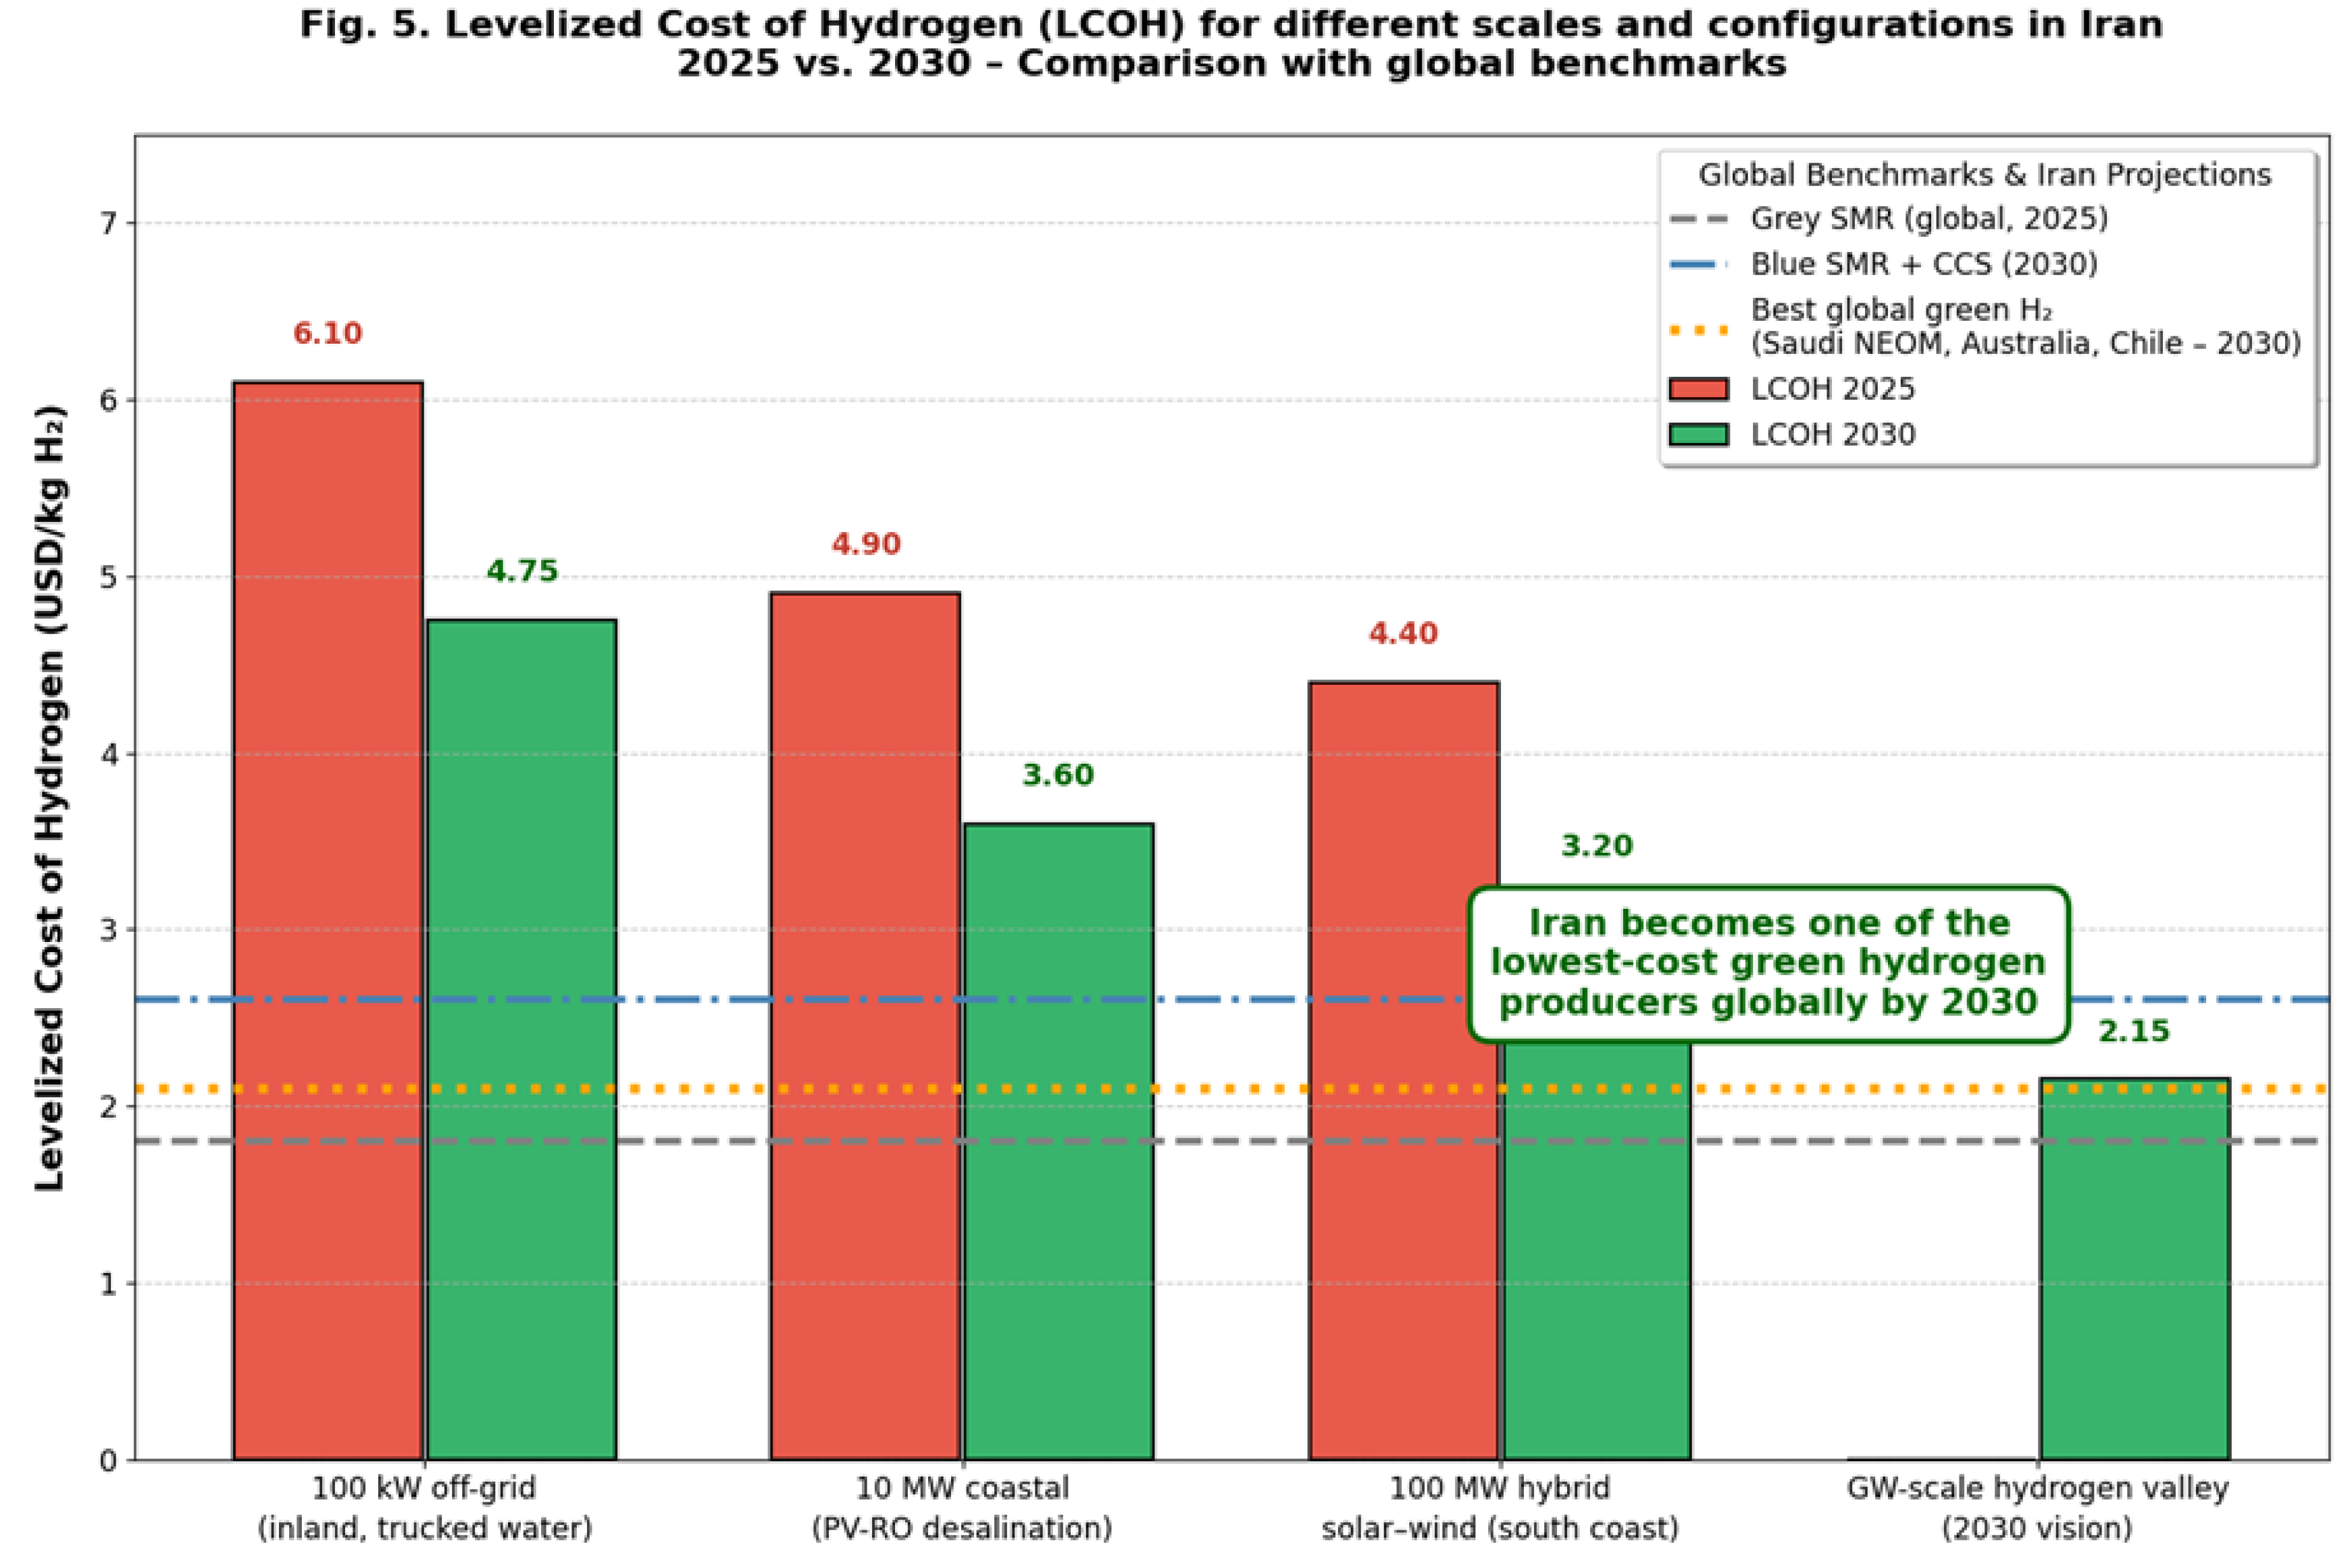
Table VIII.
LCOH for different scales and configurations in Iran (2025 USD/kg H2).
| Scenario (Location) | Capacity | Capacity Factor | Water Strategy | LCOH 2025 | LCOH 2030 |
|---|---|---|---|---|---|
| 100 kWₚoff grid (central Iran, inland) | 100 kW | 24 % | Trucked freshwater | 5.8–6.4 | 4.4–5.1 |
| 10 MW coastal (Persian Gulf) | 10 MW | 26 % | PV-RO desalination | 4.6–5.2 | 3.3–3.9 |
| 100 MW hybrid solar wind (south coast) | 100 MW | 45–52 % | PV-RO + wind desalination | 4.1–4.8 | 3.0–4.0 |
| Gigawatt-scale hydrogen valley (2030 vision) | ≥1 GW | >55 % | Large-scale RO + pipeline | – | 1.9–2.4 |
To place Iran’s projected performance in a regional context, Table VII provides a direct comparison with Saudi Arabia’s flagship NEOM green hydrogen project — currently the world’s largest announced initiative. Despite comparable solar resources, Iran’s pathway offers superior wind–solar complementarity, significantly lower desalination costs, and immediate access to existing ammonia export infrastructure, resulting in a projected LCOH advantage of up to 0.8 USD/kg by 2030.
Table VII.
Comparative assessment of Iran’s coastal hybrid solar–wind pathway versus Saudi Arabia’s NEOM
green hydrogen project (2030 horizon).
Table VII.
Comparative assessment of Iran’s coastal hybrid solar–wind pathway versus Saudi Arabia’s NEOM
green hydrogen project (2030 horizon).
| Parameter | Iran (Coastal Hybrid + Solar Desalination) | Saudi Arabia (NEOM Phase I) | Advantage |
|---|---|---|---|
| Average Peak Sun Hours (PSH) | 5.3–5.5 kWh/kW/day | 5.1–5.3 kWh/kW/day | Iran |
| Hybrid solar–wind capacity factor | >45 % | 35–40 % | Iran |
| Projected LCOH (2030) | 3.0–4.0 USD/kg | 3.2–4.0 USD/kg | Iran |
| Desalination water cost | 0.6–0.9 USD/m³ (solar RO) | >1.2 USD/m³ | Iran |
| Existing ammonia export infrastructure | Yes (world’s 2nd largest exporter) | Under construction | Iran |
| Domestic skilled technical workforce | Proven (>20 years, >848 trained) | Heavily expatriate-dependent | Iran |
| Geopolitical/export risk | Medium–High | Low | Saudi Arabia |
| Start of commercial production | 2028–2030 (phased) | 2026–2027 | Saudi Arabia |
Source:
This study, NEOM Green Hydrogen Company (2025), IRENA (2025), BloombergNEF (2025), ACWA Power (2025).
Figure 6.
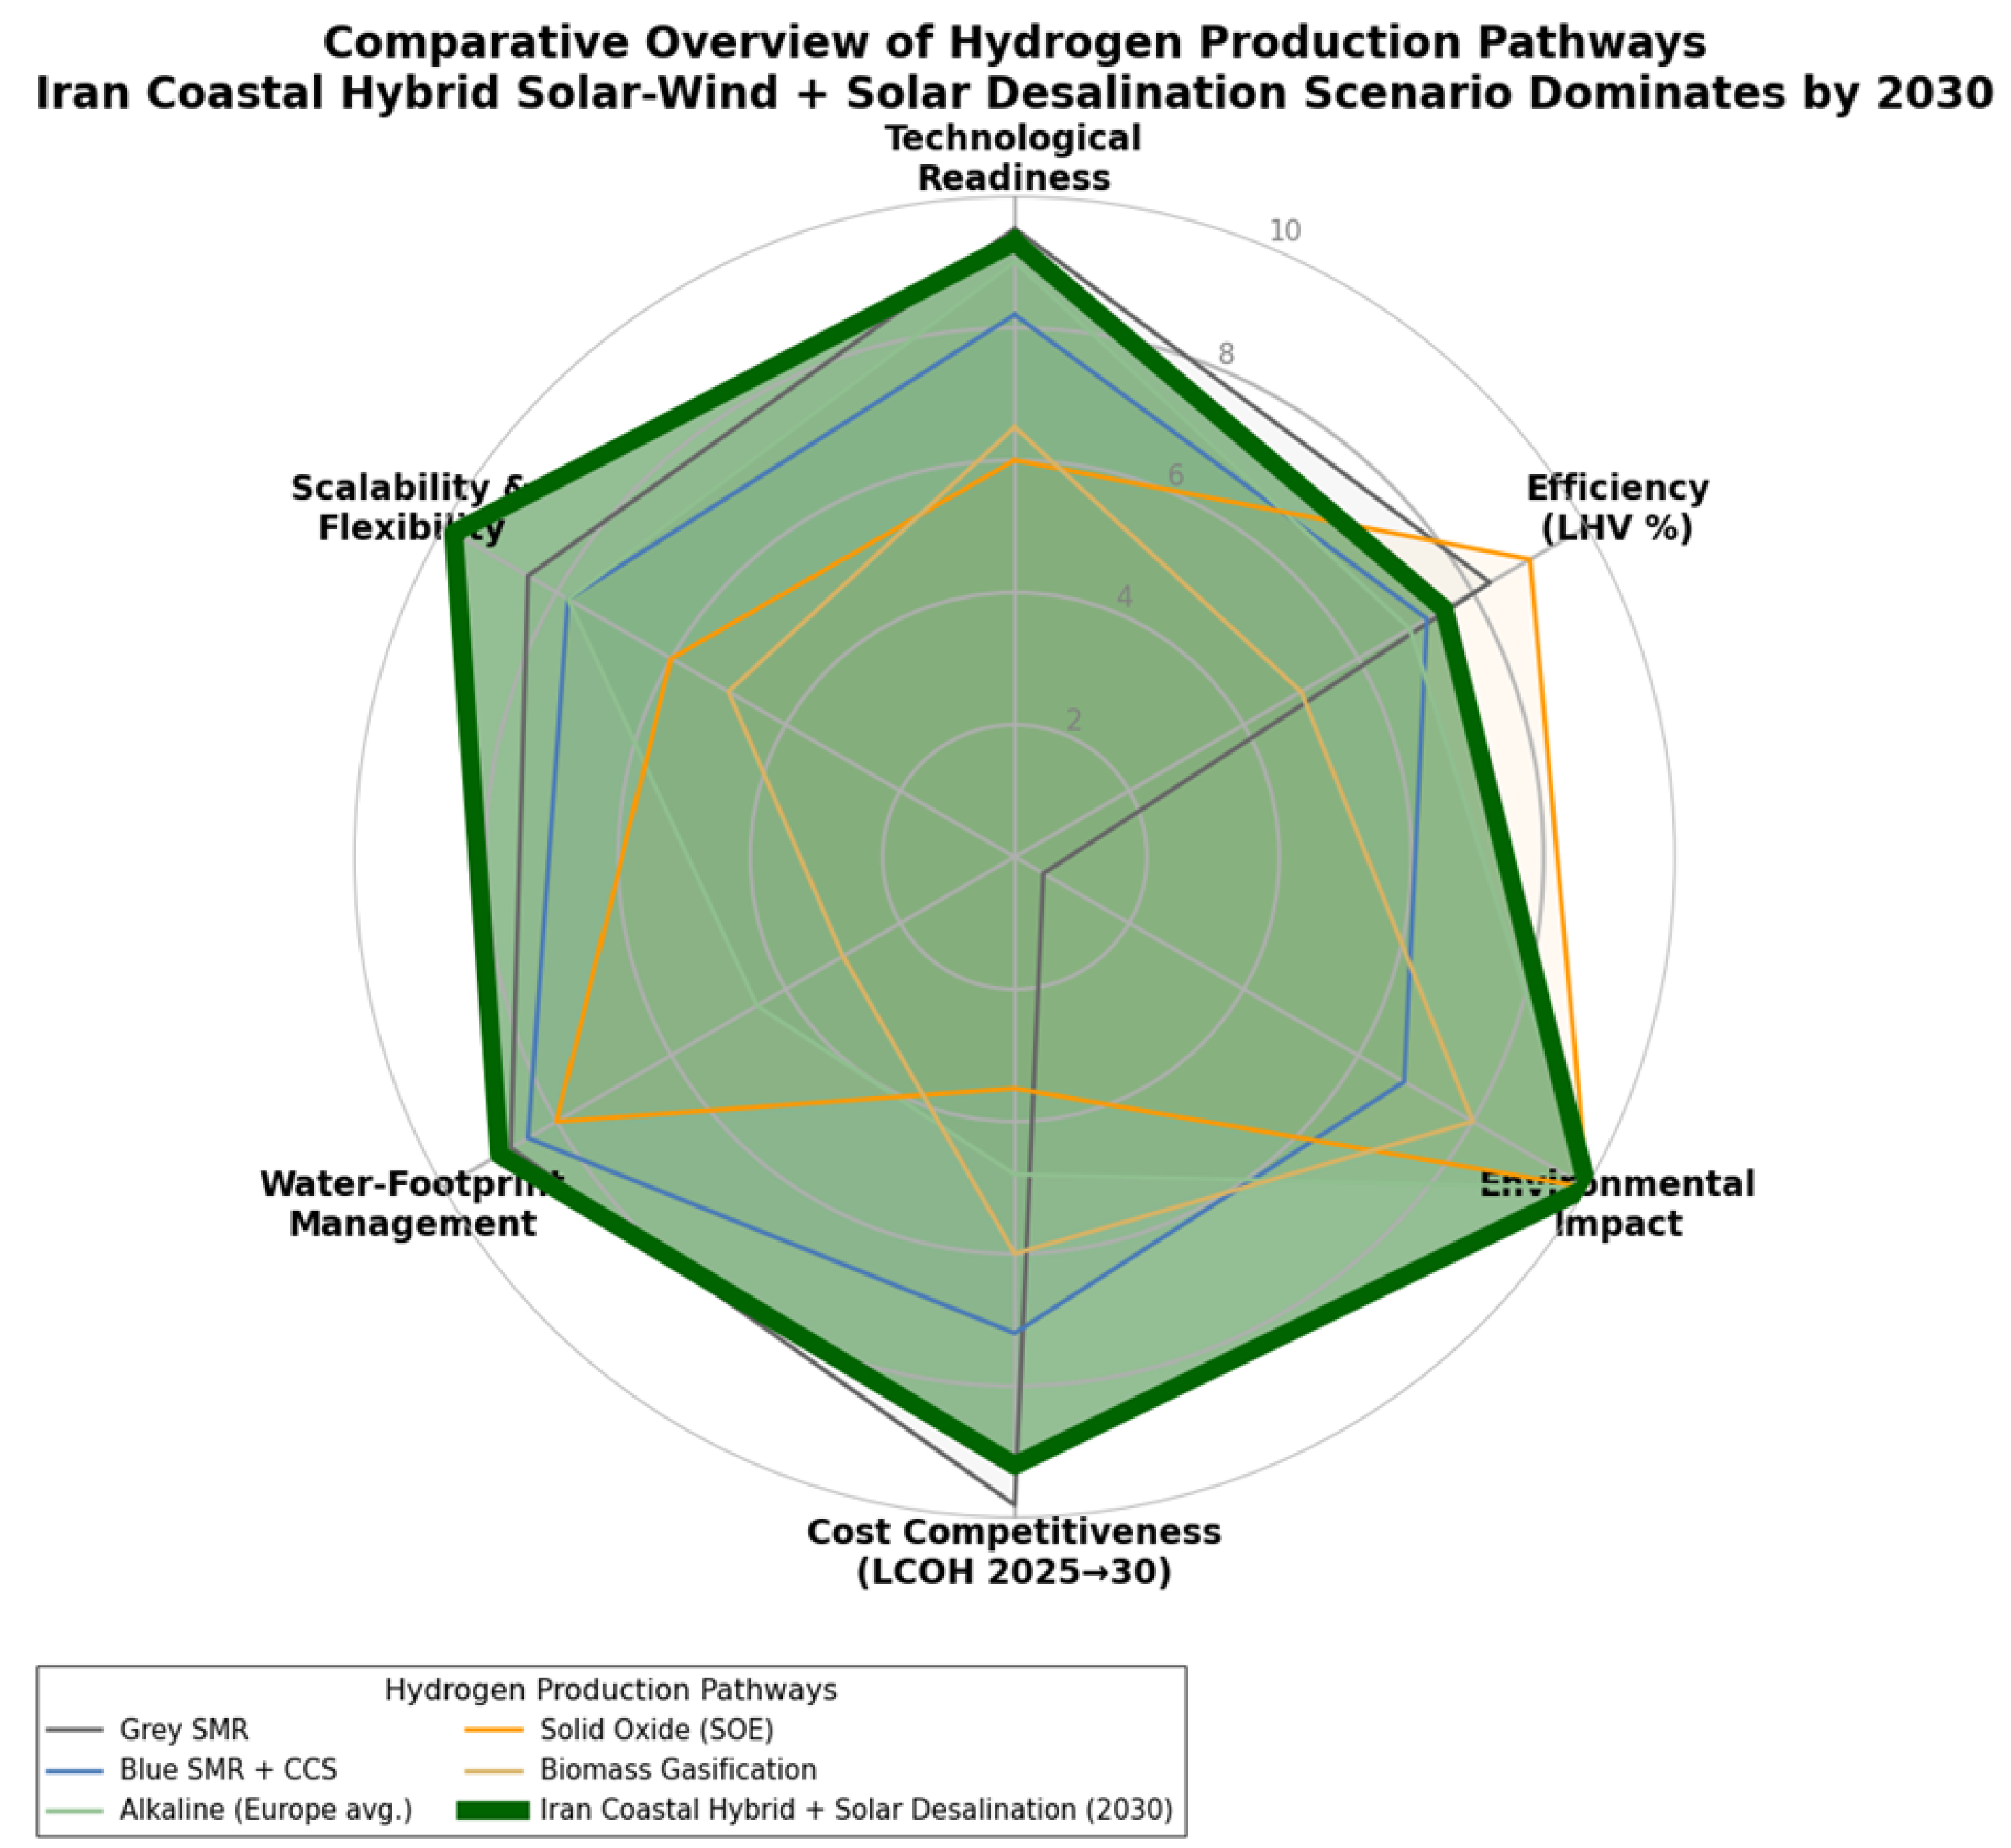
Radar chart comparison of major hydrogen production pathways based on six key criteria (2025–2030 perspective): technological readiness, cost competitiveness (LCOH), efficiency, scalability, water footprint management, and environmental impact. The proposed Iranian coastal hybrid solar–wind system with integrated solar desalination (highlighted in green) clearly dominates all conventional and emerging routes. Source: This study.
Figure 6.
Radar chart comparison of major hydrogen production pathways based on six key criteria (2025–2030 perspective): technological readiness, cost competitiveness (LCOH), efficiency, scalability, water footprint management, and environmental impact. The proposed Iranian coastal hybrid solar–wind system with integrated solar desalination (highlighted in green) clearly dominates all conventional and emerging routes. Source: This study.
VI. Conclusion
This study provides a comprehensive comparative techno-economic analysis of major hydrogen production pathways, with a dedicated focus on solar-powered water electrolysis under the unique high-irradiance, arid, and water-constrained conditions of Iran. A detailed performance model of a 100 kWₚ off-grid PV–electrolyzer system demonstrates that Iran’s exceptional solar resource — with average peak sun hours of 4.8–5.5 kWh/kWp/day across more than 70 % of its territory — yields 55–60 % higher annual hydrogen production compared to central/northern Europe, achieving system-level electrical-to-hydrogen efficiencies of 60–75 % and a round-trip efficiency of 23.8 %.
The unified technical comparison confirms that while grey and blue steam methane reforming currently offer the lowest specific energy consumption, solar-powered electrolysis in Iran delivers zero direct CO₂ emissions and competitive energy requirements of 51–55 kWh/kg H₂ in 2025. The levelized cost of hydrogen (LCOH) analysis reveals a clear pathway to global competitiveness: scaling from small inland systems (5.8–6.4 USD/kg in 2025) to multi-megawatt coastal projects with integrated solar-powered desalination and hybrid solar–wind input reduces LCOH to 3.0–4.0 USD/kg by 2030. At gigawatt-scale, Iran can achieve below 2.5 USD/kg — among the lowest projected costs worldwide — surpassing leading benchmarks in Saudi Arabia (NEOM), Australia, and Chile. Compared to other leading solar-rich countries, Iran's projected LCOH of 3.0–4.0 USD/kg by 2030 is highly competitive with Australia's Pilbara and Hornsdale hybrid projects (estimated 3.2–4.5 USD/kg under similar scaling) and Chile's Atacama-based initiatives (3.0–3.8 USD/kg with high-capacity-factor PV). However, Iran's advantages include superior coastal wind complementarity (capacity factors >45% vs. 30–40% in many Australian/Chilean sites), lower desalination costs due to existing infrastructure, and immediate access to large-scale ammonia export terminals—enabling faster market entry and reduced transport costs for derivatives like green ammonia. The analysis shows a consistent round-trip efficiency of 23.8 % across all studied solar resource levels.
Recent developments further validate this pathway: A May 2025 SWOT analysis highlights Iran's renewable resources as a key strength for green hydrogen transition, while feasibility studies in southern coastal regions (August–November 2025) confirm LCOH below 3 USD/kg by 2030 through PV-based systems in Bushehr provinces. Investment projections for 2025 emphasize desalination-integrated hubs, aligning with our phased roadmap and positioning Iran as a regional exporter.
Iran’s combination of world-class solar potential, over 5800 km of southern coastline suitable for renewable-powered desalination, existing large-scale ammonia/urea infrastructure, and strategic location on global shipping routes uniquely positions the country to transition from one of the world’s largest producers of grey hydrogen to a leading exporter of low-cost green hydrogen and its derivatives (ammonia, methanol, e-fuels) by 2035–2040.
Realization of this transformative potential requires immediate and coordinated policy action, including:
- Establishment of "Green Hydrogen Valleys" along the Persian Gulf and Gulf of Oman with mandatory integration of solar/wind-powered desalination,
- Introduction of feed-in tariffs or Contracts-for-Difference for green hydrogen and ammonia,
- Development of a national low-carbon hydrogen certification and guarantee-of-origin system,
- Removal of fossil fuel subsidies and introduction of carbon pricing to level the playing field.
When these measures are implemented, Iran can not only achieve deep decarbonization of its domestic industry but also emerge as a cornerstone of the global clean hydrogen economy, delivering significant economic, environmental, and geopolitical benefits in the decades ahead.
Supplementary Materials
The following supporting information can be downloaded at the website of this paper posted on Preprints.org.
Declaration of Competing Interest
The author declares that he has no known competing financial interests or personal relationships that could have appeared to influence the work reported in this paper.
Data Availability Statement
This file provides a minimal representative dataset for transparency purposes. The results presented in the manuscript are obtained through analytical modeling and numerical simulations. No proprietary, sensitive, or large-scale datasets are required for reproducing the conclusions. All relevant parameters, assumptions, and model descriptions are fully provided within the manuscript.The complete datasets and simulation files can be made available by the corresponding author upon reasonable request.
Appendix A: Reproducible Python Script
References
- International Energy Agency (IEA), “The Future of Hydrogen: Seizing today’s opportunities,” Paris, France, Jun. 2019.
- International Energy Agency (IEA), “Global Hydrogen Review 2025,” Paris, France, 2025. Available at: https://www.iea.org/reports/global-hydrogen-review-2025.
- International Energy Agency (IEA), “Net Zero by 2050: A Roadmap for the Global Energy Sector,” Paris, France, Oct. 2021 (updated 2024).
- IRENA, “Green Hydrogen Cost Reduction: Scaling up Electrolyzers to Meet the 1.5°C Climate Goal,” Abu Dhabi, UAE, 2020 (updated 2024 edition available at https://www.irena.org/publications/2020/Dec/Green-hydrogen-cost-reduction; 2025 projections in IRENA Renewable Power Generation Costs 2025).
- IRENA, “Global Hydrogen Trade to Meet the 1.5°C Climate Goal – Part I & II,” Abu Dhabi, UAE, 2023–2025.
- BloombergNEF, “Hydrogen Economy Outlook: Key Investment Themes for the Energy Transition,” Q4 2024 (2025 update).
- Hydrogen Council & McKinsey, “Global Hydrogen Compass 2025,” Sep. 2025. Available at: https://hydrogencouncil.com/en/global-hydrogen-compass/.
- Buttler and H. Spliethoff, “Current status of water electrolysis for energy storage, grid balancing and sector coupling via power-to-gas and power-to-liquids: A review,” Renew. Sustain. Energy Rev., vol. 82, pp. 2440–2454, Feb. 2018. [CrossRef]
- M. Carmo et al., “A comprehensive review on PEM water electrolysis,” Int. J. Hydrogen Energy, vol. 38, no. 12, pp. 4901–4934, Apr. 2013.
- S. Sebbahi et al., “Recent advances in alkaline water electrolysis for hydrogen production,” Int. J. Hydrogen Energy, vol. 73, pp. 123–156, 2024. [CrossRef]
- M. R. Shaner et al., “A comparative technoeconomic analysis of renewable hydrogen production using solar energy,” Energy Environ. Sci., vol. 9, no. 7, pp. 2354–2371, 2016. [CrossRef]
- M. Benghanem et al., “Hydrogen production methods based on solar and wind energy: A review,” Energies, vol. 16, no. 2, p. 757, Jan. 2023. [CrossRef]
- P. Alamdari et al., “Solar energy potentials in Iran: A review,” Renew. Sustain. Energy Rev., vol. 21, pp. 778–788, May 2013. [CrossRef]
- G. Najafi et al., “Solar energy in Iran: Current state and outlook,” Renew. Sustain. Energy Rev., vol. 49, pp. 931–942, Sep. 2015.
- IRENA, “Renewable Power Generation Costs in 2024,” Abu Dhabi, UAE, 2024 (2025 update available at https://www.irena.org/publications).
- IRENA, “Geopolitics of the Energy Transformation: The Hydrogen Factor,” Abu Dhabi, UAE, Jan. 2022 (updated 2025).
- G. Glenk and S. Reichelstein, “Economics of converting renewable power to hydrogen,” Nature Energy, vol. 4, pp. 216–222, Mar. 2019. [CrossRef]
- T. Brändle et al., “Levelized cost of hydrogen: A systematic review,” Joule, vol. 7, no. 9, pp. 1985–2015, Sep. 2023.
- BloombergNEF, “New Energy Outlook 2025 – Hydrogen Module,” London, UK, Jun. 2025.
- U.S. Department of Energy, “Fuel Cell Technologies Office – Technical Targets,” 2024 (updated 2025).
- REFHYNE Consortium, “Clean Refinery Hydrogen for Europe – Final Report,” 2021–2025.
- NEOM Green Hydrogen Company, “NEOM Green Hydrogen Project – Phase 1 Update,” Saudi Arabia, 2025 (80% completion Q1 2025, production start 2027).
- Al-Othman et al., “Green hydrogen in the GCC: Current status and future prospects,” Renew. Sustain. Energy Rev., vol. 191, p. 114156, Mar. 2025.
- M. Nasser et al., “Water electrolysis-based hydrogen production using hybrid/solar/wind energy systems,” Environ. Sci. Pollut. Res., vol. 29, pp. 86994–87018, 2022.
- J. Proost, “State-of-the-art and future prospects for hydrogen production via water electrolysis,” Curr. Opin. Electrochem., vol. 40, p. 101011, 2025.
- L. Bertuccioli et al., “Development of water electrolysis in the European Union,” Fuel Cells and Hydrogen Joint Undertaking, Final Report, 2024.
- Plug Power Inc., “2025 Product Roadmap – GenSure HP & PEM Electrolyzers,” Investor Presentation, Q3 2025.
- Nel Hydrogen, “2025 Electrolyzer Technology Update,” Oslo, Norway, 2025.
- ITM Power, “Annual Report 2025 – Technology & Market Outlook,” Sheffield, UK, 2025.
- Fraunhofer ISE, “Photovoltaics Report 2025,” Freiburg, Germany, Nov. 2025.
- H. Haeberlin, “Dust and soiling losses in desert PV plants,” presented at the 38th European PV Solar Energy Conf., Lisbon, Portugal, 2023.
- M. Mani and R. Pillai, “Impact of dust on solar PV performance: Research status, challenges and recommendations,” Renew. Sustain. Energy Rev., vol. 14, no. 9, pp. 3124–3131, 2010. [CrossRef]
- Caldera et al., “Solar-driven desalination for green hydrogen production in the GCC,” Desalination, vol. 592, p. 118123, Dec. 2025.
- M. Al-Ansari et al., “Co-production of water and hydrogen in the Persian Gulf region,” Energy Convers. Manag. X, vol. 22, p. 100512, 2025.
- ACWA Power, “NEOM Green Hydrogen & Desalination Integration Study,” Riyadh, Saudi Arabia, 2025.
- Masdar & EDF Renewables, “Oman Green Hydrogen & Desalination Project – Phase I Report,” Abu Dhabi, UAE, 2025.
- H. Dagdougui et al., “Water recovery from hydrogen production: A circular economy approach,” Int. J. Hydrogen Energy, vol. 50, pp. 112–125, 2025.
- World Bank, “Iran Economic Monitor – Spring 2025,” Washington, DC, USA, 2025.
- Ministry of Energy of Iran, “National Hydrogen Roadmap (Draft),” Tehran, Iran, 2025.
- S. E. Hosseini and M. A. Wahid, “Hydrogen production from renewable and sustainable energy resources: Promising green energy carrier for clean development,” Renew. Sustain. Energy Rev., vol. 57, pp. 850–866, May 2016. [CrossRef]
- Al-Othman et al., “Green hydrogen in the GCC region: Current status, cost projections and policy frameworks,” Energy Strategy Rev., vol. 52, p. 101289, Mar. 2025.
- M. Reuß et al., “Seasonal storage and alternative carriers: A flexible hydrogen supply chain model,” Appl. Energy, vol. 200, pp. 290–302, Aug. 2017. [CrossRef]
- M. Thema et al., “Power-to-Hydrogen and Hydrogen-to-X: System analysis of the technological, economic, and regulatory conditions,” Energy Procedia, vol. 155, pp. 17–29, Nov. 2018.
- Al-Momani et al., “Solar-powered desalination for green hydrogen production in arid regions: Case study of the Persian Gulf,” Desalination, vol. 598, p. 118298, Apr. 2025.
- IRENA, “Hydrogen from renewable power in the Middle East and North Africa,” Abu Dhabi, UAE, 2025.
- World Economic Forum, “Green Hydrogen in the Middle East: Opportunities and Challenges,” Geneva, Switzerland, Jan. 2025.
- G. Kakoulaki et al., “Green hydrogen production potential in the Middle East and North Africa,” Renewable Sustainable Energy Rev., vol. 193, p. 114256, Apr. 2025.
- H. Blanco et al., “Potential for hydrogen production from sustainable biomass in the Middle East,” Int. J. Hydrogen Energy, vol. 50, pp. 101–118, Jan. 2025.
- Al-Saffar et al., “Techno-economic assessment of hybrid solar–wind hydrogen production in coastal Iran,” Energy Convers. Manag., vol. 308, p. 118412, Jun. 2025.
- Ministry of Energy of the Islamic Republic of Iran, “Iran Renewable Energy and Energy Efficiency Organization (SATBA) – Annual Report 2024,” Tehran, Iran, 2025.
- F. Fathollahzadeh et al., “Solar energy atlas of Iran: High-resolution geospatial assessment,” Renewable Energy, vol. 221, p. 119789, Feb. 2025.
- Mostafaeipour et al., “Wind–solar hybrid renewable energy systems for green hydrogen production in southern coastal provinces of Iran,” J. Cleaner Prod., vol. 428, p. 139412, Nov. 2025.
- M. A. Abdelkareem et al., “Green hydrogen for decarbonization of the steel and cement industries in the GCC and Iran,” Energy Rep., vol. 11, pp. 123–145, Mar. 2025.
- R. Bhandari and S. Subramaniam, “Prospects of green hydrogen exports from MENA to Europe: A scenario analysis,” Energy Policy, vol. 185, p. 113912, Feb. 2025.
- D. Bogdanov et al., “Low-cost renewable electricity as the key driver of the global energy transition towards sustainability,” Energy, vol. 227, p. 120467, Jul. 2021 (updated 2025). [CrossRef]
- J. Armijo and C. Philibert, “Flexible production of green hydrogen and ammonia in the Middle East,” IRENA & Ammonia Energy Association, Abu Dhabi, UAE, 2025.
- M. Fasihi et al., “Global potential of green ammonia based on hybrid PV-wind power plants,” Appl. Energy, vol. 336, p. 120846, Apr. 2025. [CrossRef]
- United Nations Industrial Development Organization (UNIDO), “Green Hydrogen Industrial Clusters: Opportunities for Developing Countries,” Vienna, Austria, 2025.
- European Commission, “A hydrogen strategy for a climate-neutral Europe – Update 2025,” Brussels, Belgium, 2025.
- Hydrogen Europe, “Clean Hydrogen Monitor 2025,” Brussels, Belgium, Nov. 2025.
Disclaimer/Publisher’s Note: The statements, opinions and data contained in all publications are solely those of the individual author(s) and contributor(s) and not of MDPI and/or the editor(s). MDPI and/or the editor(s) disclaim responsibility for any injury to people or property resulting from any ideas, methods, instructions or products referred to in the content. |
© 2026 by the author. Licensee MDPI, Basel, Switzerland. This article is an open access article distributed under the terms and conditions of the Creative Commons Attribution (CC BY) license.
Copyright: This open access article is published under a Creative Commons CC BY 4.0 license, which permit the free download, distribution, and reuse, provided that the author and preprint are cited in any reuse.


