Submitted:
31 December 2025
Posted:
31 December 2025
You are already at the latest version
Abstract
This study focuses on the ecological vulnerability and its driving mechanism of the Ebinur Lake Basin. Integrating natural factors such as annual average temperature, annual precipitation and elevation, as well as social factors including GDP and population distribution, it systematically evaluates the ecological vulnerability of the basin from 1994 to 2024 by adopting methods like the SRP model, Analytic Hierarchy Process (AHP) and Geodetector. The results show that the overall scale of ecologically vulnerable areas in the basin has presented a shrinking trend over the past 30 years: the area of severe vulnerability reached a peak of 14,270.31 square kilometers in 2004 and then decreased to 13,242.39 square kilometers; the area of slight vulnerability increased by 60.8%; and the proportion of moderate vulnerability has slightly risen since 2014. Spatially, the vulnerability exhibits significant agglomeration characteristics: severe vulnerable areas are concentrated in the mountainous areas of the basin boundary and the eastern region of Ebinur Lake, while slight vulnerable areas are distributed in woodlands and farmlands of alluvial fans in low mountains and hills. Geodetector analysis shows that, fractional vegetation cover, normalized difference vegetation index and land use type are the dominant factors, natural factors and social factors interact significantly.This study provides a scientific basis for ecological protection and sustainable development of the basin.
Keywords:
Ebinur Lake
; geodetector
; ecological vulnerability
; driving mechanisms
1. Introduction
1.1. Research Background
Wetland is an important part of the ecosystem, it is also the most biodiversity rich ecological landscape in nature[1]. It has the functions of flood storage and drought resistance, regulating climate, slowing soil erosion, promoting sediment deposition and land formation, degrading environmental pollution, maintaining regional ecological balance and protecting biodiversity, known as the “kidney of the earth”[2]. Lakes are an important part of wetland ecosystems. They have stable water bodies and rich biological communities, and they maintain the regional ecological balance with their unique ecological functions. The ecological balance of the lake ecosystem is easily unbalanced by external interference. This vulnerability is more prominent in the arid areas of Northwest China. Lakes in arid areas are important water conservation areas. Lakes in arid areas are important water conservation areas. It also has the key function of climate regulation. At the same time, it provides a suitable habitat for animals and plants[3]. At present, lakes in arid areas are facing many pressures, such as the reduction of area, the deterioration of water quality, and the decline of biodiversity. These pressures threaten the health and stability of wetland ecosystems. It also has a far-reaching impact on the social and economic development of the surrounding areas.
1.2. Research Status at Home and Abroad
Ecological vulnerability and its driving mechanism, it has always been regarded as the focus and focus in the international ecological community. In terms of methods, Fuzzy Delphi analytic hierarchy process is used in combination with geographic information system, multi-source remote sensing data and cluster analysis, and integrate all kinds of data, build a comprehensive assessment system for ecological vulnerability of urban wetlands, study on spatio temporal characteristics of ecological sensitive areas[4,5,6,7,8,9]. In theory, introduction of Elsa framework into Wetland vulnerability assessment in Aral Sea and other regions[10]. The framework integrates the four dimensions of exposure, sensitivity, adaptability and resilience, it systematically assesses the impact of climate change on the ecological vulnerability of the Aral Sea.
In China, the study of ecological vulnerability has also received widespread attention. Urban expansion, industrial development and other factors have led to the occupation and destruction of a large number of wetlands. Wetland ecosystem functions are seriously affected[11,12,13,14,15]. Climate change, such as temperature rise and precipitation change, changes the wetland area. It affects the growth and distribution of wetland vegetation. Changes in the hydrological environment, such as river diversion and groundwater level decline, will also destroy the wetland ecosystem. The function of the wetland ecosystem is destroyed[16,17,18,19,20]. Soil erosion reduces the soil fertility of wetlands and affects the growth of vegetation, reduces the ecological stability of wetlands[21,22]. Over exploitation, pollution discharge, irrational use of water resources and other human activities, it is also an important reason for the fragility of wetland ecosystem[23]. Wetland area reduction due to over development, destroys the integrity of wetlands[24]; pollution discharge will directly endanger the survival of wetland organisms[25];the unreasonable utilization of water resources and excessive water intake have led to the decline of water level, impact on wetland ecological function[26]. In terms of methodology, domestic scholars have adopted various technologies such as remote sensing, geographic information system and ecological model, the quantitative and qualitative analysis of wetland ecological vulnerability was carried out[27]. Remote sensing can monitor wetland changes, obtain wetland area, vegetation coverage and other data; GIS can integrate and analyze wetland spatial data, provide spatial framework support for ecological vulnerability assessment; the ecological model can simulate the natural succession law of wetland ecosystem, predict the development trend of its ecological vulnerability[28]. Ih, development has hindered the natural development, the process of wetlands, the process of ecological degradation in uncultivated areas has also accelerated. The reclamation activities directly destroyed the original vegetation of the wetland, engineering measures such as drainage and dredging have changed the pattern of surface runoff, thus causing wetland hydrological cycle disorder, leading to significant decline of wetland ecological service function[29]. The construction of water conservancy projects changes the hydrological characteristics of rivers, affects the stability of wetland ecosystem[30]. In the study of ecological vulnerability of lakes, domestic scholars are mainly concentrated in the lake wetlands in the eastern plain such as Dongting Lake, Hongze Lake and Honghu Lake, and the marshes and wetlands in Sanjiang plain and other areas. AHP can be used to classify the complex wetland ecological vulnerability assessment indicators, determine the weight of each indicator, and comprehensive assessment of wetland ecological vulnerability[31].
Compared with the eastern plain, there are relatively few studies on the ecological vulnerability of lakes and wetlands in the western arid region, the research method is also relatively simple. The lakes and wetlands in the arid regions of Western China are faced with water shortage, land desertification, salinization and other problems. The study of its ecological vulnerability has important practical significance[32]. In the past 60 years, Ebinur Lake Wetland under the dual stress of natural background and human activities, the area shrank sharply, biodiversity is under serious threat, land desertification has intensified, and frequent occurrence of disastrous weather[33]. Ebinur Lake is located in the arid area of Western China, the climate is dry and water resources are scarce, and the impact of human activities, making its ecological environment problems increasingly prominent[34]. These problems have a significant impact on the ecological security of the basin and the ecological environment and socio-economic development of the economic belt at the northern foot of the Tianshan Mountains[35]. As a typical representative of lakes and wetlands in arid areas, the unique geographical location and ecological environment make it an important object for the study of Lake Wetland Ecosystem in Arid Areas[36]. Through in-depth study on the driving mechanism of ecological vulnerability change in Ebinur Lake Basin, we can provide scientific basis for formulating targeted protection and recovery measures, promote the improvement of ecological environment and the sustainable development of social economy in Ebinur Lake Basin[37].
2. Materials and Methods
2.1. Study Area
Ebinur Lake Basin is located in Bortala Mongolian Autonomous Prefecture of Xinjiang Uygur Autonomous Region (43°37’N to 45°55’N, 79°53’E to 85°02’E). Ebinur Lake is located at the lowest point of Junggar basin, it is the water and salt concentration center on the southwest edge of the basin, it is the largest lake in Junggar basin, it is also the largest salt water lake in Xinjiang[38]. Ebinur Lake Basin is far away from the sea and the surrounding terrain is complex, water vapor is difficult to penetrate, the average annual precipitation in the basin is less than 100 mm, extreme drought, the lake water supply mainly depends on 23 rivers such as Jinghe River, Kuitun River and Bortala River.
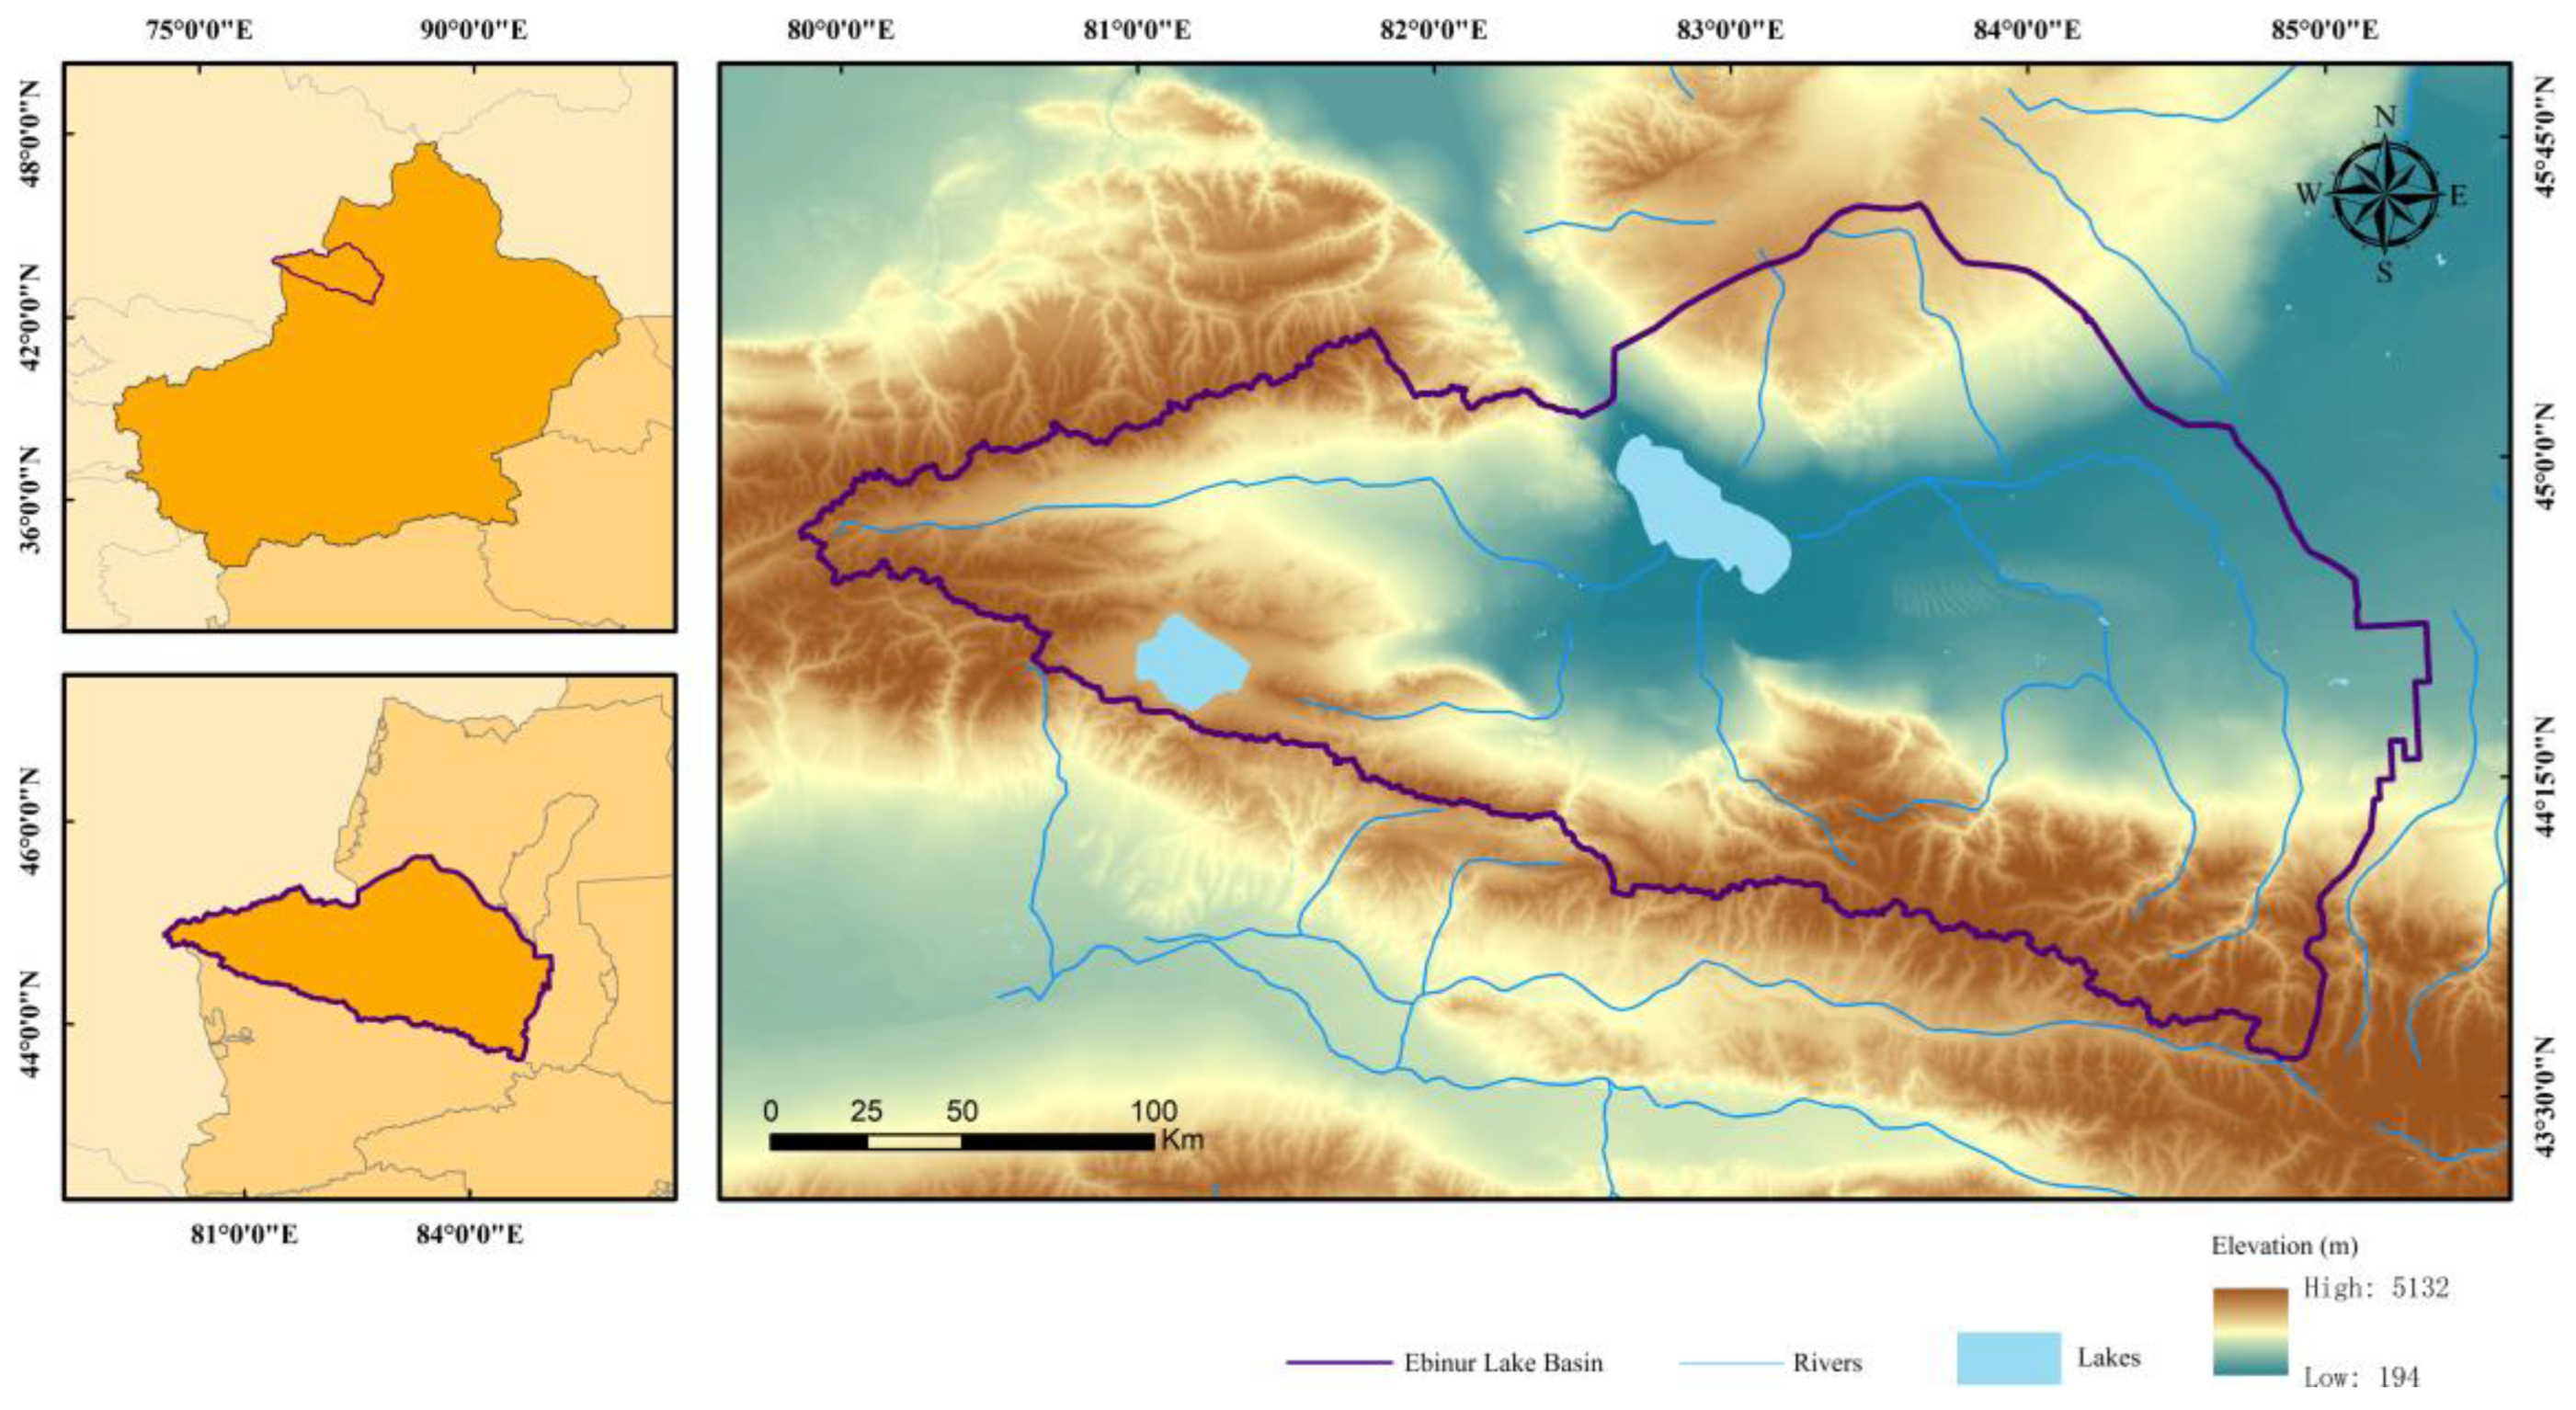
Figure 1.
Schematic map of the study area.
In the past 50 years, the population of Ebinur Lake Basin has continued to grow, the pace of social and economic development has accelerated, in the process, as a result, the surface runoff flowing into Ebinur Lake has been sharply reduced. Some of the tributaries that originally flowed into Ebinur Lake even dried up. As a direct result, the water area of Ebinur Lake is shrinking[39]. The reduction of water area has triggered a series of serious ecological and environmental problems, especially, as the wetland area of Ebinur Lake decreases significantly, a large area of the lake bottom is exposed. Today, the Ebinur Lake Basin has become one of the important sources of dust storms in Xinjiang and even China[40].
2.2. Data Sources
2.2.1. Landsat
The Landsat data used in this study are mainly derived from the United States Geological Survey (USGS) (https://earthexplorer.usgs.gov/), as detailed in . This dataset has a spatial resolution of 30 meters and a time span ranging from 1994 to 2024.

Table 1.
Basic Information of Landsat Data.
| Year | Data Type | Selected Bands | Spatial Resolution/m | Remarks |
| 1994 | Landsat-5 TM CO1 T1 SR | 1,2,3,4,5,6,7 | 30 | Cloud-free |
| 2004 | Landsat-5 TM CO1 T1 SR | 1,2,3,4,5,6,7 | 30 | Cloud-free |
| 2014 | Landsat-8 OLI CO1 T1 SR | 1,2,3,4,5,6,7 | 30 | Cloud-free |
| 2024 | Landsat-8 OLI CO1 T1 SR | 1,2,3,4,5,6,7 | 30 | Cloud-free |
2.2.2. Digital Elevation Model (DEM)
To ensure data consistency and facilitate subsequent analysis, the Copernicus Digital Elevation Model (DEM) released by the European Space Agency (ESA) (https://dataspace.copernicus.eu/) was adopted.
2.2.3. Meteorological Data
Meteorological data are mainly derived from observational records of various meteorological stations. The adopted meteorological data mainly include four core indicators as follows: annual average temperature, annual precipitation, annual extreme high temperature, and annual extreme low temperature. The study period ranges from 1994 to 2024, and the analysis is conducted at 10-year intervals.
Table 2.
Basic Information of Meteorological Stations in the Ebinur Lake Basin.
| Station No. | Station Name | Longitude | Latitude | Observation Site Elevation/m |
| 51232 | Alashankou | 82°35’E | 45°11’N | 366.3 |
| 51238 | Bole | 82°04’E | 44°54’N | 532.6 |
| 51330 | Wenquan | 81°01’E | 44°58’N | 1353.9 |
| 51334 | Jinghe | 82°54’E | 44°37’N | 329.4 |
| 51346 | Wusu | 84°40’E | 44°26’N | 478.3 |
2.2.4. Socio-Economic Data
Socio-economic data cover two key indicators (population and gross regional product) from 1994 to 2023 for regions in the basin, including Bortala Mongolian Autonomous Prefecture (encompassing Bole, Jinghe and Wenquan Counties), as well as Tuoli County, Wusu City and Kuitun City.
Data are sourced from:
Statistical Yearbook of Bortala Mongolian Autonomous Prefecture, Bureau of Statistics of Bortala Mongolian Autonomous Prefecture.
Statistical Yearbook of Xinjiang Uygur Autonomous Region, Bureau of Statistics of Xinjiang Uygur Autonomous Region.
2.3. Research Methods
2.3.1. S-R-P Model
The ecological ecotone theory was proposed by American ecologist Clement in the early 20th century[41], this theory continues to evolve into the study of ecological vulnerability[42]. Ecological vulnerability is driven by natural factors (such as terrain factors, climate factors, etc.) and human and social factors (such as land use, human activities, etc.), measure the sensitivity of the ecological environment in the study area to external interference.
The S-R-P model is a theoretical framework for comprehensive assessment of ecological vulnerability. It starts from the three key dimensions of sensitivity-resilience-pressure, comprehensively examine the impact of natural factors and human activities on the ecosystem[43]. The model integrates multi-dimensional indicators, revealed the internal formation mechanism of ecosystem vulnerability, it provides a scientific analysis tool for ecological protection and restoration.
2.3.2. Analytic Hierarchy Process (AHP)
Analytic hierarchy process decomposes complex decision-making problems into multiple hierarchical structures, builds a hierarchical model, a decision-making method that systematically analyzes decision-making problems and ultimately forms solutions. First formally proposed by American operations researcher Thomas L. Saaty in the mid-1990s, it is a systematic and hierarchical analysis method[44]. Typical manifestations and causes of ecological vulnerability in Ebinur Lake Basin, the weight of each index is determined by analytic hierarchy process.
2.3.3. Standardization of Evaluation Index
This study selected 12 evaluation factors, it aims to comprehensively and objectively reflect the ecological vulnerability of the study area. However, there are differences in the dimensions and attributes of these indicators. If it is directly used for ecological vulnerability assessment without treatment, it will make the results lack of accuracy and comparability. In this study, the range standardization method was used to standardize the data to the [0,1] interval. The formula is:
Positive indicators:
Negative indicators:
In formulas (1) and (2), denotes the standardized value of the i-th indicator, denotes the original value of the -th indicator, denotes the maximum value of the original data for the -th indicator, and denotes the minimum value of the original data for the -th indicator.
2.3.4. Ecological Vulnerability Index
After obtaining the weight of each indicator, linear weighted summation method was used to calculate the ecological vulnerability of Ebinur Lake wetland. The linear weighted summation method is a simple and effective comprehensive evaluation method. It multiplies the standardized value of each evaluation index by the corresponding weight, then adds all the products, thus, the comprehensive assessment value of ecological vulnerability is obtained, and its calculation formula is as follows:
In formula (3), EVI denotes the ecological vulnerability index, where a larger value indicates a higher degree of ecological vulnerability in the region; is the standardized value of the -th indicator, and is the weight of the -th indicator, as shown in Table 3.
2.3.5. Degree of Relief
Degree of relief is an important indicator for the classification of basic landform types[45]. It plays an important role in the study of geography and related fields. The formula is as follows:
In formula (4), R denotes degree of relief, denotes the maximum elevation within a unit area, and denotes the minimum elevation within a unit area.
2.3.6. Land Use and Land Cover Change
2.3.7. Normalized Difference Vegetation Index
The Normalized Difference Vegetation Index (NDVI) is an indirect indicator calculated based on the characteristics of vegetation reflection bands, which reflects the growth status, biomass and vegetation types of surface vegetation[46]. Its calculation formula is as follows:
In formula (5), NDVI denotes the Normalized Difference Vegetation Index, NIR denotes the reflected radiation intensity of the near-infrared band, and denotes the reflected radiation intensity of the red band.
2.3.8. Fractional Vegetation Cover
Fractional Vegetation Coverage (FVC) refers to the percentage of vegetation’s vertical projection area on the ground to the total area of the statistical region. This index can reflect the vegetation density, it can also reflect the size of the photosynthesis area of plants, it is an important basic data to describe the ecosystem. This index can effectively reduce the uncertainty caused by the spectral characteristics of non-vegetated areas and improve the analysis accuracy[47]. This research adopted the dimidiate pixel model to retrieve the fractional vegetation coverage (FVC) of the study area; the calculation formula is as follows:
In formula (6), denotes fractional vegetation coverage, denotes the NDVI value of bare soil, denotes the NDVI value of pure vegetation. In this study, the NDVI value for bare soil areas was selected as the value corresponding to the cumulative percentage of ≤ 0.05%, while that for pure vegetation areas was selected as the value corresponding to the cumulative percentage of ≥ 0.95%.
2.3.9. Spatial Autocorrelation Analysis
The first law of geography shows that everything is related to other things and the more adjacent things are, the closer the relationship is. Spatial autocorrelation is used to reflect whether the spatial data shows a trend of aggregation or dispersion, and the strength and significance of this trend.
Global spatial autocorrelation is used to quantitatively describe the similarity of attribute values of spatial units in the study area. Its essence is to statistically infer the spatial agglomeration characteristics of observation data through the spatial dependence constructed by the spatial weight matrix. The global Moran’s I is usually adopted as its indicator, and the calculation formula is as follows:
In formula (7), denotes the global Moran’s I, denotes the total number of spatial grids, is an element in the spatial weight matrix, and correspond to the ecological vulnerability index values of the i-th and j-th grids respectively, and represents the average value of the ecological vulnerability indices of all grids. The value range of the Moran’s I index is within the interval [[-1,1], and the spatial correlation states can be divided into three types (negative correlation, random distribution, and positive correlation) according to this value range.
Local Spatial Autocorrelation: Local spatial autocorrelation analysis can be used to further evaluate the local spatial similarity and difference between a certain region and its adjacent regions, thereby revealing spatial heterogeneity. Its calculation formula is as follows:
The meanings of all indicators in formula (8) are the same as those in formula (7).
2.3.10. Geodetector
Geodetector is a tool for detecting and utilizing spatial differentiation[48]. This method is based on the Second Law of Geography, and reveals the spatial distribution patterns of geographical phenomena and their influencing factors by comparing the variation degree of a certain attribute value across different spatial units.
Differentiation analysis and factor detection aim to explore the spatial differentiation characteristics of variable Y; meanwhile, they quantify the explanatory power of a specific factor X on the spatial differentiation of variable Y. The q-value is adopted herein as the evaluation indicator, and its calculation formula is as follows:
In formula (9), h denotes the stratification of variable Y or factor X. represents the number of units in the -th stratum, and denotes the total number of units in the entire study area. is the variance of Y values in the -th stratum, and is the variance of Y values across the entire area. The value range of q-value is [0,1]; the larger the q-value, the more obvious the spatial differentiation characteristics of Y. When stratification is based on independent variable X, a larger q-value indicates a stronger explanatory power of independent variable X on attribute Y; conversely, a smaller q-value indicates a weaker explanatory power. The main objective of interaction detection is to identify the interaction relationships between different risk factors. Based on the comparison of these q-values, the relationships between two factors can be classified into the following five types.
The main objective of interaction detection is to identify the interaction relationships between different risk factors. Based on the comparison of these q-values, the relationships between two factors can be categorized into the following five types.
Table 5.
Types of interactions between two independent variables on the dependent variable.
| Criterion | Interaction Type |
| q(X1∩X2)<Min(q(X1),q(X2)) | Nonlinear attenuation |
| Min(q(X1),q(X2))<q(X1∩X2)<Max(q(X1),q(X2)) | Single-factor nonlinear attenuation |
| q(X1∩X2)>Max(q(X1),q(X2)) | Bifactor enhancement |
| q(X1∩X2)=q(X1)+q(X2) | Independence |
| q(X1∩X2)>q(X1)+q(X2) | Nonlinear enhancement |
3. Results
3.1. Results of Ecological Vulnerability Assessment Factors in Ebinur Lake Basin
The 12 Factors of ecological vulnerability assessment in Ebinur Lake Basin have been normalized and normalized, all index data have been mapped to [0,1] dimensionless interval, both positive and negative indicators are transformed into a unified expression that the greater the value, the greater the ecological vulnerability, eliminate dimensional differences and indicator attribute conflicts. The following is the analysis of the results of ecological vulnerability assessment factors of Ebinur Lake Wetland.
The topography of Ebinur Lake Basin is significantly higher in the West and lower in the East. It is surrounded by mountains in the north, south and west, constituting the main framework of the basin. The East is connected with the Jungar basin plain. The mountainous areas in the West constitute the birthplace of the drainage system, the snow melt water and precipitation constitute the main supply of surface runoff; Ebinur Lake is the lowest depression in Junggar basin, becoming the catchment center of the basin, lacustrine plain and alluvial terrace are developed. The mountains in the central and western regions have large slopes, strong erosion forms deep valleys, the eastern alluvial plain has a small slope, the terrain is flat and open, forming a fertile irrigated agricultural area.
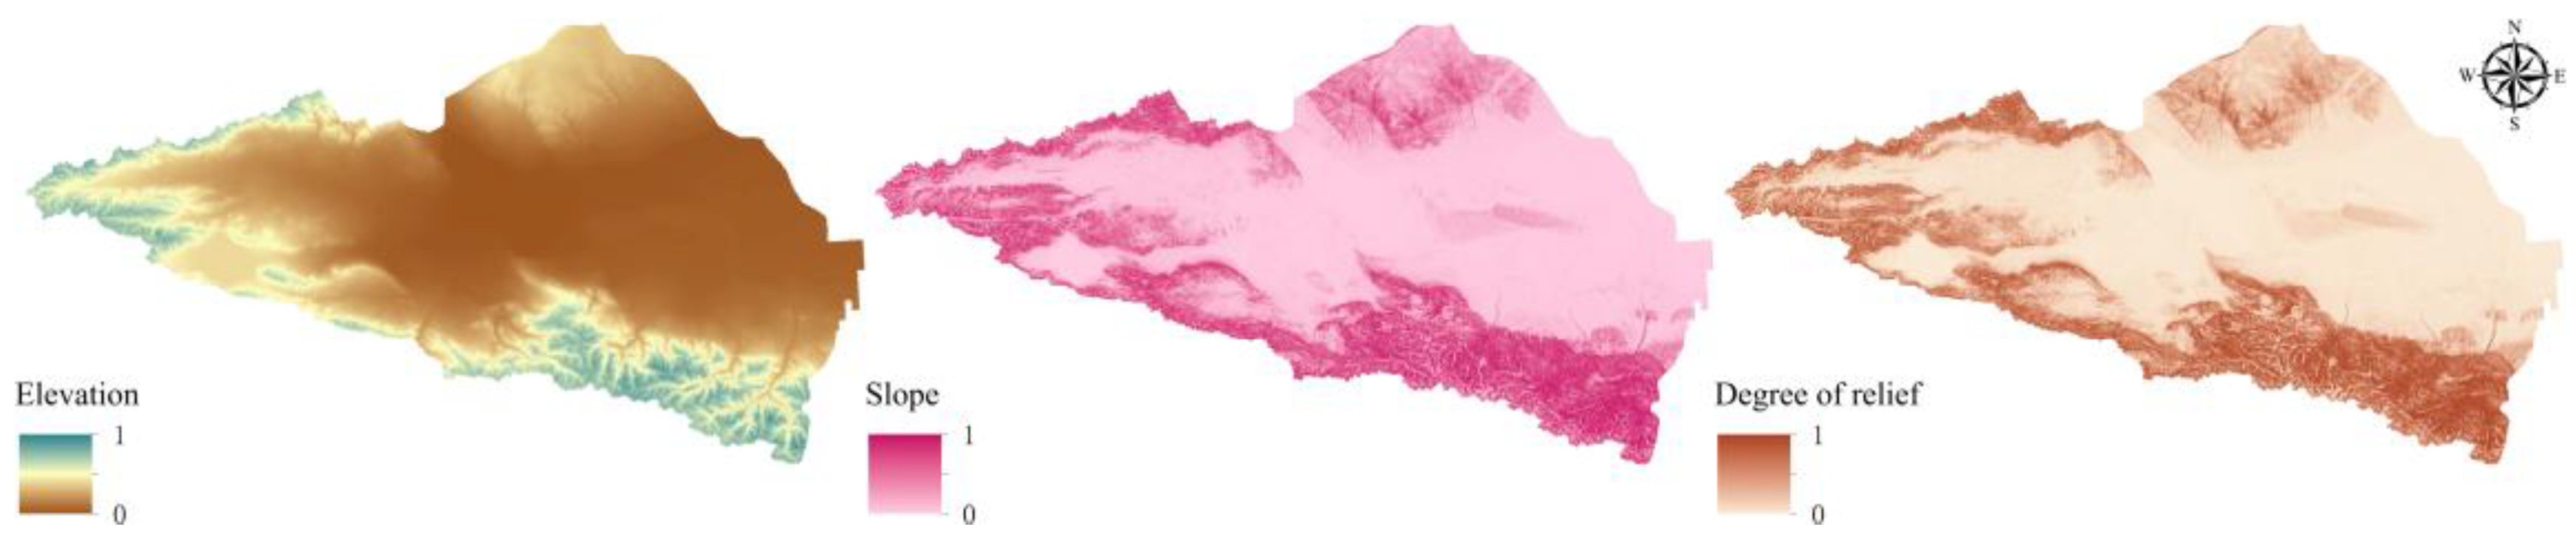
Figure 2.
Topographic Factors.
The annual average temperature is lower in the West and higher in the East. The temperature in the western and northern mountainous areas is relatively low, the temperature in the eastern and southern plains is higher. The annual precipitation is mainly concentrated in the plain, there is less rainfall in mountainous areas. This distribution pattern affects the distribution of water resources and ecosystem structure of the basin; extreme high temperature events are more frequent and serious in the Alataw pass and the eastern plain, threat to ecosystem and agricultural production; extreme low temperature events are also common in mountainous areas, which also have an important impact on the local ecosystem and human activities.
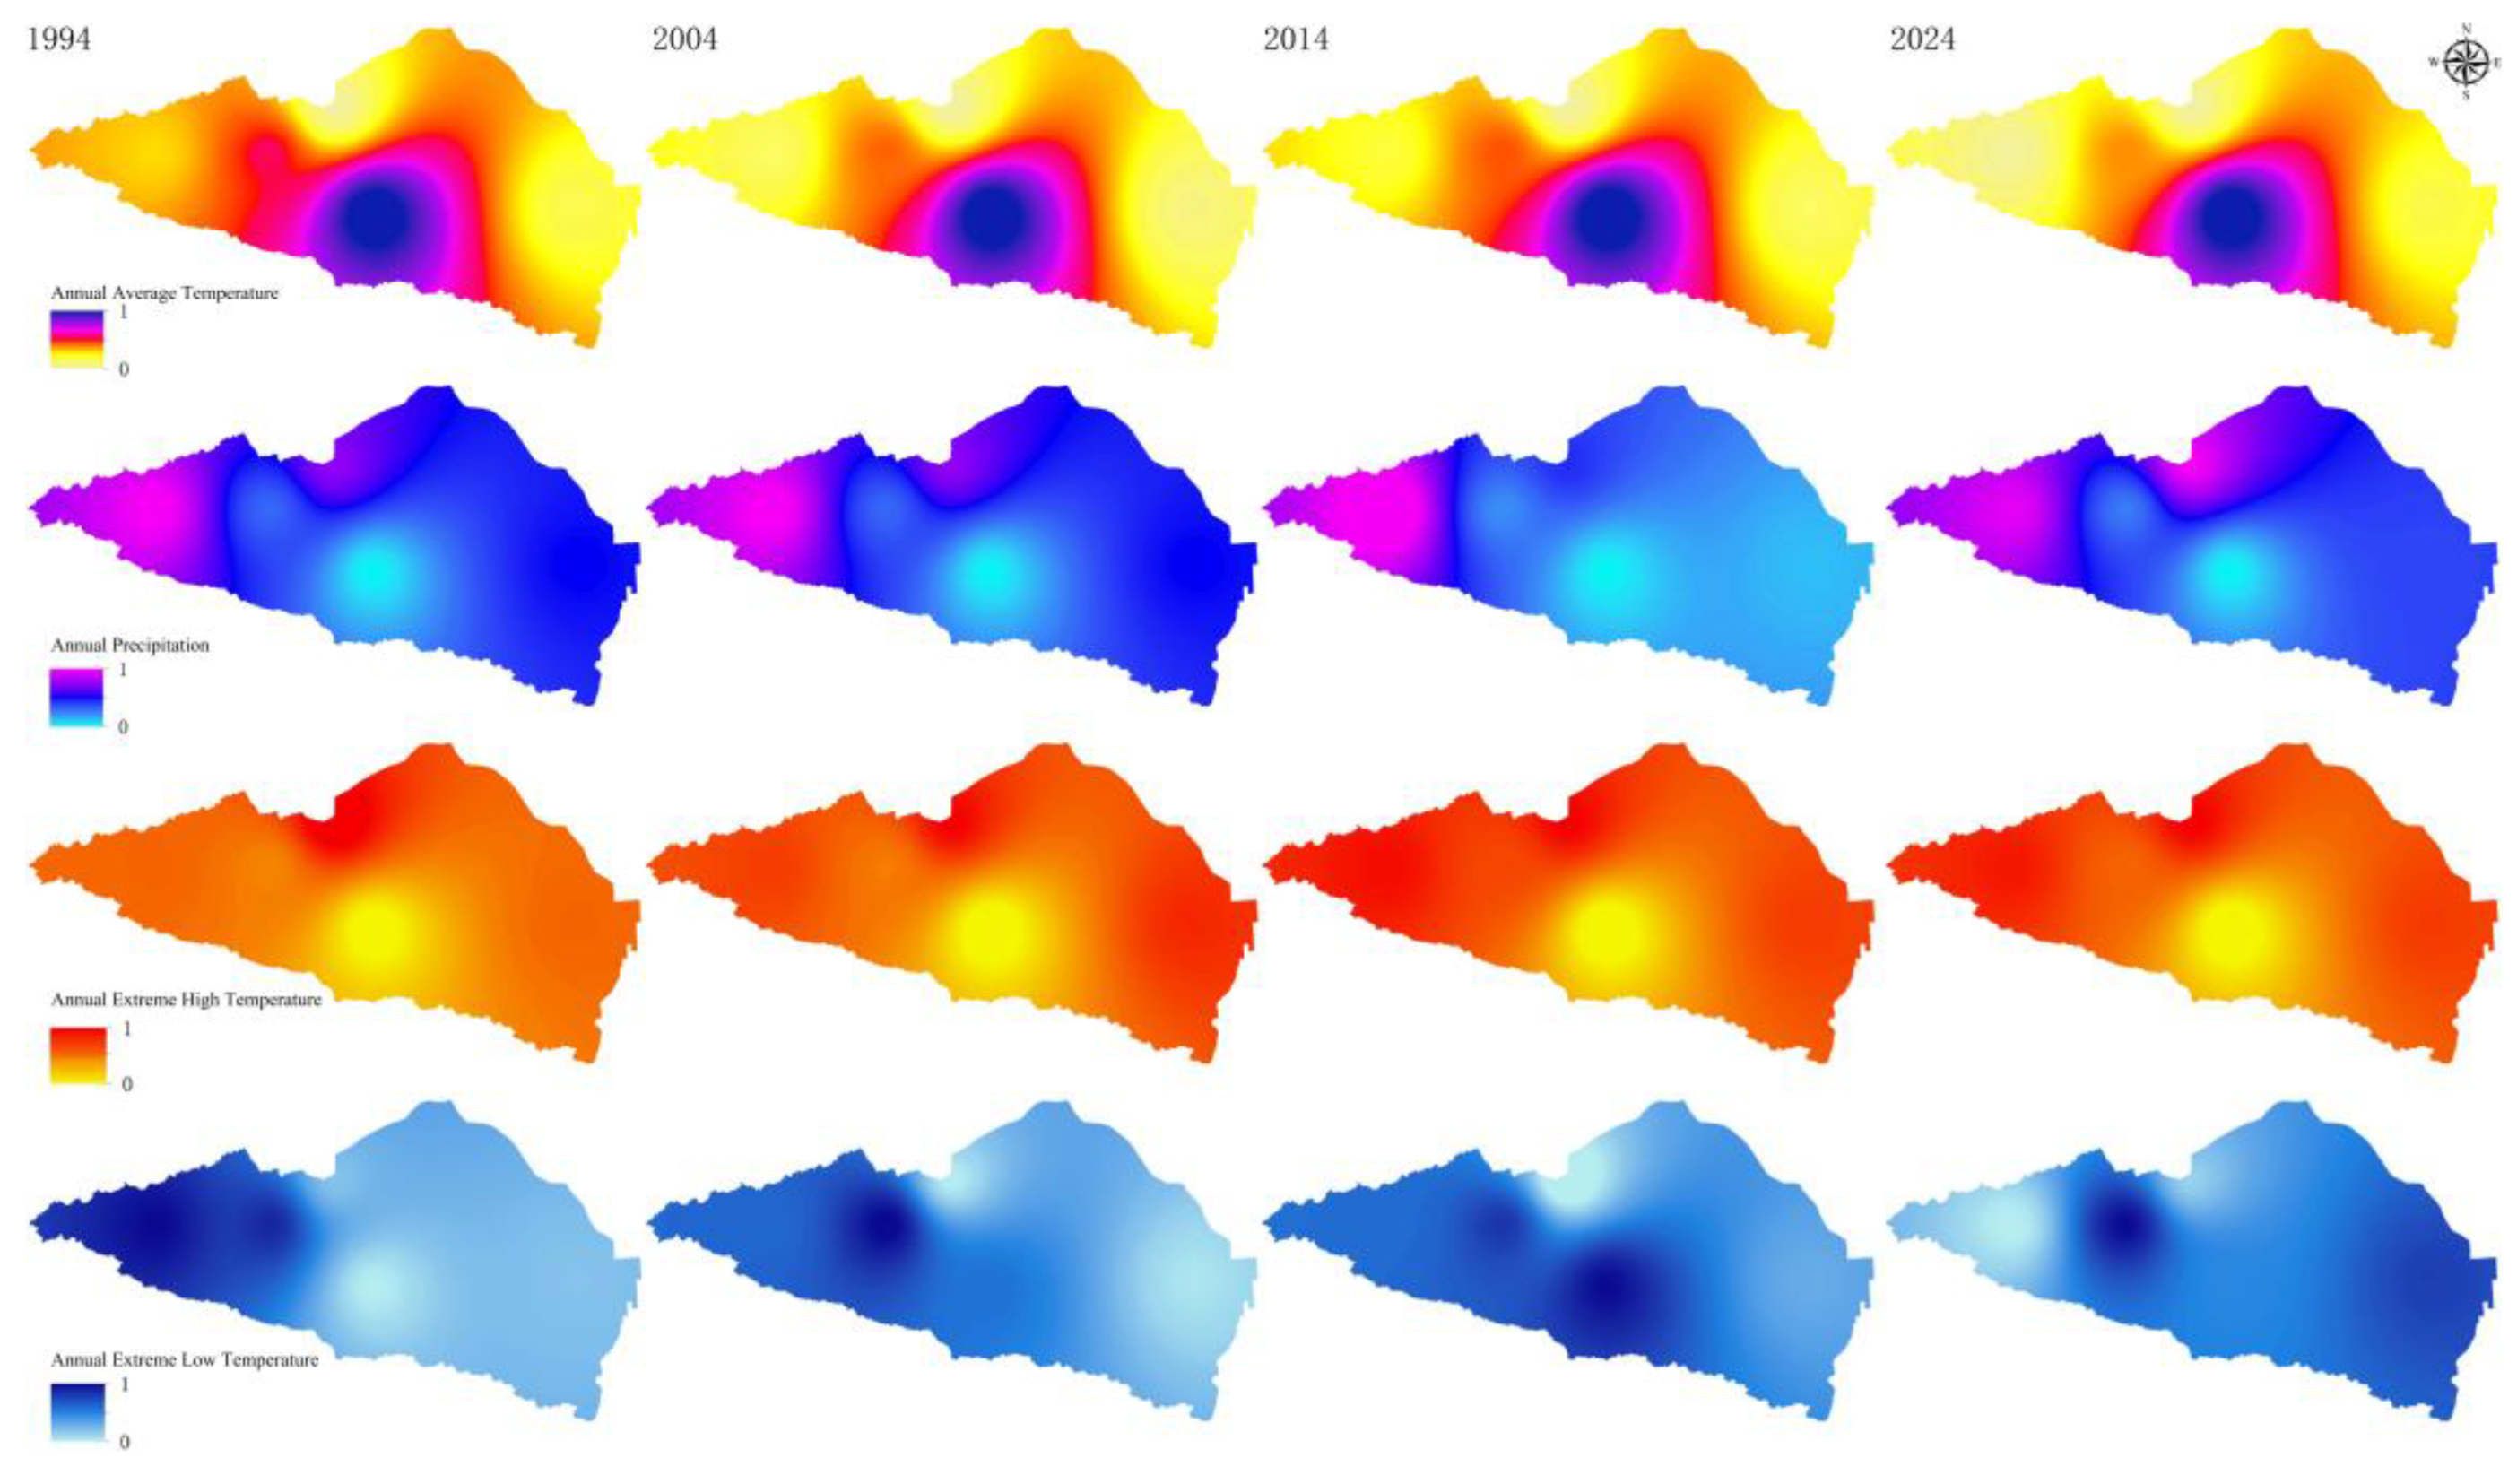
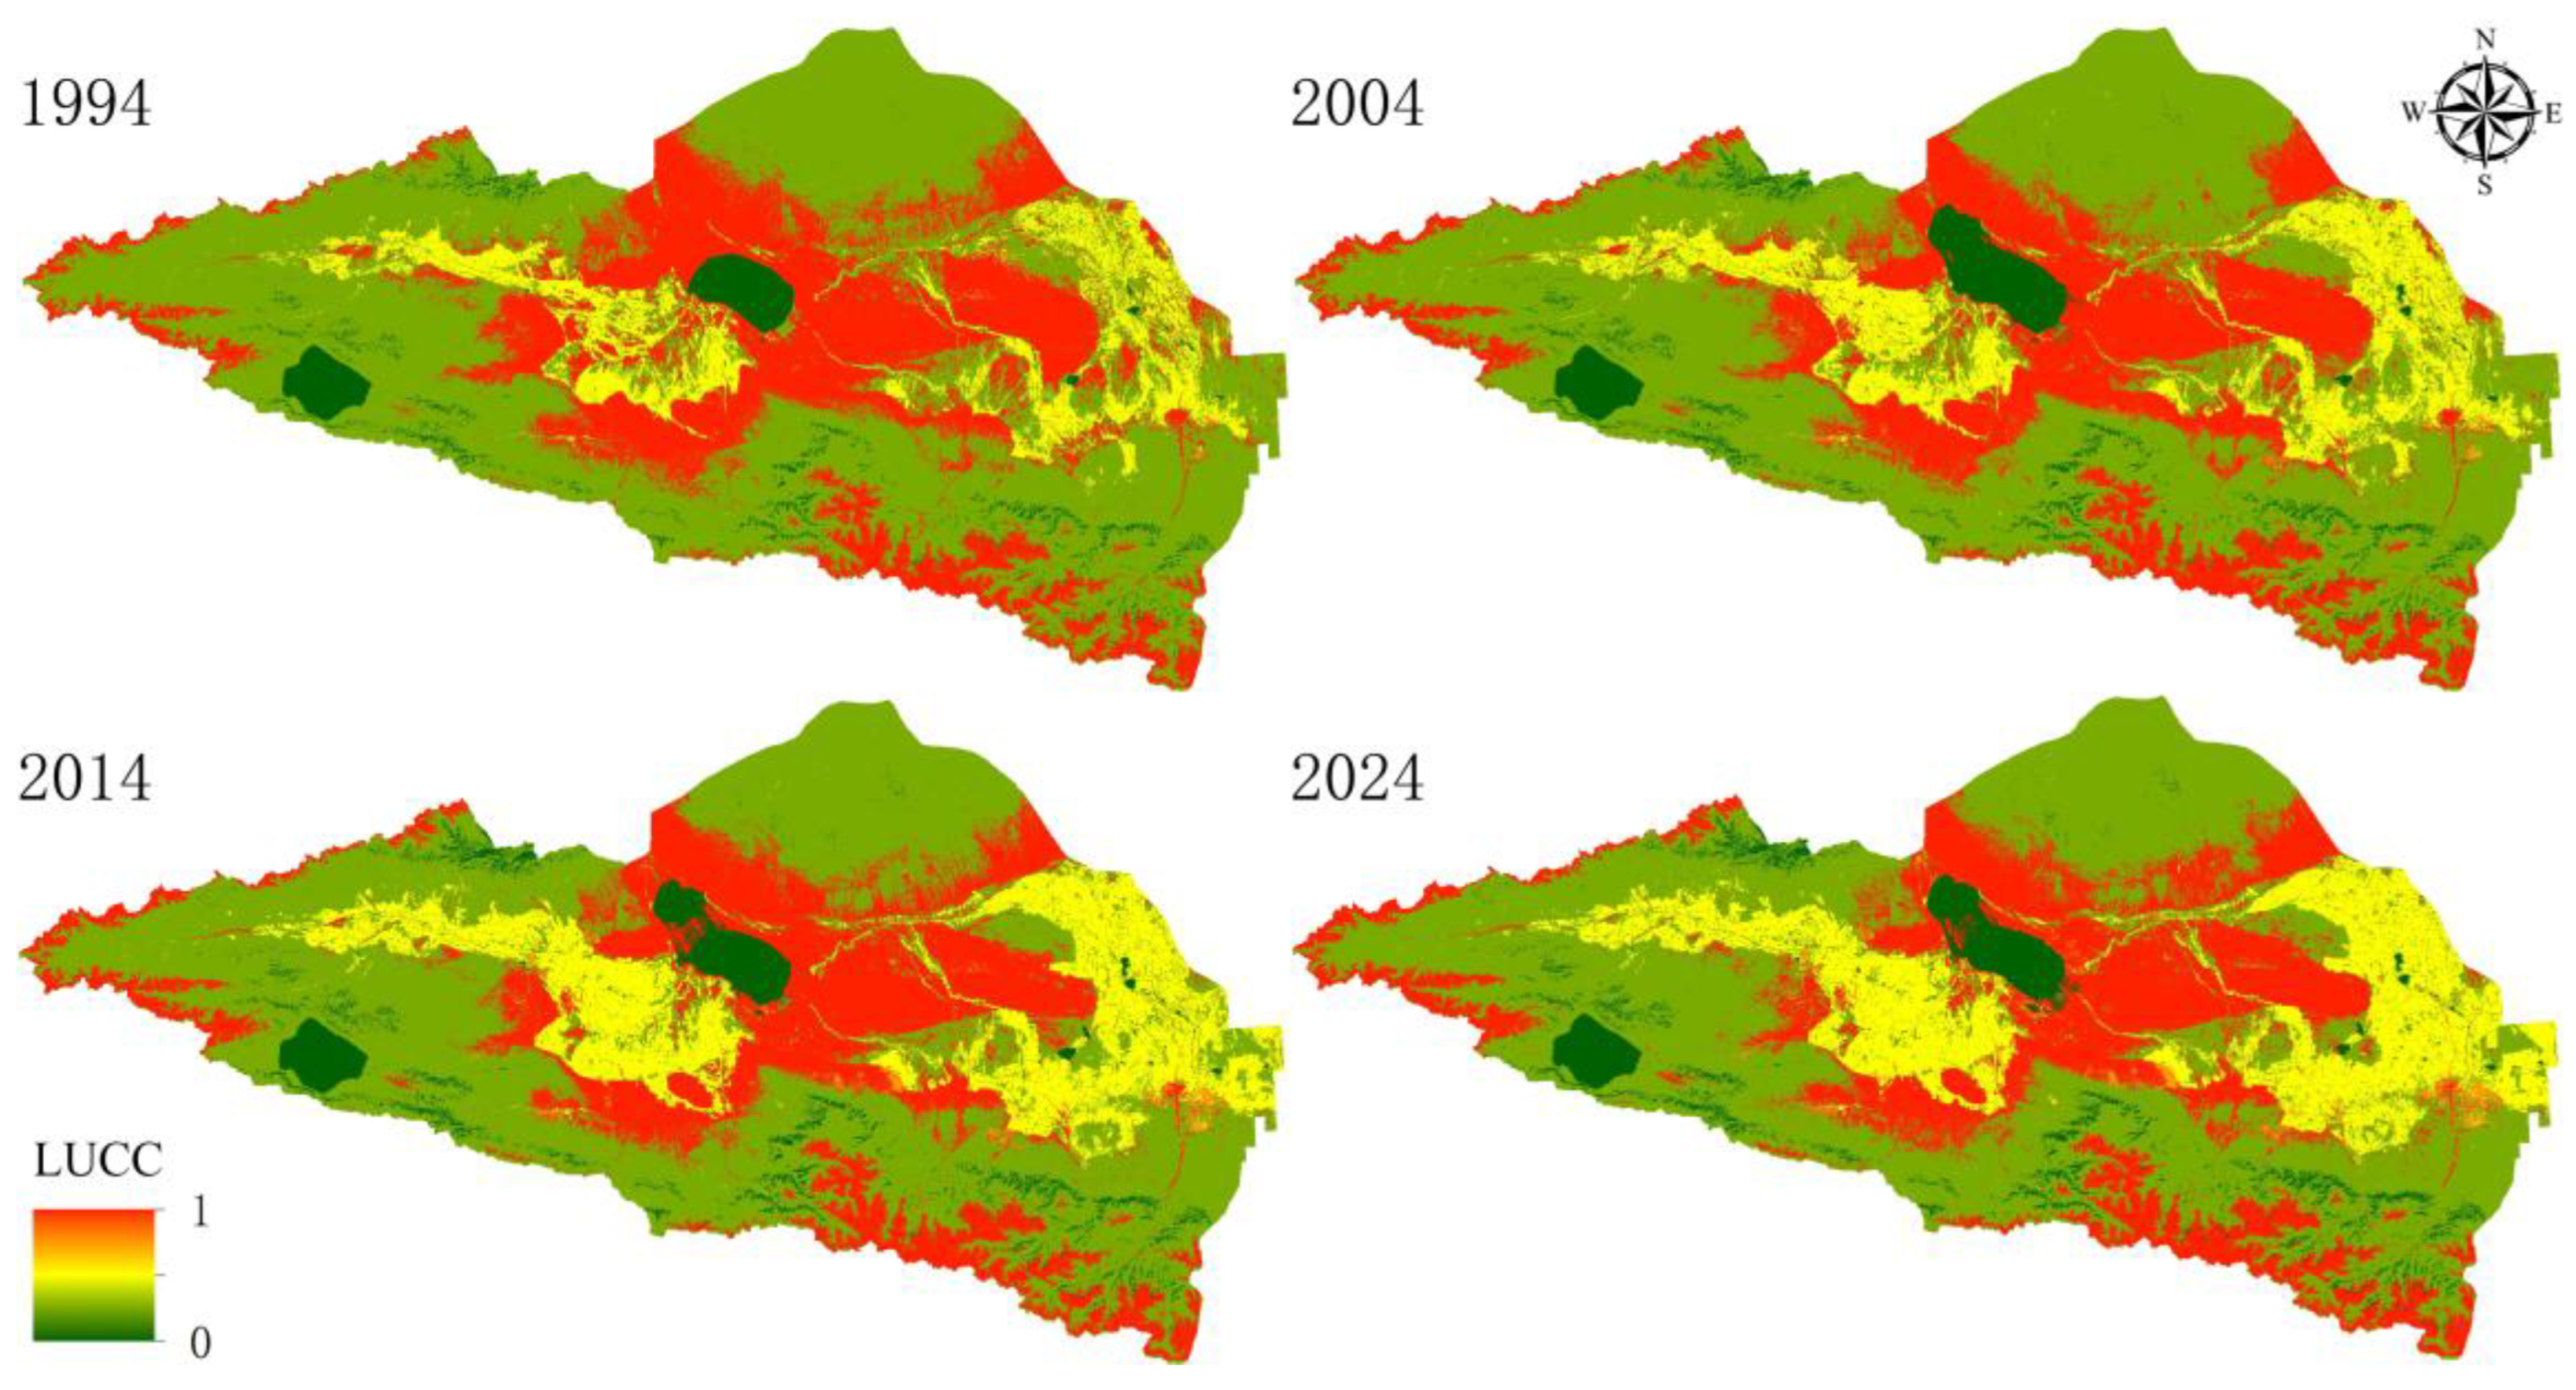
Figure 3.
Meteorological Factors.
Figure 4.
Surface Factors.
Cultivated land is mainly distributed in the Jinghe, Bortala River and Kuitun River basins, while grassland and forest land are primarily distributed near the mountains around the southern basin. Unused land is concentrated in the Gobi saline-alkali land around Ebinur Lake and the alpine glaciers in the southern mountains.
Figure 5 shows the vegetation factors. In the western and Northern high-altitude mountains, there are mainly sparse vegetation dominated by bare rock glaciers, the vegetation is scattered in island shape. The central alluvial fan shows the transition characteristics of woodland, grassland and shrub, the eastern plain presents a high coverage landscape with continuous distribution of cultivated land and plantation.
The distribution of population and GDP in Ebinur Lake Basin is characterized by concentrated river valleys and sparse mountainous deserts. The population density of the valley is 300-500 people/km². The cultivated land in the eastern plain is concentrated, but the population density is less than that in the river valley. The population density in high altitude mountainous areas and desert areas is extremely low. GDP distribution and population are highly coupled, but the degree of agglomeration is more significant.
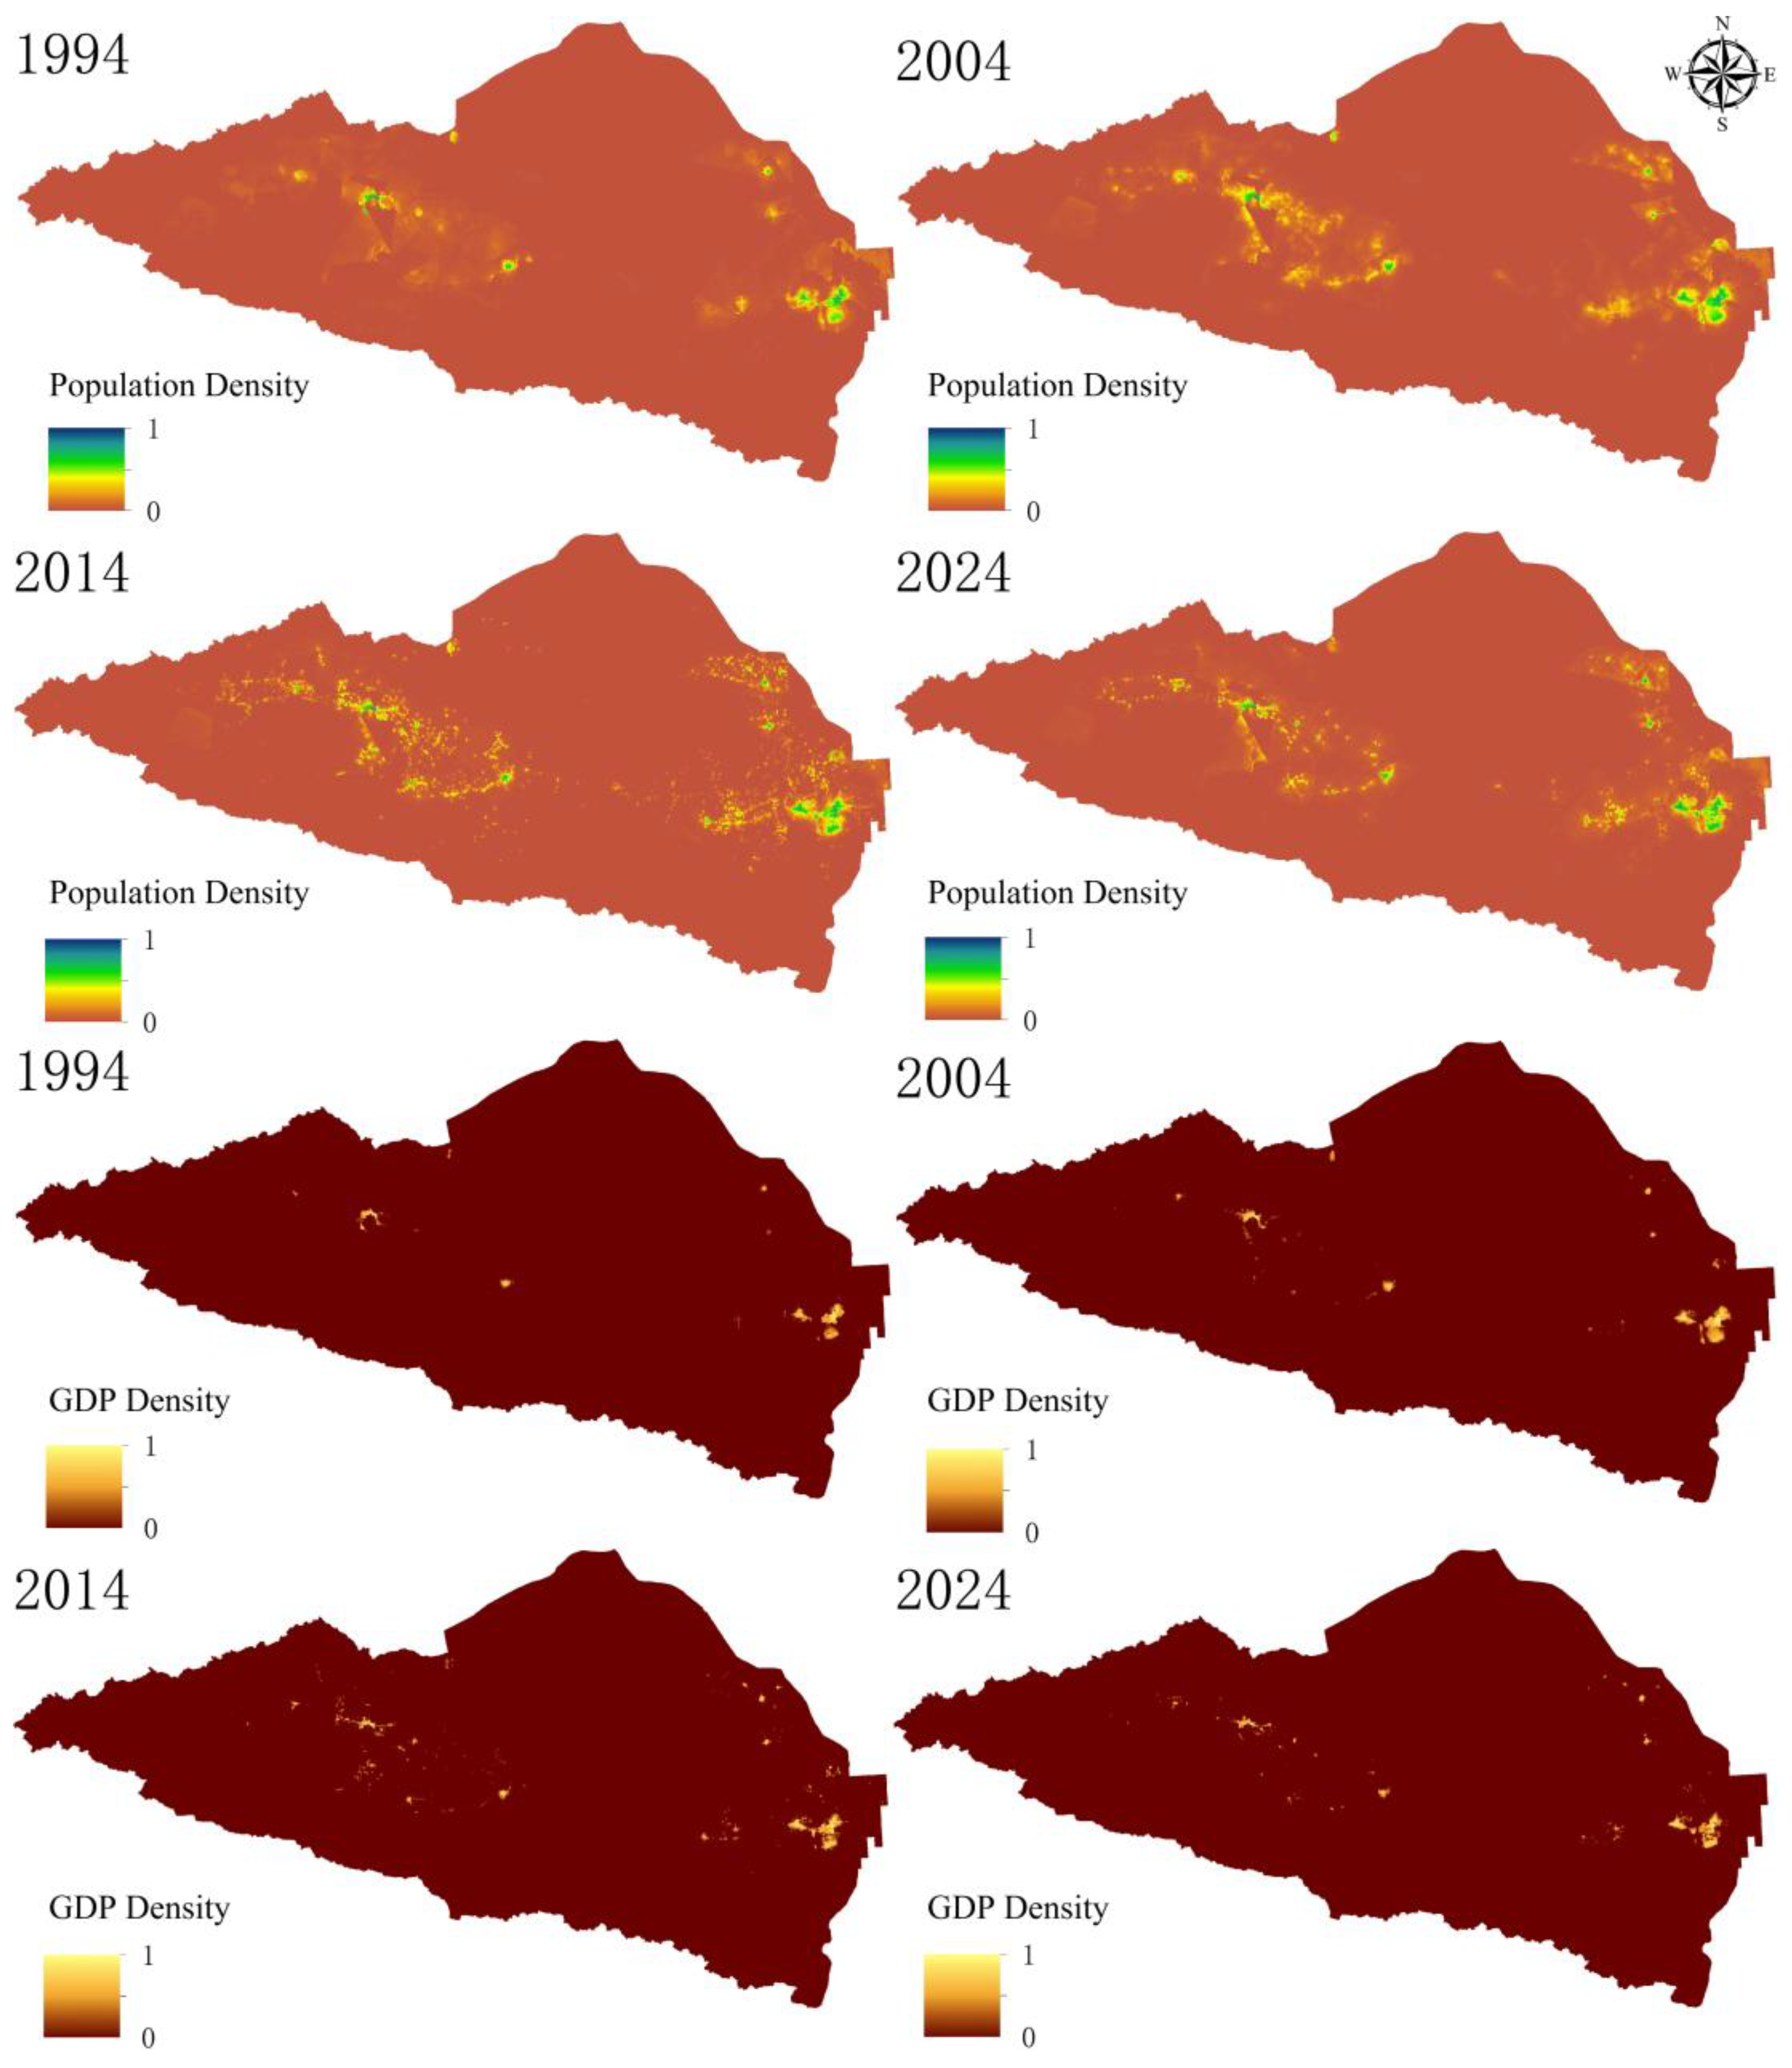
Figure 6.
Social Factors.
3.2. Results of Ecological Vulnerability Assessment in the Ebinur Lake Basin
3.2.1. Spatio-Temporal Variation Characteristics of Ecological Vulnerability
According to the complex ecological environment of Ebinur Lake Basin, selected 12 evaluation indicators. These indicators cover topography, climate, vegetation, land use and other aspects, and can comprehensively and objectively reflect the ecological status of Ebinur Lake Basin. By using the ecological vulnerability assessment method, the ecological vulnerability index (EVI) of the study area from 1994 to 2024 was calculated (Figure 7). A larger EVI value indicates a more fragile ecosystem in the region. Conversely, a smaller EVI value signifies stronger ecological stability, better environmental quality and healthier ecosystem conditions in the region.
There are great differences in ecological vulnerability in the whole study area. The ecological vulnerability index of Ebinur Lake Wetland ranges from 0.062186 (2014) to 0.690991 (1994), the spatial difference is significant. Using the natural breakpoint method, vulnerability is divided into five levels: slight vulnerability, mild vulnerability, moderate vulnerability, severe vulnerability and extreme vulnerability (Figure 8).
Through the statistics of ecological vulnerability level, it reveals the evolution law of regional ecological vulnerability. The area of severely vulnerable areas continued to shrink to 13242.39 square kilometers after reaching a peak of 14270.31 square kilometers in 2004, the proportion decreased by 2.15 percentage points. The area of micro vulnerable areas increased from 4777.61 square kilometers to 7681.21 square kilometers, the growth rate reached 60.8%, the proportion increased from 10.01% to 16.09%, it reflects the overall improvement of the quality of the regional ecological base. The area of moderately vulnerable areas increased against the trend after 2014, the proportion rose from 28.87% to 29.09%. From 1994 to 2024, the overall scale of ecologically fragile areas showed a decreasing trend, and the vulnerability of ecosystems was alleviated to some extent.
In terms of spatial distribution, the degree of ecological vulnerability in Ebinur Lake Basin shows significant differences in space. Moderate and mild vulnerable areas are mainly concentrated in Bole City and Jinghe County on the west side of Ebinur Lake. These areas are continuously affected by salinization and wind erosion from the bare lake bed. The ecology is relatively fragile. The slightly fragile areas are widely distributed in the woodland and farmland of alluvial proluvial fan in the low mountains and hills of Wenquan County, Tuoli County, Wusu city and Kuitun city. These regions are the core areas of socio-economic activities, it is also the area where human activities have the most significant impact on the ecological environment. The severely vulnerable areas are mainly distributed in the mountains at the boundary of Ebinur Lake Basin and the zone between the east of Ebinur Lake and ALA mountain pass. The region is ecologically fragile, lacking biodiversity, once the ecosystem is damaged, extremely difficult to recover. Ecological problems such as the decline of groundwater level caused by lake shrinkage, salinization caused by bare lake bed, vegetation degradation and grassland desertification are an important reason for it to become a highly vulnerable area.
3.2.2. Spatial Autocorrelation of Ecological Vulnerability
The global Moran’s I index in 1994, 2004, 2014 and 2024 were 0.756, 0.781, 0.807 and 0.804, respectively, the Z score is much higher than 2.58, and the corresponding p-values are all 0. There is a significant cluster phenomenon in the spatial distribution of ecological vulnerability. By calculating the local Moran index of Ebinur Lake Wetland ecological vulnerability index, cluster analysis was performed, in order to explore its spatial aggregation characteristics, and then reveal the spatial heterogeneity of the region.
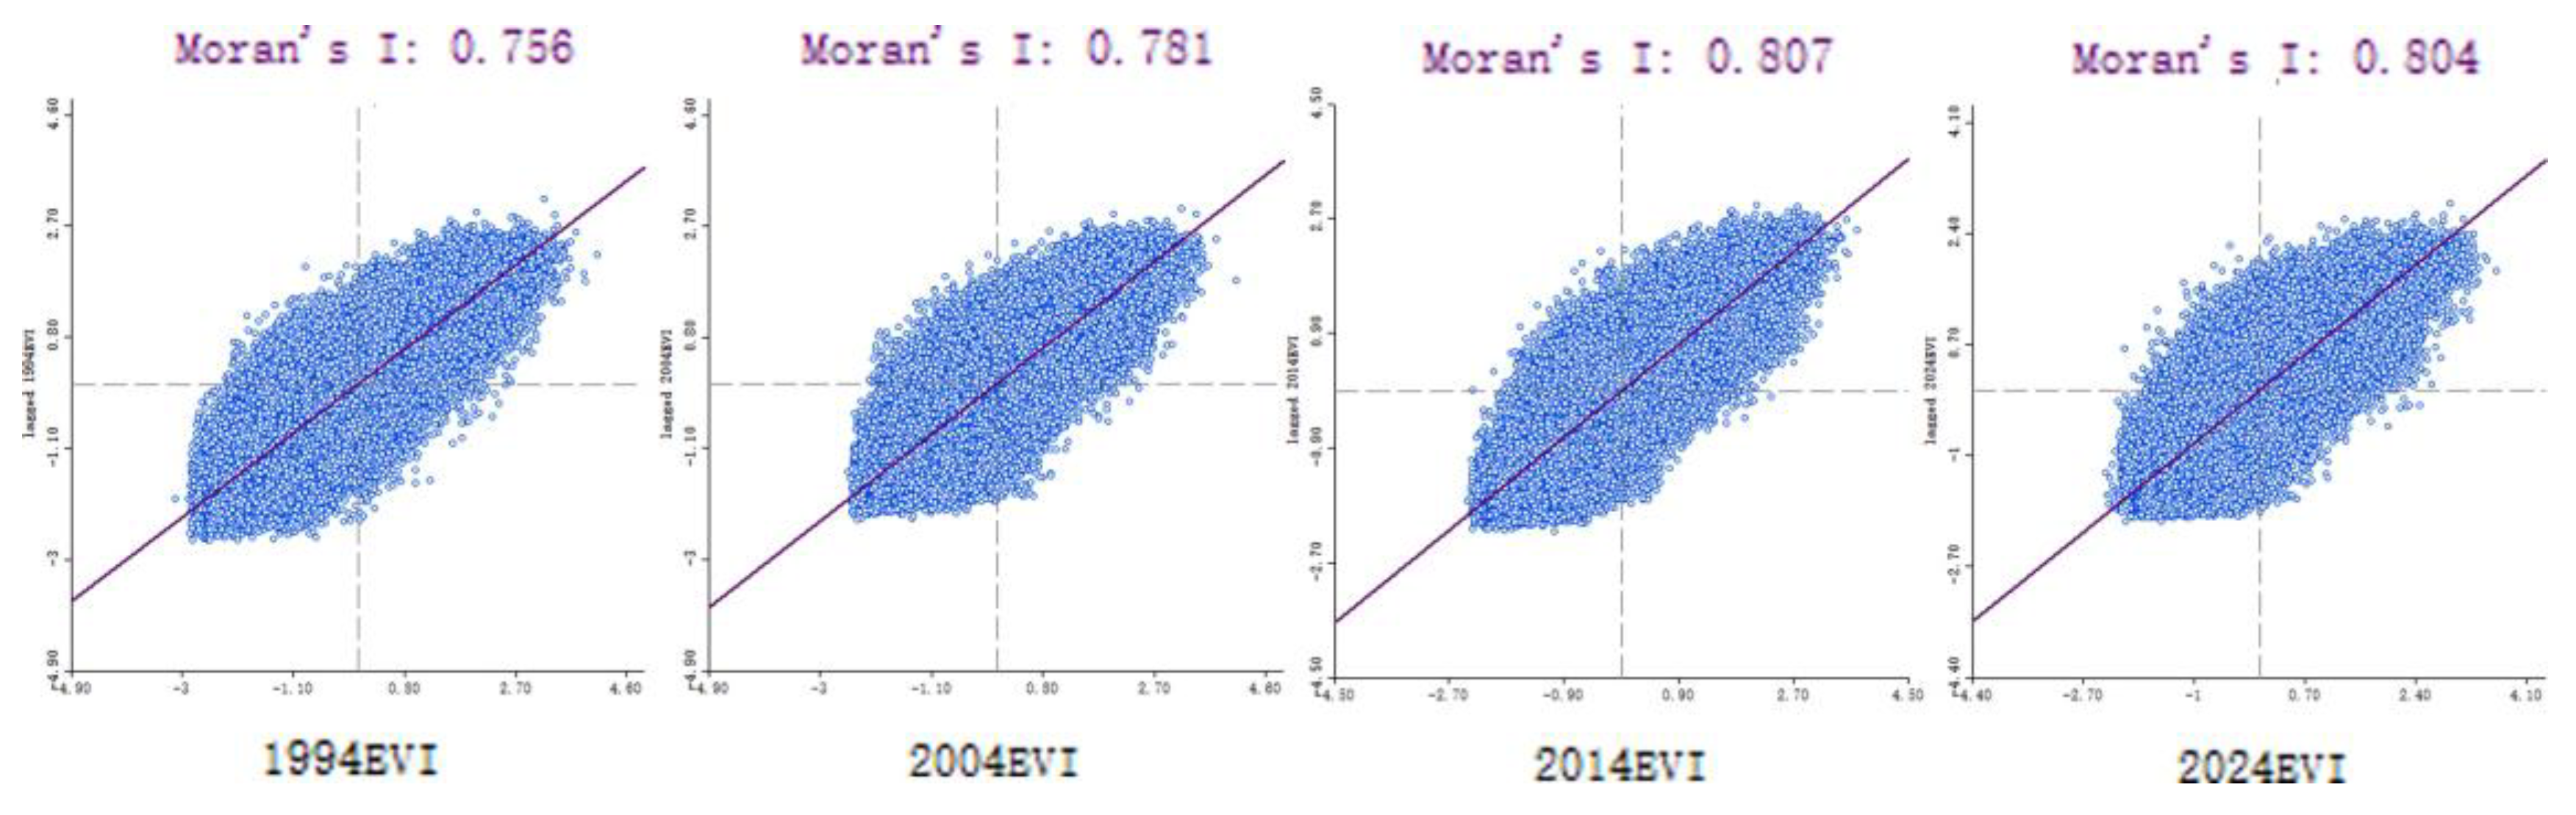
Figure 9.
Scatter Plot of Ecological Vulnerability of Ebinur Lake.
Figure 10 shows the Lisa cluster diagram of ecological vulnerability of Ebinur Lake Wetland. The “low-low” aggregation areas are concentrated near the cultivated land of the alluvial plain in the basin, the ecological vulnerability index of the region and its surrounding areas is at a low level, it reflects that the ecological environment quality of these regions is relatively good. The relatively stable land use mode of cultivated land and human farming activities makes the quality of the ecological environment in this area high. The “high-high” gathering area is mainly located in the mountainous and other high-altitude areas at the edge of the basin and the bare sandy land around Ebinur Lake. Most of these areas are bare lake beds, influenced by severe salinization and wind erosion caused by gale from Alataw pass, extremely fragile ecology.”Low high” discrete areas are mostly distributed around grassland and bare land on the edge of cultivated land. The ecological vulnerability index of these regions is relatively low, however, the ecological vulnerability index of adjacent grids is high. Facing high ecological risks, vulnerable to impact from surrounding high vulnerability areas. The “high low” discrete area is mainly located at the periphery of the “low low” accumulation area, and mostly concentrated in urban built-up areas. This shows that the ecological vulnerability index of urban built-up areas is high, while the ecological vulnerability index of its surrounding areas is low.
Figure 11 shows the cold and hot spots of Ebinur Lake Wetland ecological vulnerability. Cold and hot spot analysis can be used to further study the spatial clustering of high and low values, within the 90% and 95% confidence intervals. The cold hot spot is located in the vicinity of the cold hot spot determined by the 99% confidence interval.
3.3. Analysis on Driving Mechanism of Ecological Vulnerability in Ebinur Lake Basin
In order to further explore the interpretation of the spatial distribution of ecological vulnerability under the joint action of any two impact factors, we carried out factor interaction detection analysis. The interaction detector can not only identify whether there is interaction, it can also further evaluate the strength, direction and linear or non-linear relationship of this interaction. This is of great significance for understanding the interaction mechanism between variables.
The factor interaction detection analysis in this study reveals the two factor enhanced and nonlinear enhanced effects. As shown in Figure 12, during 1994, 2004, 2014 and 2020, the most significant impact on the ecological vulnerability index is the interaction between land use types, normalized difference vegetation index, vegetation coverage and topographic factors. The explanatory power q-values are all over 0.8. In addition, the factors with weak explanatory power and those with strong explanatory power show nonlinear interaction characteristics.
4. Discussion
4.1. Ecological Vulnerability Assessment of Ebinur Lake Basin
The ecological vulnerability assessment of Ebinur Lake Basin has established a comprehensive evaluation system based on 12 indicators, including topography, climate and vegetation. The evolution law of the regional ecological pattern is presented through the temporal and spatial dynamic analysis. The spatial differentiation of evi values in Ebinur Lake Basin is obvious. From 1994 to 2024, the corresponding evi values of lake wetlands ranged from 0.06 to 0.69; after the area of severely vulnerable areas reached its peak in 2004, the area continues to decrease, the area of micro fragile areas has increased by 60.8% in 30 years, the ecological quality has been improved. Spatially, the moderate ecological fragile area and the mild ecological fragile area are distributed in Bole City, Jinghe County and other areas under salinization and wind erosion stress; micro ecological fragile areas are spatially distributed in low mountains, hills and cultivated land such as Wenquan County and Tuoli County; severe ecological fragile zones are distributed in the mountains at the boundary of the basin and the Alashankou area, the lake surface shrinkage causes the water level of the lake basin to fall below the groundwater level, salinization and vegetation degradation. The global Moran’s I index (0.756-0.807) shows that ecological vulnerability has a significant spatial positive correlation. We can see from the results of Lisa clustering analysis, the low-low concentration area is mainly located on the alluvial plain, it is also a concentrated distribution area of cultivated land; Most of the high-high concentration areas are located in mountainous and bare plateau sandy areas; while the low-high discrete areas are mostly distributed on the edge of cultivated land, and relatively fragmented; the high-low discrete area mainly surrounds the urban built-up area. Cold and hot spot analysis revealed that cold and hot spot areas under 99% confidence level had spatial adjacency characteristics, which verified the conclusions of LISA cluster analysis.
4.2. Driving Mechanism of Ecological Vulnerability
With the help of interactive detection analysis, the influencing factors and interaction mechanism of ecological vulnerability in Ebinur Lake Basin were explored. Factor interaction detection reveals the two factor and nonlinear enhancement effect, the interaction between factors has more impact on ecological vulnerability than single effect, driving its change. In specific years, the interactions between LUCC, NDVI, FVC and topographic factors had significant impacts on ecological vulnerability with q-values exceeding 0.8, and most interactions between low-explanatory and high-explanatory factors exhibited nonlinear characteristics.
4.3. Prospects
This study conducted a systematic assessment and analysis of the ecological vulnerability of Ebinur Lake Wetland. It enriches the theoretical framework for the study of ecological vulnerability of lakes and wetlands in arid areas, it provides scientific support for the ecological protection and sustainable development of Ebinur Lake Basin. Future research should further explore the construction of a more refined and dynamic ecological vulnerability assessment index system, so as to more accurately reflect the ecological situation of Ebinur Lake Basin. It is necessary to study the complex interaction mechanism between these factors, focusing on the interaction between natural factors and socio-economic factors, and the way of their joint influence on the evolution of ecological vulnerability. At the same time, in the process of policy making, the ecological vulnerability characteristics of Ebinur Lake Basin should be fully considered, formulate scientific and rational ecological protection policies and measures, and we should also pay attention to regional collaborative governance, strengthen cross-sectoral and cross-regional cooperation, jointly promote the improvement of the ecological environment in the Ebinur Lake Basin, realize the coordinated development of regional ecological security and social economy.
Author Contributions
Conceptualization, Liu Mingyu and Xuan Junwei; Methodology, Liu Mingyu and Xuan Junwei; Software, Liu Mingyu; Validation, Liu Mingyu, Xuan Junwei and Gu Jinzhi; Formal Analysis, Liu Mingyu; Investigation, Liu Mingyu; Resources, Liu Mingyu; Data Curation, Liu Mingyu; Writing-Original Draft Preparation, Liu Mingyu; Writing-Review and Editing, Liu Mingyu, Xuan Junwei and Gu Jinzhi; Supervision, Xuan Junwei and Gu Jinzhi; Project Administration, Xuan Junwei and Gu Jinzhi; Funding Acquisition, Xuan Junwei and Gu Jinzhi. All authors have read and agreed to the published version of the manuscript. For term explanations, please refer to the CRediT taxonomy. Authorship is limited to those who have made substantial contributions to the work reported.
Funding
Please add: Sponsored by special found of Xinjiang Key Laboratory of Soil and Plant Ecological Processes, grant number:23XJTRZW01.
Conflicts of Interest
The authors declare no conflicts of interest.
Abbreviations
The following abbreviations are used in this manuscript:
| LUCC | Land Use and Land Cover Change |
| NDVI | Normalized Difference Vegetation Index |
| FVC | Fractional Vegetation Cover |
| EVI | Ecological Vulnerability Index |
References
- Yu, W.; Ji, R.; Han, X.; et al. Evaluation of the biodiversity conservation function in Liaohe Delta Wetland, Northeastern China. Journal of Meteorological Research. 2020, 34(4), 798–805. [CrossRef]
- Erwin, K. L. Wetlands and global climate change: The role of wetland restoration in a changing world. Wetlands Ecology and Management. 2009, 17, 71–84. [CrossRef]
- Grenfell, S.; Grenfell, M.; Tooth, S.; et al. Wetlands in drylands: Diverse perspectives for dynamic landscapes. Wetlands Ecology and Management. 2022, 30, 607–622. [CrossRef]
- Li, Q.; Yu, B.; Wu, Z.; et al. Vulnerability assessment of urban remnant mountain ecosystems based on ecological sensitivity and ecosystem services. Ecological Indicators. 2023, 151.
- Das, Uttam; Behera, Bhagirath. Geospatial assessment of ecological vulnerability of fragile Eastern Duars Forest integrating GIS-based AHP, CRITIC and AHP-TOPSIS models. Geomatics Natural Hazards & Risk. 2024, 24. [CrossRef]
- Zhang, HX; Song, Q; Wang, SR; et al. Spatiotemporal coupling of ecological vulnerability and economic comprehensive level in the source area of the Yellow River in China based on remote sensing, GIS and AHP-CRITIC. Geomatics Natural Hazards & Risk. 2025, 25. [CrossRef]
- Liu, GJ; Wang, JL; Li, SH; et al. Dynamic Evaluation of Ecological Vulnerability in a Lake Watershed Based on RS and GIS Technology. Polish Journal of Environmental Studies. 2019, 14. [CrossRef]
- Xu, ZY; Wu, B; Aili, A; et al. Hydrogeological Dynamics, Salinization Risk and Ecological Vulnerability in an Arid Inland River Basin. Water Air and Soil Poullution. 2025, 19.
- Zhang, X; Zhang, CC; Chen, X;et al. Evaluation of the vulnerability of Huanghe estuary coastal wetlands to marine oil spill stress. Frontiers in Marine Science. 2024, 10.
- Polat, R., Yakhshimurad, K., Viktor, S., et al.Applying the ELSA Framework to assess ecosystem vulnerability in wetlands of the Aral Sea Region. E3S Web of Conferences. 2024, 590.
- Zhang, J. F. & Sun, Q. X. Causes of wetland degradation and ecological restoration in the Yellow River Delta Region. Forestry Studies in China.2005, 7(2), 15–18. [CrossRef]
- Yang, LA; Zhang, SM; Yin, L; et al. Global occupation of wetland by artificial impervious surface area expansion and its impact on ecosystem service value for 2001-2018.Ecologal Indicators. 2022, 12. [CrossRef]
- Dawuda, UK; Yonghong, C; Al-Masnay, YA; et al. Assessment of wetland loss through industrialization and community expansion: a case study of the greater amanzule wetland in the Ellembelle district of Ghana. Fromtiers in Environmental Science. 2024, 17. [CrossRef]
- Wu, XL; Bu, XY; Dong, SC; et al. The Impact of Restoration and Protection Based on Sustainable Development Goals on Urban Wetland Health: A Case of Yinchuan Plain Urban Wetland Ecosystem, Ningxia, China. Sustainability. 2023, 19. [CrossRef]
- Xu, EQ; Chen, YM. Modeling Intersecting Processes of Wetland Shrinkage and Urban Expansion by a Time-Varying Methodology. Sustainability. 2019, 24. [CrossRef]
- Xu, M. N.; Huang, X. C.; Li, J. J.; et al. Assessing the ecological risk and its driving forces on islands using the Pressure-State-Response model. Scientific Reports. 2025, 15(1), 23162. [CrossRef]
- Cui, XX; Guo, L; Zhang, XQ; et al. Correlation Analysis of Wetland Pattern Changes and Groundwater in Kaifeng Downstream of the Yellow River, China. Water. 2025, 15.
- Wang, XL; Xu, HL; Liu, K; et al. Ecological water conveyance-driven wetland hydrological connectivity and morphological changes in arid regions: An analysis of the Taitema Lake wetland. Journal of Environmental Management. 2025, 13. [CrossRef]
- Zhou, TY; Shu, LC; Lu, CP; et al. Attenuation of the contribution of groundwater to a wetland caused by groundwater overexploitation. Hydrological Processes. 2023, 13.
- Hu, BT; Zhang, GX; Sun, JX; et al. Construction and application of an eco-hydrological model for assessing watershed wetland water storage capacity. Science China-Earth Sciences. 2025, 15. [CrossRef]
- Bing, G.; Yi, Z.; Jinfeng, Z.; et al. Spatial patterns of ecosystem vulnerability changes during 2001–2011 in the three-river source region of the Qinghai-Tibetan Plateau, China. Journal of Arid Land. 2016, 8(1), 23–35.
- Ford, H; Garbutt, A; Ladd, C; et al. Soil stabilization linked to plant diversity and environmental context in coastal wetlands. Journal of Vegetation Science. 2016. [CrossRef]
- Liu, Y. Analysis and protection & utilization of ecological vulnerability of Hengshui Lake Wetland (Master’s thesis). Hebei Normal University, 2016.
- Shen, Y. Evaluation of ecological vulnerability and its restoration and reconstruction of wetland in Dongting Lake Area (Master’s thesis). Hunan Normal University, 2006.
- Hua, Y. Z. Evolution characteristics and vulnerability assessment of Dianchi Lake ecosystem (Master’s thesis). Suzhou University of Science and Technology, 2020.
- Zhao, Y. Evaluation and regionalization of ecological vulnerability in Central Asia (Master’s thesis). Beijing Forestry University, 2019.
- Ippolito, A.; Sala, S.; Faber, J. H.; (2009). Ecological vulnerability analysis: A river basin case study. Science of the Total Environment, 407(18), 5047–5056. [CrossRef]
- Zhao, Y. Z.; Zou, X. Y.; Cheng, H.; Jia, H. K.; Wu, Y. Q.; Wang, G. Y.; Zhang, C. L. & Gao, S. Y. (2006). Assessing the ecological security of the Tibetan plateau: Methodology and a case study for Lhaze County. Journal of Environmental Management, 81(2), 149–161. [CrossRef]
- Sun, Y. X.; Wu, G. H.; Mao, M. J.; et al. (2023). Remote sensing and environmental assessment of wetland ecological degradation in the Small Sanjiang Plain, Northeast China. Frontiers in Ecology and Evolution, 11. [CrossRef]
- Bai, D. X.; Liu, C. S.; Ma, A. J.; et al. (2020). Impacts of multi-purpose reservoir construction, land-use change and climate change on runoff characteristics in the Poyang Lake basin, China. Journal of Hydrology: Regional Studies, 29, 100694.
- Li, L. W.; Liu, Z.; Bai, Y. L. & Sheng, J. (2018). Environmental vulnerability evaluation of Yellow River Delta coast based on AHP-CVI technology. Ecology and Environmental Sciences, 27, 297–303.
- Bai, X.; Jin, H. L.; Ren, J. L.; et al. (2009). Study on evaluation index system of ecosystem health of Ebinur Lake Wetland in Xinjiang based on PSR model. Wetland Science and Management, 5(3), 16–20.
- Yan, S. Environmental evolution and countermeasures of Ebinur Lake and its surrounding areas. Journal of Arid Land Resources and Environment. 1996, 10(1), 30–37.
- Liu, S. Y. Diagnosis and analysis of ecological environment health in Ebinur Lake Basin based on spatial information technology (Master’s thesis). Urumqi, Xinjiang University,2020.
- Su, Y. J.; Zhang, Z. H.; & Bao, A. M. Deterioration of ecological environment in Ebinur Lake and its prevention and control countermeasures. Arid Land Geography. 2002, 25(2), 143–148.
- Zhang, Y.; Zhang, F.; Wang, J.; et al. Spatiotemporal dynamics of ecological disturbance degree and landscape pattern changes in Ebinur Lake Wetland Nature Reserve in recent 40 years. Acta Ecologica Sinica. 2017, 37(21), 7082–7097.
- Xie, Z. Y.; Li, W. H.; Xie, Z. J.; et al. Evaluation of ecosystem service function value in Ebinur Lake Wetland Nature Reserve. Arid Land Geography. 2011, 34(3), 532–54.
- Li, Y. H.; Chu, X. Z.; & Jin, H. L. Analysis of hydrological characteristics in Ebinur Lake Basin of Xinjiang. Hydrology. 2006, 26(5), 68–71.
- Bai, X. Study on ecological vulnerability and its driving mechanism of Ebinur Lake wetland in Xinjiang (Doctoral thesis). Shanghai, East China Normal University, 2010.
- Yang, Q.; He, Q.; Li, H. J.; et al. Research on change trend and mutation of dust climate in Ebinur Lake Basin. Journal of Desert Research. 2003, 23(5), 27–32.
- Nelson, R.; Kokic, P.; Crimp, S.; et al. (2010). The vulnerability of Australian rural communities to climate variability and change: Part I - integrating impacts with adaptive capacity. Environmental Science & Policy, 13(1), 18–27. [CrossRef]
- Bradley, M. P.; & Smith, E. Using science to assess environmental vulnerabilities. Environmental Monitoring and Assessment. 2004, 94(1–3), 1–7. [CrossRef]
- Qiao, Q.; Gao, J. X.; Wang, W.; et al. Comprehensive evaluation method and application of ecological vulnerability. Research of Environmental Sciences. 2008, 21(5), 117–123.
- Saaty, T. L.; & Vargas, L. G. Diagnosis with dependent symptoms: Bayes theorem and the analytic hierarchy process. Operations Research. 1998, 46(4), 454–467. [CrossRef]
- Feng, Z. M.; Tang, Y.; Yang, Y. Z.; et al. Topographic relief of China and its correlation with population distribution. Acta Geographica Sinica. 2007, 62(10), 1073–1082.
- Sun, H. Y.; Wang, C. Y.; Niu, Z.; et al. Changes of surface vegetation coverage in China and its relationship with climatic factors: Based on NOAA time series data analysis. Journal of Remote Sensing. 1998, 2(3), 204–210.
- Zhang, K.; Lü, Y. H.; Fu, B. J.; et al. Effects of vegetation coverage changes on ecosystem services and their thresholds in the Loess Plateau. Acta Geographica Sinica. 2020, 75(5), 949–960.
- Wang, J. F.; Li, X. H.; Christakos, G.; Liao, Y. L.; Zhang, T.; & Gu, X. Geographical detectors-based health risk assessment and its application in the neural tube defects study of the Heshun Region, China. International Journal of Geographical Information Science. 2010, 24(1), 107–127. [CrossRef]
Figure 5.
Vegetation Factors.
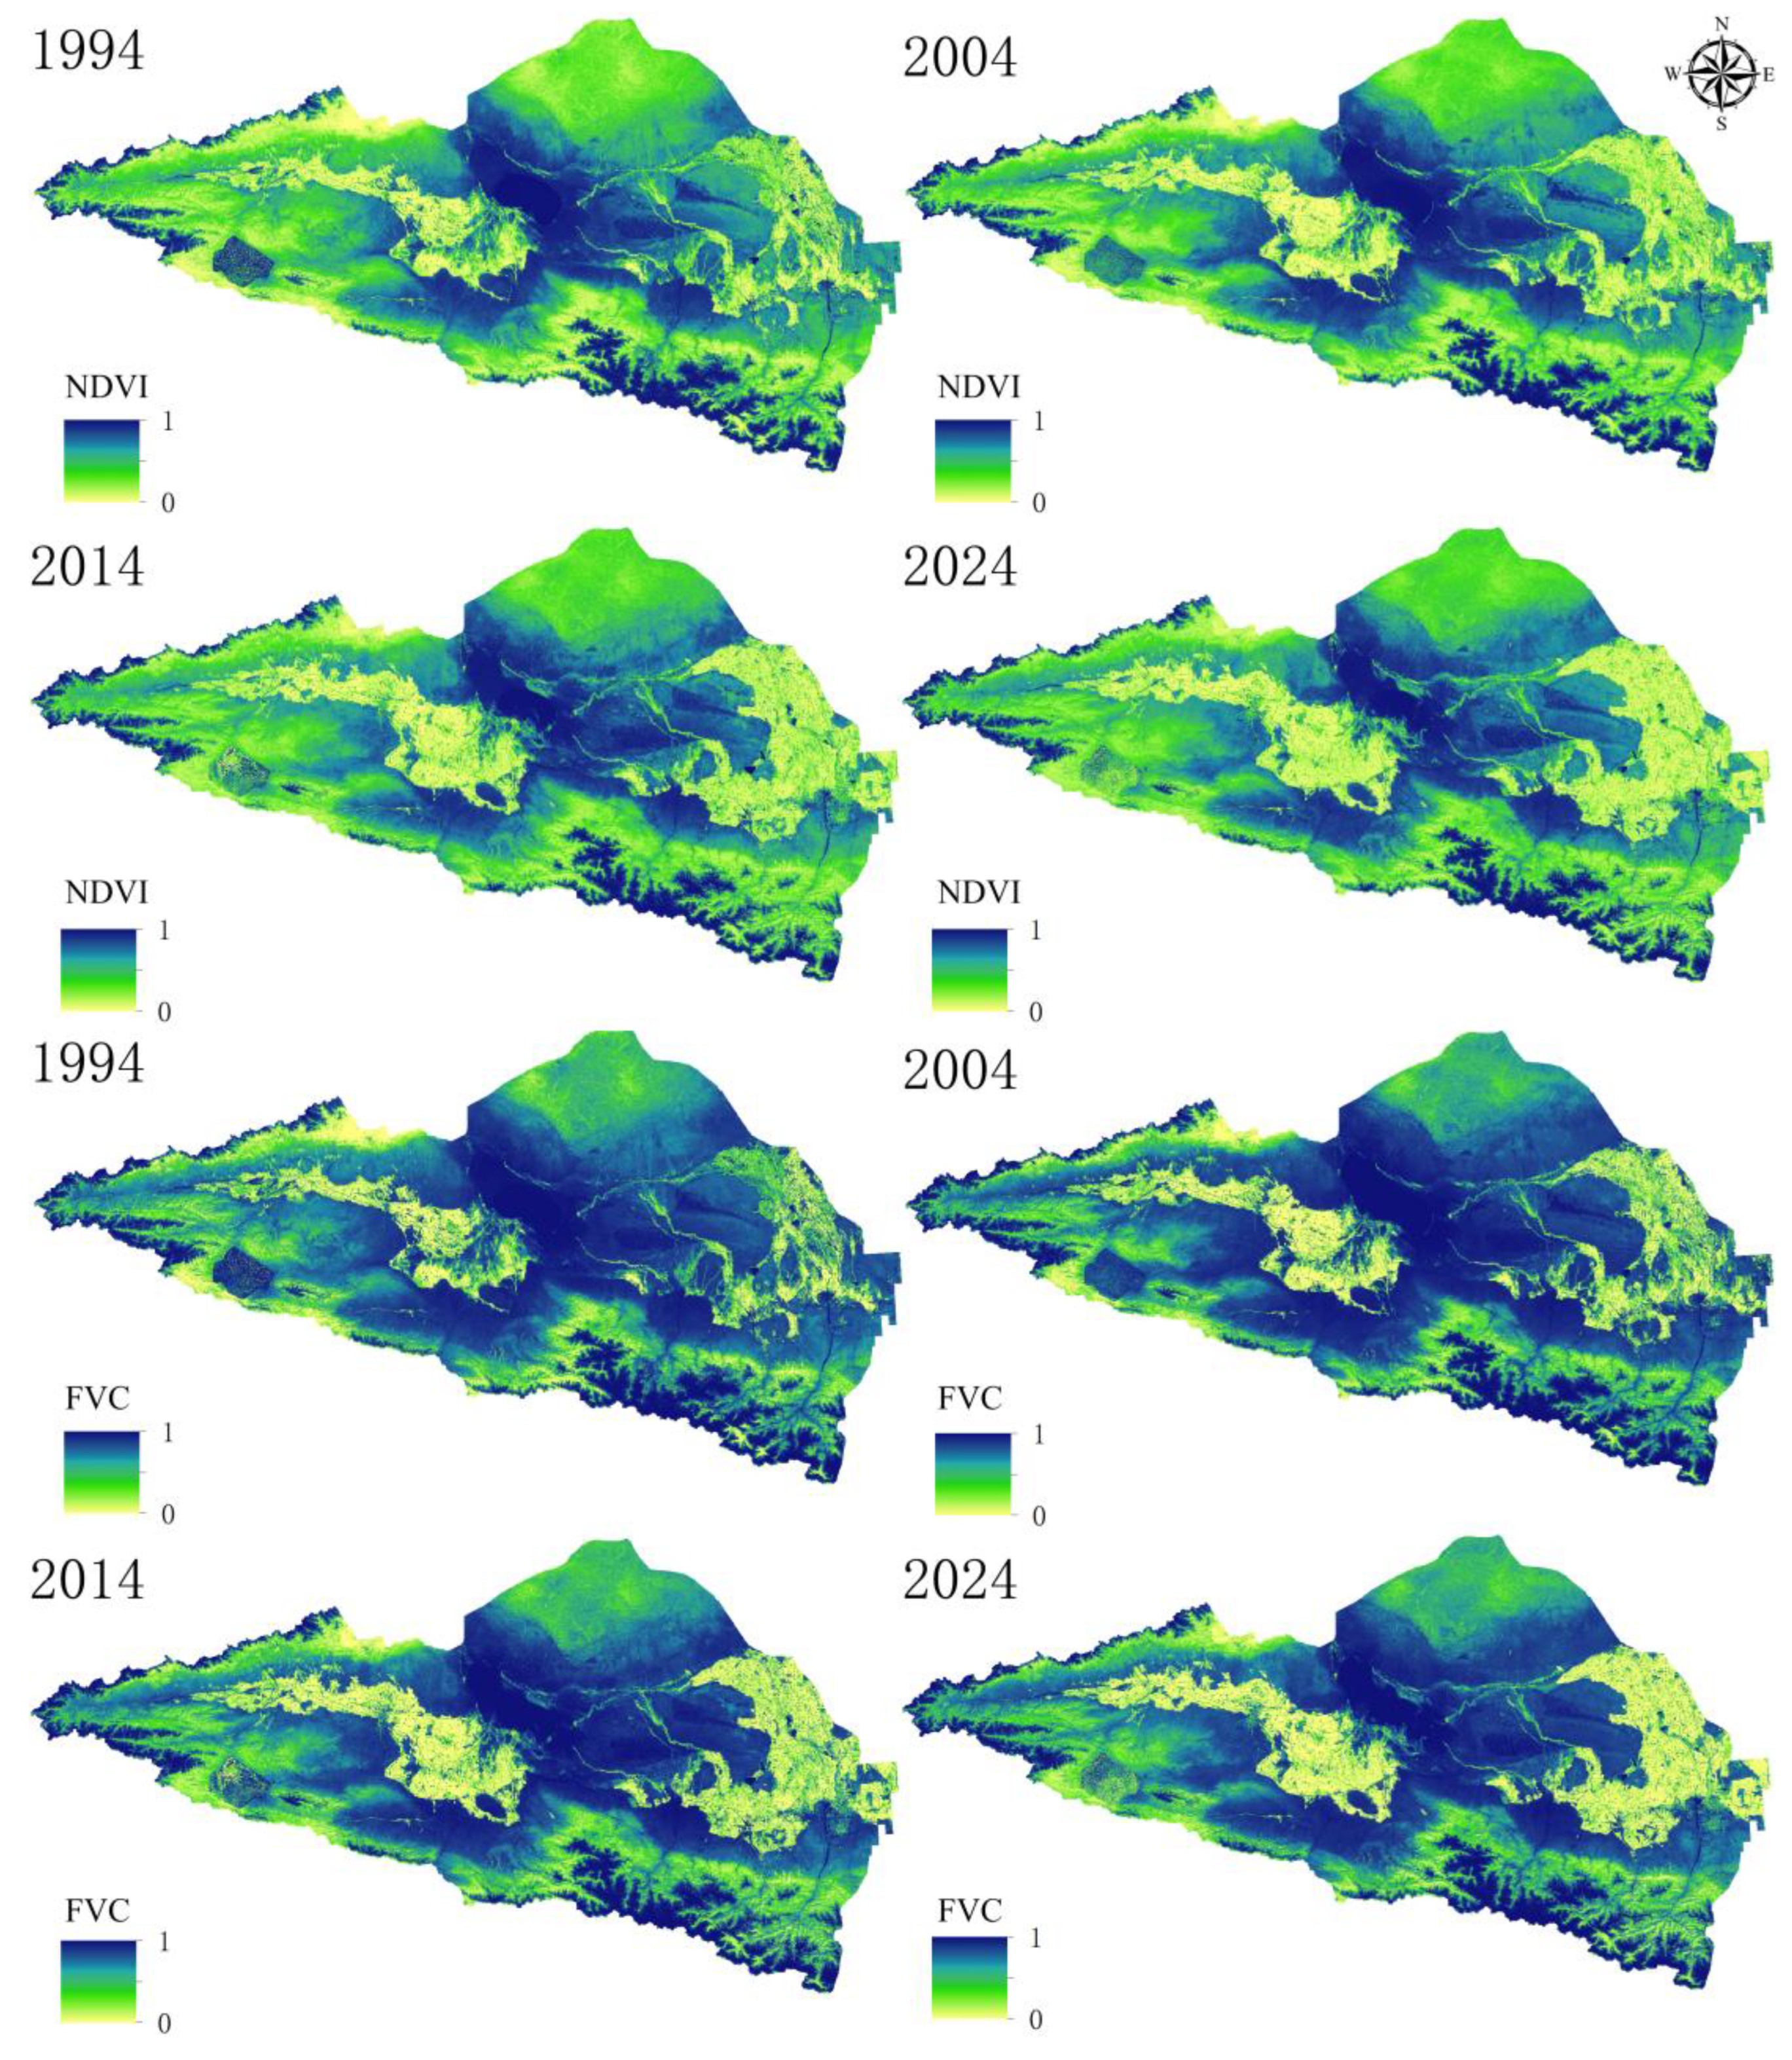
Figure 7.
Ecological Vulnerability Index of Ebinur Lake.
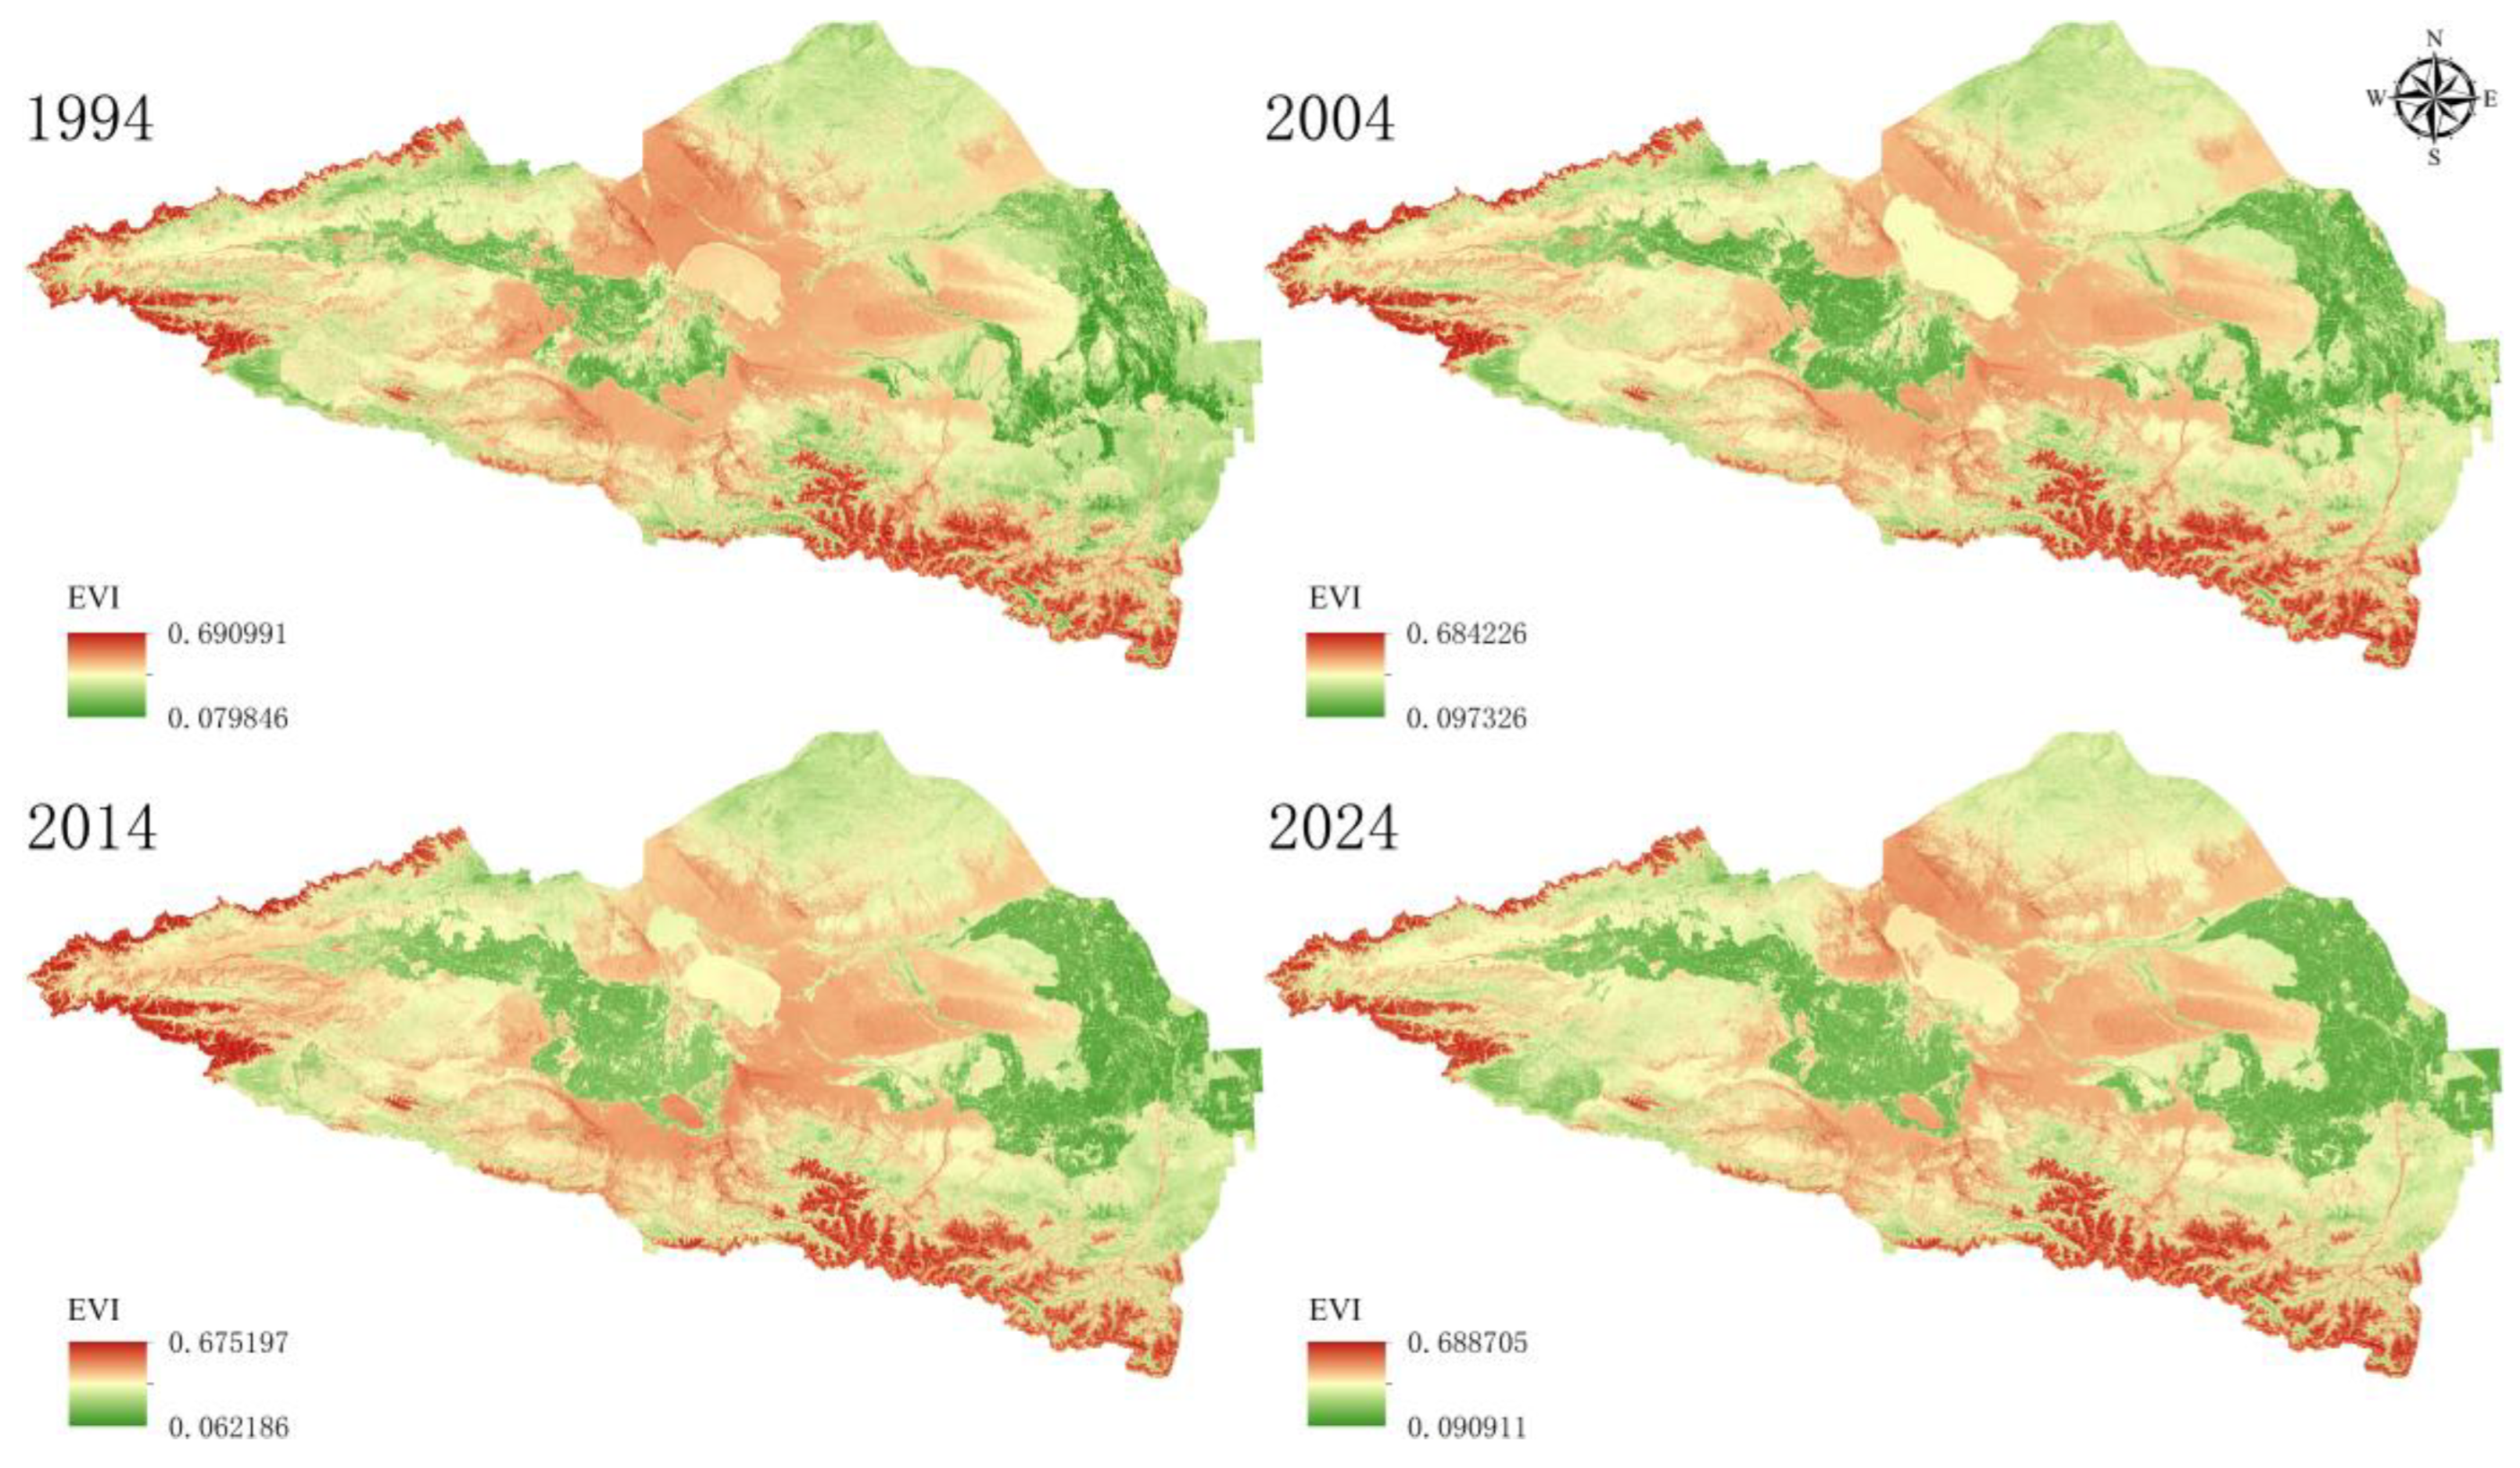
Figure 8.
Ecological Vulnerability Grades of Ebinur Lake.
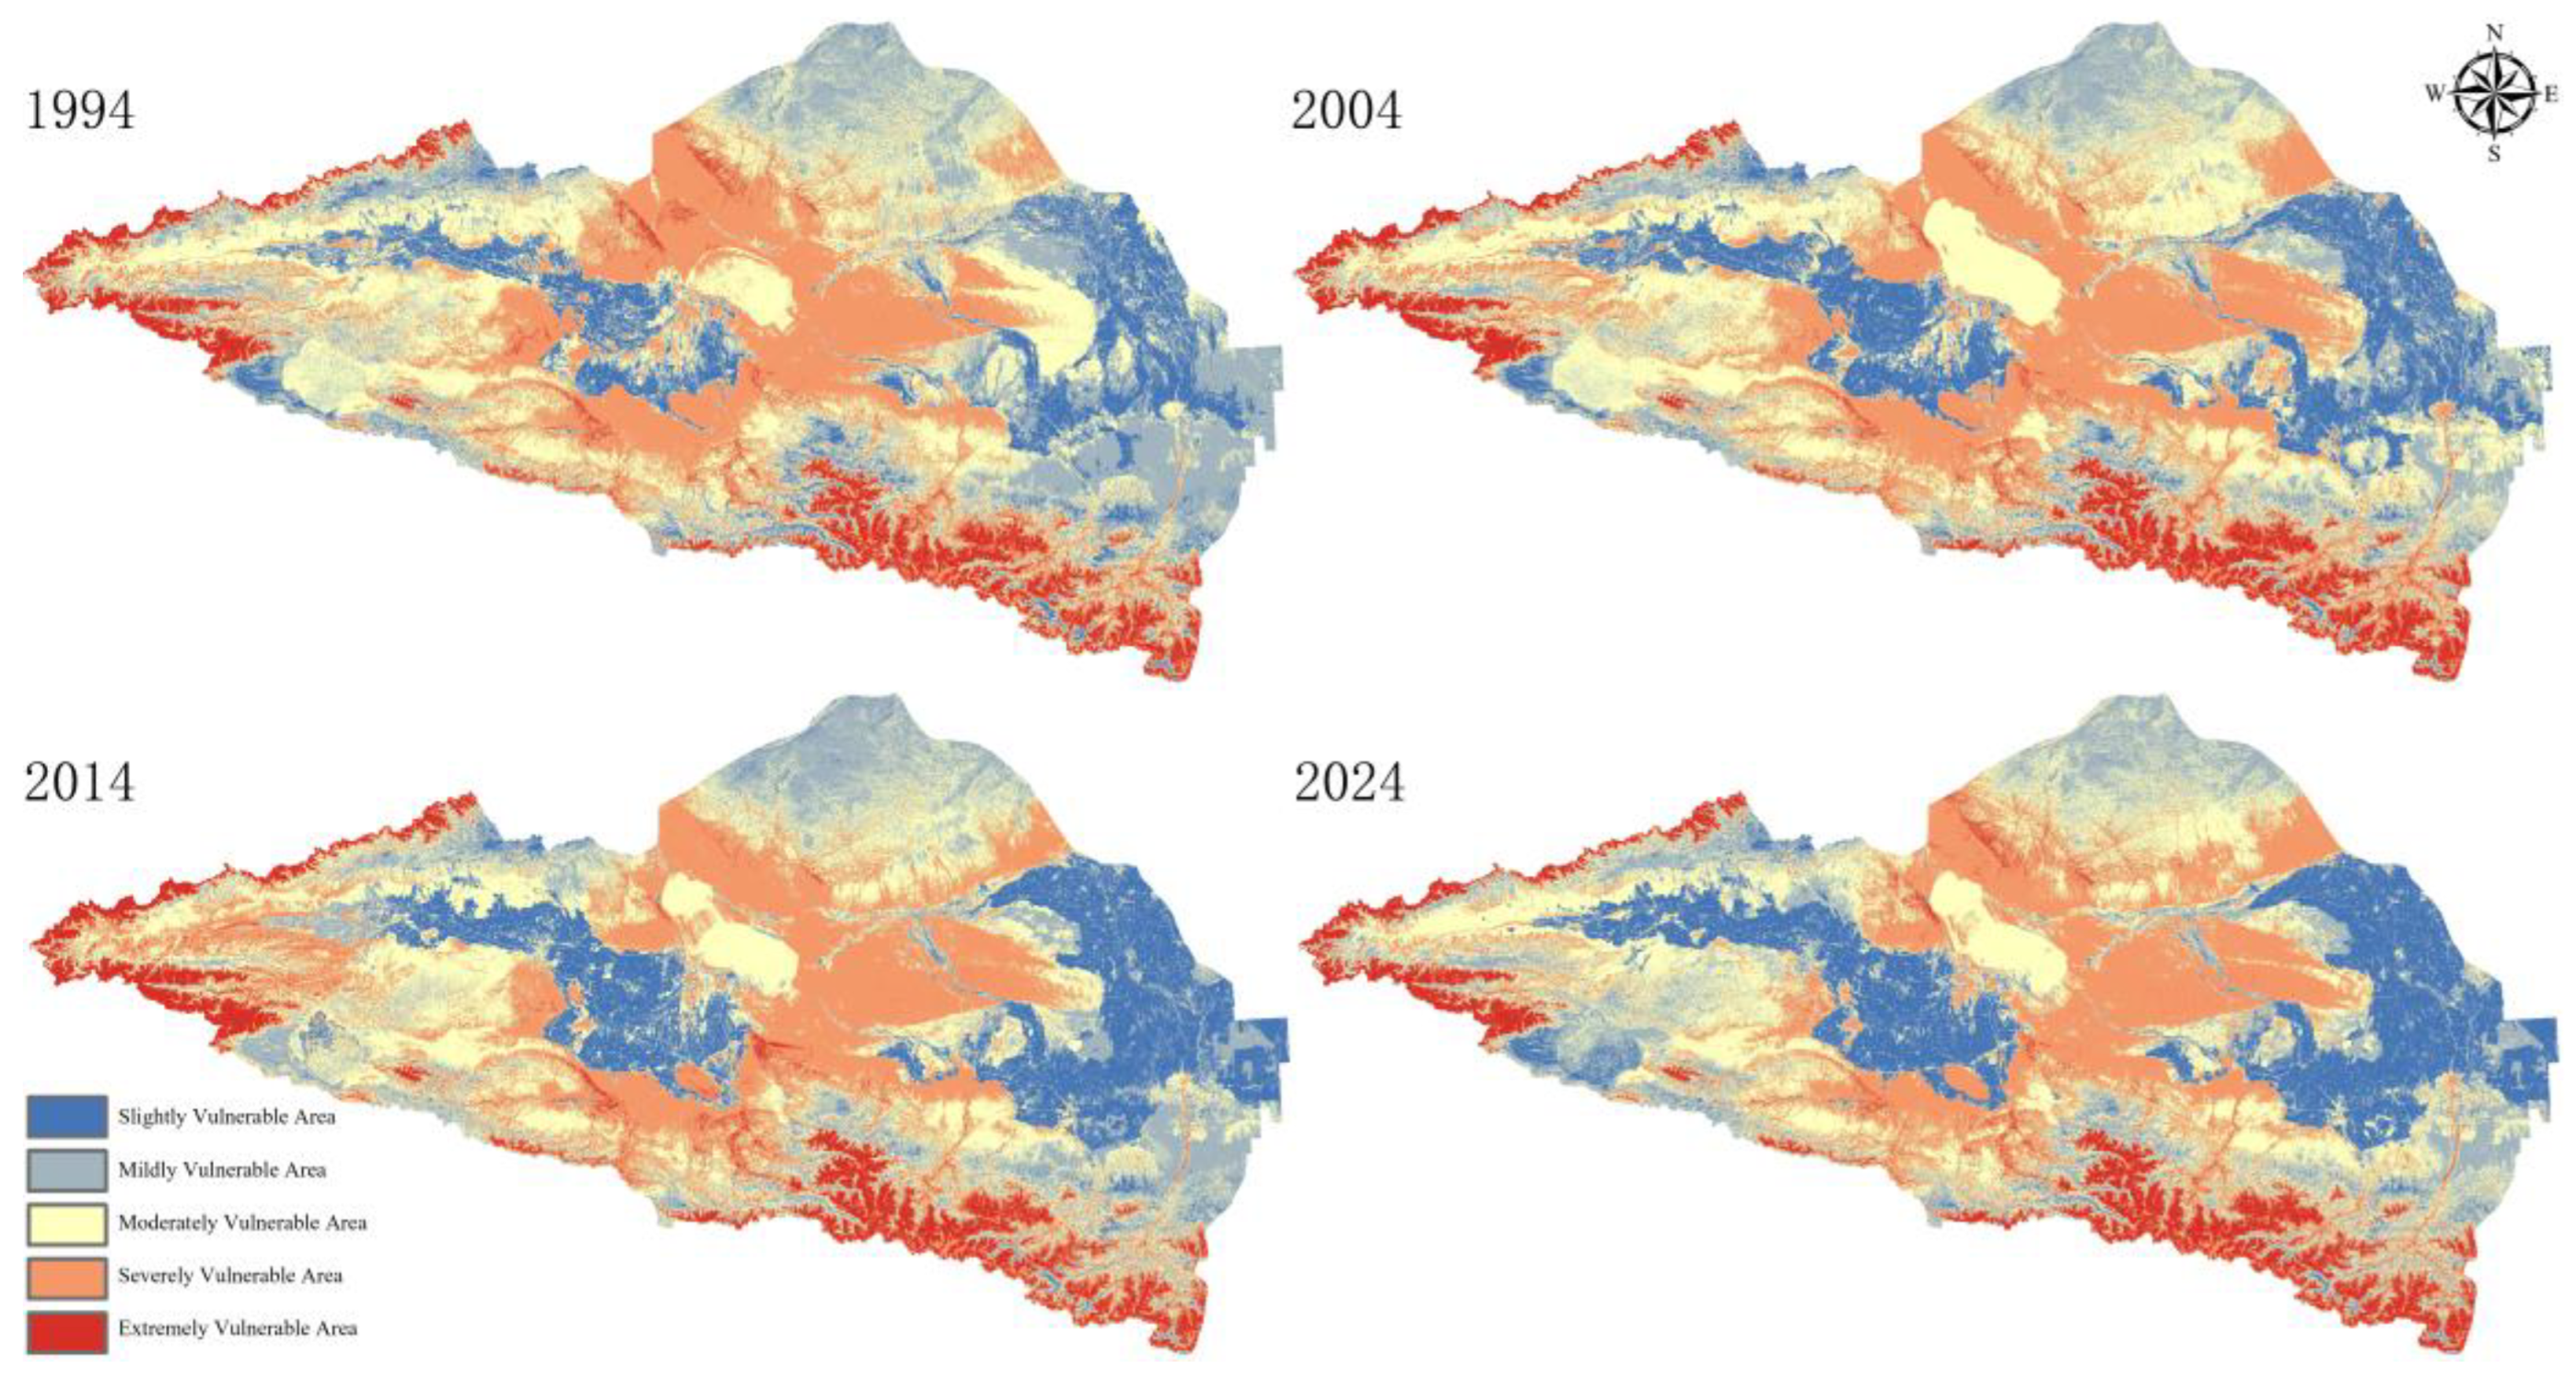
Figure 10.
LISA Cluster Map of Ecological Vulnerability of Ebinur Lake.
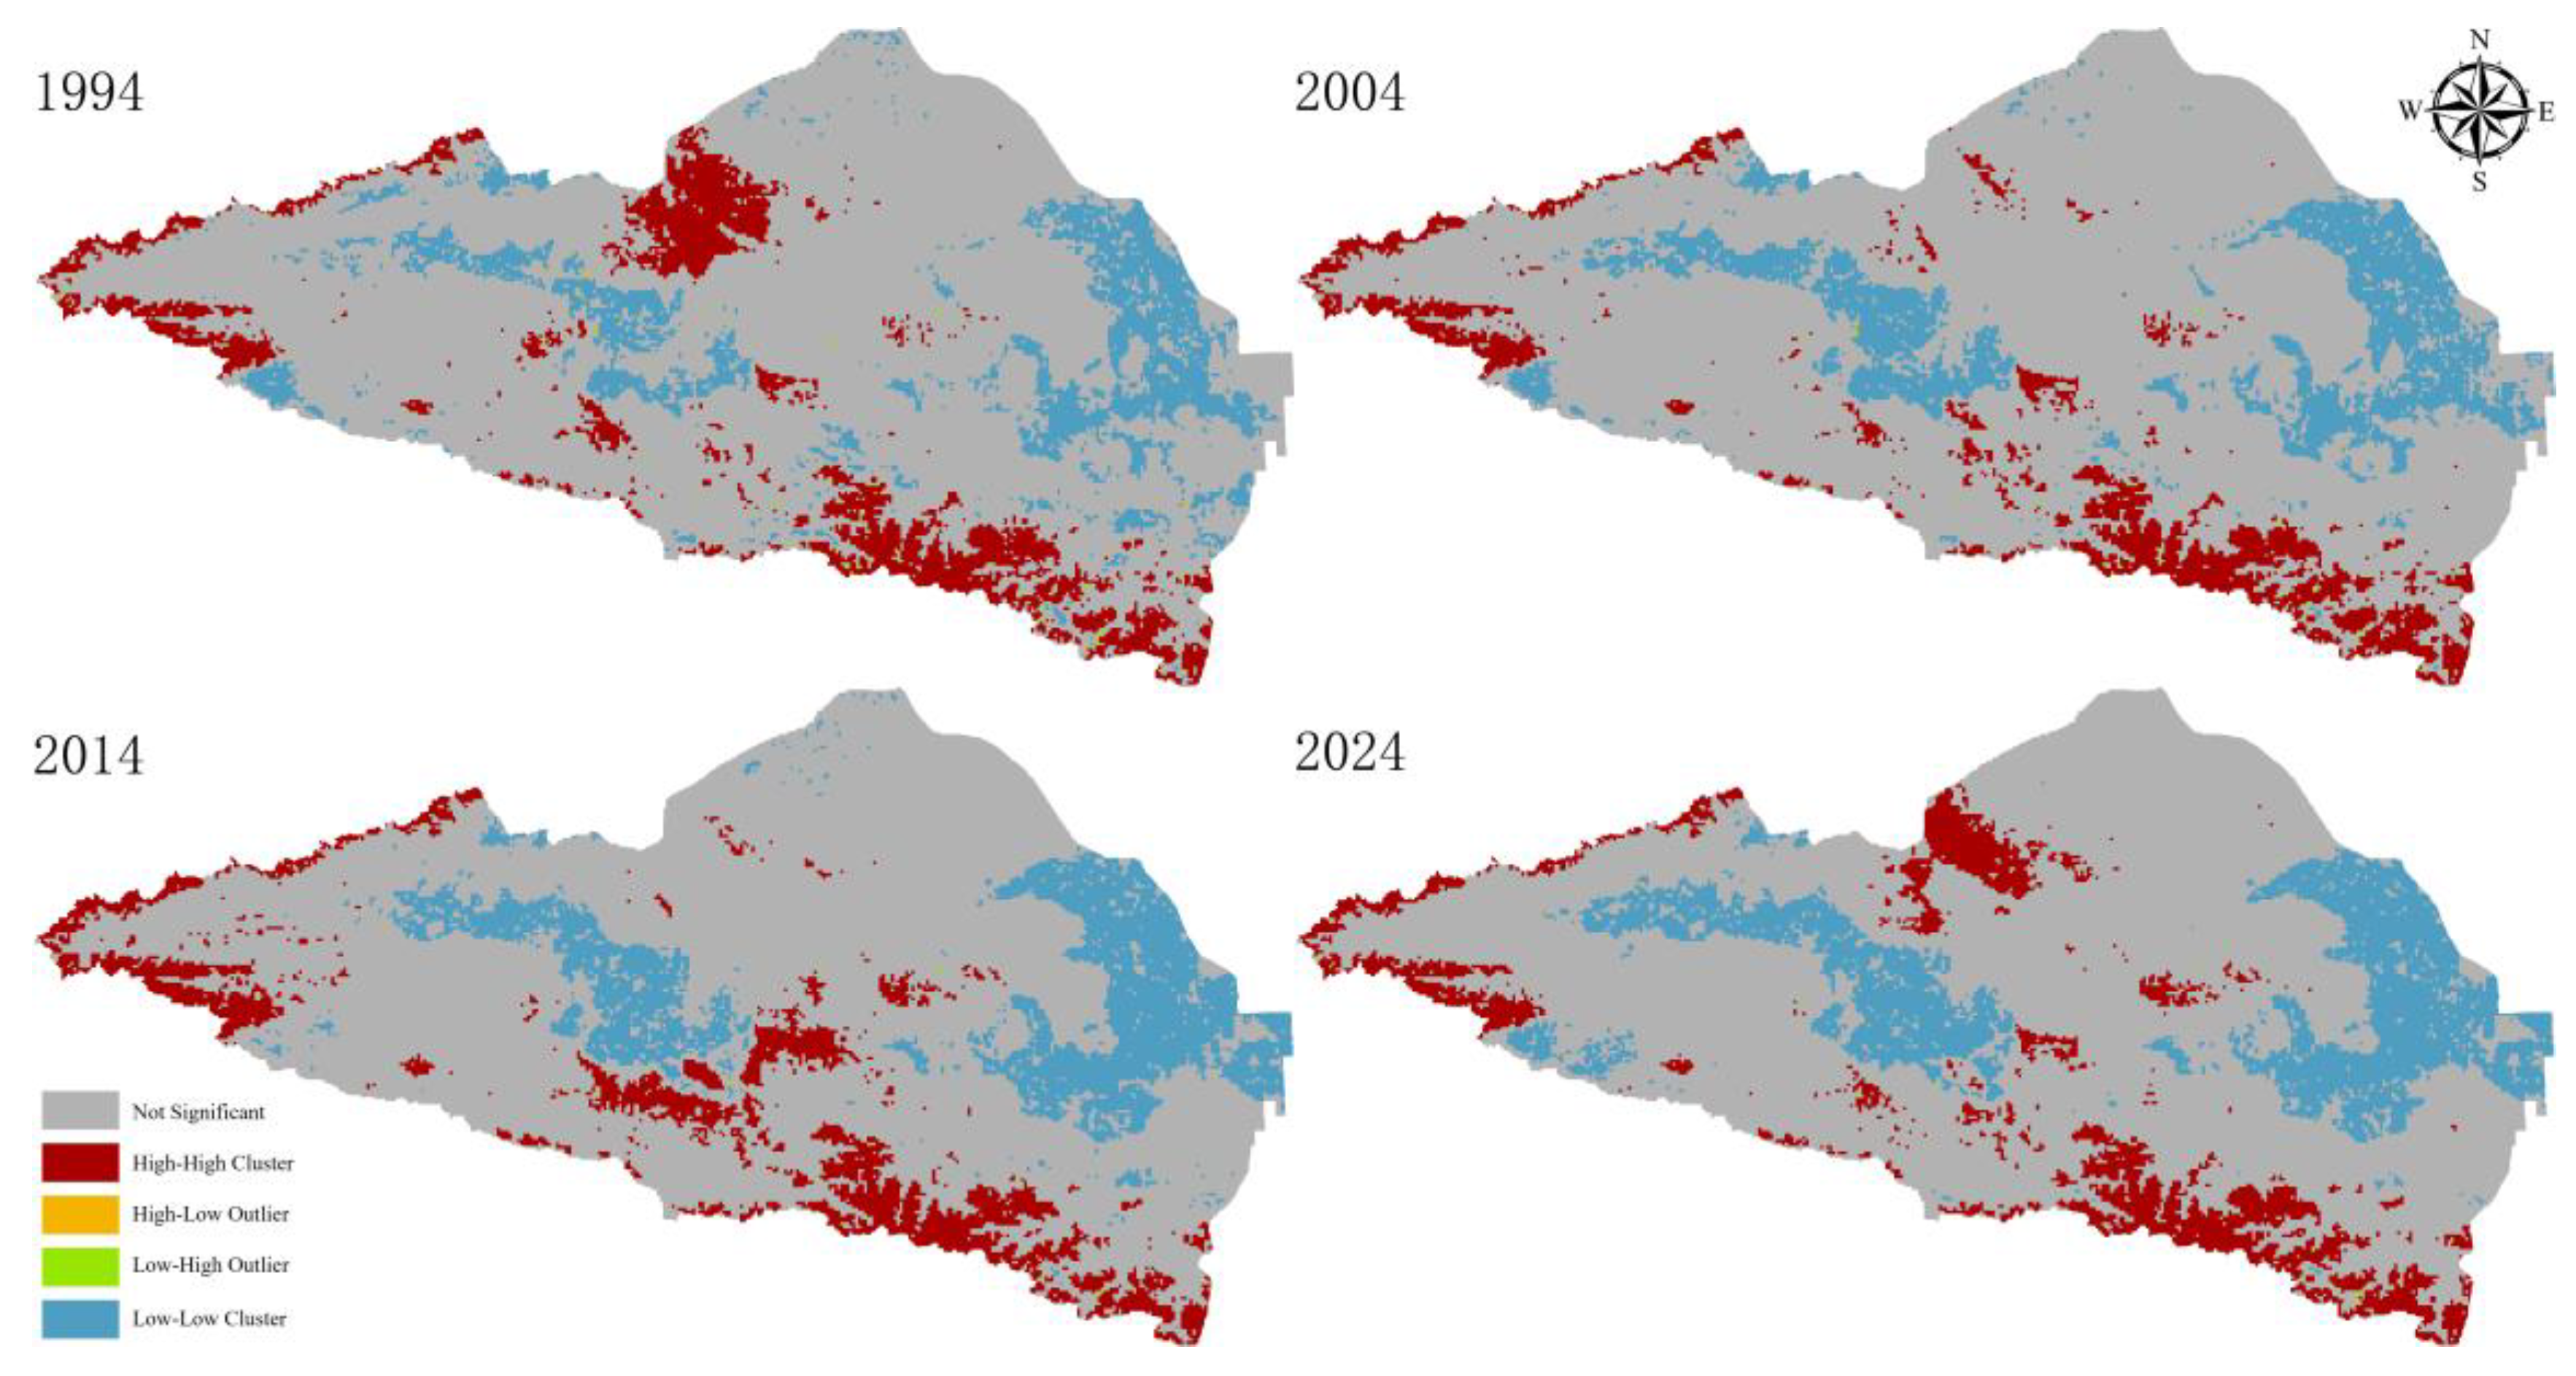
Figure 11.
Analysis of cold and hot spots.
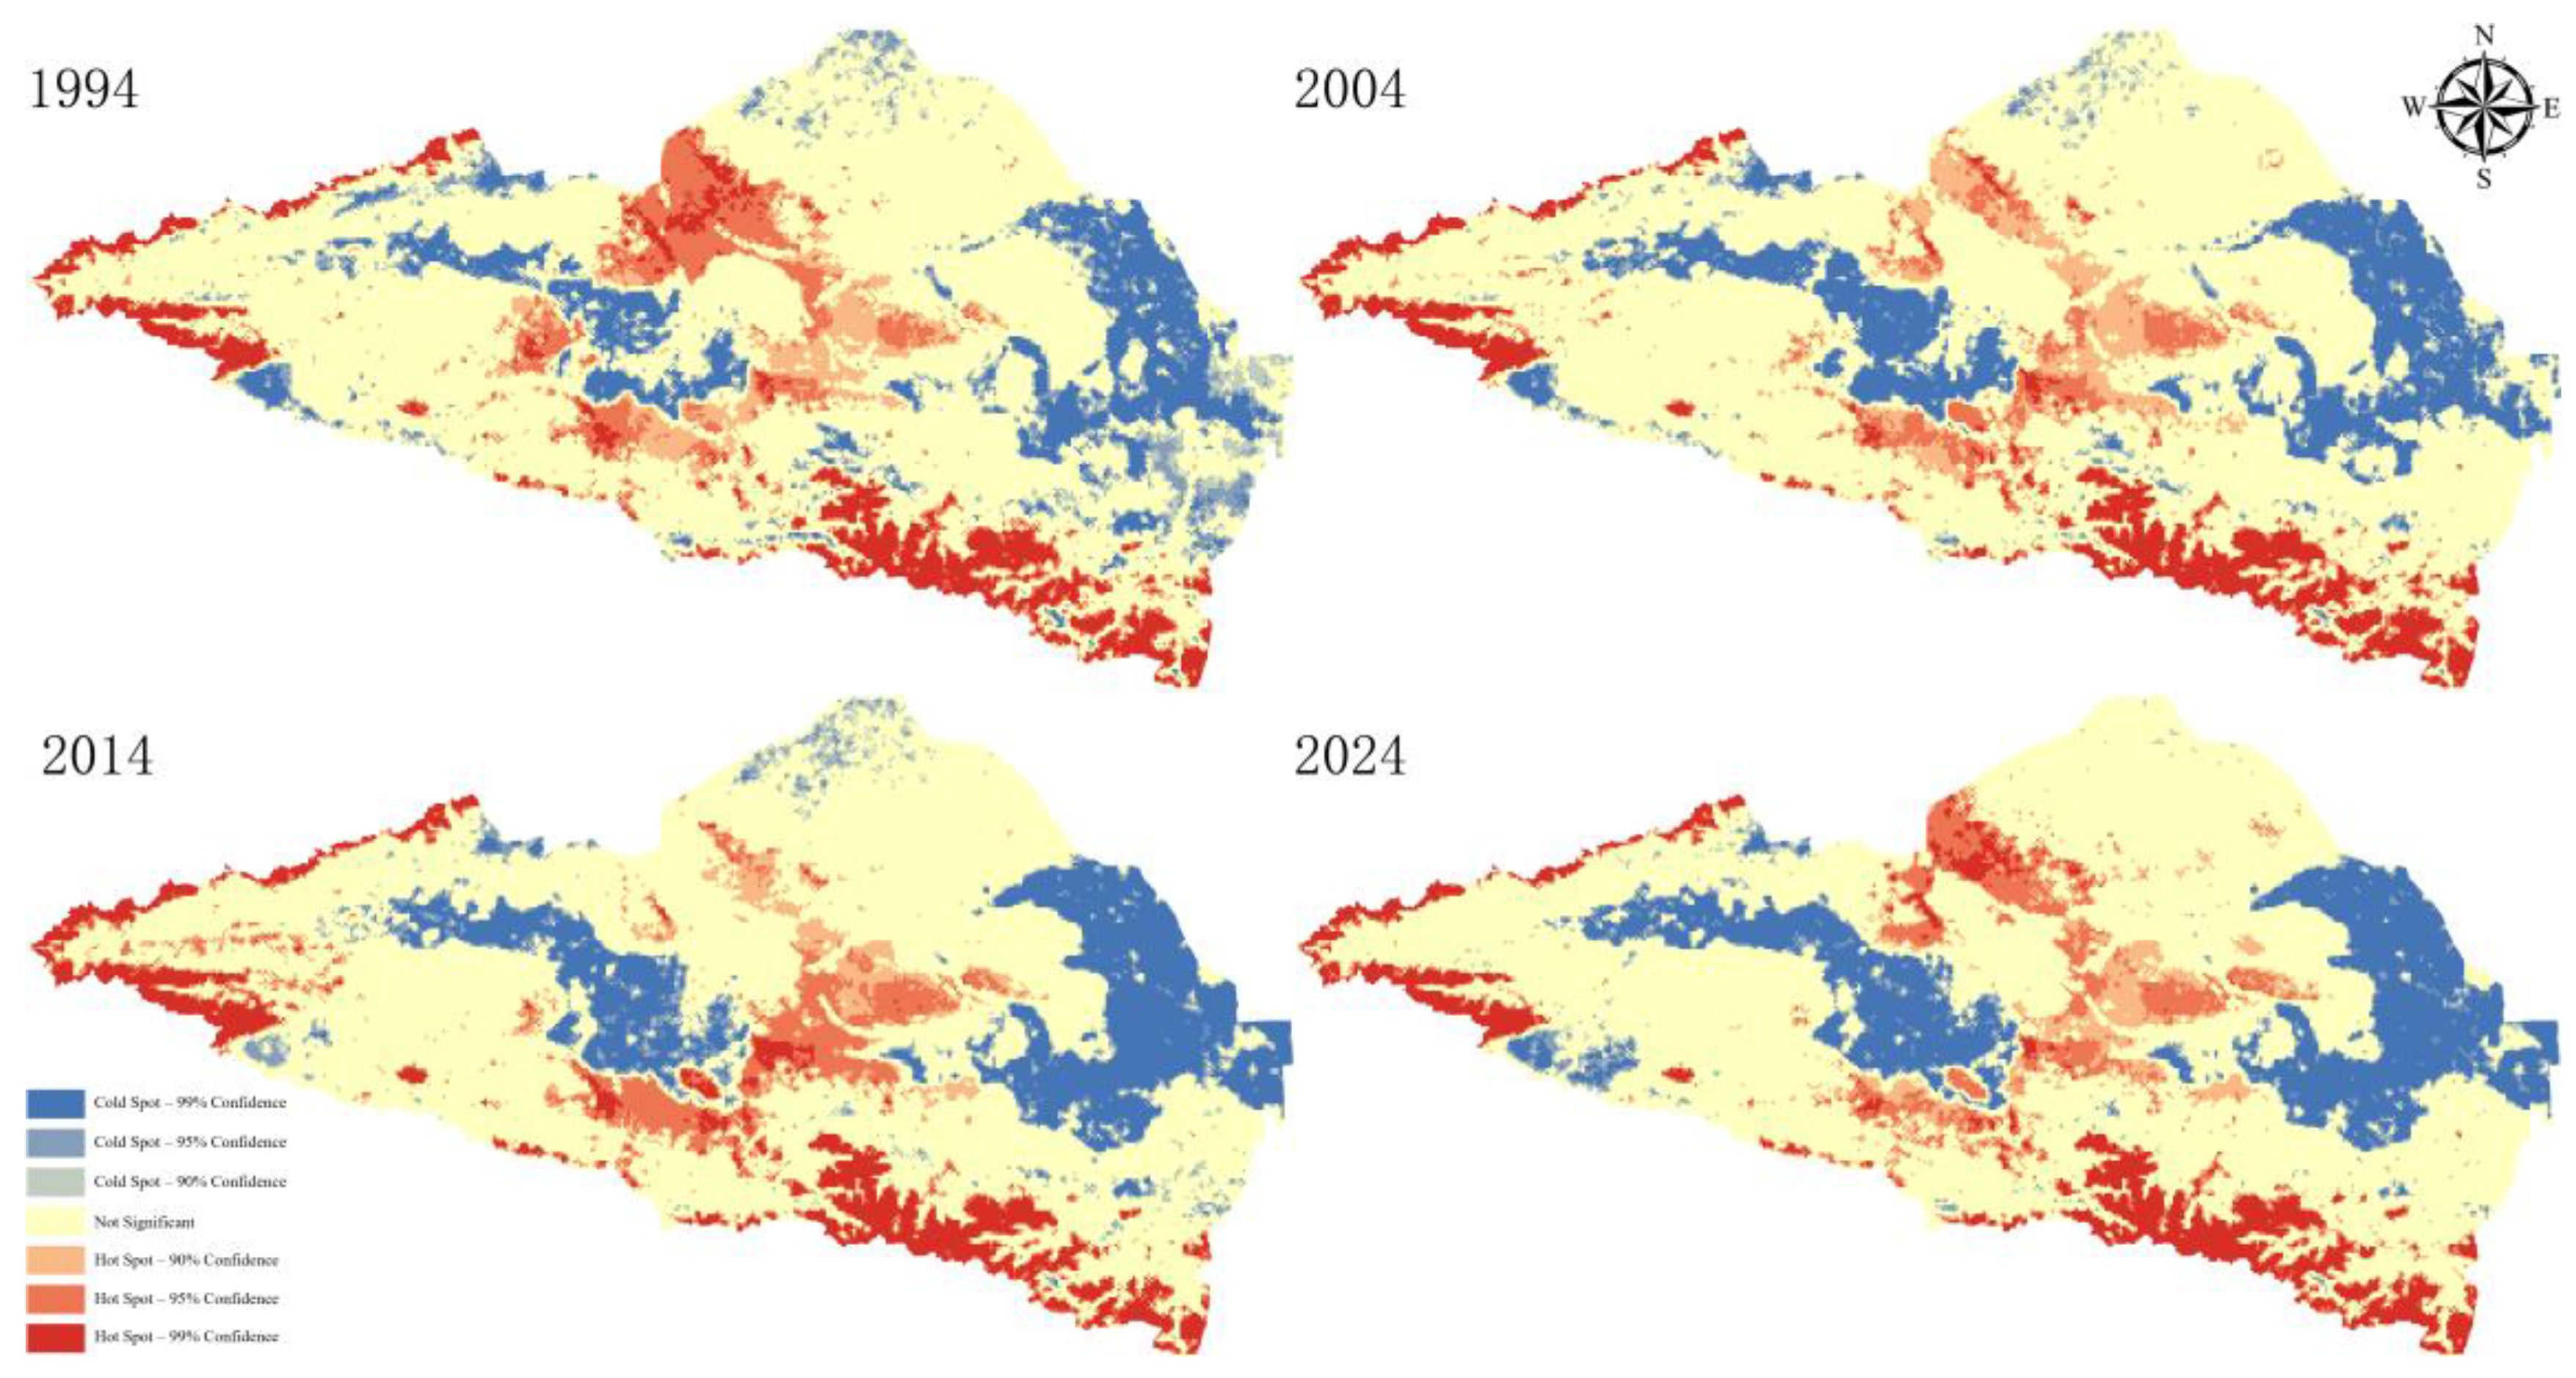
Figure 12.
Results of Interaction Detector Analysis from 1994 to 2024.
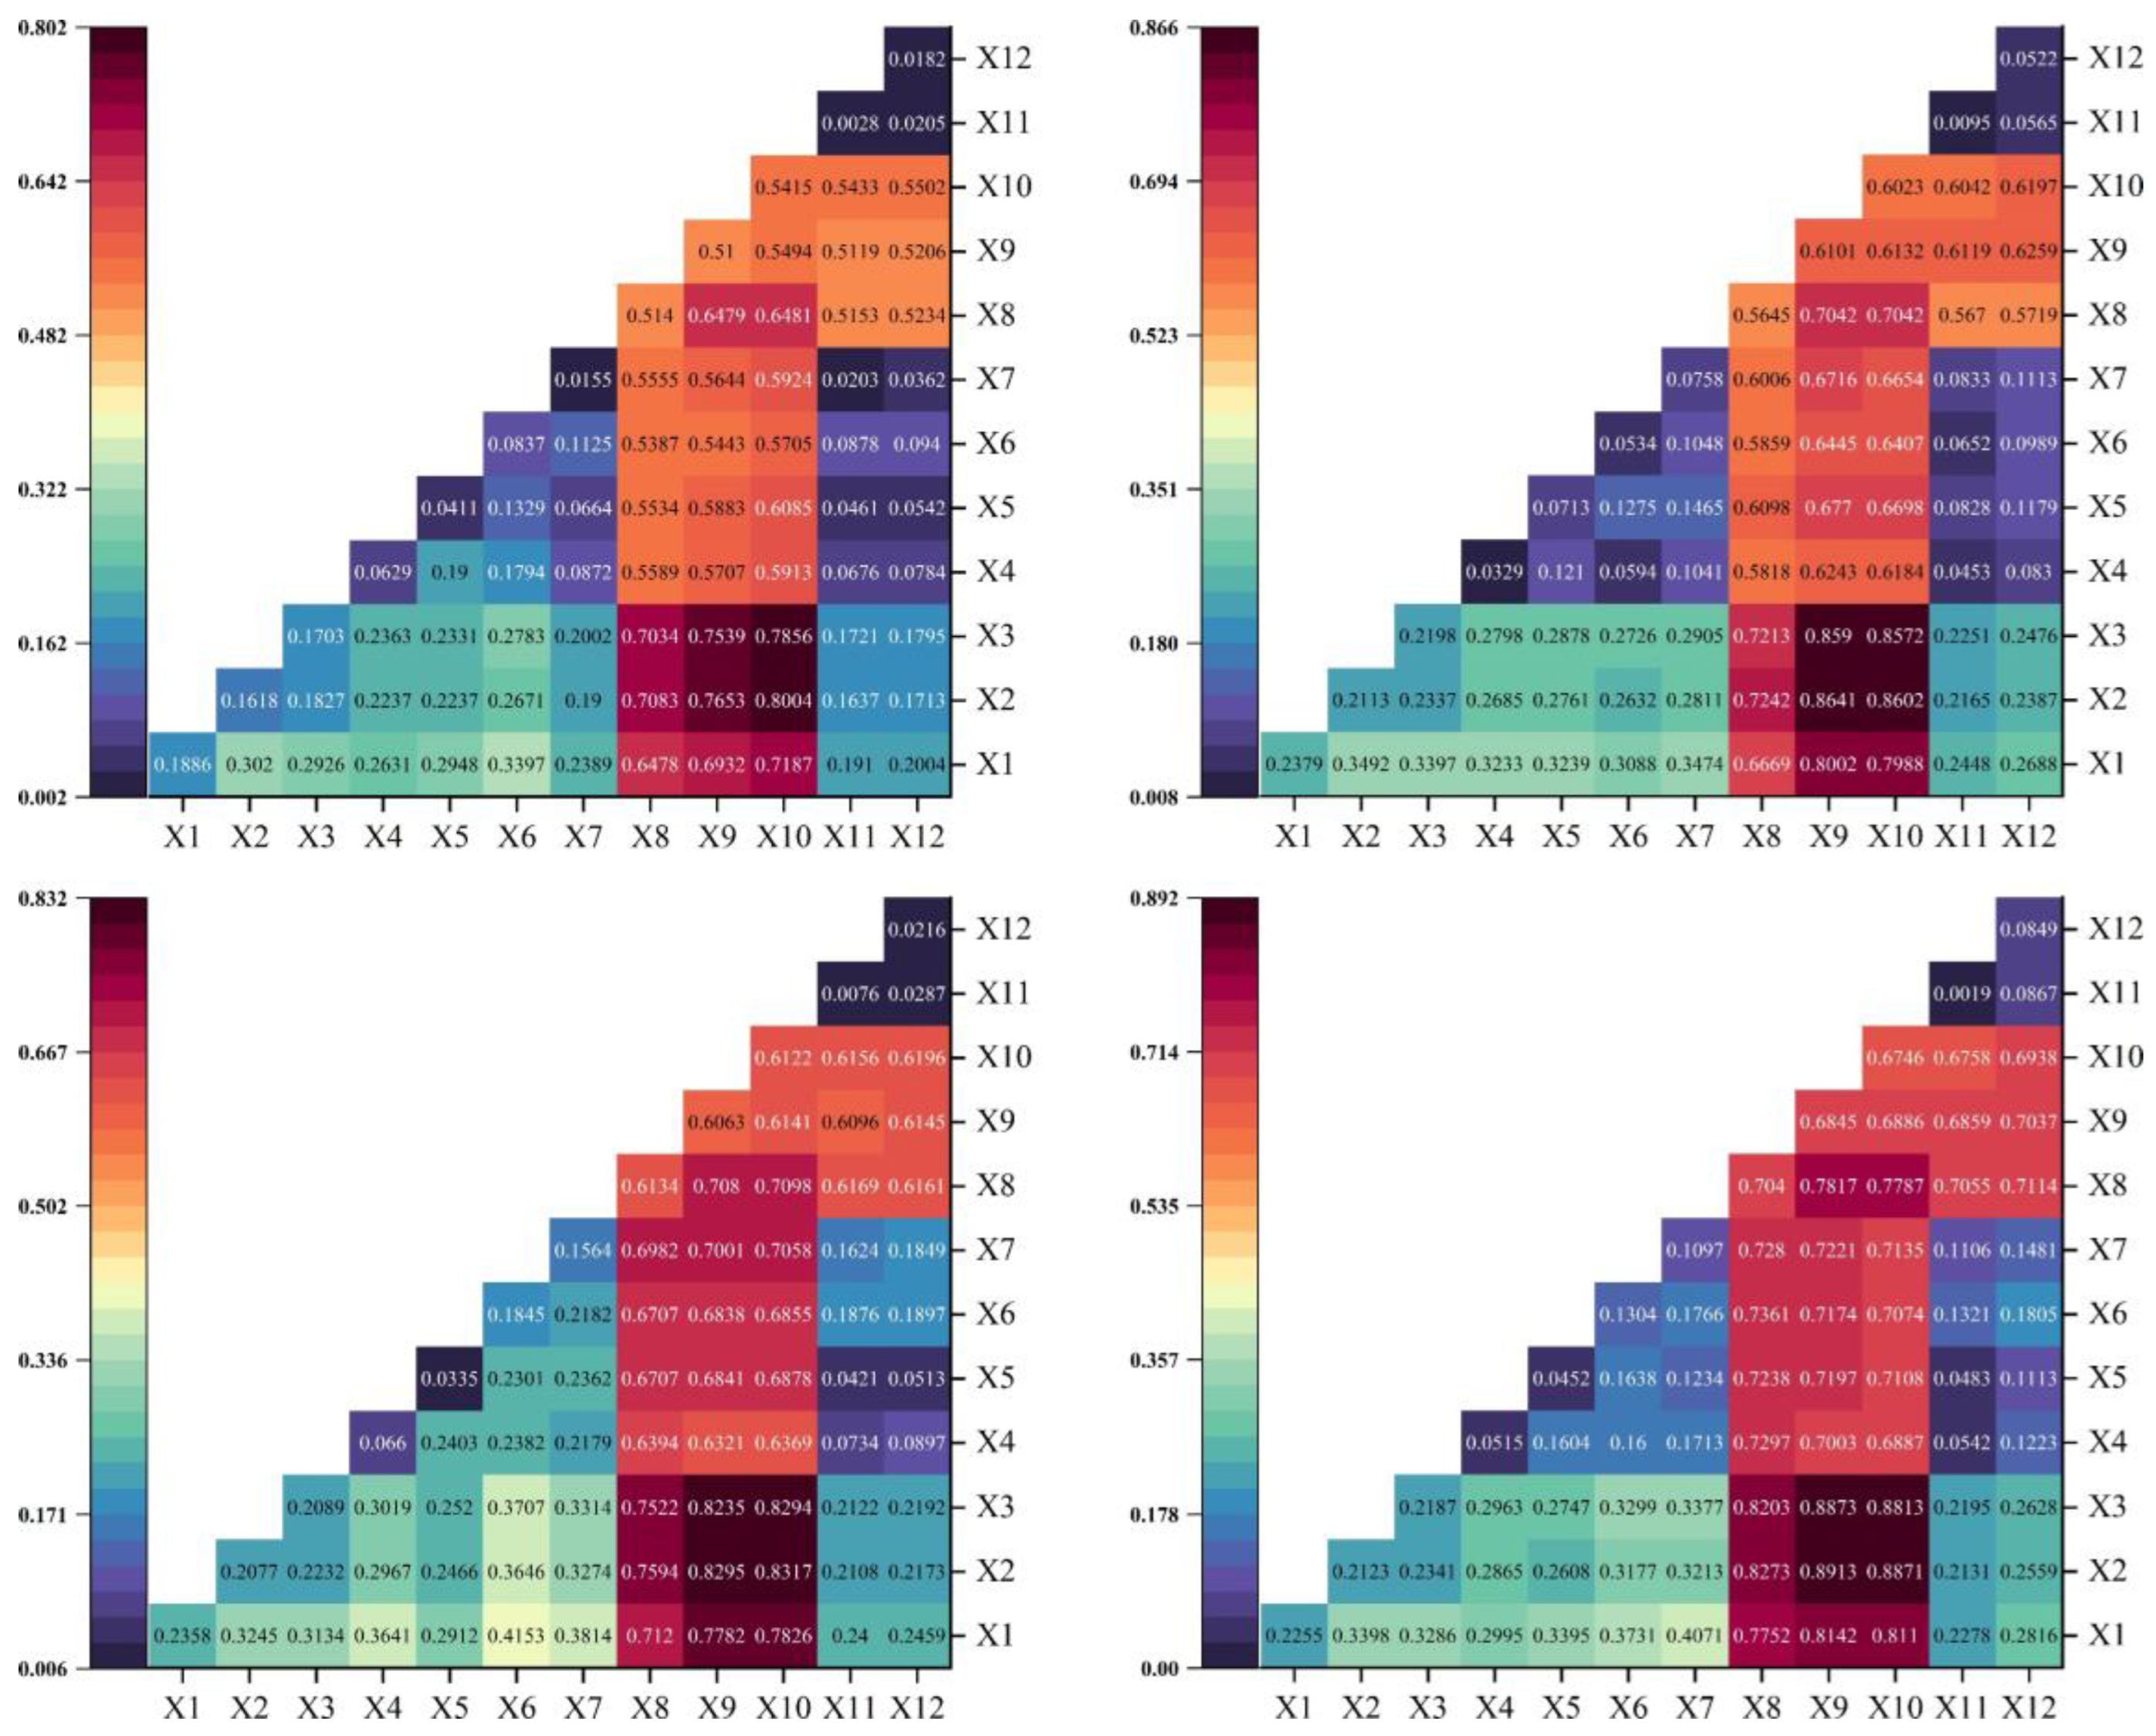
Table 3.
Evaluation Index System of Ecological Vulnerability in Ebinur Lake Basin.
| Criterion Layer (Weight) | Element Layer (Weight) | Indicator Layer (Weight) | Indicator Attribute |
| Ecological Sensitivity (0.6277) |
Topographic Factor(0.3191) | Elevation(0.1046) | Positive |
| Slope(0.1018) | Positive | ||
| Degree of relief (0.1127) | Positive | ||
| Climatic Factor (0.2119) | Annual Average Temperature (0.0882) | Negative | |
| Annual Precipitation(0.1037) | Negative | ||
| Annual Extreme High Temperature(0.01) | Positive | ||
| Annual Extreme Low Temperature(0.01) | Negative | ||
| Surface Factor(0.0967) | LUCC(0.0967) | Graded Assignment | |
| Ecological Resilience (0.2754) |
Vegetation Factor(0.2754) | NDVI(0.1356) | Negative |
| FVC(0.1398) | Negative | ||
| Ecological Pressure (0.0969) |
Social Factor(0.0969) | Population Density(0.0585) | Positive |
| GDP Density(0.0384) | Positive |
Table 4.
Value Assignment of Land Use and Land Cover Change.
| Indicator | Standardized Score | ||||
| 0.2 | 0.4 | 0.6 | 0.8 | 1 | |
| LUCC | Forestland, Water | Grassland | Cultivated Land | Construction Land | Unused Land |
Disclaimer/Publisher’s Note: The statements, opinions and data contained in all publications are solely those of the individual author(s) and contributor(s) and not of MDPI and/or the editor(s). MDPI and/or the editor(s) disclaim responsibility for any injury to people or property resulting from any ideas, methods, instructions or products referred to in the content. |
© 2025 by the authors. Licensee MDPI, Basel, Switzerland. This article is an open access article distributed under the terms and conditions of the Creative Commons Attribution (CC BY) license (http://creativecommons.org/licenses/by/4.0/).
Copyright: This open access article is published under a Creative Commons CC BY 4.0 license, which permit the free download, distribution, and reuse, provided that the author and preprint are cited in any reuse.


