
Submitted:
30 December 2025
Posted:
31 December 2025
You are already at the latest version
Abstract
Background: Head and neck squamous cell carcinomas (HNSCC) are aggressive malignancies with high mortality and poor prognosis. Pseudogenes with altered expression during HNSCC progression may serve as potential biomarkers for early detection, prognosis, and therapy selection. Methods: In this report, we analyzed the expression of ANXA2P2 and PA2G4P4 pseudogenes in HNSCC patients using data from The Cancer Genome Atlas. Clinical correlations were assessed through UALCAN and cBioPortal. Functional enrichment was investigated using REACTOME, ESTIMATE, and Gene Set Enrichment Analysis. Statistical analyses were performed with GraphPad Prism 8. Results: Both ANXA2P2 and PA2G4P4 were significantly upregulated in HNSCC compared to normal tissue. Their expression varied based on HPV status and was negatively correlated with overall survival. High pseudogene expression was associated with dysregulated oncogenic pathways, while low expression was linked to distinct immunological profiles. Conclusions: ANXA2P2 and PA2G4P4 exhibit oncogenic properties in HNSCC and hold potential as diagnostic and prognostic biomarkers.
Keywords:
HNSCC
; pseudogene
; biomarker
; oncogene
; TCGA
; HPV
1. Introduction
Head and neck squamous cell carcinomas (HNSCCs) develop from tissues in the oral cavity, oropharynx, hypopharynx, and larynx. It affects approximately 600,000 new patients yearly. Thus, HNSCCs are the sixth most common type of cancer worldwide [1,2]. The main risk factors include tobacco exposure, overuse of alcoholic beverages, and oncogenic virus infections. Human papillomavirus (HPV) is the most critical viral oncogenic factor contributing to HNSCCs and causes disturbances in the molecular program of cells [3,4,5,6]. Depending on the HNSCC stage, unimodal or multimodal treatment strategies can be applied. In clinical practice, the early stages of HNSCCs are treated by surgery or radiotherapy. In locally advanced cancer, the surgery is followed by adjuvant radiation or chemoradiation [1,2]. It should be noted that despite the progression in chemotherapy, the primary treatment approach for HNSCC is still radiotherapy [7,8,9,10,11,12,13]. In the last decade, much attention has been put on the different types of non-coding RNAs, mostly on microRNAs. Up to date, longer RNA transcripts such as long non-coding RNAs (lncRNAs) also seem essential in HNSCC biology and should be intensively explored as a critical component of the RNA world [14,15,16,17,18].
Pseudogenes are considered copies of genes that have lost their original function due to the accumulation of mutations. The human genome possesses around 11,000 pseudogenes; however, the exact number remains still undefined [19]. Pseudogenes, once considered non-functional “junk DNA,” are now recognized as important genomic elements with potential regulatory functions. Advances in sequencing have revealed their involvement in various biological processes, including their alterations in multiple cancers [18]. Pseudogenes can interact with their parental genes or other genomic loci, influencing their sequence integrity and transcriptional activity. Additionally, pseudogene-derived RNAs can participate in post-transcriptional regulation by acting as antisense RNAs, endogenous small-interfering RNAs, competitive endogenous RNAs (ceRNAs), or through other RNA-mediated mechanisms [19,20,21]. Some pseudogenes may even produce functional proteins that mimic or disrupt the actions of their protein-coding counterparts [19]. The role of most pseudogenes in the pathomechanism of cancer development, including HNSCC, remains poorly understood. Despite the small number of reports about pseudogenes, this type of RNA transcript seems to be a new potential class of biomarkers in modern oncology. For instance, the expression levels of pseudogenes such as FKBP9P1, PTTG3P, FTH1P3, DUXAP8, DUXAP10 or PTENP1 were changed during HNSCC progression and could serve as potential diagnostic or prognostic biomarkers [22,23,24,25,26,27,28,29]. In this study, the role of two pseudogenes named ANXA2P2 (annexin A2 pseudogene 2) and PA2G4P4 (proliferation-associated 2G4 pseudogene 4) in the pathogenesis of HNSCC and the potential diagnostic utility were analyzed based on the transcriptome data and clinical data obtained during The Cancer Genome Atlas (TCGA) project.
To date, no protein or peptide products have been confirmed for these pseudogenes. ANXA2P2 has a single transcript (NR_003573.1, 1310 nt), while PA2G4P4 also has a single transcript (NR_003284.1, 2751 nt), according to the NCBI Gene and Ensembl databases [30,31]. However, the GeneCards database reports an annexin A2-like protein (A6NMY6, 339 amino acids) encoded by ANXA2P2, as detected by Komalasari et al. [32,33]. The parental gene of ANXA2P2, ANXA2 (annexin A2), plays a crucial role in cancer progression, including HNSCC. ANXA2 regulates membrane dynamics, and its downregulation correlates with poorly differentiated and dysplastic tissues in the head and neck region. It is implicated in tumor progression, migration, and metastasis [34,35]. Despite its biological significance, ANXA2 alone has not been validated as a reliable biomarker for HNSCC monitoring [36,37]. However, a saliva-based protein panel consisting of antibodies against MMP1, KNG1, ANXA2, and HSPA5 demonstrated high sensitivity and specificity in detecting oral squamous cell carcinoma (OSCC) in a Taiwanese population [38]. Furthermore, Quabius et al. reported increased ANXA2 expression in HPV-DNA-positive tonsillar samples [39]. Notably, ANXA2 plays a key role in the life cycle of both RNA and DNA viruses, including HPV, hepatitis B (HBV), and hepatitis C (HCV) [40]. The second pseudogene, PA2G4P4, originates from PA2G4 (proliferation-associated 2G4), though little is known about its role in HNSCC. PA2G4 encodes two protein isoforms: PA2G4-P42 (which inhibits tumor growth) and PA2G4-P48 (which promotes tumor growth). Sun et al. demonstrated that PA2G4-P48 enhances HNSCC proliferation by reducing polyubiquitination via MCTS1 (MCTS1 re-initiation and release factor) [41]. Additionally, cDNA array and proteomic analyses suggest that PA2G4 mRNA and protein are overexpressed in radioresistant OSCC cell lines; however, Western blot validation yielded inconsistent results [42].
Beyond its role in cancer, PA2G4 (also known as EBP1, ErbB-3 receptor binding protein) is essential for viral replication. Inhibition of EBP1 induces cell cycle arrest and apoptosis in HIV-infected cells [43]. Similarly, in influenza virus infection, EBP1 expression correlates with viral protein production [44].
Given these findings, we selected ANXA2P2 and PA2G4P4 for further investigation in HNSCC. This study aims to explain their biological roles and assess their potential as diagnostic biomarkers in HNSCC using The Cancer Genome Atlas project’ transcriptomic and clinical data.
2. Materials and methods
In this study based on the preselection using The University of ALabama at Birmingham CANcer data analysis Portal (UALCAN) database two pseudogenes, named ANXA2P2 and PA2G4P4, were chosen. Next, we checked the data against the Encyclopedia of RNA Interactomes (ENCORI) database [45], using the following criteria; the first: Difference between healthy and cancer tissue with p < 0.05 and false discovery rate, FDR < 0.05 and/or the second criteria: difference in patient survival, where p < 0.05. Finally, using TCGA data downloaded from Santa Cruz UCSC Xena browser analysis was performed to describe their potential as biomarkers. The main steps of methods we presented in Figure 1.
2.1. TCGA Data
The TCGA expression levels data of ANXA2P2 and PA2G4P4 genes were downloaded from Santa Cruz UCSC Xena browser (TCGA Head and Neck Squamous Cell Carcinoma, IlluminaHiSeq pancan normalized; 566 samples; UCSC Xena; accession on 20 September 2024) and from UALCAN and ENCORI databases (http://ualcan.path.uab.edu; https://rnasysu.com/encori/; accession on 20 September 2024) [45,46,47,48].
2.2. Pathological and Clinical Analyses
The expression levels of pseudogenes were analyzed in cancerous and corresponding healthy (normal) tissues from the larynx, pharynx, and oral cavity. The HPV status was assessed based on p16 protein (encoded by tumor suppressor gene CDKN2A, cyclin-dependent kinase inhibitor 2A) expression and in situ hybridization (ISH) and categorized as positive and negative samples [48], was assessed for all genes using the Wilson/Brown method with a 95% confidence interval (CI). Additionally, correlations between the expression levels of six analyzed pseudogene transcripts were evaluated.
Using the TCGA classification of tumors (atypical, basal, classical, and mesenchymal subtypes), we further analyzed the expression levels of PA2G4P4 and ANXA2P2. Associations between pseudogene expression levels and tumor characteristics, such as proliferation ratio, wound healing capacity, and intratumor heterogeneity, were also determined using data from Thorsson et al. [49]. Furthermore, the expression levels of two pseudogenes were correlated with clinical and pathological parameters; methodologies described by us previously [23,29,45,46,50] and using available online tools like GEPIA2 (Gene Expression Profiling Interactive Analysis, version 2; http://gepia2.cancer-pku.cn/#index; accession on 18 January 2025) [51].
2.3. Gene Analyses and Functional Enrichment Analysis (GSEA)
Genes positively or negatively correlated with pseudogene expression (Spearman’s correlation coefficients R > 0.3 or R < -0.3) were identified using cBioPortal, (https://www.cbioportal.org/; accession on 20 September 2024). These genes were subsequently analyzed using the REACTOME Pathway Browser (https://reactome.org/; accession on 20 September 2024), applying a significance threshold of p ≤ 0.05. Gene Set Enrichment Analysis (GSEA) was performed using version 4.1.0 of the GSEA software [52], following protocols outlined in prior studies [23,29,45,46,50].
2.4. Association of Pseudogenes and Response to Ionizing Radiation
The potential association of ANXA2P2 and PA2G4P4 with genomic instability was investigated. Additionally, the expression levels of these pseudogenes were analyzed in the context of HNSCC patients’ responses to radiotherapy, using a model previously described by Paszkowska et al. [29].
2.6. Statistical Analyses
All statistical analyses were performed using GraphPad Prism 8 (GraphPad Software, San Diego, CA, USA). Normality was tested using the Shapiro–Wilk test, while comparisons of ANXA2P2 and PA2G4P4 expression levels across clinical subgroups were made using T-tests or Mann–Whitney U tests, depending on data distribution. Methodologies referenced in previous studies were used where appropriate [23,29,45,46,50].
3. Results
3.1. Expression of Pseudogenes is Upregulated in HNSCC and Correlated with tumor Localization, Tumor Type and HPV Status
Based on the UALCAN database, the pseudogenes ANXA2P2 and PA2G4P4 were significantly overexpressed in primary HNSCC samples compared to normal tissues (p = 0.01172 and p < 0.0001, respectively) and patients with low/medium expression levels of these pseudogenes displayed better survival than those with higher expression levels (p = 0.048 and p = 0.037, respectively), Suppl. Figure 1A. Moreover, we verified those data using a different database named ENCORI. We observed that, no differences were identified for ANXA2P2 (ENSG00000231991) pseudogene, the fold change FC = 1.10; p = 0.17 with FDR = 0.3; but in the case of PA2G4P4 (ENSG00000230457), FC = 1.68; p < 0.0001 with FDR < 0.0001. Next, the association between analyzed pseudogenes and patients' survival was verified using LongRank test with estimation of coefficient β (Coef β) and hazard ratio (HR). We indicated that in the case of ANXA2P2 pseudogene, we found that patients with lower expression levels of ANXA2P2 had better overall survival (OS) than those with higher expression of this gene (Coef β = 0.41; HR = 1.5; p = 0.0032). However, for PA2G4P4, no differences in OS were observed for (Coef β = 0.08; HR = 1.08; p = 0.58), Suppl. Figure 1B.
Additionally, a strong positive correlation in expression levels was observed between ANXA2P2 and PA2G4P4 (Figure 2A). Moreover, we observed, that expressions levels of ANXA2 and PA2G4 were significantly differ between normal and cancer samples, and in the both cases were up-regulated in cancer than in normal type of analyzed samples (p = 0.0004 and p < 0.00001, respectively), Suppl. Figure 2A. Next, we checked the correlation of parental gene and its pseudogene, ANXA2 and ANXA2P2, PA2G4 and PA2G4P4 as well as between two parental genes, ANXA2 and PA2G4, in normal and cancer samples using the GEPIA2 database. We observed, that in the case of ANXA2 and ANXA2P2 the higher correlation normal than cancer samples (p = 0; R = 0.94, and p < 0.0001; R = 0.85, respectively), in the case of PA2G4 and PA2G4P4 (p < 0.0001; R = 0.56, and p < 0.0001; R = 0.33, respectively) as well as ANXA2 and PA2G4 (p < 0.0001; R = 0.64, and p < 0.0001; R = 0.27, respectively). It should be noted that correlation was weaker in cancer samples than in normal in all analyzed by us cases, Suppl. Figure 2B.
To investigate the expression patterns of these pseudogenes based on tumor localization, HNSCC patients were divided into three groups corresponding to the larynx, pharynx, and oral cavity, in accordance with the classification provided by the National Institutes of Health. The analysis revealed the most significant difference in pseudogene expression between tumors from the pharynx and oral cavity (p < 0.001), except in the case of PA2G4P4, where no differences were observed. Moreover, significant differences in expression levels were also noted for all pseudogenes between tumor samples from the larynx and oral cavity (p < 0.05). Among all pseudogenes analyzed, only ANXA2P2 showed statistically significant differences in expression levels across all tumor localizations (Figure 2B).
Next, the expression levels of the pseudogenes were assessed in relation to the HPV status. The analysis showed that ANXA2P2 expression was significantly downregulated in HPV-positive patients compared to HPV-negative patients (p < 0.0001). However, no significant differences were observed in the expression levels of PA2G4P4. Moreover, ANXA2P2 demonstrated the ability to discriminate between HPV-positive and HPV-negative samples, as indicated by an area under the curve value of 0.7417 (p < 0.0001). Additionally, we investigated the expression levels of parental genes depending on the HPV status. Significant up-regulation of ANXA2 expression levels in HPV(-) than the HPV(+) group of patients was observed (p = 0.0043) only. In the case of PA2G4, no differences were indicated (p = 0.336); (Suppl. Figure 2C).
Using the TCGA classification of tumors into atypical, basal, classical, and mesenchymal subtypes, the expression levels of ANXA2P2 and PA2G4P4 were analyzed further. The findings revealed that atypical subtypes exhibited significantly lower expression levels of both pseudogenes compared to basal subtypes (p < 0.0001 for both). In addition, significant differences in expression were noted between basal and classical subtypes for both pseudogenes, (p = 0.0003 for PA2G4P4 and p = 0.0092 for ANXA2P2). Lower expression levels of ANXA2P2 and PA2G4P4 were also observed in mesenchymal subtypes compared to basal subtypes (p < 0.0001 and p = 0.0001, respectively). For ANXA2P2, a significant difference in expression was also detected between atypical and mesenchymal subtypes of HNSCC (p = 0.0409); (Figure 3A).
The association of pseudogene expression levels with tumor proliferation, wound healing ability, and intratumor heterogeneity was also evaluated. The results indicated that higher tumor proliferation ratios were observed in patients with elevated levels of ANXA2P2 and PA2G4P4, with p < 0.0001 and p = 0.0412, respectively. Similarly, increased wound-healing ability was associated with higher expression levels of ANXA2P2 and PA2G4P4 (p < 0.0001 and p = 0.0007, respectively). In contrast, no significant associations were observed between pseudogene expression levels and intratumor heterogeneity (Figure 3B).
3.2. Expression Levels of Pseudogenes Differ Depending on Clinicopathological Parameters
The expression levels of ANXA2P2 and PA2G4P4 were correlated with various clinicopathological parameters of HNSCC patients, including age, gender, smoking status, and cancer stage. Significant differences were observed between pseudogene expression levels and specific parameters. Notably, the expression of ANXA2P2 showed a significant association with gender (p = 0.0079), T-stage (p = 0.0427), N-stage (p = 0.0314), tumor grade (p = 0.0033), and perineural invasion (p = 0.0116). For PA2G4P4, significant differences were identified in relation to N-stage (p = 0.0226). All results are summarized in Table 1.
3.3. Patients with Low Expression Levels of ANXA2P2 and PA2G4P4 Display Better Survival Rates
HNSCC samples were divided into low and high-expressing groups based on the mean level of the studied pseudogene. The differences in disease-free survival (DFS) and overall survival (OS) between these patient groups were calculated. Significantly longer OS was observed in the group of patients with low ANXA2P2 and PA2G4P4 expression (p = 0.0202, p = 0.0215, respectively) compared to patients characterized by higher expression, Figure 3C. The difference in DFS was discovered in patients with low ANXA2P2 expression levels compared to high-expressing patients. However, the OS calculated for signatures expression of two pseudogenes using the GEPIA2 tool indicated that patients with the jointly lower expression level of ANXA2P2 and PA2G4P4 had significantly longer survival time (p = 0.0012) and present better DFS (p = 0.037); (Figure 3D). Furthermore, the OS and DFS analysis for parental genes of ANXA2P2 and PA2G4P4 showed that patients presented no differences in DFS (p = 0.14) and only slightly better OS for the group with lower expression levels in comparison to patients with higher levels of both of those protein-coding genes (p = 0.048); Suppl. Figure 2D.
3.4. Pseudogene Expression is Associated with Several Cellular Processes and Pathways
Gene sets from cBioPortal with Spearman’s negative correlations (R < -0.3) and positive correlations (R > 0.3) with the analyzed pseudogenes were selected and subjected to pathway analysis using REACTOME to classify them into critical cellular processes and pathways (p < 0.05). For ANXA2P2, the most negatively correlated genes were involved in regulating potassium channels, opening calcium channels, FGFR2 ligand binding and activation, and genes associated with platelet degranulation. Conversely, the most positively correlated genes were linked to RHO GTPase activation and formin-mediated pathways related to platelet degranulation. For PA2G4P4, the negatively correlated genes were primarily involved in collagen degradation, collagen chain trimerization, and diseases related to glycosaminoglycan metabolism (Figure 4A).
To further explore the relationship between pseudogene expression and patient gene expression profiles, Gene Set Enrichment Analysis (GSEA) was performed. This analysis calculated the enrichment of gene sets in patients with high and low expression of the respective pseudogenes. In the case of ANXA2P2, significantly enriched gene sets were associated with high pseudogene expression. In contrast, PA2G4P4 demonstrated more statistically significant enrichment in patients with low pseudogene expression. Patients with high levels of ANXA2P2 presented enrichment in deregulated genes associated with the p53 signaling pathway, MYC targets, and genes upregulated by activation of the PI3K/AKT/mTOR pathway. Additional oncogenic signatures included dysregulation of genes downregulated in primary keratinocytes and genes defining the KRAS dependency signature. On the other hand, patients with high levels of PA2G4P4 showed enrichment in genes regulated by MYC, upregulated by the mTORC1 complex or during the unfolded protein response, and associated with DNA repair mechanisms, the G2/M checkpoint, and cell cycle regulation through E2F transcription factors. Furthermore, pathways linked to oxidative phosphorylation were also significantly associated with high PA2G4P4 expression (Figure 4B).
3.5. ANXA2P2 and PA2G4P4 Pseudogenes Are Associated with the Response to Ionizing Radiation
Analysis of cellular pathways revealed that the studied pseudogenes, ANXA2P2 and PA2G4P4, are associated with critical pathways involved in the cellular response to ionizing radiation. To explore the potential association of these pseudogenes with genome stability and the response to radiotherapy in HNSCC patients, we applied the model previously described by Paszkowska et al. [29].
Our findings demonstrated that for PA2G4P4, significant differences in silent and nonsilent mutation rates were observed between patients with high and low expression levels of this pseudogene (p = 0.0112 and p = 0.0017, respectively). Furthermore, patients with higher ANXA2P2 expression levels exhibited significantly lower aneuploidy scores compared to those with lower ANXA2P2 expression (p = 0.0264). Homologous recombination defects, another parameter linked to genome stability, were also studied. It was observed that lower ANXA2P2 expression was associated with higher homologous recombination defects (p = 0.0004). These findings highlight the potential role of ANXA2P2 and PA2G4P4 in maintaining genome stability and influencing the response to radiotherapy in HNSCC (Figure 5A). Finally, based on our previously published model, we check if expression levels of ANXA2P2 and PA2G4P4 differ between groups of patients with and without response to radiotherapy. We observed that in the case of both, ANXA2P2 and PA2G4P4, patients with response to radiotherapy have lower expression levels of those pseudogenes in comparison to the group of patients displaying no response to this treatment (p = 0.0297 and p = 0.0040, respectively); (Figure 5B).
3.6. Immunological profiles of HNSCC Patient Samples Differ Depending on Pseudogene Levels
Finally, we examined the possible association of the expression levels of PA2G4P4 and ANXA2P2 pseudogenes with the immune profile of HNSCC patients. High expression levels of two pseudogenes were associated with the C2 immune subtype, and low expression was associated with C1 subtype (p < 0.0001 and p = 0.0049, respectively). In the case of SNV (single-nucleotide variants) as well as Indel (short insertion and deletion) neoantigens only for patients with higher levels of PA2G4P4 were associated with higher neoantigens score than patients with lower levels of this pseudogene (p = 0.0022 and p = 0.0175, respectively). Next, the B cell receptor (BCR) and T cell receptor (TCR) scoring, depending on the pseudogene expression levels, were calculated. No differences (p > 0.05) for all pseudogenes were indicated in the case of BCR and TCR evenness scores. In the case of BCR shannon and BCR richness, higher expression levels of all analyzed pseudogenes were associated with lower scores (p = 0.045, and p < 0.0001, respectively, and for BCR richness: p = 0.0356, and p < 0.0001, respectively). In the case of TCR shannon as well as TCR richness, the same dependency as for BCR was observed (p < 0.0001 and < 0.0001, respectively, and for BCR richness: p < 0.0001 and p < 0.0001, respectively). For the cancer/testis antigen (CTA) score, no association with ANXA2P2 was observed, but a lower CTA score was indicated for patients with higher levels of PA2G4P4 (p = 0.0029). The last immunological parameters were the interferon-gamma and transforming growth factor beta responses in patients with low and high expression levels of PA2G4P4, and ANXA2P. We observed that higher levels of all analyzed pseudogenes were associated with a higher IFN-gamma response (p = 0.0044, and p < 0.0001, respectively). In contrast, lower expression levels of PA2G4P4 were connected with better TGF-beta responses (p < 0.0001). No differences in ANXA2P and TGF-beta responses were noticed (p > 0.05). All data is presented in Figure 6A and Supplementary Table S6.
The ESTIMATE stromal and immune scores were analyzed in HNSCC samples divided into low and high pseudogene expression groups. Significantly lower ESTIMATE scores were observed in HNSCC patients with high expression of ANXA2P2 and PA2G4P4 compared to low expression groups (p = 0.0467, p < 0.0001, respectively). The stromal cell infiltration and lower scores were found in patients with higher expression of ANXA2P2 and PA2G4P4 (p = 0.0407, p < 0.0001, respectively). The immune cell infiltration was significantly lower in patients with high expression of PA2G4P4 (p = 0.0003). All results are shown in Supplementary Table S7.
Next, the immunological profiles of HNSCC patients with various expression levels of pseudogenes, based on the immune score analysis were assessed. Accordingly, fractions of lymphocytes, neutrophils, eosinophils, mast cells, dendritic cells, and macrophages were evaluated. A significantly smaller fraction of dendritic cells was observed in HNSCC patients with low PA2G4P4 expression (p = 0.0197); in the case of ANXA2P2 for patients with lower expression of these pseudogenes, we observed higher levels of lymphocytes (p < 0.0001) and lower levels of macrophages (p = 0.0031). Moreover, a higher fraction of mast cells (p = 0.0112) was found in the group of patients with higher expression of ANXA2P2 than in the group with lower expression of this pseudogene, Figure 6B and 6C, and Supplementary Table S7. In the case of the PA2G4P4, differences were found in the subpopulation of CD4 memory resting T cells, regulatory Tregs, naive B cells, and macrophages type M1 (p = 0.0210, p = 0.0019, p = 0.0034, p = 0.0086, respectively). For patients with higher levels of ANXA2P2, a lower fraction of follicular helper, regulatory Tregs, naive B cells, and a higher fraction of M0 as well as M1 macrophages were found (p = 0.0004, p < 0.0001, p < 0.0001, p = 0.0011 and p = 0.0105, respectively). All results are presented in Figure 6B and 6C and Supplementary Table S7.
4. Discussion:
Over the past few decades, substantial efforts have been dedicated to identifying reliable biomarkers for head and neck squamous cell carcinoma, aiming to enhance diagnosis, prognostication, and therapeutic outcomes. These efforts have been particularly focused on enabling personalized approaches to HNSCC management. This includes the development of cellular-, DNA-, and RNA-based markers from diverse sources and the improvement of imaging modalities such as dual-time-point fluorine-18-fluorodeoxyglucose positron emission tomography/computed tomography (DTP 18F-FDG PET/CT). These advancements hold promise for better-predicting disease progression, patient survival, and treatment responses, including radiotherapy [5,6,17,53,54,55,56,57,58].
Its parental gene, ANXA2, is well-studied and implicated in promoting cancer cell proliferation, migration, invasion, metastasis, treatment resistance, and immune modulation in various malignancies. In HNSCC, ANXA2 is upregulated in laryngeal and oral squamous cell carcinoma tissues and fluids and correlates with advanced disease and poor prognosis [61,62,63,64].
In this study, we analyzed the expression of two pseudogene transcripts: ANXA2P2 and PA2G4P4 and found them to be significantly overexpressed in HNSCC tissue samples compared to adjacent normal tissues. Based on these findings, we propose ANXA2P2 and PA2G4P4 as potential biomarker candidates for HNSCC. ANXA2P2 is one of three pseudogenes of annexin A2, located on chromosome 9 (9p13.3), and shares high sequence homology with annexin A2. Its overexpression has been reported in hepatocellular carcinoma, where it is associated with an aggressive phenotype [59]. Higher ANXA2P2 expression has also been linked to the severity of diffuse gliomas, suggesting its potential as a prognostic biomarker [60]. To our knowledge, this is the first report linking ANXA2P2 expression to HNSCC. However, its parental gene, ANXA2, is well-studied and implicated in promoting cancer cell proliferation, migration, invasion, metastasis, treatment resistance, and immune modulation in various malignancies. In HNSCC, ANXA2 is upregulated in laryngeal and oral squamous cell carcinoma tissues and fluids and correlates with advanced disease and poor prognosis [61,62,63,64].
PA2G4P4, located on the long arm of chromosome 3 (3q25.31), resides within the region of the long intergenic non-coding RNA 886 (LINC00886). Its functional counterpart, PA2G4, is located on chromosome 12 and encodes ErbB3-binding protein (EBP1), which plays a pivotal role in many cancers [65,66,67]. PA2G4P4 is upregulated in invasive bladder cancer cell lines and patient samples, where it contributes to cancer development by regulating cell proliferation, migration, and apoptosis [66]. In glioblastoma, PA2G4P4 promotes the expression of the PA2G4 oncogene and facilitates its nuclear translocation, affecting cell viability and apoptosis [65]. Li et al. analyzed TCGA data and identified PA2G4P4 as a top-ranked pseudogene essential for tumor classification. Furthermore, overexpression of PA2G4P4 has been observed in several tumor types, including HNSCC, ovarian cancer, and sarcoma [68]. Together, these findings underscore the oncogenic potential of ANXA2P2 and PA2G4P4 and justify further investigation into their clinical and mechanistic roles in HNSCC.
Recent studies suggest that pseudogenes are not merely transcriptional noise or non-functional “junk DNA,” but rather play crucial roles in cellular processes. Pseudogene-derived RNAs can act as competitive endogenous RNAs (ceRNAs), antisense RNAs, or serve as sources of small interfering RNAs (siRNAs), thereby influencing the expression of other genes involved in cancer development and progression. Furthermore, pseudogenes may affect the sequence integrity and transcriptional regulation of their parental genes. These regulatory functions may contribute significantly to the initiation and progression of HNSCC, especially through complex post-transcriptional networks and feedback mechanisms that remain to be fully explained.
We also observed a significant association between the expression levels of these pseudogenes and tumor localization, particularly in tumors originating from the pharynx and oral cavity. We hypothesize that the tumor localization of the localization-specific expression may reflect regionally distinct oncogenic functions of these pseudogenes. Additionally, expression levels positively correlated with key clinicopathological parameters such as cancer stage, T-stage, N-stage, and tumor grade. That supports our hypothesis of a potential oncogenic function of the above pseudogenes in HNSCC. However, other mechanisms, such as changes in cellular transcription during cancer progression, cannot be excluded.
Importantly, ANXA2P2 expression differed between HPV(-) and HPV(+) patients. In our previous work, we indicated that PTTG3P is associated with HPV infection in HNSCC [23]. Santini et al. showed that ANXA2P2 is downregulated in invasive cervical carcinomas in comparison to normal cervical keratinocytes. The above supports our observation in the HPV(+) patients displaying lower levels of the transcript [69]. Moreover, the ANXA2T (annexin A2 heterotetramer) is involved in HPV endocytosis, capsid disassembly as well as in virion degradation prevention [61]. It should be noted that ANXA2 is involved in immune response [69], but the role of its pseudogene was not yet validated. We did not observe changes in the immune profile of HNSCC patients associated with the expression level of ANXA2T.
We also performed the gene set enrichment analysis to find positive and negative correlations between ANXA2P2 and PA2G4P4, and different biological processes. We found that genes correlated with the analyzed pseudogenes were associated with oncogenic processes. ANXA2P2 is positively correlated with formins activation by RHO GTPases and oncogenic MAPK signaling pathways. Formins are involved in regulating the actin cytoskeleton and in cancer cell motility and invasiveness [70]. On the other hand, the RAS/RAF/MAPK pathway regulates cellular proliferation, differentiation, and survival and is frequently mutated in human cancers [71]. GSEA analysis also indicated that patients with high expression of ANXA2P2 and PA2G4P4 have dysfunctions in carcinogenesis pathways, which suggests that they are oncogenic pseudogenes. Moreover, we observed that patients with lower expression of analyzed pseudogenes displayed lower enrichment of genes involved in the oncogenic signature gene sets in comparison to high expression groups. The cellular pathways that are often dysregulated in cancer may lead to aggressive cellular phenotype. The patients with lower expression of specific pseudogenes may display profiles like cells with BMI1 knockdown or downregulated genes associated with epithelial-to-mesenchymal transition process or longer survival, indicating the oncogenic function of studied pseudogenes in HNSCC [72].
In the treatment of HNSCC, radiotherapy represents a crucial therapeutic modality and serves as the standard of care in palliative settings [73,74,75]. However, radiotherapy is associated with numerous adverse effects, including psychological distress such as procedural stress and anxiety [76], radiation-induced skin injury and radiation dermatitis in face area [77,78], radiation induced brachial plexopathy [79] as well as problems with assessment of margin and high uncertainties with decision making between avoiding recurrence and protection of critical organs [80,81,82]. These limitations underscore the need for strategies aimed at optimizing radiotherapy efficacy and enabling biological assessment of the response to ionizing radiation [83,84,85,86,87]. One approach is epigenetic analysis and the search for epigenetic patterns that can serve as predictive biomarkers in the personalization of radiotherapy for head and neck cancers. Previously, we explored the expression of pseudogenes AURKAPS1, HERC2P2, and SDHAP1 in the context of radiotherapy response. AURKAPS1 showed predictive value, with low expression associated with improved response and decreased DNA repair gene expression, suggesting a role in modulating radiosensitivity through genomic stability [46]. Moreover, AURKAPS1 was associated with changes in DNA repair. Patients with lower levels of AURKAPS1 had better response to radiotherapy and displayed lower levels of DNA repair genes. It is probably a direct link between lower expression levels of DNA repair genes and better patients' response to radiotherapy. And probably AURKAPS1 has the same biological role in this phenomenon [46].
Here, we extended this line of inquiry to ANXA2P2 and PA2G4P4 to explore their potential roles in genomic instability and radiotherapy response in HNSCC patients. Limited evidence exists regarding the interplay between pseudogene expression, radiation response, and genomic instability [88]. Our research is the first to describe the ANXA2P2 and PA2G4P4 pseudogenes in this context. We observed that patients with higher levels of ANXA2P2 and PA2G4P4 responded worse to the radiotherapy than those with lower levels of this pseudogene. Furthermore, pathway enrichment analysis revealed that patients with high ANXA2P2 expression displayed upregulation of gene sets associated with rb_p107_dn.v1_dn, singh_kras_dependency_signature, p53 pathway, myc targets v1, rb_p130_dn.v1_dn, tbk1.dn.48hrs_dn, pi3k_akt_mtor_signaling, and in the case of PA2G4P4 enrichment of genes in pathways included MYC targets, mTORC1 signaling, genes connected with unfolded protein response, DNA repair, G2M checkpoint, E2F targets, oxidative phosphorylation and with genes changed after ablation of Rb gene (RB_p107_dn.v1_dn), in the patients with higher expression of PA2G4P4. Li et al, described the hypoxia, incistric radiosensitivity, repopulation and differentiation, as the radioresistance parameters for head and neck squamous cell carcinoma. After induction of DNA damage the cellular checkpoints are activated and lead to cell cycle arrest with the DNA repair or removal of the affected cells [88]. Regulation of mitotic spindle formation, correction of misattached kinetochore-microtubules, spindle checkpoint signaling and chromatid separation process prevents negative influence of internal and external [70]. Separation of sister chromatids is controlled by spindle checkpoint, and failure in this causes aneuploidy/polyploidy [89]. Chromosomal instability (CIN) arises from defects in the mitotic checkpoint, altered kinetochore-microtubule dynamics, centrosome amplification, and exposure to ionizing radiation. CIN can influence cancer progression in three distinct ways: it can promote tumor development, suppress tumorigenesis, or have no significant effect, depending on the genetic and cellular context [90]. In presented work we observed that higher levels of PA2G4P4 is associated with higher levels of silent and nonsilent mutation rates, and for higher levels of ANXA2P2 with lower aneuploidy score and homologous recombination defects. CIN-induced cell death, resulting from the loss of essential chromosomes, represents a potential therapeutic strategy for enhancing radiotherapy efficacy through the addition of CIN-inducing agents [90]. The overcoming of the threshold of CIN could be beneficial. Lee et al. ranked 62 different anticancer drugs for its potential to be used as modifiers of CIN using the model based on human artificial chromosome (HAC). They indicated that paclitaxel, gemcitabine, dactylolide, LMP400, talazoparib, olaparib, peloruside A, GW843682, VX-680 and cisplatin were the most affecting loss of HAC at a high frequency and could be used to lead the cells to the CIN phenotype in the context of radiotherapy [91]. It should be noted that genomic instability is characteristic and frequently occurring in HNSCC. However, this remains speculative, and further in vitro studies are necessary to establish a direct mechanistic link between ANXA2P2, PA2G4P4, and radiotherapy response [92].
It should be noted that based on our pathway analysis, we can find the up-regulation of genes in the group of patients with higher levels of ANXA2P2 and PA2G4P4 which are described as radiation resistance pathways [93], and could be useful for target therapy in HNSCC [94]. We suspect that patients with better response to radiotherapy, which as we identified were associated with lower levels of ANXA2P2 and PA2G4P4, the response to radiotherapy could be connected with changes in those pathways. However, further in vitro studies are necessary to clarify the mechanistic links between these pseudogenes and radiotherapy response.
Finally, we investigated the association between high and low ANXA2P2 and PA2G4P4 expression levels and the immune profile of HNSCC, integrating our findings with the immune profiling data reported by Thorsson et al. [49]. We observed that patients with lower expression of PA2G4P4 displayed a higher fraction of CD4 memory resisting T cells, while patients with lower expression displayed better survival rates. Low expression of PA2G4P4 was associated with the presence of regulatory T cells (Tregs). Tregs are believed to be pro-cancer [96,97]. However, Liang et al. observed that HNSCC patients with higher levels of Tregs cells have better OS and DFS [98]. Lyu et al. indicated that the pseudogene and parental gene, HLA-DPB2/HLA-DPB1, axis was strongly associated with high immune infiltration of CD8+ T cells, CD4+ T cells, Tfh, Th1, and NK cells and with high expression of majority biomarkers of monocytes, NK cell, T cell, CD8+ T cell, and Th1 in breast cancer. Moreover, HLA-DPB2 and its parental gene HLA-DPB1 are correlated with better patients' prognosis and positively correlated with the expression of programmed cell death factor 1 (PD-1), its ligand (PDL-1) and CTLA-4 [98]. Kim et al., showed that B cells are activated by irradiation and PD-1 blockade, and improve patients' survival of HPV(+) HNSCC [100]. It was shown that high fraction of activated (CD86+), antigen-presenting (CD86+/CD21-) and memory B cells (IgD-/CD27+) as well as high infiltration of T follicular helper cells and plasma cells were found in the HNSCC tumors [100]. We observed that in patients with low PA2G4P4 expression, the naïve B cells were upregulated and memory B cells were downregulated. Previous reports indicated that the role of tumor infiltrating lymphocytes (TILs) is complex and might be affected by a number of factors with pro- or anticancer activity [101]. We also observed M1 type macrophages in patients with lower expression of PA2G4P4 pseudogene. The postulated polarized macrophage presence in specific tumor regions is essential for OSCC [102] and only M2-like marker CD163+ predicts poor prognosis in HNSCC [103]. The above findings indicate complexity of HNSCC immunity and suggest that pseudogenes may display either direct or indirect effect on HNSCC microenvironment. There has been increasing evidence of the clinical importance of stromal and immune cells in the tumor microenvironment [104]. Those cells are involved in tumor growth, invasion, and metastasis [105,106]. We found that high expression of ANXA2P2 and PA2G4P4 correlated with lower stromal scores. High expression of PA2G4P4 correlated negatively with the immune score. There is no data related to the PA2G4P4 in cancer immunology.
Our study is limited by the disparity in sample sizes between the control and tumor groups, which may influence the robustness of the findings. To address this limitation, future research should focus on validating these findings using larger, well-balanced cohorts of HNSCC and normal tissue samples. Additionally, the inclusion of matched adjacent normal tissues from the same patients could help minimize variability and strengthen the reliability of the conclusions. Furthermore, a significant challenge in validating our findings is the lack of suitable data on ANXA2P2 and PA2G4P4 in publicly available datasets, such as the Gene Expression Omnibus, which could be used for independent in silico validation and comparison with our results derived from the TCGA. While this limitation prevents us from conducting direct validation within external datasets, we acknowledge this gap and emphasize the need for further investigations using independent datasets, either computationally or experimentally through in vitro and in vivo models.
Despite these limitations, this report represents an important step in characterizing the potential oncogenic roles of ANXA2P2 and PA2G4P4 in HNSCC. As the first study to explore the involvement of these pseudogenes in this malignancy, our findings serve as a basis for future research.
5. Conclusions
Based on the presented results, we hypothesize that the identified pseudogenes ANXA2P2 and PA2G4P4 may have potential significance in the pathogenesis of HNSCC. However, definitive evidence of their involvement must be confirmed through in vitro or in vivo models. Based on the results we conclude 1) ANXA2P2 and PA2G4P4 pseudogenes contribute to HNSCC pathogenesis. Both pseudogenes were significantly overexpressed in HNSCC tumor samples compared to normal tissues. Their expression levels were associated with tumor localization and HPV status, indicating their potential role in tumor development. 2) Potential oncogenic role of ANXA2P2 and PA2G4P4. High expression of these pseudogenes correlated with the activation of oncogenic signaling pathways. Moreover, the expression levels were associated with TCGA tumor subtypes, proliferation rates, and wound healing ability, further supporting their classification as oncogenes. 3) Patients with low expression of ANXA2P2 and PA2G4P4 had significantly longer overall survival. Here, we noticed lower expression levels were also associated with better response to radiotherapy, suggesting their potential predictive value for treatment outcomes. 4) The expression of these pseudogenes was correlated with distinct immune profiles and highlighted their possible role in tumor-immune interactions. In summary, while our findings suggest their potential as biomarkers, further studies are required to fully elucidate their molecular mechanisms and clinical utility in cancer pathogenesis.
Supplementary Materials
Supplementary materials are the integral part of this work. Supplementary Figure F1. Preselection of ANXA2P2 and PA2G4P4 pseudogenes based on UALCAN and ENCORI databases: A) expression levels in healthy and cancer tissue; B) association of pseudogene expression with patient survival; Graphs downloaded from UALCAN and ENCORI databases, modified; ns - not significant, *** p < 0.001, ** p < 0.01 and * p < 0.05 considered as significant; FDR - false discovery rate; LogRank (Mantel-Cox) test; low and high subgroups of patients divided based on mean expression; p < 0.05 considered significant; HR - hazard ratio; 95 % CI - confidence interval; coefficient β (Coef β). Supplementary Figure F2. Characteristics of parental genes of ANXA2P and PA2G4P4 pseudogenes: A) expressions levels of ANXA2 and PA2G4 in normal and cancer samples based on the UALCAN database; B) correlation of parental gene and its pseudogene, ANXA2 and ANXA2P2, PA2G4 and PA2G4P4 as well as between two parental genes, ANXA2 and PA2G4, in normal and cancer samples using the GEPIA2 database; C) expression levels of parental genes depending on the HPV status; HPV(-) and HPV(+) group of patients based on UALCAN database; D) OS and DFS for parental genes of ANXA2P2 and PA2G4P4 based on the GEPIA2 database; p < 0.05 considered significant; HR - hazard ratio; 95 % CI - confidence interval. Supplementary Table S1. Spearman R values - correlation matrix between ANXA2P and PA2G4P4 expression levels. Supplementary Table S2. Association of ANXA2P and PA2G4P4 expression levels and classification to the atypical, basal, classical and mesenchymal tumor subtype based on the TCGA characteristics, proliferation ratio, wound healing ability and intratumor heterogeneity; p < 0.05 considered as significant. Supplementary Table S3. Genes are negatively or positively correlated with ANXA2P and PA2G4P4, and classified into cellular processes and pathways based on REACTOME analysis. Supplementary Table S4. List of processes and genes enriched between groups of patients with high expression of ANXA2P and PA2G4P4 based on GSEA analysis. Supplementary Table S5. Association of ANXA2P and PA2G4P4 with the response to ionizing radiation. Supplementary Table S6. Association of the expression levels of ANXA2P and PA2G4P4 pseudogenes with the immune profile of HNSCC patients. Supplementary Table S7. Immunological profile of HNSCC patients associated with the expression level of ANXA2P and PA2G4P4 pseudogenes.
Author Contributions
Authors’ individual contributions: conceptualization – TK methodology - TK; investigation - PB, MD, KK, MC, AL, TK, KG, JKM, PP, KD, NG, KR, PM, AFS, UK, MJP, AZ, PG, PM, KT; data curation - MD, MC, KK, AL, TK writing - original draft preparation - PB, MD, MC, KK, AL, TK; writing - review and editing - TK, KL, PB, AT, EL,AP, UK, ZC, BS, KR; visualization - MD, KK, MC, AL, TK; supervision - TK, ZC, BS, AT; funding acquisition - TK,PB, ZC, BS, KR, AT, TK, PB - have contributed equally to this work.
Funding
This work was supported by Greater Poland Cancer Center and Poznan University of Medical Sciences (Department of Cancer Immunology, Chair of Medical Biotechnology - budget for scientific activities).
Data Availability Statement
The datasets used and/or analyzed during the current study are available from the corresponding author on reasonable request. Raw data are available on the XenaBrowser, Ualcan, cBioportal and ESTIMATE databases.
Acknowledgments
Publication was made during the class “Analysis of experimental data”, performed in the Chair of Medical Biotechnology, Department of Cancer Immunology, Poznan University of Medical Sciences, in 2020/2021 and Greater Poland Cancer Centre — grant no.: 22/02/2024/BAK/WCO/002 and grant No.: 7/2022 (259); 10/11/21/PGN/WCO/0/3 to AT. Joanna Kozłowska-Masłoń received a PhD program scholarship at the time of writing this manuscript from Adam Mickiewicz University in Poznan.
Conflicts of Interest
The authors declare that there is no conflict of interest regarding the publication of this paper. All authors read and approved the final manuscript.
Ethics approval
Study is based on analysis of freely available data sets and does not need any ethics committee’s agreement, and does not violate the rights of other persons or institutions.
Abbreviation
| CI | Confidence Interval |
| DFS | Disease Free Survival |
| ESTIMATE | Estimation of STromal and Immune cells in MAlignant Tumor tissues using Expression data |
| FDR | False Discovery Rate |
| GSEA | Gene Set Enrichment Analysis |
| HNSCC | Head and Neck Squamous Cell Carcinoma |
| HPV | Human papillomavirus |
| MHC | Major Histocompatibility Complex |
| NES | Normalized Enrichment Score |
| OS | Overall Survival |
| ROC | Receiving-operating characteristic |
| TCGA | The Cancer Genome Atlas |
References
- Marur, S.; Forastiere, A.A. Head and Neck Squamous Cell Carcinoma: Update on Epidemiology, Diagnosis, and Treatment. Mayo Clin Proc. 2016, 91, 386–396. [Google Scholar] [CrossRef] [PubMed]
- Dyzmann-Sroka, A.; Malicki, J.; Jędrzejczak, A. Cancer incidence in the Greater Poland region as compared to Europe. Rep Pract Oncol Radiother. 2020, 25, 632–636. [Google Scholar] [CrossRef] [PubMed]
- Rothenberg, S.M.; Ellisen, L.W. The molecular pathogenesis of head and neck squamous cell carcinoma. J Clin Invest. 2012, 122, 1951–1957. [Google Scholar] [CrossRef]
- Rupar, M.J.; Golusinski, P.; Golusinski, W.; Masternak, M.M. Human Papillomavirus and the use of nanoparticles for immunotherapy in HPV-related cancer: A review. Rep Pract Oncol Radiother. 2019, 24, 544–550. [Google Scholar] [CrossRef]
- Rajabi-Moghaddam, M.; Abbaszadeh, H. Gene polymorphisms and prognosis of head and neck squamous cell carcinoma: a systematic review. Rep Pract Oncol Radiother. 2022, 27, 1045–1057. [Google Scholar] [CrossRef] [PubMed]
- Rajabi-Moghaddam, M.; Abbaszadeh, H. Gene polymorphisms and risk of head and neck squamous cell carcinoma: a systematic review. Rep Pract Oncol Radiother. 2022, 27, 1058–1076. [Google Scholar] [CrossRef]
- Alayón, L.F.; Salas, B.S.; Diaz-Saavedra, R.C.; Ortiz, A.R.; Martin, J.Z.; Jimenez, P.C.L.; Sáez-Bravo, M.L. Screening oropha-ryngeal dysphagia in patients with head and neck cancer in a radiation oncology department. Rep. Pract. Oncol. Radiother. 2024, 28, 756–763. [Google Scholar] [CrossRef]
- O’Dwyer, N.; O’Connell, L.; Browne, D.; Khosravi, B.; Brennan, S.; Duane, F.; Armstrong, J.; Boychak, O.; McArdle, O. Treatment of oropharyngeal cancer during the COVID-19 lockdown—Outcomes for patients treated during the pandemic. Rep. Pract. Oncol. Radiother. 2024, 29, 606–613. [Google Scholar] [CrossRef]
- Gordon, K.; Gulidov, I.; Semenov, A.; et al. Proton re-irradiation of unresectable recurrent head and neck cancers. Rep Pract Oncol Radiother. 2021, 26, 203–210. [Google Scholar] [CrossRef]
- Koiwai, K.; Hirasawa, D.; Sugimura, M.; et al. Impact of upgraded radiotherapy system on outcomes in postoperative head and neck squamous cell carcinoma patients. Rep Pract Oncol Radiother. 2022, 27, 954–962. [Google Scholar] [CrossRef]
- Viani, G.A.; Faustino, A.C.; Danelichen, A.F.B.; et al. Radiotherapy for locally advanced head and neck cancer in elderly patients: results and prognostic factors a single cohort. Rep Pract Oncol Radiother. 2021, 26, 12–19. [Google Scholar] [CrossRef]
- Sindhu, S.K.; Bauman, J.E. Current Concepts in Chemotherapy for Head and Neck Cancer. Oral Maxillofac Surg Clin North Am. 2019, 31, 145–154. [Google Scholar] [CrossRef]
- Li, C.X.; Tan, X.R.; Wei, W.; Li, M.Q.; Zhang, W.N.; Gong, Z.C.; Zhang, Y.; Zhao, H.R. A radiobiological perspective on radioresistance or/and radiosensitivity of head and neck squamous cell carcinoma. Rep Pract Oncol Radiother. 2024, 28, 809–822. [Google Scholar] [CrossRef] [PubMed] [PubMed Central]
- Guglas, K.; Kozłowska-Masłoń, J.; Kolenda, T.; et al. Midsize noncoding RNAs in cancers: a new division that clarifies the world of noncoding RNA or an unnecessary chaos? Rep Pract Oncol Radiother. 2022, 27, 1077–1093. [Google Scholar] [CrossRef]
- Kozłowska-Masłoń, J.; Guglas, K.; Kolenda, T.; Lamperska, K.; Makałowska, I. miRNA in head and neck squamous cell carcinomas: promising but still distant future of personalized oncology. Rep Pract Oncol Radiother. 2023, 28, 681–697. [Google Scholar] [CrossRef]
- Kolenda, T.; Guglas, K.; Kopczyńska, M.; et al. Good or not good: Role of miR-18a in cancer biology. Rep Pract Oncol Radiother. 2020, 25, 808–819. [Google Scholar] [CrossRef]
- Kolenda, T.; Guglas, K.; Baranowski, D.; et al. cfRNAs as biomarkers in oncology - still experimental or applied tool for personalized medicine already? Rep Pract Oncol Radiother. 2020, 25, 783–792. [Google Scholar] [CrossRef]
- Kolenda, T.; Paszkowska, A.; Braska, A.; et al. Host gene and its guest: short story about relation of long-noncoding MIR31HG transcript and microRNA miR-31. Rep Pract Oncol Radiother. 2023 2023, 28, 114–134. [Google Scholar] [CrossRef]
- Xiao-Jie, L.; Ai-Mei, G.; Li-Juan, J.; Jiang, X. Pseudogene in cancer: real functions and promising signature. J Med Genet. 2015, 52, 17–24. [Google Scholar] [CrossRef]
- Shi, X.; Nie, F.; Wang, Z.; Sun, M. Pseudogene-expressed RNAs: a new frontier in cancers. Tumour Biol. 2016, 37, 1471–1478. [Google Scholar] [CrossRef] [PubMed]
- Song, X.J.; Bi, M.C.; Zhu, Q.S.; Liu, X.L. The emerging role of lncRNAs in the regulation of osteosarcoma stem cells. Eur Rev Med Pharmacol Sci. 2022, 26, 966–974. [Google Scholar] [CrossRef]
- Yang, Y.F.; Feng, L.; Shi, Q.; et al. Silencing novel long non-coding RNA FKBP9P1 represses malignant progression and inhibits PI3K/AKT signaling of head and neck squamous cell carcinoma in vitro. Chin Med J (Engl) 2020, 133, 2037–2043. [Google Scholar] [CrossRef]
- Grzechowiak, I.; Graś, J.; Szymańska, D.; et al. The Oncogenic Roles of PTTG1 and PTTG2 Genes and Pseudogene PTTG3P in Head and Neck Squamous Cell Carcinomas. Diagnostics (Basel) 2020, 10, 606. [Google Scholar] [CrossRef] [PubMed]
- Liu, M.; Gao, X.; Liu, C.L. Increased expression of lncRNA FTH1P3 promotes oral squamous cell carcinoma cells migration and invasion by enhancing PI3K/Akt/GSK3b/ Wnt/β-catenin signaling. Eur Rev Med Pharmacol Sci. 2018, 22, 8306–8314. [Google Scholar] [CrossRef]
- Zhu, X.; Zhao, Q.; Su, X.; et al. A three-gene signature might predict prognosis in patients with acute myeloid leukemia. Biosci Rep. 2020, 40, BSR20193808. [Google Scholar] [CrossRef] [PubMed]
- Jia, H.; Wang, X.; Sun, Z. Exploring the long noncoding RNAs-based biomarkers and pathogenesis of malignant transformation from dysplasia to oral squamous cell carcinoma by bioinformatics method. Eur J Cancer Prev. 2020, 29, 174–181. [Google Scholar] [CrossRef] [PubMed]
- Liu, J.; Xing, Y.; Xu, L.; Chen, W.; Cao, W.; Zhang, C. Decreased expression of pseudogene PTENP1 promotes malignant behaviours and is associated with the poor survival of patients with HNSCC. Sci Rep. 2017, 7, 41179. [Google Scholar] [CrossRef]
- Stasiak, M.; Kolenda, T.; Kozłowska-Masłoń, J.; et al. The World of Pseudogenes: New Diagnostic and Therapeutic Targets in Cancers or Still Mystery Molecules? Life (Basel) 2021, 11, 1354. [Google Scholar] [CrossRef]
- Paszkowska, A.; Kolenda, T.; Guglas, K.; et al. C10orf55, CASC2, and SFTA1P lncRNAs Are Potential Biomarkers to Assess Radiation Therapy Response in Head and Neck Cancers. J Pers Med. 2022, 12, 1696. [Google Scholar] [CrossRef]
- Available online: http://www.ensembl.org/Homo_sapiens/Gene/Summary?g=ENSG00000231991;r=9:33624274-33625293;t=ENST00000435128 (accessed on 28 January 2025).
- Available online: https://www.ncbi.nlm.nih.gov/gene/304 (accessed on 28 January 2025).
- Available online: https://www.genecards.org/cgi-bin/carddisp.pl?gene=ANXA2P2&keywords=annexin (accessed on 28 January 2025).
- Komalasari, N.L.G.Y.; Tomonobu, N.; Kinoshita, R.; Chen, Y.; Sakaguchi, Y.; Gohara, Y.; Jiang, F.; Yamamoto, K.I.; Murata, H.; Ruma, I.M.W.; Sumardika, I.W.; Zhou, J.; Yamauchi, A.; Kuribayashi, F.; Inoue, Y.; Toyooka, S.; Sakaguchi, M. Lysyl oxidase-like 4 exerts an atypical role in breast cancer progression that is dependent on the enzymatic activity that targets the cell-surface annexin A2. Front Oncol. 2023, 13, 1142907. [Google Scholar] [CrossRef] [PubMed] [PubMed Central]
- Pena-Alonso, E.; Rodrigo, J.P.; Parra, I.C.; Pedrero, J.M.; Meana, M.V.; Nieto, C.S.; Fresno, M.F.; Morgan, R.O.; Fernandez, M.P. Annexin A2 localizes to the basal epithelial layer and is down-regulated in dysplasia and head and neck squamous cell carcinoma. Cancer Lett. 2008, 263, 89–98. [Google Scholar] [CrossRef] [PubMed]
- Rodrigo, J.P.; Lequerica-Fernández, P.; Rosado, P.; Allonca, E.; García-Pedrero, J.M.; de Vicente, J.C. Clinical significance of annexin A2 downregulation in oral squamous cell carcinoma. Head Neck 2011, 33, 1708–1714. [Google Scholar] [CrossRef] [PubMed]
- Hsueh, P.C.; Chang, K.P.; Liu, H.P.; Chiang, W.F.; Chan, X.Y.; Hung, C.M.; Chu, L.J.; Wu, C.C. Development of a salivary autoantibody biomarker panel for diagnosis of oral cavity squamous cell carcinoma. Front Oncol. 2022, 12, 968570. [Google Scholar] [CrossRef] [PubMed] [PubMed Central]
- Rodrigo, J.P.; Martínez, P.; Allonca, E.; Alonso-Durán, L.; Suárez, C.; Astudillo, A.; García-Pedrero, J.M. Immunohistochemical markers of distant metastasis in laryngeal and hypopharyngeal squamous cell carcinomas. Clin Exp Metastasis 2014, 31, 317–325. [Google Scholar] [CrossRef] [PubMed]
- Yu, J.S.; Chen, Y.T.; Chiang, W.F.; Hsiao, Y.C.; Chu, L.J.; See, L.C.; Wu, C.S.; Tu, H.T.; Chen, H.W.; Chen, C.C.; Liao, W.C.; Chang, Y.T.; Wu, C.C.; Lin, C.Y.; Liu, S.Y.; Chiou, S.T.; Chia, S.L.; Chang, K.P.; Chien, C.Y.; Chang, S.W.; Chang, C.J.; Young, J.D.; Pao, C.C.; Chang, Y.S.; Hartwell, L.H. Saliva protein biomarkers to detect oral squamous cell carcinoma in a high-risk population in Taiwan. Proc Natl Acad Sci U S A Erratum in: Proc Natl Acad Sci U S A. 2016 Nov 8, 113, E7139. doi: 10.1073/pnas.1616695113. PMID: 27663741; PMCID: PMC5068314. 2016, 113, 11549–11554. [Google Scholar] [CrossRef] [PubMed]
- Quabius, E.S.; Heinrichs, A.; Kühnel, A.; Laudien, M.; Hoppe, F.; Mlynski, R.; Ambrosch, P.; Hoffmann, M. Tonsillar swabs and sputum predict SLPI- and AnxA2 expression in tonsils: A prospective study on smoking dependent SLPI- and AnxA2-expression, and tonsillar HPV infection. Oncol Lett. 2022, 23, 164. [Google Scholar] [CrossRef] [PubMed] [PubMed Central]
- Park, I.W.; Fiadjoe, H.K.; Chaudhary, P. Impact of Annexin A2 on virus life cycles. Virus Res;Epub 2024, 345, 199384. [Google Scholar] [CrossRef] [PubMed] [PubMed Central]
- Sun, L.; Xing, G.; Wang, W.; Ma, X.; Bu, X. Proliferation-associated 2G4 P48 is stabilized by malignant T-cell amplified sequence 1 and promotes the proliferation of head and neck squamous cell carcinoma. J Dent Sci.;Epub 2023, 18, 1588–1597. [Google Scholar] [CrossRef] [PubMed] [PubMed Central]
- Lee, S.Y.; Park, H.R.; Cho, N.H.; Choi, Y.P.; Rha, S.Y.; Park, S.W.; Kim, S.H. Identifying genes related to radiation resistance in oral squamous cell carcinoma cell lines. Int J Oral Maxillofac Surg.;Epub 2013, 42, 169–176. [Google Scholar] [CrossRef] [PubMed]
- Zhang, S.; Zhang, B.; Xu, X.; Wang, L.; Feng, X.; Wang, Q.; Huang, H.; Wu, J.; Li, P.; Wang, J. HIV-1 viral protein R downregulates Ebp1 and stabilizes p53 in glioblastoma U87MG cells. Clin Transl Oncol. 2014, 16, 293–300. [Google Scholar] [CrossRef] [PubMed]
- Ejima, M.; Kadoi, K.; Honda, A. Influenza virus infection induces cellular Ebp1 gene expression. Genes Cells 2011, 16, 927–937. [Google Scholar] [CrossRef] [PubMed]
- Kolenda, T.; Śmiełowska, M.; Lipowicz, J.; Ostapowicz, J.; Pacześna, P.; Rosochowicz, M.; Poter, P.; Kozłowska-Masłoń, J.; Guglas, K.; Dudek, K.; Grzejda, N.; Regulska, K.; Florczak, A.; Kazimierczak, U.; Lamperska, K.; Teresiak, A. The RNA world: from experimental laboratory to "in silico" approach. Part 1: User friendly RNA expression databases portals. Rep Pract Oncol Radiother 2024. [Google Scholar] [CrossRef]
- Kolenda, T.; Kozłowska-Masłoń, J.; Mantaj, P.; Grzejda, N.; Kamiński, K.; Dziuba, M.; Czarnecka, M.; Leszczyńska, A.; Poter, P.; Guglas, K.; et al. AURKAPS1, HERC2P2 and SDHAP1 pseudogenes: Molecular role in development and progression of head and neck squamous cell carcinomas and their diagnostic utility. Rep. Pract. Oncol. Radiother. 2024, 29, 719–731. [Google Scholar] [CrossRef]
- Chandrashekar, D.S.; Karthikeyan, S.K.; Korla, P.K.; Patel, H.; Shovon, A.R.; Athar, M.; Netto, G.J.; Qin, Z.S.; Kumar, S.; Manne, U.; Creighton, C.J.; Varambally, S. UALCAN: An update to the integrated cancer data analysis platform. Neoplasia 2022, 25, 18–27. [Google Scholar] [CrossRef] [PubMed] [PubMed Central]
- Nulton, T.J.; Olex, A.L.; Dozmorov, M.; Morgan, I.M.; Windle, B. Analysis of The Cancer Genome Atlas sequencing data reveals novel properties of the human papillomavirus 16 genome in head and neck squamous cell carcinoma. Oncotarget 2017, 8, 17684–17699. [Google Scholar] [CrossRef] [PubMed] [PubMed Central]
- Thorsson, V.; Gibbs, D.L.; Brown, S.D.; et al. The Immune Landscape of Cancer [published correction appears in Immunity. Immunity Immunity. 2018, 48, 812–830.e14. 2019, 51, 411–412. [Google Scholar] [CrossRef] [PubMed]
- Kolenda, T.; Poter, P.; Guglas, K.; et al. Biological role and diagnostic utility of ribosomal protein L23a pseudogene 53 in cutaneous melanoma. Rep Pract Oncol Radiother. 2023, 28, 255–270. [Google Scholar] [CrossRef]
- Tang, Z.; Kang, B.; Li, C.; Chen, T.; Zhang, Z. GEPIA2: an enhanced web server for large-scale expression profiling and interactive analysis. Nucleic Acids Res. 2019, 47(W1), W556–W560. [Google Scholar] [CrossRef]
- Subramanian, A.; Tamayo, P.; Mootha, V.K.; Mukherjee, S.; Ebert, B.L.; Gillette, M.A.; Paulovich, A.; Pomeroy, S.L.; Golub, T.R.; Lander, E.S.; Mesirov, J.P. Gene set enrichment analysis: a knowledge-based approach for interpreting genome-wide expression profiles. Proc Natl Acad Sci U S A 2005, 102, 15545–15550. [Google Scholar] [CrossRef] [PubMed] [PubMed Central]
- Staniewska, E.; Tomasik, B.; Tarnawski, R.; Łaszczych, M.; Miszczyk, M. The prognostic value of red cell distribution width (RDW), neutrophil-to-lymphocyte ratio (NLR), and platelet-to-lymphocyte ratio (PLR) in radiotherapy for oropharyngeal cancer. Rep Pract Oncol Radiother. 2021, 26, 1010–1018. [Google Scholar] [CrossRef]
- Ganesh, M.S.; Narayanan, G.S.; Kumar, R. Change of telomerase activity in peripheral blood of patients with head and neck squamous cell carcinoma pre and post curative treatment. Rep Pract Oncol Radiother. 2020, 25, 28–34. [Google Scholar] [CrossRef]
- Pietrzak, A.K.; Kazmierska, J.; Marszalek, A.; et al. Dual-time-point PET/CT study protocol can improve the larynx cancer diagnosis. Rep Pract Oncol Radiother. 2020, 25, 533–538. [Google Scholar] [CrossRef]
- Kaźmierska, J.; Bajon, T.; Winiecki, T.; Borowczak, D.; Bandurska-Luque, A.; Jankowska, M.; Żmijewska-Tomczak, M. Significance of neutrophil to lymphocyte ratio as a predictor of outcome in head and neck cancer treated with definitive chemo-radiation. Rep. Pract. Oncol. Radiother. 2023, 28, 389–398. [Google Scholar] [CrossRef]
- Maćkowiak, B.; Ostrowska, K.; Kulcenty, K.; Kaźmierska, J.; Ostapowicz, J.; Nowicka, H.; Szewczyk, M.; Książek, K.; Suchorska, W.M.; Golusiński, W. The impact of XPC gene single nucleotide polymorphism rs2228001 on head and neck cancer patients’ response to radiotherapy treatment. Rep. Pract. Oncol. Radiother. 2024, 29, 148–154. [Google Scholar] [CrossRef]
- Nema, R. An omics-based tumor microenvironment approach and its prospects. Rep. Pract. Oncol. Radiother. 2024, 29, 649–650. [Google Scholar] [CrossRef] [PubMed] [PubMed Central]
- Wang, Q.S.; Shi, L.L.; Sun, F.; Zhang, Y.F.; Chen, R.W.; Yang, S.L.; Hu, J.L. High Expression of ANXA2 Pseudogene ANXA2P2 Promotes an Aggressive Phenotype in Hepatocellular Carcinoma. Dis Markers 2019, 2019, 9267046. [Google Scholar] [CrossRef] [PubMed] [PubMed Central]
- Li, S.; Zou, H.; Shao, Y.Y.; et al. Pseudogenes of annexin A2, novel prognosis biomarkers for diffuse gliomas. Oncotarget 2017, 8, 106962–106975. [Google Scholar] [CrossRef] [PubMed]
- Wang, T.; Wang, Z.; Niu, R.; Wang, L. Crucial role of Anxa2 in cancer progression: highlights on its novel regulatory mechanism. Cancer Biol Med. 2019, 16, 671–687. [Google Scholar] [CrossRef]
- Luo, S.; Xie, C.; Wu, P.; et al. Annexin A2 is an independent prognostic biomarker for evaluating the malignant progression of laryngeal cancer. Exp Ther Med. 2017, 14, 6113–6118. [Google Scholar] [CrossRef]
- Yu, J.S.; Chen, Y.T.; Chiang, W.F.; et al. Saliva protein biomarkers to detect oral squamous cell carcinoma in a high-risk population in Taiwan [published correction appears in Proc Natl Acad Sci U S A. 2016 Nov 8, 113, E7139. https://doi.org/10.1073/pnas.1616695113]. Proc Natl Acad Sci U S A 2016, 113, 11549–11554. [Google Scholar] [CrossRef]
- Zhang, W.; Gao, C.; Zhang, S.; Fang, G. Serum Annexin A2 Level Is Associated With Diagnosis and Prognosis in Patients With Oral Squamous Cell Carcinoma. J Oral Maxillofac Surg. 2017, 75, 1081–1087. [Google Scholar] [CrossRef]
- Hou, X.; Tang, W. Pseudogene PA2G4P4 promotes oncogene PA2G4 expression and nuclear translocation to affect glioblastoma cell viability and apoptosis. Life Sci. 2021, 265, 118793. [Google Scholar] [CrossRef]
- Pisapia, L.; Terreri, S.; Barba, P.; et al. Role of PA2G4P4 pseudogene in bladder cancer tumorigenesis. Biology (Basel) 2020, 9, 66. [Google Scholar] [CrossRef]
- PA2G4P4 proliferation-associated 2G4 pseudogene 4 [Homo sapiens (human)] - Gene - NCBI [Internet]. 12 Feb 2021. Available online: https://www.ncbi.nlm.nih.gov/gene/647033.
- Li, Y.; Kang, K.; Krahn, J.M.; et al. A comprehensive genomic pan-cancer classification using The Cancer Genome Atlas gene expression data. BMC Genomics 2017, 18, 508. [Google Scholar] [CrossRef] [PubMed]
- Santin, A.D.; Zhan, F.; Bignotti, E.; et al. Gene expression profiles of primary HPV16- and HPV18-infected early stage cervical cancers and normal cervical epithelium: identification of novel candidate molecular markers for cervical cancer diagnosis and therapy. Virology 2005, 331, 269–291. [Google Scholar] [CrossRef] [PubMed]
- Kitzing, T.M.; Wang, Y.; Pertz, O.; Copeland, J.W.; Grosse, R. Formin-like 2 drives amoeboid invasive cell motility downstream of RhoC. Oncogene 2010, 29, 2441–2448. [Google Scholar] [CrossRef]
- Guo, Y.J.; Pan, W.W.; Liu, S.B.; Shen, Z.F.; Xu, Y.; Hu, L.L. ERK/MAPK signalling pathway and tumorigenesis. Exp Ther Med. 2020, 19, 1997–2007. [Google Scholar] [CrossRef]
- Wiederschain, D.; Chen, L.; Johnson, B.; et al. Contribution of polycomb homologues Bmi-1 and Mel-18 to medulloblastoma pathogenesis. Mol Cell Biol. 2007, 27, 4968–4979. [Google Scholar] [CrossRef]
- Viani, G.A.; Gouveia, A.G.; Matsuura, F.K.; Neves, L.V.F.; Marta, G.N.; Chua, M.L.K.; Moraes, Y.F. Assessing the efficacy of palliative radiation treatment schemes for locally advanced squamous cell carcinoma of the head and neck: a meta-analysis. Rep Pract Oncol Radiother. 2023, 28, 137–146. [Google Scholar] [CrossRef] [PubMed] [PubMed Central]
- Pala, M.; Vrana, A.; Novakova, P.; Drbohlavova, T.; Podlesak, T. Long-term results of postoperative and definitive (chemo)radiotherapy in sinonasal carcinoma. Adult Comorbidity Evaluation 27 score as a predictor of survival. Rep Pract Oncol Radiother. 2023, 28, 147–158. [Google Scholar] [CrossRef] [PubMed] [PubMed Central]
- Takeda, K.; Umezawa, R.; Yamamoto, T.; Takahashi, N.; Suzuki, Y.; Kishida, K.; Omata, S.; Jingu, K. Survival prediction nomogram for patients with vertebral bone metastases treated with palliative radiotherapy. Rep Pract Oncol Radiother. 2023, 28, 646–653. [Google Scholar] [CrossRef] [PubMed] [PubMed Central]
- Glynn, A.M.; Harwood, R.; Garrett, B.; Harper, D.; Dunne, M.; Nicholson, J.; Rangaswamy, G.; Duane, F; Armstrong, J; McArdle, O; Brennan, S. Unmasking anxiety: a head-to-head comparison of open and closed masks in head and neck cancer radiotherapy. Rep. Pract. Oncol. Radiother. 2024, 29, 219–227. [Google Scholar] [CrossRef] [PubMed] [PubMed Central]
- Pazdrowski, J.; Gornowicz-Porowska, J.; Kaźmierska, J.; Krajka-Kuźniak, V.; Polanska, A.; Masternak, M.; Szewczyk, M.; Golusiński, W.; Danczak-Pazdrowska, A. Radiation-induced skin injury in the head and neck region: Pathogenesis, clinics, prevention, treatment considerations and proposal for management algorithm. Rep. Pract. Oncol. Radiother. 2024, 29, 373–390. [Google Scholar] [CrossRef] [PubMed]
- Basu, S.; Chatterjee, S.; Chatterjee, K.; Samanta, S.; Saha, S.; Hossain, S.T.; Mondal, P.; Biswas, S. Correlation of degree of acute radiation dermatitis (RD) with skin dose distribution in head and neck squamous cell carcinoma patients treated with definitive concurrent chemoradiation. Rep. Pract. Oncol. Radiother. 2024, 29, 579–587. [Google Scholar] [CrossRef] [PubMed] [PubMed Central]
- Noel Alexander, F.H.; Srikantia, N.; Muzumder, S.; Udayashankara, A.H.; Sebastian, M.J.; Tom, D.C.; Kathiressan, R.P.; Raj, J.M. Radiation induced brachial plexopathy in head and neck cancer patients treated with definitive radiotherapy and corre-lation with disease characteristics and dosimetric parameters. Rep. Pract. Oncol. Radiother. 2024, 29, 348–356. [Google Scholar] [CrossRef] [PubMed] [PubMed Central]
- Matuszak, N.; Piotrowski, I.; Kruszyna-Mochalska, M.; Skrobala, A.; Mocydlarz-Adamcewicz, M.; Malicki, J. Monte Carlo methods to assess biological response to radiation in peripheral organs and in critical organs near the target. Rep. Pract. Oncol. Radiother. 2024, 29, 638–648. [Google Scholar] [CrossRef] [PubMed] [PubMed Central]
- Kawahara, D.; Nagata, Y. Biological dosimetric impact of dose-delivery time for hypoxic tumour with modified microdosimetric kinetic model. Rep Pract Oncol Radiother. 2023, 28, 514–521. [Google Scholar] [CrossRef] [PubMed] [PubMed Central]
- Malicki, J.; Castro, C.L.; Fundowicz, M.; Krengli, M.; Llacer-Moscardo, C.; Curcean, S.; Montplet, C.M.; Carvalho, L.; Konstanty, E.; Barragan, T.H.; Pisani, C.; Laszlo, I.; Garau, M.M.; Kruszyna-Mochalska, M.; Lencart, J.; Zwierzchowska, D.; Serrano, A.R.; Brezae, A.; Varela, E.L.; Milecki, P.; Zannetti, M.; Coza, O.; Gonzalez, E.; Beldì, D.; Guedea, F. IROCA-TES: Improving Quality in Radiation Oncology through Clinical Audits - Training and Education for Standardization. Rep Pract Oncol Radiother. 2023, 28, 429–432. [Google Scholar] [CrossRef] [PubMed] [PubMed Central]
- Roszkowski, S.; Durczynska, Z.; Szablewska, S. Targeted nanodelivery systems for personalized cancer therapy. Rep. Pract. Oncol. Radiother. 2024, 29, 776–788. [Google Scholar] [CrossRef]
- Carneiro, M.C.; Chicrala, G.M.; Freitas, V.M.; de Lima Toyoshima, G.H.; Santos, P.S.D.S. Assessment of mouth opening before and after head and neck radiotherapy in patients with intraoral stents. Rep Pract Oncol Radiother. 2023, 28, 352–360. [Google Scholar] [CrossRef] [PubMed] [PubMed Central]
- Kaźmierska, J.; Bajon, T.; Winiecki, T.; Borowczak, D.; Bandurska-Luque, A.; Jankowska, M.; Żmijewska-Tomczak, M. Significance of neutrophil to lymphocyte ratio as a predictor of outcome in head and neck cancer treated with definitive chemoradiation. Rep Pract Oncol Radiother. 2023, 28, 389–398. [Google Scholar] [CrossRef] [PubMed] [PubMed Central]
- Calvo-Ortega, J.F.; Hermida-López, M. PRIMO Monte Carlo software as a tool for commissioning of an external beam radiotherapy treatment planning system. Rep Pract Oncol Radiother. 2023, 28, 529–540. [Google Scholar] [CrossRef] [PubMed] [PubMed Central]
- Wendykier, J.; Wojtyna, E.; Bekman, B.; Bekman, A.; Woźniak, B.; Niewiadomska, B.; Prażmowska, J.; Wendykier, P.; Bieniasiewicz, M.; Grządziel, A. Optimal values of the Electron Monte Carlo dose engine parameters. Rep Pract Oncol Radiother. 2023, 28, 416–428. [Google Scholar] [CrossRef] [PubMed] [PubMed Central]
- Kozłowska-Masłoń, J.; Guglas, K.; Paszkowska, A.; Kolenda, T.; Podralska, M.; Teresiak, A.; Bliźniak, R.; Lamperska, K. Radio-lncRNAs: Biological Function and Potential Use as Biomarkers for Personalized Oncology. J Pers Med. 2022, 12, 1605. [Google Scholar] [CrossRef] [PubMed] [PubMed Central]
- Petsalaki, E.; Zachos, G. DNA damage response proteins regulating mitotic cell division: double agents preserving genome stability. FEBS J. 2020, 287, 1700–1721. [Google Scholar] [CrossRef]
- Ito, D.; Matsumoto, T. Molecular mechanisms and function of the spindle checkpoint, a guardian of the chromosome stability. Adv Exp Med Biol. 2010, 676, 15–26. [Google Scholar] [CrossRef] [PubMed]
- Cosper, P.F.; Copeland, S.E.; Tucker, J.B.; Weaver, B.A. Chromosome Missegregation as a Modulator of Radiation Sensitivity. Semin Radiat Oncol. 2022, 32, 54–63. [Google Scholar] [CrossRef] [PubMed] [PubMed Central]
- Lee, H.S.; Lee, N.C.; Kouprina, N.; Kim, J.H.; Kagansky, A.; Bates, S.; Trepel, J.B.; Pommier, Y.; Sackett, D.; Larionov, V. Effects of Anticancer Drugs on Chromosome Instability and New Clinical Implications for Tumor-Suppressing Therapies. Cancer Res. 2016, 76, 902–911. [Google Scholar] [CrossRef] [PubMed] [PubMed Central]
- Hutchinson, M.N.D.; Mierzwa, M.; D'Silva, N.J. Radiation resistance in head and neck squamous cell carcinoma: dire need for an appropriate sensitizer. Oncogene 2020, 39, 3638–3649. [Google Scholar] [CrossRef] [PubMed] [PubMed Central]
- Li, Q.; Tie, Y.; Alu, A.; Ma, X.; Shi, H. Targeted therapy for head and neck cancer: signaling pathways and clinical studies. Signal Transduct Target Ther. 2023, 8, 31. [Google Scholar] [CrossRef] [PubMed] [PubMed Central]
- Li, Q.; Tie, Y.; Alu, A.; Ma, X.; Shi, H. Targeted therapy for head and neck cancer: signaling pathways and clinical studies. Signal Transduct Target Ther. 2023, 8, 31. [Google Scholar] [CrossRef] [PubMed] [PubMed Central]
- Damasio, M.P.S.; Nascimento, C.S.; Andrade, L.M.; de Oliveira, V.L.; Calzavara-Silva, C.E. The role of T-cells in head and neck squamous cell carcinoma: From immunity to immunotherapy. Front Oncol. 2022, 12, 1021609. [Google Scholar] [CrossRef] [PubMed] [PubMed Central]
- Jie, H. B.; Gildener-Leapman, N.; Li, J.; Srivastava, R. M.; Gibson, S. P.; Whiteside, T. L.; Ferris, R. L. Intratumoral regulatory T cells upregulate immunosuppressive molecules in head and neck cancer patients. British journal of cancer 2013, 109, 2629–2635. [Google Scholar] [CrossRef]
- Liang, B.; Tao, Y.; Wang, T. Profiles of immune cell infiltration in head and neck squamous carcinoma. Biosci Rep. 2020, 40, BSR20192724. [Google Scholar] [CrossRef] [PubMed] [PubMed Central]
- Lyu, L.; Yao, J.; Wang, M.; Zheng, Y.; Xu, P.; Wang, S.; Zhang, D.; Deng, Y.; Wu, Y.; Yang, S.; Lyu, J.; Guan, F.; Dai, Z. Overexpressed Pseudogene HLA-DPB2 Promotes Tumor Immune Infiltrates by Regulating HLA-DPB1 and Indicates a Better Prognosis in Breast Cancer. Frontiers in oncology 2020, 10, 1245. [Google Scholar] [CrossRef] [PubMed]
- Kim, S. S.; Shen, S.; Miyauchi, S.; Sanders, P. D.; Franiak-Pietryga, I.; Mell, L.; Gutkind, J. S.; Cohen, E. E. W.; Califano, J. A.; Sharabi, A. B. B Cells Improve Overall Survival in HPV-Associated Squamous Cell Carcinomas and Are Activated by Radiation and PD-1 Blockade. Clinical cancer research: an official journal of the American Association for Cancer Research 2020, 26, 3345–3359. [Google Scholar] [CrossRef] [PubMed]
- De Meulenaere, A.; Vermassen, T.; Aspeslagh, S.; Vandecasteele, K.; Rottey, S.; Ferdinande, L. TILs in Head and Neck Cancer: Ready for Clinical Implementation and Why (Not)? Head and neck pathology 2017, 11, 354–363. [Google Scholar] [CrossRef]
- Alves, A. M.; Diel, L. F.; Lamers, M. L. Macrophages and prognosis of oral squamous cell carcinoma: A systematic review. Journal of oral pathology & medicine : official publication of the International Association of Oral Pathologists and the American Academy of Oral Pathology 2018, 47, 460–467. [Google Scholar] [CrossRef]
- Troiano, G.; Caponio, V.C. A.; Adipietro, I.; Tepedino, M.; Santoro, R.; Laino, L.; Lo Russo, L.; Cirillo, N.; Lo Muzio, L. Prognostic significance of CD68+ and CD163+ tumor associated macrophages in head and neck squamous cell carcinoma: A systematic review and meta-analysis. Oral oncology 2019, 93, 66–75. [Google Scholar] [CrossRef] [PubMed]
- Kolenda, T.; Przybyła, W.; Kapałczyńska, M.; Teresiak, A.; Zajączkowska, M.; Bliźniak, R.; Lamperska, K.M. Tumor microenvironment - Unknown niche with powerful therapeutic potential. Reports of practical oncology and radiotherapy : journal of Greatpoland Cancer Center in Poznan and Polish Society of Radiation Oncology 2018, 23, 143–153. [Google Scholar] [CrossRef] [PubMed]
- Wang, H.; Wu, X.; Chen, Y. Stromal-Immune Score-Based Gene Signature: A Prognosis Stratification Tool in Gastric Cancer. Frontiers in oncology 2019, 9, 1212. [Google Scholar] [CrossRef]
- Peltanova, B.; Raudenska, M.; Masarik, M. Effect of tumor microenvironment on pathogenesis of the head and neck squamous cell carcinoma: a systematic review. Molecular cancer 2019, 18, 63. [Google Scholar] [CrossRef] [PubMed]
Figure 1.
The main steps of the methodology presented in this study based on the preselection using UALCAN and ENCORI databases two pseudogenes, named ANXA2P2 and PA2G4P4, were chosen. Next, using TCGA data downloaded from Santa Cruz UCSC Xena browser analysis was performed including: analysis of clinical and pathological features; analysis of protein-coding genes correlated with pseudogenes was done for description of pathways and processes; analysis of the role of pseudogenes in response to radiotherapy; and immune profile analysis; FDR - false discovery rate; p - probability value; UALCAN—The University of ALabama at Birmingham CANcer data analysis Portal; ENCORI—Encyclopedia of RNA Interactomes; TCGA—The Cancer Genome Atlas; GSEA—Gene Set Enrichment Analysis.
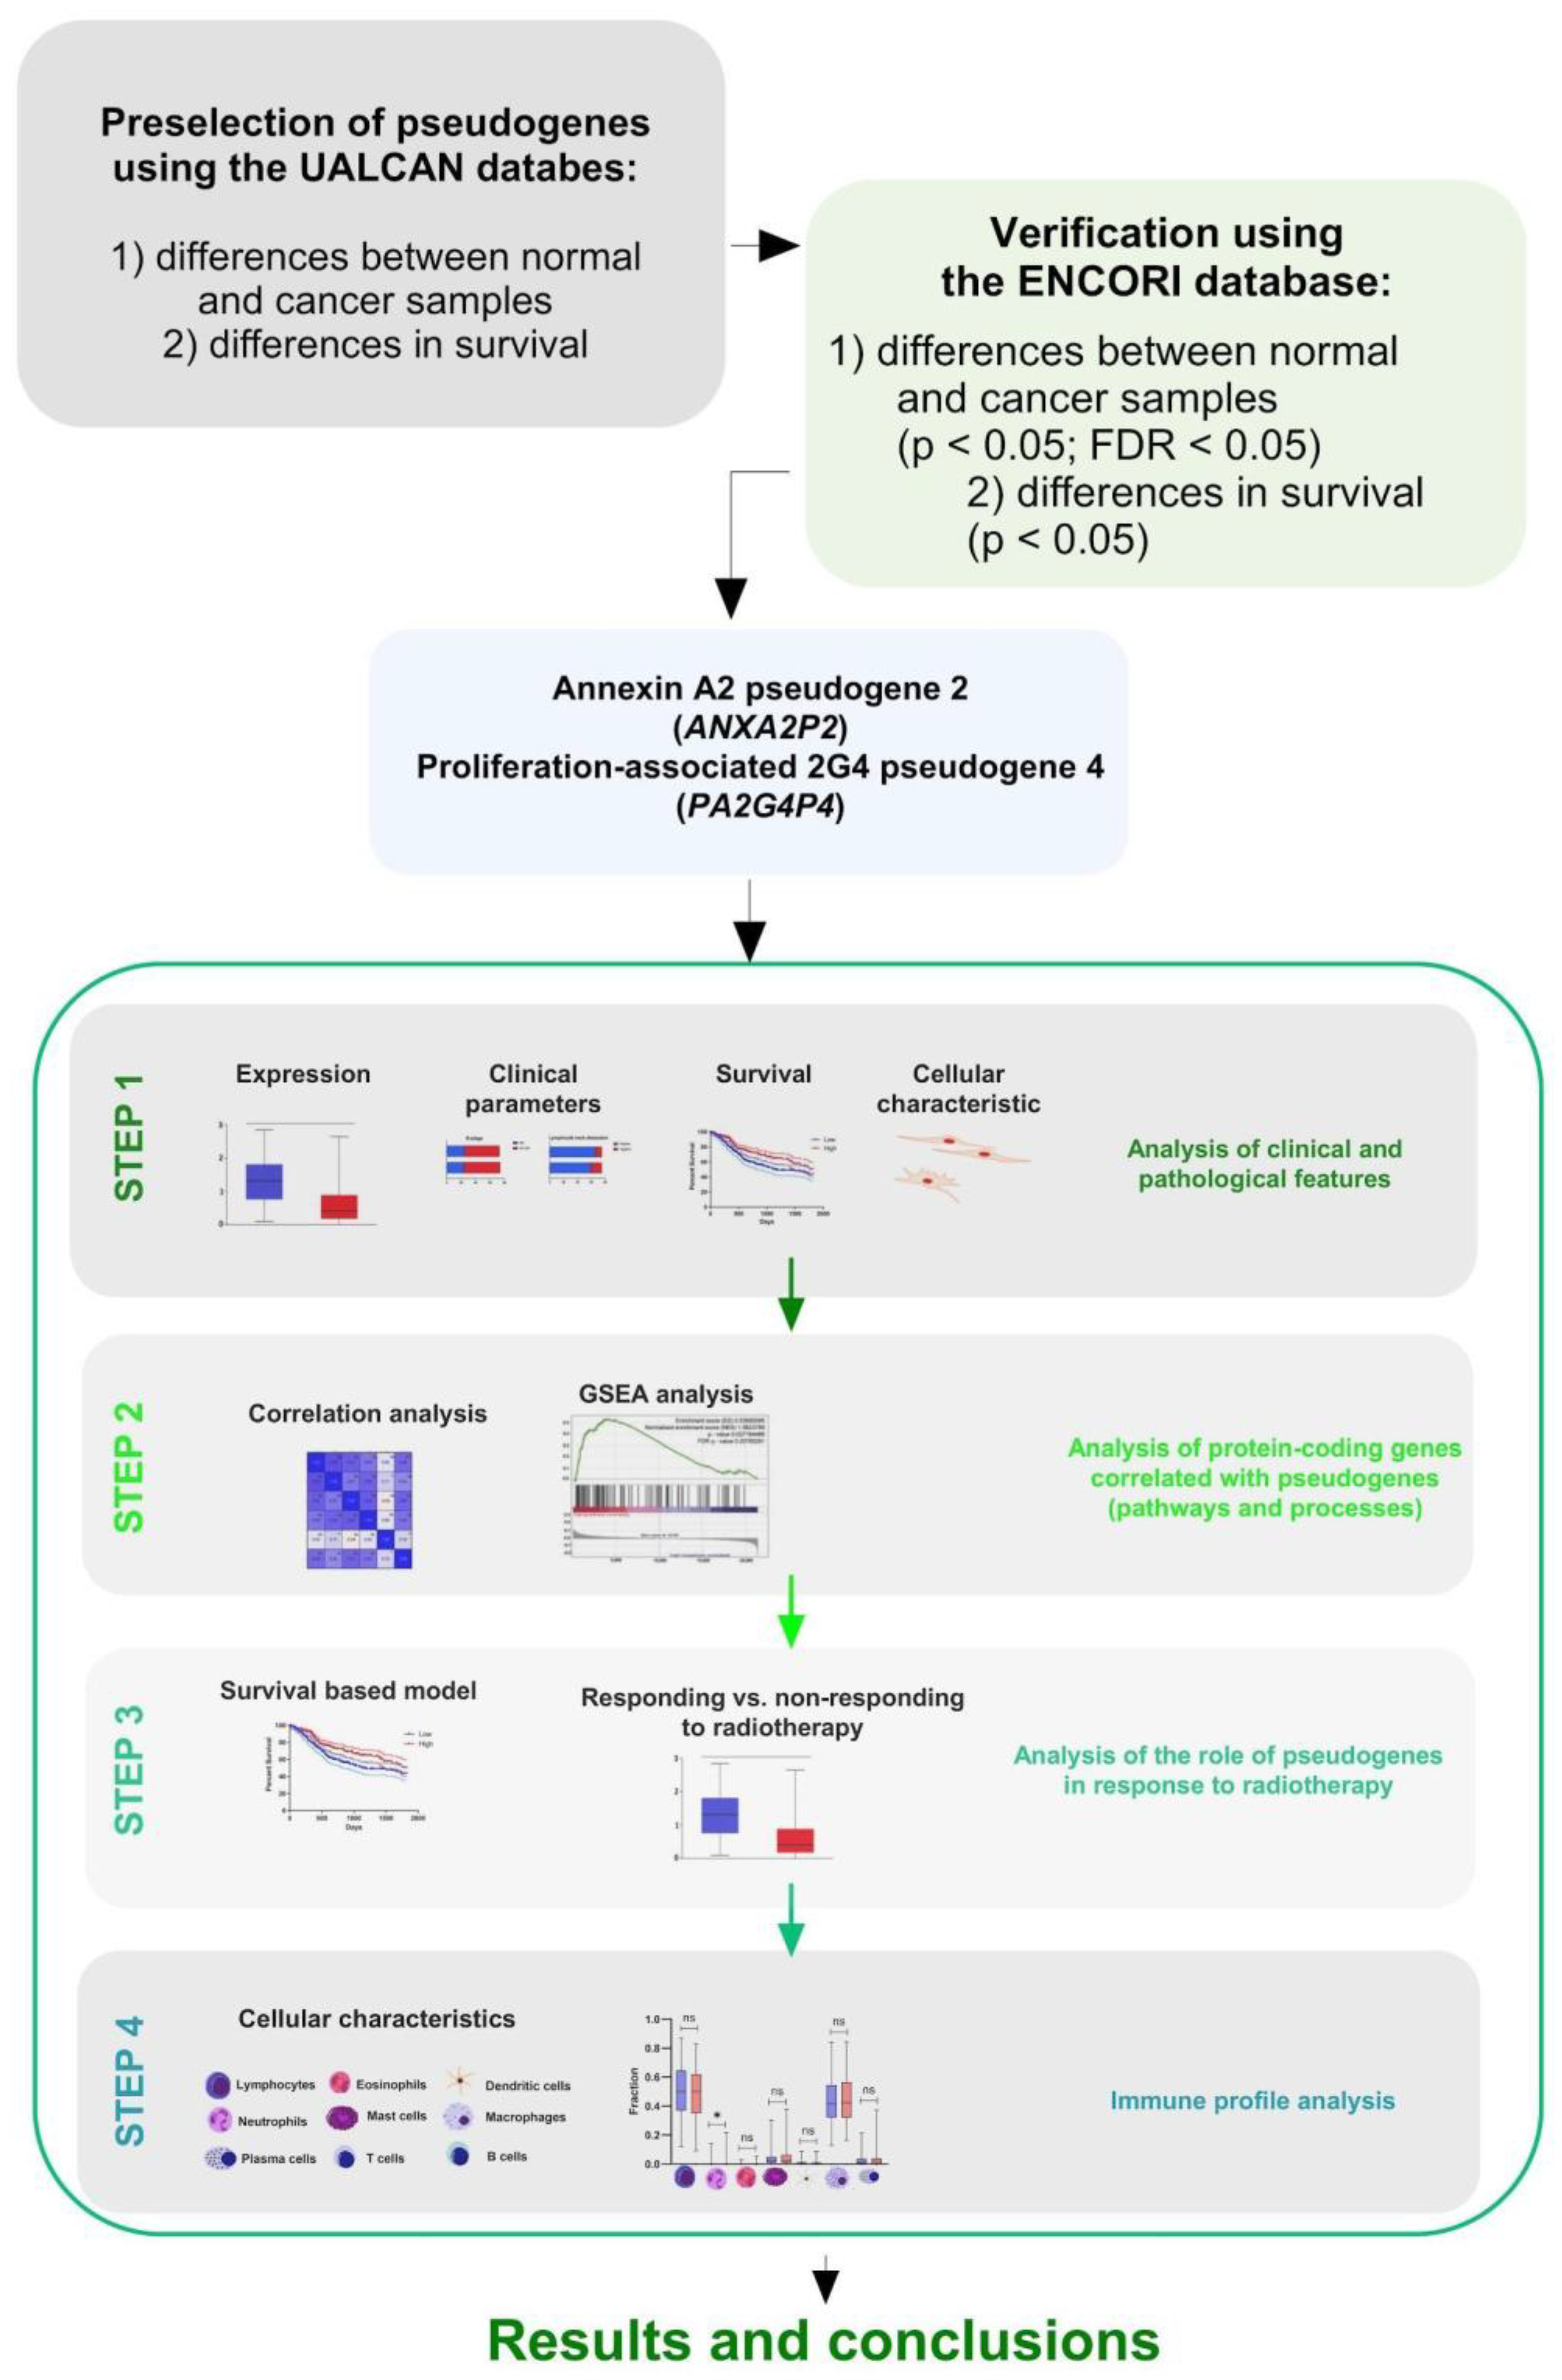
Figure 2.
The expression levels of ANXA2P2 and PA2G4P4 in HNSCC patients: A) primary tumor and normal tissue samples, un-paired T-test; B) Expression levels of all pseudogenes in various HNSCC localizations; mean ranks comparison; box and whiskers with 5-95 percentile, Kruskall-Wallis test obtained using Dunn’s multiple comparisons tests; C) expression between HPV positive and negative groups of patients; ns - not significant, **** p < 0.0001, *** p < 0.001, ** p < 0.01 and * p < 0.05 considered significant.
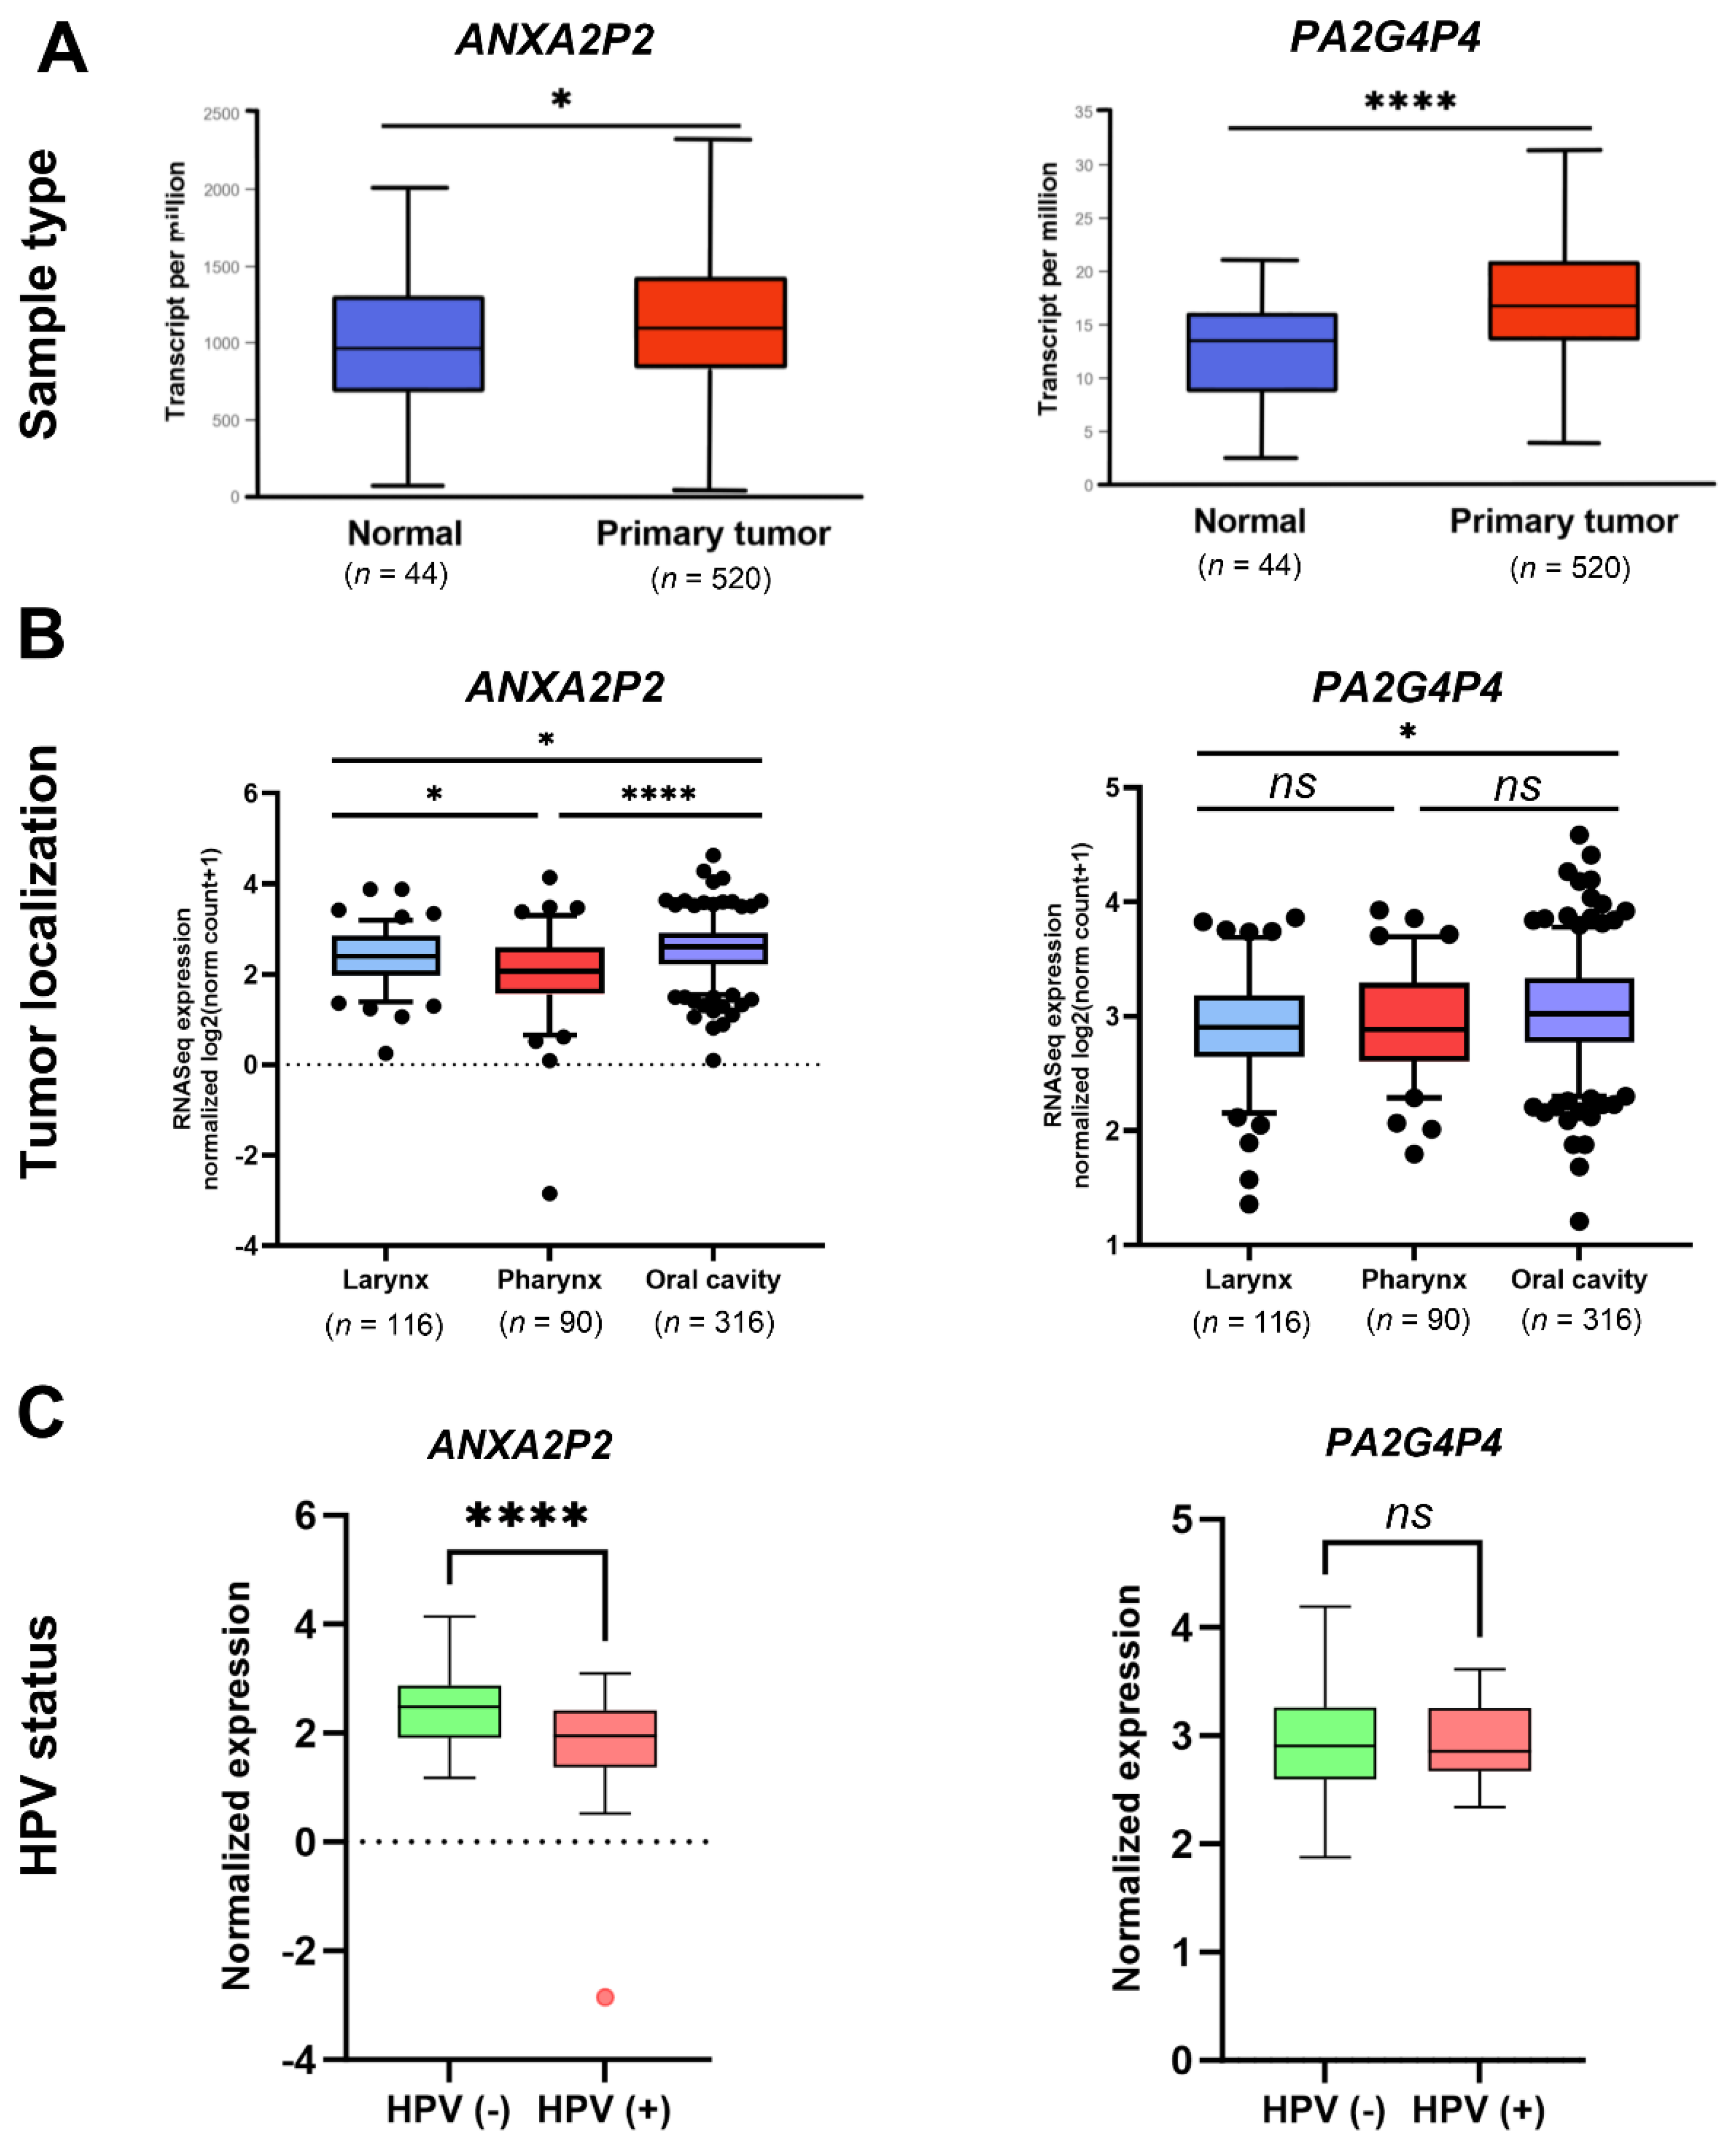
Figure 3.
Characteristics of HNSCC tumors depending on ANXA2P2 and PA2G4P4 expression levels: A) classification to the atypical, basal, classical and mesenchymal tumor subtype based on the TCGA characteristics; one way ANOVA with Tukey's multiple comparisons test or Kruskal-Wallis with Dunn’s multiple comparisons test; and B) depending on proliferation ratio, wound healing ability and intratumor heterogeneity; t-test or Mann-Whitney U test; ns - not significant, **** p < 0.0001, *** p < 0.001, ** p < 0.01 and * p < 0.05 considered significant. C) OS and DFS of HNSCC patients with all localizations of tumors depending on single expression levels of ANXA2P2 and PA2G4P4 (results presented for 3 years of observation; ap – Log-rank (Mantel-Cox) test, bp – Gehan-Breslow-Wilcoxon test) and (D) calculated for signatures expression of two pseudogenes using GEPIA2 tool. Low and high subgroups of patients divided based on mean expression; p < 0.05 considered significant; HR - hazard ratio; 95 % CI - confidence interval.
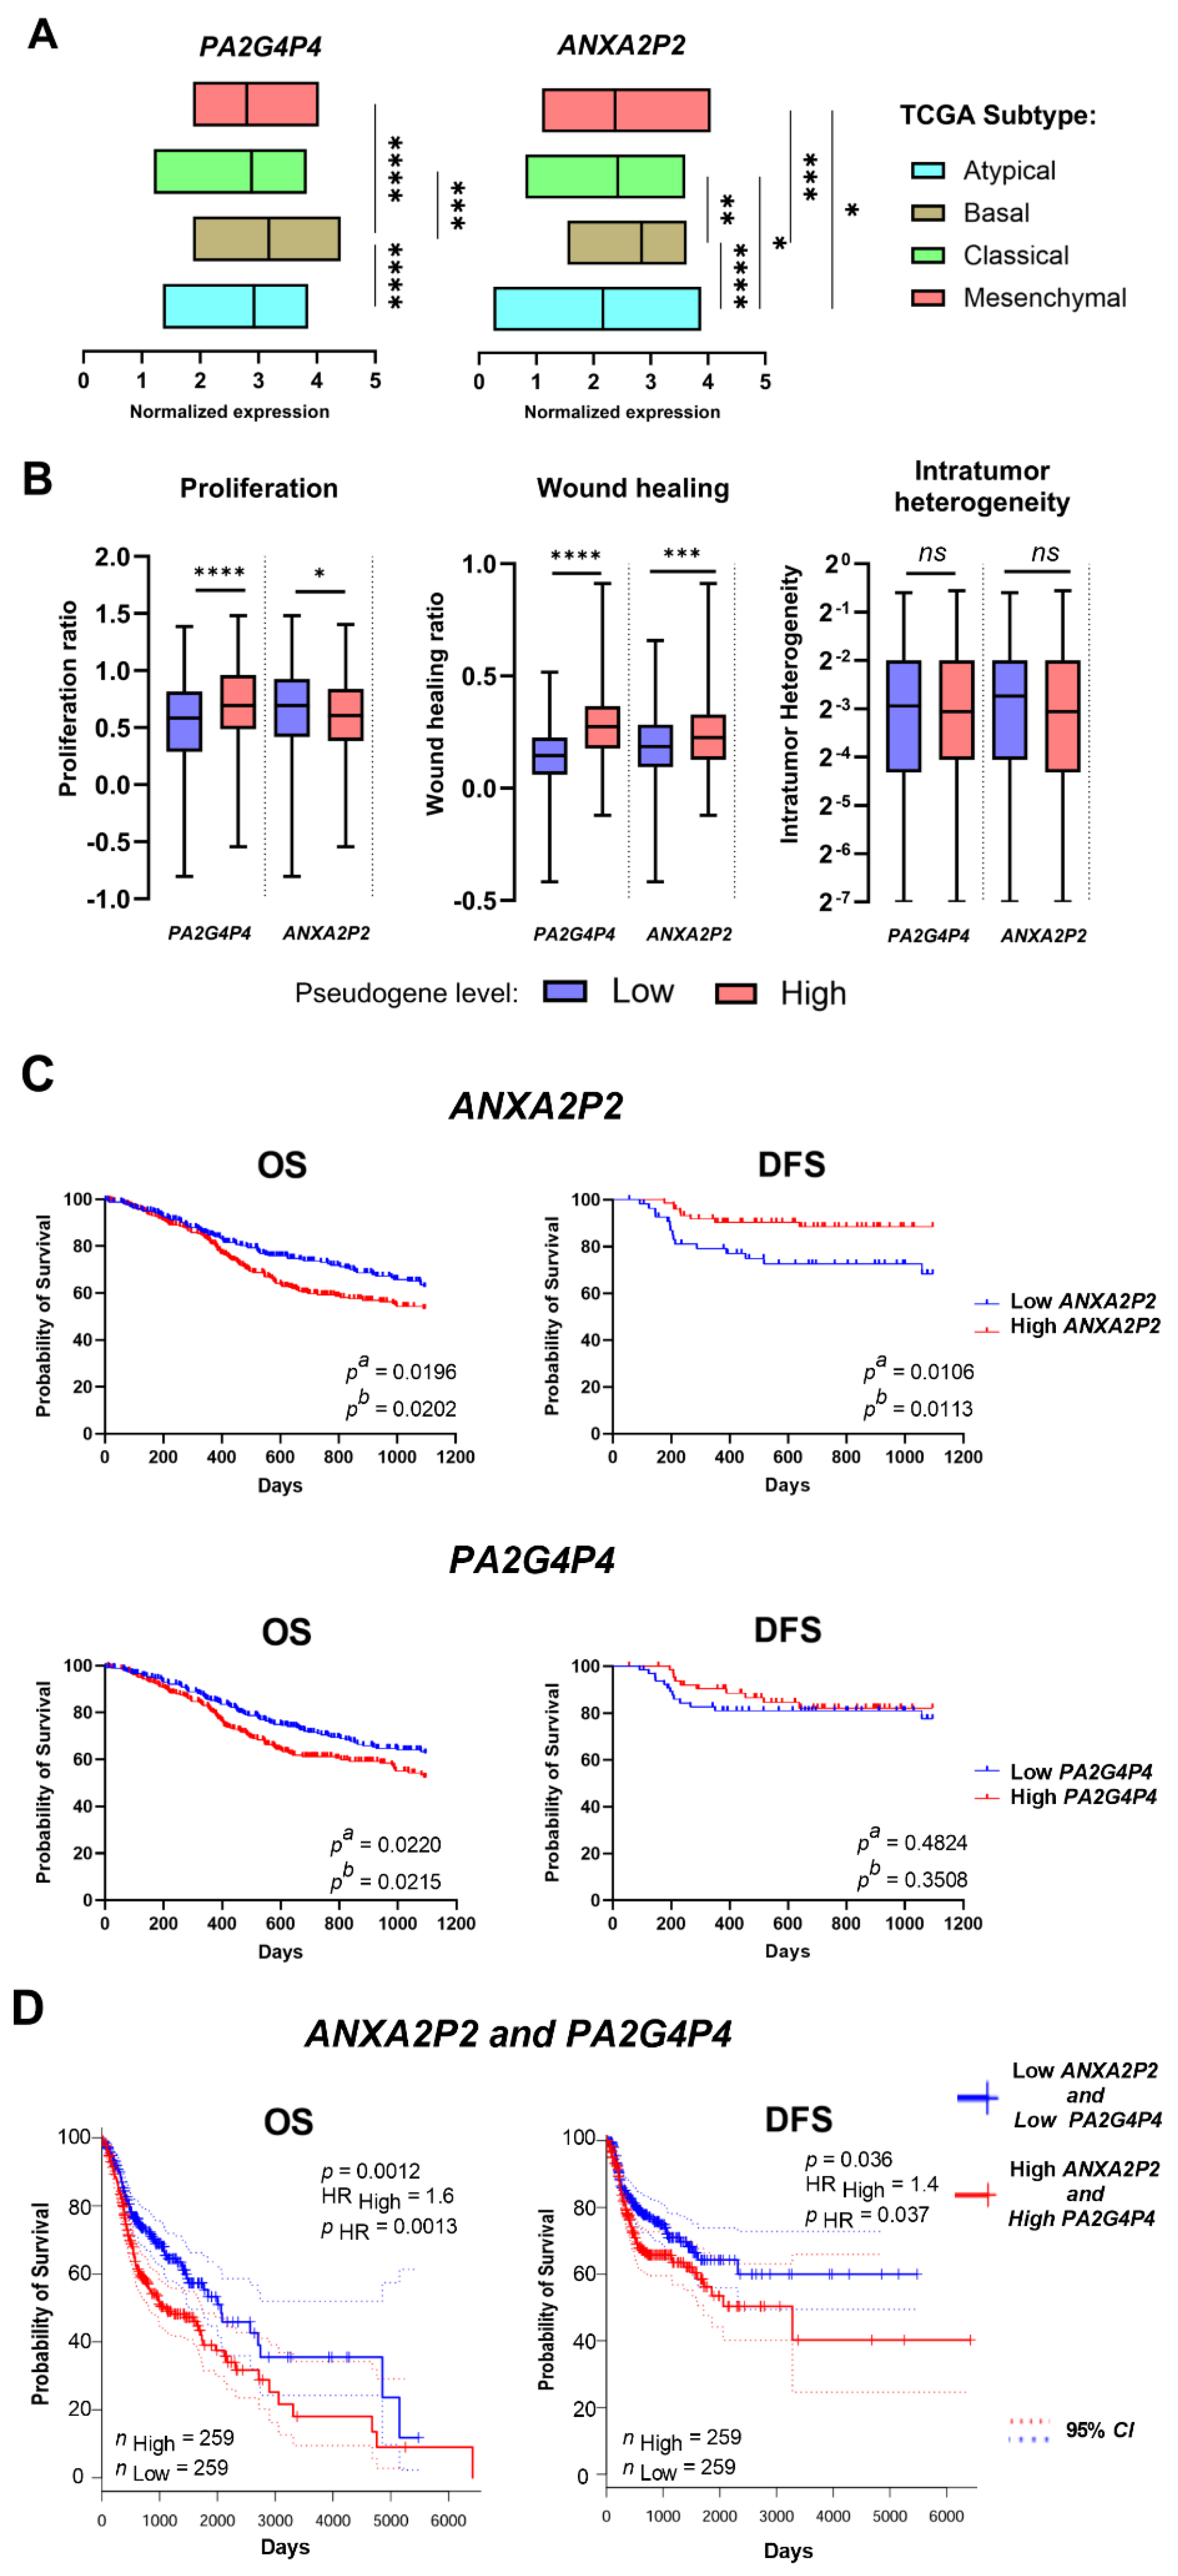
Figure 4.
A) Classification of negative (red color) and positive (blue color) correlation of ANXA2P2 and PA2G4P4 with genes involved in important cellular processes and pathways. Only genes with Spearman’s correlation > 0.3, < -0.3 and p-value < 0.05 were included in REACTOME pathway analysis. Darker red and blue colors indicate FDR < 0.05 and lighter colors indicate FDR > 0.05. B) Significantly enriched genes implicated in the signature gene hallmark and oncogenic based on GSEA analysis between groups of patients with low and high expression of ANXA2P2 and PA2G4P4 pseudogenes. NES - normalized enrichment score, count - number of genes that are enriched in a specified deregulated process; only results set with p ≤ 0.05 and FDR ≤ 0.25 were shown.
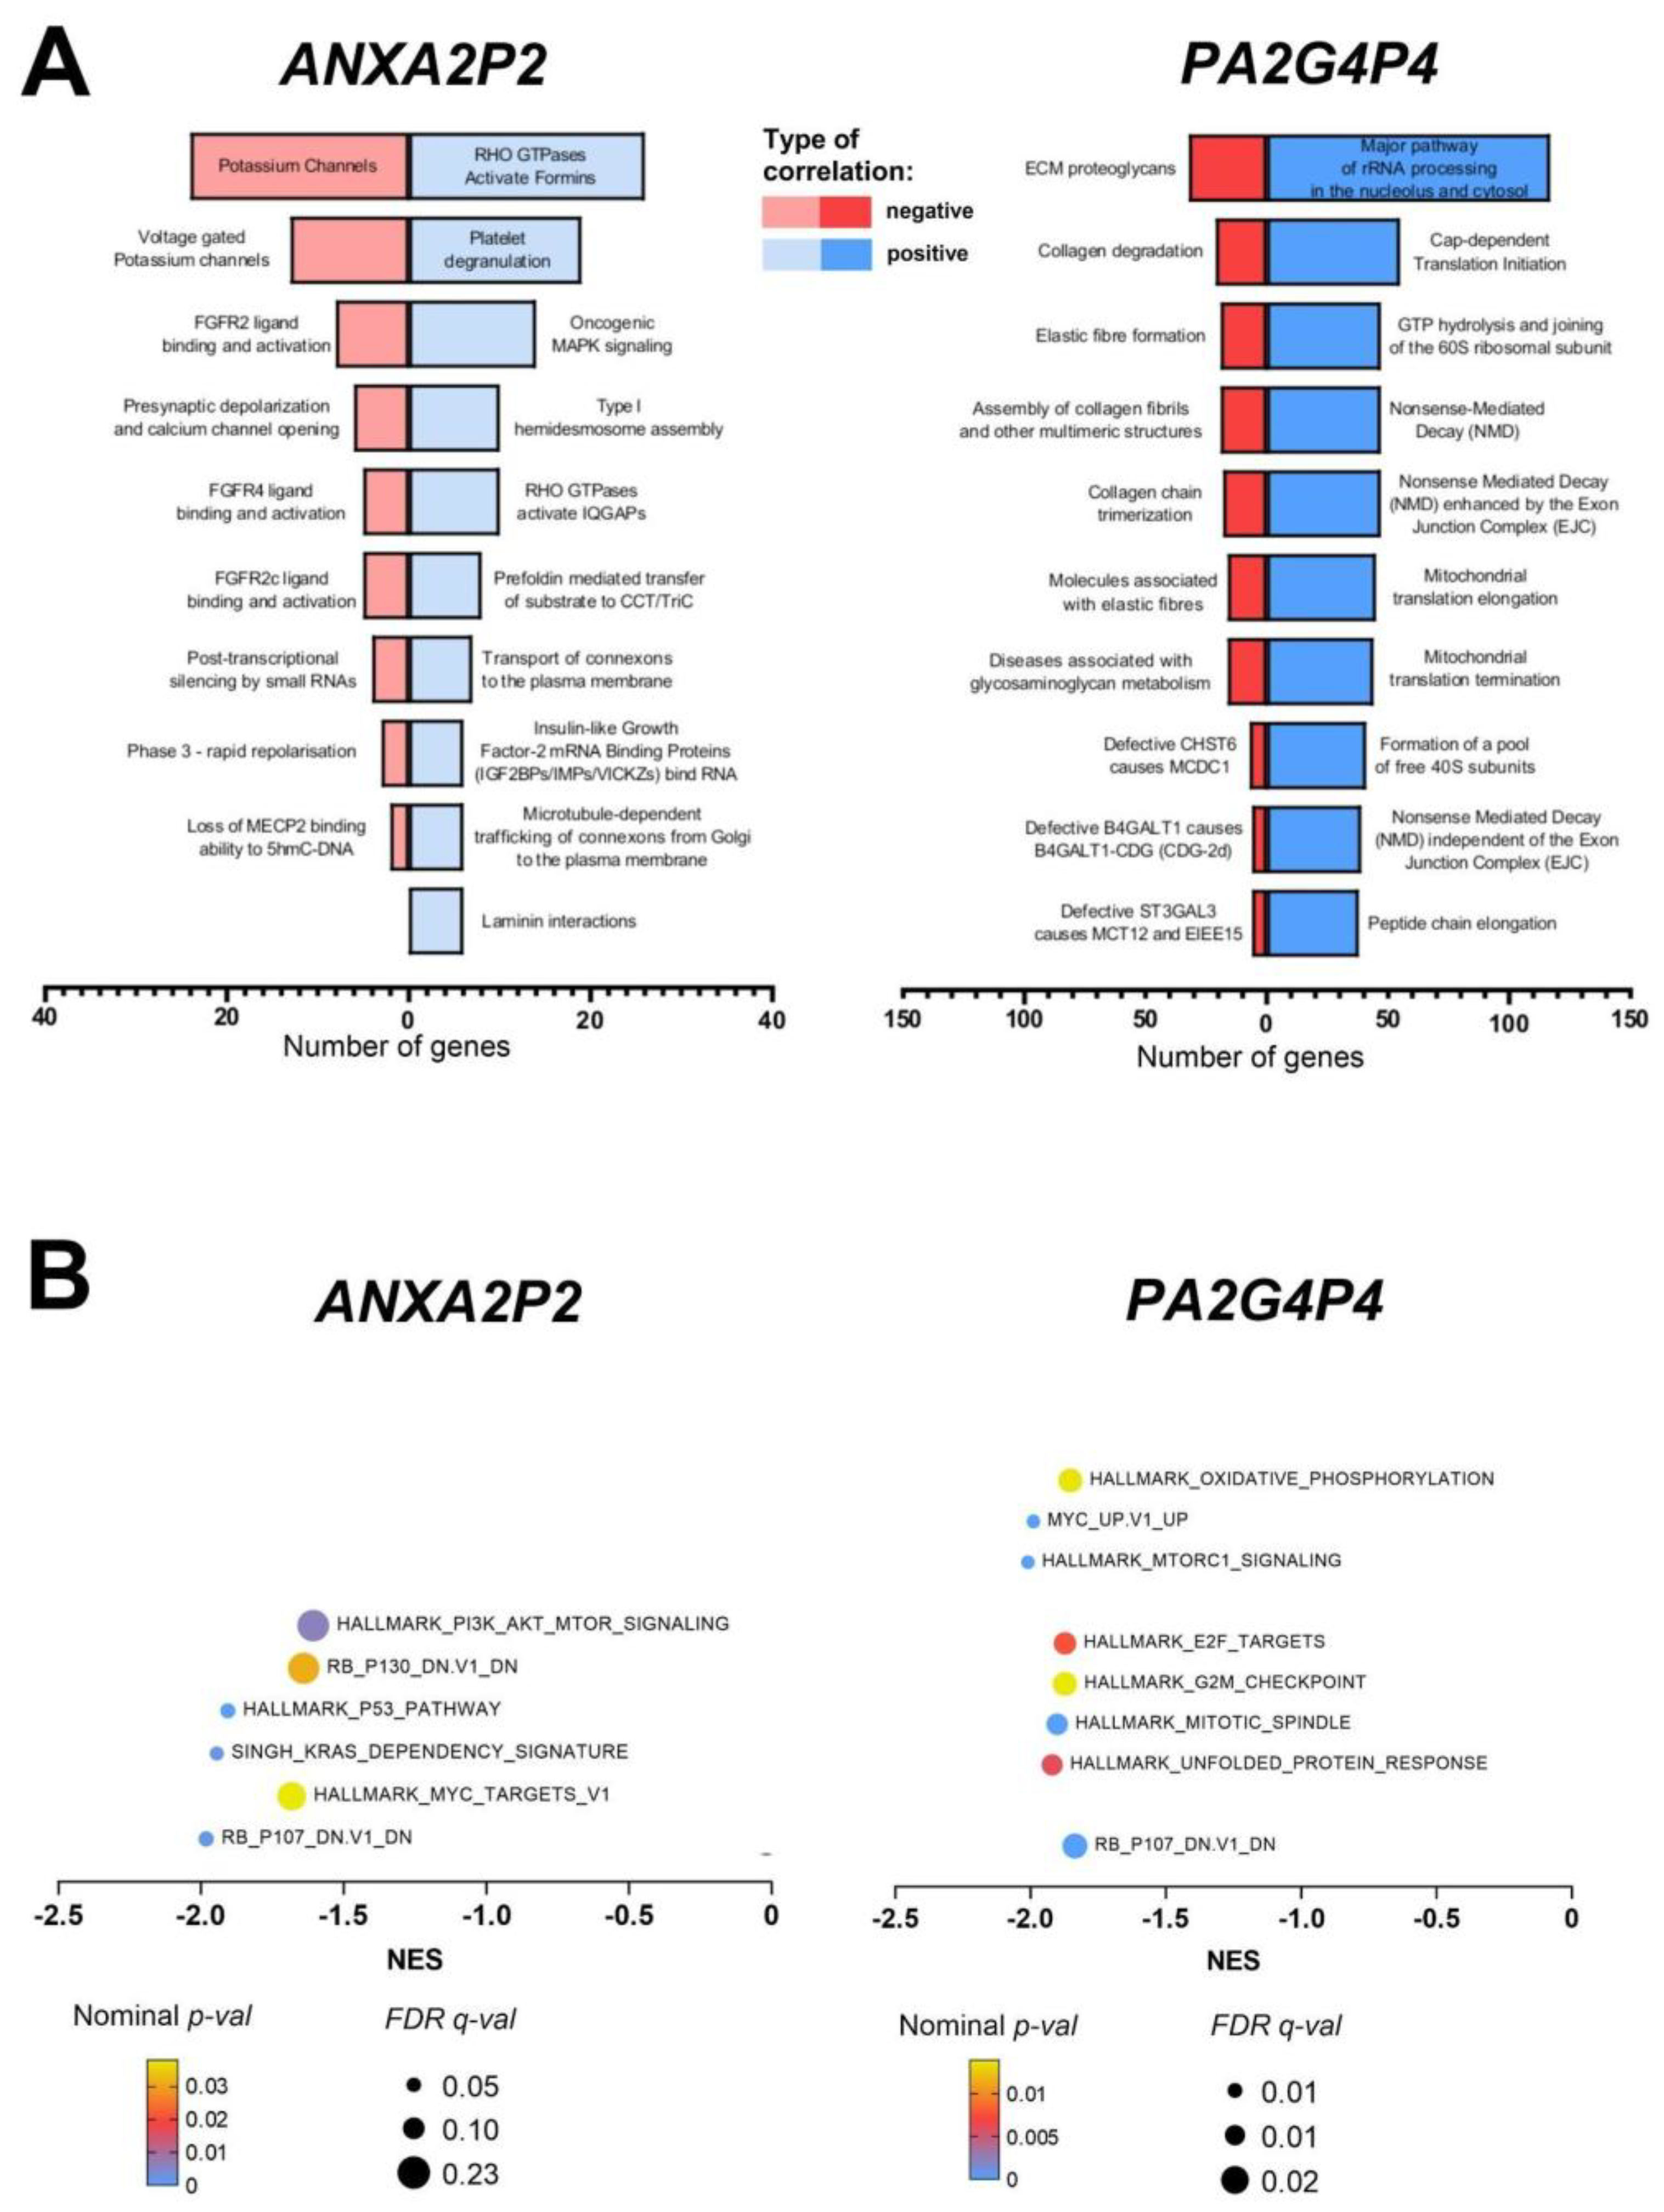
Figure 5.
Association of ANXA2P2 and PA2G4P4 pseudogenes with genome instability and response to radiotherapy of HNSCC patients: A) silent and nonsilent mutation rates, aneuploidy score and homologous recombination defects in the group of patients with low and high expression levels of specified pseudogenes; B) differences in response to radiotherapy depending on the expression levels of ANXA2P2 and PA2G4P4 pseudogenes assessed based on the model described by Paszkowska et al. [29]; t-test or Mann-Whitney U test; ns - not significant, *** p < 0.001, ** p < 0.01 and * p < 0.05 considered as significant.
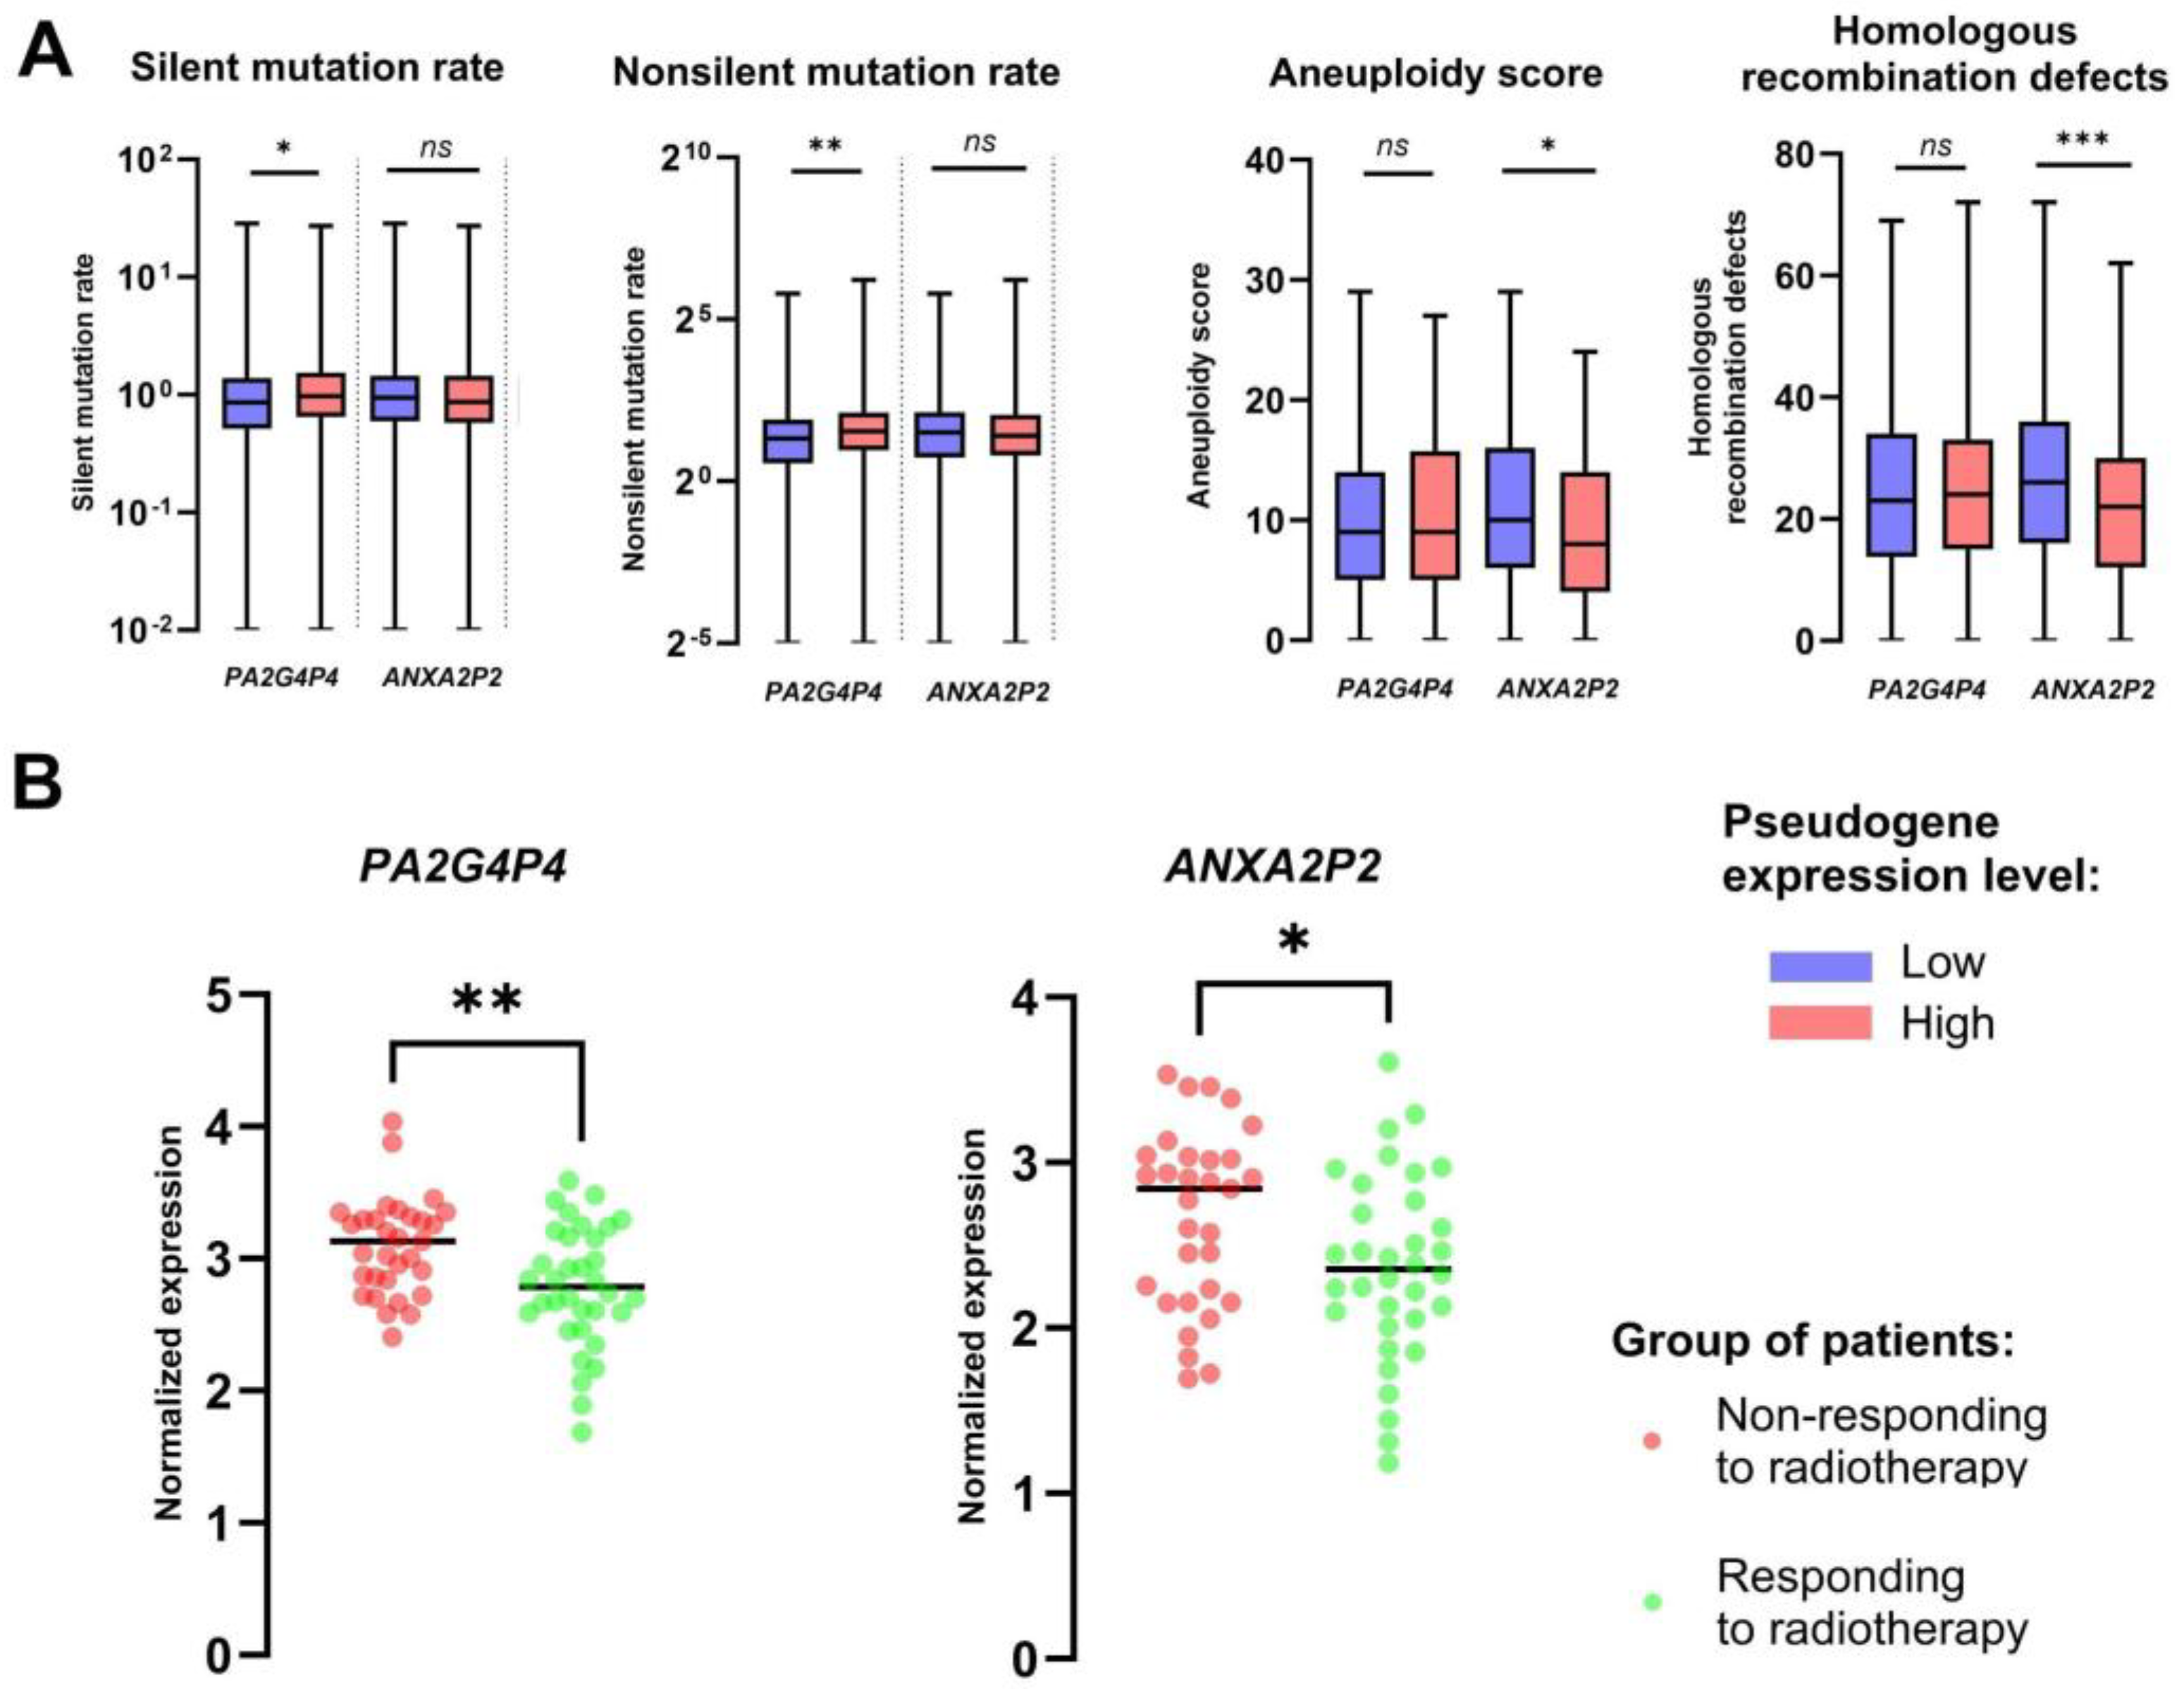
Figure 6.
Immunological characteristics of HNSCC patients depending on the expression levels of ANXA2P2 and PA2G4P4: A) TCGA immune subtype (C1 and C2), SNV (single-nucleotide variants) neoantigens, Indel (short insertion and deletion) neoantigens, BCR (B cell receptor) evenness, BCR shannon, BCR richness, TCR (T cell receptor) evenness, TCR shannon, TCR richness, CTA (cancer/testis antigen) score, IFN-gamma (interferon gamma) and TGF-beta (transforming growth factor beta) responses in the group of patients with low and high expression levels pseudogenes; B) Differences in the population of lymphocytes, neutrophils, eosinophils, mast cells, dendritic cells and macrophages, C) and fraction of specific subpopulation of T cells, B cells and macrophages associated with low and high expression level of analyzed pseudogenes; T-test or Mann-Whitney U test; ns - not significant, **** p < 0.0001, *** p < 0.001, ** p < 0.01 and * p < 0.05 considered significant.
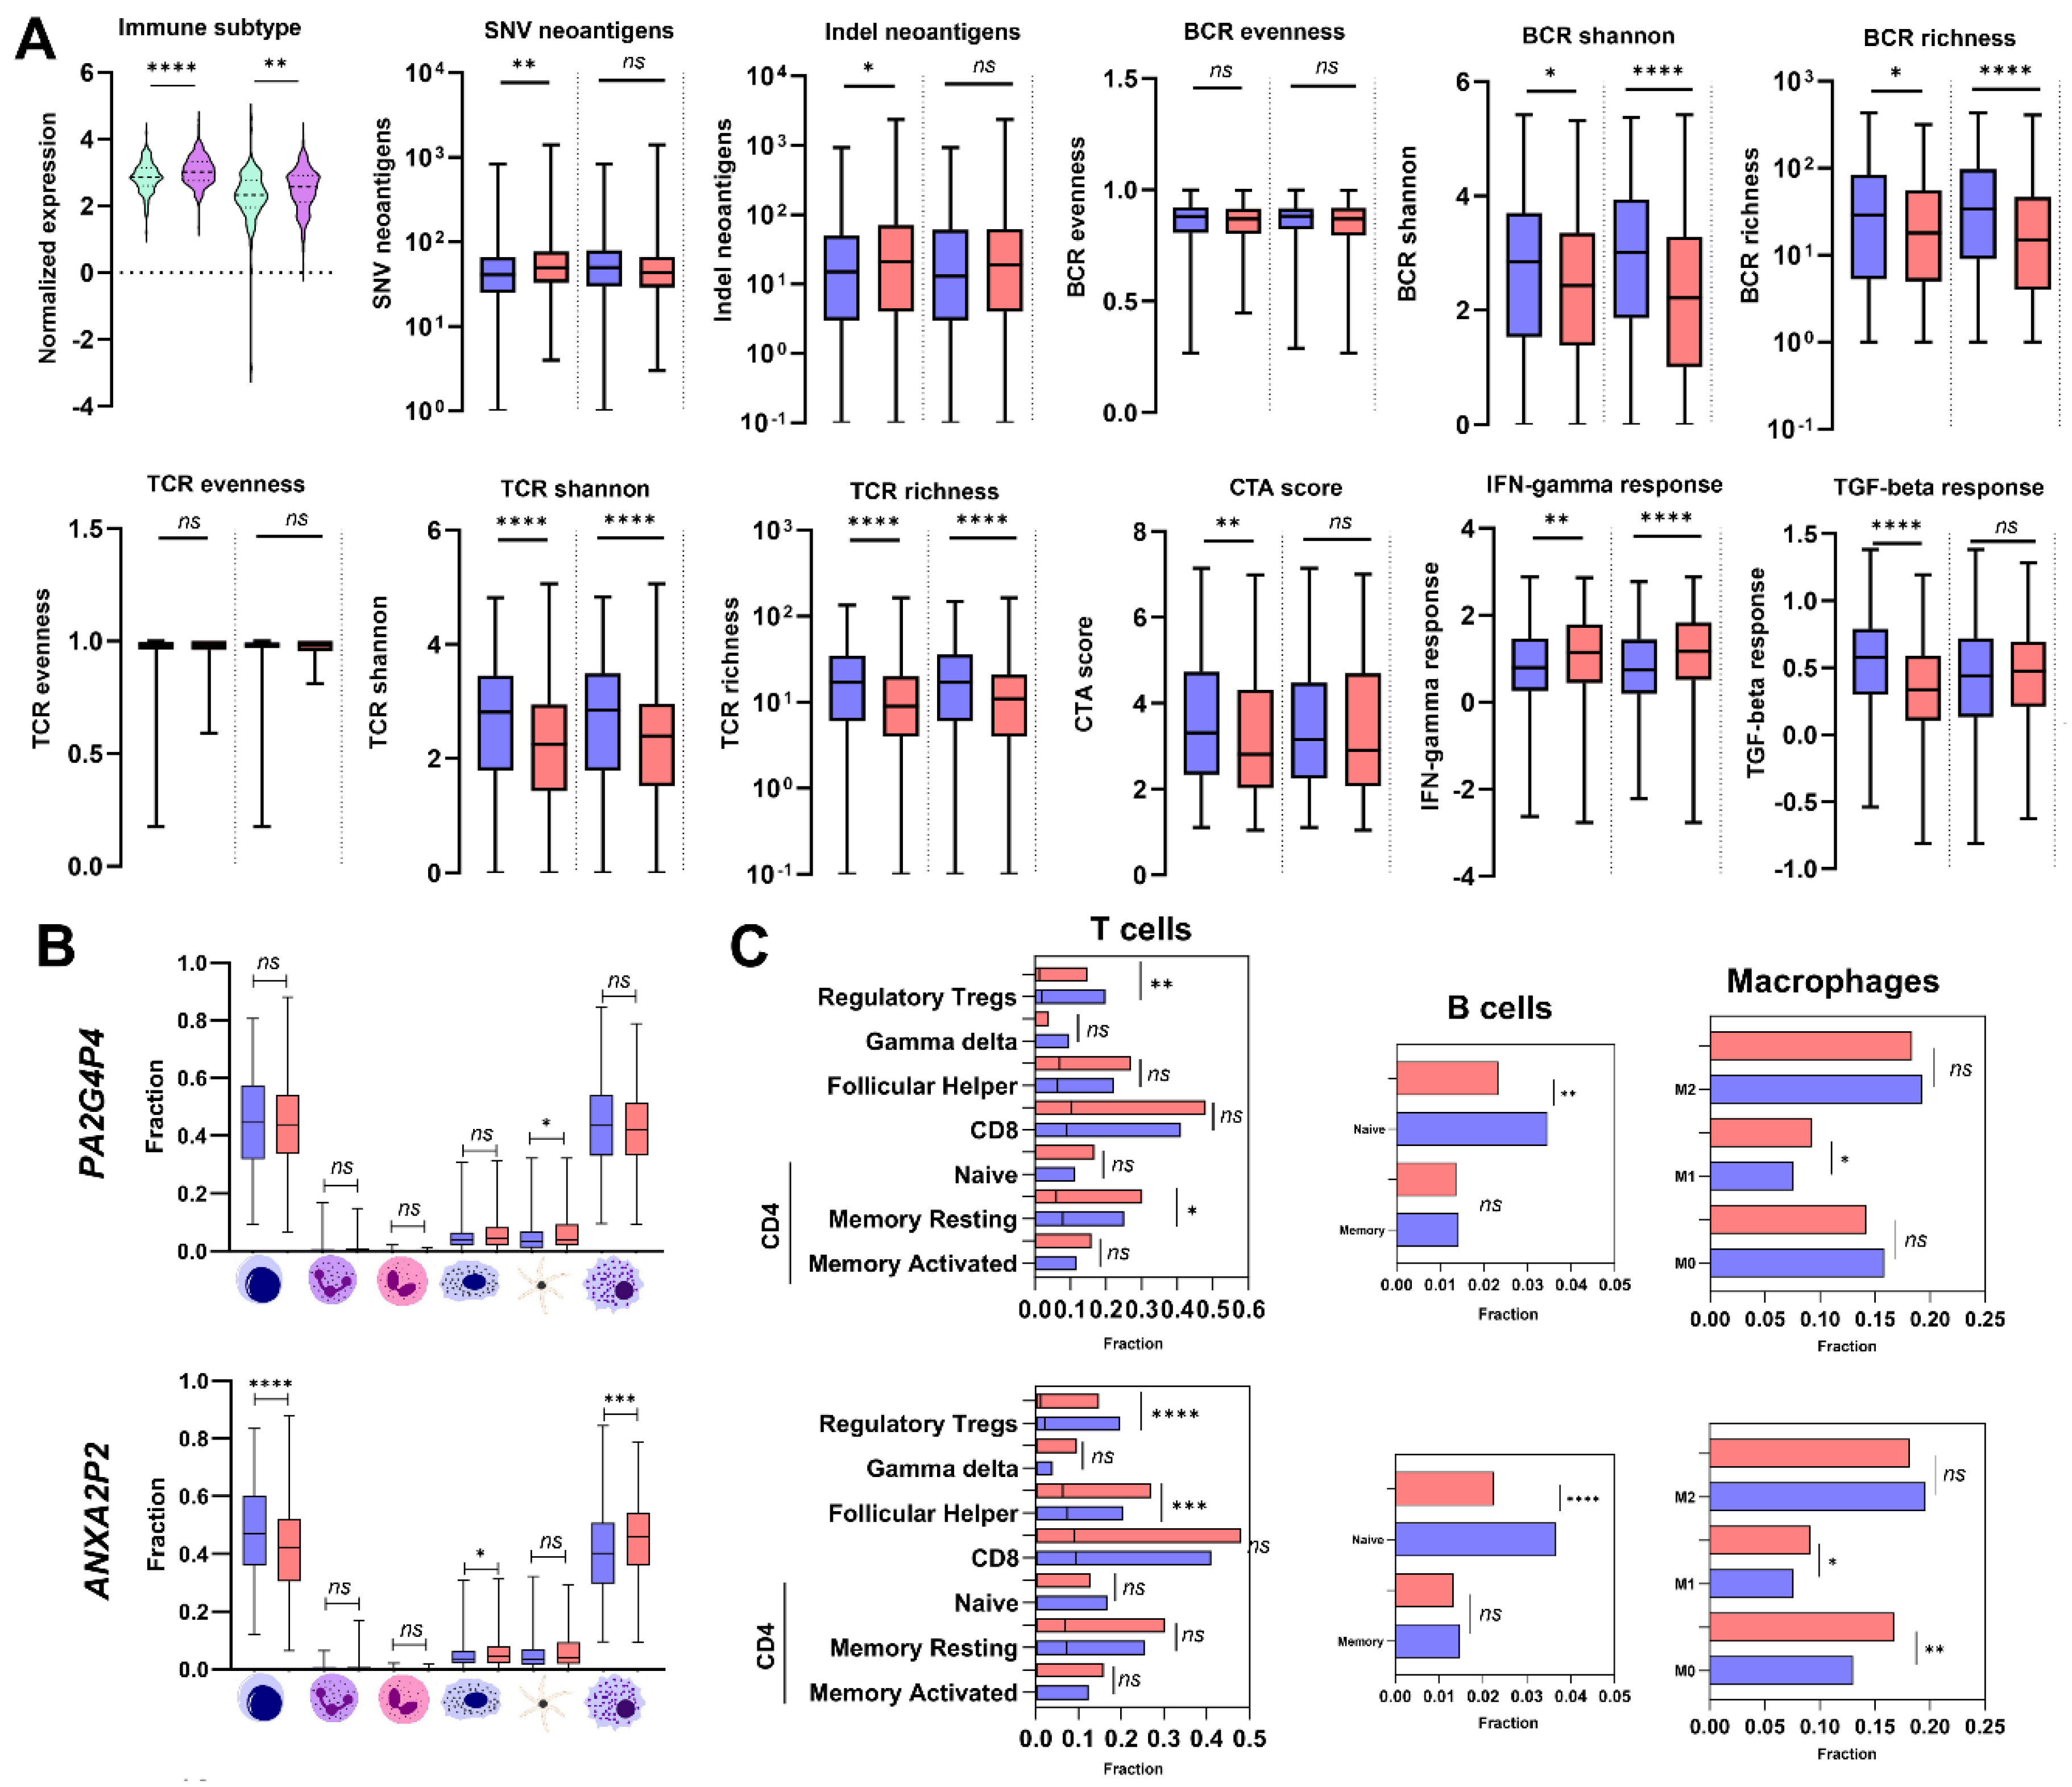

Table 1.
Expression levels of ANXA2P2 and PA2G4P4 pseudogenes associated with clinicopathological parameters analyzed in all localizations of HNSCC; t-test or Mann-Whitney U test; p < 0.05 considered significant.
Table 1.
Expression levels of ANXA2P2 and PA2G4P4 pseudogenes associated with clinicopathological parameters analyzed in all localizations of HNSCC; t-test or Mann-Whitney U test; p < 0.05 considered significant.
| Pseudogene | ANXA2P2 | PA2G4P4 | |||
|---|---|---|---|---|---|
| Parameter | Group | Mean ± SEM | p-value | Mean ± SEM | p-value |
| Age | >60 | 2.466± 0.0394 | 0.3555 | 3.018± 0.0290 | 0.1259 |
| <=60 | 2.397 ± 0.0458 | 2.966± 0.0266 | |||
| Gender | Female | 2.555± 0.0508 | 0.0079 | 3.039± 0.0353 | 0.0618 |
| Male | 2.388± 0.0364 | 2.972± 0.0236 | |||
| Alcohol | Positive | 2.405± 0.0386 | 0.2450 | 2.968± 0.0245 | 0.1680 |
| Negative | 2.473± 0.0496 | 3.037± 0.0328 | |||
| Smoking | No/Ex | 2.441± 0.0352 | 0.6006 | 2.990± 0.0241 | 0.7798 |
| Yes | 2.391± 0.0571 | 3.000± 0.0350 | |||
| Cancer Stage | I + II | 2.473± 0.0570 | 0.8922 | 3.014± 0.0447 | 0.9321 |
| III + IV | 2.479± 0.0378 | 2.998± 0.0245 | |||
| T Stage | T1 + T2 | 2.393± 0.0458 | 0.0427 | 2.965± 0.0350 | 0.7083 |
| T3 + T4 | 2.514± 0.0432 | 2.989± 0.0251 | |||
| N Stage | N0 | 2.566± 0.0442 | 0.0314 | 2.913± 0.0334 | 0.0226 |
| N1+N2+N3 | 2.395± 0.0475 | 3.019± 0.0265 | |||
| Grade | G1 + G2 | 2.504± 0.0316 | 0.0033 | 2.995± 0.0232 | 0.8218 |
| G3 + G4 | 2.267± 0.0734 | 2.985± 0.0424 | |||
| Perineural invasion | Positive | 2.573± 0.0448 | 0.0116 | 3.025± 0.0341 | 0.2572 |
| Negative | 2.373± 0.0548 | 2.984± 0.0354 | |||
| Lymph Node Neck Dissection | Positive | 2.455± 0.0336 | 0.1344 | 3.006± 0.0223 | 0.0698 |
| Negative | 2.336± 0.0690 | 2.927± 0.0410 | |||
| Lympho- vascular Invasion |
Positive | 2.379± 0.0728 | 0.0921 | 3.046± 0.0426 | 0.4558 |
| Negative | 2.532 ± 0.0410 | 2.987± 0.0322 | |||
| HPV status | Positive | 1.739± 0.1558 | <0.0001 | 2.912± 0.0634 | 0.6705 |
| Negative | 2.447 ± 0.0740 | 2.950± 0.0554 | |||
Disclaimer/Publisher’s Note: The statements, opinions and data contained in all publications are solely those of the individual author(s) and contributor(s) and not of MDPI and/or the editor(s). MDPI and/or the editor(s) disclaim responsibility for any injury to people or property resulting from any ideas, methods, instructions or products referred to in the content. |
© 2025 by the authors. Licensee MDPI, Basel, Switzerland. This article is an open access article distributed under the terms and conditions of the Creative Commons Attribution (CC BY) license (http://creativecommons.org/licenses/by/4.0/).
Copyright: This open access article is published under a Creative Commons CC BY 4.0 license, which permit the free download, distribution, and reuse, provided that the author and preprint are cited in any reuse.


