Submitted:
31 December 2025
Posted:
31 December 2025
You are already at the latest version
Abstract
Energy security and stability are related to the national economy and people's livelihood. Effectively improving the resilience of energy industry supply chain is the key factor to realize energy security and stability. Based on the panel data of 30 provinces in China from 2013 to 2023, this paper empirically explores the influence mechanism of new quality productivity on the resilience of energy industry supply chain. It is found that the new quality productivity can significantly enhance the resilience of the energy industry supply chain. The regulatory effect test results show that the energy supply level can positively promote the new quality productivity and improve the resilience of the energy industry supply chain. The results of threshold effect test show that the level of urbanization development and the degree of industrial synergy agglomeration make the new quality productivity have a nonlinear influence on the resilience of energy industry supply chain. The results of heterogeneity test show that the productivity of new quality plays a more obvious role in promoting the resilience of energy industry supply chain in the central region and the regions with higher information level.
Keywords:
new quality productivity
; energy industry
; supply chain resilience
1. Introduction
The report of the 20th National Congress of the Communist Party of China clearly stated that "efforts should be made to improve the resilience and safety level of industrial and supply chains"[1]. With the reorganization of the global industrial supply chain, major changes unseen in a century are accelerating, and China's energy industry supply chain is also facing an uncertain external environment. The resilience of the energy industry supply chain is an important foundation for the smooth circulation of the national economy. Ensuring the safety and reliability of the energy industry supply chain is a key element in achieving high-quality development in China's socialist modernization drive. With the current reorganization of the industrial technology industry, "stuck neck" areas have posed serious threats to China's energy industry supply chain, such as "broken chains" and "stuck chains". This has triggered rising energy prices and energy supply crises. Large-scale enterprises have relocated from China, and the layout of the global industrial supply chain has gradually become localized and decentralized. On January 31, 2024, General Secretary Xi Jinping pointed out when presiding over the 11th collective study session of the Political Bureau of the CPC Central Committee that we should take new quality productivity as the foothold, actively develop and layout the industrial chain, and continuously improve the safety and stability of the industrial supply chain resilience [2]. New productivity is a highly dynamic advanced quality, a new kinetic energy for economic development, and the driving force for replenishing and strengthening chains [3,4]. Under the new quality, developing new technologies, allocating new production factors, deepening the transformation of strategic industries, and deploying future emerging industries are important paths to building a modern industrial system and building a new development pattern [5,6,7]. Therefore, clarifying the interaction between new quality productivity and the energy industry supply chain, and exploring how to influence the resilience of the energy industry supply chain through new quality productivity, are currently urgent tasks for China to respond to challenges and achieve high-quality development of the industry.
In the previous literature, research on new productivity and industrial supply chain resilience was mainly carried out from two dimensions: First, focusing on enterprise development, exploring the path to improve the resilience of industrial supply chains empowered by new quality productivity in the process of enterprise development. Zhang and Zhang(2025) [8] Based on panel data of listed companies, the study concluded that new quality productivity can enhance the resilience of industrial supply chains. Akhtar et al.(2022) [9]、Zhao et al.(2023) [10] Based on enterprise panel data, we explore that supply chain digitalization has a significant positive impact on supply chain resilience and performance. Second, The enabling role of productivity in industrial supply chains. Lin et al.(2025)[11] Based on provincial panel data to explore the relationship between new quality productivity and high-quality agricultural development, focusing on "how new quality productivity affects high-quality agricultural development" and heterogeneity and non-linear characteristics, empirical analysis shows that new quality productivity significantly promotes high-quality agricultural development. Chen and Ye(2025) [12] Taking the sports industry as the research object, based on panel data from 11 provinces and cities, it was found that new productivity has a significant positive impact on the quality and efficiency reform of the sports industry and that there is regional heterogeneity.
Through sorting out the above studies, it can be found that most scholars have conducted extensive research on new productivity and industrial supply chain resilience. However, when studying the role of new quality productivity in industrial supply chain resilience, enterprise panel data are mostly used, and relevant research is still lacking. There is even less research on the impact of new quality productivity on the resilience of the energy industry supply chain. Based on existing research, this article focuses on the two key points of new quality productivity and energy industry supply chain resilience, and deeply explores the impact of new productivity on the resilience of the energy industry supply chain. Possible research contributions are: on the one hand, based on China's provincial panel data and from the perspective of the energy industry, we construct an index system for new quality productivity and energy industry supply chain resilience, and empirically analyze the impact mechanism of new quality productivity on the energy industry supply chain. This provides a basis for the construction of indicators for new quality productivity and energy industry supply chain resilience, and expands new ideas for the role of new productivity in energy industry supply chain resilience. On the other hand, based on theoretical analysis and from the perspective of industrial collaborative agglomeration and urbanization development level, the nonlinear impact characteristics of new quality productivity on the resilience process of the energy industry supply chain are explored, providing new inspiration for the implementation of government decision-making.
2. Theoretical Analysis and Research Hypotheses
2.1. The Impact of New Quality Productivity on the Resilience of the Energy Industry Supply Chain
New quality productivity is the driving force behind improving the resilience of the energy industry supply chain. According to existing research results, industrial supply chain resilience is generally represented by resilience and recovery capabilities. Resistance is represented by human capital, innovation output and input, etc. Resilience is represented by industrial benefits, degree of digitalization, etc. [13]. First of all, new quality productivity can help improve workers’ quality and thus enhance their resilience [14]. In order to meet the needs of the new situation, on the one hand, new quality productivity can cultivate professional talents that meet the needs of the energy industry, and on the other hand, it can attract high-quality, high-tech and new-quality labor force. Secondly, on the supply side, new quality productivity will help improve the advancement of labor materials in the energy industry, thereby improving recovery capabilities [15]. New quality productivity constantly updates and iterates new technologies and products in aspects such as digital and physical integration and artificial intelligence to enhance the advancement of labor materials in the energy industry, break through technical barriers, and ensure the stability of the supply chain. New quality productivity can gather workers, labor materials and labor objects, innovate and optimize the allocation structure among production factors, improve resilience and recovery capabilities, thereby promoting the improvement of the supply resilience of the energy industry. Based on this, the following hypothesis is put forward:
Hypothesis 1:
New quality productivity can promote the resilience of the energy industry supply chain
2.2. The Moderating Effect of New Quality Productivity on the Resilience of Energy Industry Supply Chain
The regulating effect of energy supply level. The fundamental to improving the resilience of the energy industry supply chain is to solve the energy supply problem. By improving the energy supply level, we can realize the chain replenishment, strengthening the chain, cooperating and controlling the chain, thereby effectively promoting the positive impact of new quality productivity on the resilience of the energy industry supply chain [16]. With the geopolitical impact of the Russia-Ukraine conflict and the Palestine-Israel conflict, the global energy supply and demand pattern has experienced significant fluctuations. The improvement of energy supply level can realize innovative allocation and optimal combination of production factors, and then help new productivity to improve the resilience of the energy industry supply chain through new qualities such as technological revolution, management innovation, and product upgrades. Based on this, the following hypotheses are put forward:
Hypothesis 2:
The level of energy supply can enhance the role of new quality productivity in promoting the resilience of the energy industry supply chain
2.3. The Threshold Effect of New Quality Productivity on the Resilience of Energy Industry Supply Chain
The threshold effect of the degree of industrial synergy and agglomeration. Different degrees of industrial synergy and agglomeration make new quality productivity forces important to energy industry supply chain resilience makes a difference [17]. When the degree of industrial synergy and agglomeration is high, it can promote the flow of production factors to break regional restrictions, improve the quality of labor matching, realize information and technology sharing, and broaden the overall layout of the industrial chain. When the degree of industrial synergy and agglomeration is low, the development potential of new quality productivity forces is not fully realized, and its role in promoting the resilience of the energy industry supply chain is weakened.
Threshold effect of urbanization development level. The development degree of urbanization in different regions has different degrees of influence on the supply chain of new quality production [18]. The level of urbanization development can maximize the role of new quality productivity. When the level of urban development is high, it can accelerate the development of new quality productivity by stimulating the creation of new labor materials, new workers, and new labor objects in the energy industry, thus promoting the improvement of the resilience of the regional energy industry supply chain. When the level of urban development is low, it will have varying degrees of impact on the resilience of the energy industry supply chain in the area where new quality productivity plays a role. Based on the above analysis, this article puts forward the following hypotheses:
Hypothesis 3:
The degree of industrial collaborative agglomeration and the level of urbanization development cause new quality productivity to have a non-linear impact on the resilience of the energy industry supply chain.
3. Research Design
3.1. Research Methods
In order to scientifically and reasonably measure the level of new quality productivity and energy industry supply chain resilience, this article uses the entropy weight method to conduct an objective weighting analysis of all levels of indicators of new quality productivity and energy industry supply chain resilience to ensure the objectivity of the indicators. The main steps of entropy method weighting are as follows:
Index standardization. In order to ensure the dimensionality and direction consistency of the indicator data, the data must be standardized before the entropy weight method. At the same time, considering that the data in this article uses provincial panel data, the time variable 𝓉 is introduced for measurement during indicator analysis. The specific standardization announcement is as follows:
Among them, in the formula represents the province and city(); represents each indicator(); represents the year(); represents the dimensionless data of indicators in province and city in year after standardization; represents the maximum value of the indicator in each province and city; represents the minimum value of the indicator in the province and city. If the indicator positively affects the entropy value, formula (1) is used to calculate it; if the indicator negatively affects the entropy value, formula (2) is used to calculate it.
Indicator translation. Considering that 0 values will appear when calculating the data range dimension method, in order to ensure the operability of the data when calculating the entropy weight method, the standardized index values are slightly shifted here. The specific shift calculation is as follows: Formula (3)
In the formula, is the translation amount. To ensure that the translation has little impact on the actual indicator data, the value of here is 0.0001
Calculate the proportion of each indicator in the new productivity and energy industry supply chain resilience indicators respectively. The specific calculation is as formula (4).
Calculate the information entropy value of the indicator . The specific calculation is as shown in formula (5).
In the formula, .
Calculate the weight of each indicator . The specific calculation is as shown in formula (6).
In the formula, is the difference coefficient of each indicator . The greater the difference coefficient, the more important the indicator is in the comprehensive evaluation index system.
Calculate the linear weighted comprehensive index . The specific calculation is as follows: formula (7).
3.2. Model Settings
3.2.1. Baseline Regression Model
In order to test hypothesis 1, the following benchmark regression model is constructed:
Among them, and represent the region and year respectively; is the core explained variable, indicating the energy industry supply chain resilience of the region in the period; is the core explanatory variable, indicating the new quality productivity of the region in the period. The control variable represents population density, represents the degree of openness to the outside world, represents production industry structure; 、、 represent region fixed effects, time fixed effects and random disturbance terms respectively; is the intercept term, 、、、 are all coefficients to be estimated.
3.2.2. Moderating Effect Model
In order to deeply explore the impact of new productivity on the resilience of the energy industry supply chain and verify Hypothesis 2, considering that the energy supply level may have endogenous problems with the energy industry supply chain resilience, the energy supply level and the energy industry supply chain resilience are first decentralized, and the interaction term is included in the regression model. Construct the following moderating effect model:
Among them, is the regulating variable, representing the energy supply level respectively; represents the interaction term between decentralized new productivity and the resilience of the energy industry supply chain. The meanings of the remaining variables are the same as in equation (8).
3.2.3. Threshold Effect Model
In order to test Hypothesis 3 and explore the nonlinear characteristics of new productivity on the resilience of the energy industry supply chain, the following threshold effect model was constructed:
Among them, and are intercept terms; represents the degree of industrial collaborative agglomeration, represents the level of urbanization development; is an indicative function, which takes the value 1 when the conditions are met, and 0 otherwise; is the corresponding threshold value; the meanings of the remaining variables are the same as equation (8).
3.3. Variable Definition and Description
3.3.1. Explained Variable
The explained variable in this article is the energy industry supply chain resilience . The resilience of the energy industry supply chain refers to the ability of the energy industry to avoid chain disconnection and quickly return to its original state after being impacted. Considering the particularity of the energy industry, this article refers to relevant research [19,20,21]to construct the following energy industry supply chain resilience index system (see Table 1), and uses the entropy weight method to complete the weight calculation of the index system.
3.3.2. Core Explanatory Variables
New quality productivity () is the core explanatory variable of this article. This article refers to existing research [22,23,24], combines the characteristics of the energy industry, from the three dimensions of new energy workers, new energy labor objects, and new energy labor materials, a new quality productivity index system was constructed (see Table 2), and the entropy weight method was used to calculate the weight of the index system.
3.3.3. Regulated Variable
This paper uses the energy supply level () as the adjusting variable. According to Gu et al. (2023) [25], the energy supply level is characterized by the length of transportation routes in different regions.
3.3.4. Threshold Variable
This article uses the industrial synergy agglomeration index () and urbanization development level ( as threshold variables. Referring to existing research [26,27,28], an improved E-G index is used to calculate the industrial synergy agglomeration index. The calculation announcement is as follows:
Among them: is the industrial synergy agglomeration index, and represent the production service industry and manufacturing respectively. the degree of industrial agglomeration; and are the number of employees in the production service industry and manufacturing industry in the region respectively; and are the total number of employees in the production service industry and manufacturing industry in the country; is the total number of employment in the country; 𝒾 and 𝓉 represent the region and year respectively.
3.3.5. Control Variables
In order to more accurately reflect the relationship between new quality productivity and the resilience of the energy industry supply chain, this paper further introduces control variables: population density ), represented by the ratio of the regional population at the end of the year to the regional area; degree of openness to the outside world (), represented by the ratio of import and export trade volume to regional GDP; industry Structure () is characterized by the ratio of the gross production value of the secondary and tertiary industries to the gross regional product.
3.4. Data Source
The panel data of 30 provinces in China from 2013 to 2023 (considering the integrity and availability of data, the data of Xizang, Hong Kong, Macao and Taiwan have been excluded) are selected as the research samples. The data mainly comes from the "China Statistical Yearbook", "China Science and Technology Statistical Yearbook", "China Education Statistical Yearbook", "China High tech Industry Statistical Yearbook", "China Basic Unit Yearbook", "China Environment Yearbook", "China Power Yearbook", "China Natural Resources Statistical Yearbook", "China Trade and Economic Statistical Yearbook", "China Economic and Trade Yearbook", "China Business Yearbook", "China Population and Employment Statistical Yearbook", "China Energy Statistical Yearbook", "China Industrial Statistical Yearbook", and CSMAR database. And use linear interpolation to fill in missing data.
4. Empirical Analysis
4.1. Benchmark Regression Results Analysis
The benchmark regression results are shown in Table 3, which mainly reports the impact of new quality productivity on the resilience of the energy industry supply chain. Column (1) is the regression result of adding only the explanatory variable new productivity and fixing the time and province effects. The regression coefficient is 0.463, passing the significance test at the 1% level. Columns (2) and (3) are the regression results after introducing control variables such as openness, population density, and industrial structure. Column (3) does not fix the time and province. The regression results show that new quality productivity has a significant role in improving the resilience of the energy industry supply chain. Hypothesis 1 is thus verified.
4.2. Endogeneity Test
4.2.1. Instrumental Variable Method
Considering that there is a certain endogenous causal relationship between new productivity and the energy industry supply chain, there may be problems with omitted variables in the constructed model. This article further introduces instrumental variables and estimates them using two-stage least squares (2SLS) method. The instrumental variable is selected as the one-period lag of new quality production (). As can be seen from column (2) in Table 4, the selected instrumental variables pass the non-identifiable and weak instrumental variable tests, proving that the instrumental variables are effective. The regression results in column (1) show that the instrumental variable coefficient is significant at the 1% level, indicating that the instrumental variable is positively related to new qualitative productivity. The regression results in column (2) show that new productivity positively promotes the resilience of the energy industry chain and supply chain, verifying that the baseline regression results are robust.
4.2.2. Differential and System GMM Estimation Method
Considering that the resilience of the energy industry supply chain may be related to the sequence, this paper further introduces the lag term l. Re of regional energy industry supply chain resilience in the model, in order to separate unobservable factors and reduce the bias of model estimation. Estimate and test the model using the GMM system differential method. According to column (3) of Table 4, AR (1) is significant at the 10% level, while AR (2) is not significant. If there is first-order autocorrelation in the residuals and no second-order autocorrelation, then there is no significant sequence correlation in the error term of the original model. If the P-value of Hansen's overidentification constraint test is greater than 0.1, the null hypothesis is accepted that the instrumental variable overidentification constraint is valid. After endogeneity treatment, the regression results in column (3) indicate that new quality productivity has a significant promoting effect on the resilience of the energy industry supply chain, further verifying hypothesis 1.
4.3. Robustness Check
In order to verify the reliability of the empirical results, this paper conducts a robustness test on the regression results by replacing models, eliminating abnormal samples, replacing core explanatory variables, and replacing explained variables. (1) Replace the model. Due to the range of resilience values in the energy industry supply chain being between 0 and 1, which meets the condition of limited dependent variables, the Tobit model was chosen for re estimation. After adding control variables and fixed provinces and years, the regression results in column (1) of Table 5 show that new quality productivity significantly positively affects the resilience of the energy industry supply chain, which is consistent with the baseline regression results. (2) Remove abnormal samples. Due to the impact of the COVID-19 in 2020, the consumption demand has changed. Therefore, the regression estimation is conducted again after removing the data of the epidemic year. The regression results in Column 5 (2) of Table 5 show that they are still significant. (3) Replace the dependent variable and the core explanatory variable separately. Using principal component analysis, the weights of new quality productivity and energy industry supply chain resilience were re estimated, and the entropy weight method was used to obtain the replaced new quality productivity weight and energy industry supply chain resilience weight c. After re estimating the regression model, it can be seen from columns (3) and (4) of Table 5 that the regression results are significant. Based on this, the conclusion that new quality productivity enhances the resilience of the energy industry supply chain is relatively robust.
4.4. Mechanism Test
4.4.1. Moderating Effect
According to equation (9), the regression results using energy supply level as the moderating effect are shown in column (5) of Table 5. It can be seen from the regression results that the regression coefficient of the interaction term between energy supply level and new quality productivity is 0.162, which is significant at the 1% level. It shows that the level of energy supply can effectively enhance the positive enabling effect of new productivity on the resilience of the regional energy industry supply chain. Therefore, hypothesis 2 is confirmed.
4.4.2. Threshold Effect
According to equations (10) and (11), this paper tests the threshold effect of the level of urbanization development and the degree of industrial collaborative agglomeration. After testing, as shown in Figure 1, both the urbanization level and the degree of industrial collaborative agglomeration passed the single threshold test. According to the threshold effect test results in Table 6, it can be seen that the level of urbanization and the degree of industrial collaborative agglomeration are not significant in the double threshold test. This shows that there is a nonlinear relationship between new quality productivity and the resilience of the energy industry supply chain, with the level of urbanization development and the degree of industrial synergy agglomeration as threshold variables. According to column (1) in Table 7, it can be seen that the first threshold value of urbanization level is 11.93. Among the threshold values of urbanization level at each stage, new productivity is significant at the 1% level. However, the coefficient of new quality productivity is different at different stages. As the level of urban development continues to improve, new production factors will rapidly upgrade, making new quality productivity more dependent on new production factors and weakening the positive promotion effect on urban development level. According to column (2) in Table 7, it can be seen that the first threshold value of industrial collaborative agglomeration is 3.098. When the degree of industrial collaborative agglomeration is less than the threshold value of 3.098, the regression coefficient of new quality productivity is 0.286, which is significant at the 1% level; when the degree of industrial collaborative agglomeration is greater than the threshold value of 3.098, the regression coefficient of new quality productivity is 0.529, which is significant at the 1% level. This shows that as industrial synergy agglomeration continues to grow, the role of new quality productivity in improving the resilience of the energy industry supply chain is also increasing. Taken together, under different levels of urbanization development and industrial synergy agglomeration, new quality productivity shows non-linear characteristics to the energy industry supply chain. And it shows significant promotion effect in different threshold ranges. Therefore, hypothesis 3 is confirmed.
4.5. Heterogeneity Analysis
In order to verify the differences in the resilience of new quality productivity to the energy industry supply chain among different informatization levels and different regions. This article uses the ratio of the total volume of postal and telecommunications services in a region to the year-end population to characterize the level of informatization; According to the geographical location division of the National Bureau of Statistics, the sample is divided into two parts: the eastern and western parts and the central part for separate regression analysis. (1) Heterogeneity in the degree of informatization. Taking the median of the informatization degree ratio as a reference, it is divided into areas with a high degree of informatization and areas with a low degree of informatization. It can be seen from columns (1) and (2) in Table 8 that the new quality productivity coefficient of areas with a high degree of informatization is 0.511, and that of areas with a low degree of informatization is 0.203, and both are significant at the 1% level. The test results for the difference in coefficients between groups are significant at the 10% level, indicating that a high degree of informatization can help promote new quality productivity and improve the resilience of the energy industry supply chain. (2) Regional heterogeneity. It can be seen from columns (3) and (4) of Table 8 that the new quality productivity coefficient in the eastern and western regions is 0.306, and the new quality productivity coefficient in the central region is 0.711, both are significant at the 1% level, and the difference test results of the coefficients between groups are significant at the 5% level. The economy of the eastern region is developing rapidly, and the impact of new productivity on it is smaller than that of other regions. The western region is a resource-based agglomeration area, and the energy industry supply chain has relatively good resilience. Compared with other regions, the energy industry supply chain resilience is less affected by new quality productivity. Therefore, the central region is more susceptible to the impact of new quality productivity than the eastern and western regions, thereby improving the resilience of the energy industry supply chain.
5. Conclusion and Recommendations
5.1. Conclusion
This article uses panel data from 30 provinces in China from 2013 to 2023 as a research sample, using a two-way fixed effect model, an adjustment variable model and a threshold effect model to deeply explore the impact of new quality productivity on the resilience of the energy industry supply chain. The study found that: first, new quality productivity has a positive role in improving the resilience of the energy industry supply chain. Second, in the impact of new quality productivity on the resilience of the energy industry supply chain, the level of urbanization and the degree of industrial synergy agglomeration both have a single threshold effect and exhibit non-linear impact characteristics. Third, energy supply levels can enhance the positive impact of new quality productivity on the resilience of the energy industry supply chain. Fourth, the role of new quality productivity in promoting the resilience of the energy industry supply chain is more significant in areas with a high degree of informatization and central regions.
5.2. Suggestion
Based on the above conclusions, the following suggestions are put forward: (1) The development of new productivity in the energy industry should be based on technological innovation and increase investment in research and development funds, vigorously improve the level of information digitization, through the continuous updating of key technologies, the continuous iterative upgrading of new technologies and new products, to provide a steady stream of momentum for strengthening and replenishing chains, thereby empowering the stable development of the regional energy industry supply chain. (2) Accelerate the regional energy market reform, focus on industrial synergy and agglomeration, optimize the allocation of energy industry resources, and enhance the flexibility of the regional energy industry supply chain. Further improve regional energy supply levels, coordinate the layout of energy industry gradients, strengthen infrastructure construction, and optimize industrial upgrading. Based on new production factors, build a digital and intelligent development path for the energy industry and enhance the resilience of the energy industry supply chain. (3) Further develop informatization construction, actively promote the reform of medical and educational systems and mechanisms, and improve human capital levels. Vigorously develop advantageous industries, support the development of high-tech industrial enterprises such as artificial intelligence, big data, cloud computing and new energy, improve labor productivity, continue to empower new productive forces, and continuously improve the resilience of industrial supply chains.
Author Contributions
Yuyue Xu: Propose research ideas, design research plans, and write the initial draft of the paper; Yuyue Xu: Participated in data collection and analysis, optimized research methods, and assisted in revising papers; Yuyue Xu: Provide theoretical support and empirical analysis suggestions, participate in paper revision and review; Xin Li: Coordinate the research process, guide the writing of papers, review and finalize them, and be responsible for the completeness and academic standardization of the research content.
Funding
This research was funded by the National Social Science Foundation of China (24&ZD106); The research was funded by the Open Fund of Sichuan Oil and Gas Development Research Center(2025SY018).
Institutional Review Board Statement
This study did not require ethics approval, thus this declaration is not applicable.
Informed Consent Statement
Not applicable.
Conflicts of Interest
The authors declare no conflict of interest. The funders had no role in the design of the study; in the collection, analyses, or interpretation of data; in the writing of the manuscript; or in the decision to publish the results.
References
- Xi, J. Holds high the great banner of socialism with Chinese characteristics and unites to strive for the comprehensive construction of a modern socialist country: - Report at the 20th National Congress of the Communist Party of China (October 16, 2022). People's Daily 2022, 1. [Google Scholar]
- Li, Y. Improve the resilience and security level of my country's industrial and supply chains while accelerating the construction of a new development pattern. Economic Perspectives 2023, 51–58. [Google Scholar]
- Yinxing, Hong; Kunyi, Wang. Research on the resilience and security of industrial chain and supply chain from the perspective of new quality productivity. Economic Research 2024, 59, 4–14. [Google Scholar]
- Chu, H.; Niu, X.; Li, M.; Wei, L. Research on the Impact of New Quality Productivity on Enterprise ESG Performance. Int. Rev. Econ. Finance 2025, 99. [Google Scholar] [CrossRef]
- Cao, X.; Lei, J.; Shi, D.; Yu, W.; Tao, T.; Zhang, X.; Wang, A. New Quality Productivity of Agriculture and Rural Areas at the Provincial Scale in China: Indicator Construction and Spatiotemporal Evolution. Isprs Int. J. Geo-Inf. 2025, 14. [Google Scholar] [CrossRef]
- Ye, L.; Fang, Z. The Impact of New-Quality Productivity on Environmental Pollution: Empirical Evidence from China. Sustainability 2025, 17, 3230. [Google Scholar] [CrossRef]
- An, B.; Xu, P.; Li, H.; Shao, C. Statistical measurement and regional coordination characteristics analysis of China's new energy productivity. Statistics and Decision-making 2025, 41, 29–34. [Google Scholar]
- Zhang, J.; Zhang, Y. Research on Collaborative Performance of Green Supply Chain Enabled by New Quality Productivity. Sustainability 2025, 17, 3793. [Google Scholar] [CrossRef]
- Akhtar, P.; Ghouri, A.M.; Saha, M.; Khan, M.R.; Shamim, S.; Nallaluthan, K. Industrial Digitization, the Use of Real-Time Information, and Operational Agility: Digital and Information Perspectives for Supply Chain Resilience. Ieee Trans. Eng. Manag. 2024, 71, 10387–10397. [Google Scholar]
- Zhao, N.; Hong, J.; Lau, K.H. Impact of Supply Chain Digitalization on Supply Chain Resilience and Performance: A Multi-Mediation Model. Int. J. Prod. Econ. 2023, 259. [Google Scholar] [CrossRef] [PubMed]
- Lin, L.; Gu, T.; Shi, Y. The Influence of New Quality Productive Forces on High-Quality Agricultural Development in China: Mechanisms and Empirical Testing. Agric.-Basel 2024, 14. [Google Scholar] [CrossRef]
- Chen, X.; Ye, S. Influence of New Qualitative Productivity Forces on Quality-Effective Change in China’s Yangtze River Economic Belt Sports Industry: The Mediating Effect of Industry-University-Research Cooperation. PLoS ONE 2025, 20. [Google Scholar] [CrossRef]
- Liu, Q.; Chen, R.; Yu, Q. Improving Sustainable Performance of China’s New Energy Industry through Collaborative Innovation Network Resilience. Renew. Sustain. Energy Rev. 2024, 201. [Google Scholar] [CrossRef]
- Zhao, H.; Li, C.; Yang, Z.; Zhang, Z.; Jin, C.; Guo, S. How Can New Quality Productivity Decrease Carbon Emission Intensity? Evidence from 30 Provincial Regions in China. Energy 2025, 327. [Google Scholar] [CrossRef]
- Liu, Y.; Wang, J.; Ma, D.; Ding, J.; Peng, T. New Quality Productivity, Labor Quality and Corporate High-Quality Green Development. J. Environ. Manage. 2025, 395, 128018. [Google Scholar] [CrossRef]
- Zhang, L.; Fu, S.; Tian, J.; Peng, J. A Review of Energy Industry Chain and Energy Supply Chain. Energies 2022, 15, 9246. [Google Scholar] [CrossRef]
- Qin, Q.; Yu, Y.; Liu, Y.; Zhou, J.; Chen, X. Industrial Agglomeration and Energy Efficiency: A New Perspective from Market Integration. Energy Policy 2023, 183. [Google Scholar] [CrossRef]
- Pan, K.; Liu, R.; Chen, X.; Huang, Y. How Does Industrial Agglomeration Affect Exports? Evidence from Chinese Province-Industry Panel Data. Sustainability 2023, 15. [Google Scholar] [CrossRef]
- Zhang, S.; Gucheng. Supply chain digitalization and supply chain resilience. Financial Research 2024, 50, 21–34. [Google Scholar]
- Zhu, Y.; Zhang, W.; Wang, D.; Dou, S.; Xu, D. Evaluation of supply chain resilience of China's copper resource industry chain. Resource Science 2023, 45, 1761–1777. [Google Scholar]
- Huang, K.; Wang, K.; Lee, P.K.C.; Yeung, A.C.L. The Impact of Industry 4.0 on Supply Chain Capability and Supply Chain Resilience: A Dynamic Resource-Based View. Int. J. Prod. Econ. 2023, 262. [Google Scholar] [CrossRef]
- Li, L.; Jia, Y. The impact and mechanism of new productivity on supply chain resilience. Statistics and Decision Making 2025, 41, 104–108. [Google Scholar]
- Li, X. New High-Quality Productivity Promotes the Improvement of Resilience in Logistics Industry: Role Mechanism and Empirical Analysis of Psychological Behavior. Psychol. Rep. 2025, 128, 97–99. [Google Scholar]
- Liu, Y.; He, Z. Synergistic Industrial Agglomeration, New Quality Productive Forces and High-Quality Development of the Manufacturing Industry. Int. Rev. Econ. Finance 2024, 94. [Google Scholar] [CrossRef]
- Gu, Y.; Liu, W.; Wang, B.; Tian, B.; Yang, X.; Pan, C. Analysis and Prediction of Energy, Environmental and Economic Potentials in the Iron and Steel Industry of China. Processes 2023, 11, 3258. [Google Scholar] [CrossRef]
- Yuan, F.; Zhang, K.; Qiu, A. The impact mechanism of digital economy on the resilience of intelligent manufacturing industry chain - an empirical test based on China's provincial panel data. Science and Technology Management Research 2025, 45, 107–116. [Google Scholar]
- Liu, X.; Zuo, L.; Hu, L.; Wang, C.; Sheng, S. Industrial Agglomeration, Environmental Regulation, and Carbon Emissions Reduction under the Carbon Neutrality Goal: Threshold Effects Based on Stages of Industrialization in China. J. Clean. Prod. 2024, 434. [Google Scholar] [CrossRef]
- Zhou, N.; Shi, Q.; Ye, J. Industrial Co-Agglomeration, Human Capital Upgrading, and Supply Chain Efficiency. Finance Res. Lett. 2025, 86. [Google Scholar] [CrossRef]
- Jin, T.; Dang, C. Research on the mechanism of digital economy improving regional energy efficiency-based on the perspective of new productivity development. Social Science Front 2025, 244–252. [Google Scholar]
- Zhong, Z.; Chen, Z. Urbanization, Green Development and Residents’ Happiness: The Moderating Role of Environmental Regulation. Environ. Impact Assess. Rev. 2022, 97. [Google Scholar] [CrossRef]
Figure 1.
Threshold variable likelihood ratio function graph.
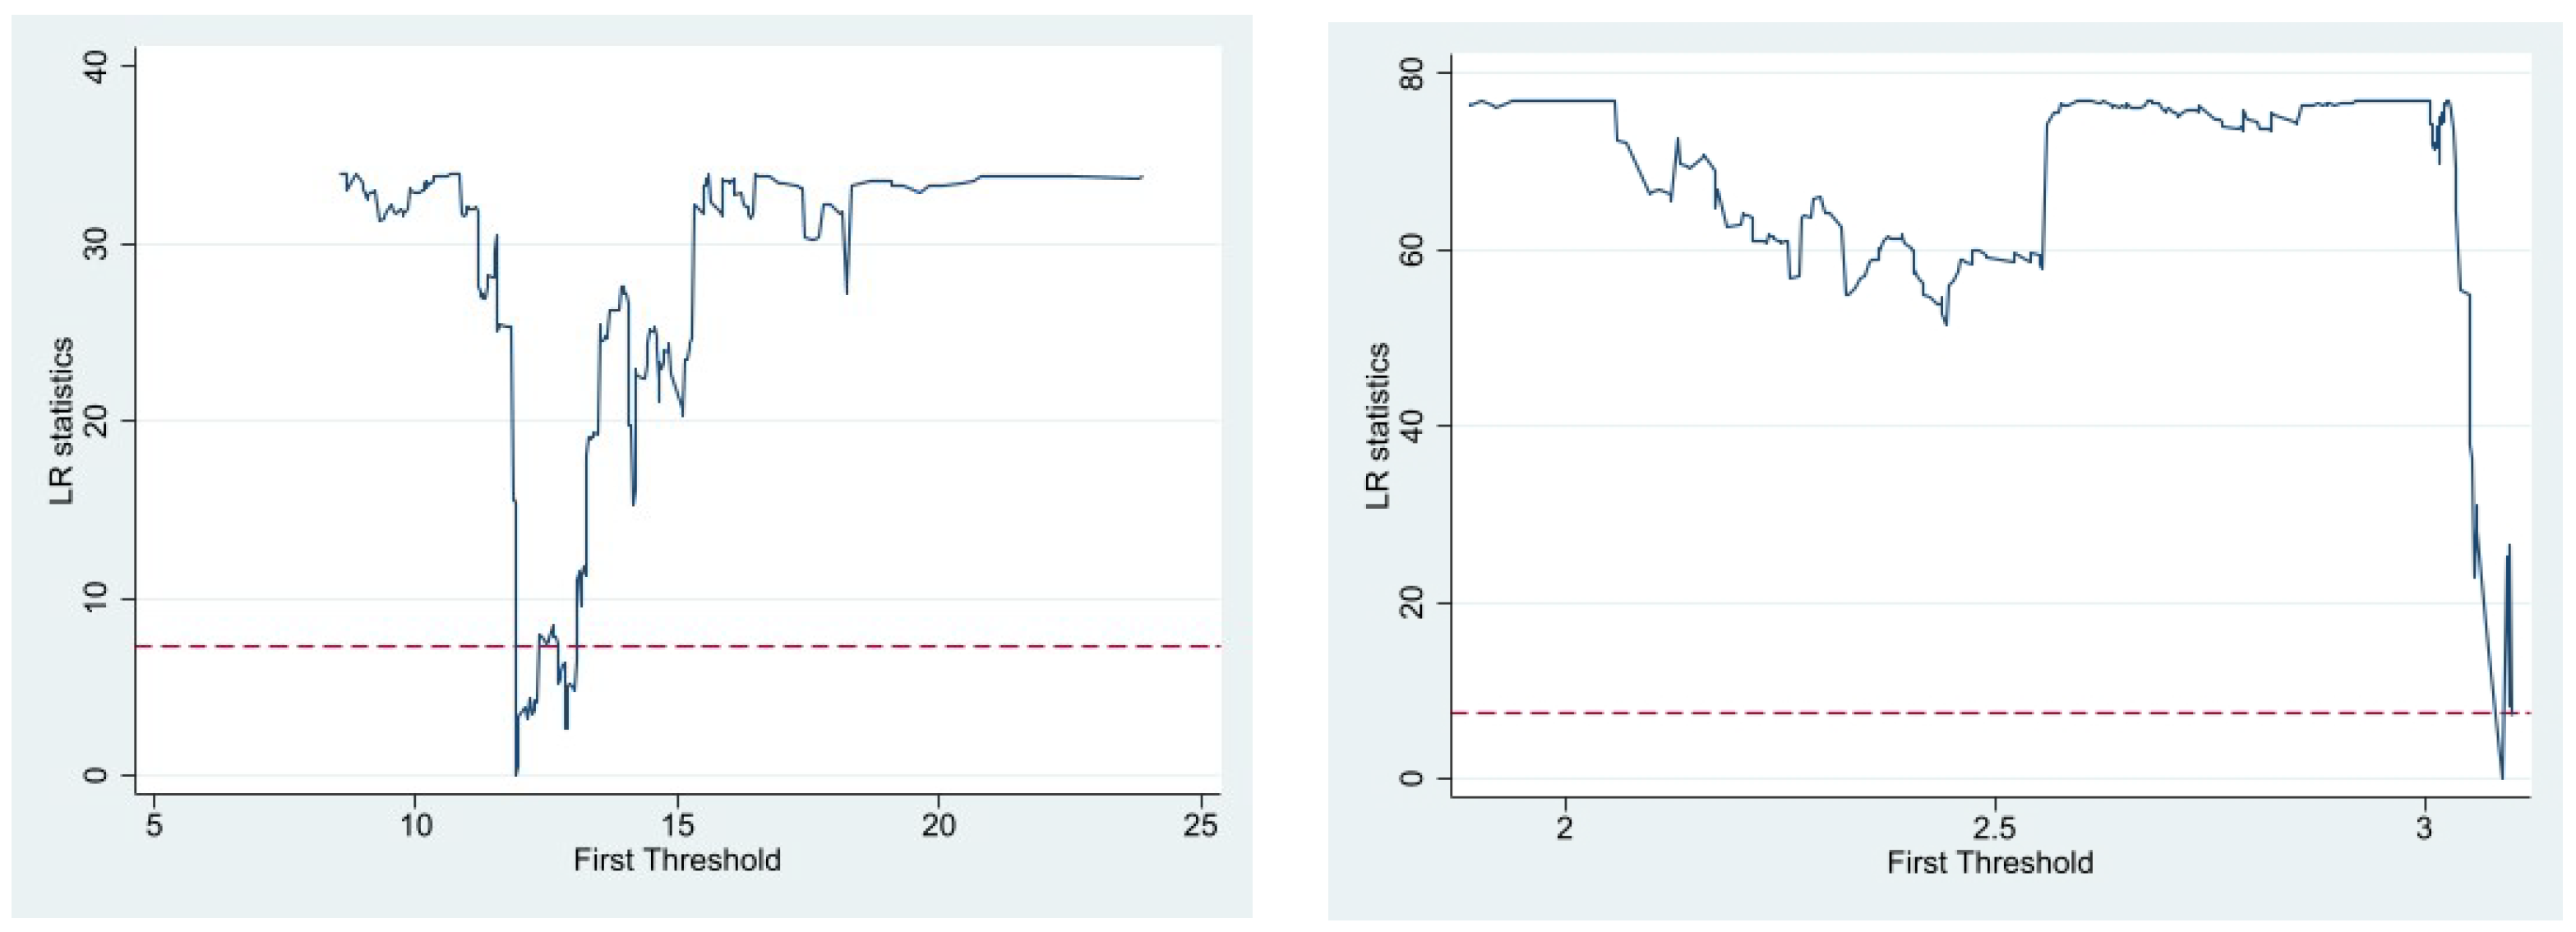

Table 1.
Energy industry supply chain resilience index system.
| First-level indicator | Secondary indicator | Third-level indicator | Indicator Properties | Weight |
| Resistance ability | Energy processing and conversion losses | The amount of energy input during energy processing and conversion – the amount of energy output | Negative | 0.0005 |
| Terminal energy consumption | The sum of all types of energy used for consumption (rather than for processing and conversion into other energy sources) | Positive | 0.0297 | |
| Energy production capacity | Primary energy production | Negative | 0.0049 | |
| Installed power generation capacity by region | Positive | 0.0301 | ||
| Energy supply capacity | Energy production/terminal energy consumption | Positive | 0.1009 | |
| Recovery ability | Energy and Environmental Governance | Comprehensive utilization of industrial solid waste | Positive | 0.0386 |
| Industrial waste gas treatment investment costs | Positive | 0.0639 | ||
| Energy industry foundation | Number of energy production and supply companies | Positive | 0.0383 | |
| Highway mileage | Positive | 0.0274 | ||
| Electricity consumption of the whole society | Positive | 0.0372 | ||
| Reorganization ability | Market environment level | Residential water, electricity and fuel price index | Positive | 0.0102 |
| Cyclical sustainable development | CO2 emission intensity | Negative | 0.0070 | |
| Industrial cooperation capabilities | Increment of tertiary industry/increment of GDP | Positive | 0.0167 | |
| Industrial synergy capabilities | Operating income of electronic information manufacturing owners | Positive | 0.1312 | |
| Innovation ability | Innovation output | Number of valid patents | Positive | 0.1017 |
| Innovation investment | Purchase expenses abroad | Positive | 0.1483 | |
| Purchase of domestic technology expenses | Positive | 0.1581 | ||
| Technical transformation expenditure | Positive | 0.0553 |
Table 2.
New quality productivity index system.
| First-level indicator | Secondary indicator | Third-level indicator | Indicator Properties | Weight | First-level indicator |
| New energy workers | Energy new quality worker capabilities | Energy industry labor productivity | Primary energy production per capita | Positive | 0.1198 |
| Energy industry workers’ salary levels | Average salary of people employed in energy industries such as electricity, heat, gas and water production and supply industries | Positive | 0.0251 | ||
| Scale of energy new quality workers | Scale of human capital of industrial enterprises | Number of R&D personnel in industrial enterprises above designated size | Positive | 0.0687 | |
| Energy industry labor force size | Proportion of employment in energy industries such as electricity, heat, gas and water production and supply industries | Positive | 0.0162 | ||
| Concept of new energy workers | Career preference | Scientific research and technical services industry employment share | Positive | 0.0312 | |
| Entrepreneurial awareness | Number of energy-related companies incubated by technology business incubators | Positive | 0.0596 | ||
| Energy new quality labor object | Energy supply level | City gas supply level | Urban natural gas supply | Positive | 0.0398 |
| Urban Liquefied Petroleum Gas Supply Level | Urban Liquefied Petroleum Gas Supply | Positive | 0.0474 | ||
| Energy green development level | Green and clean energy power generation situation | Wind, nuclear, hydro, solar power generation | Positive | 0.0354 | |
| Industrial pollution control capabilities | Completed investment in industrial pollution control | Positive | 0.0424 | ||
| Development level of new quality enterprises | Enterprise informatization development level | Number of computers used by the unit enterprise at the end of the period | Positive | 0.0281 | |
| Economic development of industrial enterprises above designated size | Operating income profit rate of industrial enterprises | Positive | 0.0006 | ||
| State-owned energy industry enterprise fixed investment capacity | Growth rate of fixed assets investment in state-owned economy, energy industry | Positive | 0.0239 | ||
| Energy new quality labor data | Energy infrastructure | City gas supply capacity | City artificial gas, natural gas, liquefied petroleum gas pipeline length | Positive | 0.0365 |
| Power supply capacity | Circuit length of 35KV and above transmission lines in the region | Positive | 0.0445 | ||
| Digital infrastructure | Digital development level of industrial enterprises | Number of Internet broadband access users in industrial enterprises | Positive | 0.0331 | |
| Industrial enterprise information technology service level | Industrial Enterprise Information Technology Services Revenue | Positive | 0.1666 | ||
| Technological innovation construction | Industrial enterprise technology innovation achievement level | Number of valid invention patents of industrial enterprises | Positive | 0.1025 | |
| Industrial enterprise technology innovation construction level | New product development expenses for industrial enterprises | Positive | 0.0786 |
Table 3.
Baseline regression results.
| (1) | (2) | (3) | |
| 0.463*** (7.87) |
0.330*** (5.91) |
0.809*** (29.89) | |
| -0.193*** (-7.33) | 0.052*** (4.38) | ||
| 0.118* (1.95) | 0.004** (2.06) |
||
| -0.035** (-2.50) | 0.050*** (6.47) | ||
| Constant term | 0.069*** (8.23) | -0.483 (-1.46) |
-0.060*** (-4.41) |
| Time fixed effects | Y | Y | N |
| Province fixed effects | Y | Y | N |
| N | 330 | 330 | 330 |
| 0.926 | 0.940 | 0.820 |
Note: *, * *, and * * * indicate significance at the 10%, 5%, and 1% levels, respectively, and () represents the t-statistic. the same below.
Table 4.
Endogeneity test results.
| (1) | (2) | (3) | |
| One-stage regression | Two-stage regression difference | System GMM | |
| 0.529*** (5.81) | 0.179*** (9.51) | ||
| 0.647*** (15.55) |
|||
| 0.764*** (40.96) | |||
| Constant term | -0.474* (-1.80) |
-0.024 (-1.48) |
|
| DWH inspection P-value | 0.0001 | ||
| Cragg Donald Wald F-value | 241.951 | ||
| Unrecognized inspection | 145.476*** | ||
| AR (1) test P-value | 0.095 | ||
| AR (2) test P-value | 0.249 | ||
| Control variable | Y | Y | Y |
| Time fixed effects | Y | Y | Y |
| Province fixed effects | Y | Y | Y |
| N | 300 | 300 | 300 |
| 0.973 | 0.326 |
Note: The critical value of Cragg Donald Wald F is 10% and 16.38. The values in parentheses for columns (1) and (2) are t values, and the values in parentheses for column (3) are Z values.
Table 5.
Mechanism Inspection Results.
| (1) | (2) | (3) | (4) | (5) | |
| Tobit model | Excluding samples from the year of the epidemic | Replace the core explanatory variable | Replace the dependent variable | ||
| 0.542*** (9.98) | 0.333*** (6.27) |
3.750*** (7.88) | 0.319*** (5.82) | ||
| 0.0360*** (10.09) | |||||
| 0.162*** (3.78) | |||||
| Control variable | Y | Y | Y | Y | Y |
| Constant term | -0.0632 (-1.60) | -0.421 (-1.33) |
0.110 (0.35) |
-9.146*** (-3.24) |
-0.356 (-0.97) |
| Time fixed effects | Y | Y | Y | Y | Y |
| Province fixed effects | Y | Y | Y | Y | Y |
| N | 330 | 300 | 330 | 330 | 330 |
| - | 0.948 | 0.950 | 0.974 | 0.943 |
Note: Column (1) parentheses represent Z values, while the remaining parentheses represent t values.
Table 6.
Threshold effect test.
| Threshold variable | Threshold effect | F value | P value | BS frequency | Threshold value | Threshold inspection threshold type | Threshold value | 95% confidence interval | ||
| 10% | 5% | 1% | ||||||||
| Urbanization development level | Single threshold | 34.46 | 0.020 | 500 | 21.326 | 26.115 | 39.614 | Single threshold | 11.9300 | [11.9100,11.9500] |
| Double threshold | 16.01 | 0.200 | 500 | 21.082 | 25.795 | 40.767 | - | - | ||
| Industrial synergy agglomeration | Single threshold | 78.21 | 0.000 | 500 | 26.929 | 34.291 | 45.154 | Single threshold | 3.0918 | [3.0739,3.0991] |
| Double threshold | 20.81 | 0.140 | 500 | 23.113 | 51.424 | 112.337 | - | - | ||
Table 7.
Threshold effect test results.
| (1) | (2) | |
|---|---|---|
| () | 0.553*** (10.19) | |
| () | 0.415*** (8.74) |
|
| () | 0.286*** (6.12) | |
| () | 0.529*** (11.23) | |
| Constant term | -0.481 (-1.39) |
-0.531 (-1.63) |
| Control variable | Y | Y |
| Time fixed effects | Y | Y |
| Province fixed effects | Y | Y |
| N | 330 | 330 |
| 0.456 | 0.516 |
Table 8.
Heterogeneity test results.
| (1) | (2) | (3) | (4) | |
| High degree of informatization | Low level of informatization | East West Department | Central | |
| 0.511*** (5.53) |
0.203*** (3.66) |
0.306*** (4.46) | 0.711*** (3.11) | |
| Constant term | -1.132 (-1.33) |
-0.408** (-2.09) | -1.149* (-1.96) |
0.327 (0.59) |
| Control variable | Y | Y | Y | Y |
| Time fixed effects | Y | Y | Y | Y |
| Province fixed effects | Y | Y | Y | Y |
| P-Value | 0.060* | 0.040** | ||
| N | 165 | 163 | 231 | 99 |
| 0.951 | 0.968 | 0.948 | 0.937 | |
Note: P-Value value is the significance of the coefficient difference between the test groups, obtained through Fisher's test sampling 1000 times.
Disclaimer/Publisher’s Note: The statements, opinions and data contained in all publications are solely those of the individual author(s) and contributor(s) and not of MDPI and/or the editor(s). MDPI and/or the editor(s) disclaim responsibility for any injury to people or property resulting from any ideas, methods, instructions or products referred to in the content. |
© 2025 by the authors. Licensee MDPI, Basel, Switzerland. This article is an open access article distributed under the terms and conditions of the Creative Commons Attribution (CC BY) license (http://creativecommons.org/licenses/by/4.0/).
Copyright: This open access article is published under a Creative Commons CC BY 4.0 license, which permit the free download, distribution, and reuse, provided that the author and preprint are cited in any reuse.


