
Submitted:
30 December 2025
Posted:
31 December 2025
You are already at the latest version
Abstract
Background: Automated visual field testing is fundamental in ophthalmology, but differences in stimulus scaling and luminance between devices hinder direct comparison of sensitivity values. Virtual reality (VR)–based perimetry has emerged as a portable alternative, yet its relationship with conventional perimetry requires clarification. Methods: This prospective cross-sectional study included 60 healthy participants stratified into younger (< 50 years) and older (≥ 50 years) groups. Differential light sensitivity was assessed in the right eye using Humphrey Automated Perimetry (HFA 30-2) and a VR-based perimeter (Dicopt-Pro) in randomized order. Pointwise sensitivity values were analyzed using linear regression and Bland–Altman analysis, and sensitivity profiles were examined as a function of visual field eccentricity. Results: A strong linear relationship was observed between HFA and Dicopt-Pro sensitivity values in both age groups (R ≥ 0.96). A systematic and approximately constant inter-device offset was identified, with mean differences of 15.7 ± 0.4 dB in younger subjects and 13.7 ± 0.5 dB in older subjects. Bland–Altman analysis showed consistent bias without proportional error. Dicopt-Pro sensitivity profiles demonstrated an eccentricity-dependent decline comparable to HFA while preserving age-related differences. Conclusions: VR-based perimetry using Dicopt-Pro shows sensitivity patterns closely aligned with conventional Humphrey perimetry when a systematic, age-specific inter-device offset is considered.
Keywords:
visual field
; automated perimetry
; virtual reality perimetry
; humphrey field analyzer
; scale offset
1. Introduction
Visual field assessment is a cornerstone of functional evaluation in ophthalmology and optometry, playing a critical role in the early detection and monitoring of diseases such as glaucoma, optic neuropathies, and retinal disorders [1,2]. Functional alterations in the visual field may precede detectable structural changes, making perimetry an essential diagnostic and follow-up tool [3]. However, the accuracy, reproducibility, and clinical interpretability of visual field measurements are strongly influenced by the characteristics of the perimetric device, which complicates direct comparison across different systems.
Traditionally, visual field testing has been performed using conventional perimeters, evolving from kinetic Goldmann perimetry to static automated perimetry systems such as the Humphrey Field Analyzer (HFA) and the Octopus perimeter [1,3]. These devices are specifically designed to quantify differential light sensitivity at predefined retinal locations using standardized testing strategies. Despite their widespread clinical adoption and well-established normative databases, conventional automated perimeters present several limitations [4]. Their large physical footprint, high acquisition and maintenance costs, and dependence on controlled clinical environments restrict their accessibility in certain settings. In addition, these tests require sustained fixation, attention, and cooperation from the patient, often leading to fatigue and reduced test reliability, particularly in elderly subjects or those with limited mobility.
Recent technological advances have introduced virtual reality (VR)–based solutions as an alternative approach to visual field assessment [5,6]. Head-mounted VR perimeters offer increased portability, controlled visual environments, and enhanced flexibility in test design, while potentially improving patient comfort and engagement [6]. Several studies have demonstrated the feasibility of VR-based perimetry for visual field screening and monitoring, highlighting its potential role in clinical practice, telemedicine, and home-based assessment [7].
Among these emerging technologies, the Dicopt-Pro system represents a portable VR-based perimetric platform designed to evaluate central visual field sensitivity using strategies comparable to those employed in standard automated perimetry [8]. However, the integration of VR-based perimetry into routine clinical workflows and longitudinal studies requires a rigorous understanding of how its measurements relate quantitatively to those obtained with established gold-standard devices such as the HFA 30-2 [1,3]. Without a clear characterization of the inter-device scale relationship, direct comparison of sensitivity values across devices remains problematic [9].
From an applied perspective, the lack of interoperability between perimetric devices represents a relevant limitation in both clinical practice and research settings. Visual field data obtained with different instruments cannot be directly compared or pooled without a clear understanding of the systematic scale-related differences between devices, which complicates longitudinal follow-up, multi-center studies, and the integration of emerging technologies into established clinical workflows [9,10].
This issue becomes particularly relevant when novel perimetric platforms are intended to complement rather than replace conventional devices, as is the case with virtual reality–based systems. In this context, clearly characterizing the systematic scale-related differences between devices enables continuity with existing normative databases, facilitates interpretation by clinicians familiar with standard automated perimetry, and supports the adoption of portable or remote assessment tools without disrupting current diagnostic paradigms.
A key challenge in this context arises from scale effects inherent to perimetric measurements. Visual field sensitivity is expressed in decibels (dB), representing the logarithmic attenuation of the maximum stimulus luminance [4]. Because different perimeters operate with distinct maximum stimulus luminances while often sharing similar background luminance levels, identical sensitivity values expressed in dB may correspond to substantially different physical luminance levels.
To address the relationship between conventional automated perimetry and virtual reality–based perimetry from a rigorous scientific perspective, it is essential to emphasize that differences in sensitivity values expressed in decibels arise directly from how each device defines its dB scale relative to its own maximum stimulus luminance (Lmax) [10,11,16]. Because both instruments operate under Weber’s law, retinal sensitivity remains physiologically constant, while numerical dB values differ due to distinct luminance reference levels [11,16]. Consequently, systematic inter-device differences in dB do not imply differences in perceptual sensitivity, but rather reflect scale-dependent reference shifts inherent to each perimetric system [10,11].
From a theoretical standpoint, differences in maximum stimulus luminance between conventional and VR-based perimeters suggest the existence of a predictable and approximately constant scale offset between their sensitivity measurements. Characterizing this offset is essential to enable meaningful comparison with historical HFA data and to support the clinical interpretation of VR-based perimetry. Moreover, the availability of age-stratified normative data is crucial for the correct interpretation of VR-based visual field results in healthy populations.
Therefore, the aims of the present study were threefold: to compare differential light sensitivity values obtained with Humphrey Automated Perimetry (HFA 30-2) and the Dicopt-Pro virtual reality–based perimeter in healthy younger and older subjects; to characterize the systematic inter-device sensitivity offset between both systems; and to establish normative sensitivity profiles for the Dicopt-Pro in a population without ocular pathology.
By addressing these objectives, this study seeks to bridge classical automated perimetry and virtual reality–based perimetry within a coherent, scale-aware quantitative reference framework
2. Materials and Methods
2.1. Study Design and Participants
This prospective, observational, analytical, cross-sectional study included 60 healthy volunteers of different ages, with no history of ocular or systemic disease affecting visual function. Inclusion criteria required a best-corrected visual acuity (BCVA) of 0.30 logMAR or better in the tested eye. Exclusion criteria included the presence of ocular pathology (e.g., cataract, glaucoma, macular or retinal disease), previous ocular surgery, or current systemic or topical medication with known effects on visual performance (e.g., corticosteroids or antiepileptic drugs).
To explore the influence of age on visual field sensitivity, participants were stratified into two age groups: younger than 50 years and 50 years or older. Only the right eye of each participant was included in the analysis to avoid inter-eye correlation effects.
All procedures adhered to the tenets of the Declaration of Helsinki. The study protocol was reviewed and approved by the Ethics Committee of Hospital Clínico San Carlos (Madrid, Spain; approval code 23/614-E). Written informed consent was obtained from all participants after a detailed explanation of the study procedures.
The study workflow, including participant selection, perimetric testing, and data inclusion, is summarized in Figure 1. All participants underwent Humphrey Field Analyzer (HFA) 30-2 and Dicopt-Pro virtual reality–based perimetry in randomized order, with only the right eye included for analysis.
2.2. Clinical Examination
All participants underwent a comprehensive optometric examination to confirm eligibility. Visual acuity was measured monocularly using an ETDRS chart (Precision Vision, La Salle, IL, USA) and recorded in logMAR units. The anterior segment was evaluated using a slit lamp biomicroscope (SL-D2, Topcon, Tokyo, Japan). Objective refraction, pupillometry, pachymetry, and non-contact tonometry were assessed using a multi-diagnostic platform (Visionix VX120, Luneau Technology, France).
2.3. Perimetric Testing
Each participant underwent two visual field examinations in randomized order: a standard automated perimetry test using the Humphrey Field Analyzer (HFA) and an equivalent visual field assessment using the Dicopt-Pro virtual reality–based perimeter. The order of device testing was randomized to minimize learning and fatigue effects, and both examinations were performed on the same day with a rest period between tests.
Humphrey Field Analyzer (HFA):
Standard 30-2 testing was performed using a Goldmann size III stimulus with a duration of 200 ms, a background luminance of 31.5 apostilbs (asb), and the SITA-Standard strategy. The maximum stimulus luminance was 10,000 asb.
Dicopt-Pro:
An equivalent 30° visual field test was performed using the Dicopt-Pro system. Stimulus size and duration were designed to be comparable to those of the HFA test, with a background luminance of 31.5 asb. A 4-2-1 thresholding strategy was employed, and stimuli were presented within an immersive virtual reality environment with controlled luminance adaptation. The maximum stimulus luminance of the Dicopt-Pro system was 273.63 asb.
Visual field sensitivity values from both devices were recorded in decibels (dB) and compared on a point-by-point basis according to corresponding test locations.
2.4. Data Analysis and Inter-Device Scale Relationship
Linear regression analysis was used to evaluate the relationship between sensitivity values obtained with the HFA and the Dicopt-Pro systems and to characterize the systematic inter-device offset between sensitivity scales, arising from differences in maximum stimulus luminance reference. Based on this characterization, Dicopt-Pro sensitivity data were expressed relative to the HFA reference framework to generate normative sensitivity profiles as a function of visual field eccentricity.
2.5. Statistical Analysis
Statistical analyses were performed using standard statistical software (IBM SPSS Statistics, version 30; IBM Corp., Armonk, NY, USA). Prior to inferential analyses, data distribution was assessed using the Shapiro–Wilk test and visual inspection of histograms and Q–Q plots.
Quantitative variables are presented as mean ± standard deviation when normally distributed, or as median and interquartile range otherwise. Visual field sensitivity values obtained with both devices were analyzed descriptively and comparatively.
To evaluate the relationship between sensitivity measurements obtained with the Humphrey Field Analyzer (HFA) and the Dicopt-Pro system, simple linear regression analysis was performed, considering pointwise sensitivity values as continuous variables. The slope, intercept, and correlation coefficient (R) were used to characterize the strength of the linear association between both systems and to quantify the systematic inter-device sensitivity offset arising from differences in stimulus luminance reference.
Agreement between the two measurement methods was further explored using Bland–Altman plots in order to identify potential systematic bias and assess the consistency of differences across the range of measured sensitivities.
To analyze the influence of age, participants were stratified into two groups (<50 years and ≥50 years), and between-group differences in sensitivity values were evaluated using parametric (independent-samples Student’s t-test) or non-parametric (Mann–Whitney U test) methods, depending on data distribution.
After accounting for the systematic inter-device sensitivity offset, Dicopt-Pro sensitivity values were expressed relative to the HFA reference framework to generate normative sensitivity profiles as a function of visual field eccentricity. A two-tailed p-value < 0.05 was considered statistically significant for all analyses.
3. Results
A total of 60 healthy participants were included, with one eye per subject (right eye) analyzed according to the study design. Participants were stratified into two age groups: a younger group (<50 years) and an older group (≥50 years).
Table 1 summarizes the demographic and clinical characteristics of both groups. As expected, a significant difference in age was observed between groups (p < 0.001). Significant between-group differences were also found for objective spherical equivalent and photopic pupil diameter (p < 0.05). No statistically significant differences were observed in subjective refraction, intraocular pressure, central corneal thickness, or mesopic pupil diameter (p > 0.05).
Visual field sensitivity values obtained with the Humphrey Field Analyzer (HFA 30-2) and the Dicopt-Pro system were compared on a point-by-point basis across corresponding test locations.
Figure 2 illustrates the distribution of sensitivity values across visual field eccentricities for both devices in the younger group.
Figure 3 illustrates the eccentricity-dependent sensitivity profile in the older group for both perimetric systems. As observed in the younger group, differential light sensitivity decreased progressively with increasing eccentricity, with consistently higher absolute sensitivity values obtained with HFA compared to Dicopt-Pro across all tested locations. The overall shape of the sensitivity decline was comparable between devices, indicating similar spatial sensitivity patterns in older subjects.
A relatively constant offset between HFA and Dicopt-Pro sensitivity values was observed across eccentricities, suggesting a systematic difference between the two measurement scales rather than location-dependent variability.
Linear regression analysis demonstrated a strong linear relationship between pointwise sensitivity values obtained with HFA and Dicopt-Pro in both age groups (Table 2). In the younger group, regression analysis revealed a high correlation coefficient (R), indicating a strong linear association between sensitivity values measured by both devices. A similarly strong linear relationship was observed in the older group.
Although regression parameters were calculated separately for each device as a function of eccentricity, the inter-device offset was estimated from pointwise sensitivity differences across corresponding visual field locations.
The regression intercepts revealed a systematic and approximately constant offset between the two devices. Mean pointwise sensitivity differences, calculated across corresponding visual field locations, were 15.7 ± 0.4 dB in the younger group and 13.7 ± 0.5 dB in the older group, characterizing an age-dependent inter-device sensitivity offset rather than a conversion factor.
The limits of agreement were comparable between age groups, suggesting similar variability in inter-device differences across the studied age range.
After accounting for the systematic inter-device sensitivity offset, Dicopt-Pro sensitivity values were expressed relative to the HFA reference framework. Figure 4 illustrates the resulting normative sensitivity profiles as a function of visual field eccentricity for both age groups.
Dicopt-Pro sensitivity profiles showed an eccentricity-dependent decline comparable in shape to that observed with Humphrey Automated Perimetry, while preserving expected age-related differences. These results provide normative reference profiles for Dicopt-Pro measurements in healthy subjects, independent of direct numerical equivalence with conventional perimeters.
Agreement between HFA and Dicopt-Pro sensitivity measurements was further evaluated using Bland–Altman analysis (Figure 5). The analysis revealed a consistent mean bias across the sensitivity range, with no evidence of proportional error. The limits of agreement were comparable between younger and older subjects, supporting the presence of a systematic and approximately constant offset between devices.
4. Discussion
The present study investigated the relationship between conventional automated perimetry and virtual reality–based perimetry by directly comparing sensitivity measurements obtained with the Humphrey Field Analyzer (HFA 30-2) and the Dicopt-Pro system in healthy subjects across two age groups. The main findings demonstrate that, despite systematic differences in absolute sensitivity values attributable to device-specific scaling characteristics, both devices exhibit highly comparable eccentricity-dependent sensitivity profiles.
From a psychophysical standpoint, the observed constant offset between HFA and Dicopt-Pro sensitivity values reflects an isomorphic sensory response despite differences in numerical representation. Because perimetric sensitivity is expressed as a logarithmic attenuation relative to each device’s maximum stimulus luminance, identical perceptual thresholds correspond to different dB values when Lmax differs between instruments.
In this context, the preservation of equal spacing between sensitivity values across devices indicates an equidistant relationship between logarithmic scales, rather than a true conversion of thresholds. This scale equidistance allows sensitivity profiles obtained with Dicopt-Pro to be interpreted within the clinical reference framework of Humphrey Automated Perimetry without violating Weber’s law or altering the physical meaning of the stimulus.
The observed inter-device displacement can therefore be described as a factor of equidistance, defined as the constant offset between parallel logarithmic dB scales that preserves Weber proportionality and sensory isomorphism across devices.
A consistent and approximately constant offset in sensitivity values was observed between HFA and Dicopt-Pro across visual field locations, as evidenced by linear regression analysis and Bland–Altman agreement assessment. This offset amounted to approximately 15.7 dB in younger subjects and 13.7 dB in older subjects, supporting the existence of a scale-related difference rather than location-dependent variability. Similar systematic inter-device differences have been reported in previous comparisons of automated perimeters, where uniform offsets were attributed primarily to differences in stimulus luminance scaling and dynamic range rather than to fundamental discrepancies in visual field sensitivity measurement [9,10]. In addition, Hutchings et al. [12] demonstrated that absolute sensitivity values and their variability are strongly influenced by instrument-specific characteristics, reinforcing the need for device-dependent calibration or conversion approaches.
In line with these findings, recent studies comparing head-mounted or virtual reality–based perimetry with conventional Humphrey automated perimetry have reported good agreement for global indices and pointwise sensitivity metrics, together with shorter examination times and high patient acceptance. Studies by Hekmatjah et al., Najdawi et al., and Zeppieri et al. [13,14,15] have shown that VR-based perimeters can achieve clinically acceptable concordance with HFA measurements, supporting their feasibility as alternative or complementary tools for visual field assessment.
The observation of a largely constant offset across eccentricities suggests that both systems rely on comparable psychophysical principles and assess similar perceptual thresholds, despite operating with markedly different maximum stimulus luminances. It is well established that perimetric sensitivity expressed in decibels is inherently device-dependent, as the dB scale represents a logarithmic attenuation relative to each instrument’s maximum achievable stimulus intensity and background luminance. Consequently, identical sensitivity values expressed in decibels may correspond to different physical luminance levels when devices operate with different dynamic ranges, as discussed in classical and contemporary perimetric modeling studies [11,16]. Within this context, the present findings should be interpreted as demonstrating systematic, scale-related differences between devices rather than numerical equivalence of sensitivity values.
Importantly, when Dicopt-Pro sensitivity profiles are examined in relation to Humphrey Automated Perimetry measurements, they closely match the overall shape and eccentricity-dependent decline observed with HFA, while preserving expected age-related differences. These profiles provide preliminary normative reference data for Dicopt-Pro measurements in healthy individuals and support the feasibility of integrating VR-based perimetry into existing clinical and research frameworks without implying direct numerical equivalence between devices.
Age-related differences observed in visual function parameters, including visual acuity, pupil diameter, and refractive status, are consistent with well-documented physiological changes associated with aging and served primarily as contextual variables in the present study. Previous research has shown that aging is associated with a gradual decline in visual acuity and changes in both optical and neural components of the visual system [17]. However, the preservation of similar sensitivity gradients and regression slopes across age groups in the present study indicates that the performance of the Dicopt-Pro system remains stable across different age ranges, reinforcing the robustness and consistency of the observed inter-device relationship across age groups.
From an applied perspective, the systematic characterization of sensitivity differences between conventional automated perimetry and VR-based perimetry substantially enhances the clinical and research utility of Dicopt-Pro. Rather than transforming or converting sensitivity values between devices, the present results provide device-specific normative reference data for Dicopt-Pro measurements in healthy individuals, contextualized by their relationship with Humphrey Automated Perimetry. This approach facilitates informed comparison with historical datasets, supports longitudinal interpretation within the same device, and enables multi-center studies employing different perimetric platforms without assuming numerical equivalence across instruments. Recent studies have highlighted the feasibility and potential advantages of VR-based perimetry, including improved portability, patient comfort, and applicability in remote or non-clinical environments [5,6]. These features are particularly relevant in populations with limited mobility and in screening or telemedicine contexts.
This applied perspective is consistent with broader reviews of visual field testing modalities, in which emerging technologies such as VR-based perimetry are highlighted as promising solutions for expanding access to functional visual assessment beyond conventional clinical environments [18].
Several limitations of the present study should be acknowledged. First, the study was conducted exclusively in a healthy population, and therefore the applicability of the observed inter-device relationship to patients with visual field defects, such as those with glaucoma or neuro-ophthalmological conditions, remains to be determined. Second, the analysis was limited to central visual field testing, and the behavior of Dicopt-Pro sensitivity measurements in peripheral visual field regions was not assessed. In addition, test–retest variability was not explicitly evaluated, which is particularly relevant given previous evidence showing that fatigue effects and measurement variability can substantially influence automated perimetry outcomes and their interpretation in longitudinal follow-up [19,20,21].
Finally, although age stratification was included, larger samples covering a wider age range would allow more refined characterization of age-related effects on device-specific sensitivity profiles. Future studies including clinical populations, peripheral field assessment, and repeatability analysis will be essential to further evaluate the clinical utility and robustness of VR-based perimetry using Dicopt-Pro.
Overall, the present results indicate that sensitivity measurements obtained with Dicopt-Pro follow patterns closely comparable to those observed with conventional Humphrey automated perimetry once scale-related differences are accounted for, supporting the integration of VR-based perimetry within existing visual field assessment frameworks.
5. Conclusions
The present study demonstrates the existence of sensory equidistance between Humphrey Automated Perimetry and the Dicopt-Pro virtual reality–based perimeter. The observed dB displacement—approximately 15.7 dB in younger subjects and 13.7 dB in older subjects—represents a constant scale offset that preserves the proportional structure of visual field sensitivity.
This offset should not be interpreted as a simple additive conversion factor, but rather as a normalization between logarithmic sensitivity scales with different luminance references, necessary to maintain the integrity of Weber’s law in perimetric interpretation. Within this framework, Dicopt-Pro provides clinically meaningful and physiologically consistent visual field assessments that are directly comparable in structure, though not numerically equivalent, to conventional Humphrey perimetry.
Supplementary Materials
The following supporting information can be downloaded at the website of this paper posted on Preprints.org. Table S1: Relationship between stimulus attenuation in decibels and maximum luminance (Lmax) for the Humphrey Field Analyzer and the Dicopt-Pro system.
Author Contributions
Conceptualization, F.J.P.-M. and J.E.C.-S.; methodology, F.J.P.-M.; software, F.J.P.-M.; validation, F.J.P.-M., J.E.C.-S. and R.B.-V.; formal analysis, F.J.P.-M.; investigation, F.J.P.-M., L.S.-A., M.M.-G. and C.O.-C.; resources, F.J.P.-M.; data curation, F.J.P.-M. and R.B.-V.; writing—original draft preparation, F.J.P.-M.; writing—review and editing, F.J.P.-M., J.E.C.-S. and R.B.-V.; visualization, F.J.P.-M.; supervision, F.J.P.-M.; project administration, F.J.P.-M.; funding acquisition, F.J.P.-M.. All authors have read and agreed to the published version of the manuscript
Funding
This research received no external funding.
Institutional Review Board Statement
The study was conducted in accordance with the Declaration of Helsinki and approved by the Ethics Committee of Hospital Clínico San Carlos (Madrid, Spain) (protocol code 23/614-E).
Informed Consent Statement
Informed consent was obtained from all subjects involved in the study.
Data Availability Statement
The data presented in this study are available from the corresponding author upon reasonable request. The data are not publicly available due to ethical and privacy restrictions.
Conflicts of Interest
The authors declare no conflicts of interest. The funders had no role in the design of the study; in the collection, analyses, or interpretation of data; in the writing of the manuscript; or in the decision to publish the results.
Abbreviations
The following abbreviations are used in this manuscript:
| asb | Apostilbs |
| BCVA | Best-Corrected Visual Acuity |
| dB | Decibels |
| ETDRS | Early Treatment Diabetic Retinopathy Study |
| HFA | Humphrey Field Analyzer |
| IOP | Intraocular Pressure |
| logMAR | Logarithm of the Minimum Angle of Resolution |
| PD | Pupil Diameter |
| SAP | Standard Automated Perimetry |
| SD | Standard Deviation |
| SE | Spherical Equivalent |
| VR | Virtual Reality |
References
- Li, A.; De Moraes, C.G. The evolution of visual field testing: A 40-year perspective on modern perimetry in glaucoma. Ophthalmol. Glaucoma 2025, 8, S20–S26. [Google Scholar] [CrossRef] [PubMed]
- Brussell, E.M.; White, C.W.; Faubert, J.; Dixon, M.; Balazsi, G.A.; Overbury, O. Multi-flash campimetry as an indicator of visual field loss in glaucoma. Am. J. Optom. Physiol. Opt. 1986, 63, 32–40. [Google Scholar] [CrossRef] [PubMed]
- Erichev, V.P.; Antonov, A.A.; Vitkov, A.A.; Grigoryan, L.A. Static automated perimetry in the diagnosis of glaucoma: Assessment of disease progression. Vestn. Oftalmol. 2023, 139, 96–104. [Google Scholar] [CrossRef] [PubMed]
- Heijl, A.; Lindgren, G.; Olsson, J. The effect of perimetric experience in normal subjects. Arch. Ophthalmol. 1989, 107, 81–86. [Google Scholar] [CrossRef] [PubMed]
- Griffin, J.M.; Slagle, G.T.; Vu, T.A.; Eis, A.; Sponsel, W.E. Prospective comparison of VisuALL virtual reality perimetry and Humphrey automated perimetry in glaucoma. J. Curr. Glaucoma Pract. 2024, 18, 4–9. [Google Scholar] [CrossRef] [PubMed]
- Wong, K.A.; Ang, B.C.H.; Gunasekeran, D.V.; Husain, R.; Boon, J.; Vikneson, K.; et al. Remote perimetry in a virtual reality metaverse environment for out-of-hospital functional eye screening compared against the gold standard Humphrey visual fields perimeter: A proof-of-concept pilot study. J. Med. Internet Res. 2023, 25, e45044. [Google Scholar] [CrossRef] [PubMed]
- Shi, R.B.; Li-Han, L.Y.; Kherani, I.N.; Trope, G.E.; Buys, Y.M.; Wong, W.; et al. Virtual reality portable perimetry and home monitoring of glaucoma: Retention and compliance over a 2-year period. Ophthalmol. Sci. 2025, 5, 100639. [Google Scholar] [CrossRef] [PubMed]
- Mees, L.; Upadhyaya, S.; Kumar, P.; Kotawala, S.; Haran, S.; Rajasekar, S.; et al. Validation of a head-mounted virtual reality visual field screening device. J. Glaucoma 2020, 29, 86–91. [Google Scholar] [CrossRef] [PubMed]
- Landers, J.; Sharma, A.; Goldberg, I.; Graham, S. A comparison of global indices between the Medmont automated perimeter and the Humphrey field analyzer. Br. J. Ophthalmol. 2007, 91, 1285–1287. [Google Scholar] [CrossRef] [PubMed]
- Pye, D.; Herse, P.; Nguyen, H.; Vuong, L.; Pham, Q. Conversion factor for comparison of data from Humphrey and Medmont automated perimeters. Clin. Exp. Optom. 1999, 82, 11–14. [Google Scholar] [CrossRef] [PubMed]
- Heuer, D.K.; Anderson, D.R.; Feuer, W.J.; Gressel, M.G. The influence of decreased retinal illumination on automated perimetric threshold measurements. Am. J. Ophthalmol. 1989, 108, 643–650. [Google Scholar] [CrossRef] [PubMed]
- Hutchings, N.; Wild, J.M.; Hussey, M.K.; Flanagan, J.G.; Trope, G.E. The long-term fluctuation of the visual field in stable glaucoma. Invest. Ophthalmol. Vis. Sci. 2000, 41, 3429–3436. [Google Scholar] [PubMed]
- Hekmatjah, N.; Chibututu, C.; Han, Y.; Keenan, J.D.; Oatts, J.T. Virtual reality perimetry compared to standard automated perimetry in adults with glaucoma: A systematic review. PLoS ONE 2025, 20, e0318074. [Google Scholar] [CrossRef] [PubMed]
- Najdawi, W.O.; Jiang, F.; Zamba, G.K.D.; Johnson, C.A.; Pouw, A.E. Comparison of a novel head-mounted perimeter versus the Humphrey field analyzer. Ophthalmol. Glaucoma 2025, 8, 213–226. [Google Scholar] [CrossRef] [PubMed]
- Zeppieri, M.; Gagliano, C.; Cappellani, F.; Visalli, F.; D’Esposito, F.; Avitabile, A.; et al. Clinical assessment of a virtual reality perimeter versus the Humphrey field analyzer: Comparative reliability, usability, and prospective applications. Vision 2025, 9, 86. [Google Scholar] [CrossRef] [PubMed]
- Anderson, D.R.; Patella, V.M. Automated Static Perimetry, 2nd ed.; Mosby: St. Louis, MO, USA, 1999; pp. 1–45. [Google Scholar]
- Elliott, D.; Whitaker, D.; MacVeigh, D. Neural contribution to spatiotemporal contrast sensitivity decline in healthy ageing eyes. Vision Res. 1990, 30, 541–547. [Google Scholar] [CrossRef] [PubMed]
- Rai, B.B.; Sabeti, F.; Carle, C.F.; Maddess, T. Visual field tests: A narrative review of different perimetric methods. J. Clin. Med. 2024, 13, 2458. [Google Scholar] [CrossRef] [PubMed]
- Johnson, C.A.; Adams, C.W.; Lewis, R.A. Fatigue effects in automated perimetry. Appl. Opt. 1988, 27, 1030–1037. [Google Scholar] [CrossRef] [PubMed]
- Turpin, A.; McKendrick, A.M. What reduction in standard automated perimetry variability would improve the detection of visual field progression? Invest. Ophthalmol. Vis. Sci. 2011, 52, 3237–3245. [Google Scholar] [CrossRef] [PubMed]
- Saunders, L.J.; Russell, R.A.; Crabb, D.P. Measurement precision in a series of visual fields acquired by the standard and fast versions of the Swedish interactive thresholding algorithm. JAMA Ophthalmol. 2015, 133, 74–80. [Google Scholar] [CrossRef] [PubMed]
Figure 1.
Study flow diagram illustrating participant selection, inclusion criteria, perimetric testing sequence, and data included in the analysis.
Figure 1.
Study flow diagram illustrating participant selection, inclusion criteria, perimetric testing sequence, and data included in the analysis.
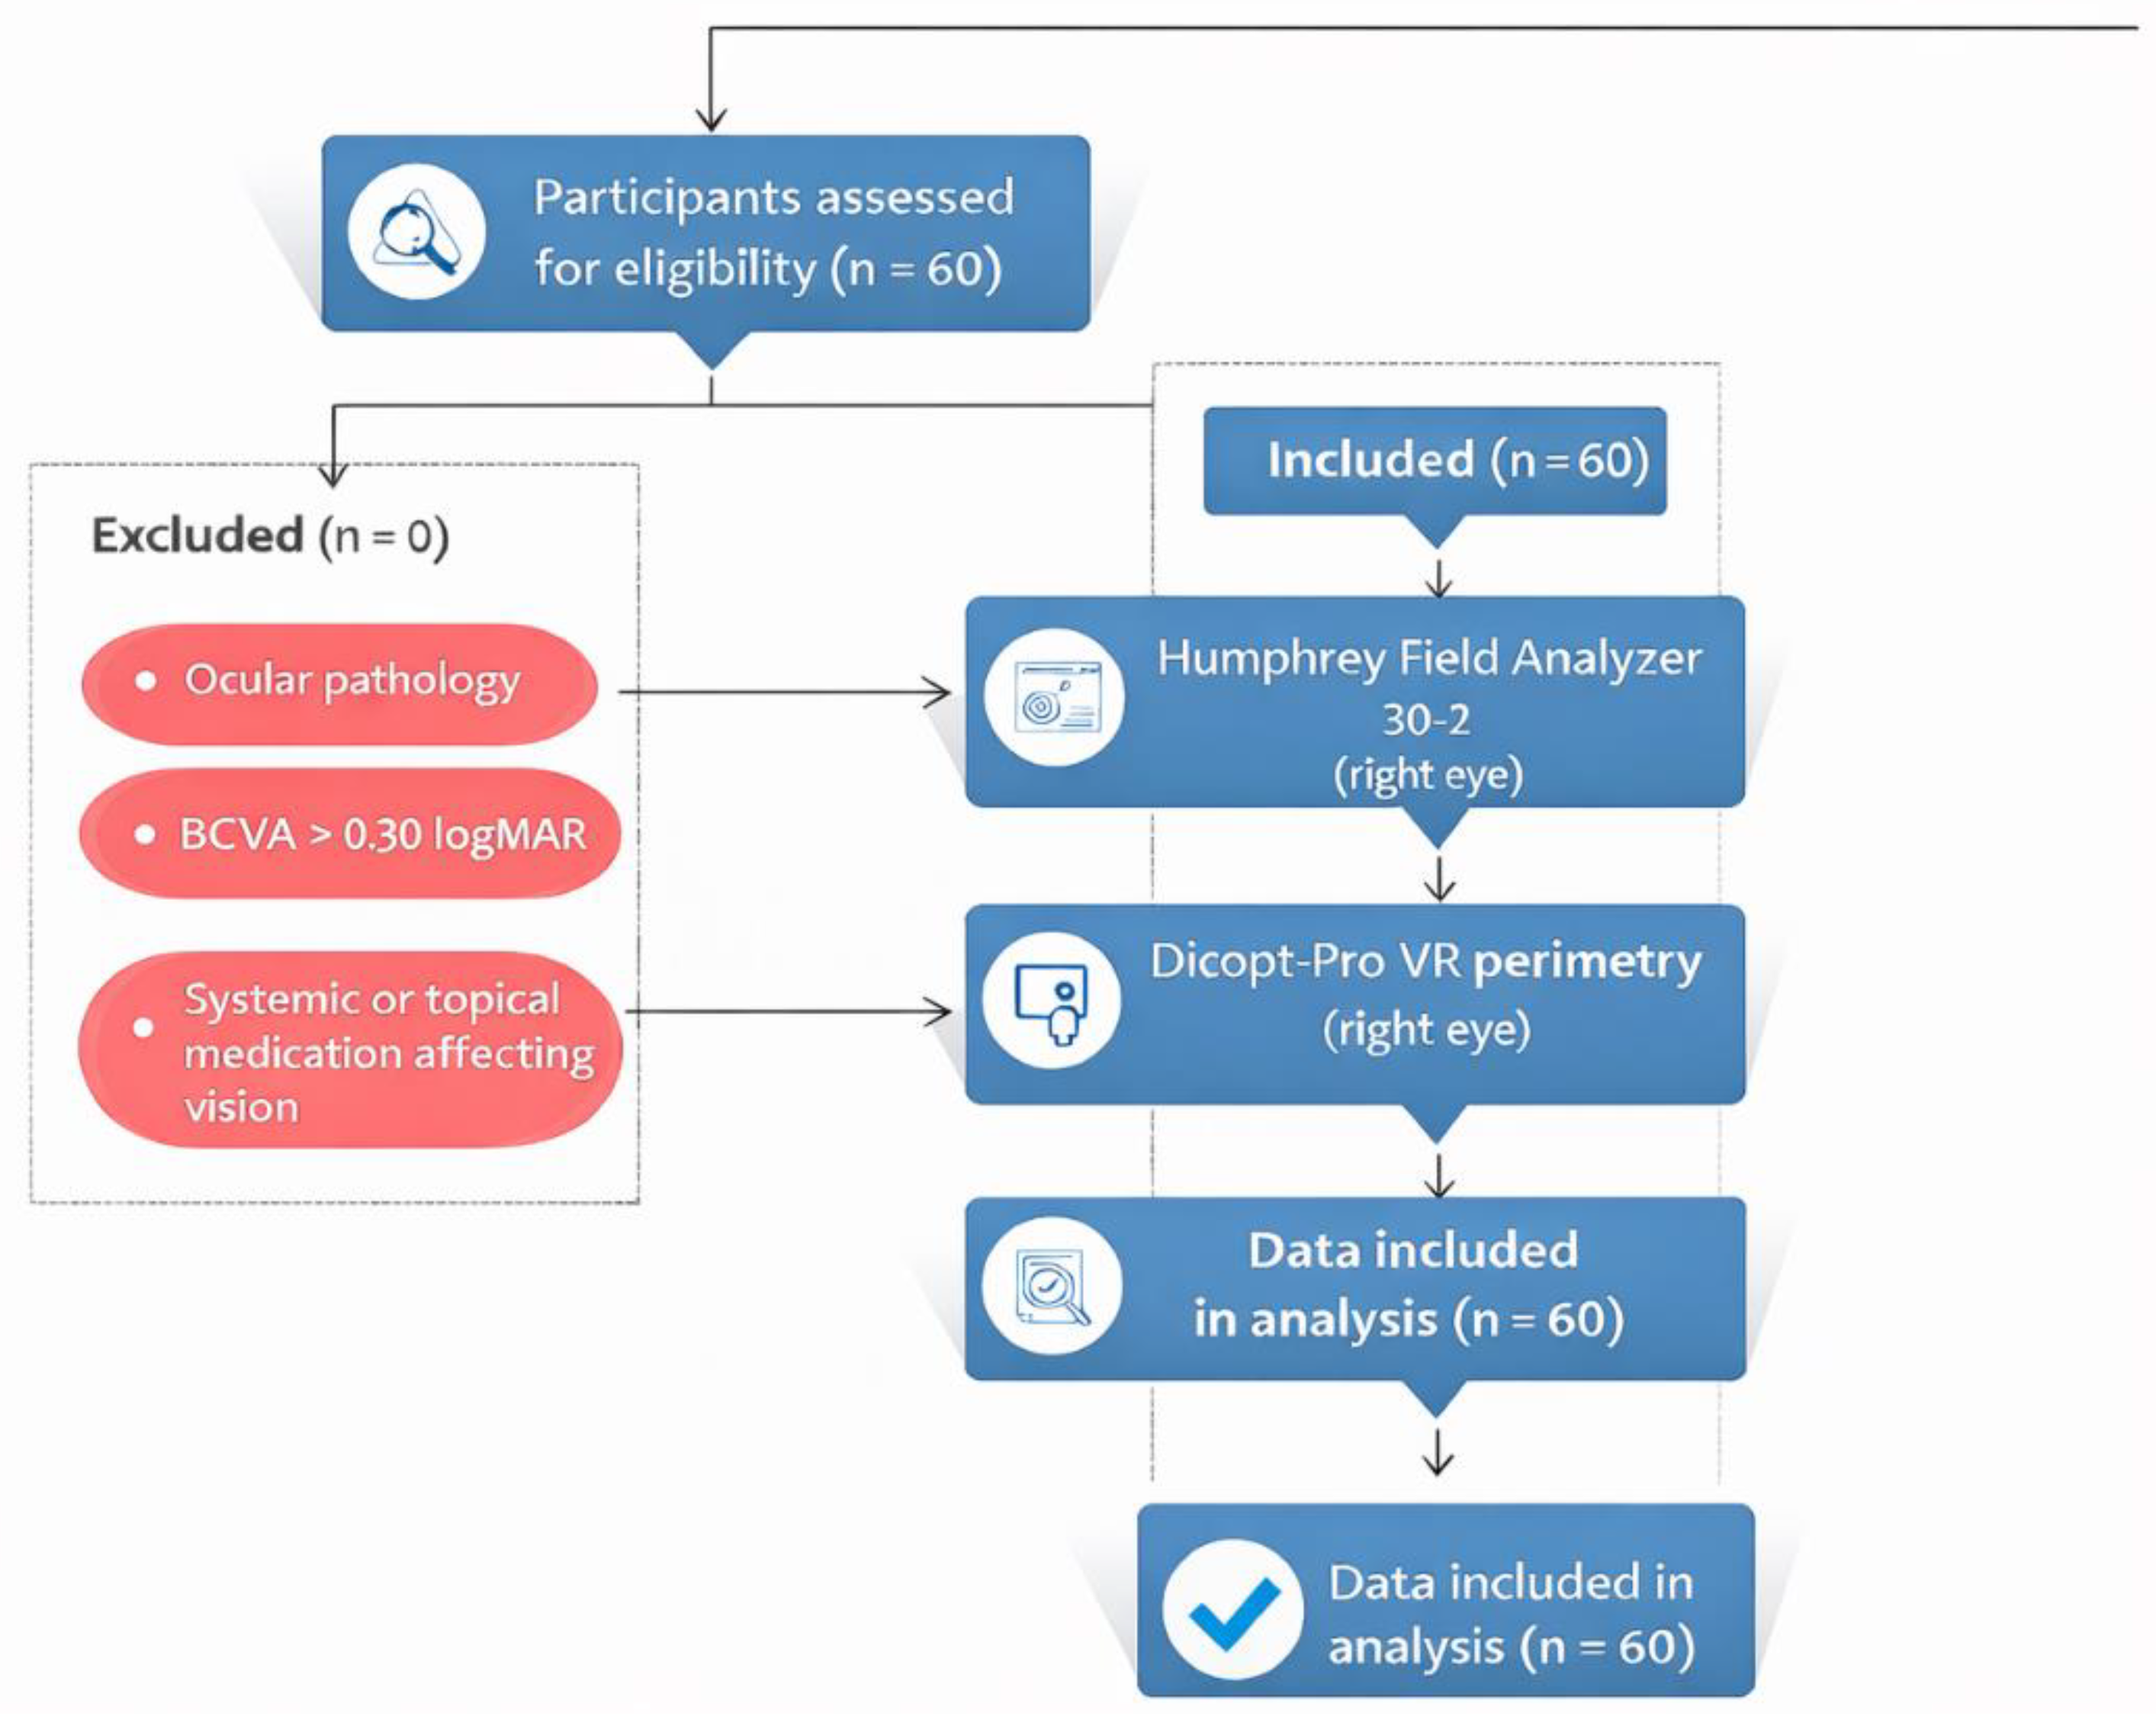
Figure 2.
Differential light sensitivity as a function of visual field eccentricity in the younger group, measured with the Humphrey Field Analyzer (HFA 30-2) and the Dicopt-Pro system. Both devices show a comparable eccentricity-dependent sensitivity profile, with a marked reduction at approximately 15° corresponding to the physiological blind spot.
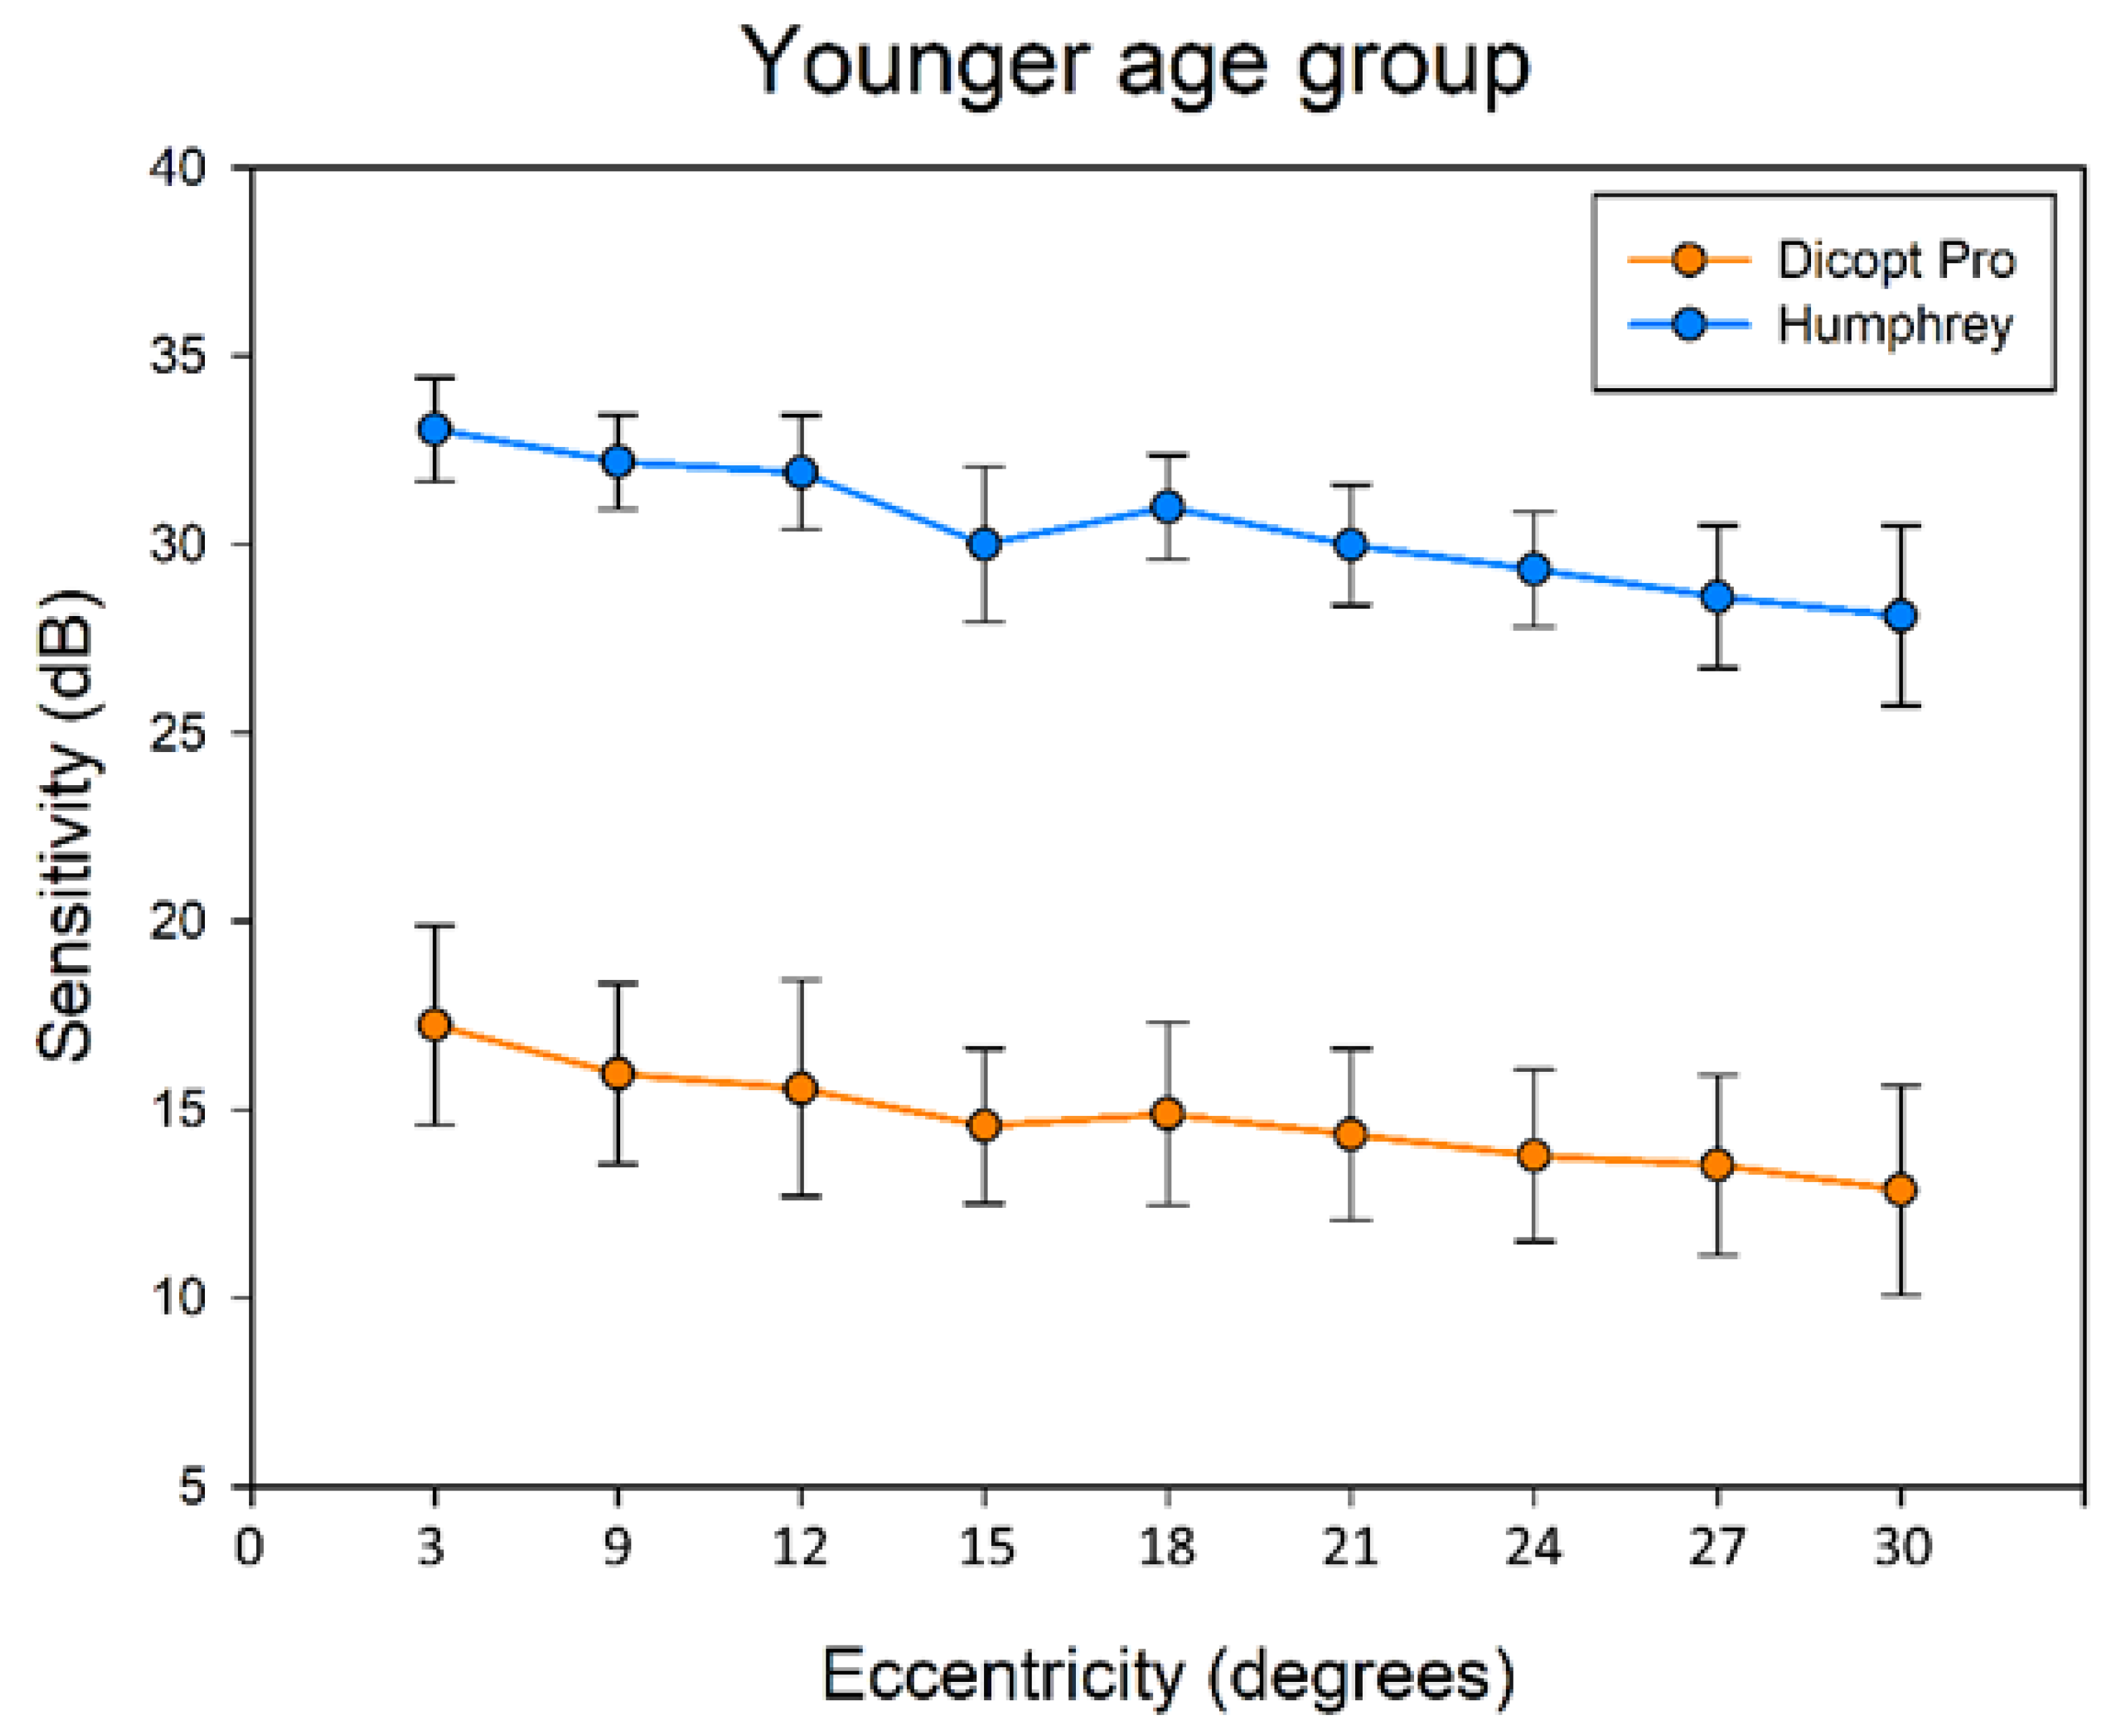
Figure 3.
Differential light sensitivity as a function of visual field eccentricity in the older group, measured with the Humphrey Field Analyzer (HFA 30-2) and the Dicopt-Pro system. Error bars indicate standard deviation.
Figure 3.
Differential light sensitivity as a function of visual field eccentricity in the older group, measured with the Humphrey Field Analyzer (HFA 30-2) and the Dicopt-Pro system. Error bars indicate standard deviation.
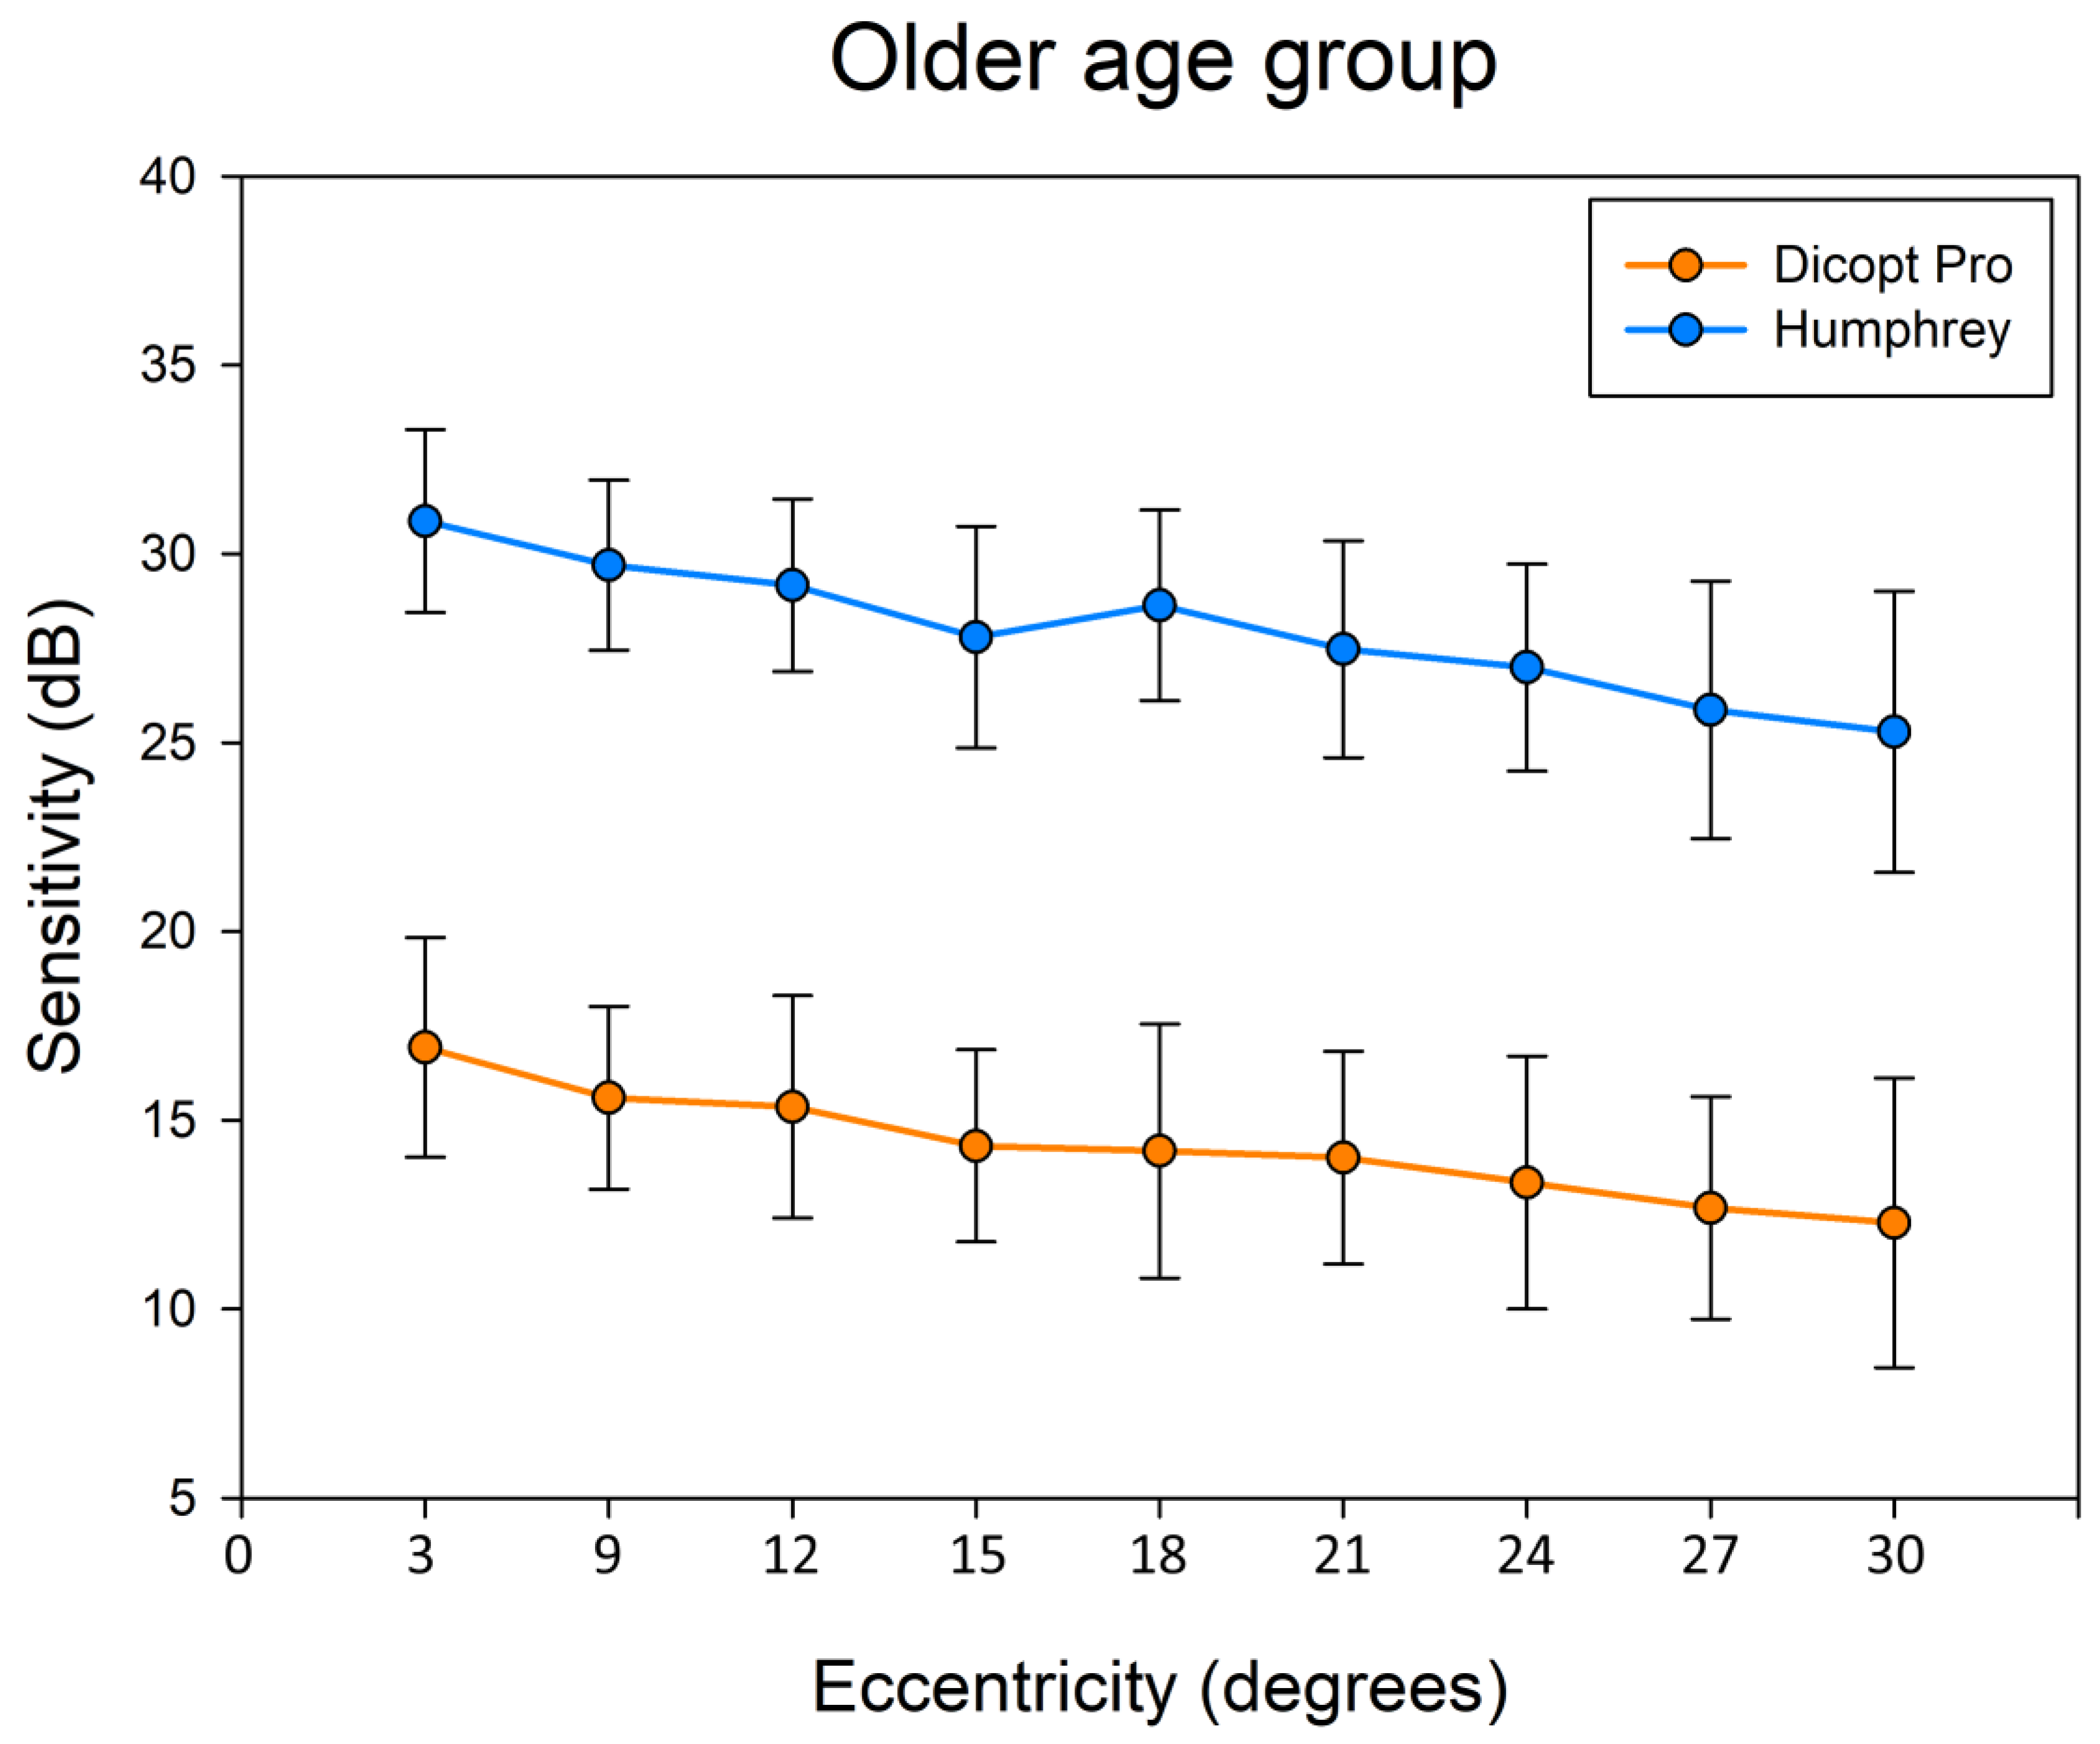
Figure 4.
Normative sensitivity profiles obtained with the Dicopt-Pro system as a function of visual field eccentricity for younger and older subjects. Both age groups exhibit highly comparable eccentricity-dependent sensitivity profiles, with a global age-related downward shift in sensitivity.
Figure 4.
Normative sensitivity profiles obtained with the Dicopt-Pro system as a function of visual field eccentricity for younger and older subjects. Both age groups exhibit highly comparable eccentricity-dependent sensitivity profiles, with a global age-related downward shift in sensitivity.
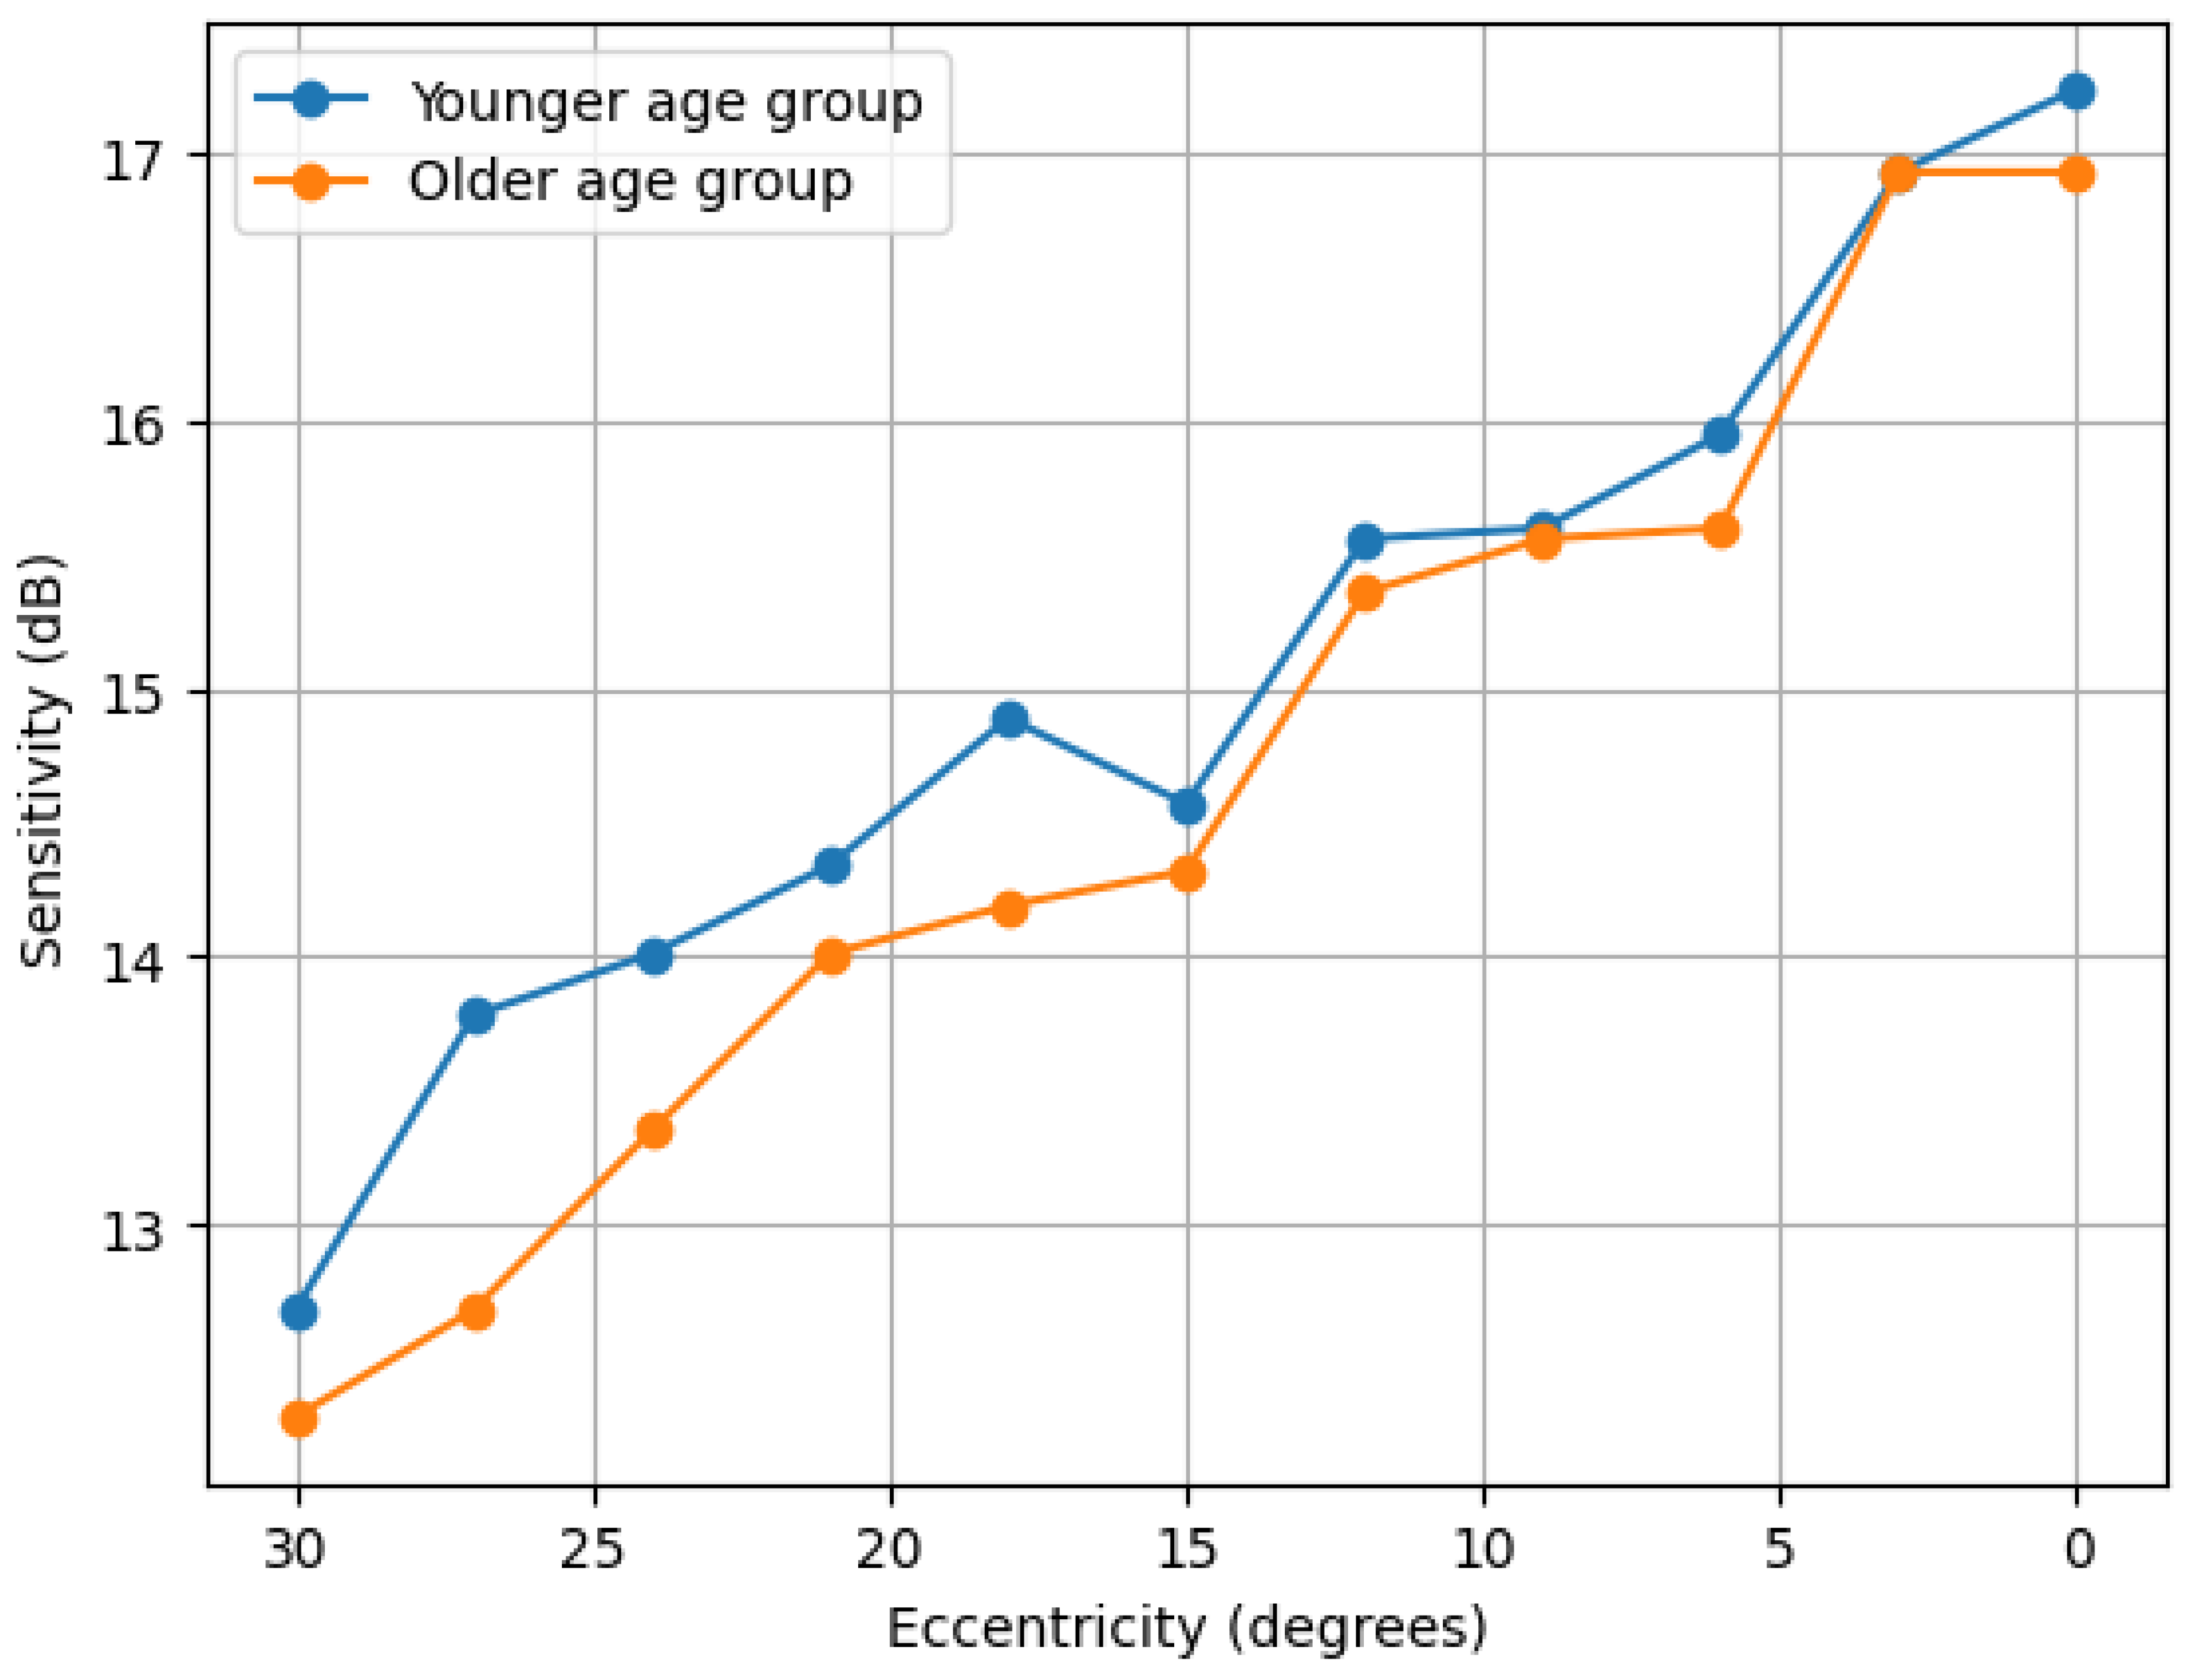
Figure 5.
Bland–Altman analysis showing agreement between Humphrey Automated Perimetry (HFA 30-2) and Dicopt-Pro sensitivity measurements. Solid lines indicate mean bias and dashed lines the 95% limits of agreement.
Figure 5.
Bland–Altman analysis showing agreement between Humphrey Automated Perimetry (HFA 30-2) and Dicopt-Pro sensitivity measurements. Solid lines indicate mean bias and dashed lines the 95% limits of agreement.
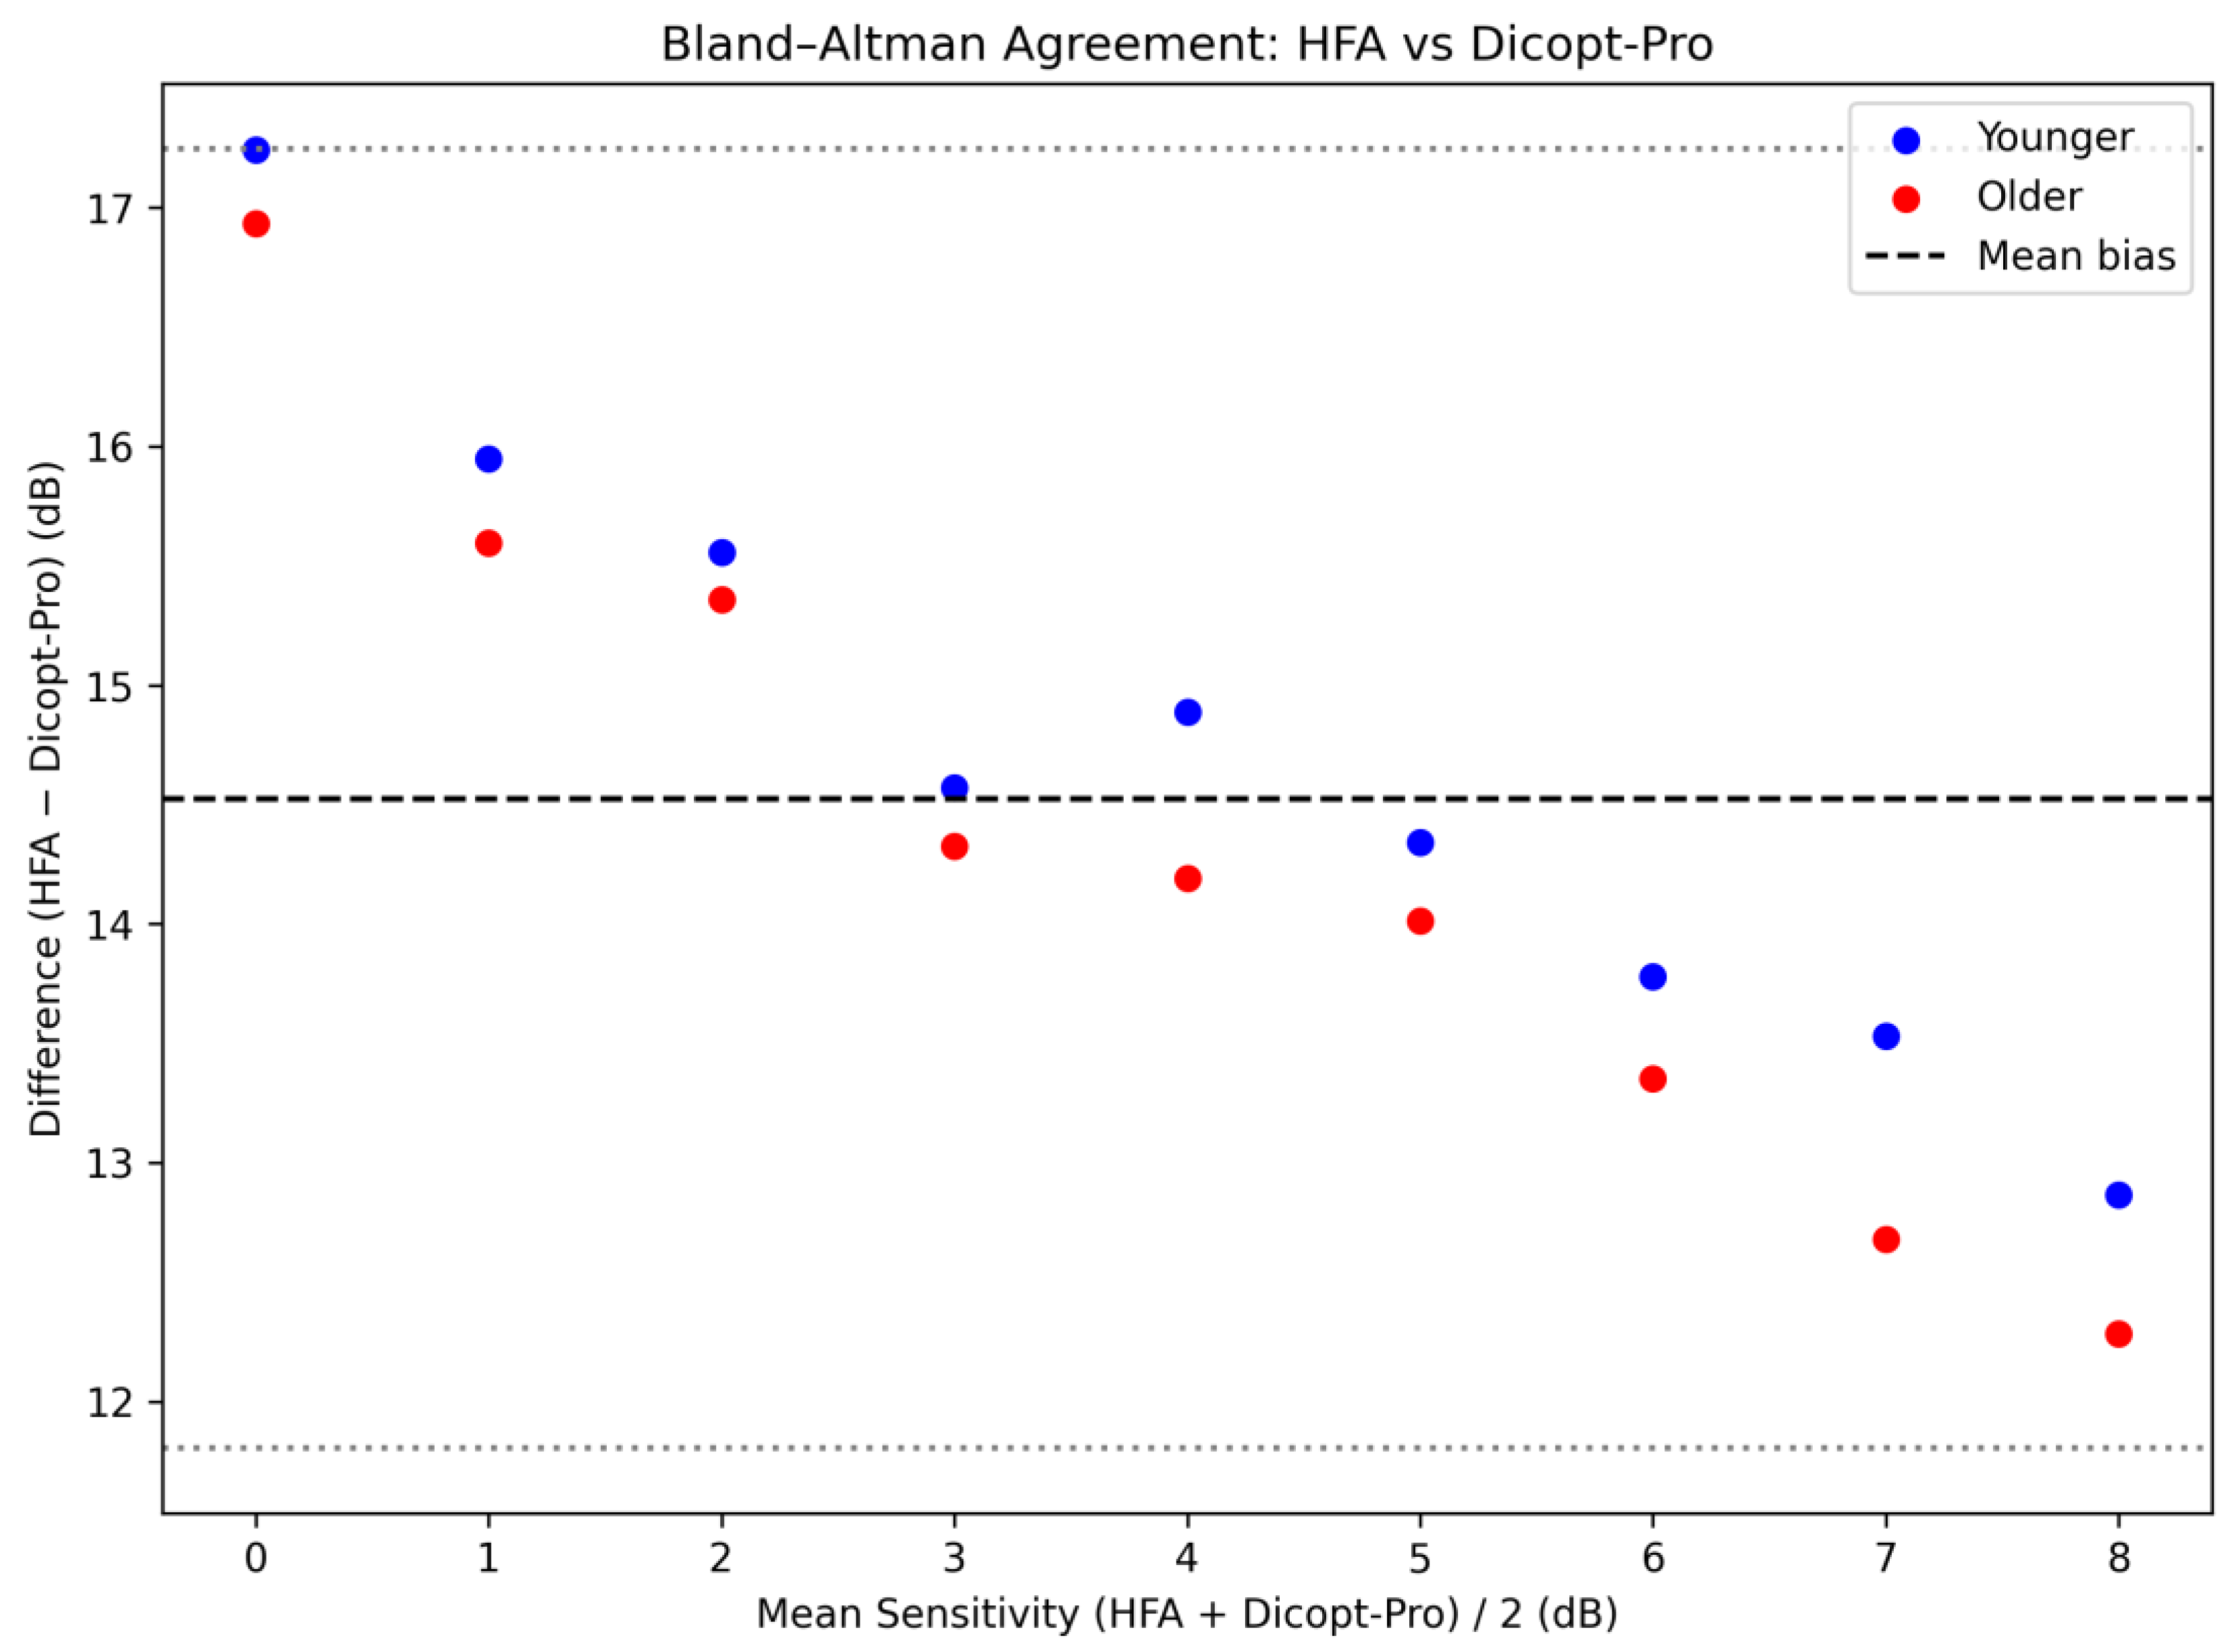

Table 1.
Demographic and clinical characteristics between the younger and older groups. Data are expressed as mean, standard deviation (SD), and minimum and maximum.
Table 1.
Demographic and clinical characteristics between the younger and older groups. Data are expressed as mean, standard deviation (SD), and minimum and maximum.
| Younger | Older | P value | ||
| No. of subjects (n) | 30 | 30 | ||
| Age, mean ± SD (range) | 22.77 ± 4.40 (21.0 – 44.0) | 59.9 ± 11.27 (50.0 – 80.0) | <0.001* | |
| SE (D) Objective refraction | -2.71 ± 4.05 (-17.13 – 0.50) | -0.63 ± 1.58 (-4.88 – 2.75) | 0.012* | |
| SE (D) subjective refraction | -1.81 ± 3.83 (-15.63 – 0.75) | -0.43 ± 1.46 (-4.5 – 2.25) | 0.070 | |
| BCVA (logMAR) | -0.09 ± 0.11 (-0.3 – 0.2) | -0.02 ± 0.11 (-0.2 – 0.3) | <0.001* | |
| IOP (mmHg) | 12.93 ± 2.68 (8.0 – 20.0) | 12.8 ± 2.55 (10 – 18.0) | 0.102 | |
| Pachymetry (µm) | 538.23 ± 33.77 (454 - 616) | 551.9 ± 47.34 (470 - 654) | 0.881 | |
| Photopic PD (mm) | 3.00 ± 0.00 (3.0 – 3.0) | 2.93 ± 0.15 (2.4 – 3.0) | <0.001* | |
| Mesopic PD (mm) | 4.79 ± 0.53 (2.4 – 5.0) | 3.66 ± 0.81 (2.4 – 5.0) | 0.761 | |
Table 2.
Linear regression parameters relating differential light sensitivity (dB) to visual field eccentricity for the Humphrey Field Analyzer (HFA 30-2) and Dicopt-Pro in the younger and older age groups.
Table 2.
Linear regression parameters relating differential light sensitivity (dB) to visual field eccentricity for the Humphrey Field Analyzer (HFA 30-2) and Dicopt-Pro in the younger and older age groups.
| Constant | Slope | R | P value | ||
| HFA | Younger | 33.734 | 0.185 | 0.967 | <0.001 |
| Older | 31.515 | 0.200 | 0.976 | <0.001 | |
| Dicopt-Pro | Younger | 17.400 | 0.150 | 0.982 | <0.001 |
| Older | 17.235 | 0.166 | 0.990 | <0.001 |
Disclaimer/Publisher’s Note: The statements, opinions and data contained in all publications are solely those of the individual author(s) and contributor(s) and not of MDPI and/or the editor(s). MDPI and/or the editor(s) disclaim responsibility for any injury to people or property resulting from any ideas, methods, instructions or products referred to in the content. |
© 2025 by the authors. Licensee MDPI, Basel, Switzerland. This article is an open access article distributed under the terms and conditions of the Creative Commons Attribution (CC BY) license (http://creativecommons.org/licenses/by/4.0/).
Copyright: This open access article is published under a Creative Commons CC BY 4.0 license, which permit the free download, distribution, and reuse, provided that the author and preprint are cited in any reuse.


