
Submitted:
30 December 2025
Posted:
31 December 2025
You are already at the latest version
Abstract
The shift toward Industry 5.0 places human-centred and digitally integrated metrology at the core of modern manufacturing, particularly in the automotive sector, where portable Laser Line Triangulation (LLT) systems must combine accuracy with operator usability. This study addresses the challenge of operator-induced variability by evalu-ating how algorithmic strategies and mechanical support features jointly influence the performance of a portable LLT device derived from the G3F sensor. A comprehensive Measurement System Analysis was performed to compare three feature-extraction al-gorithms—GC, FIR, and Steger—and to assess the effect of a masking device designed to improve mechanical alignment during manual measurements. The results highlight distinct algorithm-dependent behaviours in terms of repeatability, reproducibility, and computational efficiency. More sophisticated algorithms demonstrate improved sensi-tivity and feature localisation under controlled conditions, whereas simpler gradi-ent-based strategies provide more stable performance and shorter processing times when measurement conditions deviate from the ideal. These differences indicate a trade-off between algorithmic complexity and operational robustness that is particu-larly relevant for portable, operator-assisted metrology. The presence of mechanical alignment aids was found to contribute to improved measurement consistency across all algorithms. Overall, the findings highlight the need for an integrated co-design of algorithms, calibration procedures, and ergonomic aids to enhance repeatability and support operator-friendly LLT systems aligned with Industry 5.0 principles.
Keywords:
Laser Line Triangulation system
; Measurement System Analysis
; gap and flush measurement
1. Introduction
The evolution of manufacturing towards intelligent, adaptive, and human-centric paradigms has placed measurement technologies at the heart of industrial transformation. Industry 5.0, emphasizing the synergy between human expertise and advanced automation, requires quality control systems that are not only precise but also flexible, resilient, and capable of supporting customization and safety across diverse production environments [1,2].
This evolution is closely intertwined with the broader transition toward digitalization [3], which is redefining industrial processes across sectors through smart technologies, interconnected systems, and data-driven decision-making. Measurement systems are no longer isolated or purely manual instruments; they are becoming integrated platforms capable of real-time analysis, remote monitoring, and seamless communication with other digital assets. By combining advanced measurement capabilities with intelligent digital frameworks, manufacturers can achieve greater efficiency, traceability, and adaptability—laying the foundation for production environments that fully embody the principles of Industry 5.0 [4].
Within this broader transformation, the automotive sector exemplifies how digital metrology is reshaping traditional quality control practices. The integration of advanced sensors and automated inspection routines has become essential to meet the increasingly stringent aesthetic and functional requirements of modern vehicles [5]. Dimensional checks such as gap and flush—used to assess the alignment and surface continuity between adjacent body components—play a vital role in ensuring both visual appeal and aerodynamic performance. Their accurate detection is now a critical step in digitalized assembly lines, where precision and repeatability must coexist with speed and flexibility [6]. Gap refers to the lateral distance between two neighboring surfaces, while flush quantifies the vertical offset between them. Historically, these measurements were performed manually using gauges and visual inspection, but such methods are increasingly inadequate in the face of tighter tolerances and the need for traceability. Laser triangulation has emerged as a robust alternative, offering non-contact, high-resolution data acquisition suitable for both in-line and off-line applications [7].
Recent literature has explored various implementations of portable triangulation systems [8], including smartphone-integrated sensors [9,10,11] and robotic-mounted devices[12]. These solutions have demonstrated promising results in terms of mobility and integration with digital ecosystems [13]. However, a persistent challenge remains: the variability introduced by human operators when using handheld systems. While systematic errors can be minimized through calibration and design, operator-induced deviations continue to affect measurement reliability, especially in manual modes [14].
In manual measurement contexts, the role of the operator becomes a critical variable influencing the reliability of the acquired data. Even when using high-precision instruments, the absence of standardized handling procedures or real-time feedback mechanisms can lead to inconsistencies in positioning, orientation, and interpretation of results. These uncertainties, often subtle and difficult to detect, can compromise the validity of the analysis and hinder process optimization [15].
To mitigate these risks, it is essential to equip operators with advanced support techniques that enhance measurement repeatability and reduce subjective influence. This includes the integration of algorithmic guidance systems, ergonomic fixtures, and intelligent interfaces capable of assisting the user during acquisition. By embedding such tools into the measurement workflow, the system can actively compensate for human variability, ensuring that the data collected reflects the true geometry of the components rather than the nuances of operator behavior.
In response to this challenge, the present study builds on the existing G3F sensor, a portable Laser Line Triangulation (LLT) system previously reported in the literature for automotive applications [16], and introduces a novel contribution: a comparative analysis of three dedicated algorithms for gap and flush measurement. The key innovation of this work lies in evaluating these algorithms through a rigorous Measurement System Analysis (MSA), which systematically assesses their accuracy, repeatability, and reproducibility under varying operational conditions. While the G3F system itself is established, this study provides new insights into the relative performance of the algorithms, highlighting how differences in mathematical modelling, signal processing strategies, and sensitivity to environmental factors affect measurement reliability. This MSA-based comparison offers a robust framework for benchmarking laser-based gap and flush measurement techniques in real-world automotive scenarios.
Beyond this algorithmic comparison, the study also examines a modification of the G3F system in which a masking device is mounted to facilitate measurement by the operator. By contrasting the standard G3F sensor with the masked version, the research assesses not only algorithmic performance but also how hardware adaptations can influence measurement ease, precision, and reliability. This dual-level evaluation—algorithmic and hardware-assisted—provides a comprehensive framework for benchmarking laser-based gap and flush measurement techniques in real-world automotive scenarios.
Ultimately, the results of these analyses will provide a clear picture of both the measurement system’s performance and the operator’s influence on the process. By quantifying these effects and comparing algorithmic strategies, the study aims to advance the integration of intelligent measurement systems into human-centred manufacturing workflows, contributing to more resilient, adaptive, and user-friendly metrology solutions fully aligned with the principles of Industry 5.0.
The paper is organized as follows: section 2 describes a summary of related works to select which algorithm to choose for a deeper study; section 3 describes materials and methods; section 4 presents the results; section 5 presents limitations of the study and conclusion.
2. Related Works of Algorithms Selection
A review of the literature [17] reveals that stripe extraction algorithms for Laser Line Triangulation (LLT) system are generally categorized based on their approach to finding the center, balancing accuracy against computational cost. The most common and fundamental methods cited are centroid-based algorithms (like the Grey Centroid - GC) [18] and Hessian-based algorithms (like the Steger method) [19]. Many recent studies focus on developing new algorithms and AI that modify or combine these methods to achieve higher accuracy. However, these enhancements often introduce further mathematical operations, increasing the processing time, which is unsuitable for the embedded system targeted in this work. An additional intermediate algorithm in terms of computational cost can join with GC and Steger to perform the benchmark, the Finite Impulse Response (FIR) algorithm [20]. Details of each algorithm chosen is described in paragraph 3.5.
In recent years, machine learning (ML) and artificial intelligence (AI) have emerged as promising approaches to improve the accuracy and adaptability of LLT systems. Instead of relying purely on analytical models, AI-based methods can learn the mapping between image intensity distributions and stripe center positions directly from data. Neural network architectures, such as convolutional neural networks (CNNs), have been trained to detect laser stripe centers with sub-pixel accuracy even under challenging conditions like varying surface reflectivity, ambient illumination, or partial occlusion [21]. Other approaches exploit deep regression models and autoencoders to denoise and enhance stripe profiles prior to extraction, thereby reducing sensitivity to sensor noise and optical distortions. Recent studies further show that integrating a neural network segmentation stage to isolate the stripe region, followed by sub-pixel center extraction on the cleaned area, achieves higher accuracy and lower computational cost compared to full image Hessian methods [22]. This combination of semantic segmentation and geometric refinement enables robust operation under difficult optical conditions while concentrating computation on the relevant region and minimizing stray light artifacts.
While these AI-driven solutions can significantly improve robustness and accuracy, they often require substantial computational resources and large training datasets, making them less suitable for real-time embedded implementations. Nevertheless, they represent a growing research direction for adaptive and self-calibrating triangulation sensors that can outperform traditional model-based algorithms in uncontrolled environments.
3. Materials and Methods
3.1. Methodology
The methodology adopted in this study has been structured to provide a clear and systematic assessment of the portable LLT system under investigation. The section first describes the core technology related to LLT, then, the experimental measurement setup, including the G3F sensor and the different masking configurations developed to support and enhance the acquisition process. This is followed by the MSA framework, which defines the procedures used to quantify the uncertainty in the measurement of gap and flush, gauge repeatability, and reproducibility uncertainty across the various configurations tested [23].
Finally, the methodology outlines the gap and flush algorithms selected for evaluation, detailing their underlying principles and their role within the overall measurement workflow. This structure enables a comprehensive understanding of how hardware setup, measurement system performance, and algorithmic strategies jointly influence the reliability of gap and flush measurements in automotive applications. Within this framework, the flush value is equal to the distance between the straight line of a reference surface and the edge point on the other side; in practice, both the reference line and the edge point are geometric features that must be detected. The gap value is evaluated as the distance between the circles of surfaces; these circles are likewise geometric features extracted from the measurement data. Figure 1 shows two adjoining components (solid lines) together with these geometric definitions of gap and flush [24].
3.2. Core Technology: Laser Stripe Detection and Center Estimation
The core task of an LLT sensor is to accurately determine the center of the laser stripe in each column of the image, as this information forms the basis for the subsequent reconstruction of the observed object’s profile. The laser beam profile can typically be approximated by a Gaussian distribution; therefore, along each image column , the intensity of the laser line in the image can be represented as , where denotes the pixel position within the column. After applying an appropriate intensity threshold, only pixels whose values exceed this threshold are retained as part of the laser stripe, Figure 2 as in (1). These selected pixels define the region of interest on which sub-pixel localization algorithms are applied to compute the stripe center.
In this context, it is essential to determine which laser stripe extraction algorithm is most suitable for real-time processing on an embedded system. The analysis will focus on several well-known algorithms, evaluating their performance in terms of precision and processing time when executed on a low-power CPU. The objective is to quantify the trade-off between measurement uncertainty and computational cost for a general-purpose LLT sensor controlled by a System-on-Module (SoM) platform.
Additionally, the study aims to assess how ergonomic modifications of the sensor influence its overall performance, and how these effects compare to the performance variations introduced by different center detection algorithms.
3.3. Measurement Setup
In this work the G3F sensor from U-Sense.it srl is used (Figure 3 (a)), which is a manual, wireless, portable laser profilometer. To obtain the LLT Field of View (FOV), the components shown in Figure 4 are required:
- a laser source (blue in the figure) that project a thin, straight light plane;
- a camera, composed of a CMOS sensor combined with a lens system (represented as the yellow pyramid frustum).
An angle is formed between the optical axis of the camera and that of the laser. The interception of the camera’s FOV with the laser plane defines the sensor’s trapezoidal measurement area [25]. In Table 1 is described G3F FOV, starting by trapezoidal minor base (Z= 0 mm) to the major (Z = 12 mm).
The G3F sensor interacts with the contact surface through a soft front panel positioned in front of the optical assembly (the design of the soft panel is shown on the left in Figure 3 (b) and (c)). The repeatability of the contact point has the greatest influence on the overall measurement uncertainty, as previously investigated in [16]. In this paper, an improvement in performance achieved through a more ergonomic design and cost-effective is presented. In this revised design, alignment teeth for both the gap and the flush have been added to the front panel, as shown at the right side in Figure 3 (a) and in (c). This modification represents a low-cost design enhancement that improves positioning repeatability and user handling.
3.4. Measurement System Analysis
This paper presents a benchmark to compare three different laser stripe extraction algorithms. The evaluation is based on two fundamental and equally important metrics: measurement uncertainty and processing time.
The processing time evaluation is a critical parameter, as the target G3F system is embedded and runs on a low-power SOM processing unit (based on the i.MX 8M family) designed for flexibility and low power consumption.
To robustly quantify the measurement uncertainty, a Gauge Repeatability and Reproducibility (GRR) study was conducted, in accordance with standard MSA procedures, emulating a standard industrial process. This study, evaluated using the range method [23], breaks down the total variation of the measurement system into two primary components:
- Repeatability uncertainty based on Equipment Variation (EV): the variation observed when a single operator measures the same part multiple times; this uncertainty is influenced by the uncertainty of the sensor and uncertainty of the measurement method.
- Reproducibility uncertainty based on Appraiser Variation (AV): the variation that arises when different operators measure the same part; this uncertainty indicates how much can be useful to train operators to obtain the same measurement method.
To perform this benchmark in a controlled manner, a single set of images was used. Images were acquired from 14 different points on the same car, seven for each side as shown in Figure 5 by 4 different operators. Each operator acquired the same point 3 times in a random order. This set was acquired under two distinct working conditions ("with" and "without alignment teeth"). Using the same image set ensures that all three algorithms are tested against the exact same input data, allowing for a direct comparison of their GRR performance and processing speed.
3.5. Algorithms
The measurement obtained by LLT is based on image acquisition. This context makes it possible to leverage standard Computer Vision pre-processing strategies to improve the robustness and accuracy of the data, primarily by reducing noise.
However, the industrial environment introduces numerous challenges that complicate the reliable extraction of the laser stripe center. The primary challenges include:
- image noise: requiring de-noising strategies (e.g. Gaussian, mean or median filtering [17];
- surface irregularities: such as specular reflections or abrupt changes in color or material;
- laser stripe variations: where surface irregularities cause fluctuations in the stripe’s thickness and intensity, producing heterogeneous regions in the image.
There are three main processing stages that influence the final measurement value. The first stage, image pre-processing, addresses noise and background identification [17]. The output of this stage is a denoised and properly cropped image, optimized for subsequent analysis. The second stage performs the laser stripe extraction. After applying the calibration functions, this stage produces one or more profiles representing the reconstructed geometry. To extract the laser stripe centerline with high precision, we employ the GC, Steger, and FIR algorithms. Finally, the third stage consists of feature extraction from the obtained profiles. In this phase, the relevant geometric features are computed to produce the final measurement output.
3.5.1. Image Pre-Processing
After analyzing the noise present in the images acquired by the sensor, it is observed that the noise is predominantly impulsive rather than Gaussian. This is evident in Figure 6, where high-intensity white dots appear in proximity to darker dots. This type of noise, known as salt-and-pepper noise, is characterized by frequent dark spots in bright areas and bright spots in dark areas across the image. Given these characteristics, the median filter emerges as the most suitable choice, as confirmed in the literature [26,27]; in this work, a median filter with a 5×5 kernel is adopted and the resulting improvements in the uniformity of the laser stripe are illustrated on the right in Figure 7.
To increase the speed of laser stripe extraction and improve detection, the Otsu thresholding method is applied to set to zero all points outside the ROI [22]. The positions of the first and last pixels with intensity in each column are located by scanning the image from top to bottom, and the corresponding row indices are recorded as and .
To enhance the stability of subsequent stripe center extraction, the ROI is obtained considering only row indexes where pixels intensities are non-zero and is then expanded by 10 pixels both upward and downward. Therefore, the upper and lower boundaries of the ROI is defined as ( – 10) and ( + 10), respectively.
3.5.2. Stripe Extraction Algorithms: GC, Steger and FIR
GC algorithm finds for each column j the , that is the i row in the j column where the laser stripe is founded, following the equation for each consecutive pixel with intensity that exceeds the threshold, as shown in Figure 8 and following the formula (2) with sub-pixel accuracy
Steger method has the necessity to know the input parameter , which is related to the stripe width and is used in the Gaussian filtering step. The algorithm then computes the Hessian matrix of the image and calculates its eigenvalues to identify the stripe profile with subpixel accuracy using the Taylor expansion along the normal direction, as described by Steger [19] and Zaho et. al. [28].
The Finite Impulse Response (FIR) algorithm is selected as an intermediate solution between GC and Steger, as it relies on a per-column convolution that is more computationally demanding than the grey-centroid method but less complex than Steger. An important advantage of the FIR approach is that it applies a low-pass filter during the computation of the derivative along each column . It is possible to demonstrate that, considering a vector and a filtered vector obtained with the convolution between the filter and the original vector (3) is equal to the vector convolved with the derived filter as shown in (4), that means that the derivate must be calculated only once by the program after the filter definition [20]. Than it is possible to calculate the i row with subpixel precision finding the zero crossing as shown in Figure 9 following the eq. (5) where is the last positive point of before the zero crossing and is the first negative point.
The filter is designed following the steps shown in Figure 10. Since the images are affected by impulsive noise, a Hamming window Figure 10 (a) is chosen as the smoothing component. The derivate kernel Figure 10 (b) is designed with a relatively large support to further mitigate the influence of local noise. The designed kernel to reduce noise and find the zero crossing is represented in Figure 10 (c).
After finding points, the laser stripe is obtained linking each point with a scanning procedure: starting by left, the point is joined to another if the distance between them is behind a threshold. Then the calibration is applied to obtain the real-world coordinates .
3.5.3. Features Extraction
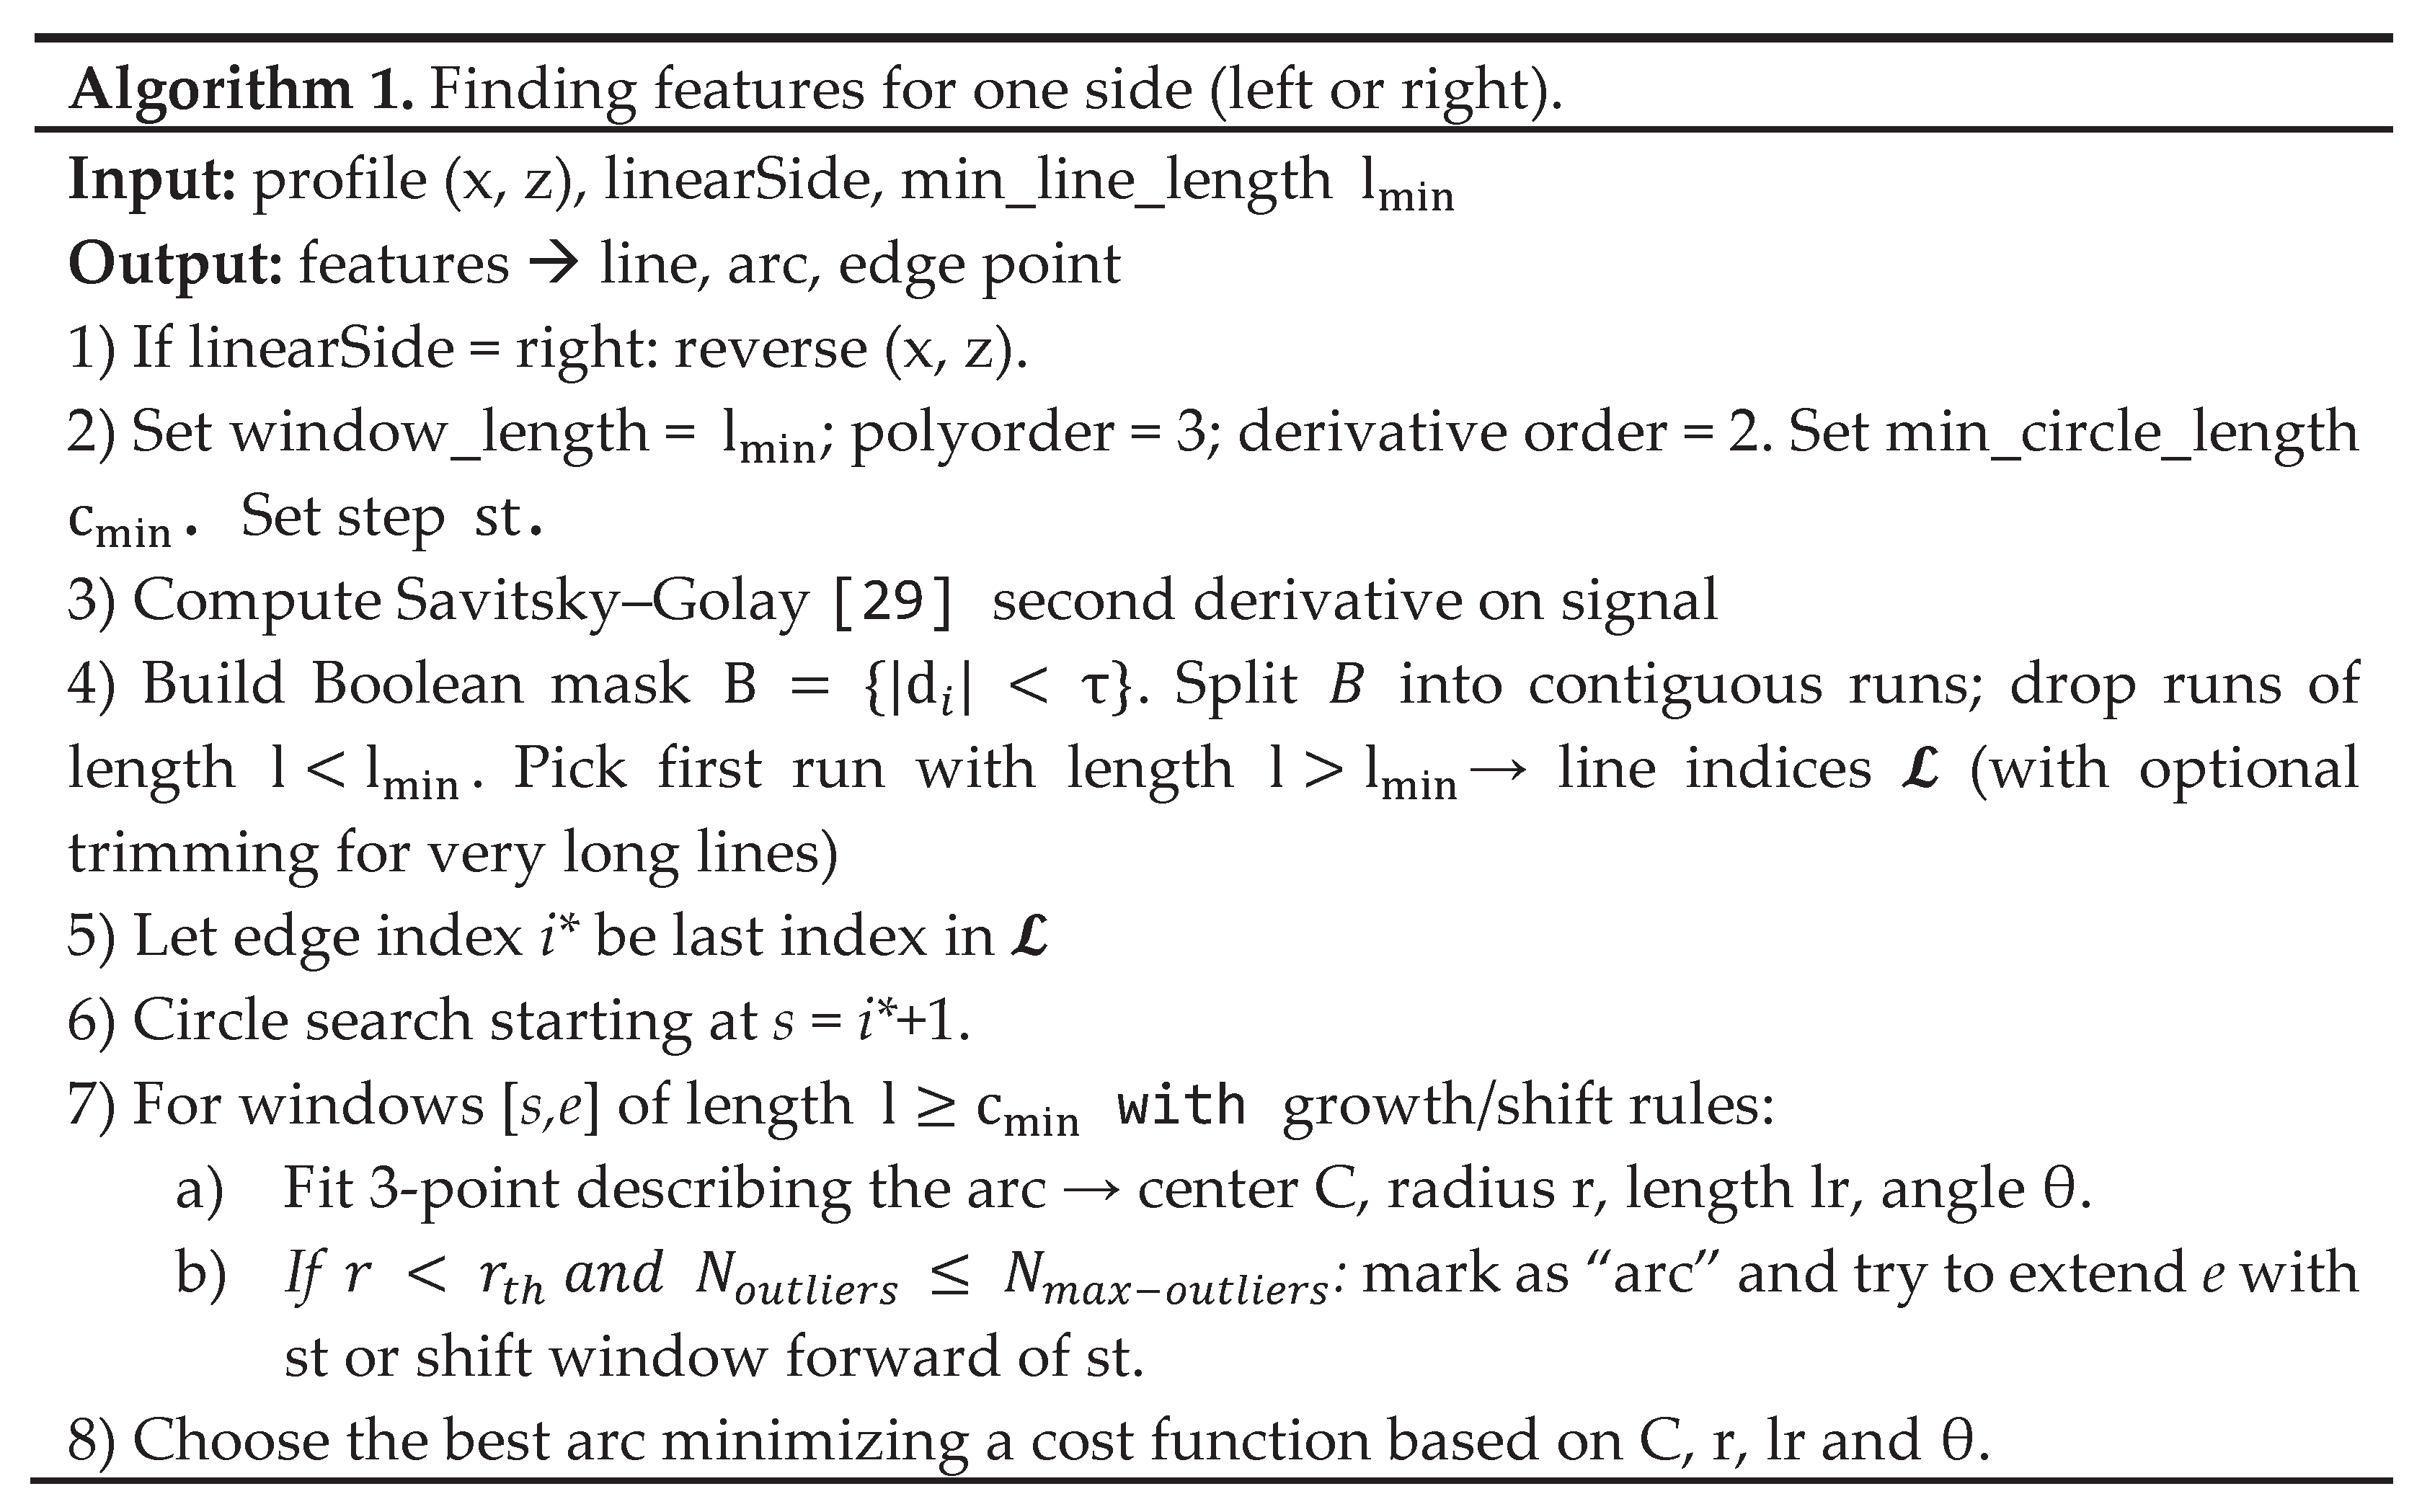
In this paragraph, a features extraction code is provided with the aim to evaluate gap and flush using the definition provided in paragraph 3.1 .First the second grade derivate is calculated for both letf and right profile. The hypothesis is that each profile is composed by at least one line and an arc of circle. Lines and circles are evaluated for each profile according to the following pseudocode (Algorithm 1). Then a reference surface is chosen to evaluate gap and flush as in Figure 1.
4. Results
To evaluate the performance and robustness of the proposed gap and flush algorithms, a comprehensive MSA was carried out under different operating conditions. This chapter presents the outcomes of that assessment, comparing AV, EV, GRR and processing time for the three algorithms considered. The analysis is performed both with and without the masking device mounted on the G3F system, allowing us to isolate the effects of hardware assistance and operator interaction on the measurement process. The results reported in the following figures provide a clear overview of how each algorithm behaves in practical use and highlight the conditions under which performance degradation may occur.
In Figure 11 is shown the difference in performance, AV, EV, GRR and processing time, between GC, FIR and Steger algorithms while the prototyped front panel is used when measuring gap and flush. In Figure 12 is shown the same benchmark when the front panel is not mounted; here it is possible to see a net decrease of performance for FIR and Steger algorithms in gap analysis and for all the algorithms for flush analysis.
The algorithm to choose in this case is GC, which has significantly lower processing times than its rivals, Steger and FIR, and is more robust to sudden changes in operating conditions. The results shown also have other, more general practical consequences: the measurement system without alignment teeth has an internal uncertainty high enough to absorb the uncertainty caused by operator changes.
5. Conclusions and Limitations
This study set out to evaluate how algorithmic strategies and mechanical support features jointly affect the performance of a portable LLT system for gap and flush assessment in automotive applications. Through a dedicated MSA procedure, the work investigated whether more advanced extraction algorithms effectively enhance measurement reliability when the system is operated manually, and how mechanical alignment aids contribute to overall robustness. The following conclusions synthesize the main findings and outline the implications for the development of portable, operator-friendly metrology solutions.
The results show that the performance of the LLT measurement system is influenced not only by the choice of the extraction algorithm but also—often more significantly—by the mechanical conditions under which the measurement is performed. Although FIR and Steger algorithms incorporate more sophisticated processing techniques, their advantages decrease sharply when operator variability or suboptimal alignment conditions are present. The GC algorithm proved to be the most effective in this context: it consistently achieved lower processing times and maintained stable performance even when measurement conditions degraded.
The comparison between measurements taken with and without the alignment teeth on the front panel further highlights the dominant role of mechanical guidance. The absence of alignment features led to a marked increase in uncertainty—exceeding 30% for flush measurements—overshadowing the differences between algorithms. This finding demonstrates that, in portable metrology applications, mechanical support and ergonomic aids can have a stronger impact on repeatability and reproducibility than algorithmic complexity.
Future developments should therefore focus on improving both calibration and feature extraction. A promising direction is the integration of calibration procedures directly into the extraction stage, in a way that is coherent with the specific algorithm employed. Additionally, exploring mechanical modifications or user-assistance fixtures could further reduce operator influence and enhance the robustness of portable LLT systems.
Overall, this study demonstrates that achieving reliable, operator-assisted gap and flush measurements requires a balanced co-design of algorithms, calibration strategies, and mechanical support. Such an integrated approach aligns closely with the principles of Industry 5.0, where human-centered measurement systems must combine accuracy, repeatability, and usability to effectively support flexible and digitalized manufacturing environments.
Author Contributions
conceptualization G.G.P, S.C.; investigation and methodology G.G.P, S.C, M.N.; software G.G.P.; resources C.C., M.N., N.P; writing—review and editing G.G.P, C.C., S.C.; supervision S.C., N.P. All authors have read and agreed to the published version of the manuscript.
Funding
This research received no external funding.
Data Availability Statement
Data is unavailable due to privacy restriction.
Acknowledgments
This work was partially supported by PR Marche Fondo Sociale Europeo Plus 2021/2027 and by the European project OPENZDM (Grant Agreement No. 101058673, call HORIZON-CL4-2021-TWINTRANSITION-01).
Conflicts of Interest
The authors declare no conflicts of interest.
References
- Bucci, I.; Fani, V.; Bandinelli, R. Towards Human-Centric Manufacturing: Exploring the Role of Human Digital Twins in Industry 5.0. Sustainability 2025, 17, 129. [Google Scholar] [CrossRef]
- Nahavandi, S. Industry 5.0—A Human-Centric Solution. Sustainability 2019, 11, 4371. [Google Scholar] [CrossRef]
- Buri, Z.; Kiss, T.J. Digitalisation in the Context of Industry 4.0 and Industry 5.0: A Bibliometric Literature Review and Visualisation. Applied System Innovation 2025, 8, 137. [Google Scholar] [CrossRef]
- Stavropoulos, P. Digitization of Manufacturing Processes: From Sensing to Twining. Technologies 2022, 10, 98. [Google Scholar] [CrossRef]
- Moona, G.; Singh, A.; Kumar, V.; Sharma, R.; Kumar, H. Dimensional Metrology: Underpinning the Automotive Sector in an Indelible Fashion. MAPAN 2024, 39, 931–941. [Google Scholar] [CrossRef]
- D’Emilia, G.; Gaspari, A.; Natale, E. Accuracy Improvement of Measurement Management Systems: Requirements for Reliability of Data and Practical Examples. In Proceedings of the 2020 IEEE International Instrumentation and Measurement Technology Conference (I2MTC), May 2020; pp. 1–6. [Google Scholar]
- Wang, H.; Li, M.; Wei, Q. Virtual Matching Measurement of Gap and Flush. In Proceedings of the 2021 14th International Symposium on Computational Intelligence and Design (ISCID), December 2021; pp. 192–197. [Google Scholar]
- Tran, T.-T.; Ha, C. Non-Contact Gap and Flush Measurement Using Monocular Structured Multi-Line Light Vision for Vehicle Assembly. Int. J. Control Autom. Syst. 2018, 16, 2432–2445. [Google Scholar] [CrossRef]
- Minnetti, E.; Chiariotti, P.; Castellini, P.; Violini, L.; Garcia, G.; Vicente, H.; Paone, N. Smart Portable Laser Triangulation System for Assessing Gap and Flush in Car Body Assembly Line. In Proceedings of the 2019 II Workshop on Metrology for Industry 4.0 and IoT (MetroInd4.0&IoT), June 2019; pp. 49–53. [Google Scholar]
- Minnetti, E.; Chiariotti, P.; Paone, N.; Garcia, G.; Vicente, H.; Violini, L.; Castellini, P. A Smartphone Integrated Hand-Held Gap and Flush Measurement System for in Line Quality Control of Car Body Assembly. Sensors 2020, 20, 3300. [Google Scholar] [CrossRef] [PubMed]
- Pham, L.H.; Tran, D.N.-N.; Rhie, C.H.; Jeon, J.W. A Mobile Vision-Based System for Gap and Flush Measuring between Planar Surfaces Using ArUco Markers. In Proceedings of the 2021 International Conference on Electronics, Information, and Communication (ICEIC), January 2021; pp. 1–4. [Google Scholar]
- Kholkhujaev, J.; Maculotti, G.; Genta, G.; Galetto, M.; Inoyatkhodjaev, J. Non-Contact Articulated Robot-Integrated Gap and Flushness Measurement System for Automobile Assembly. IEEE Access 2022, 10, 86528–86541. [Google Scholar] [CrossRef]
- Schröder, T.; Schwieger, V. Automated Gap and Flush Measurements between Car Parts Assisted by a Highly Flexible and Accurate Robot System: Fully Automated Gap Measurement in Agile Car Production. Journal of Applied Geodesy 2025, 19, 653–664. [Google Scholar] [CrossRef]
- Pham, L.H.; Tran, D.N.-N.; Byun, J.Y.; Rhie, C.H.; Jeon, J.W. A Smartphone-Based Laser Measuring System for Gap and Flush Assessment in Car Body. IEEE Transactions on Industrial Electronics 2021, 68, 6297–6307. [Google Scholar] [CrossRef]
- D’Emilia, G.; Gaspari, A.; Iavicoli, C.; Natale, E. Measurement Uncertainty Estimation of Gap and Profile in the Automotive Sector. J. Phys.: Conf. Ser. 2020, 1589, 012017. [Google Scholar] [CrossRef]
- Paolini, G.G.; Nisi, M.; Casaccia, S.; Amicucci, F.; Cristalli, C.; Paone, N. Repeatability and Reproducibility Method of Hand-Handle Laser Triangulation Profilometer. In Proceedings of the 2025 IEEE International Workshop on Metrology for Industry 4.0 & IoT (MetroInd4.0 & IoT), July 2025; pp. 40–44. [Google Scholar]
- Xu, X.; Fei, Z.; Yang, J.; Tan, Z.; Luo, M. Line Structured Light Calibration Method and Centerline Extraction: A Review. Results in Physics 2020, 19, 103637. [Google Scholar] [CrossRef]
- Soucy, M.; Laurendeau, D.; Poussart, D.; Auclair, F. Behaviour of the Center of Gravity of a Reflected Gaussian Laser Spot near a Surface Reflectance Discontinuity. Industrial Metrology 1990, 1, 261–274. [Google Scholar] [CrossRef]
- Steger, C. An Unbiased Detector of Curvilinear Structures. IEEE Transactions on Pattern Analysis and Machine Intelligence 1998, 20, 113–125. [Google Scholar] [CrossRef]
- Forest, J.; Salvi, J.; Cabruja, E.; Pous, C. Laser Stripe Peak Detector for 3D Scanners. A FIR Filter Approach. Proceedings of the Proceedings of the 17th International Conference on Pattern Recognition, 2004. ICPR 2004 2004, Vol. 3, 646–649 Vol.3. [Google Scholar]
- Chen, X.; Fang, C.; Hu, A.; Ren, Y.; Zhang, M.; Cui, T. A Novel Reflective Interference Mitigation Model for Laser Stripe Extraction. Measurement 2024, 237, 115187. [Google Scholar] [CrossRef]
- Bo, Q.; Hou, B.; Miao, Z.; Liu, H.; Lu, X.; Wang, Y. Laser Stripe Center Extraction Method Base on Hessian Matrix Improved by Stripe Width Precise Calculation. Optics and Lasers in Engineering 2024, 172, 107896. [Google Scholar] [CrossRef]
- Cepova, L.; Kovacikova, A.; Cep, R.; Klaput, P.; Mizera, O. Measurement System Analyses – Gauge Repeatability and Reproducibility Methods. Measurement Science Review 2018, 18, 20–27. [Google Scholar] [CrossRef]
- Minnetti, E.; Chiariotti, P.; Castellini, P.; Violini, L.; Garcia, G.; Vicente, H.; Paone, N. Smart Portable Laser Triangulation System for Assessing Gap and Flush in Car Body Assembly Line. In Proceedings of the 2019 II Workshop on Metrology for Industry 4.0 and IoT (MetroInd4.0&IoT), June 2019; pp. 49–53. [Google Scholar]
- Computer Graphics: Principles and Practice; Third edition; Addison-Wesley: Upper Saddle River (NJ), 2014; ISBN 978-0-321-39952-6.
- Gonzalez, R.C.; Woods, R.E. Digital Image Processing; Fourth, global edition; Pearson Education: New York, New York, 2018; ISBN 978-1-292-22304-9. [Google Scholar]
- What Is Image Filtering in the Spatial Domain? - MATLAB & Simulink. Available online: https://it.mathworks.com/help/images/what-is-image-filtering-in-the-spatial-domain.html (accessed on 5 October 2025).
- Zhao, H.; Liu, X.; Wang, S.; Diao, K.; Luo, C. An Enhanced Centerline Extraction Algorithm for Complex Stripes in Linear Laser Scanning Measurement. Precision Engineering 2024, 91, 199–211. [Google Scholar] [CrossRef]
- Savitzky, Abraham.; Golay, M.J.E. Smoothing and Differentiation of Data by Simplified Least Squares Procedures. Anal. Chem. 1964, 36, 1627–1639. [Google Scholar] [CrossRef]
- Evaluation of Measurement Data — Guide to the Expression of Uncertainty in Measurement 2008.
Figure 1.
Gap and flush definitions.
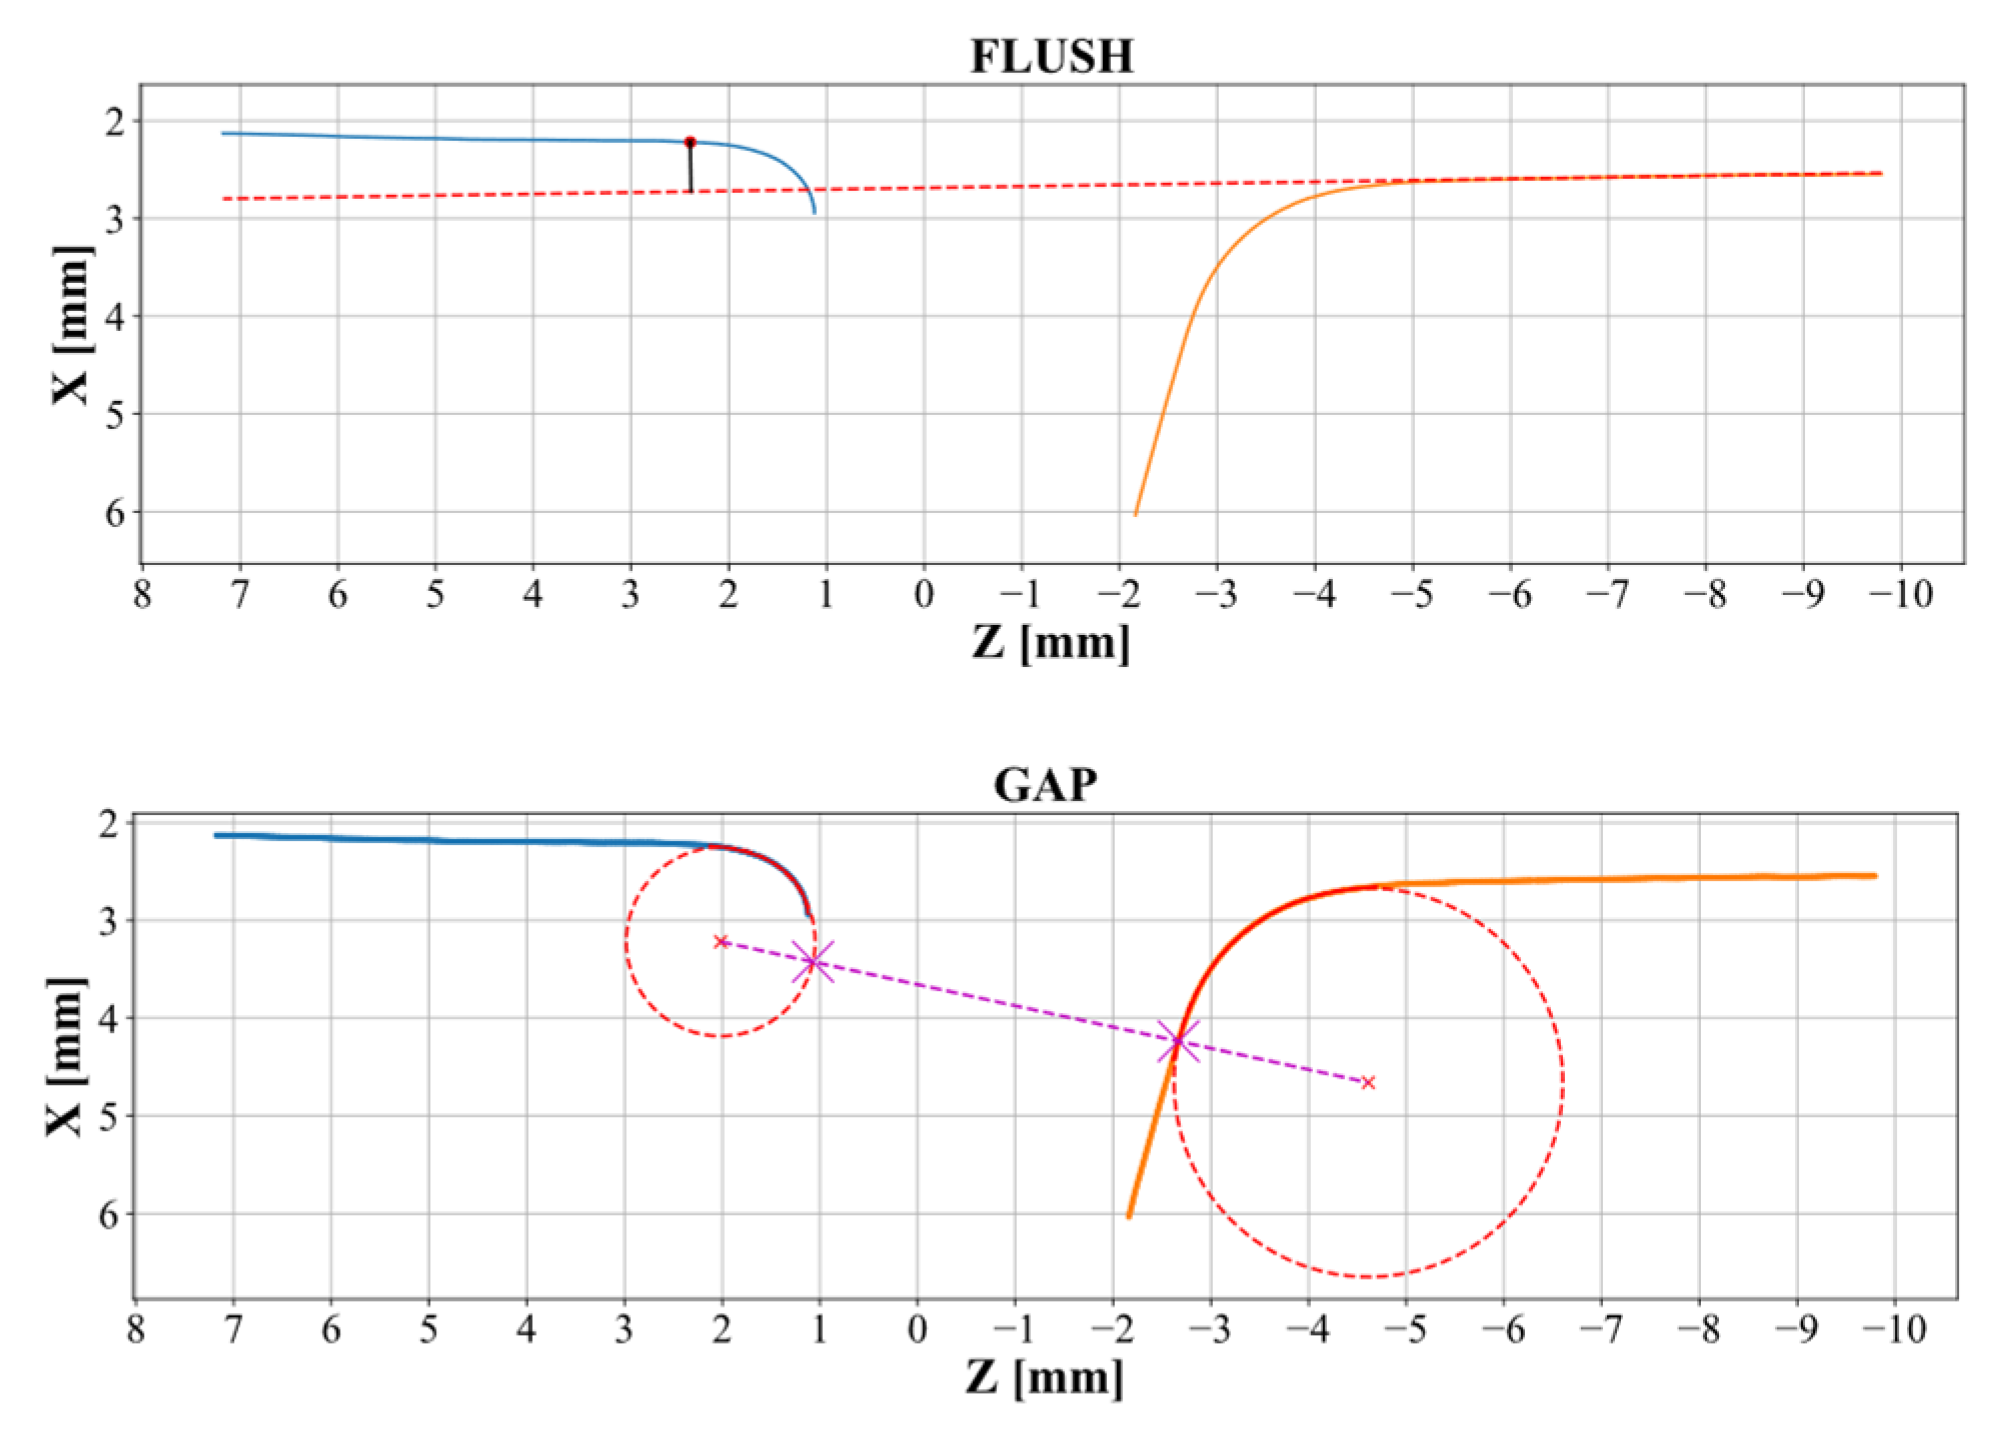
Figure 2.
Gaussian profile with a threshold that determinize where the laser stripe starts.
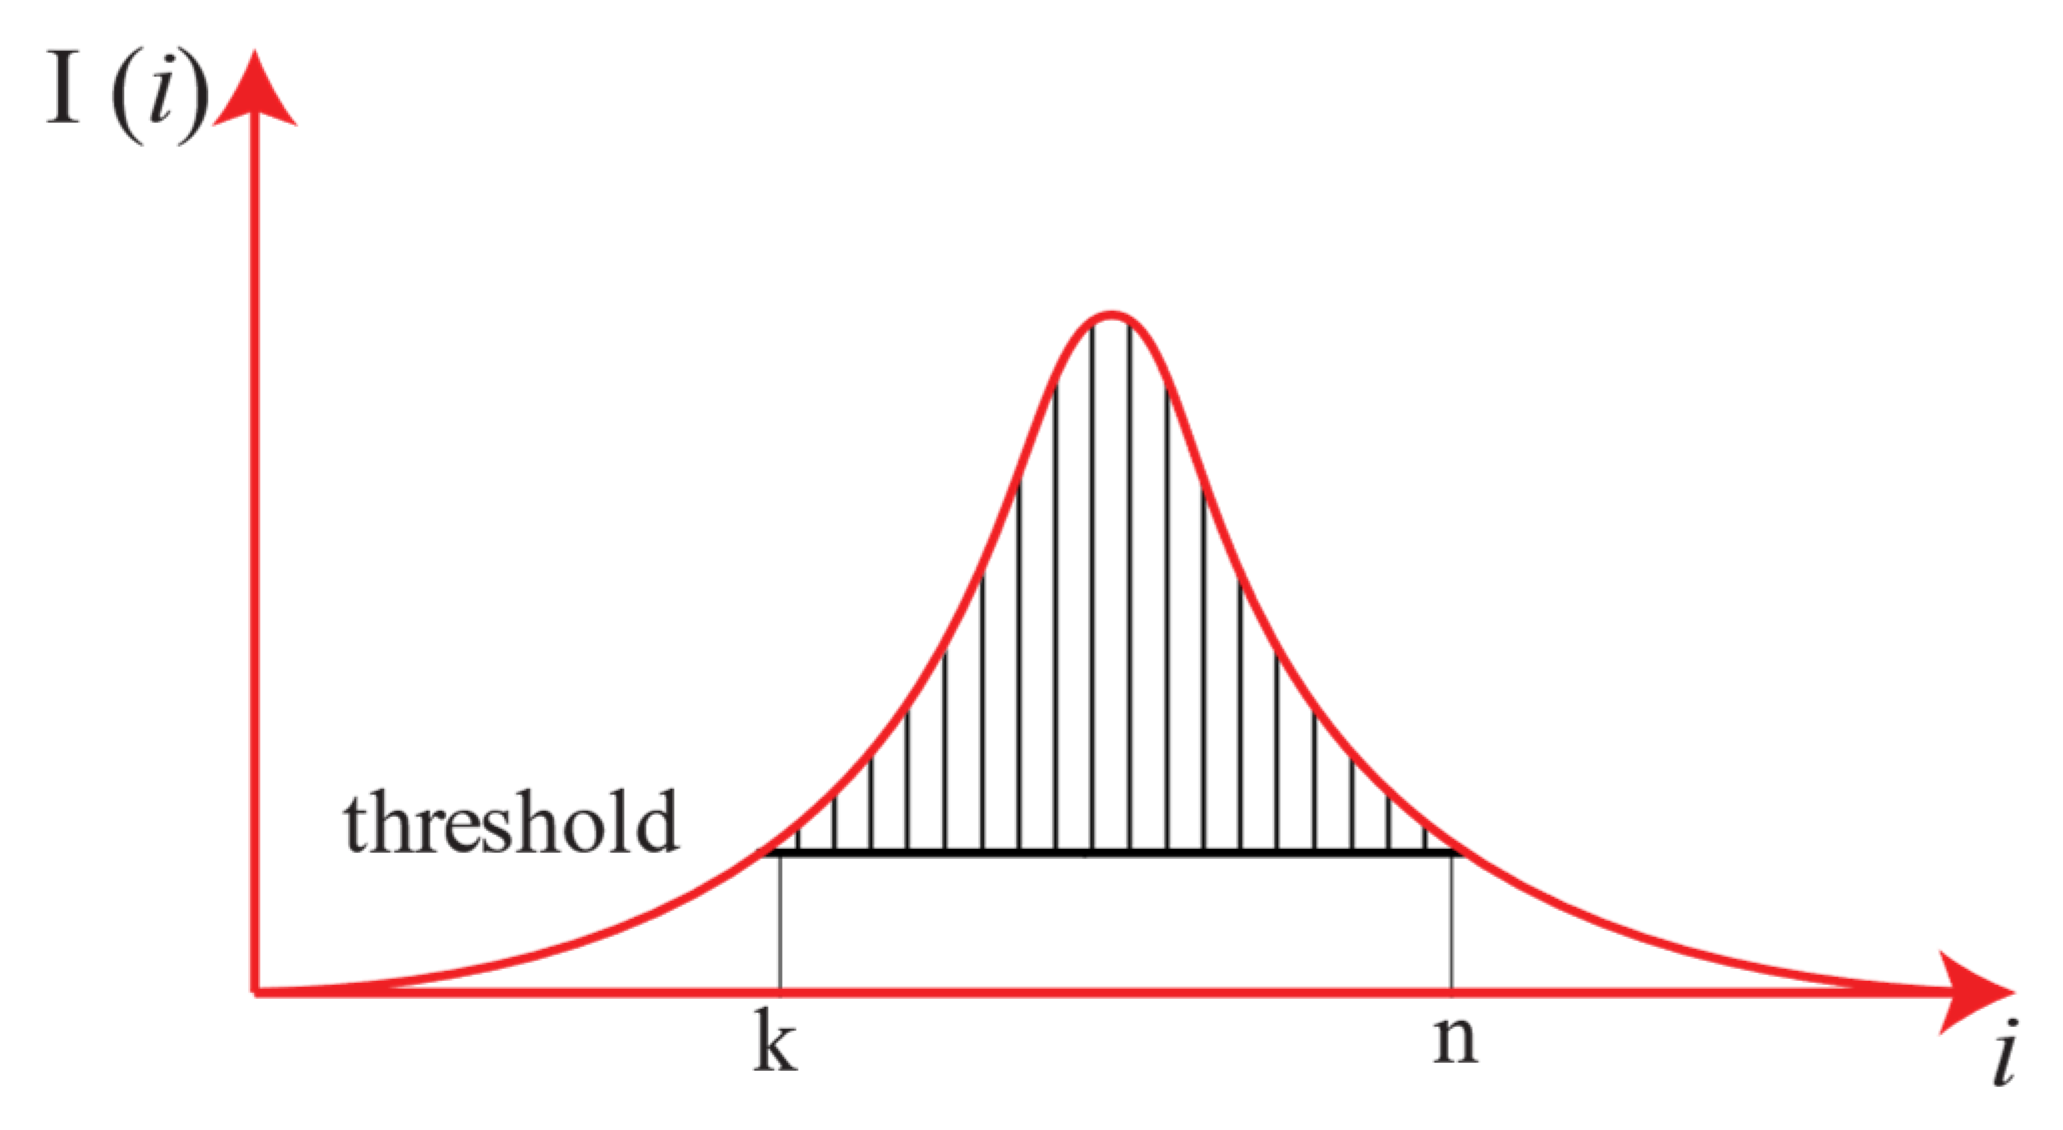
Figure 3.
a) G3F sensor; b) Standard soft sensor front panel (left) and prototype panel with alignment teeth (right); c) real front panels.
Figure 3.
a) G3F sensor; b) Standard soft sensor front panel (left) and prototype panel with alignment teeth (right); c) real front panels.
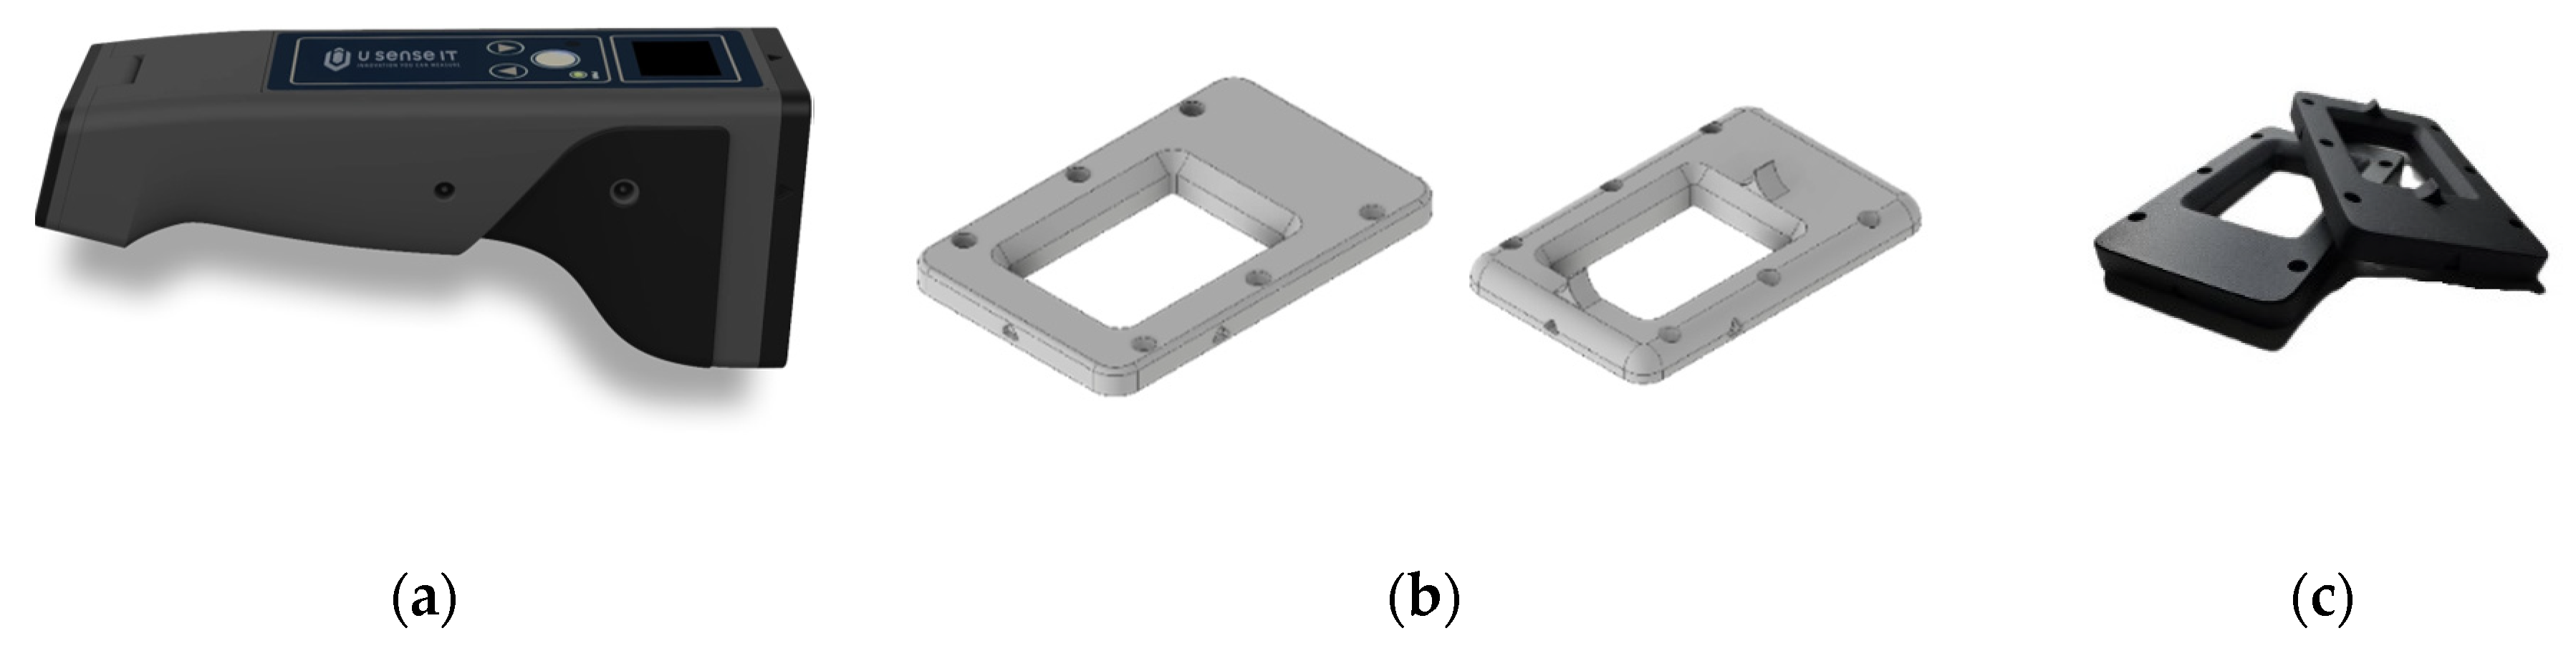
Figure 4.
LLT FOV definition (grey) as the interception of camera pyramid frustum FOV (yellow) and laser plane (bright blue).
Figure 4.
LLT FOV definition (grey) as the interception of camera pyramid frustum FOV (yellow) and laser plane (bright blue).
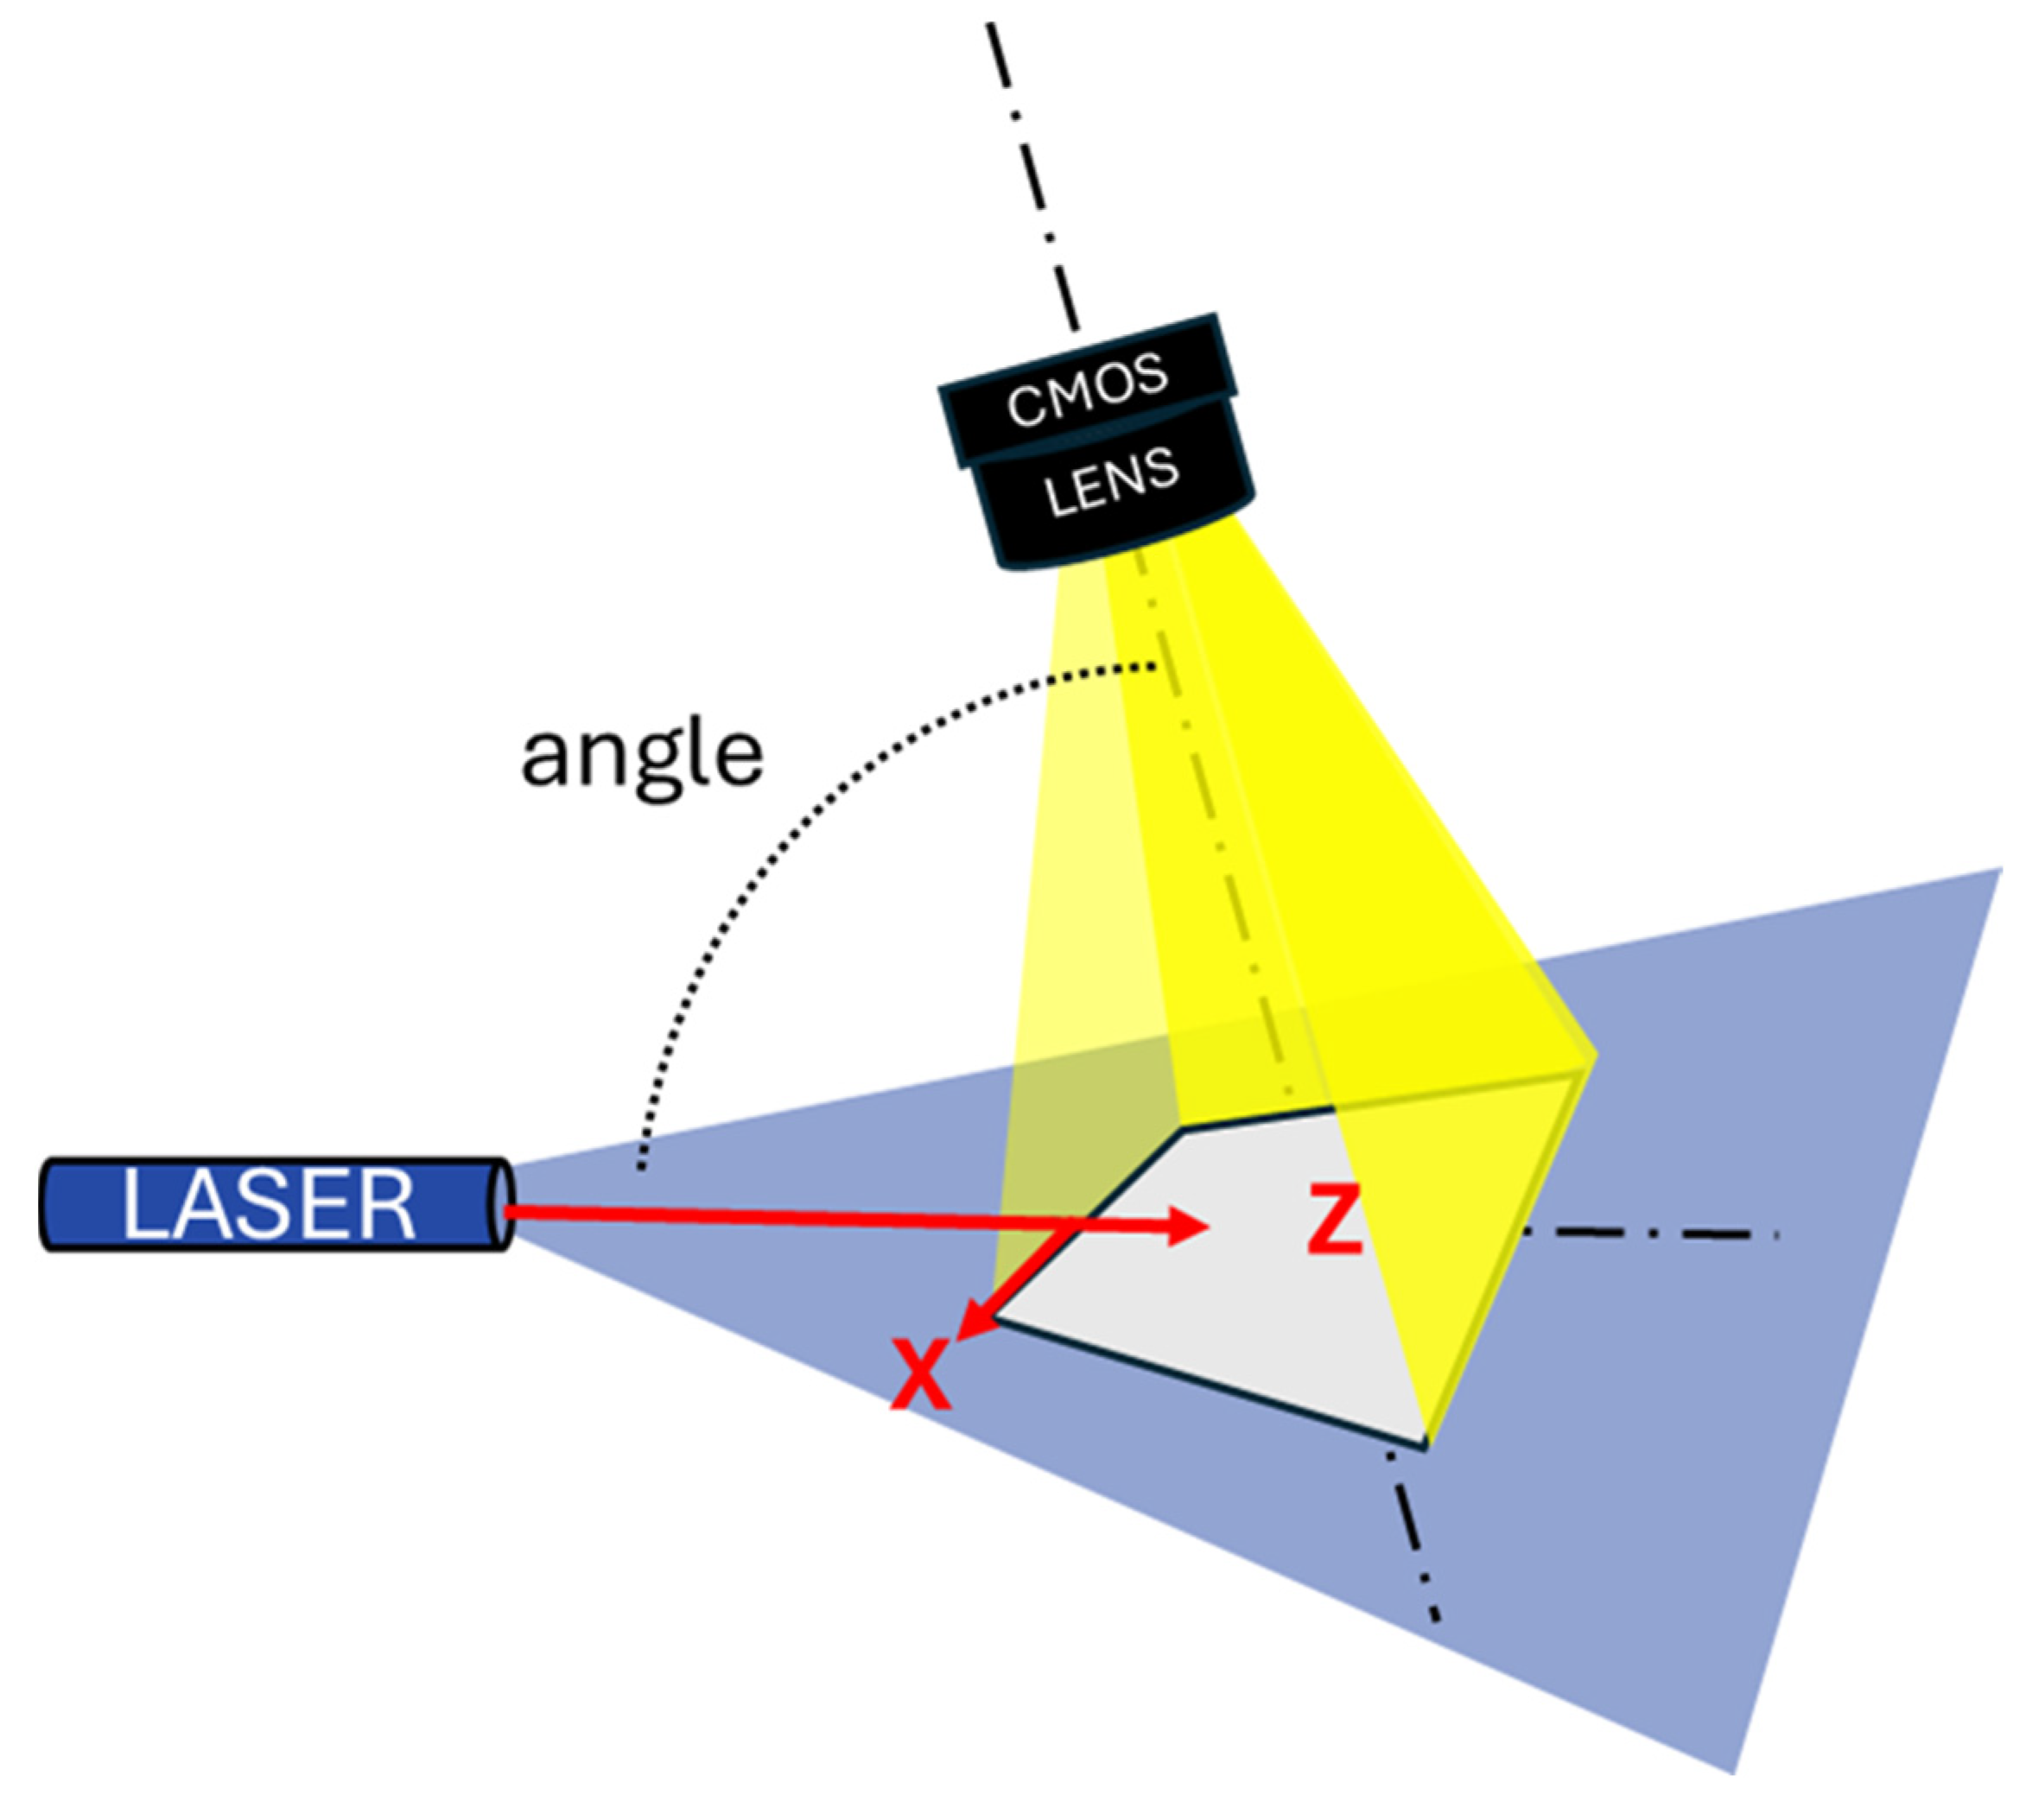
Figure 5.
Measurement sequence in green performed on the car's left side.
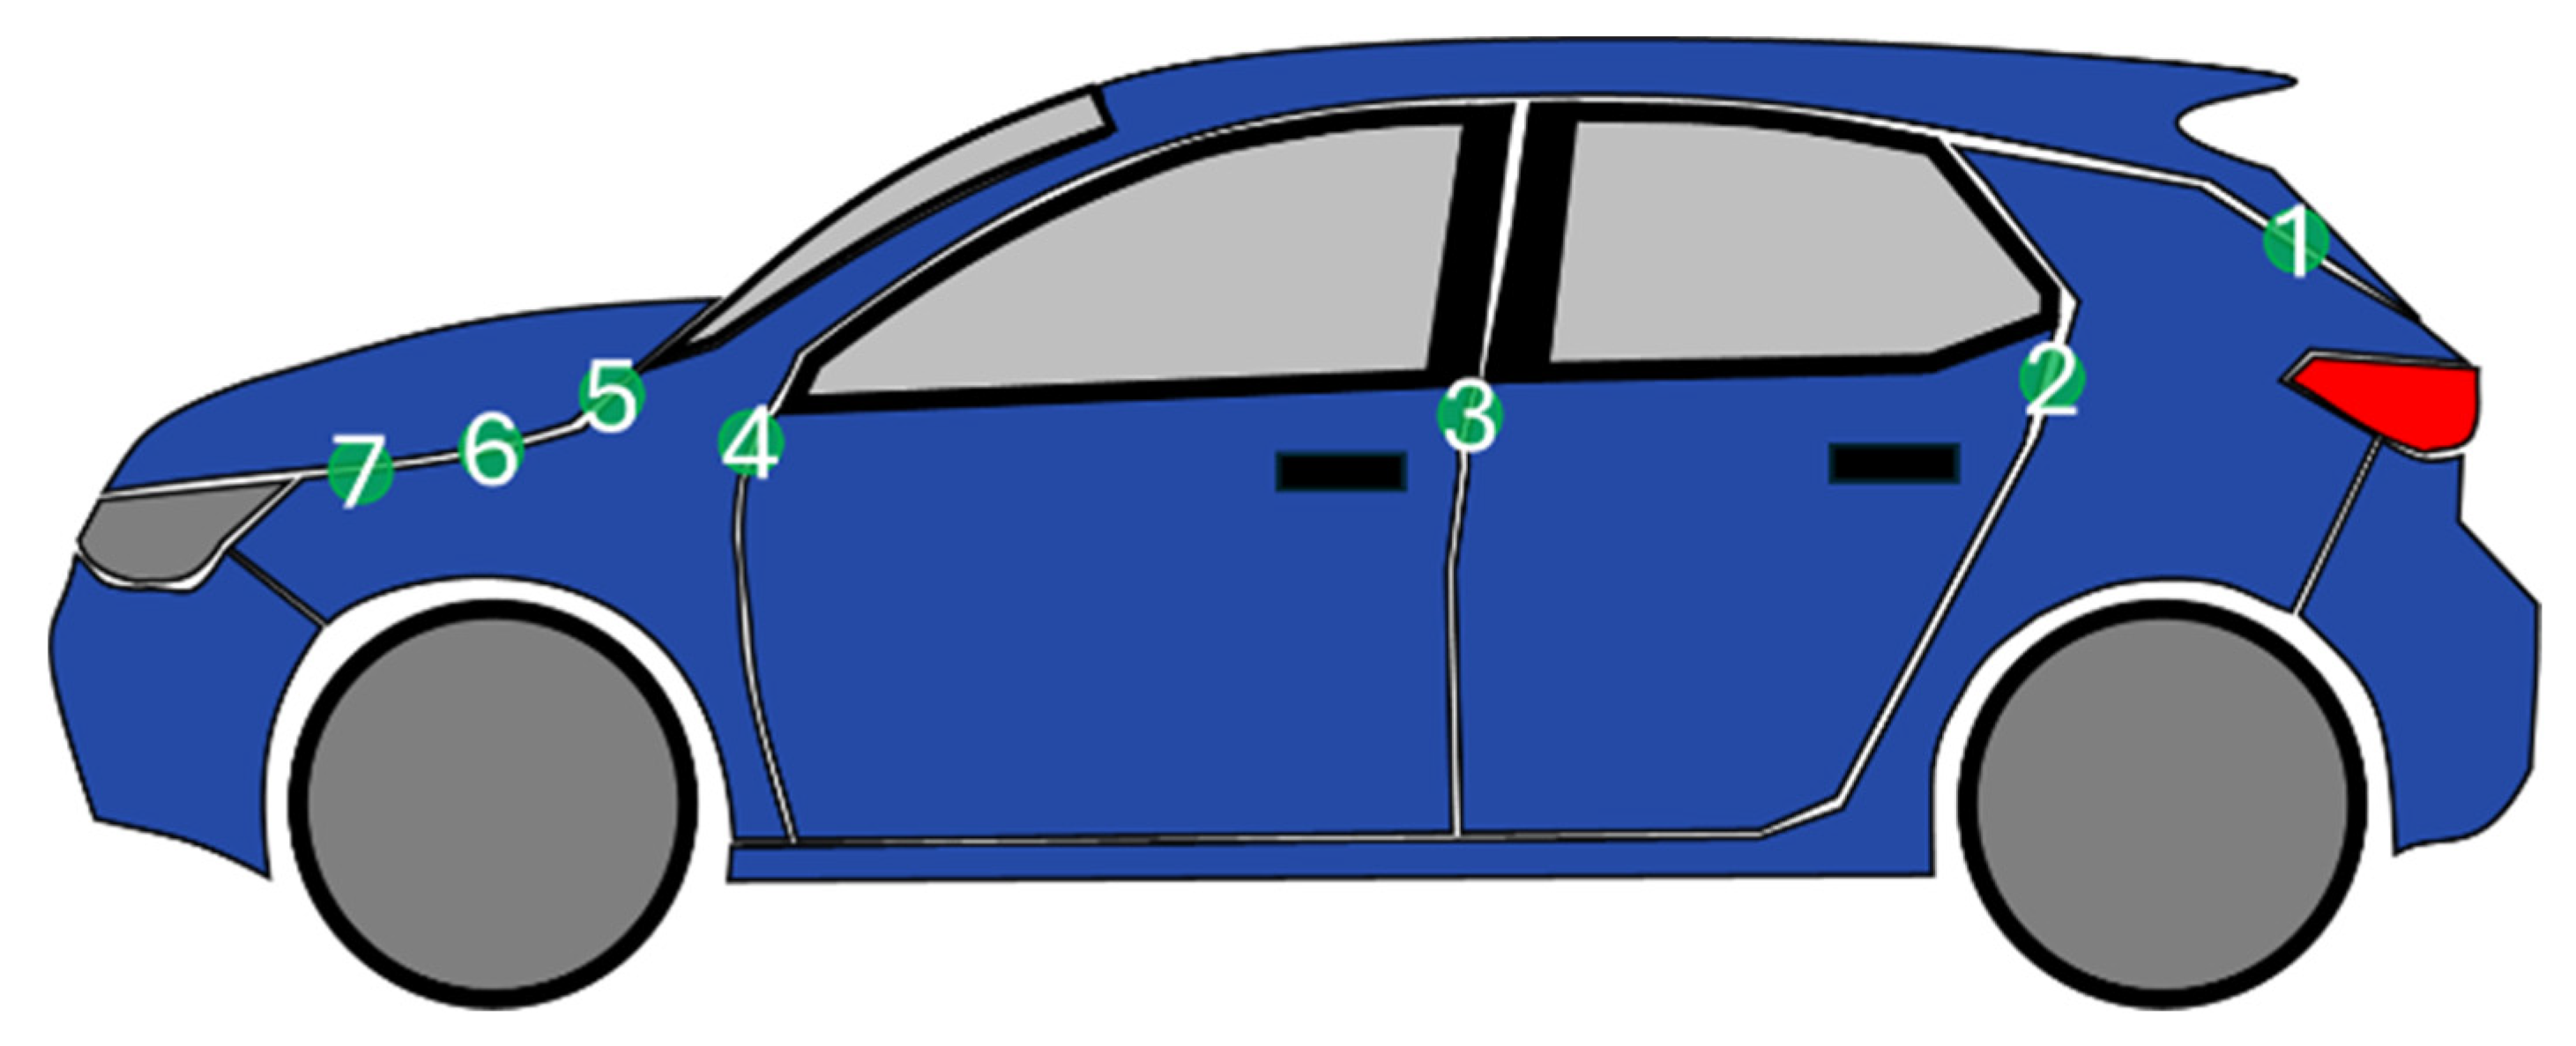
Figure 6.
Two different images acquired by the sensor zoomed on the laser stripe. It is possible to see bright points immersed in the laser stripe next to dark points showing impulsive noise.
Figure 6.
Two different images acquired by the sensor zoomed on the laser stripe. It is possible to see bright points immersed in the laser stripe next to dark points showing impulsive noise.
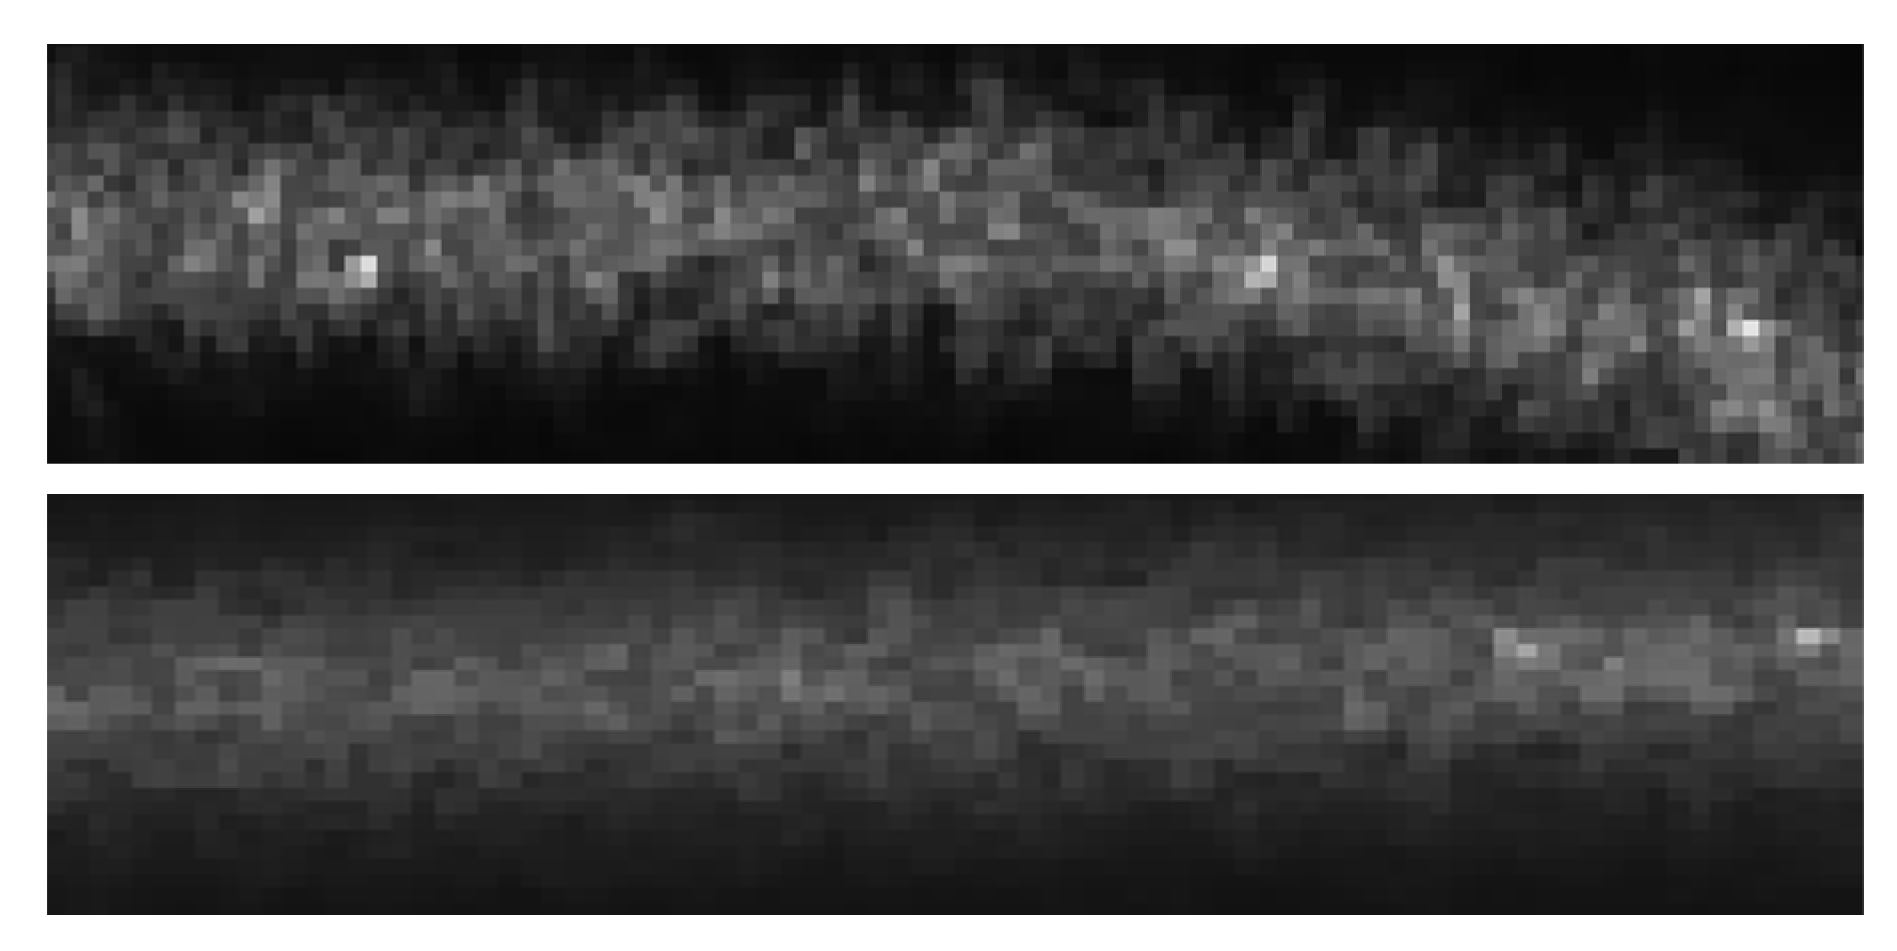
Figure 7.
On the left there is a portion of image, on the right the same portion after using the median filter.
Figure 7.
On the left there is a portion of image, on the right the same portion after using the median filter.
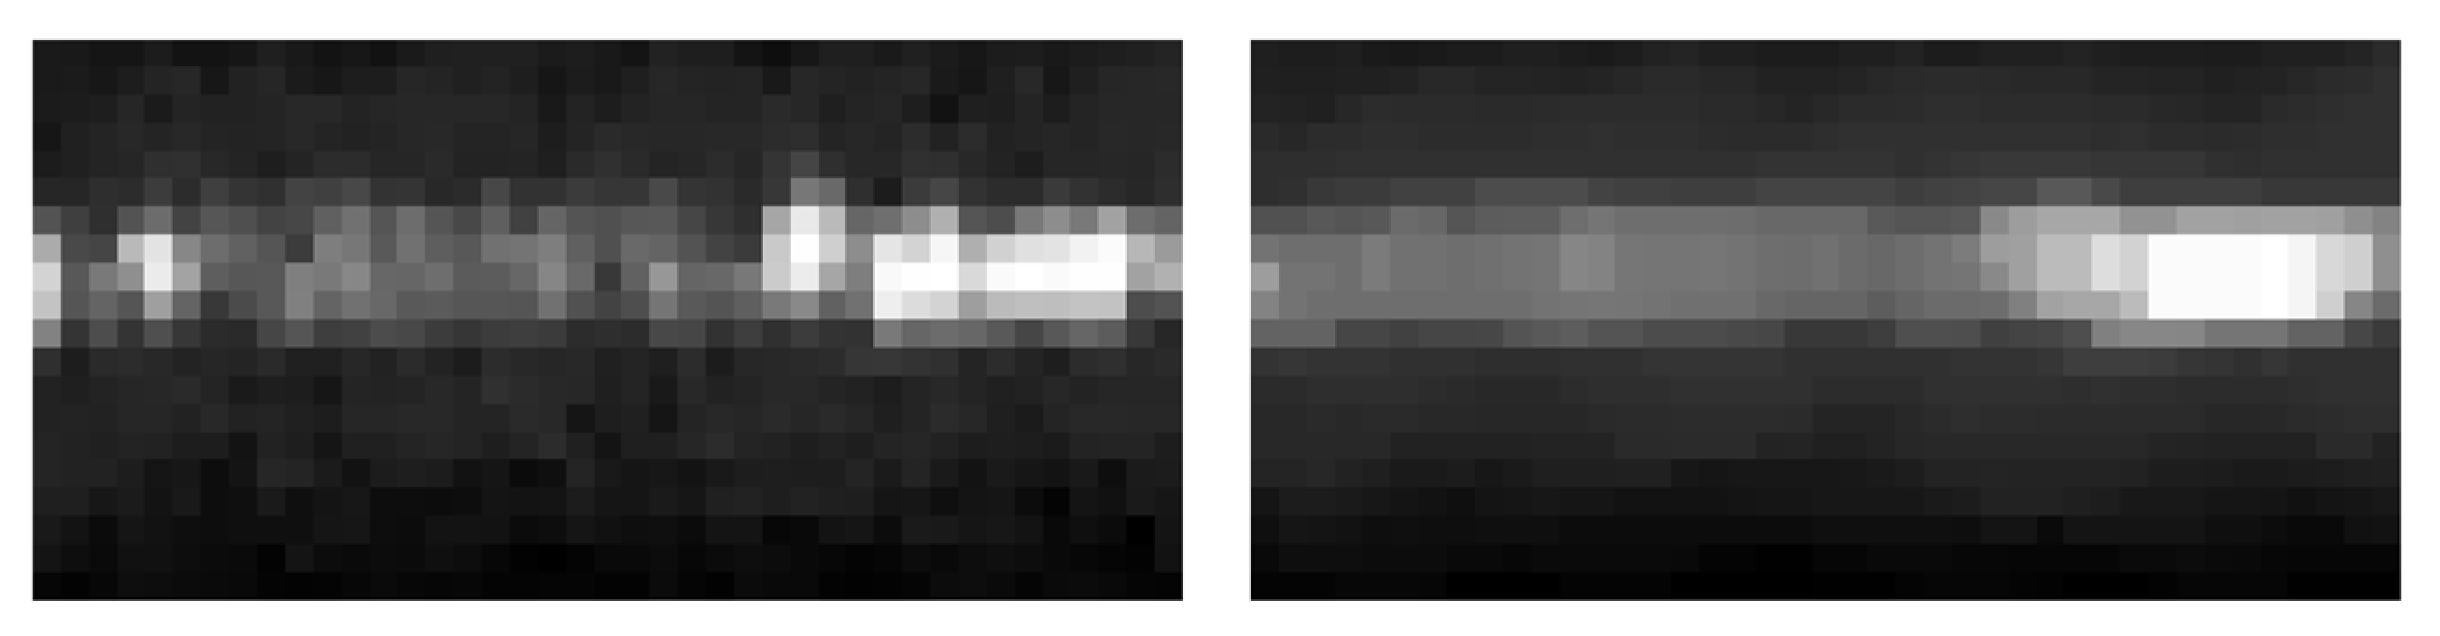
Figure 8.
Representation of GC method for laser stripe extraction. Only values above the threshold are considered. There are n - k black vertical lines representing pixels i rows above the threshold.
Figure 8.
Representation of GC method for laser stripe extraction. Only values above the threshold are considered. There are n - k black vertical lines representing pixels i rows above the threshold.
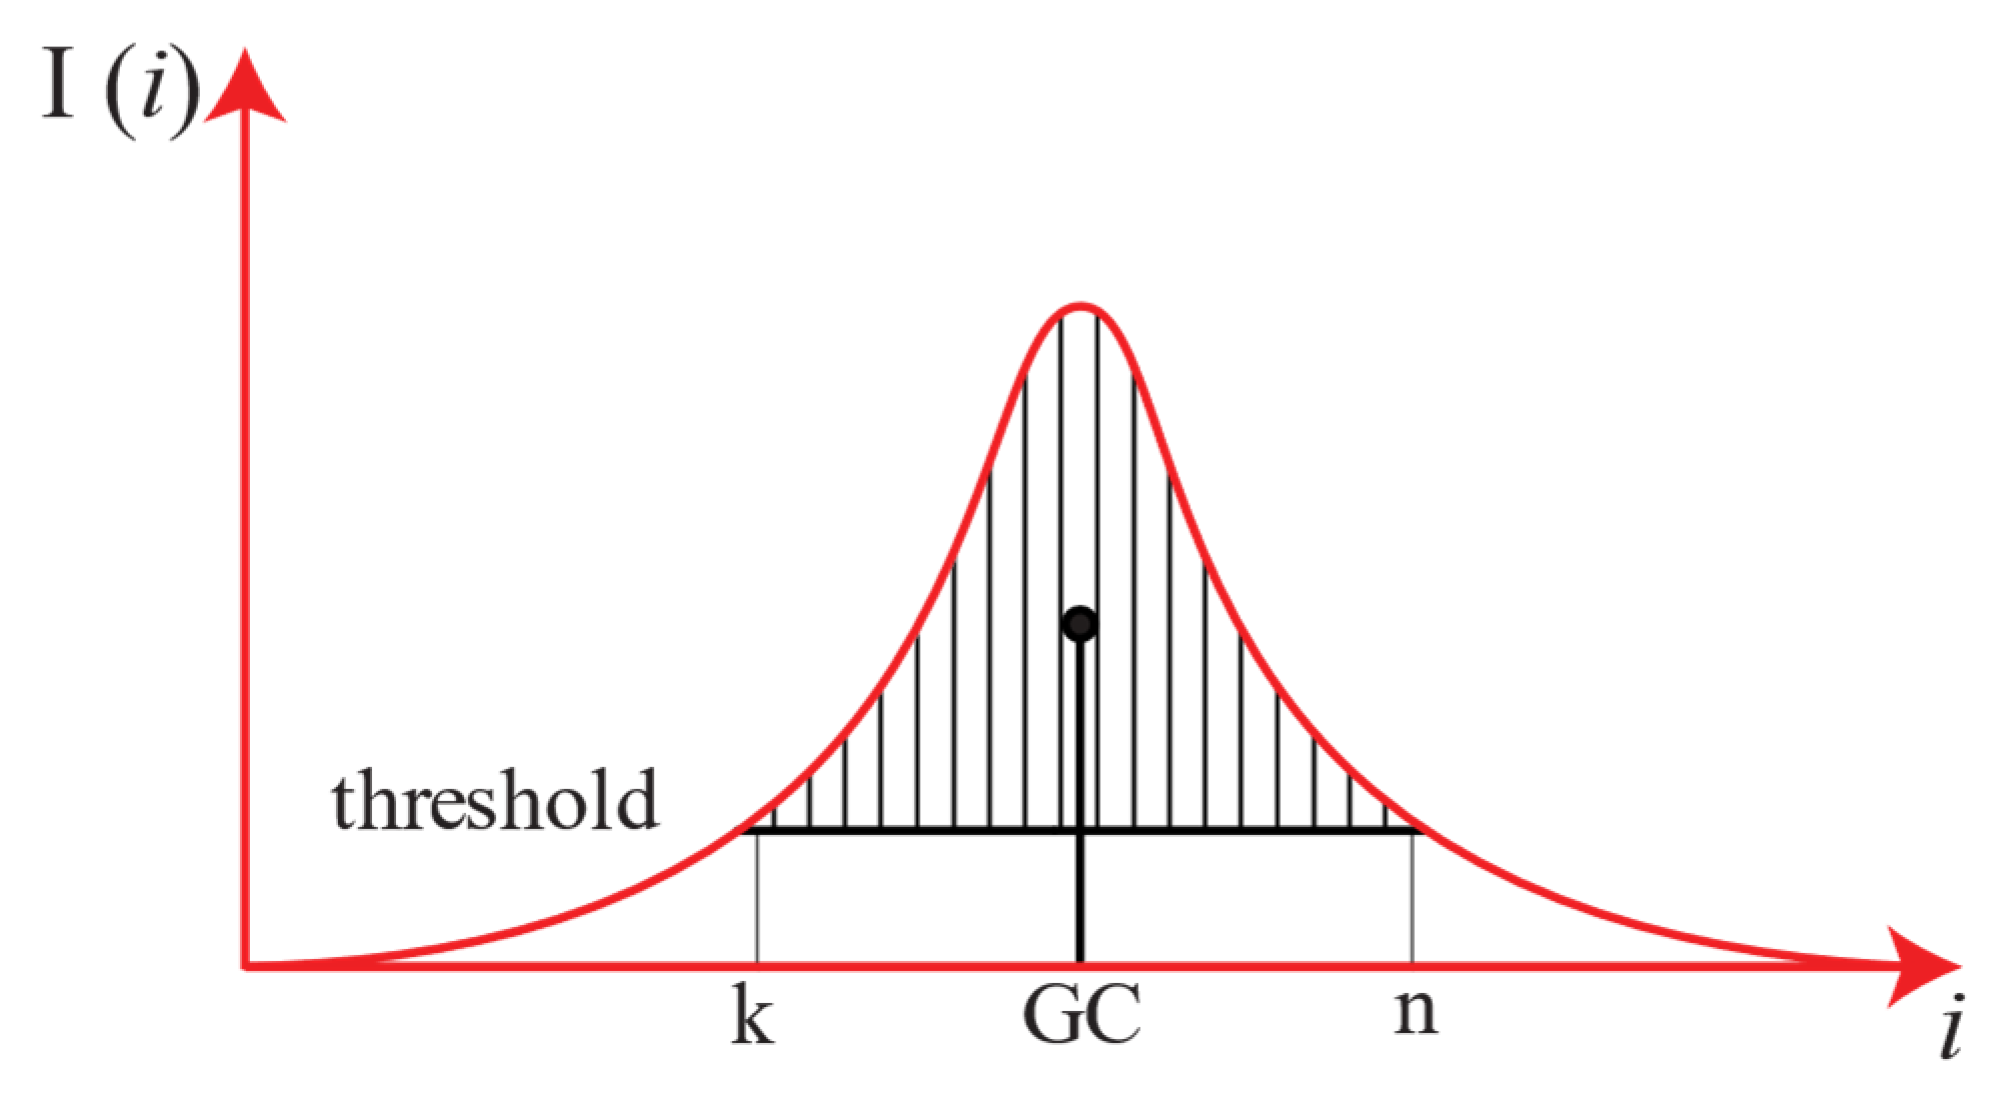
Figure 9.
Graphical representation of FIR Peak algorithm. Only for intensities above the threshold the convolution is computed.
Figure 9.
Graphical representation of FIR Peak algorithm. Only for intensities above the threshold the convolution is computed.
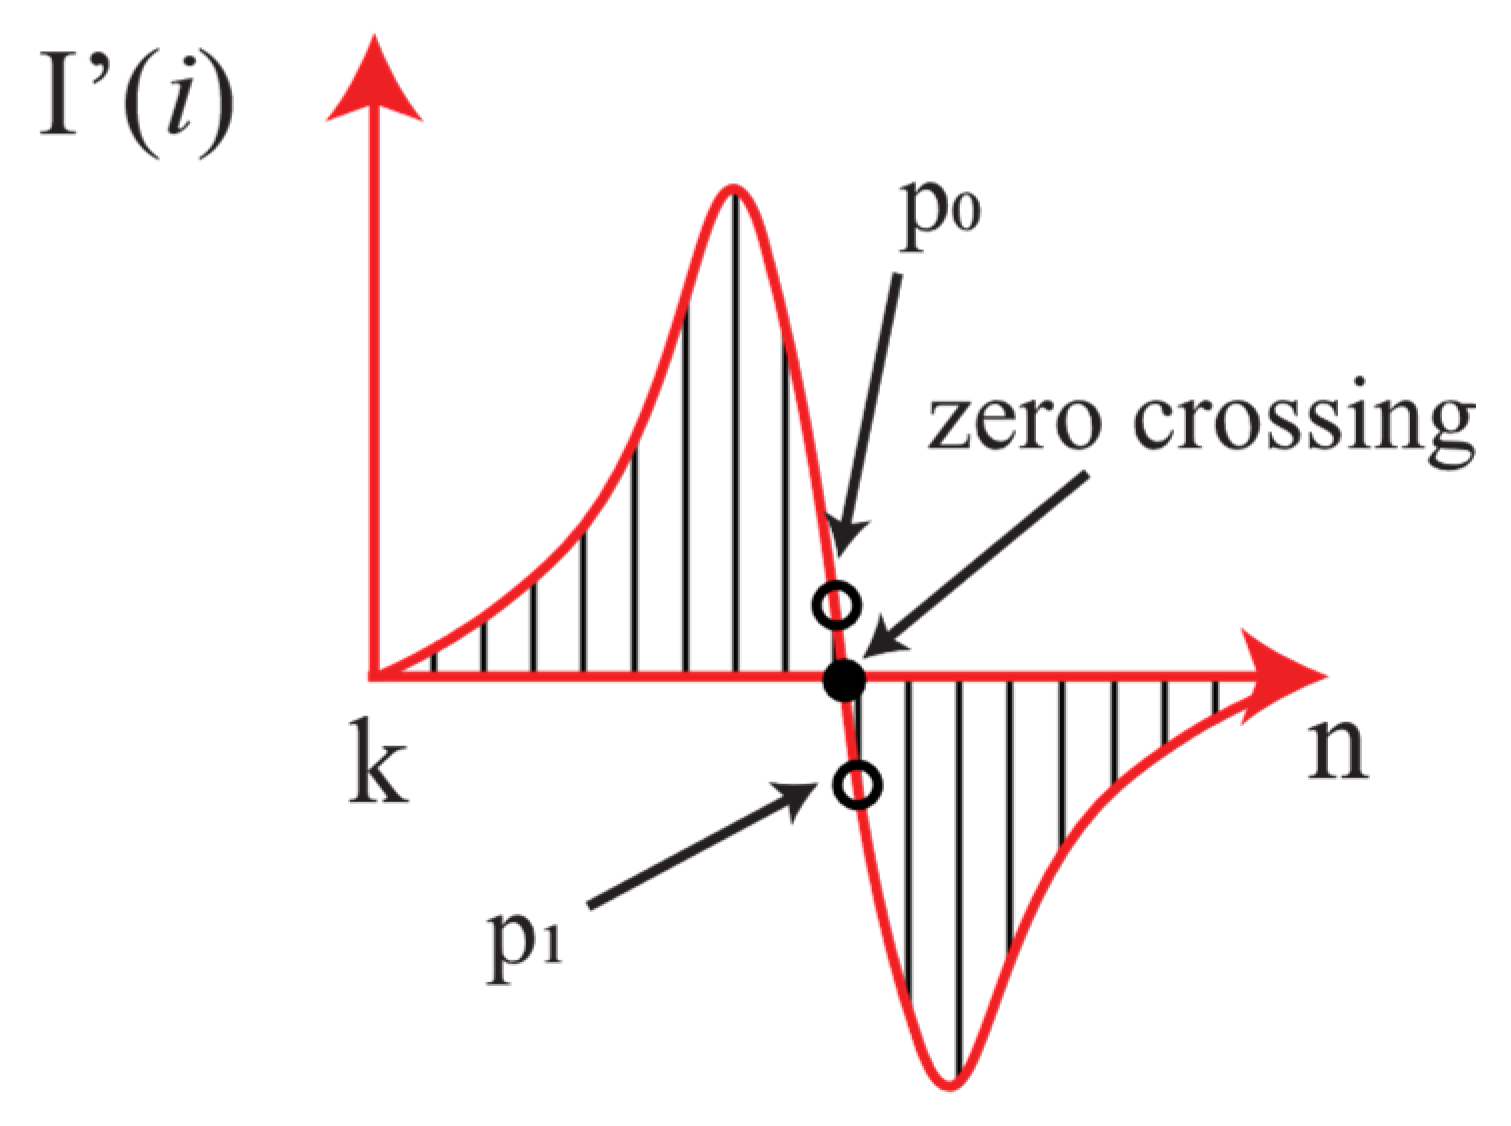
Figure 10.
(a) Hamming filter with 21 parameters and cutoff of 0.5. (b) Derivate kernel. (c) FIR filter designed for this paper.
Figure 10.
(a) Hamming filter with 21 parameters and cutoff of 0.5. (b) Derivate kernel. (c) FIR filter designed for this paper.
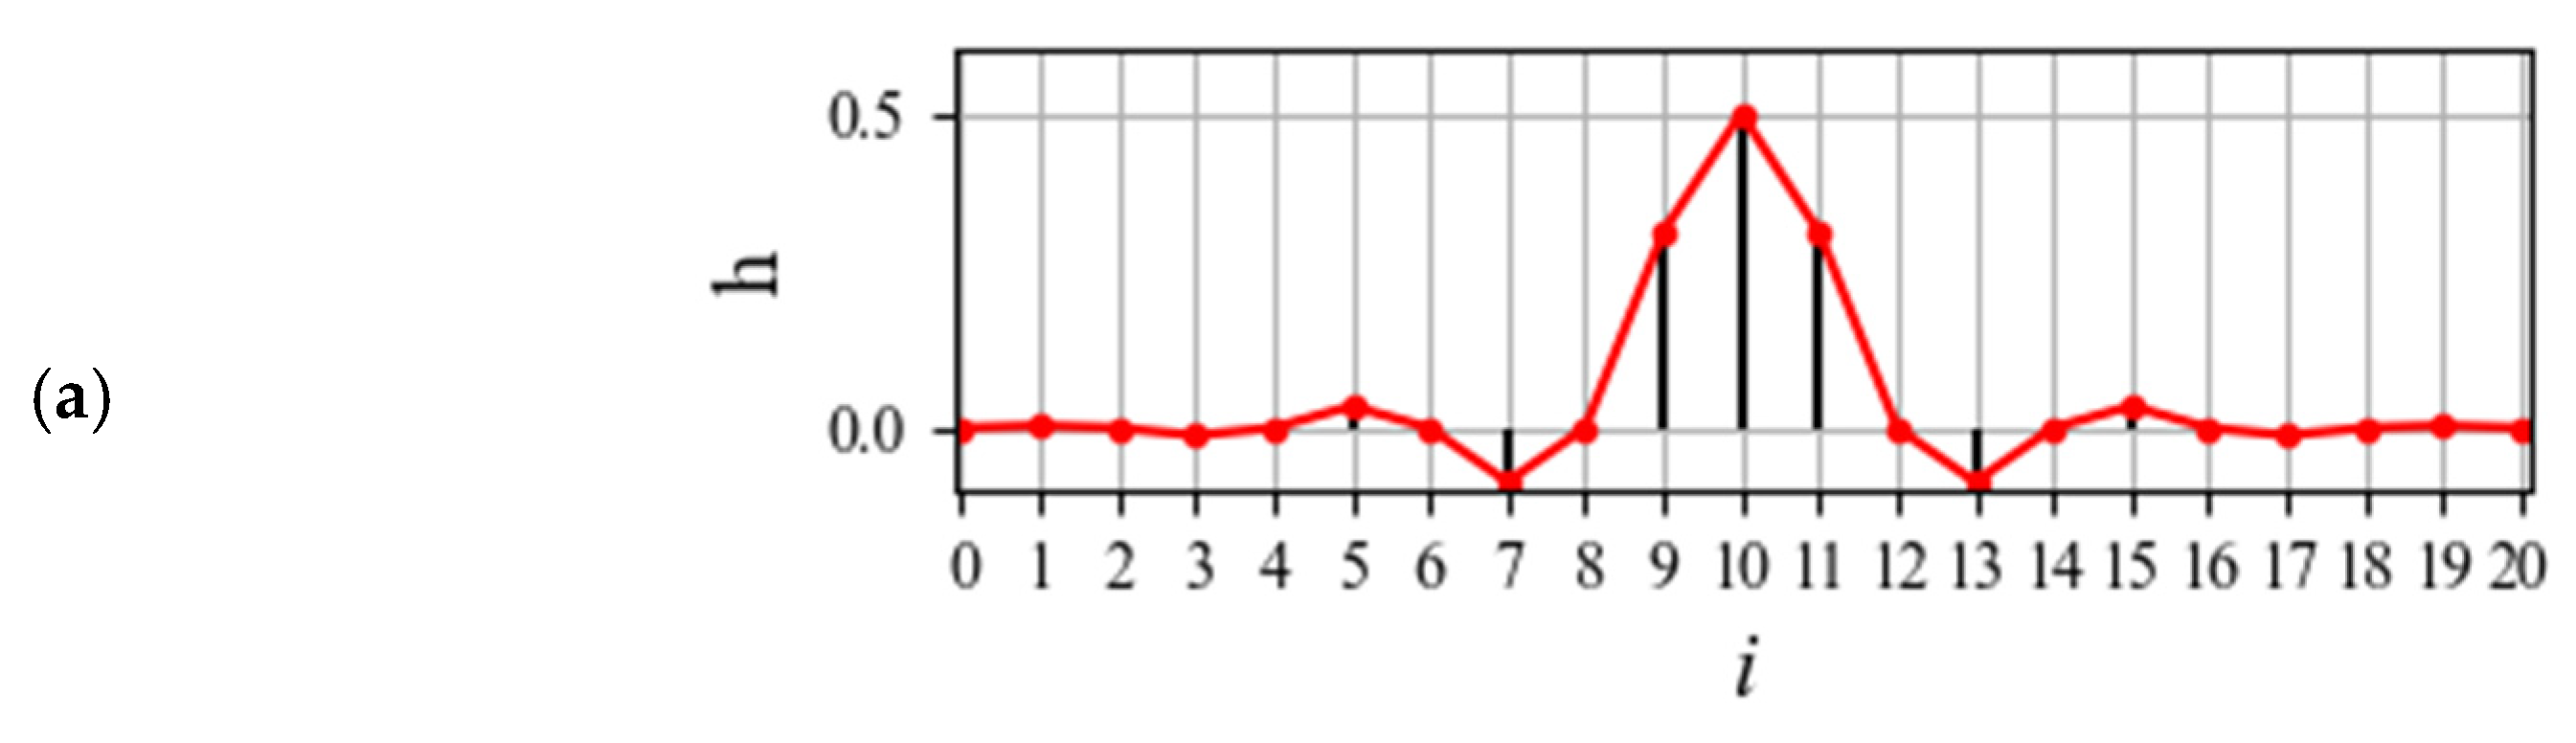
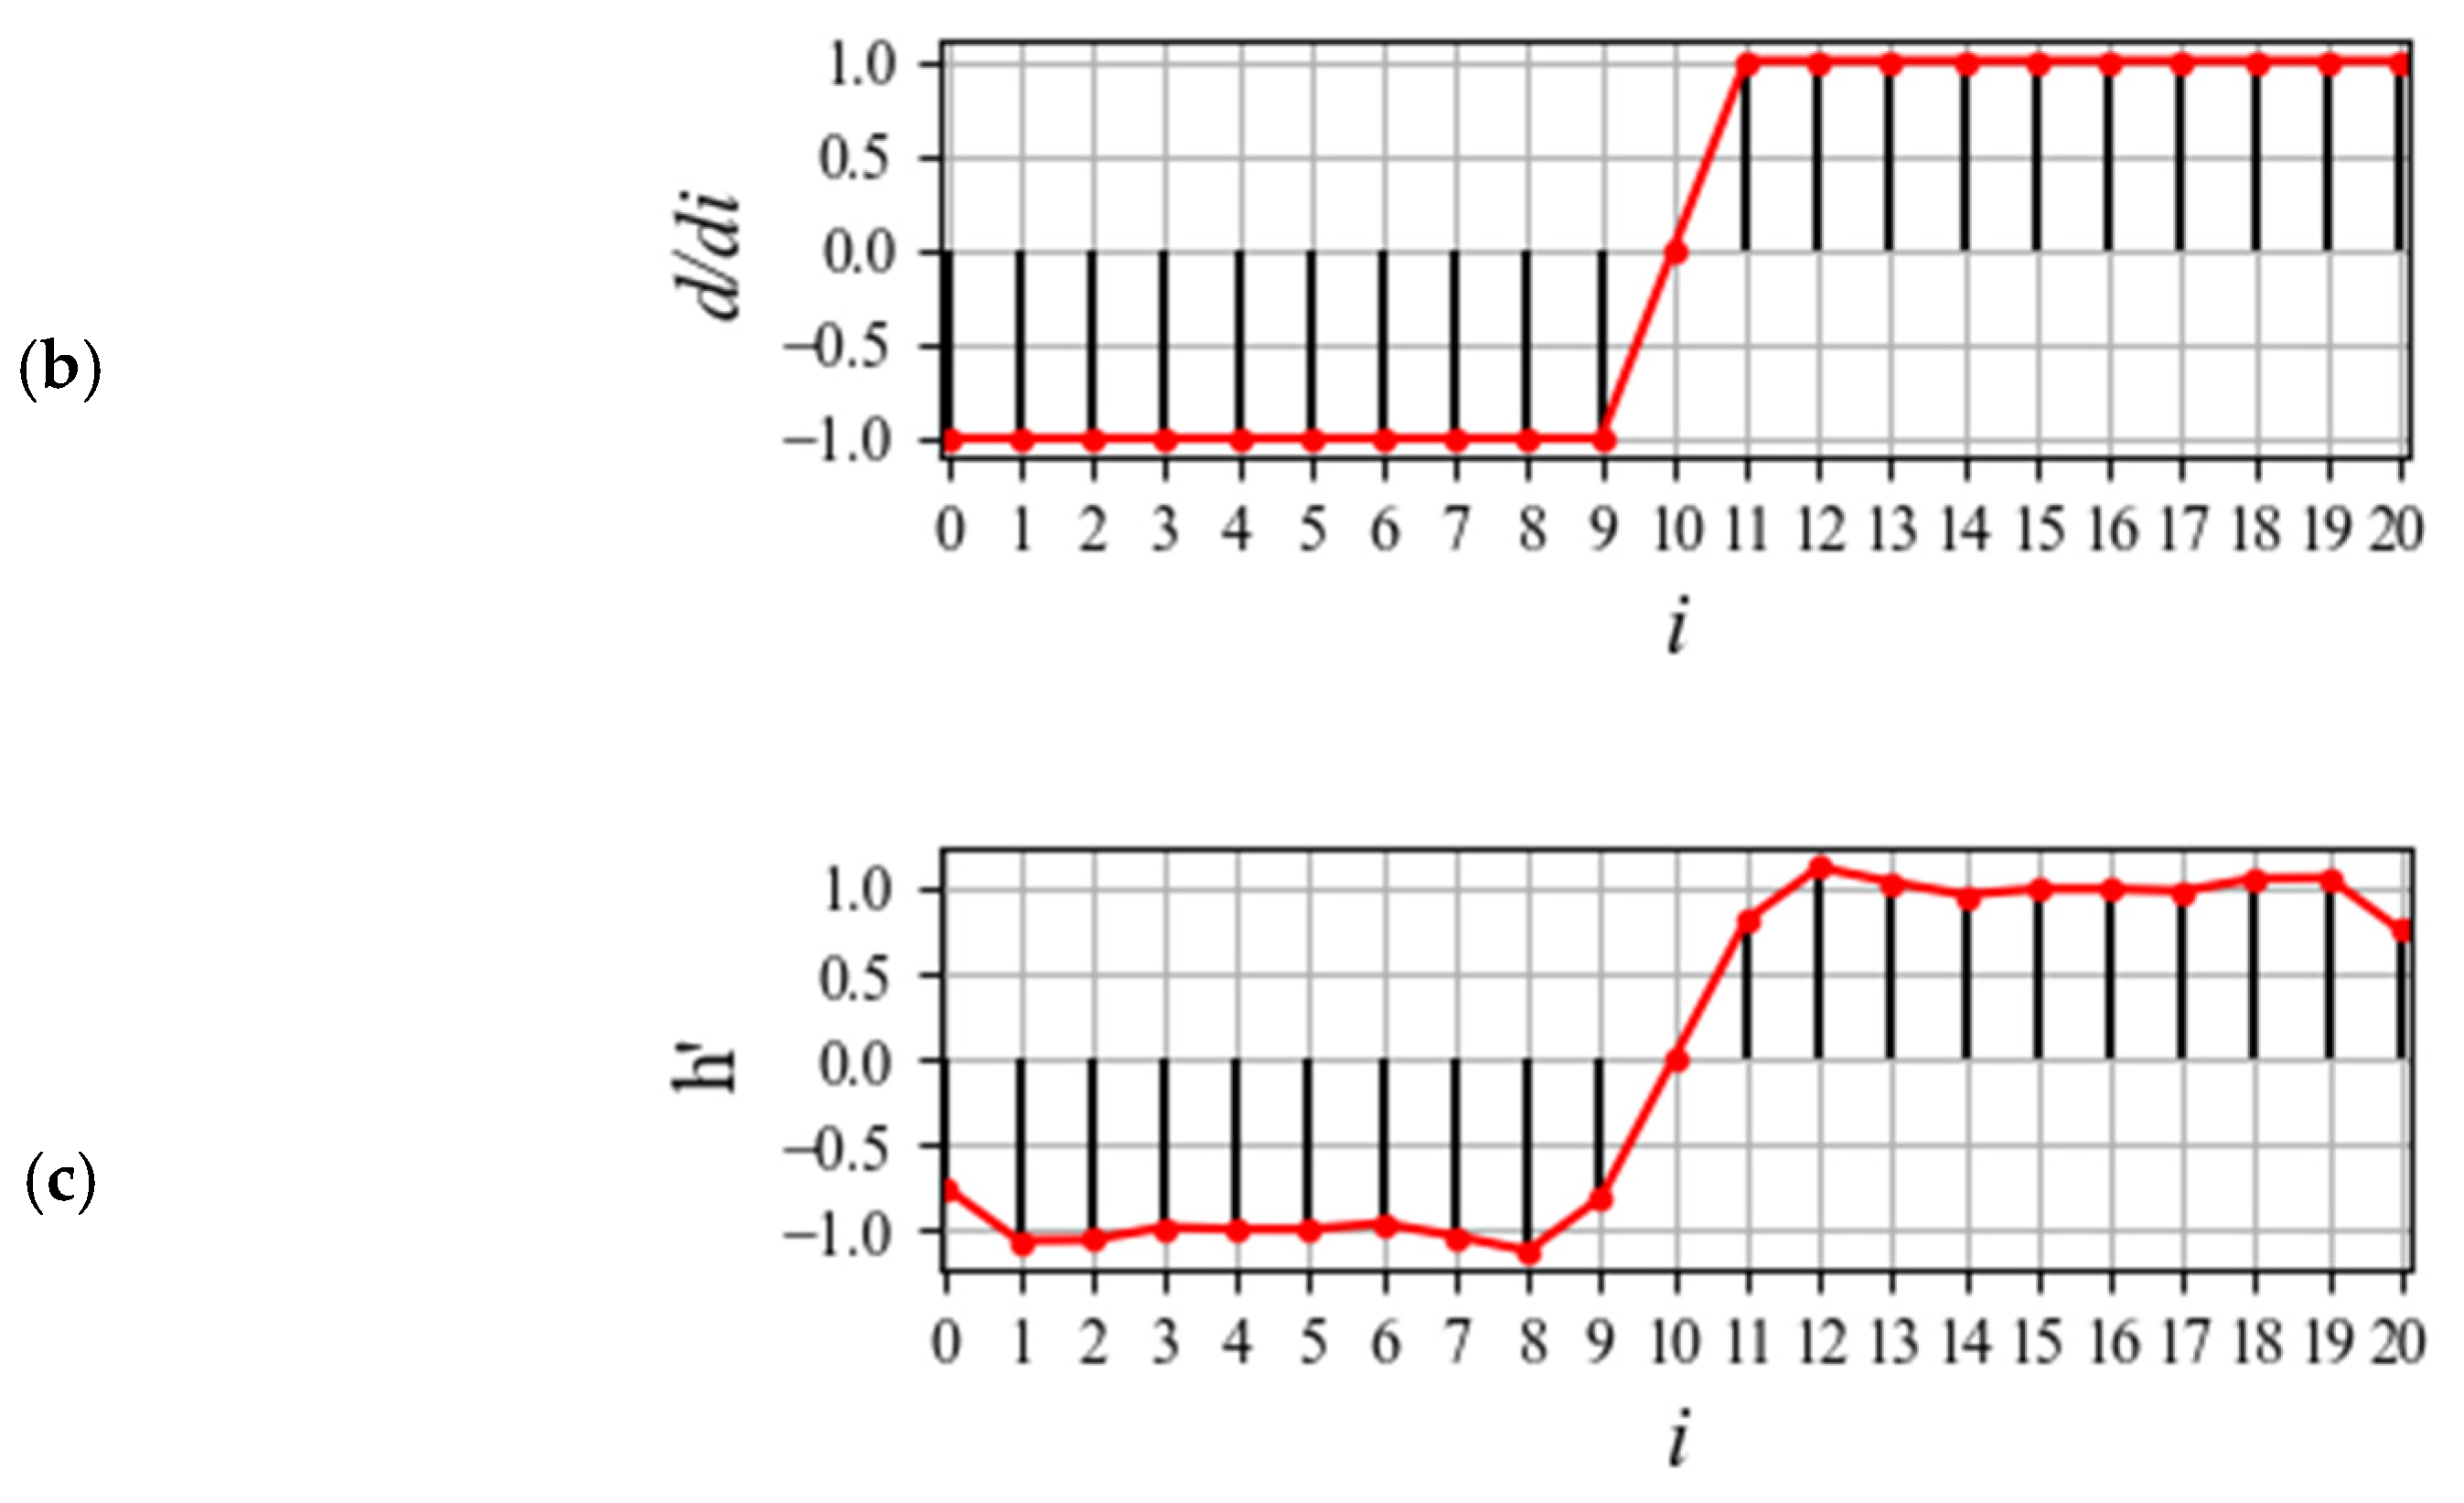
Figure 11.
Uncertainty and processing time benchmark using three different algorithms when the front panel with alignment teeth is used to measure gap (a) and flush (b).
Figure 11.
Uncertainty and processing time benchmark using three different algorithms when the front panel with alignment teeth is used to measure gap (a) and flush (b).
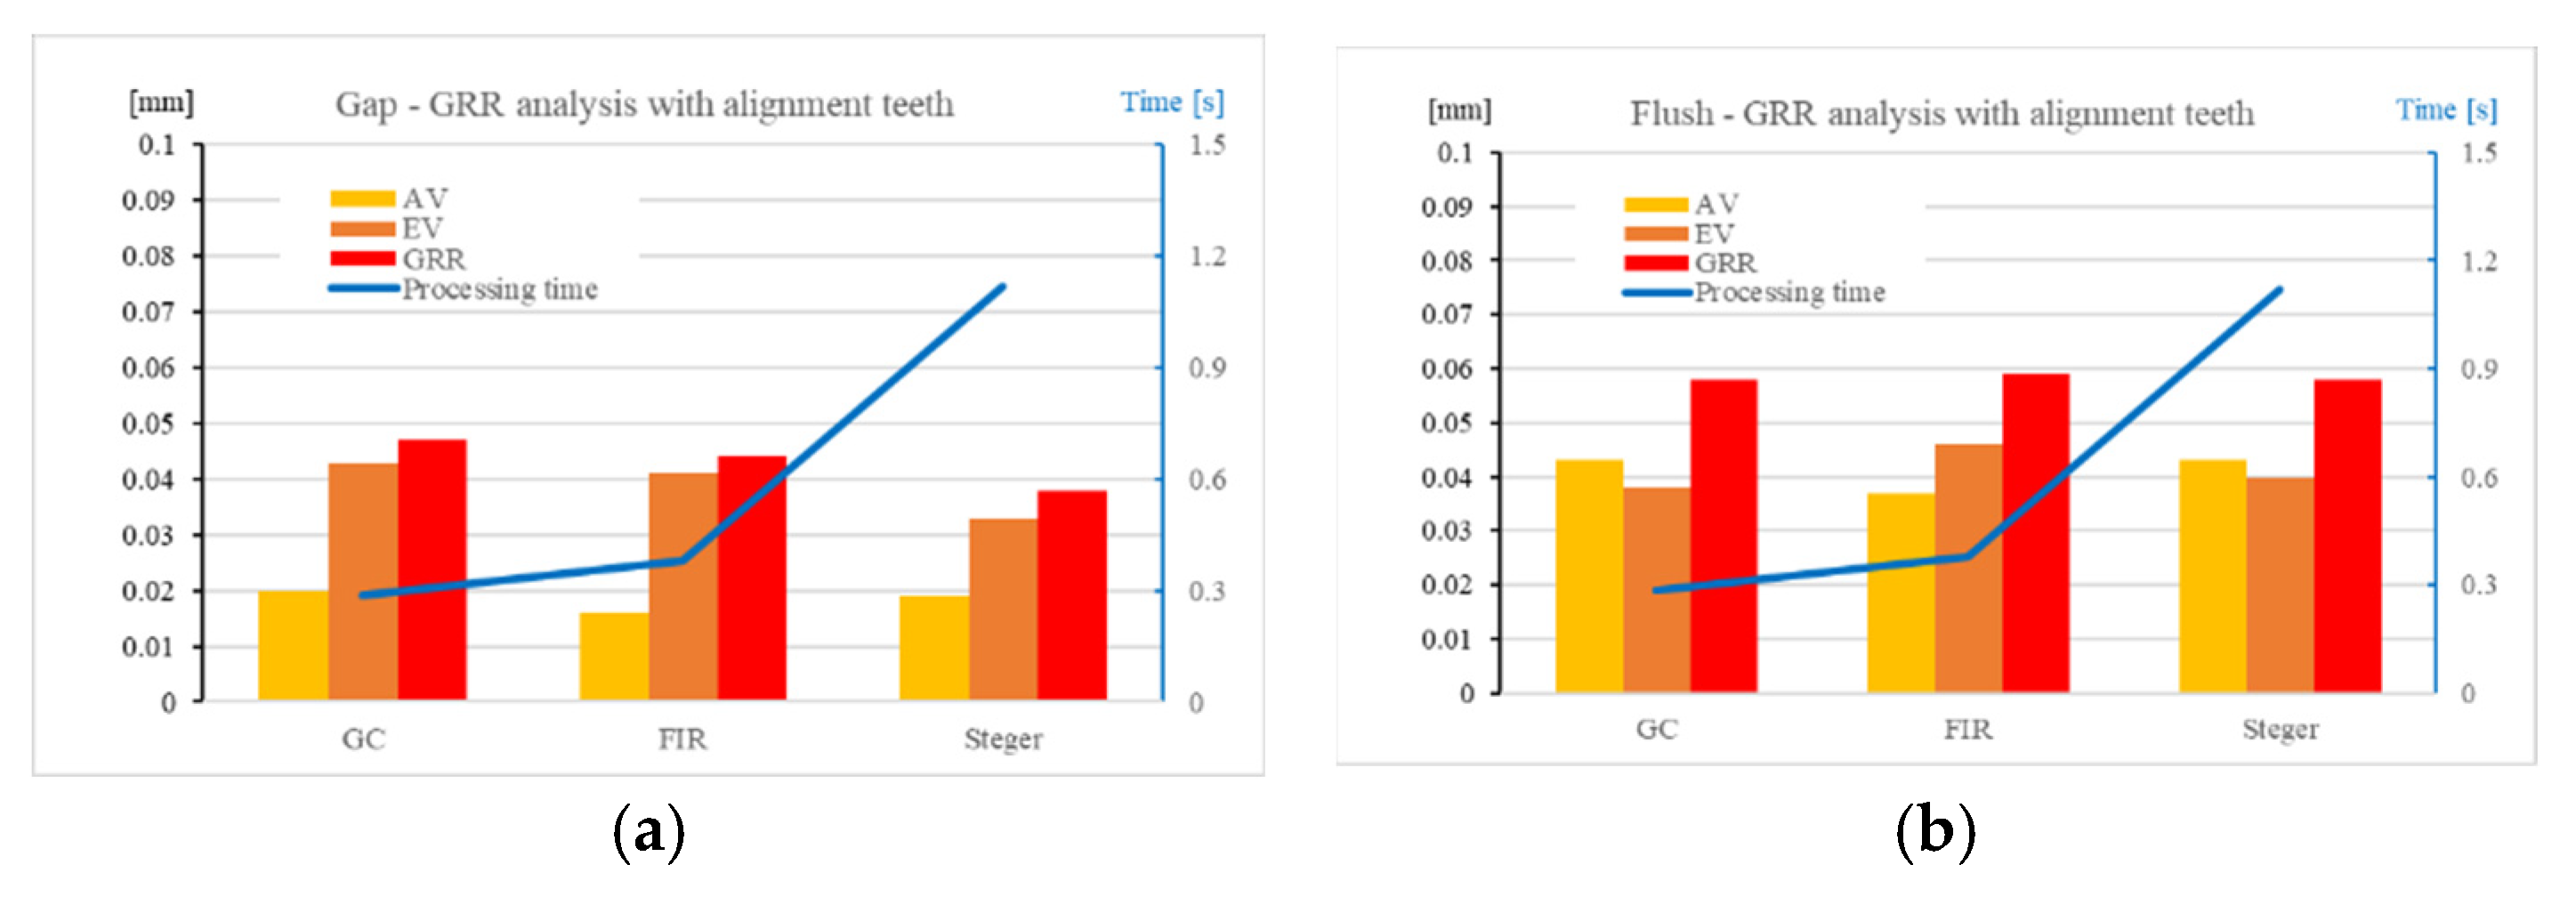
Figure 12.
Uncertainty and processing time benchmark using three different algorithms when the front panel without alignment teeth is used to measure gap (a) and flush (b).
Figure 12.
Uncertainty and processing time benchmark using three different algorithms when the front panel without alignment teeth is used to measure gap (a) and flush (b).
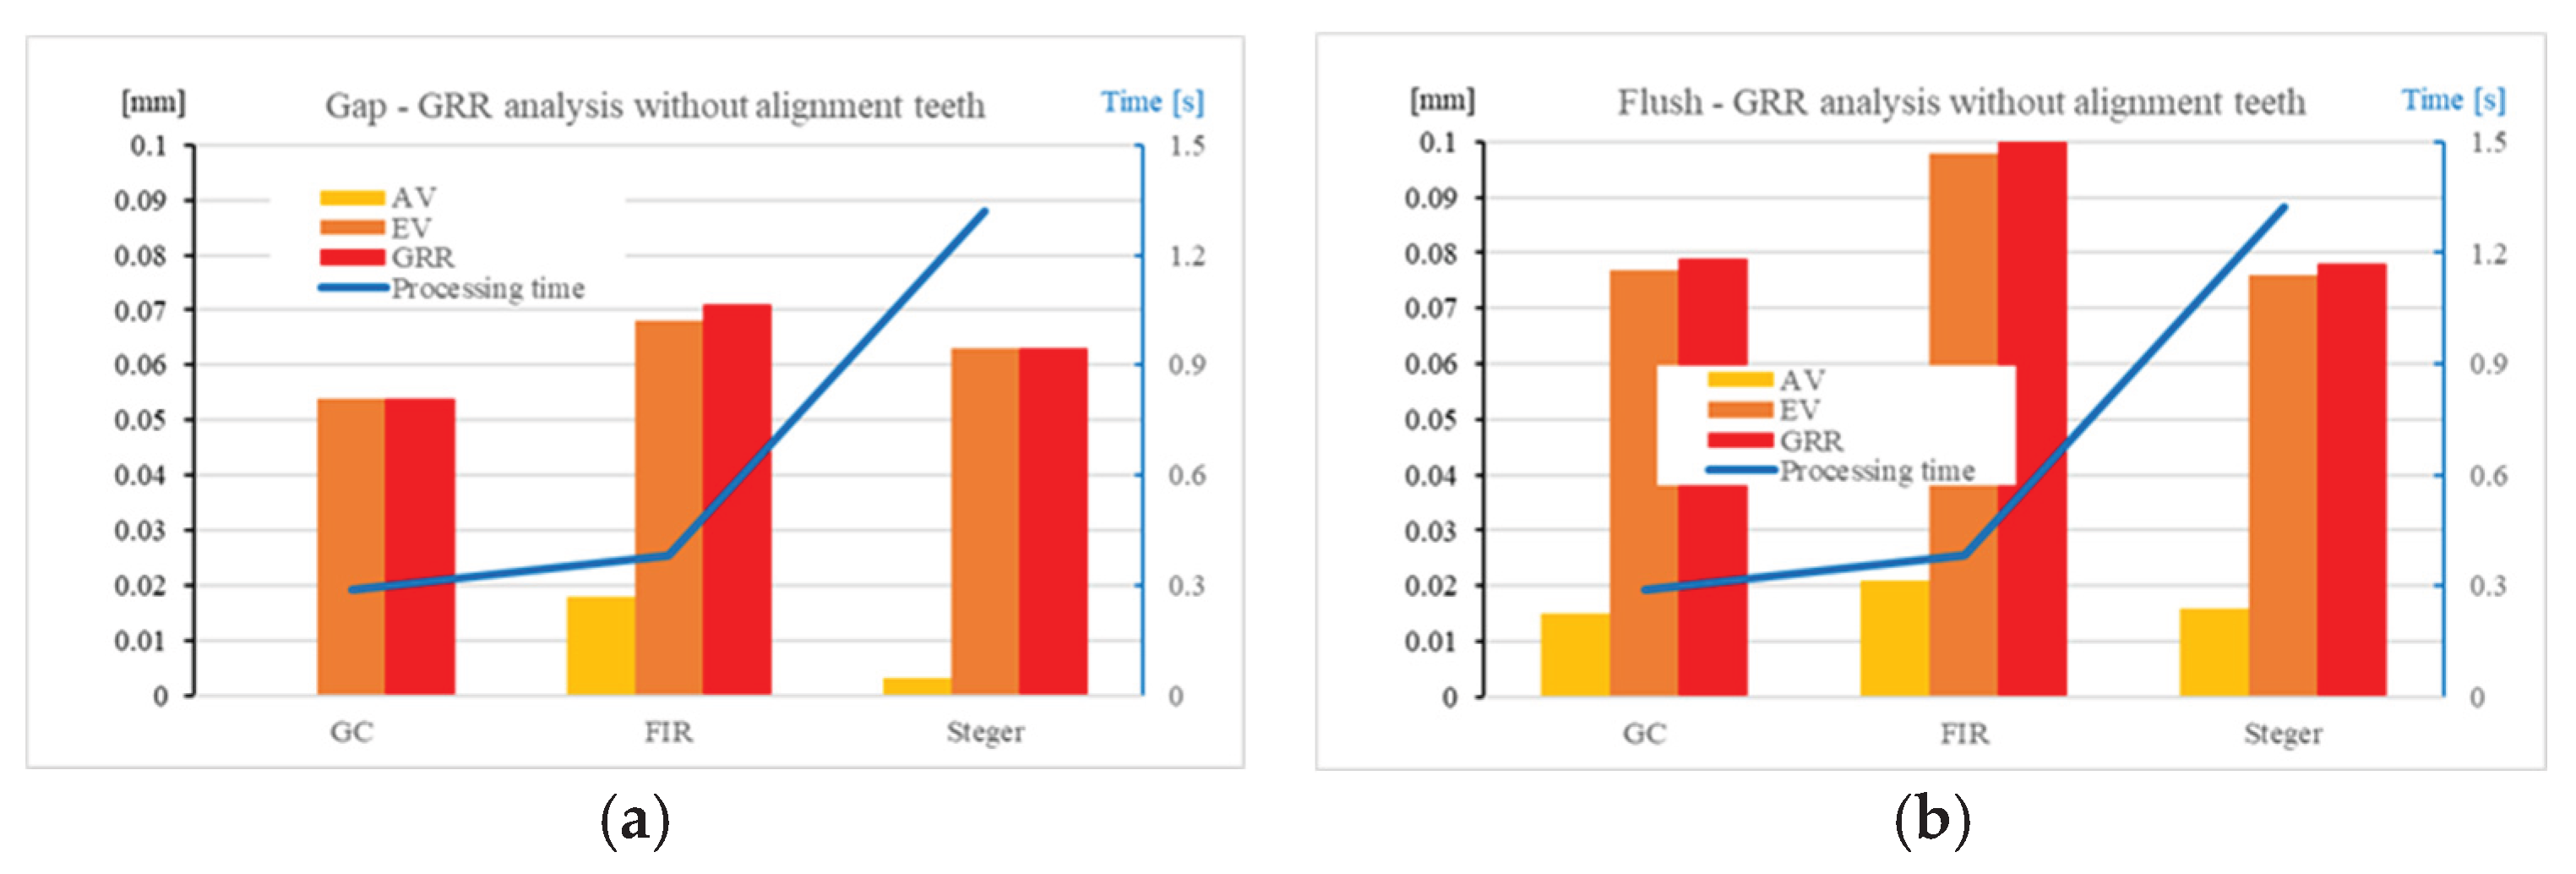

Table 1.
Sensor's FOV description.
| Z = 0 mm | Z = 12 mm | |
|---|---|---|
| X range | ± 8.5 mm | ± 11 mm |
| X Resolution | 7 μm | 9 μm |
| Z Resolution | 9 μm | 9 μm |
Disclaimer/Publisher’s Note: The statements, opinions and data contained in all publications are solely those of the individual author(s) and contributor(s) and not of MDPI and/or the editor(s). MDPI and/or the editor(s) disclaim responsibility for any injury to people or property resulting from any ideas, methods, instructions or products referred to in the content. |
© 2025 by the authors. Licensee MDPI, Basel, Switzerland. This article is an open access article distributed under the terms and conditions of the Creative Commons Attribution (CC BY) license (http://creativecommons.org/licenses/by/4.0/).
Copyright: This open access article is published under a Creative Commons CC BY 4.0 license, which permit the free download, distribution, and reuse, provided that the author and preprint are cited in any reuse.


