
Submitted:
30 December 2025
Posted:
31 December 2025
You are already at the latest version
Abstract
The growing demand for high-protein dairy products, driven by the expanding markets for infant formula and nutritional supplements, has led to a higher incorporation of milk protein ingredients like milk protein concentrate (MPC) and whey protein isolate (WPI) in dairy formulations. However, the effects of these protein additives on the thermal stability and sensory attributes of dairy products remain insufficiently studied. This research examines the influence of thermal processing (80 °C for 30 min) and protein fortification (MPC, WPI, and their combination) on the denaturation of whey proteins, the formation of volatile compounds, and the sensory characteristics of milk. Specifically, whole milk was fortified with MPC, WPI, and their combination at concentrations of 4% MPC, 4% WPI, and 2% MPC + 2% WPI, respectively, to evaluate the impact of different protein fortifications on these properties. Our findings reveal that heat treatment significantly promoted the denaturation of β-lactoglobulin and α-lactalbumin, with protein fortification playing a role in modulating these changes. Notably, lactoferrin exhibited matrix-dependent antioxidant behavior, meaning its antioxidant activity varied based on the protein composition and structure of the milk matrix, influencing its stability and function under different fortification conditions. Volatile profiling indicated that MPC enhanced the formation of sulfur-containing compounds and aldehydes, whereas WPI favored ketones and Maillard-derived volatiles. Sensory analysis revealed that heated WPI fortified samples exhibited stronger cooked and dairy fat aromas, while unfortified milk retained milky and grassy notes. Correlation analysis highlighted the mechanistic links between protein denaturation and lipid-derived compounds. These results emphasize that protein type and composition play crucial roles in flavor development. The strategic blending of MPC and WPI offers a practical approach to balancing volatile profiles and mitigating off-flavors, providing insights for the formulation of thermally stable, protein-fortified dairy products with optimized sensory quality.
Keywords:
milk protein concentrate (MPC)
; whey protein isolate (WPI)
; protein denaturation
; thermal processing
; sensory attributes
1. Introduction
The growing interest in high-protein milk powders is largely driven by the expanding demand for infant formulas and targeted nutritional supplements aimed at older adults and sports professionals [1]. The incorporation of milk protein derivatives, such as whey protein isolate (WPI) and milk protein concentrate (MPC), in Protein-enriched on-the-go-to-consume drinks has surged due to the superior quality of these proteins and the associated health benefits they offer [2]. While milk proteins, particularly whey proteins, are prone to structural changes when subjected to heat treatment, casein, the predominant protein in milk, is more stable under heat and remains largely unaffected by thermal processing in dairy items [3]. Whey proteins are made up of various proportions, including β-lactoglobulin (β-lg), α-lactalbumin (α-la), immunoglobulins (Ig), lactoferrin (Lf), lactoperoxidase (Lp), and bovine serum albumin (BSA) [4]. In MPC, the typical casein: whey protein proportion is held at 78:22, ensuring stability during ultra-high-temperature (UHT) processing due to the heat-resistant nature of casein micelles. However, whey proteins, especially β-lactoglobulin, are vulnerable to denaturation during UHT processing, which can influence their solubility and functionality, including emulsification and gel formation, although the higher casein content contributes to the overall stability. In contrast, WPI, composed entirely of whey proteins, undergoes significant denaturation and aggregation during heat treatment, which limits its thermal stability [5].
Heating plays a pivotal role in dairy processing, with a substantial effect on the functional attributes of products like yogurt, milk powder, and UHT milk. It affects essential qualities, including the consistency of yogurt texture, the thermal stability of reconstituted milk, and the rheological behavior of sweetened condensed milk. The thermal milk protein processing techniques facilitates the development of a protein network in yogurt, inactivates enzymes to enhance product stability, and modifies the viscosity of milk. Moreover, heat treatment contributes to the Maillard reaction, which improves the development of sensory profile and color in milk-based items. In addition to these effects, thermal processing is crucial for maintaining the microbiological safety of dairy products, which is essential for prolonging their shelf life [6,7,8]. In the dairy industry, heat treatment not only guarantees product safety but also enhances shelf life, though it can also alter the physical and chemical characteristics of milk, potentially affecting the flavor, quality, and nutritional composition of the final product [9]. Dairy protein components in powdered form are generally produced through several stages of processing, with heat treatment being a key factor in altering protein structures, primarily by inducing denaturation [10,11,12,13]. Denaturation occurs in two distinct phases: initially, the disruption of weak interactions, including hydrogen bonds and hydrophobic forces, which support the original protein configuration, results in the denaturation of both the two-dimensional and three-dimensional protein conformations. In the second phase, the denatured proteins form aggregates through intermolecular disulfide linkages and hydrophobic interactions [14,15,16,17]. The denaturation of whey proteins, including β-lactoglobulin, becomes more pronounced with higher protein concentrations in systems such as milk or reconstituted milk. Following thermal treatment at 80 °C for durations ranging from 5 to 30 min, up to 70-95% of whey proteins may undergo denaturation, leading to aggregation via disulfide bonding with κ-casein, thus modifying functional properties such as gel formation and solubility [18].
MPC is a growing category of powdered dairy ingredients that combines both casein and whey proteins, with protein concentrations typically varying between 40% and 89%. In the current era, MPC has been produced in a range of protein levels and integrated into various dairy products. It is commonly used to modify the protein composition of milk for cheese production and is also included in processed cheeses, infant milk formulas, dairy-based drinks, and nutritional products. Among milk protein derivatives, MPC is particularly valued for its high protein content (50–85%) and relatively low lactose levels [19]. MPC is a protein-rich powder derived from spray-drying skim milk, using membrane filtration techniques to concentrate the proteins [20]. Carr [21] investigated the thermal stability of MPC85, prepared at a 3.5% protein concentration, at 120 °C, and observed that it demonstrated limited stability. This instability was largely influenced by the interaction between casein and whey proteins. In a following study, Crowley et al. (2014) examined the impact of heat treatment on several MPC variants, including MPC35 (skim milk powder), MPC50, MPC60, MPC70, MPC80, MPC85, and MPC90, when exposed to 140 °C [22]. Their findings revealed a trend in protein stability, where stability initially decreased as protein concentration increased (from MPC35 to MPC80), it improved in the MPC85 and MPC90 variants, likely due to the dominance of casein and the reduction in Maillard reactions associated with lower lactose content.
WPI is derived from liquid whey through a multi-step processing technique. Despite the fact that liquid whey is rarely used directly as a nutritional component, except in certain products such as whey cheeses or beverages, it is typically processed into premium products like dried whey powder or WPI, which contains more than 90% protein. The preparation of WPI commonly employs techniques such as ion-exchange chromatography or ultrafiltration, subsequent to the use of spray drying, a widely adopted procedure that converts aqueous substrates into a fine powder [23]. Whey protein is recognized as a superior protein source, greatly boosting the nutritional content of diverse food products [24]. It is widely integrated into food products including baby food formulations, functional foods, and snack items. Recently, there has been a growing highlight on modifying the characteristics of whey proteins to optimize their functional attributes, such as improving heat resistance, controlling aggregation, and enhancing solubility at higher concentrations, to meet the evolving demands of the food sector. Whey proteins offer a diverse array of functional attributes, including superior solubility, dispersibility, moisture retention, foam formation, whipping characteristics, emulsifying ability, gel formation, and pH regulation capacity [25]. These properties render whey proteins highly versatile, making them appropriate for a variety of food applications [26].
Despite the common utilization of MPC and WPI to enhance dairy formulations, their combined effect on the thermal durability and sensory attributes of whole milk remains underexplored. Also, there is very little knowledge on dairy products with high protein content. This study investigated the heat-induced denaturation of high protein milk systems fortified with MPC or WPI or both. Our findings provide actionable insights for developing thermally stable, protein-fortified whole milk that maintains functionality and consumer acceptability.
2. Materials and Methods
2.1. Sample Collection and Preparation
Ultra-high temperature (UHT, 138 °C for 2 sec) treated whole milk (WM) was acquired from regional marketplace, specifically from the manufacturer Special Pure Milk, while MPC and WPI in powder form were provided by Cezanne company, Yinchuan Ningxia, China. Whole milk (WM) was used as control. The nutritional composition of the whole milk (WM), milk protein concentrate (MPC), and whey protein isolate (WPI) used in this study is presented in Table 1. The compositional analysis of the whole milk (WM) supplemented with milk protein concentrate (MPC) and whey protein isolate (WPI) is shown in Table 2. An aliquot of MPC or WPI was mixed with 24 aliquots (w w-1) of WM, denoted WM+MPC or WM+WPI. Same aliquot of MPC and WPI was mixed with 48 times of WM, denoted WM+MPC+WPI. After the mixing process, the resulting mixtures were exposed to heat treatment at 80°C for designated time intervals (0, 5, 10, and 30 minutes) in a metal container, with the heated samples labeled as H. Before the analytical procedure, all heated samples were tempered at 25 °C for at least 1 h until further analysis. In particular, four sample formulations were prepared: 4% (w w-1) MPC was mixed with 96% (w w-1) whole milk, denoted as WM+MPC. Similarly, 4% (w w-1) WPI was added to 96% whole milk, resulting in the formulation WM+WPI. Additionally, a combination of both 2% MPC and 2% WPI was mixed with 96% whole milk, referred to as WM+MPC+WPI.
2.2. Protein Analysis
2.2.1. Determination of the Protein Profile
The protein profile was analyzed using SDS-PAGE, with minor adjustments to the procedure outlined by [27]. To standardize the protein concentration for SDS-PAGE, each heat-treated sample was diluted to a 2% (w w-1) protein concentration based on the original protein content (as indicated in Table 3) and vortexed thoroughly. The samples were then homogenized by vortex mixing (3 × 1 mol L⁻¹, with 30 sec intervals between cycles) to ensure complete homogeneity. Freshly prepared samples were immediately used for SDS-PAGE to minimize any protein degradation. To prepare the protein samples, 80 μL of a double-concentrated reducing buffer was blended with 80 μL of each sample, while 20 μL of a five-fold concentrated non-reducing buffer was added to the remaining 80 μL of samples. The blends were heated at 95 °C for 5 min in an Eppendorf Thermomixer. Following heating, the samples were vortexed and tempered at room temperature for 30 min. For electrophoresis, 8 μL of the processed protein samples were loaded onto a 4-20% Super-PAGE Bis-Tris gel (Epizyme, Shanghai, China), and separation was carried out using a Mini P-4 vertical electrophoresis system (Cavoy, Beijing, China). The separated proteins were stained with Coomassie Brilliant Blue R-250 (0.01%, w v⁻¹), obtained from Bio-Rad Laboratories (Hercules, CA, USA), for 1 hour, subsequently undergoing destaining in a solution containing 250 mL of anhydrous ethanol (Macklin Biochemical Co. Ltd., Shanghai, China), 80 mL of acetic acid (Mreda Technology Co. Ltd., Beijing, China), and 670 mL of deionized water, adjusted to a final quantity of 1 liter. The destaining process carried on overnight using a stirrer machine in a large petri dish. The electrophoresis gels were then scanned using a scanner in carrier sheets. Each sample was analyzed in triplicate.
2.2.2. Determination of Denaturation Rate of Active Protein
Protein quantification was carried out using a HPLC system (Agilent 1260, Agilent Technologies, USA) fitted with an AdvanceBio RP-mAb C4 column (4.6 × 150 mm, 3.5 µm), following a modified protocol from [28].
Subsequently, acidification and centrifugation were performed, followed by pH adjustment utilizing an accurate pH instrument in combination with certified calibration liquids (pH 4.0 and 7.0). A 1 mol L⁻¹ HCl solution was prepared by diluting concentrated HCl (37%, Mreda Technology Co., Ltd., Beijing, China) using deionized water, adjusting the total volume to 100 mL. For pH adjustment, 20 mL portions of each sample were transferred to glass beakers, where the initial pH (6.6 ± 0.1) was measured. The pH was then lowered to 4.6 by gradually adding 1 mol L⁻¹ HCl drop by drop, with thorough rinsing of the pH electrode and glassware with distilled water between sample preparations.
After acidification, the aliquots were moved into 50 mL centrifugal tubes of polypropylene, followed by stabilizing at 20 °C for 20 min. The samples were subsequently centrifuged at 10,000 × g for 30 min at 4 °C using a bench-top refrigerated centrifuge (Heraeus Multifuge ×1R, Thermo Fisher Scientific, Cleveland, OH, USA). The resulting supernatants were passed through 0.22 µm membrane filters into pre-labeled HPLC vials. Filtration was conducted using syringe-driven 0.22 µm membrane filters (Millipore) into pre-chilled Agilent glass vials, which were directly preserved at -20 °C. Before the HPLC procedure, the frozen samples were given 2 hours to thaw at 4 °C. and vortexed to guarantee full redissolution of the contents.
For high-performance liquid chromatography (HPLC) analysis, the specimens were separated at a constant throughput of 1 mL min⁻¹, utilizing a 10 µL injection volume, while the temperature of the column was held steady at 60 °C for the quantification of α-lactalbumin (α-LA) and β-lactoglobulin (β-LG), with measurement conducted at 210 nm. The solvent gradient initiated with 70% solvent A and 30% solvent B, gradually shifting to 45% solvent A and 55% solvent B at 10 min, then altering to 30% solvent A and 70% solvent B at 10.1 min, and reverting to the original solvent composition by 12.1 min, followed by an additional 17-min hold. For lactoferrin (LF) analysis, the column temperature was increased to 70 °C, and measurement was conducted at 280 nm. The LF gradient began with 95% solvent A and 5% solvent B for 2 min, then transitioned to 20% solvent A and 80% solvent B at 5 min, maintaining this formulation for 8 minutes before returning to the original solvent mix at 9 min, with a subsequent 13-min hold. Calibration graphs were constructed using five different concentrations for each protein, with each analysis conducted in triplicate.
2.3. Analysis and Identification of the Volatile Organic Compounds (VOCs)
2.3.1. Extraction of Volatile Components by Solid-Phase Microextraction (HS-SPME-Arrow-GC-MS)
A 1 g portion of sodium chloride (NaCl) was combined with a 5 g sample, followed by the addition of 1 μL of a 0.816 mg mL⁻¹ solution of 2-methyl-3-heptanone, sourced from Macklin Biochemical Co. Ltd. (Shanghai, China), as an internal reference. The mixture was transferred into a 10 mL amber container, capped with a rubber septum, and subjected to vortex mixing for thorough homogenization. The container was then immersed in a metal bath set at 45 °C for 20 min to facilitate equilibration. A 120 μm, 1.1 cm DVB/CAR/PDMS fiber (divinylbenzene/carboxen/polydimethylsiloxane; Agilent Scientific Instruments, Santa Clara, USA) was introduced into the headspace, where it was equilibrated for 30 min at 45 °C, positioned 1 cm above the liquid level inside the sealed vessel. Following the extraction phase, the fiber was placed into the analytical port for thermal desorption and maintained at 230 °C for 5 min. Each specimen was examined in triplicate, and the data generated were processed using CDNN software (v.2.1, Applied Photophysics Ltd., Leatherhead, UK).
Volatile compound detection was performed using a gas chromatograph (Agilent 7890B, Agilent Technologies Co., USA), coupled with a solid-phase microextraction (SPME) arrow injector, a mass-selective detector (Agilent 5977, Agilent Technologies Co., USA), and a polyethylene glycol-based capillary column (Agilent DB-WAX, Agilent Scientific Instruments, Santa Clara, USA; 60 m × 0.25 mm, 0.25-μm film thickness). Helium served as the carrier gas, with a constant flow rate of 1.2 mL min⁻¹, and the system operated in a non-split mode, with the injector temperature maintained at 250 °C. The column oven was programmed according to the following temperature ramp: starting at 40 °C, increasing at 7 °C min⁻¹ to 75 °C, then rising at 2 °C min⁻¹ to 150 °C, followed by a 5 °C min⁻¹ increment to 230 °C, where it was held for 2 min. The mass spectrometer operated in electron impact ionization mode with a 70 eV electron energy, and the ion source temperature was stabilized at 230 °C. A full-scan analysis was performed within the mass-to-charge (m z⁻¹) range of 30 to 350.
2.3.2. Identification and Quantification of Volatile Components
The volatile substances retrieved from the samples were first recognized through the NIST 14 mass spectral search database, incorporated into the gas chromatography-mass spectrometry (GC-MS) system. Further validation of these identifications was achieved via mass spectrometry (MS) analysis and the computation of the retention index (RI). The retention index (RI) was calculated by analyzing a series of linear alkanes, spanning from C7 to C40, under identical GC-MS parameters applied to the milk samples, employing the equation below:
RI=100×(n+ ti-tn/tn+1-tn)
The retention index (RI) was determined by comparing the elution duration of the specific volatile substance (ti) in the milk sample with the retention periods of reference alkanes. This determination factors in the carbon chain length (n) of the alkanes, where tn and tn + 1 represent the elution durations of alkanes containing n and n + 1 carbon atoms, respectively. This method enables the calculation of the retention index for each volatile compound based on its elution pattern relative to the alkanes.
VOCs were identified with the help of the NIST 14 spectral database and the Shimadzu Flavor Component database. The relative abundance of each VOC was estimated through semi-quantitative analysis with an internal standard, applying the following formula:
Cx=Ci/Ai ×Ax
In this approach, Cx and Ax denote the relative quantity and chromatographic signal strength of a VOC, respectively, whereas Ci and Ai refer to the quantity and chromatographic signal intensity of the internal standard, 2-methyl-3-heptanone.
2.4. Quantitative Descriptive Analysis (QDA)
The sensory qualities of the milk specimens were analyzed through Quantitative Descriptive Analysis (QDA), adhering to the process outlined by [29]. A trained panel consisting of eight participants (two males and six females, aged 18 to 27) from Beijing Technology and Business University was selected for the assessment. Before participating, all individuals reviewed and understood the study's aims, methodology, possible risks, and advantages, and gave their informed consent. The panelists assessed five aroma attributes: milky, fatty, cooked, oxidized, and grassy, across eight different sample types. These included both unheated and thermally processed samples (heated at 80 °C for 30 min), which were: WM Control, WM Heated, WM+MPC Control, WM+MPC Heated, WM+WPI Control, WM+WPI Heated, WM+MPC+WPI Control, and WM+MPC+WPI Heated.
Following thermal treatment at 80 °C for 30 min, the specimens were swiftly reduced to 25 °C in a chilled water bath, with continuous agitation for 5 min. Following this, the samples were permitted to stabilize for 30 min at 25 °C before sensory evaluation. Each sample, both heated (cooled) and unheated, was evaluated in 10 mL aliquots served in odorless, sealed glass vials under controlled lighting conditions. The aroma intensity was rated using an unstructured line scale ranging from 0 to 15 points, with “none” on the left and “strong” on the right.
After the assessment, the panel reached an agreement on the sensory characteristics of each sample, defining terms and reference points for each aroma attribute as outlined in Table S1. The sensory evaluation process was carried out based on a predefined set of sensory descriptors, with all participants well-acquainted with the terminology and intensity scales employed in the analysis.
2.5. Statistical Analysis
Each trial was conducted in three replications for every sample, and the outcomes were expressed as the average ± standard deviation to ensure consistency and reliability. Data were meticulously documented, with initial computations carried out using Microsoft Excel 2025 (Microsoft, Redmond, WA, USA). Statistical analyses were conducted using a two-way analysis of variance (ANOVA) in SPSS 27.0 software (SPSS Inc., Chicago, IL, USA), with a significance threshold established at p < 0.05. To visually illustrate the data, bar charts, radar diagrams, and correlation graphs were generated using Origin 2025 (Origin Lab Corporation, Northampton, MA, USA). Principal Component Analysis (PCA) was conducted using the SIMCA 14.1.0 software (Umetrics AB, Umeå, Sweden) to assess data patterns and reduce dimensionality. For heatmap and advanced clustering analysis, ChiPlot (https://www.chiplot.online/, accessed on 6 September 2025) was utilized. Additionally, XLSTAT software (version 2019.2.2, Addinsoft, New York, NY, USA) was used for partial least squares regression (PLSR). to explore the relationships between the variables.
3. Results and Discussion
3.1. Sample Composition and Protein Profile (Gel Electrophoresis)
3.1.1. Effects of Different Protein Compositions
SDS-PAGE could indicate native (non-denatured) and denatured proteins, detect hydrophobic aggregates (primarily derived from unfolded whey proteins), and identify components of disulfide-bonded aggregates [30]. Evaluation carried out under both reductive and non-reductive conditions showed distinct protein profiles among the four sample groups (WM, WM+MPC, WM+WPI, WM+MPC+WPI), primarily driven by their varying compositions shown in Figure 1. The WM sample displayed distinct bands corresponding to both casein (αs1-, αs2-, β-, κ-caseins) and whey proteins (β-Lg, α-La, LF), with casein bands showing higher intensity, which aligns with the anticipated 78:22 casein-to-whey protein ratio in bovine milk. The reducing SDS-PAGE analysis (Figure 1A, 1B) revealed distinct protein patterns for samples WM, WM+MPC, WM+WPI, and WM+MPC+WPI under varying heating duration (0, 5, 10, and 30 min at 80 °C). For sample WM (Figure 1A, lanes 2–5), the unheated control (lane 2) displayed intact protein bands, while heated samples (lanes 3–5) revealed progressive fragmentation or aggregation, as indicated by the emergence of species with greater molecular mass and the development of distinct protein clusters as heating time increased. Similar trends were observed for WM+MPC. Prominent casein bands were observed in sample WM+MPC, reflecting MPC’s high casein content, (Figure 1A, lanes 6–9) and WM+WPI (Figure 1B, lanes 2–5), though the presence of MPC or WPI appeared to modulate the extent of protein degradation. The combination of MPC and WPI (sample WM+MPC+WPI; Figure 1B, lanes 6–9) exhibited intermediate behavior, suggesting potential interactions between MPC and WPI that influenced protein stability under heat stress.
In non-reducing conditions (Figure 1C,D), the protein profiles differed notably from those observed under reducing conditions, highlighting the role of disulfide bonds in protein aggregation or stabilization, casein further formed large aggregates, a characteristic of casein’s tendency to associate in the absence of reducing agents. For WM (Figure 1C, lanes 2–5), the unheated control (lane 2) showed minimal aggregation, while heated samples (lanes 3–5) exhibited increased high-molecular-weight aggregates, indicative of heat-induced cross-linking. The addition of 4% MPC (Figure 1D, lanes 6–9) or 4% WPI (lanes 2–5 in panel B) altered the aggregation patterns, with MPC potentially promoting larger aggregates and WPI stabilizing certain protein fractions. The milk protein bands (β-Lg, α-La, LF) displayed reduced intensity in the whole milk (WM) sample compared to the WM+WPI sample. The WM+WPI sample displayed more pronounced whey protein bands (β-Lg, α-La, LF) under both reductive and non-reductive conditions, further confirming the role of WPI in enhancing the whey protein content. Sample WM+MPC+WPI displayed an intermediate profile in both conditions: casein bands (from MPC) and whey protein bands (from WPI) were present at intensities between those of WM+MPC and WM+WPI. This confirmed the relative contributions of MPC (rich in casein) and WPI (rich in whey proteins) to the mixture. Sample WM+MPC+WPI (Figure 1D, lanes 6–9) demonstrated a complex interplay between the two additives, resulting in a different aggregation profile. These results emphasize the impact of heat exposure time and additive composition on protein behavior under non-reducing conditions. In non-reducing conditions, β-Lg appeared as dimers (~36 kDa) due to preserved disulfide bonds, with no detectable casein contamination, aligning with WPI’s high whey protein purity [31].
Under reducing conditions, partial recovery of β-Lg bands indicated additional non-covalent aggregation mechanisms [32]. MPC fortification attenuated β-Lg aggregation, suggesting caseins exert a protective chaperone-like effect [14], whereas WPI-fortified samples showed more pronounced high-molecular-weight aggregates due to their higher β-Lg content. The WM+MPC+WPI mixture demonstrated intermediate behavior, indicating interactions between caseins and whey proteins. These findings demonstrate that β-Lg is the primary driver of heat-induced aggregation, caseins mitigate this process, and α-La shows intermediate thermal resilience, underscoring the combined roles of protein composition and heating time in governing stability of fortified milk systems.
3.1.2. HPLC Analysis of Whey Proteins
Table 4 shows heat treatment significantly increased lactoferrin concentration in the heated whole milk sample (WM-H; 0.451 mg mL-1) compared to the non-heated whole milk control (WM; 0.096 mg mL-1) (P < 0.05), suggesting that lactoferrin was released or stabilized by heat treatment, as previously reported by [33]. In contrast, the β-lactoglobulin content was markedly decreased (P < 0.05) in the heated whole milk sample (WM-H; 0.014 mg mL-1) compared to the non-heated whole milk (WM; 0.034 mg mL-1), possibly due to heat-induced aggregation or degradation. The incorporation of MPC or WPI significantly elevated (P < 0.05) the β-lactoglobulin composition in dairy samples relative to the WM sample, with values of 2.011 and 6.469 mg mL-1, respectively. However, heating caused a notable decrease (P < 0.05) in the β-lactoglobulin content of the heated WPI-fortified whole milk sample (WM+WPI-H; 5.193 mg mL-1) compared to the unheated WPI-fortified whole milk (WM+WPI). The sample fortified with 4% WPI (WM+WPI) exhibited significantly higher (P < 0.05) concentrations of all three protein forms (α-lactalbumin, β-lactoglobulin, and lactoferrin) compared with all other fortified samples, highlighting the ability of WPI to mitigate whey protein loss during thermal treatment. The fortified sample containing both milk protein concentrate (MPC) and whey protein isolate (WPI), referred to as WM+MPC+WPI, exhibited intermediate protein concentrations, were notably reduced (P < 0.05) compared to those measured in the WPI-fortified whole milk (WM+WPI) but higher than the MPC-fortified whole milk (WM+MPC), suggesting possible synergistic or competitive interactions between the added proteins under thermal stress. Overall, these findings demonstrate the temperature- and concentration-dependent behavior of whey protein retention in fortified milk systems.
To further explore the molecular mechanisms underlying the compositional variations, size-exclusion chromatography coupled with high-performance liquid chromatography (SEC-HPLC) was employed. Native WM exhibited low α-lactalbumin (α-La) and β-lactoglobulin (β-Lg) content, with well-defined monomer peaks, consistent with established benchmarks for bovine milk [34]. In contrast, the formulations fortified with MPC and WPI exhibited large aggregates that eluted at the void volume, alongside smaller soluble complexes, suggesting the simultaneous presence of both denatured and native whey protein components. It was observed that 80 °C thermal treatment caused a significant loss of soluble β-Lg in WPI-supplemented milk (≈20% reduction), in accordance with its high thermal susceptibility [35], while α-La was relatively resistant (< 12% reduction), most probably because of its disulfide-stabilized tertiary structure [36]. Lactoferrin exhibited matrix-dependent behavior, meaning its antioxidant activity varied based on the protein composition and structure of the milk matrix, influencing its stability and function under different fortification conditions. Its concentration was higher in heated whole milk (WM), likely due to dissociation from natural casein–lactoferrin complexes present in the milk matrix, and lower in fortified systems, suggesting co-aggregation with denatured β-lactoglobulin during heating [37]. Overall, these chromatographic and compositional patterns indicate that the resilience of whey protein is profoundly influenced by both the fortification method and the thermal treatment applied.
Consistent patterns in the behavior of heat-induced proteins across samples were found by the combined SDS-PAGE and HPLC analyses. Although the mechanisms were different, both methods showed that heating (30 min at 80 °C) significantly altered protein profiles: HPLC measured changes in particular whey protein concentrations, while SDS-PAGE emphasized aggregation (non-reducing) or fragmentation (reducing). The decrease in β-lactoglobulin levels detected by HPLC in heated WM (WM-H), for example, matched the findings of SDS-PAGE, where smearing or band disappearance indicated heat-induced degradation. On the other hand, high-molecular-weight aggregates in non-reducing SDS-PAGE were associated with the increased lactoferrin content in WM-H (HPLC), suggesting heat-stabilized complexes. The additives MPC and WPI modulated these effects similarly in both analyses; MPC promoted aggregation, which was consistent with its intermediate HPLC protein retention, while WPI's dominance in preserving β-lactoglobulin (HPLC) paralleled its role in maintaining distinct protein bands (SDS-PAGE). Notably, their intermediate HPLC concentrations were reflected in the synergistic effects of MPC+WPI in SDS-PAGE (e.g., distinct banding patterns), indicating balanced protein interactions. All of these findings highlight how important heating time and additive makeup are for protein stability, with WPI providing better defense against heat deterioration than MPC or both.
3.2. Analysis and Identification of the Volatile Organic Compounds (VOCs)
The VOCs in milk subjected were examined under various heat treatments both qualitatively and quantitatively using HS-SPME-arrow-GC-MS. The examination identified alcohols, aldehydes, acids, esters, and ketones among the volatiles in the milk powder constituents, with these substances contributing notably to the overall fragrance. In total of 45 VOCs were found based on the flavor compounds associated with milk. These compounds were chosen for principal component analysis (PCA) based on prior reports [38]. These compounds included seven alcohols, seven aldehydes, eight acids, three esters, seven ketones, and fourteen other compounds (Table S2). Sulfur-containing compounds have a considerable impact on the flavor profile of dairy products and are frequently linked to its cooked flavor [39]. Dimethyl trisulfide (DMTS) and dimethyl sulfone (DMSO₂), two sulfur compounds, were found in the samples. Strong "rotten cabbage" off-flavors are produced by DMTS, which is produced by the microbial or thermal breakdown of sulfur-containing amino acids (such as methionine/cysteine). On the other hand, the oxidation product of dimethyl sulfide (DMS), dimethyl sulfone (DMSO₂), adds disagreeable "burnt" notes. Divergent sulfur volatile pathways in the samples are highlighted by DMTS, which indicates protein degradation or microbial activity, whereas DMSO₂ is formed by abiotic oxidation [40]. Using GC/MS and descriptive sensory analysis, our study has investigated the flavor of the constituents. These methods provide an effective approach to identifying the compounds in the constituents that contribute to aroma. Numerous compounds have been detected in prior research employing analytical techniques [41]. The range of the total VOC content was 9.40 μg kg-1 to 19.83 μg kg-1.
Different volatile profiles for each sample group were found by the analysis, indicating variations in their composition. In line with the main fat oxidation pathways found in bovine milk systems, whole milk (WM) had higher levels of lipid-derived aldehydes (hexanal, nonanal) and short-chain acids (butanoic acid) [42]. This profile changed with protein fortification: WM+MPC showed sulfur compounds (dimethyl trisulfide), which corresponded to the heat-induced degradation of sulfur-containing amino acids in caseins [43], whereas WM+WPI had higher ketones (2-heptanone), which were indicative of the breakdown of whey protein β-lactoglobulin [44]. As seen in mixed-protein dairy matrices, the blended WM+MPC+WPI group combined both protein-derived volatiles and showed intermediate characteristics [45]. These changes demonstrate how protein type affects flavor chemistry: WPI prefers ketonic compounds linked to creamy aromas [46], while MPC adds sulfurous notes associated with cooked off flavors [47]. All groups had persistent levels of 1-hexanol and 1-octanol, which suggests secondary oxidation processes [48]. With MPC and WPI each posing distinct challenges (sulfur vs. ketone formation) that need to be managed through customized processing to maximize sensory quality in fortified dairy products, the results highlight how important protein selection is for flavor stability.
SPME found volatiles like straight-chain aldehydes that come from lipid oxidation (unsaturated fatty acids). These volatiles distributes smells that are "grassy," "fatty," or "rancid" (hexanal, octanal, decanal, and nonanal) [49]. Aldehydes were the most prevalent volatile compounds found in WM, with their levels decreasing upon the addition of protein, likely due to the dilution of fat content [50]. Strecker aldehydes are made when amino acids break down in the Maillard reaction, which is responsible for "malty," "nutty," or "burnt" notes (benzaldehyde and benzenecacetaldehyde) [51]. Such compounds have been recognized in whey and dairy protein products and are linked to protein degradation (e.g., Strecker aldehydes) and lipid oxidation (e.g., straight-chain aldehydes), often correlating with off-flavors such as cardboard or rancidity [52,53,54,55]. Protein fortification using MPC or WPI usually increases the levels of Strecker aldehydes, such as 3-methylbutanal derived from leucine; however, none were detected in this study [56]. In contrast, straight-chain aldehydes resulting from lipid oxidation, compounds like hexanal and nonanal were the primary volatile substances found in all milk samples [57]. This suggests that lipid oxidation, rather than protein degradation, was the primary pathway for volatile formation under the applied thermal processing conditions. According to [41,58,59], straight-chain aldehydes are the primary volatiles produced through lipid oxidation. In this study, lipid oxidation products (e.g., hexanal, nonanal) were the predominant volatiles, indicating that protein degradation had a negligible impact under the present processing conditions. These volatile compound profiles align with the sensory descriptive results, further demonstrating that spray drying negatively impacts flavor (Figure PCA of volatile and sensory).
Figure 2A and B show that the VOC profiles were different in each sample when the histograms were stacked. About 45% of alcohols, 15% of aldehydes and acids, and about 5-10% of ketones, esters, and other compounds were found in unheated WM. This profile shows lipid oxidation activity in WM took place before heat treatment. Heating increased the relative abundance of acids for all samples, which became the most common type in many heated samples (for example, it peaked at about 40% in WM+WPI-H). Ketones were more noticeable in heated samples with WPI, but less so in heated samples with MPC. The mixed WM+MPC+WPI-H had a more balanced and complex VOC distribution, which means that the combined protein system changed how thermal degradation happened. The absolute VOC content (μg kg-1) increased with heating and fortification, peaking in the blended protein sample. This backs up the idea that when protein additives are heated, they change the volatile profiles from native lipid oxidation products to protein-derived compounds.
Principal component analysis (PCA) was employed to evaluate the variations in VOCs across the sample groups (Figure 2C). The first two principal axes (PC1 and PC2) accounted for 44.8% of the overall variability (PC1: 28.8%; PC2: 16.0%), revealing distinct clustering patterns in the distribution of flavor compounds, where heated samples were separated from unheated ones, and protein-fortified samples (WM+MPC, WM+WPI, and WM+MPC+WPI) were differentiated based on their compositional profiles. The unheated control (WM) formed a distinct cluster from all heated samples, indicating substantial thermally induced alterations in VOC profiles. Heated samples were separated along PC2, with WM+MPC-H and WM+WPI-H forming separate sub-groups. This suggests that heating changes proteins in a specific way. The WM+MPC+WPI-H group was in the middle of the WM+MPC and WM+WPI samples. This shows that the two proteins worked together to change the release of volatile compounds. These groupings are in line with the heatmap results, which showed that samples added MPC had more aldehydes and samples added WPI had more Maillard-derived compounds.
The cluster heatmap showed that the sample groups had different volatile organic compound (VOC) profiles (Figure 2D). In line with previous thermal reaction research in dairy systems [42,60], the unheated WM control group, characterized by minimal VOC levels, formed a distinct cluster apart from the heated samples, establishing an anticipated baseline. The elevated concentrations of aldehydes and acids derived from lipids. (such as hexanal, nonanal, and butanoic acid) observed in all heated samples are well-established indicators of lipid oxidation induced by heat, as described in detail by [48]. There were also effects that were specific to proteins. [43] showed that casein can actively change lipid oxidation pathways. This is in line with the subclustering of WM+ 4% MPC-H samples, which kept more aldehydes. On the other hand, the increase in sulfur-containing compounds (like dimethyl trisulfide) and furans (like furfural) in the WM+WPI-H group is in line with what is known about β-lactoglobulin's role in promoting Maillard and Strecker degradation reactions [61,62]. The intermediate VOC profile of the WM+MPC+WPI-H group indicates synergistic interactions between casein and whey proteins upon heating, corroborating the hypothesis put forth by [45] that competitive protein reactions may transpire in complex dairy matrices, thereby moderating overall volatile release. These observations, consistent with the outcomes of the PCA analysis, show that the difference between sample groups is caused by volatiles whose formation pathways are well known. However, the way protein combinations change them gives us new information.
3.3. Sensory Characteristics
The milky, dairy fat, cooked, oxidized, and grassy scents of all milk specimens were assessed to investigate the alterations in taste triggered by thermal processing (80 °C, 30 min) and protein fortification (MPC, WPI). The radar plot (Figure 3) showed different aroma profiles of the samples.
All milk samples exhibited distinct aroma profiles (Table 5). The unheated whole milk sample (WM Control) showed the strongest milky aroma (~8.19), consistent with expectations for an unprocessed milk matrix [63]. However, heat treatment at 80 °C for 30 min decreased the milky aroma by 20–30%, likely due to the degradation of volatiles [64]. The heated WPI-fortified whole milk (WM+WPI Heated) exhibited the strongest cooked aroma (~8.75), which is probably due to sulfur-containing compounds such as dimethyl sulfide released during whey protein denaturation [61]. The heated milk sample fortified with both MPC and WPI (WM+MPC+WPI Heated) displayed the most pronounced dairy fat aroma (~9.63), likely resulting from heat-induced protein–lipid interactions that enhance flavor richness [65].
Conversely, oxidized and grassy aroma notes were relatively low in all heated samples (oxidized: 4.50–8.50; grassy: 2.44–4.75), indicating that thermal treatment at 80 °C for 30 min (moderate heating) did not promote extensive lipid oxidation. In contrast, previous studies have shown that higher-temperature treatments (> 120 °C, high heating) can substantially increase these off-flavor compounds [66]. In conclusion, these findings suggest that thermal processing exerts a greater influence on the aroma profiles of milk than the inherent composition of raw milk, while protein fortification can specifically modify certain flavor attributes.
3.4. Correlation Analysis
The Partial Least Squares Regression (PLS-R) correlation loading plot (Figure 4) revealed two distinct groups of aroma profiles: samples that underwent moderate thermal treatment (80 °C for 30 min) and were fortified with additional proteins (e.g., WM+MPC+WPI) exhibited fresh, dairy-like sensory attributes, including milky and grassy aromas. Those traits are strongly correlated with volatile alcohols and ketones like 1-hexanol, 1-pentanol, and 2-heptanone. These compounds are associated with creamy or green notes, with 2-heptanone being particularly prevalent in fermented dairy systems [44]. In contrast, samples subjected to heat treatment (WM-H, WM+WPI-H) fit the description of cooked or oxidized foods and are mostly made up of aldehydes (like nonanal and decanal) and Maillard-derived furans (like furfural), which is a sign of thermal degradation in milk [67]. Whey proteins also change how flavors are released because they can hold onto aromas well [46]. This could help keep fresh notes in samples with a lot of protein. Overall, these results emphasize the impact of protein composition and thermal treatment on the sensory attributes of dairy.
Correlation analysis (Figure 5) indicated a positive association (P < 0.05) between the denaturation of α-LA and β-LG and lipid-derived alcohols and ketones (1-heptanol, 2-heptanone). This suggests that the unfolding of whey protein facilitates the formation of compounds responsible for grassy and creamy notes. This result is consistent with known mechanisms of lipid oxidation and fermentation associated with dairy proteins [42,61]. There were strong positive correlations between whey protein denaturation and furfural/benzaldehyde which indicates that the unfolding of protein ease, Maillard and Strecker degradation pathways. This aligns with the established function of whey proteins, especially their reactive amino acids, as principal precursors to thermal reaction volatiles [62,67]. On the other hand, the denaturation of lactoferrin (LF) was negatively correlated with aldehydes like hexanal and octanal, which suggests that LF has a protective, antioxidant effect that stops lipid oxidation. This corroborates the suggested mechanism by which LF's iron-chelating activity inhibits pro-oxidant metal catalysis [68,69]. These findings collectively illustrate that protein-specific conformational alterations during processing are a principal factor influencing the volatile complex dairy matrices [65].
4. Conclusion
This research examined the impact of thermal treatment (80 °C for 30 min) and protein enrichment (MPC and WPI) on the structural alterations of whey proteins, the formation of volatile compounds, and the sensory characteristics of dairy products. Following heating, the structural denaturation of β-lactoglobulin and α-lactalbumin was significantly promoted across all treatments, with protein fortification modulating these changes. Specifically, MPC fortification enhanced the formation of sulfur-containing compounds and aldehydes, while WPI fortification favored the generation of ketones and Maillard-derived volatiles. Sensory analysis indicated that WPI-fortified samples exhibited stronger cooked and dairy fat aromas, while unfortified milk retained milky and grassy notes. Correlation analysis further highlighted the mechanistic links between protein denaturation and lipid-derived compounds. These findings demonstrate that the type and composition of protein fortification, particularly through the strategic blending of MPC and WPI, significantly influence volatile profiles, mitigate off-flavors, and provide a practical approach for designing thermally stable, protein-enriched dairy products with optimized sensory quality.
Author Contributions
Conceptualization, Y.Z. and B.W.; methodology, B.L.; software, J.Y.; validation, J.Y., Y.W. and Y.Z.; formal analysis, J.Y.; investigation, J.Y.; resources, B.W.; data curation, J.Y., Y.W. and X.W.; writing—original draft preparation, J.Y.; writing—review and editing, B.L., F.M. and Y.Z.; visualization, Y.W.; supervision, F.M. and B.W.; project administration, Y.Z.; funding acquisition, Y.Z. All authors have read and agreed to the published version of the manuscript.
Funding
This research was funded by Beijing Technology and Business University Horizontal Project, grant number 2024085. The APC was funded by Beijing Technology and Business University Horizontal Project.
Institutional Review Board Statement
This research program was approved by the Science Research Ethics Committee of Beijing Technology and Business University. Approval Code: No. (64) 2024. Approval Date: 20 February 2024.
Informed Consent Statement
Informed consent for participation was obtained from all subjects involved in the study.
Data Availability Statement
The original contributions presented in this study are included in the article/Supplementary Materials; further inquiries can be directed to the corresponding author.
Acknowledgments
The authors would like to express their gratitude to the School of Food and Health, Beijing Technology and Business University for providing laboratory facilities and instrumentation support. Special thanks are extended to the 8 participants who volunteered for the sensory evaluation experiment. We also appreciate the administrative support provided by the editorial team of MDPI Dairy during the submission process.
Conflicts of Interest
Dr. Bozhao Li is affiliated with a commercial company, but the company had no role in the design of the study; in the collection, analyses, or interpretation of data; in the writing of the manuscript; or in the decision to publish the results. The other authors declare no conflicts of interest.
References
- Walstra, P.; Lagrange, B.C. Global market for dairy proteins. J. Food Sci. 2015, 80, A16–A22. [Google Scholar] [CrossRef] [PubMed]
- Nagpal, R.; Behare, P.V.; Rana, R.; Kumar, A.; Kumar, M.; Arora, S.; Yadav, H. Bioactive peptides derived from milk proteins and their health beneficial potentials: An update. Food Funct. 2011, 2, 18–27. [Google Scholar] [CrossRef] [PubMed]
- Fickak, A.; Delaplace, G.; Andrieu, J.; Ronse, G. Effect of whey protein concentration on the fouling and cleaning of a heat transfer surface. J. Food Eng. 2011, 104, 323–331. [Google Scholar] [CrossRef]
- Smithers, G.W. Whey and whey proteins—From “gutter-to-gold”. Int. Dairy J. 2008, 18, 695–704. [Google Scholar] [CrossRef]
- Eshpari, H.T.; Perrechil, F.A.; Cunha, R.L. Changes in the physical properties, solubility, and heat stability of milk protein concentrates prepared from partially acidified milk. J. Dairy Sci. 2014, 97, 7394–7401. [Google Scholar] [CrossRef]
- Newstead, D.F.; Brown, A.A. The effects of heat treatment and pH on the heat stability of recombined evaporated milk. N. Z. J. Dairy Sci. Technol. 1975, 10, 113–118. [Google Scholar]
- Kessler, H.G.; Beyer, H.J. Thermal denaturation of whey proteins and its effect in dairy technology. Int. J. Biol. Macromol. 1991, 13, 165–173. [Google Scholar] [CrossRef]
- Cheng, L.J.; McCarthy, O.J. Viscosity of sweetened condensed milk concentrates: Effects of preheat treatment applied during powder manufacture. Aust. J. Dairy Technol. 2000, 55, 115–118. [Google Scholar]
- Krishna, T.C.; Najda, A.; Bains, A.; Tosif, M. M.; Papliński, R.; Kapłan, M.; Chawla, P. Influence of ultra heat treatment on properties of milk proteins. Polymers 2021, 13, 3164. [Google Scholar] [CrossRef]
- Singh, H.; Creamer, L.K. Denaturation, aggregation and heat stability of milk proteins during the manufacture of skim milk powder. J. Dairy Res. 1991, 58, 269–283. [Google Scholar] [CrossRef]
- Murphy, E.G.; Tobin, J.T.; Roos, Y.H.; Fenelon, M.A. A high-solids steam injection process for the manufacture of powdered infant milk formula. Food Bioprocess Technol. 2013, 6, 463–475. [Google Scholar] [CrossRef]
- Singh, H.; Havea, P. Thermal denaturation, aggregation and gelation of whey proteins. In Advanced Dairy Chemistry—1: Proteins; Fox, P.F., McSweeney, P.L.H., Eds.; Springer: New York, NY, USA, 2003; pp. 1261–1287. [Google Scholar]
- Walstra, P.; Jenness, R. Dairy Chemistry & Physics, 1st ed.; John Wiley & Sons: New York, NY, USA, 1984; p. xviii + 467. [Google Scholar]
- Havea, P.; Singh, H.; Creamer, L.K. Characterization of heat-induced aggregates of β-lactoglobulin, α-lactalbumin, and bovine serum albumin in a whey protein concentrate environment. J. Dairy Res. 2001, 68, 483–497. [Google Scholar] [CrossRef]
- Hong, Y.H.; Creamer, L.K. Changed protein structures of bovine β-lactoglobulin B and α-lactalbumin as a consequence of heat treatment. Int. Dairy J. 2002, 12, 345–359. [Google Scholar]
- Wijayanti, H.B.; Bansal, N.; Deeth, H.C. Stability of whey proteins during thermal processing: A review. Compr. Rev. Food Sci. Food Saf. 2014, 13, 1235–1251. [Google Scholar] [CrossRef]
- Zúñiga, R.N.; Tabilo-Munizaga, G.; Vega-Gálvez, A.; Miranda, M.; Pérez-Won, M. Kinetics of formation and physicochemical characterization of thermally induced β-lactoglobulin aggregates. J. Food Sci. 2010, 75, E261–E268. [Google Scholar] [PubMed]
- Law, A.J.R.; Leaver, J. Effect of protein concentration on rates of thermal denaturation of whey proteins in milk. J. Agric. Food Chem. 1997, 45, 4255–4261. [Google Scholar] [CrossRef]
- Huppertz, T.; Kelly, A.L. Advances in milk protein ingredients. In Innovations in Healthy and Functional Foods; Taylor & Francis Group: Boca Raton, FL, USA, 2012; pp. 363–389. [Google Scholar]
- Chandan, R.C. Dairy ingredients for food processing: An overview. In Dairy Ingredients for Food Processing; Wiley-Blackwell: Ames, IA, USA, 2011; pp. 3–33. [Google Scholar]
- Carr, A. J. The Functional Properties of Milk Protein Concentrates. Ph.D. Thesis, Massey University, Palmerston North, New Zealand, 1999. Available online: http://mro.massey.ac.nz/bitstream/handle/10179/2460/02_whole.pdf?sequence=1&isAllowed=y.
- Crowley, S.V.; Megemont, M.; Gazi, I.; Kelly, A.L.; Huppertz, T.; O’Mahony, J.A. Heat stability of reconstituted milk protein concentrate powders. Int. Dairy J. 2014, 37, 104–110. [Google Scholar] [CrossRef]
- Masters, K. Spray Drying Handbook, 4th ed.; Godwin: London, 1985. [Google Scholar]
- Quach, M.L.; Clapperton, J.; Fanning, S.; Rasmussen, J. Headspace sampling of whey protein concentrate solutions using solid-phase microextraction. Food Res. Int. 1999, 31, 371–379. [Google Scholar] [CrossRef]
- Davis, J.P.; Foegeding, E.A. Comparisons of the foaming and interfacial properties of whey protein isolate and egg white proteins. Colloids Surf. B Biointerfaces. 2007, 54, 200–210. [Google Scholar] [CrossRef]
- Morr, C.V.; Ha, E.Y.W. Whey Protein Concentrates and Isolates: Processing and Functional Properties. Crit. Rev. Food Sci. Nutr. 1993, 33, 431–476. [Google Scholar] [CrossRef]
- Zenker, H.; Raupbach, J.; Boeren, S.; Wichers, H.; Hettinga, K. The effect of low vs. high temperature dry heating on solubility and digestibility of cow’s milk protein. Food Hydrocoll. 2020, 109, 106105. [Google Scholar] [CrossRef]
- Bordin, G.; Raposo, F.C.; de la Calle, B.; Rodríguez, A.R. Identification and quantification of major bovine milk proteins by liquid chromatography. J. Chromatogr. A 2001, 928, 63–76. [Google Scholar] [CrossRef]
- Silva, R.C.A.; Ferreira, J.F.; Alvarenga, T.A.; Mattos, M.C.; Rocha, R.S.; Pimentel, T.C.; Esmerino, E.A.; Freitas, M.Q.; Cruz, A.G. Quantitative descriptive analysis in sensory evaluation of dairy products. J. Sens. Stud. 2018, 33, e12408. [Google Scholar]
- Patel, H.A.; Singh, H.; Anema, S.G.; Creamer, L.K. Effects of heat and high hydrostatic pressure treatments on the aggregation of whey proteins in whey protein concentrate solutions. Food N. Z. 2004, 4, 29–35. [Google Scholar]
- Considine, T.P.; Patel, H.A.; Anema, S.G.; Singh, H.; Creamer, L.K. Interactions of milk proteins during heat and high hydrostatic pressure treatments—A review. Innov. Food Sci. Emerg. Technol. 2007, 8, 1–23. [Google Scholar] [CrossRef]
- Livney, Y.D.; Dalgleish, D.G. Specificity of disulfide bond formation during thermal aggregation in solutions of β-lactoglobulin B and κ-casein A. J. Agric. Food Chem. 2004, 52, 5527–5532. [Google Scholar] [CrossRef]
- Haas, J.K.; Bork, J.; Ziegler, G.R.; Chen, W.; Drake, M.A. Effects of high-temperature, short-time pasteurization on milk and whey during commercial whey protein concentrate production. J. Dairy Sci. 2025, 108, 257–271. [Google Scholar] [CrossRef] [PubMed]
- Farrell, H.M. J. R.; Jimenez-Flores, R.; Bleck, G.T.; Brown, E.M.; Butler, J.E.; Creamer, L.K.; Hicks, C.L.; Hollar, C.M.; Ng-Kwai-Hang, K.F.; Swaisgood, H.E. Nomenclature of the proteins of cows’ milk. J. Dairy Sci. 2004, 87, 1641–1674. [Google Scholar] [CrossRef]
- Elgar, D.F.; Norris, C.S.; Ayers, J.S.; Pritchard, M.; Otter, D.E.; Palmano, K.P. Simultaneous separation and quantitation of the major bovine whey proteins including proteose peptone and caseinomacropeptide by reversed-phase high-performance liquid chromatography. J. Chromatogr. A 2000, 878, 183–196. [Google Scholar] [CrossRef]
- Permyakov, S.E.; Berliner, L.J.; Permyakov, E.A. α-Lactalbumin: Structure and function. FEBS Lett. 2000, 473, 269–274. [Google Scholar] [CrossRef] [PubMed]
- Corredig, M.; Dalgleish, D.G. The mechanisms of the heat-induced interaction of whey proteins with casein micelles in milk. Int. Dairy J. 1999, 9, 233–236. [Google Scholar] [CrossRef]
- Cadwallader, K.R.; Drake, M.A. Flavours and off-flavours in milk and dairy products. In Advanced Dairy Chemistry: Volume 3—Lactose, Water, Salts and Minor Constituents; McSweeney, P.L.H., Fox, P.F., Eds.; Springer: New York, NY, USA, 2009; pp. 631–690. [Google Scholar]
- Huang, Y.; Cao, H.; Pan, M.; Wang, C.; Sun, B.; Ai, N. Unraveling volatilomics profiles of milk products from diverse regions in China. Food Res. Int. 2024, 179, 114000. [Google Scholar] [CrossRef] [PubMed]
- Goss, M.; Kroll, J.H. Chamber studies of OH + dimethyl sulfoxide and dimethyl disulfide: Insights into the dimethyl sulfide oxidation mechanism. Atmos. Chem. Phys. 2024, 24, 1299–1314. [Google Scholar] [CrossRef] [PubMed]
- Hall, G.; Andersson, J.; Lingnert, H.; Olofsson, B. Flavor Changes in Whole Milk Powder during Storage: The Kinetics of the Formation of Volatile Fat Oxidation Products and Other Volatile Compounds. J. Food Qual. 1985, 7, 153–190. [Google Scholar] [CrossRef]
- Contarini, G.; Povolo, M. Volatile Fraction of Milk: Comparison between Purge and Trap and Solid Phase Microextraction Techniques. J. Agric. Food Chem. 2002, 50, 7350–7355. [Google Scholar] [CrossRef]
- Guyomarc’h, F.; Famelart, M. H.; Henry, G.; Gulzar, M.; Leonil, J.; Hamon, P.; Croguennec, T. Current ways to modify the structure of whey proteins for improved functionality. Annu. Rev. Food Sci. Technol. 2022, 13, 1–29. [Google Scholar]
- Tan, C.; Tian, Y.; Tao, L.; Xie, J.; Wang, M.; Zhang, F.; Zhao, C. Exploring the Effect of Milk Fat on Fermented Milk Flavor Based on Gas Chromatography–Ion Mobility Spectrometry (GC-IMS) and Multivariate Statistical Analysis. Molecules 2024, 29, 1099. [Google Scholar] [CrossRef]
- Chen, Y.; McClements, D.J.; Peng, X.; Chen, L.; Xu, Z.; Meng, M.; Jin, Z. Research Progresses on Enzymatic Modification of Starch with 4-α-Glucanotransferase. Trends Food Sci. Technol. 2023, 131, 164–174. [Google Scholar] [CrossRef]
- Schädle, C.N.; Sanahuja, S.; Bader-Mittermaier, S. Influence of Fat Replacers on the Rheological, Tribological, and Aroma Release Properties of Reduced-Fat Emulsions. Foods 2022, 11, 820. [Google Scholar] [CrossRef]
- Jo, Y.; Carter, B.G.; Barbano, D.M.; Drake, M.A. Identification of the Source of Volatile Sulfur Compounds Produced in Milk during Thermal Processing. J. Dairy Sci. 2019, 102, 8658–8669. [Google Scholar] [CrossRef]
- Frankel, E.N. Lipid Oxidation. Prog. Lipid Res. 1980, 19, 1–22. [Google Scholar] [CrossRef] [PubMed]
- Wright, J.W. Characterization of cabbage off-flavor in whey protein isolate. J. Food Sci. 2006, 71, C86–C90. [Google Scholar] [CrossRef]
- Croissant, A. E.; Kang, E. J.; Campbell, R.E. The effect of bleaching agent on the flavor of liquid whey and whey protein concentrate. J. Dairy Sci. 2009, 92, 5917–5927. [Google Scholar] [CrossRef] [PubMed]
- Evans, J.; Zulewska, J.; Newbold, M.; Drake, M. A.; Barbano, D. M. Comparison of composition, sensory and volatile components of thirty-four percent whey protein and serum protein concentrates. J. Dairy Sci. 2009, 92, 4773–4791. [Google Scholar] [CrossRef] [PubMed]
- Whitson, M. E.; Miracle, R. E.; Drake, M.A. Sensory characterization of chemical components responsible for cardboard flavor in whey proteins. J. Sens. Stud. 2010, 25, 616–636. [Google Scholar] [CrossRef]
- Listiyani, M. A. D.; Campbell, R. E.; Miracle, R. E. Influence of bleaching on the flavor of 34% whey protein concentrate and residual benzoic acid concentration in dried whey proteins. J. Dairy Sci. 2011, 94, 4347–4359. [Google Scholar] [CrossRef]
- Jervis, S.; Campbell, R.; Wojciechowski, K. L. Effect of bleaching whey on sensory and functional properties of 80% whey protein concentrate. J. Dairy Sci. 2012, 95, 2848–2862. [Google Scholar] [CrossRef]
- Park, C. W.; Mark, A. S.; Drake, M. A. The effect of spray-drying parameters on the flavor of nonfat dry milk and milk protein concentrate 70%. J. Dairy Sci. 2016, 99, 9598–9610. [Google Scholar] [CrossRef]
- Smith, T. J.; Campbell, R. E.; Jo, Y.; Drake, M.A. Flavor and stability of milk proteins. J. Dairy Sci. 2016, 99, 4325–4346. [Google Scholar] [CrossRef]
- Lee, Y. B.; Laye, I.; Kim, Y. D.; Morr, C.V. Formation of volatile compounds in whey protein concentrate during elevated temperature storage as a function of water activity. Int. Dairy J. 1996, 6, 485–496. [Google Scholar] [CrossRef]
- Carunchia Whetstine, M. E.; Drake, M. A. The flavor and flavor stability of skim and whole milk powders. In Flavor of Dairy Products; ACS Publishing: Washington, D.C., 2007; pp. 217–251. [Google Scholar]
- Lloyd, M.A.; Hess, S.J.; Drake, M.A. Effect of Nitrogen Flushing and Storage Temperature on Flavor and Shelf-Life of Whole Milk Powder. J. Dairy Sci. 2009, 92, 2409–2422. [Google Scholar] [CrossRef] [PubMed]
- Yuan, N.; Chi, X.; Ye, Q.; Liu, H.; Zheng, N. Analysis of Volatile Organic Compounds in Milk during Heat Treatment Based on E-nose, E-tongue and HS-SPME-GC-MS. Foods 2023, 12, 1071. [Google Scholar]
- Tunick, M.H.; Iandola, S.K.; Van Hekken, D.L. Comparison of SPME Methods for Determining Volatile Compounds in Milk, Cheese, and Whey Powder. Foods 2013, 2, 534–543. [Google Scholar] [CrossRef] [PubMed]
- Lee, J.H.; Min, D.B. Changes of Headspace Volatiles in Milk with Riboflavin Photosensitization. J. Food Sci. 2009, 74, C563–C568. [Google Scholar] [CrossRef]
- Silva, H. L. A.; Balthazar, C. F.; Silva, R.; Vieira, A. H.; Costa, R. G. B.; Esmerino, E. A.; Freitas, M. Q.; Cruz, A.G. Sodium reduction and flavor enhancer addition in probiotic Prato cheese: Contributions of quantitative descriptive analysis and temporal dominance of sensations for sensory profiling. J. Dairy Sci. 2018, 101, 8837–8846. [Google Scholar] [CrossRef]
- Contarini, G.; Pavolo, M. Volatile fraction of milk: Comparison between purge and trap and solid phase microextraction. Dairy Sci. Technol. 2019, 99, 349–362. [Google Scholar] [CrossRef]
- Faulkner, H.; O'Callaghan, T.F.; McAuliffe, S.; Hennessy, D.; Stanton, C.; O'Sullivan, M.G.; Kilcawley, K.N. Effect of Different Forage Types on the Volatile and Sensory Properties of Bovine Milk. J. Dairy Sci. 2018, 101, 1034–1047. [Google Scholar] [CrossRef]
- Gaucher, I.; Mollé, D.; Gagnaire, V.; Gaucheron, F. Effects of Storage Temperature on Physico-Chemical Characteristics of Semi-Skimmed UHT Milk. Food Hydrocolloids 2008, 22, 130–143. [Google Scholar] [CrossRef]
- Contarini, G.; Povolo, M.; Leardi, R.; Toppino, P.M. Influence of Heat Treatment on the Volatile Compounds of Milk. J. Agric. Food Chem. 1997, 45, 3171–3177. [Google Scholar] [CrossRef]
- Shah, N.P. Effects of milk-derived bioactives: An overview. Br. J. Nutr. 2000, 84, S3–S10. [Google Scholar] [CrossRef]
- Addis, M.F.; Tedde, V.; Puggioni, G.M.G.; Pisanu, S.; Casula, A.; Locatelli, C.; Uzzau, S. Evaluation of Milk Cathelicidin for Detection of Bovine Mastitis. J. Dairy Sci. 2016, 99, 8250–8258. [Google Scholar] [CrossRef]
Figure 1.
SDS-PAGE under reducing (R) and non-reducing (NR) conditions. In Gel A (R), 1. MW Ladder, 2. WM, 3. H-WM (5 min), 4. H-WM (10 min), 5. H-WM (30 min), 6. WM + MPC, 7. H-WM + MPC (5 min), 8. H-WM + MPC (10 min), 9. H-WM + MPC (30 min). In Gel B (R), 1. MW Ladder, 2. H-WM + WPI, 3. H-WM + WPI (5 min), 4. H-WM + WPI (10 min), 5. H-WM + WPI (30 min), 6. H-WM + MPC + WPI, 7. H-WM + MPC + WPI (5 min), 8. H-WM + MPC + WPI (10 min), 9. H-WM + MPC + WPI (30 min). In Gel C (NR), 1. MW Ladder, 2. WM, 3. H-WM (5 min), 4. H-WM (10 min), 5. H-WM (30 min), 6. WM + MPC, 7. H-WM + MPC (5 min), 8. H-WM + MPC (10 min), 9. H-WM + MPC (30 min). In Gel D (NR), 1. MW Ladder, 2. H-WM + WPI, 3. H-WM + WPI (5 min), 4. H-WM + WPI (10 min), 5. H-WM + WPI (30 min), 6. H-WM + MPC + WPI, 7. H-WM + MPC + WPI (5 min), 8. H-WM + MPC + WPI (10 min), 9. H-WM + MPC + WPI (30 min). All heating was performed at 80 °C.
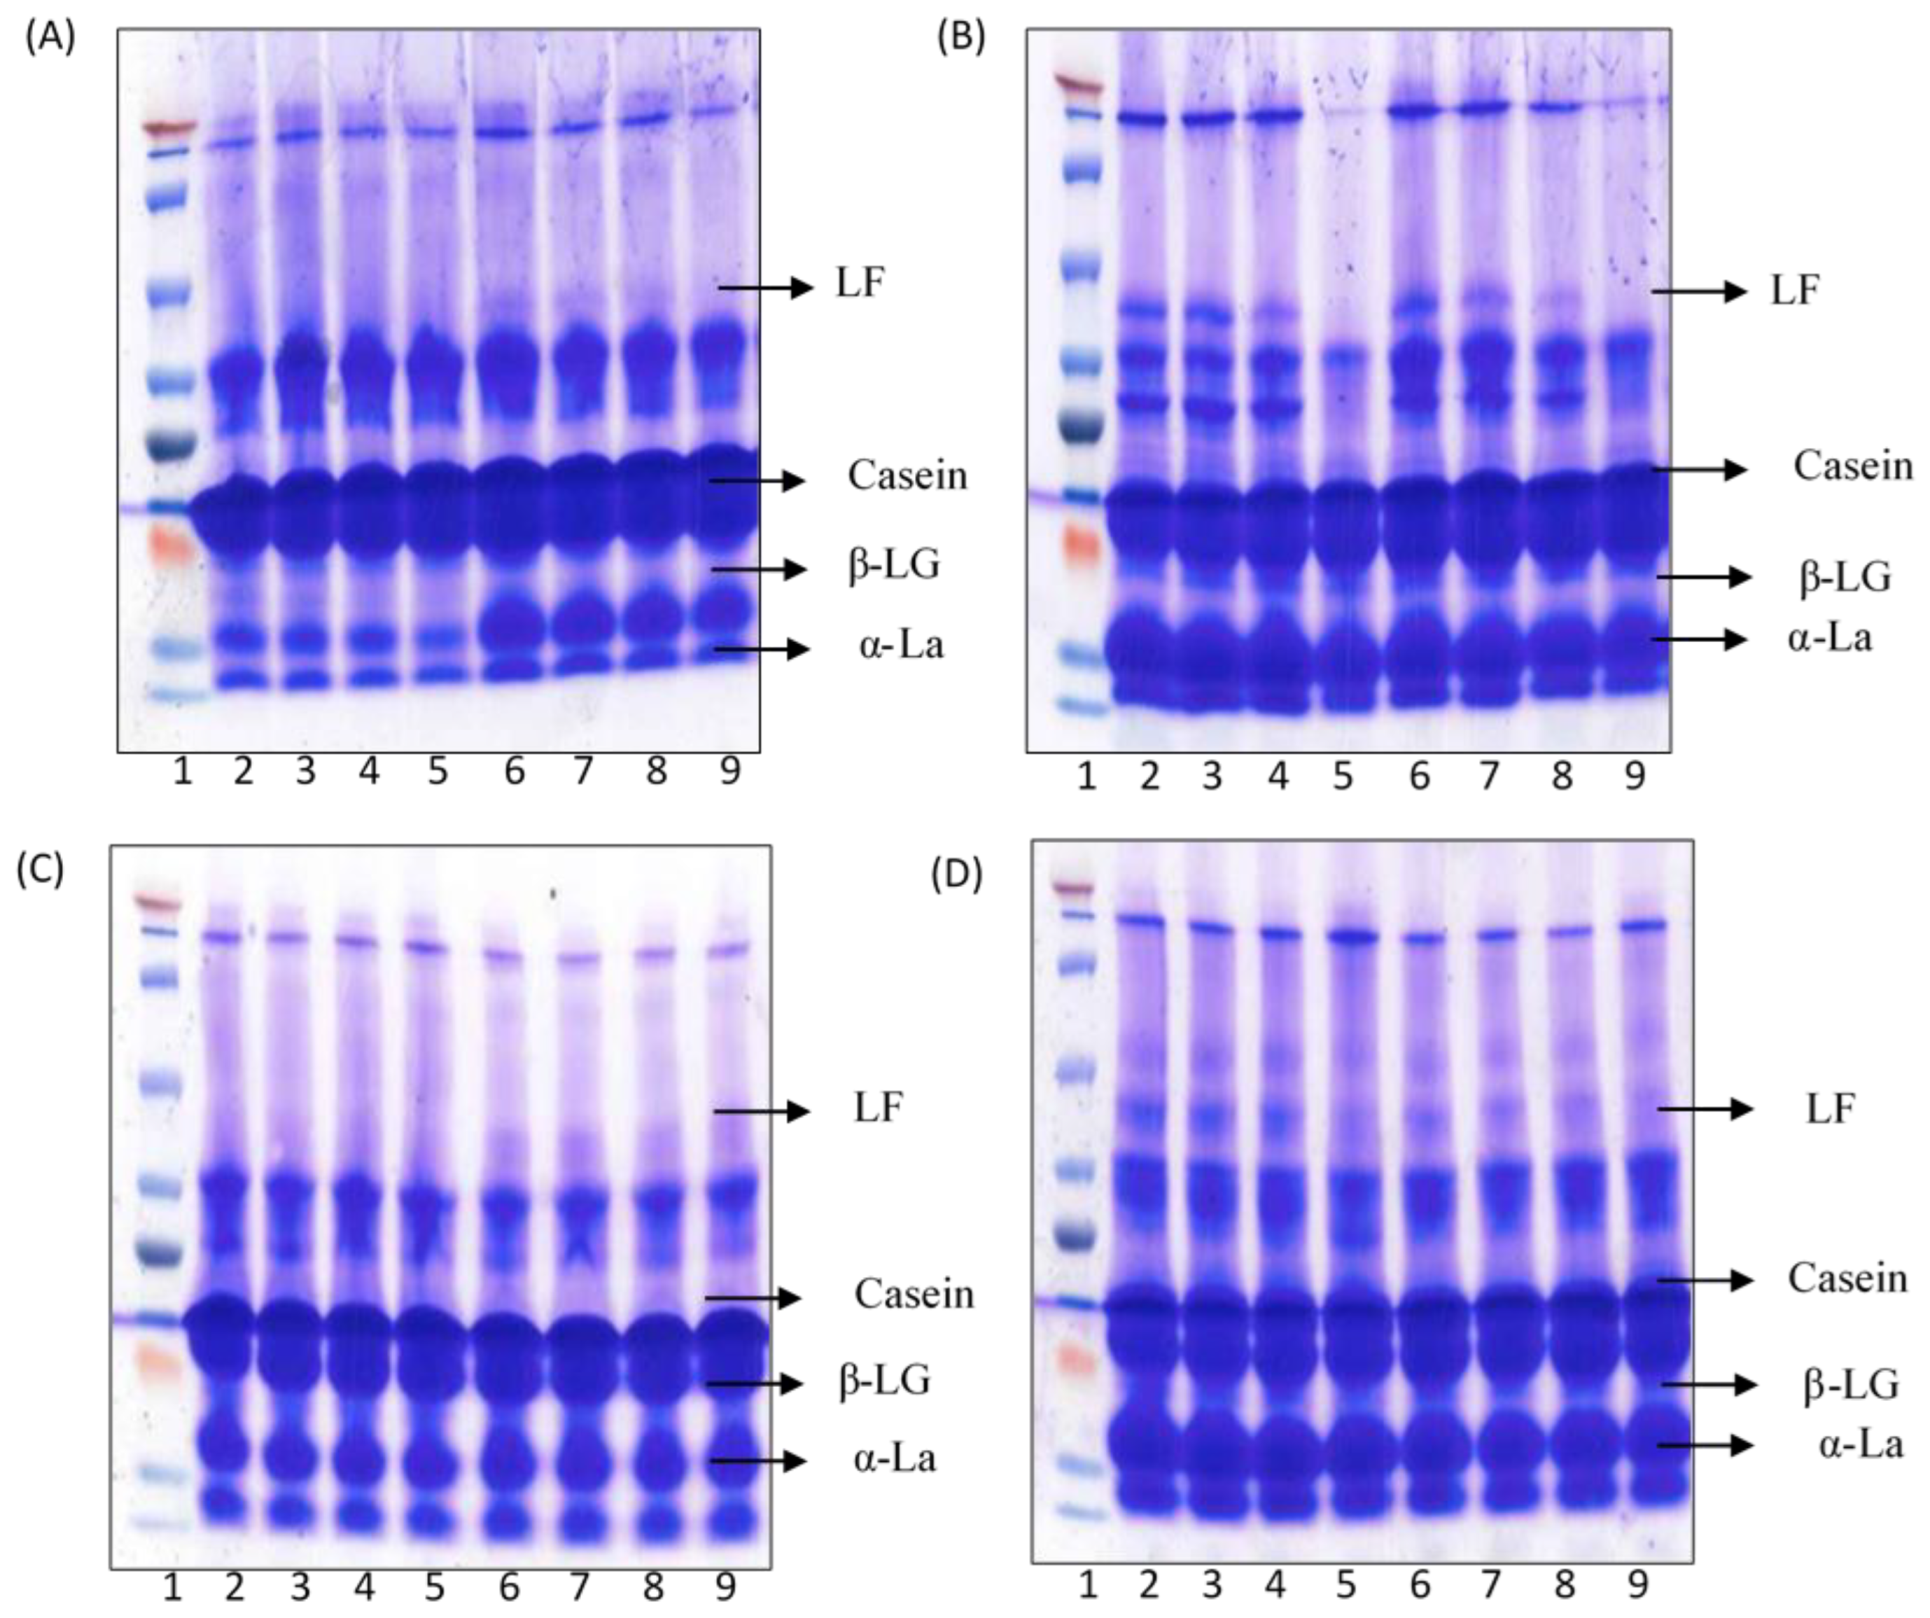
Figure 2.
The volatile organic compounds (VOCs) identified via Headspace Solid Phase Microextraction Arrow Gas Chromatography Mass Spectrometry (HS-SPME-Arrow-GC-MS) in the milk after heat treatment and protein fortification. (A) The relative VOC content. (B) The relative VOC content percentage. (C) The PCA analysis of the VOCs. (D) The clustering heat map analysis of the VOCs.
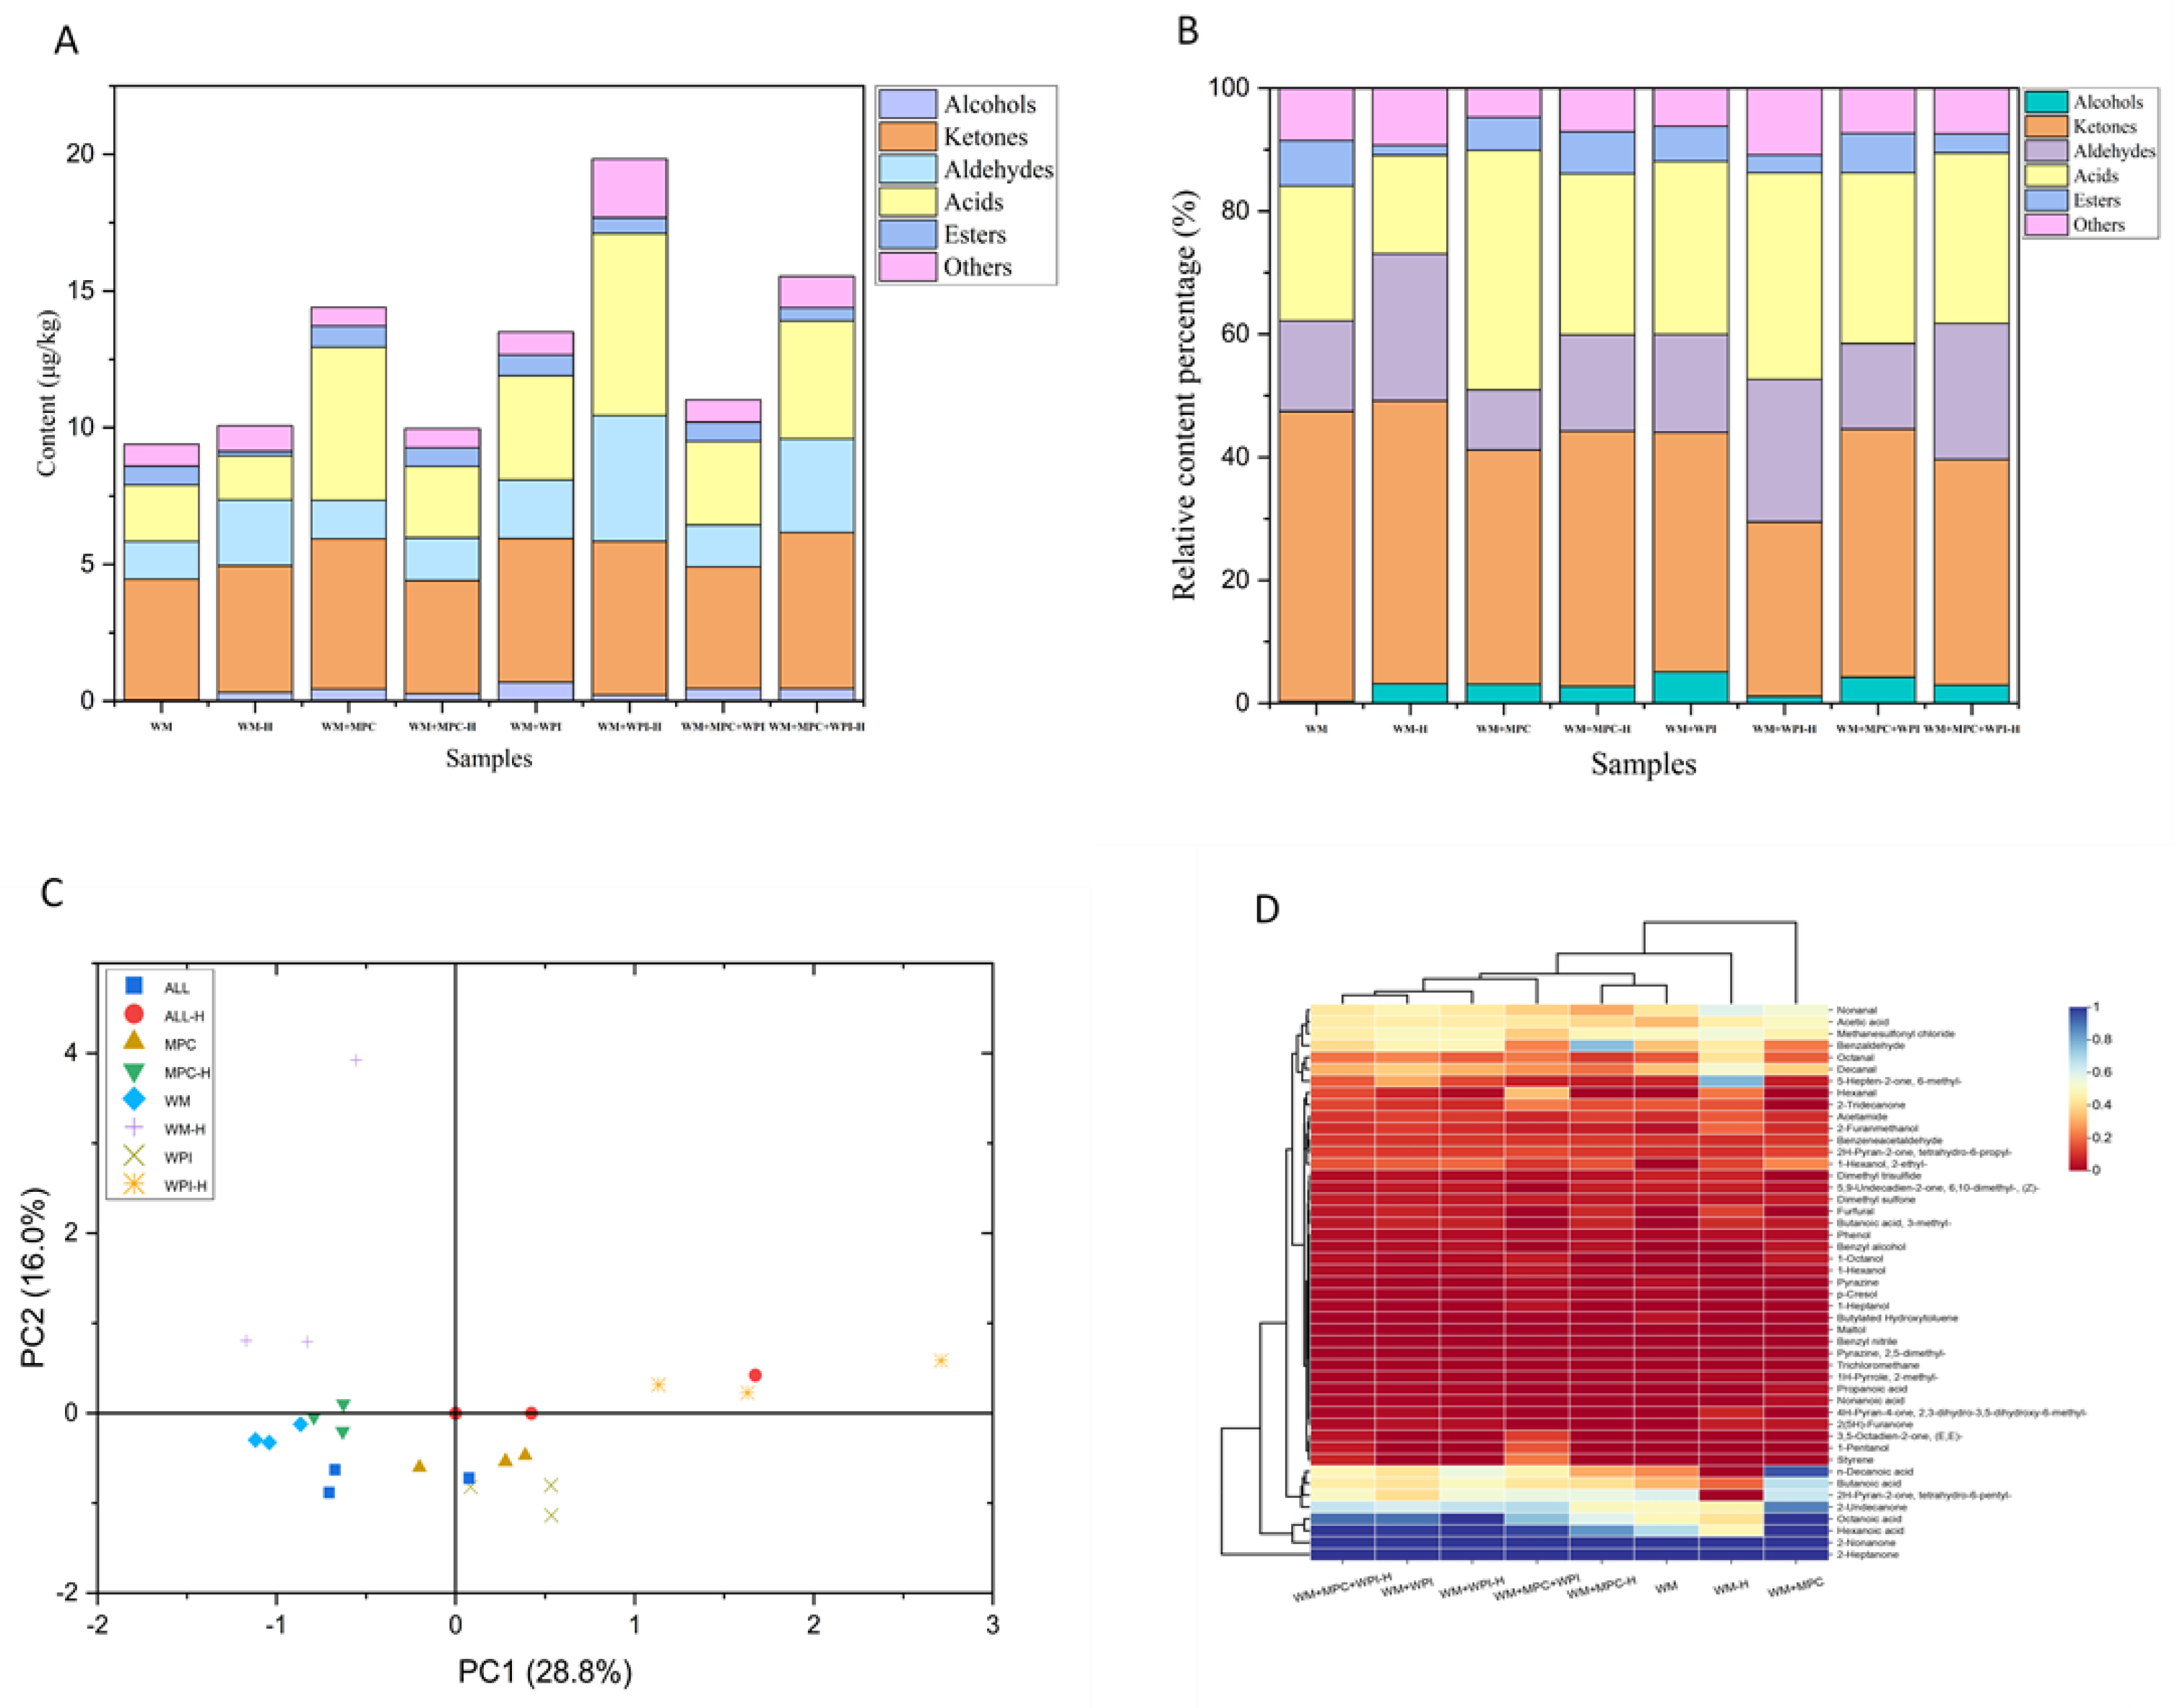
Figure 3.
Radar plot of aroma attribute intensities in milk samples after heat treatment and protein fortification. Each polygon shape represents the complete sensory profile of a sample. Scales range from 0 (none) to 15 (extremely strong). WM = whole milk; MPC = milk protein concentrate; WPI = whey protein isolate.
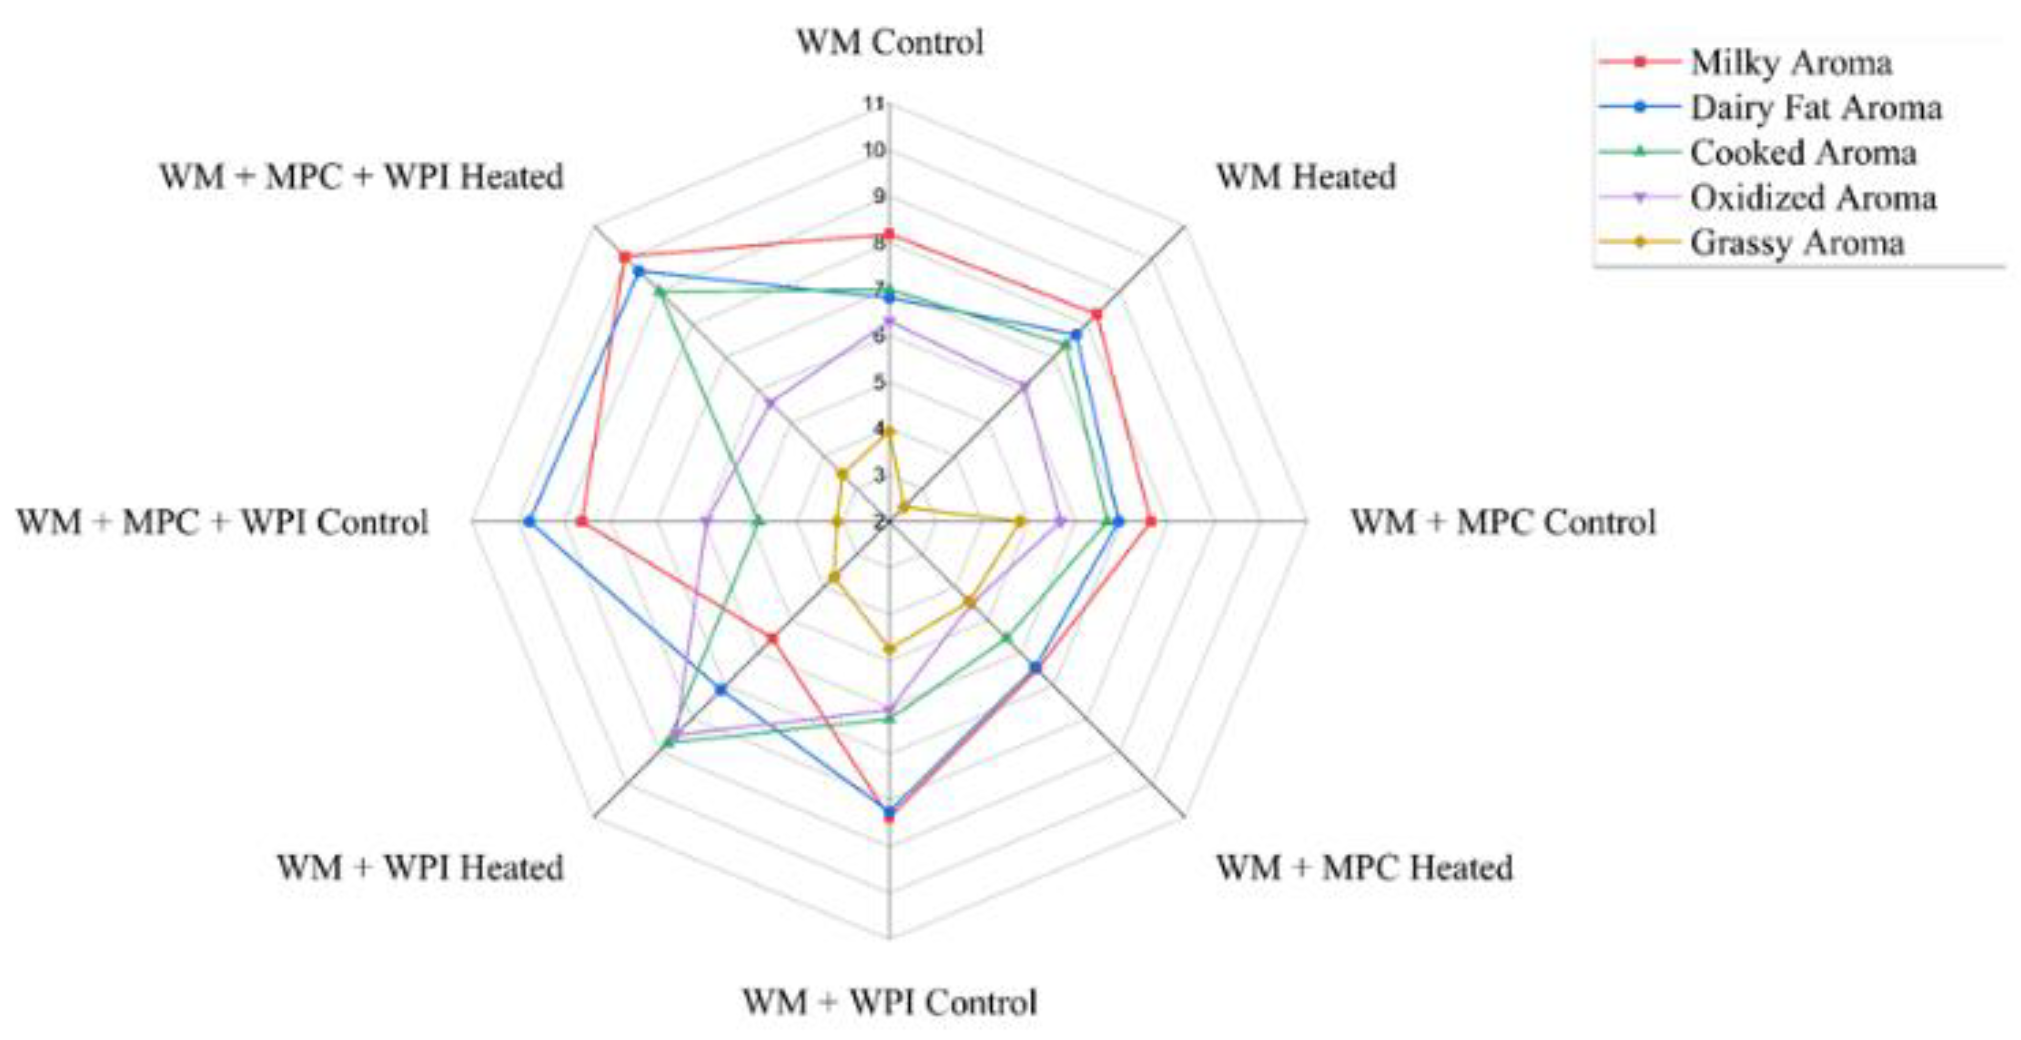
Figure 4.
Partial Least Squares Regression (PLS-R) correlation loading plot of milk samples and volatile compounds, showing how processing treatments affect aroma profiles. Important groups: (1) Protein-enhanced samples (e.g., WM + MPC + WPI) are linked to fresh dairy smells (milky, grassy) and volatile alcohols/ketones (e.g., 2-heptanone, 1-hexanol); (2) Heat-treated samples (e.g., WM-H, WM + WPI-H) are linked to cooked/oxidized notes and thermal degradation markers (e.g., furfural, nonanal). The axes show latent variables (LV1 and LV2) and the percentages of explained variance. Ellipses show the 95% confidence intervals for the treatment groups.
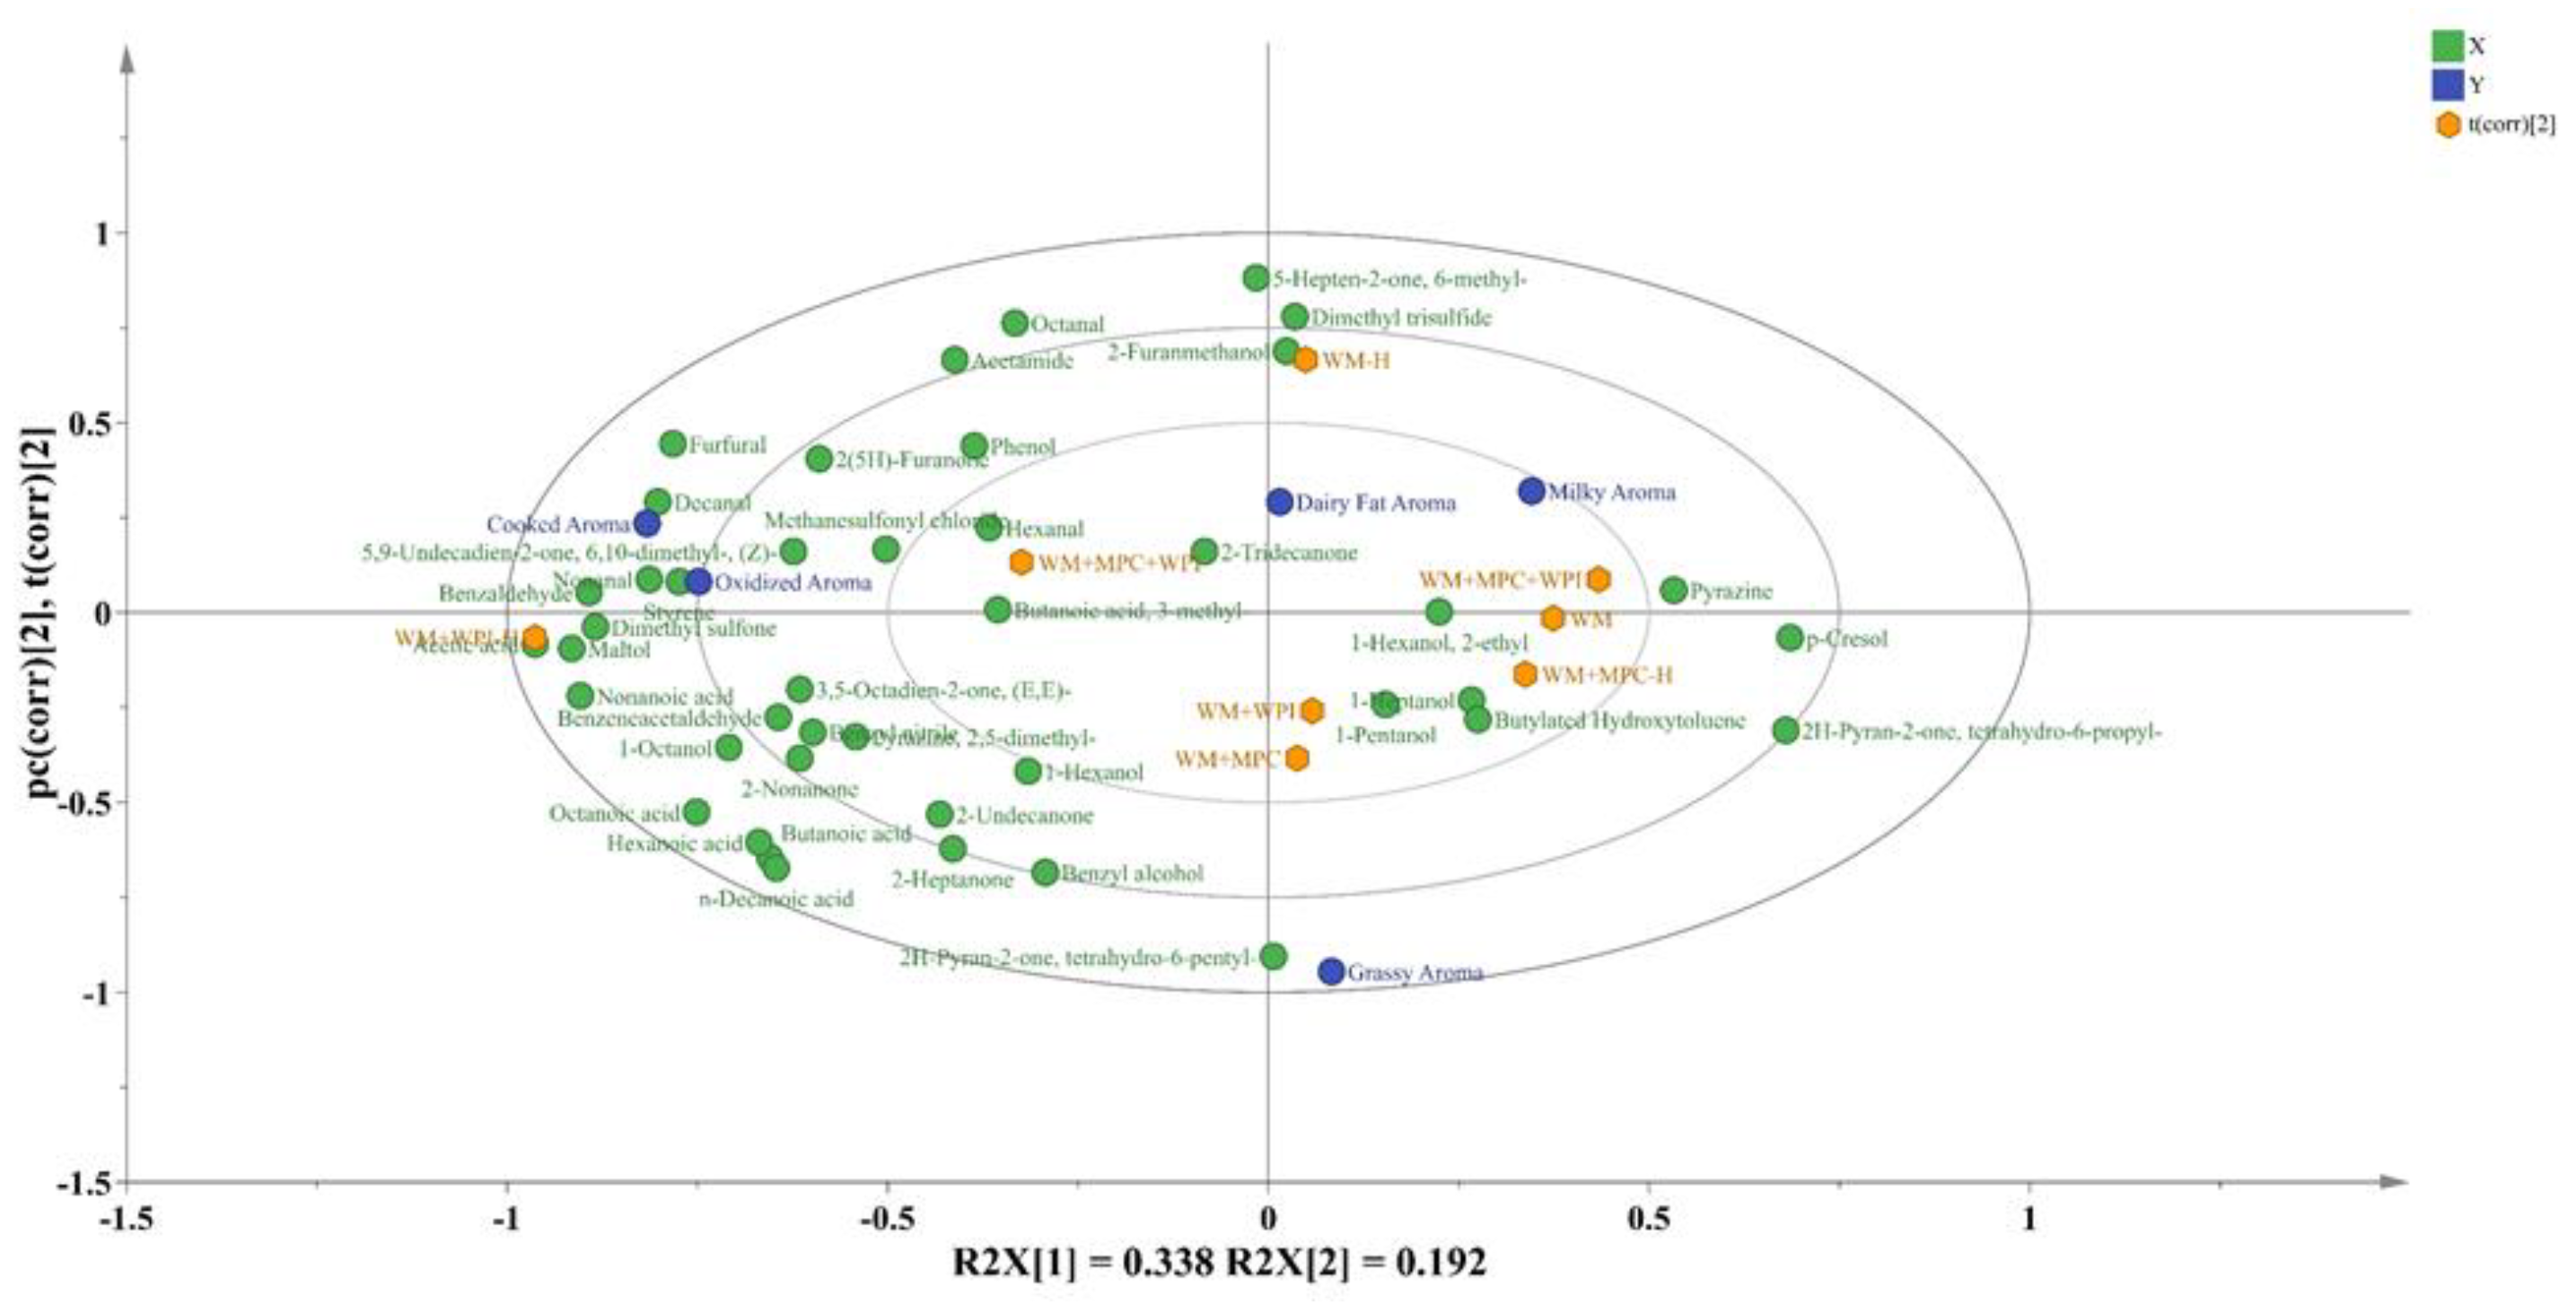
Figure 5.
Correlation plot of milk protein denaturation (α-LA, β-LG, LF) and volatile compounds under different processing treatments. The color key (right) indicates the strength and direction of the Pearson correlation coefficient, ranging from -1 (strong negative correlation, blue) to +1 (strong positive correlation, red).
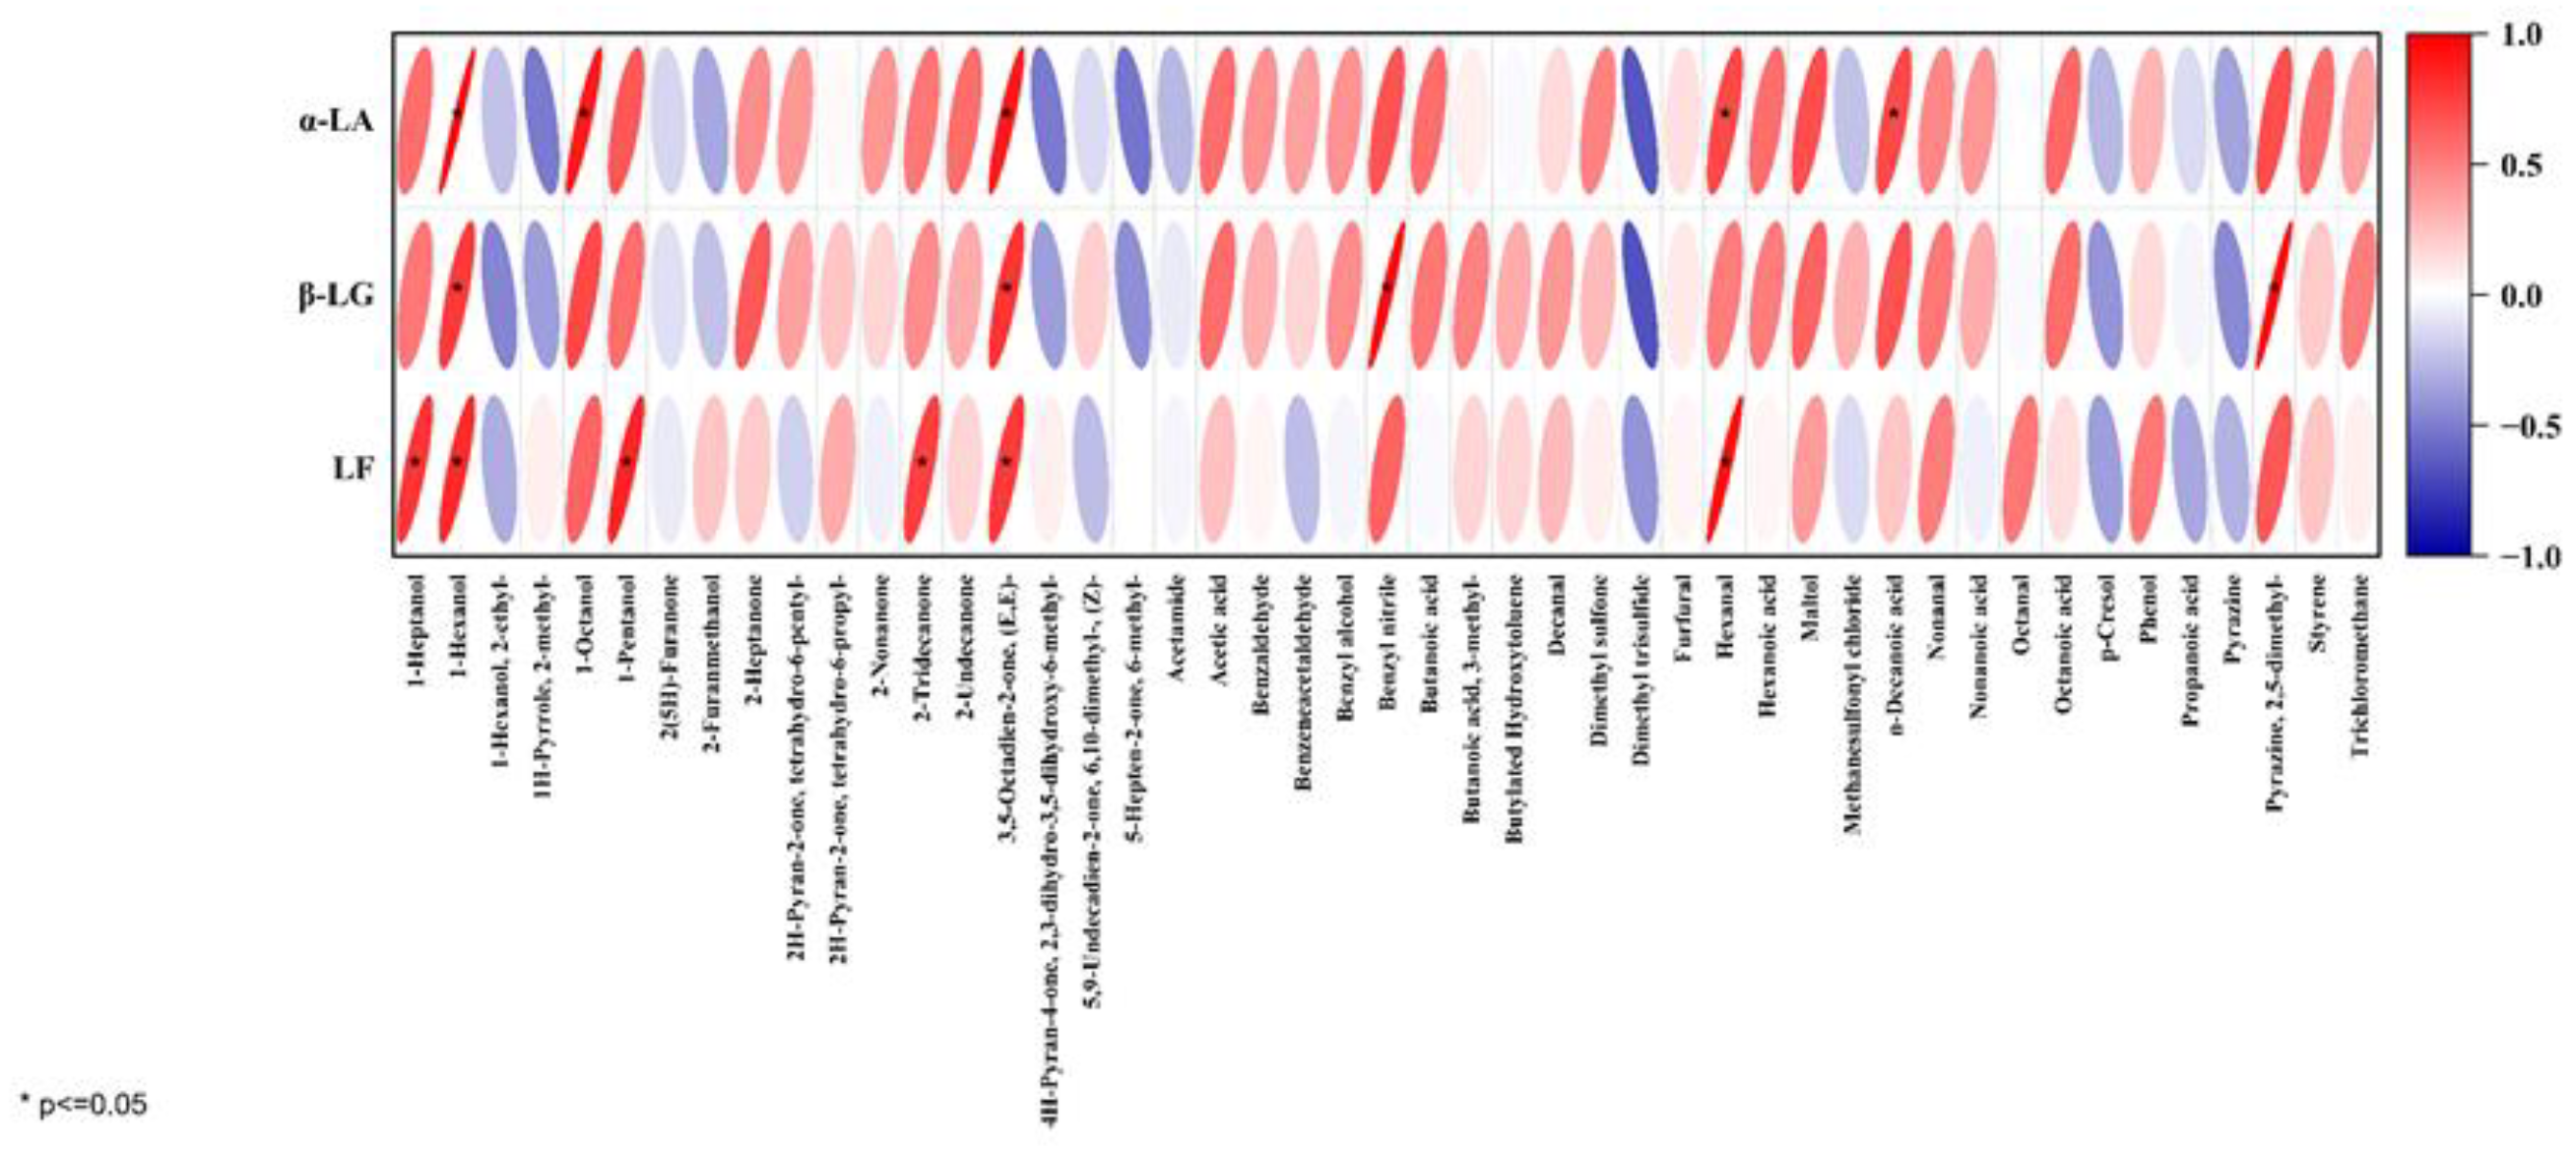

Table 1.
Nutritional profile of whole milk, milk protein concentrate, and whey protein isolate.
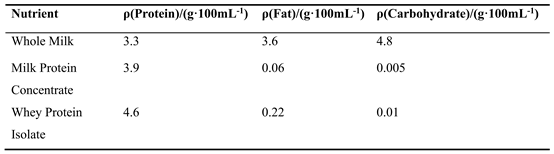
Table 2.
Compositional analysis of whole milk (WM) supplemented with milk protein concentrate (MPC) whey protein isolate (WPI).
Table 2.
Compositional analysis of whole milk (WM) supplemented with milk protein concentrate (MPC) whey protein isolate (WPI).
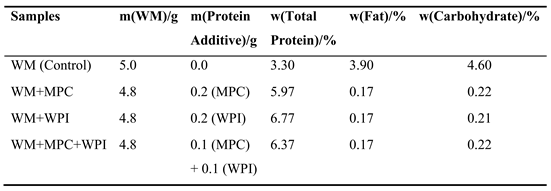
Table 3.
Protein composition of milk samples (mg/mL) by SDS-PAGE.
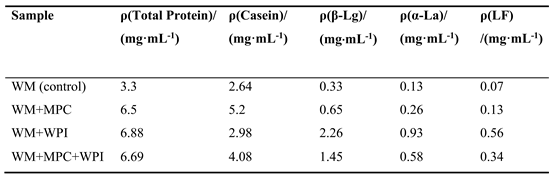
Table 4.
HPLC quantification of major whey proteins in milk and protein-fortified systems with and without heat treatment.
Table 4.
HPLC quantification of major whey proteins in milk and protein-fortified systems with and without heat treatment.
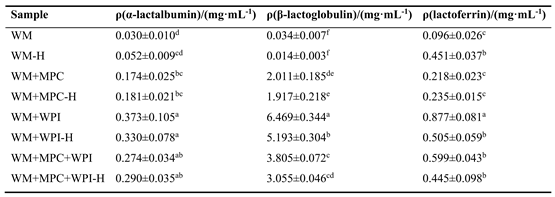
a–e According to the Tukey test, different superscripts in the same column indicate significant differences (p < 0.05).
Table 5.
Sensory Evaluation of Aroma Descriptors for Different Samples.
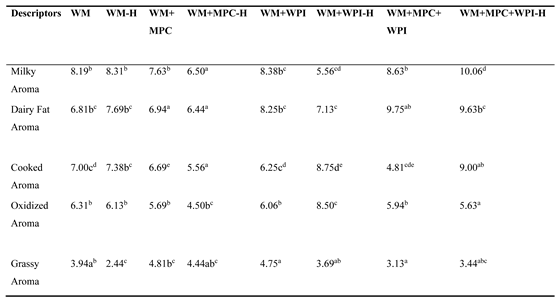
a–e According to the Tukey test, different superscripts in the same column indicate significant differences (p < 0.05).
Disclaimer/Publisher’s Note: The statements, opinions and data contained in all publications are solely those of the individual author(s) and contributor(s) and not of MDPI and/or the editor(s). MDPI and/or the editor(s) disclaim responsibility for any injury to people or property resulting from any ideas, methods, instructions or products referred to in the content. |
© 2025 by the authors. Licensee MDPI, Basel, Switzerland. This article is an open access article distributed under the terms and conditions of the Creative Commons Attribution (CC BY) license (http://creativecommons.org/licenses/by/4.0/).
Copyright: This open access article is published under a Creative Commons CC BY 4.0 license, which permit the free download, distribution, and reuse, provided that the author and preprint are cited in any reuse.


