
Submitted:
30 December 2025
Posted:
31 December 2025
You are already at the latest version
Abstract
Dysphagia, or difficulty swallowing, is a significant issue that impacts 10% to 33% of the elderly population and can lead to serious complications such as aspiration, malnutrition, and weight loss. To overcome these obstacles, there is a critical need for comprehensive rheological data and detailed information on food texture, specifically designed to align with local eating habits and cooking methods. This study aims to develop tables of rheological properties for foods commonly consumed by older adults in Portugal. Additionally, it will assess the impact of water quality on these properties during the cooking process. Based on this data, we will develop texture-modified diets that meet the nutritional needs of elderly dysphagic patients, ensuring they are safe, palatable, and practical for everyday care settings.
Keywords:
dysphagia
; elderly
; texture-modified diet
; rheology
; nutrition
1. Introduction
Dysphagia, a condition characterized by impaired chewing and swallowing, affects individuals across all age groups and is classified into two types: oropharyngeal and esophageal. Oropharyngeal dysphagia is often associated with neurological disorders or stroke, while esophageal dysphagia results from motility dysfunction. In older adults, dysphagia is frequently linked to presbyphagia, an age-related decline in swallowing function, exacerbated by comorbidities, neurodegenerative diseases, structural changes, medication effects, and muscular disorders such as sarcopenia [1,2].
Swallowing difficulties may also arise from tooth loss, ill-fitting dentures, xerostomia, sensory decline, and reduced orofacial sensitivity, all of which impair mastication and bolus formation. Dysphagia prevalence varies widely depending on the population and assessment methods, ranging from 56% to 66% in nursing homes, 9% to 71% in hospitals, and 5% to 34% in community-dwelling older adults. Managing dysphagia presents multiple challenges, including ensuring safe food textures, nutritional adequacy, palatability, preventing aspiration, providing individualized diets, maintaining hydration, ensuring food safety, promoting psychosocial well-being, and achieving cost-effectiveness. A multidisciplinary approach is essential to address these complex needs and maintain quality of life [3,4].
Malnutrition and dehydration are common in dysphagic patients due to inadequate intake of energy, protein, and fluids. These conditions are associated with immunosuppression, reduced functional capacity, increased risk of infection, and higher mortality rates. Clinical nutrition strategies, such as thickened fluids and texture-modified diets (TMDs), are employed to enhance swallowing safety and efficiency. Thickening agents increase fluid viscosity, thereby reducing the risk of aspiration, whereas TMDs change food consistency through methods such as softening, chopping, or mixing with liquids [5].
TMDs must not only ensure safety but also meet nutritional requirements, including digestibility and bioaccessibility, while maintaining sensory appeal and variety to promote adherence. However, thickened liquids may impair hydration, delay drug absorption, and reduce treatment compliance. Higher viscosity is also associated with increased pharyngeal residue [6].
Food texture is defined by physical and rheological properties such as hardness, cohesion, viscosity, and elasticity, which influence sensory perception and swallowing mechanics. These properties can be modified through cooking, mechanical processing, the addition of liquid content, or the use of industrial additives such as thickeners and stabilizers. Preferred methods preserve the food’s appearance, color, and flavor to enhance acceptability [5].
Rheological analysis is critical for quality control and safe swallowing, as it evaluates consistency, shear stress, and molecular interactions. However, such analysis typically requires expensive equipment and trained personnel. To overcome these limitations, descriptive classification systems and simplified methods, such as Texture Profile Analysis (TPA), have been developed. TPA simulates the mechanical actions of the teeth and tongue during the first two bites, providing data relevant to oral processing [1,7].
Standardizing food texture classification remains a challenge due to the diversity of foods. Tools like the Dysphagia Outcome and Severity Scale (DOSS) and the Functional Oral Intake Scale (FOIS) help assess dysphagia severity and guide dietary modifications [6].
The TMDs are achieved by modifying the rheological properties of foods. The American Dietetic Association, based on the National Dysphagia Diet (NDD), has proposed a four-grade classification of food texture modification: i) Grade 1: moderate to severe dysphagia (pureed foods); ii) Grade 2: mild to moderate oral or pharyngeal dysphagia (foods with mechanically modified texture; semi-solids about 0.6 cm); iii) Grade 3: mild oral and/or pharyngeal dysphagia (soft-solid foods less than 2.5 cm); and iv) Grade 4: No dysphagia,—regular feeding [6]. To extend the oropharyngeal transit time and prevent aspiration, the focus is based on increasing the liquid viscosity to either nectar or honey consistency (51–350 mPa∙s or 350–1750 mPa∙s, respectively) at 25 °C and a shear rate of 50 s−1, as established by the NDD [8].
In response to the need for global standardization, the International Dysphagia Diet Standardisation Initiative (IDDSI) was launched in 2012. IDDSI introduced an eight-level framework for classifying texture-modified foods and thickened liquids, using qualitative descriptors and empirical testing. The framework is designed to be universally applicable across ages, cultures, and care settings. Liquids are classified from Level 0 (thin) to thicker consistencies, with mildly thick liquids recommended for mild dysphagia and thicker ones for more severe cases [9,10].
Despite international efforts, countries like Portugal still lack a standardized national classification. The Portuguese Nutrition Association (APN) manual is the most used reference, describing soft foods and thickened liquids in terms of nectar, honey, and pudding consistencies [11].
Foods suitable for individuals with dysphagia should be soft, moist, cohesive, and easy to swallow, requiring minimal chewing effort. Ideal TMDs exhibit high viscosity and elasticity, low hardness and stickiness, and leave minimal residue in the oropharynx. Texture can be modified through various methods while maintaining sensory quality to ensure patient acceptance [1].
Due to the high cost and limited availability of texture analyzers, practical alternatives using common utensils, such as forks and spoons, have been adopted. IDDSI test methods—such as the fork drip, spoon tilt, pressure, chopstick, and finger tests—allow for accessible and standardized texture assessment. These tools help reduce subjectivity and support consistent classification of pureed, soft, firm, and solid foods.
Effective dysphagia management requires a comprehensive understanding of food texture, rheology, and nutritional needs. Texture-modified diets, when properly designed and implemented, can significantly improve safety, nutritional status, and quality of life for individuals with swallowing disorders.
Nevertheless, well-designed TMDs (visually/olfactory appealing), when supervised by professionals, support nutritional status in dysphagic patients. Warm meals may aid swallowing and improve acceptance. Standardized terminology enhances safety and communication in multidisciplinary care.
This study aims to characterize the most consumed foods among Portuguese elderly individuals, particularly those with dysphagia, by analyzing their rheological and nutritional properties. It addresses a knowledge gap by providing rheological data for typical preparation methods and examining factors such as the quality of the cooking water.
Despite international efforts, countries like Portugal still lack a standardized national classification. The APN manual is the most used reference, describing soft foods and thickened liquids in terms of nectar, honey, and pudding consistencies [11].
2. Materials and Methods
2.1. Selection of Foodstuffs
The food samples were selected based on the food preferences of the Portuguese population, with a particular focus on the dietary needs of the elderly. The selected foods (Table 1) cover all groups of the food wheel used to prepare the two main meals (lunch and dinner): meat and fish, vegetables, pulses, cereals, tubers, and fruit.
The food samples were purchased at supermarkets in Lisbon between January and February 2023. The samples were purchased on the analysis day to avoid prolonged storage periods. All parameters were analyzed in triplicate.
2.2. Food Samples Preparation
The food was prepared, cut, and washed according to standard household procedures, including peeling vegetables and tubers, washing them under running tap water (TW), and cutting them into uniform-sized slices (Table 2).
Seedless tomatoes, aubergines, and fruits were cut with skin on, dried legumes soaked for 24 hours, and peas frozen without being soaked. Broccoli and cauliflower were divided into individual flowers, with edible stalks and leaves removed. Flower stems of leafy vegetables were also removed.
2.3. Food Cooking
This study focused on water-based food preparation, using demineralized water (DW) and TW from Lisbon. Test portions of vegetables (300 – 500 g), rice (± 20 g; rice: water 1:3), meat, and fish were cooked until easily pierceable with a fork. Fruit was considered cooked when the skin separated from the fruit. Meat and fish samples were cut into steaks and fillets, with the steaks minced twice and the fish fillets cooked until they were tender and no longer splintered. After cooking, samples were drained, and the volume of water was recorded.
2.4. Methods of Food Production and Processing
Food processing involves creating a homogeneous consistency in cooked or fresh foods, such as mashed, grated, crushed, or juiced fruits, which dysphagic patients ingest. For some cooked foods, cooking water was used to facilitate homogenization and viscometer readings, and viscosity analysis was conducted after cooking. Tables S1-S2 detail different forms of homogenization used.
2.5. Sample Analysis
2.5.1. Water analysis
2.5.2. Foodstuffs: fork and syringe tests
IDDSI tests confirm product flow or texture in real-time for foods and beverages under serving conditions, especially regarding temperature [6,13,14]. This study uses fork and syringe tests for pasty and liquid samples, respectively.
The fork test requires a fork with long, multiple teeth and a reasonable distance between them, with a 19 cm-long fork with a 4.5 cm-long tooth.
The sample is crushed using a fork head, with a force exceeding average blood pressure (about 17 kPa, equivalent to the tongue during swallowing) and sufficient to turn the thumbnail white. A syringe flow test was performed using a 10 mL syringe in accordance with the IDDSI standard [14].
2.5.3. Rheological Properties
Viscosity Analysis
The viscosity of foods from different food groups was determined using a Brookfield digital rotational viscometer (model DVE) with a variable deformation range between 0.3 and 100 revolutions per minute (rpm). The instrument was calibrated daily using polydimethylsiloxane (PDMS) calibration fluid and the Brookfield LV-61 spindle.
After homogenizing hot and cooked samples, with or without the addition of boiling water, they were analyzed using viscometer spindles, and the best spindle/speed combination was selected for the test, yielding satisfactory results between 10 and 100 on the instrument's percentage torque scale [15].
The process used a Brookfield LV-61 spindle for liquid samples and an LV-64 spindle for pasty samples. The viscosity values were evaluated at 0.3, 2.5, 5, 10, 50, and 100 rpm, and the analyses were performed in triplicate.
Texture Analysis
The texture profile analysis (TPA) method used a TA.XTplusC texture analyser. The method consisted of a double penetration of a 25.4 mm acrylic cylinder to a depth of 10 mm into the samples packed in cylindrical ceramic containers (38 mm diameter and 42 mm height). The penetration speed was 1 mm/s, and the trigger load was 0.067 N. The Exponent Connect software was used to collect the parameter values. Strength, adhesion, resilience, cohesiveness, gumminess, and chewability were determined. The results presented are the mean of the three values.
2.6. Nutritional parameters
Energy content
The nutritional and energy value of meals was evaluated based on macronutrients and micronutrients, focusing on lipids, proteins, carbohydrates, fiber, and mineral composition.
The energy content of the meals (kJ/g or kcal/g) was calculated using conversion factors provided in Annex XIV of Regulation 1169/2011 [16], as outlined in Equation 1. The P is the protein content (%), FC is the conversion factor, F is the total fat or lipid content (%), C is the experimentally determined total carbohydrate content (%), and DF is the total fibre content (%).
Energy content = (P × FC) + (F × FC) + (C × FC) + (DF × FC),
2.7. Menu design
The menus were tailored to meet a nutritionally balanced diet, considering the rheological parameters previously obtained for the target foodstuff. Each menu includes a soup, a main course (served for lunch or dinner), and a fruit option (either fresh or cooked).
Based on the viscosity data, certain meals for dysphagic patients were developed. Menus were designed using the food wheel, considering the required daily quantities for their composition and the foods most commonly consumed by Portugal's elderly population [17].
Four soups (Table S4), main courses (Table S5), and desserts (Table S6) were chosen based on their carbohydrate, fat, protein, and fiber content to ensure optimal nutritional consumption.
Foods with higher and lower viscosities were grouped to ensure balanced textural changes, an organoleptically appealing texture, and acceptability for the dysphagic patient. The olive oil used to create the meals has an approximate viscosity of 0.04 Pa.s. [18].
Therefore, the meals ranged from the least calorific (1502.3 kcal/day) to the most calorific (1716.4 kcal/day), as shown in Table 3.
These recommendations include 100g for soup and dessert, and 200g for the main meal. Each of these menus (Table 3) provides the minimal need of 25 kcal/kg body weight/day (1500 kcal/day) for a person weighing 60 kg.
2.8. Statistics
Microsoft Excel was used to conduct statistical tests, evaluate rheological and nutritional parameters using basic descriptive statistics and Whisker box plots, and perform one-way analysis of variance (ANOVA) with a significance level of p ≤ 0.05, and Pearson's correlation coefficient to analyze relationships between variables.
3. Results and Discussion
3.1. Water Analysis
pH can affect the solubilization of several food components, thus increasing or decreasing the viscosity of cooked food (Table S7). Conductivity is the degree of mineralization of water. The higher its value, the higher the concentration of dissolved salts, which may react with food components to form substances of different consistencies [19].
Turbidity indicates the total content of substances dispersed in the sample, both inorganic and organic.[12] In both water samples, the turbidity value was very low, indicating that this parameter is not a reliable indicator of water quality.
Several ions and organic molecules can increase or decrease the mobility of water molecules in dilute solutions. Cations (Na+, Ca2+, Mg2+, and Al3+) react with water to form chemical structures that make solutions less fluid than pure water. The larger monovalent cations and anions (NH4+, IO3-, Cl-, NO3-) can break the bonds between water molecules, making solutions more fluid than pure water [20].
The concentration of calcium and magnesium ions determines water hardness, which does not significantly affect water viscosity; however, it can influence the final appearance, hardness, and viscosity of cooked food [21].
The DW sample is soft, while the Lisbon TW sample is moderately hard, suggesting that food consistency can change during cooking (Table S8). DW and TW change their properties after cooking food. These data may reflect changes during the cooking process, as evidenced by changes in mineralization and the pH of the cooking water for some foods.
As observed for some foods, such as Carolino rice, Arborio rice, carrot puree, pea puree, and Rocha pear, the increase in electrical conductivity of TW used for cooking is followed by an increase in the foods ' viscosity due to the increase of ions in TW.
Although spinach and chickpea cooking waters showed an increase in EC, they did not exhibit significant changes in viscosity relative to TW, likely due to mineral transfer during cooking [19,22].
During cooking, meat releases soluble substances (nitrogen compounds, minerals, lactic acid, creatinine) from the muscle tissue into the cooking water, which can increase the EC of the cooking water. For pork and chicken steaks, there was an increase in EC and pH, but a decrease in viscosity in TW. This can be explained by the formation of complexes between proteins and calcium and magnesium, which increase the water absorption capacity in the structural space of the myofibril [22,23].
3.2. Food Viscosity
3.2.1. Selection of Rotational Speed
When setting viscosity criteria for foods intended for dysphagic patients, the choice of shear rate (SR) has been a topic of debate, with 50 s-1 being the most widely used and accepted value, as this is the SR achieved during chewing. Nevertheless, viscosity is difficult to measure with a fixed SR, and some studies report significant changes in shear rate during chewing. Therefore, some studies suggest a more comprehensive range, either between 10 s-1 and 1000 s-1, corresponding to the 50 rpm to 5000 rpm range, or the range between 1 s-1 and 1000 s-1, corresponding to the 5 rpm to 5000 rpm range [24,25].
The viscosity and SR values were determined using the experimental setup, the Brookfield viscometer, the spindles, the sample's rheological behavior, and the equipment's speed range.
Table S9 shows the chosen rotational speed (rpm) values and the corresponding SR values. The SR values were calculated by multiplying the rpm value by the geometry correction factor 0.209 [26]. The foods within each food group are discussed to better understand how water quality affects food viscosity (Table 4 and Table 5).
3.2.2. Cereals and Derivatives, Tubers
As the main component of rice grains, starch accounts for 80% of the total cereal constituents. The different behaviors of the two types of rice are due to the amylose/amylopectin ratio, fat content, and solids concentration [20]. Amylose limits the expansion of starch, while amylopectin is responsible for the gelatinization of starch when heated in an aqueous solution. Viscous solutions are formed as amylose is leached from the granule, increasing the volume of the rice grains while solubilizing the amylose content. After cooling, the amylose molecules undergo recrystallization, while the amylopectin molecules remain unchanged, a consequence of their branched structure. Short-chain amylose increases viscosity, while long-chain amylose and large amylopectin molecules decrease viscosity [27].
The water absorption of Carolino rice was higher than that of Arborio rice [28]. Arborio rice has a chalky, or white, opaque core. When chewed but not cooked, Arborio rice's ability to become rigid explains its higher viscosity. Under the experimental conditions, it was not possible to obtain viscosity values for the higher SR. Due to the presence of calcium and/or magnesium ions (higher hardness), both types of rice displayed increased viscosity in the TW.
The viscoelastic nature of cooked spaghetti may have contributed to the food's difficult-to-handle, sticky, dense texture. The amount of starch in the spaghetti, which prevents the sample from becoming fluid even when combined with the cooking water, also explains why the cooking water of both samples was more viscous.
Due to its non-Newtonian behavior, the solid content of spaghetti cooking water gradually increases. Pasta's rheology is influenced by the presence of gluten proteins, which possess cohesive, elastic, and viscous properties that impact its cooking properties. Their structure and molar mass make them physically elastic and fracture-resistant, contributing to pasta's elasticity [29]. Only spaghetti cooked in TW yielded viscosity data at 2.5 rpm, making comparisons of the results impossible. The best tool for this kind of meal would be a rheometer, as it more accurately captures non-Newtonian behavior, also known as viscoelastic behavior. Therefore, spaghetti can be challenging to swallow because of its viscoelastic behaviour, which can result in choking in people with dysphagia
Cooked cereals and their derivatives exhibited non-Newtonian shear-thinning behavior due to decreased viscosity, which was related to the starch gel at high concentrations.20 Potato texture varies with plant cell size and can be influenced by several factors, including pectic compounds and starch content. Internal cell pressures from starch expansion during heating or gelling cause cultivar-specific variations in texture. Starch gelatinization and retrogradation are the primary processes that change the cooked potatoes' texture [30].
Sweet potatoes have a higher starch content, which may account for the variation in viscosity readings between them and white potatoes cooked in DW. Foods with higher starch concentrations were found to be harder (stiffer) and less tractable after cooking, whereas tubers with lower starch content yielded softer dishes [31]. When heated in excess water at 75–95 °C, starch gelatinization occurs, increasing the cell size. When amylopectin is heated continuously, gelatinization fractures its double helix, making the chains more accessible to enzymatic hydrolysis. Numerous studies have demonstrated that the higher the sugar content and the lower the viscosity, the greater the hydrolysis of starch molecules [32,33].
There were no significant variations in viscosity between purple potato puree cooked in DW and TW. Sweet potatoes contain more total solids than white and purple potatoes, which may improve hardness due to increased structural stability [33]. When white and sweet potato mash were cooked in TW, they became more viscous, which can be attributed to calcium and magnesium ions. Compared to DW, both potatoes had more dry matter and less moisture. Mashed potatoes behaved like non-Newtonian fluids, dropping their viscosity as the cutting speed increased, and might be considered a form of re-fluidization [32].
3.2.3. Vegetables and Fruits
Fruits and vegetables are non-Newtonian foods with a viscoelastic profile [34,35]. Plant cells carrying liquid-phase soluble pectin, which binds to water, solutes, and suspended particles, are dispersed in fruit and vegetable purees. These pectin chains form gels by building a three-dimensional network. Heat treatment can produce both gel formation and pectin degradation (by enzymatic activity, β-elimination, or acid hydrolysis) [36].
Temperature, shear conditions, concentration, particle size distribution, charge, interparticle interactions, soluble pectin and pectins on particle surfaces, hardness and shape, insoluble solids, soluble solids (°Brix), enzymatic activity, polarity, electrolyte concentration, and raw material composition all affect the rheological properties of fruit or vegetable purees [36,37].
The structural changes in horticultural products caused by heating can be explained by the loss of cell turgidity (producing a softer, rubbery texture) and degradation of cell wall components [38].
Pectins with many methoxy groups (—OCH3) have been shown to form gels with high soluble solids content. Conversely, pectins with limited methoxy groups form gels in the presence of calcium ions over a broad pH range. The activity of pectin methylesterase at elevated temperatures has been demonstrated to reduce the degree of methoxylation and promote gel formation [36].
The cooked vegetable with the highest viscosity was broccoli, which exhibited a drier appearance and firmer texture than the other vegetables. It is evident that the higher fibre content of turnip results in increased viscosity values.
The viscosity values of buttercup and butternut squash samples cooked in DW at a rotational speed of 2.5 rpm were statistically indistinguishable, with a recorded difference of 12.3 Pa.s.
Certain vegetables, including butternut squash, aubergines, broccoli, carrots, and tomatoes, exhibited elevated viscosity levels when cooked in TW, probably due to the presence of calcium and/or magnesium ions in the TW, which enhance the binding of pectin in vegetables due to their higher hardness. For this reason, adding these ions to canned vegetables reduces softening, although this technique is effective only for specific plant tissues [39].
The green leaves (baby watercress, spinach, and turnip greens) had low viscosity values in both types of cooking water (<1.2 Pa s), with the lowest recorded for spinach. This vegetable has a larger leaf area and fewer stalks and veins than baby watercress and turnip greens, which may explain the values obtained.
The acidic pH of tomato puree allows acid hydrolysis of the pectin, resulting in a product with lower viscosity. Enzymatic pectin degradation in carrots is limited due to low levels of polygalacturonase [36].
Most vegetables exhibited non-Newtonian, shear-thinning behavior, with a decrease in viscosity observed as the cutting speed increased [40,41].
Pectin, a constituent of plant cellulose, is subject to degradation through the action of enzymes and chemicals during processing. During heat treatment, pectin solubilisation leads to the softening of the plant tissue, which determines the texture of the resultant puree. Pectin is susceptible to acid hydrolysis due to the acidic pH of the fruit, pH = 3.7 [42].
The fruits cooked in DW showed no significant differences (p < 0.05) for the 2.5 rpm speed, with higher values for the Starking apple (62.88 Pa.s) and the Fuji apple (56.16 Pa.s), which also have higher dry matter values. The higher viscosity of the Starking apple can be explained by its slightly higher pH (pH 4.14), which reduces the rate of acid hydrolysis of the pectins.
Fruits with lower viscosity at DW (Gala apple, Golden apple, Rocha pear, Reineta apple) showed an increase in viscosity at TW. Pectic acids, one of the compounds that make up pectin, become insoluble in water when the carboxylate groups combine calcium and/or magnesium, increasing viscosity due to the increase in total soluble solids [39].
Clementine juice (5.28 Pa.s) and orange juice (0.017 Pa.s) had the highest and lowest viscosity values.
No viscosity values were obtained for the Gala, Reineta, Starking, and Rocha pears at 2.5 rpm. The large clusters of fruit cells were not broken up in the crushed fruit, resulting in a nonuniform mixture that could not be read on the viscometer. Under these conditions, the value of the rheological property measured is of limited reliability.
Particle size can be critical in the management of dysphagia because larger particles may cause immediate choking or may become lodged in the cheek or under the tongue, posing a risk of aspiration or subsequent choking. Pureed foods should not be granulated, and particle size should not exceed 1 mm. Crushed fruit is less viscous than grated fruit, and its homogeneity contributes to better feeding conditions for dysphagic patients. Both textures have the characteristics of a ready-to-swallow food, preventing choking [42,43].
Bananas are commonly consumed as a paste obtained by mashing them with a fork, which has a lower viscosity (0.216 Pa.s) than that of other fruits. This thick puree is suitable for dysphagic patients, reducing the risk of aspiration.
3.2.4. Meat and Fish
Meat composition varies based on species, age, sex, diet, and anatomical area. Myofibrillar proteins, such as actin, myosin, and actomyosin, play a crucial role in water retention, protein binding, gelling, and emulsification. Protein solubility is influenced by pH, ionic strength, temperature, solvents, dehydration, and mechanical processing. Increased pH increases water permeability, reduces structural components, and increases meat tenderness [45].
The higher the protein content, the greater the viscosity. Pork has 36% protein and has the maximum viscosity when cooked in DW (99.6 Pa.s). Beef has the lowest protein level (21%) and viscosity (9.6 Pa.s) when cooked in DW.
Chicken and pork cooked in DW had viscosities of 28.4 Pa.s and 99.6 Pa.s, respectively, at 2.5 rpm. Chicken and pork cooked in DW showed a significant decrease in viscosity, an increase in pH and electrical conductivity of the cooking water, which can be explained by the increase in the ionic strength of the medium and the protein bonds that complex with magnesium and calcium; in the case of actomyosin, this exposes more binding sites and increases the structural space of the myofibril, which promotes water absorption capacity [42].
Beef has the lowest viscosity in DW because its muscle cells and the proteins extracted by grinding have been broken down. Texture properties are influenced by moisture and fat content, which determine water retention and emulsion stability. Turkey and beef exhibited increased viscosity at TW, accompanied by a significant increase in dry matter, suggesting reduced water absorption by the meat [46].
Fish have less connective tissue than meat and more thermally unstable collagen, which melts when cooked. The qualities of its muscular fibers affect the texture of cooked fish. The two varieties of fish cooked in DW had identical viscosity results. The decrease in viscosity of the two kinds in TW could be attributed to an increase in ionic strength between actomyosin muscle filaments or the formation of complexes with calcium ions. These improvements enhance the fish's ability to retain water, resulting in more succulent flesh [46].
The meat and fish samples displayed shear-thinning behavior, with the apparent viscosity decreasing as the cutting speed increased.
3.2.5. Pulses
Pea puree has the lowest viscosity of the pulses, which could be attributed to a decrease in particle size and lower attractive forces between molecules after heating. White beans, which require the least force to distort, were chosen for testing. When cooked, white beans rise in soluble solids and hence have a higher dry matter content, which may explain the increase in viscosity. The increased viscosity of pea purée and white beans cooked with TW could be attributed to an increase in the medium's ionic strength. This enhances electrostatic attraction, which is supplemented by hydrophobic interactions, resulting in molecular precipitation and aggregation. Chickpeas absorbed more water when cooked in TW, which could explain why their viscosity decreased. Some research suggests that the vegetable's reduced viscosity is attributed to its lower lipid content. Pulses exhibited shear-thinning behavior, with the apparent viscosity decreasing as the cutting speed increased, consistent with findings from a pea research study [45,47,48].
Figure 1 shows an overview of the viscosity values obtained for the different food groups at a speed of 2.5 rpm.
Apart from carbohydrates (CH), grated fruit (Fru_Gr) and crushed fruit (Fru_Cr), all other foods had median viscosity values under 50 Pa.s. A high starch content can increase carbohydrate viscosity. In the fruit group, cooked fruit had the lowest viscosity values.
There is no correlation between food viscosity and the corresponding IDDSI scale values (R² = 0.0031). Therefore, the scales should be used independently to compare different foods (Table 1).
3.3. Texture Profile of Menus
The results of the texture analysis are shown in Table 6. Regarding firmness, except for main course 4, most prepared meals had negative values, suggesting that the food was not firm and that the texturometer might be measuring a different parameter of firmness.
It is common for meat purees to appear coarser, grainier, and with larger particles than vegetable purees, so it may be necessary to add liquid to ensure a moist, cohesive product [49].
Cohesiveness is related to the consistency of the food; if the food does not disintegrate in the first cycle, the value will be close to 1, indicating less fragmentation into particles in the oropharynx and greater safety for dysphagic patients. However, if the food disintegrates completely, the value will be close to zero [50].
Adhesiveness is related to difficulty swallowing and, in older people, the sensation of a residue in the mouth. Low adhesiveness values are best for dysphagic patients as they may facilitate swallowing [51].
Elasticity corresponds to the food's viscoelastic properties and its ability to expand and contract during chewing. Chewability relates to how easily the food can be bitten into. Meat and pulses had high chewability scores, which may indicate difficulty in biting [50].
Gumminess indicates the work required to turn semi-solid foods into a swallowable cake [52]. Meals containing meat or pulses had high gumminess scores, which may indicate difficulty in preparing the food for swallowing.
Physiological factors such as the degree of salivation or the temperature of the oral cavity, which contribute to swallowing, may limit the results obtained with the TPA [51].
4. Conclusions
This work enabled the creation of tables detailing the rheological properties of foods, including viscosity and texture, and incorporated the fork and syringe tests as examples of IDDSI flow tests. The tests were conducted on the foods most consumed by the elderly in Portugal, and proposals were made for menus that would meet the minimum daily requirement of 1,500 kcal.
If properly balanced and prepared as proposed in this study, the dysphagia diet can replace a regular consistency diet with the same nutritional value, providing a safe, balanced, and pleasant diet for the patient.
Most foods showed differences in viscosity when cooked in different waters (DW or TW), with TW yielding higher consistency. Based on the results and methodology, the rheological behavior of the studied foods can be classified as shear-thinning.
However, carers and health professionals need to utilize these tables to assess their functionality. To complement this study, it would be important to conduct a sensory evaluation of dysphagic patients and, if possible, correlate the rheological parameters with the degree of difficulty in swallowing.
Supplementary Materials
The following supporting information can be downloaded at: Preprints.org, Table S1: Process of homogenizing cooked food; Table S2: The process of homogenising food consumed fresh (fruit); Table S3: Analytical methods used for water characterization; Table S4: Composition of the soups and their nutritional value. Soups were prepared in demineralized water (DW); Table S5: Composition of the main course and its nutritional value. Meals prepared in demineralized water (DW); Table S6: Composition of the dessert (fruit) and its nutritional value; Table S7: Characterization of demineralized water (DW) and tap water (TW); Table S8: pH and electric conductivity of demineralized water (DW) and tap water (TW) used to cook the foods; Table S9: Relationship between the rotational speed and shear rate.
Author Contributions
Conceptualization, CMMA and LP; methodology, CMMA, JM and LP.; formal analysis: JB and JM; resources, CMMA, JM and LP; data curation, CMMA and LP; writing—original draft preparation, CMMA and LP; writing—review and editing, CMMA, JM and LP. All authors have read and agreed to the published version of the manuscript.
Funding
This research received no external funding.
Institutional Review Board Statement
Not applicable.
Informed Consent Statement
Not applicable.
Data Availability Statement
The original contributions presented in this study are included in the article/supplementary material. Further inquiries can be directed to the corresponding author.
Acknowledgments
The authors thank the following colleagues, engaged directly in the relationships with the housing and care centers for the elderly, namely Residências Montepio (Portugal): Mariana Cerdeira (pharmacist), Diogo Catita (nutritionist), and Rita Franco (speech therapist). Furthermore, the authors would like to thank you for your willingness to share your knowledge of the behaviour and feeding difficulties of older people, particularly those with swallowing difficulties.
Conflicts of Interest
The authors declare no conflicts of interest.
Abbreviations
The following abbreviations are used in this manuscript:
| EC | Electrical Conductivity |
| DW | Desmineralized Water |
| TW | Tat Water |
| IDDSI) | International Dysphagia Diet Standardisation Initiative |
| PDMS | Polydimethylsiloxane |
| TMD | Texture-modified diets |
| TPA | Texture Profile Analysis |
References
- Raheem, D; Carrascosa, C; Ramos, F; Saraiva, A; Raposo, A. Texture-Modified Food for Dysphagic Patients: A Comprehensive Review. Int J Environ Res Public Health 2021, 18, 5125. [Google Scholar] [CrossRef]
- Roberts, H; Lambert, K; Walton, K. The Prevalence of Dysphagia in Individuals Living in Residential Aged Care Facilities: A Systematic Review and Meta-Analysis. Healthcare (Basel) 2024, 12, 649. [Google Scholar] [CrossRef]
- Engberg, AV; Rångevall, G; Eriksson, K; Tuomi, L. Prevalence of Dysphagia and Risk of Malnutrition in Elderly Living in Nursing Homes. Dysphagia 2024, 39, 1065–70. [Google Scholar] [CrossRef]
- Leira, J; Maseda, A; Lorenzo-López, L; Cibeira, N; López-López, R; Lodeiro, L; Millán-Calenti, JC. Dysphagia and its association with other health-related risk factors in institutionalized older people: A systematic review. Arch Gerontol Geriatr 2023, 110, 104991. [Google Scholar] [CrossRef] [PubMed]
- Viñas, P; Martín-Martínez, A; Cera, M; Riera, SA; Escobar, R; Clavé, P; Ortega, O. Characteristics and Therapeutic Needs of Older Patients with Oropharyngeal Dysphagia Admitted to a General Hospital. J Nutr Health Aging 2023, 27, 996–1004. [Google Scholar] [PubMed]
- Cichero, JA; Lam, P; Steele, CM; Hanson, B; Chen, J; Dantas, RO; Duivestein, J; Kayashita, J; Lecko, C; Murray, J; Pillay, M; Riquelme, L; Stanschus, S. Development of International Terminology and Definitions for Texture-Modified Foods and Thickened Fluids Used in Dysphagia Management: The IDDSI Framework. Dysphagia 2017, 32, 293–314. [Google Scholar] [PubMed]
- Peleg, M. The instrumental texture profile analysis revisited. J Texture Stud 2019, 50, 362–68. [Google Scholar]
- Abd Aziz, ZH; Katas, H; Omar, MS; Mohamed Shah, N; Yusop, SM. Formulation and Cost-Effectiveness of Fluid Gels as an Age-Appropriate Dosage Form for Older Adults with Dysphagia. Dysphagia 2022, 37, 1022–34. [Google Scholar]
- Giura, L; Urtasun, L; Belarra, A; Ansorena, D; Astiasarán, I. Exploring Tools for Designing Dysphagia-Friendly Foods: A Review. Foods 2021, 10, 1334. [Google Scholar] [CrossRef]
- Ismael-Mohammed, K; Bolivar-Prados, M; Laguna, L; Clavé, P. Measuring the Rheological and Textural Properties of Thick Purees Used to Manage Patients with Swallowing Disorders. Nutrients 2023, 15, 3767. [Google Scholar] [CrossRef]
- Passos, L; Tavares, J; Figueiredo, D. Assessing Caregivers' Skills in Assisting People with Dementia during Mealtime: Portuguese Cultural Adaptation of the Feeding Skills Checklist. Int J Environ Res Public Health 2021, 18, 6467. [Google Scholar] [CrossRef]
- APHA, Standard Methods for the Examination of Water and Wastewater. American Public Health Association, American Water Works Association, Water Environment Federation, 2012.
- Steele, CM; Namasivayam-MacDonald, AM; Guida, BT; Cichero, JA; Duivestein, J; Hanson, B; Lam, P; Riquelme, LF. Creation and Initial Validation of the International Dysphagia Diet Standardisation Initiative Functional Diet Scale. Arch Phys Med Rehabil 2018, 99, 934–44. [Google Scholar] [CrossRef]
- IDSSI. The IDDSI Framework and Descriptors are licensed under the Creative Commons Attribution-Sharealike 4.0 International License https://creativecommons.org/licenses/by-sa/4.0/, IDDSI 2.0. | July . 2019. [Google Scholar]
- Uniyal, P; Dinesh Puri, D; Nainwal, P. Establishing correlations between different spindle and rpm for viscosity determination. Research Journal of Pharmaceutical Sciences 2023, 12, 1–3. [Google Scholar]
- EU. Regulation (EU) No 1169/2011 of the European Parliament and of the Council of 25 October 2011 on the provision of food information to consumers. Official Journal of the European Union 22/11/2011. 2011, L304/18. [Google Scholar]
- Catarina, B; Pedro, P; Helena, R. Roda da Alimentação Mediterrânica e Pirâmide da Dieta Mediterrânica: comparação entre os dois guias alimentares. Acta Portuguesa de Nutrição 2018, 06–14. [Google Scholar]
- Ashrafi, N. Effects of Temperature on Rheology of Olive Oils. 2019, 22, 34203. [Google Scholar]
- Moussaoui, D; Chaya, C; Badia-Olmos, C; Rizo, A; Tarrega, A. Effect of pH and Calcium on the Techno Functional Properties of Different Pulse Flours, Pastes, and Gels. Food Bioprocess Technol 2024, 17, 2292–303. [Google Scholar] [CrossRef]
- Fellows, PJ. Tecnologia do Processamento de Alimentos - Princípios e Prática; Artmed Editora, 2018; p. 944. [Google Scholar]
- Dedic, J; Okur, HI; Roke, S. Polyelectrolytes induce water-water correlations that result in dramatic viscosity changes and nuclear quantum effects. Sci Adv 2019, 5, eaay1443. [Google Scholar] [CrossRef]
- Razzak, A; Mahjabin, T; Khan, MRM; Hossain, M; Sadia, U; Zzaman, W. Effect of cooking methods on the nutritional quality of selected vegetables at Sylhet City. Heliyon 9, e21709. [CrossRef] [PubMed]
- Oz, F; Aksu, MI; Turan, M. The Effects of Different Cooking Methods on Some Quality Criteria and Mineral Composition of Beef Steaks. Journal of Food Processing and Preservation 2017, 41, e13008. [Google Scholar] [CrossRef]
- Zargaraan, A; Omaraee, Y; Rastmanesh, R; Taheri, N; Fadavi, G; Fadaei, M; Mohammadifar, MA. Rheological Characterization and Cluster Classification of Iranian Commercial Foods, Drinks and Desserts to Recommend for Esophageal Dysphagia Diets. Iran J Public Health 2013, 42, 1446–56. [Google Scholar]
- de Villiers, M; Hanson, B; Moodley, L; Pillay, M. The impact of modification techniques on the rheological properties of dysphagia foods and liquids. J Texture Stud 2020, 51, 154–68. [Google Scholar] [CrossRef]
- 26; Pinheiro, L; Gonçalves, J; Faustino, C. Viscosity profile of selected monofloral Portuguese honeys; E-Rheo-Iba ( The Ibero-American Journal of Rheology): Valencia, Espanha., 2017; pp. 52–55. [Google Scholar]
- Tao, K; Li, C; Yu, W; Gilbert, RG; Li, E. How amylose molecular fine structure of rice starch affects functional properties. Carbohydr Polym 2019, 204, 24–31. [Google Scholar]
- Azizi, R; Capuano, E; Nasirpour, A; Pellegrini, N; Golmakani, M-T; Hosseini, SMH; Farahnaky, A. Varietal differences in the effect of rice ageing on starch digestion. Food Hydrocolloids 2019, 95, 358–66. [Google Scholar] [CrossRef]
- Diamante, G; Peressini, D; Simonato, M; Anese, M. Effect of continuous cooking on cooking water properties and pasta quality. J Sci Food Agric 2019, 99, 3017–23. [Google Scholar] [PubMed]
- Kaur, L; Singh, N; Singh Sodhi, N; Singh Gujral, H. Some properties of potatoes and their starches I. Cooking, textural and rheological properties of potatoes. 2002, 79, 177–81. [Google Scholar] [CrossRef]
- Bordoloi, A; Kaur, L; Singh, J. Parenchyma cell microstructure and textural characteristics of raw and cooked potatoes. Advances in Potato Chemistry, Nutrition and Technology 2012, 133, 1092–100. [Google Scholar] [CrossRef]
- Dankar, I; Haddarah, A; Sepulcre, F; Pujolà, M. Assessing Mechanical and Rheological Properties of Potato Puree: Effect of Different Ingredient Combinations and Cooking Methods on the Feasibility of 3D Printing. Foods 2020, 9. [Google Scholar] [CrossRef] [PubMed]
- Nabubuya, A; Namutebi, A; Byaruhanga, Y; Schuller, RB; Narvhus, J; Wicklund, T. Viscoelastic properties of sweet potato complementary porridges as influenced by endogenous amylases. Food Science & Nutrition 2017, 5, 1072–78. [Google Scholar] [CrossRef]
- Mahiuddin, M; Godhani, D; Feng, L; Liu, F; Langrish, T; Karim, MA. Application of Caputo fractional rheological model to determine the viscoelastic and mechanical properties of fruit and vegetables. 2020, 163, 111147. [Google Scholar]
- Joyner, HS; Meldrum, A. Rheological study of different mashed potato preparations using large amplitude oscillatory shear and confocal microscopy. 2016, 169, 326–37. [Google Scholar] [CrossRef]
- Tibäck, E; Langton, M; Oliveira, J; Ahrné, L. Mathematical modeling of the viscosity of tomato, broccoli and carrot purees under dynamic conditions. 2014, 124, 35–42. [Google Scholar] [CrossRef]
- Krokida, MK; Maroulis, ZB; Saravacos, GD. Rheological Properties of Fluid Fruit and Vegetable Puree Products: Compilation of Literature Data. International Journal of Food Properties 2001, 4, 179–200. [Google Scholar] [CrossRef]
- Xu, C; Yu, C; Li, Y. Effect of blanching pretreatment on carrot texture attribute, rheological behavior, and cell structure during cooking process. Food Science and Technology 2015, 62, 48–54. [Google Scholar]
- Waldron, KW; Smith, AC; Parr, AJ; Ng, A; Parker, ML. New approaches to understanding and controlling cell separation in relation to fruit and vegetable texture. Trends in Food Science & Technology 1997, 8, 213–21. [Google Scholar] [CrossRef]
- Olaru LD; Nistor O-V;Andronoiu DGTrends in Food Science & Technology, 1997 Ghinea IO, Barbu V, Botez E. Effect of added hydrocolloids on ready-to-eat courgette (Cucurbita pepo) puree ohmically treated. 2022, 59, 388–96.
- Dutta, D; Dutta, A; Raychaudhuri, U; Chakraborty, R. Rheological characteristics and thermal degradation kinetics of beta-carotene in pumpkin puree. 2006, 76, 538–46. [Google Scholar] [CrossRef]
- Buergy, A; Rolland-Sabaté, A; Leca, A; Falourd, X; Foucat, L; Renard, CMGC. Pectin degradation accounts for apple tissue fragmentation during thermomechanical-mediated puree production. Food Science and Technology 2021, 120, 106885. [Google Scholar] [CrossRef]
- Buergy, A; Rolland-Sabaté, A; Leca, A; Renard, CMGC. Apple puree's texture is independent from fruit firmness. 2021, 145, 111324. [Google Scholar]
- Ditchfield, C; TC, C.; Rakesh, S; Toledo, RT. Rheological Properties of Banana Puree at High Temperatures. International Journal of Food Properties 2004, 7, 571–84. [Google Scholar] [CrossRef]
- Ong, KS; Chiang, JH; Sim, SYJ; Liebl, D; Madathummal, M; Henry, CJ. Functionalising insoluble pea protein aggregates using high-pressure homogenisation: Effects on physicochemical, microstructural and functional properties. 2022, 34, 100298. [Google Scholar] [CrossRef]
- Cevik, M; Icier, F. Characterization of viscoelastic properties of minced beef meat thawed by ohmic and conventional methods. Food Science and Technology International 2019, 26, 277–90. [Google Scholar] [CrossRef]
- Xiao, H; Yu, J; Song, L; Hu, M; Guo, H; Xue, Y; Xue, C. Characterization of flesh firmness and ease of separation in the fermentation of sea bass in terms of protein structure, texture, and muscle tissue structural changes. Food research international 2022, 162, 111965. [Google Scholar]
- Klug, TV; Martínez-Sánchez, A; Gómez, PA; Collado, E; Aguayo, E; Artés, F; Artés-Hernández, F. Improving quality of an innovative pea puree by high hydrostatic pressure. J Sci Food Agric 2017, 97, 4362–69. [Google Scholar] [CrossRef]
- Ettinger, L; Keller, HH; Duizer, LM. Characterizing commercial pureed foods: sensory, nutritional, and textural analysis. J Nutr Gerontol Geriatr 2014, 33, 179–97. [Google Scholar]
- Paredes, J; Cortizo-Lacalle, D; Imaz, AM; Aldazabal, J; Vila, M. Application of texture analysis methods for the characterization of cultured meat. Sci Rep 2022, 12, 3898. [Google Scholar] [CrossRef]
- Park, JW; Lee, S; Yoo, B; Nam, K. Effects of texture properties of semi-solid food on the sensory test for pharyngeal swallowing effort in the older adults. BMC Geriatr 20, 493. [CrossRef] [PubMed]
- Sharma, M; Kristo, E; Corredig, M; Duizer, L. Effect of hydrocolloid type on texture of pureed carrots: Rheological and sensory measures. 2017, 63, 478–87. [Google Scholar] [CrossRef]
Figure 1.
Box-plot of viscosity of the cooked (DW) and fresh foods (grated and crushed) grouped by food groups at 2.5 rpm. Legend: Veg (vegetables), Tub (tubers), Leg (pulses), CH (carbohydrates), Fru_Ck (cooked fruit), Fru_Gr (grated fruit), Fru_Cr (crushed fruit).
Figure 1.
Box-plot of viscosity of the cooked (DW) and fresh foods (grated and crushed) grouped by food groups at 2.5 rpm. Legend: Veg (vegetables), Tub (tubers), Leg (pulses), CH (carbohydrates), Fru_Ck (cooked fruit), Fru_Gr (grated fruit), Fru_Cr (crushed fruit).
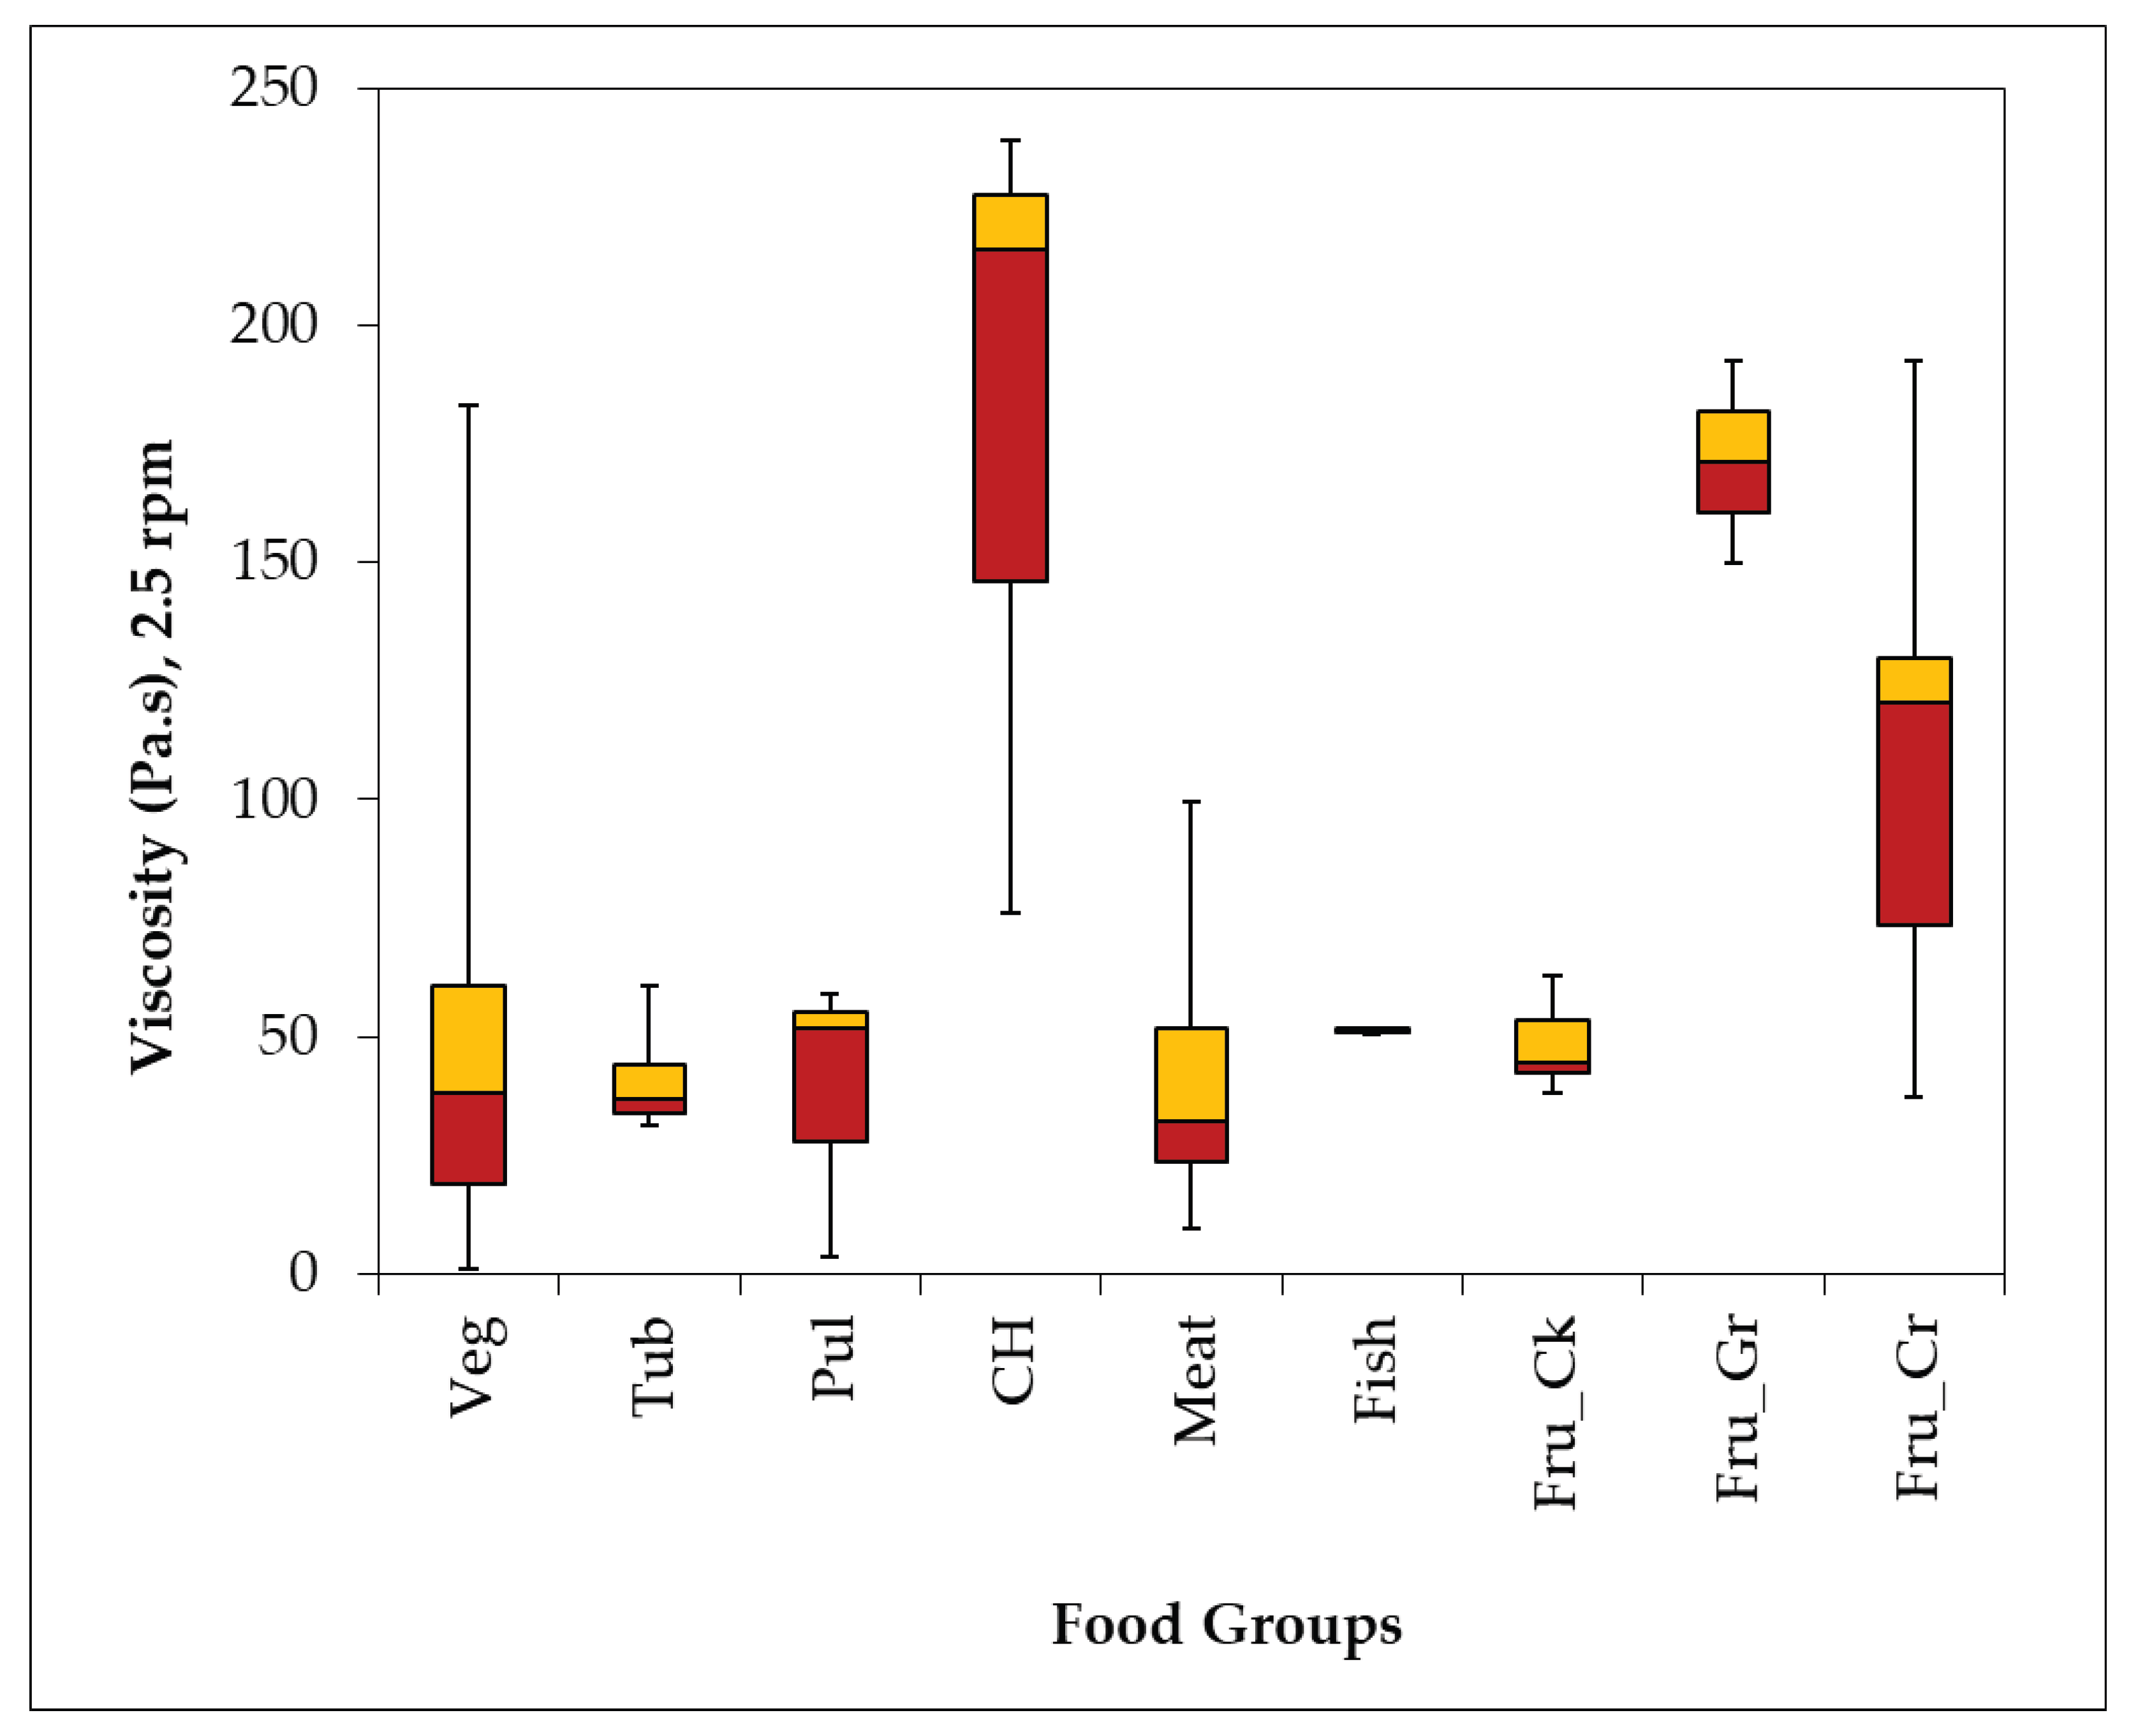

Table 1.
Foods selected for consistency characterization.
| Food Group | Food |
|---|---|
| Meat and fish | Minced rump steak, chicken steak, turkey steak, pork steak, catfish fillets, Tilapia fillets |
| Vegetables | Yellow and butternut pumpkin, baby watercress, leek, aubergine, broccoli (flower), onion, carrot, courgette, cauliflower (flower), spinach, turnip, turnip greens, tomato |
| Pulses | Peas, white beans, chickpeas |
| Cereals and derivatives, tubers | Rice (Arborio and Carolino), white potatoes, red potatoes, sweet potatoes, spaghetti |
| Fruits | Clementines, bananas, oranges, apples (Gala, Golden, Starking, Reineta and Fugi), Rocha pears |
| Fats and oils | Olive oil |
Table 2.
Grouping vegetables by type of cutting.
| Portions, 2-3 cm | Slices, 1 cm | Flower | Whole leaves |
|---|---|---|---|
| Butternut squash Yellow squash White potato Purple potato Onion Apples Turnip Rocha pear Seedless tomatoes |
Leek Sweet potato Carrot Courgette |
Broccoli Cauliflower |
Baby watercress Spinach Turnip greens |
Table 3.
Daily nutritional value corresponding to the two main meals (lunch and dinner).
| Lunch (S + M + D) | Dinner (S + M + D) | Kcal/day | ||||
|---|---|---|---|---|---|---|
| S2 | M4 | D2 | S1 | M2 | D1 | 1502.3 |
| 39.6 | 593 | 64.4 | 46.4 | 654.4 | 104.5 | |
| S1 | M1 | D1 | S2 | M2 | D2 | 1579.5 |
| 46.4 | 670.2 | 104.5 | 39.6 | 654.4 | 64.4 | |
| S3 | M3 | D3 | S4 | M4 | D4 | 1639.2 |
| 54.3 | 661.4 | 104.8 | 49.9 | 593 | 175.8 | |
| S4 | M1 | D4 | S3 | M3 | D3 | 1716.4 |
| 49.9 | 670.2 | 175.8 | 54.3 | 661.4 | 104.8 | |
S – soup (100 g); M – main course (200 g); D – dessert (100 g).
Table 4.
Comparison between the apparent viscosity of the cooked foods in demineralized (DW) and the scale established based on the IDDSI values (n=3).
Table 4.
Comparison between the apparent viscosity of the cooked foods in demineralized (DW) and the scale established based on the IDDSI values (n=3).
| IDDSI levels | Food | Preparation | DW | |||
|---|---|---|---|---|---|---|
|
η (Pa⋅s) 2.5 rpm |
η (Pa⋅s) 5 rpm |
η (Pa⋅s) 10 rpm |
||||
| Level 4 | 4 A | Butternut squash | Mashed | 68.9 ± 3.60 | 46.2 ± 7.69 | 24.6 ± 2.51 |
| Yellow squash | Mashed | 56.6 ± 10.4 | 32.5 ± 12.22 | 15.8 ± 4.13 | ||
| Fugi apple | Mashed | 56.2 ± 6.80 | 31.7 ± 4.61 | 18.8 ± 1.27 | ||
| Gala apple | Mashed | 43.4 ± 7.59 | 24.0 ± 4.97 | 14.8 ± 2.68 | ||
| Golden apple | Mashed | 42.0 ± 2.13 | 26.8 ± 3.90 | 14.3 ± 0.12 | ||
| Reineta apple | Mashed | 37.9 ± 4.76 | 25.1 ± 1.34 | 15.0 ± 0.81 | ||
| Starking apple | Mashed | 62.9 ± 3.85 | 33.2 ± 4.64 | 20.5 ± 1.26 | ||
| Rocha pear | Mashed | 45.5 ± 6.28 | 24.1 ± 4.89 | 14.1 ± 1.91 | ||
| 4 B | White potato | Mashed | 31.4 ± 16.9 | 15.0 ± 1.97 | 8.70 ± 2.57 | |
| Sweet potato | Mashed | 38.6 ± 2.69 | 23.9 ± 2.07 | 14.6 ± 1.31 | ||
| Purple potato | Mashed | 34.7 ± 0.17 | 23.6 ± 6.64 | 14.2 ± 2.40 | ||
| Turnip | Mashed | 174.5 30± 37.5 | 112.6 ± 3.68 | --- | ||
| 4 C | Carrot | Crushed | 60.6 ± 0.51 | 37.8 ± 9.79 | 26.3 ± 2.33 | |
| Cauliflower | Crushed | 3.09 ± 0.20 | 1.59 ± 0.39 | 1.11 ± 0.18 | ||
| Courgette | Crushed | 38.1 ± 12.70 | 12.1 ± 3.34 | 8.17 ± 3.07 | ||
| Tomato | Crushed | 19.1 ± 1.75 | 10.1 ± 1.92 | 6.54 ± 1.52 | ||
| 4 D | Catfish | Crushed | 50.6 ± 25.0 | 26.3 ± 3.68 | 14.2 ± 1.23 | |
| Tilapia fish | Crushed | 51.7 ± 15.8 | 21.5 ± 4.04 | 13.2 ± 1.83 | ||
| Level5 | 5 A | Baby Watercress | Crushed | 5.56 ± 1.58 | 4.12 ± 0.44 | 1.85 ± 0.47 |
| Leek | Crushed | 30.7 ± 8.40 | 24.4 ± 5.21 | 13.9 ± 3.52 | ||
| Aubergine | Crushed | 39.6 ± 7.69 | 23.9 ± 2.77 | 17.8 ± 30.54 | ||
| Broccoli | Crushed | 183 ± 13.8 | 84.9 ± 6.30 | 55.5 ± 1.71 | ||
| Onion | Crushed | 30.0 ± 3.13 | 13.9 ± 1.75 | 9.90 ± 1.92 | ||
| Spinach | Crushed | 1.22 ± 0.20 | 0.78 ± 0.13 | 0.54 ± 0.02 | ||
| Turnip | Crushed | 9.45 ± 1.40 | 5.46 ± 0.18 | --- | ||
| 5 B | Peas | Food mill stainless steel | 3.69 ± 3.86 | 1.87 ± 1.56 | 1.64 ± 0.75 | |
| White beans | 59.0 ± 9.43 | 44.0 ± 5.78 | 29.2 ± 2.64 | |||
| Chickpeas | 51.7 ± 1.53 | 26.2 ± 1.36 | 17.3 ± 0.42 | |||
| Level 6 | 6 A | Arborio Rice | Crushed | 215.5 ± 7.22 | --- | --- |
| Carolino Rice | Crushed | 76.1 ± 6.59 | 50.6 ± 4.30 | 37.8 ± 3.40 | ||
| Spaghetti | Crushed | --- | --- | --- | ||
| 6 B | Chicken steak | Crushed | 28.4 ± 2.88 | 11.8 ± 2.29 | 5.79 ± 0.29 | |
| Meat Turkey steak | Crushed | 35.9 ± 13.7 | 19.4 ± 2.88 | 10.9 ± 1.52 | ||
| Pork steak | Crushed | 99.6 ± 19.7 | 70.3 ± 7.12 | 40.9 ± 5.78 | ||
| Beef ste | Crushed | 9.60 ± 0.68 | 6.36 ± 0.51 | 3.42 ± 0.54 | ||
Legend: 4 A (easily crushable, no need to crush, no water added); 4 B (easily crushable, no need to crush, water added); 4 C (easily crushable, not homogeneous with some lumps, need to crush, no water added); 4 D (easily crushable, not homogeneous with some lumps, need to crush, water added); 5 A (kneaded with medium force (peel, flowers or leaves), not homogeneous, must be crushed, no water added); 5 B (kneaded with force greater than 5A, skin present, must use cheesecloth); 6 A (kneaded not homogeneous and forms a dense mass, must be crushed and water added); 6 B (kneaded with great difficulty, leaving large pieces, must be crushed and water added).
Table 5.
Comparison between the apparent viscosity of the cooked foods in tap water (TP) and the scale established based on the IDDSI values (n=3).
Table 5.
Comparison between the apparent viscosity of the cooked foods in tap water (TP) and the scale established based on the IDDSI values (n=3).
| IDDSI levels | Food | Preparation | TP | |||
|---|---|---|---|---|---|---|
|
η (Pa⋅s) 2.5 rpm |
η (Pa⋅s) 5 rpm |
η (Pa⋅s) 10 rpm |
||||
| Level 4 | 4 A | Butternut squash | Mashed | 88.8 ± 9.92 | 52.1 ± 15.44 | 30.9 ± 4.68 |
| Yellow squash | Mashed | 18.2 ± 3.73 | 7.46 ± 3.62 | 5.44 ± 0.90 | ||
| Fugi apple | Mashed | 37.7 ± 20.02 | 26.8 ± 6.47 | 13.8 ± 3.79 | ||
| Gala apple | Mashed | 45.7 ± 6.27 | 19.0 ± 2.63 | 19.3 ± 0.72 | ||
| Golden apple | Mashed | 55.9 ± 6.00 | 39.7 ± 3.76 | 20.9 ± 1.35 | ||
| Reineta apple | Mashed | 78.7 ± 9.86 | 38.6 ± 7.27 | 19.8 ± 1.00 | ||
| Starking apple | Mashed | 46.8 ± 5.31 | 35.8 ± 5.46 | 19.9 ± 2.11 | ||
| Rocha pear | Mashed | 74.6 ± 8.42 | 46.3 ± 5.13 | 30.4 ± 3.62 | ||
| 4 B | White potato | Mashed | 97.4 ± 25.11 | 66.6 ± 8.42 | 36.7 ± 2.19 | |
| Sweet potato | Mashed | 55.4 ± 52.9 | 38.7 ± 29.1 | 23.9 ± 13.9 | ||
| Purple potato | Mashed | 34.6 ± 9.04 | 25.4 ± 6.45 | 15.9 ± 3.86 | ||
| Turnip | Mashed | 144.7 ± 60.3 | 100.8 ± 13.0 | --- | ||
| 4 C | Carrot | Crushed | 86.8 ± 29.6 | 48.8 ± 6.88 | 31.7 ± 3.25 | |
| Cauliflower | Crushed | 4.75 ± 0.54 | 2.52 ± 0.40 | 1.43 ± 0.15 | ||
| Courgette | Crushed | 11.1 ± 3.84 | 6.68 ± 1.69 | 4.05 ± 1.10 | ||
| Tomato | Crushed | 30.2 ± 4.42 | 20.3 ± 1.95 | --- | ||
| 4 D | Catfish | Crushed | 37.7 ± 3.69 | 19.8 ± 2.52 | 10.6 ± 1.60 | |
| Tilapia fish | Crushed | 24.6 ± 4.24 | 12.9 ± 2.03 | 6.42 ± 1.53 | ||
| Level5 | 5 A | Baby Watercress | Crushed | 3.58 ± 0.35 | 2.08 ± 0.02 | 2.04 ± 0.32 |
| Leek | Crushed | 23.8 ± 0.34 | 17.4 ± 5.23 | 12.8 ± 3.26 | ||
| Aubergine | Crushed | 54.5 ± 0.68 | 36.6 ± 5.81 | 25.4 ± 2.67 | ||
| Broccoli | Crushed | 210 ± 4.87 | 109 ± 8.88 | --- | ||
| Onion | Crushed | 24.2 ± 2.78 | 13.6 ± 0.21 | 7.32 ± 1.32 | ||
| Spinach | Crushed | 1.19 ± 0.07 | 0.76 ± 0.16 | 0.41 ± 0.07 | ||
| Turnip | Crushed | 8.80 ± 0.29 | 3.96 ± 0.92 | 2.34 ± 0.49 | ||
| 5 B | Peas | Food mill stainless steel | 7.39 ± 2.03 | 6.66 ± 0.05 | 4.64 ± 0.63 | |
| White beans | 68.9 ± 13.9 | 49.7 ± 3.38 | 34.9 ± 2.15 | |||
| Chickpeas | 38.6 ± 10.9 | 45.1 ± 4.83 | 14.5 ± 10.1 | |||
| Level 6 | 6 A | Arborio Rice | Crushed | 221 ± 8.92 | --- | --- |
| Carolino Rice | Crushed | 95.8 ± 11.27 | 67.8 ± 6.66 | 50.5 ± 3.81 | ||
| Spaghetti | Crushed | 239.3 | --- | --- | ||
| 6 B | Chicken steak | Crushed | 0.57 ± 0.59 | 0.51 ± 0.18 | 0.18 ± 0.02 | |
| Meat Turkey steak | Crushed | 126.2 ± 61.3 | 41.9 ± 7.12 | 22.9 ± 2.12 | ||
| Pork steak | Crushed | 58.2 ± 0.17 | 33.1 ± 3.31 | 12.4 ± 2.59 | ||
| Beef ste | Crushed | 51.8 ± 27.83 | 79.1 ± 6.02 | 33.1 ± 6.45 | ||
Legend: 4 A (easily crushable, no need to crush, no water added); 4 B (easily crushable, no need to crush, water added); 4 C (easily crushable, not homogeneous with some lumps, need to crush, no water added); 4 D (easily crushable, not homogeneous with some lumps, need to crush, water added); 5 A (kneaded with medium force (peel, flowers or leaves), not homogeneous, must be crushed, no water added); 5 B (kneaded with force greater than 5A, skin present, must use cheesecloth); 6 A (kneaded not homogeneous and forms a dense mass, must be crushed and water added); 6 B (kneaded with great difficulty, leaving large pieces, must be crushed and water added).
Table 6.
Texture profile of each component of the proposed menus: soup (S), main course (M), and dessert (D).
Table 6.
Texture profile of each component of the proposed menus: soup (S), main course (M), and dessert (D).
| Menu | Firmness (g) | Adhesiveness (g.s.) | Springiness | Cohesiveness | Gumminess (g) | Chewiness |
|---|---|---|---|---|---|---|
| S1 | -0.426±0.174 | -2.625±0.321 | 0.99±0.002 | 0.734±0.009 | -0.31±0.127 | -0.309±0.126 |
| S2 | -0.257±0.050 | -7.776±0.234 | 0.99±0.00 | 0.641±0.020 | -0.171±0.031 | -0.169±0.031 |
| S3 | -0.399±0.075 | -2.628±0.841 | 0.99±0.005 | 0.755±0.009 | -0.296±0.055 | -0.294±0.054 |
| S4 | -0.304±0.115 | -4.665±0.711 | 0.985±0.00 | 0.657±0.011 | -0.205±0.075 | -0.202±0.074 |
| M1 | -3.584±0.192 | -35.729±0.515 | 0.976±0.002 | 0.663±0.035 | -2.482±0.100 | -2.409±0.097 |
| M2 | -2.111±0.090 | -16.337±0.749 | 0.99±0.005 | 0.682±0.015 | -1.439±0.096 | -1.425±0.085 |
| M3 | -7.749±0.331 | -47.298±7.835 | 0.913±0.018 | 0.848±0.063 | -6.574±0.233 | -5.999±0.327 |
| M4 | 0.716±0.091 | -1.508±0.688 | 0.869±0.069 | 0.547±0.016 | 0.392±0.038 | 0.312±0.004 |
| D1 | -2.249±1.484 | -20.52±6.772 | 0.98±0.005 | 0.797±0.034 | -1.793±1.311 | -1.758±1.281 |
| D2 | 0.682±0.068 | -2.769±1.577 | 0.757±0.136 | 0.614±0.058 | 0.386±0.076 | 0.288±0.115 |
| D3 | 0.658±0.216 | -4.88±4.95 | 0.985±0.069 | 0.723±0.205 | 0.439±0.205 | 0.426±0.219 |
| D4 | -0.729±0.166 | -6.284±1.094 | 0.985±0.002 | 0.677±0.043 | -0.478±0.137 | -0.471±0.134 |
Disclaimer/Publisher’s Note: The statements, opinions and data contained in all publications are solely those of the individual author(s) and contributor(s) and not of MDPI and/or the editor(s). MDPI and/or the editor(s) disclaim responsibility for any injury to people or property resulting from any ideas, methods, instructions or products referred to in the content. |
© 2025 by the authors. Licensee MDPI, Basel, Switzerland. This article is an open access article distributed under the terms and conditions of the Creative Commons Attribution (CC BY) license (http://creativecommons.org/licenses/by/4.0/).
Copyright: This open access article is published under a Creative Commons CC BY 4.0 license, which permit the free download, distribution, and reuse, provided that the author and preprint are cited in any reuse.


