
Submitted:
29 December 2025
Posted:
30 December 2025
You are already at the latest version
Abstract
In Candida species, including Candidozyma auris (formerly Candida auris), overexpression of efflux pumps is a well-established mechanism of antifungal resistance. However, accumulating evidence indicates that impaired drug import may also significantly contribute to reduced antifungal susceptibility. Sugar importers, historically viewed solely as hexose transporters (HGTs), are now emerging as potential indirect modulators of antifungal uptake. Here, we performed a comprehensive inventory and functional analysis of the HGT family in C. auris to assess its contribution to antifungal import. Phylogenetic analyses revealed that C. auris HGTs are more closely related to those of Candida albicans (C. albicans) than Saccharomyces cerevisiae (S. cerevisiae). All HGT genes showed basal expression, with several significantly downregulated upon fluconazole (FLC) exposure. To establish functional relevance, we generated a mini-library of HGT deletion mutants. Notably, the Δhgt13 strain exhibited markedly increased FLC resistance, concomitant with reduced intracellular FLC accumulation and decreased membrane permeability. Consistently, molecular docking and molecular dynamics simulations demonstrated strong and stable interactions between FLC and Hgt13p. Together, these findings implicate Hgt13p as a key determinant of FLC import and membrane permeability, revealing reduced FLC import could also contribute to antifungal resistance in C. auris.
Keywords:
Candidozyma auris
; HGT
; fluconazole
; molecular docking
; molecular dynamic simulation
1. Introduction
Human fungal infections range from common superficial conditions to life-threatening invasive diseases caused by pathogens like Candida, Aspergillus, Cryptococcus, and the emerging multidrug-resistant C. auris [1,2]. These infections are a major threat to immunocompromised individuals, including those with HIV/AIDS, undergoing chemotherapy, or in intensive care units [3]. The rising incidence of antifungal resistance driven by overuse of antifungals in medicine and agriculture has severely limited treatment options. Resistance to all major antifungal classes, including azoles, echinocandins, polyenes, and flucytosine, has complicated management and increased mortality [4]. The emergence of pan-resistant strains of C. auris further underscores the urgent need for novel antifungal agents, improved diagnostics, and global stewardship strategies [5].
Antifungal resistance arises through multiple mechanisms that enable fungi to survive otherwise lethal drug exposure. Common strategies include target site alterations, mutations in target genes encoding drug-binding enzymes such as ERG11 in azole resistance or FKS1/FKS2 in echinocandin resistance, and reducing drug affinity [4,6]. Overexpression of efflux pumps, particularly ATP-binding cassette (ABC) and major facilitator superfamily (MFS) transporters, actively expels drugs from the cell [7,8,9,10]. Alterations in membrane sterol composition influence the binding of polyenes such as amphotericin B (AMB) and consequently affect their efficacy [10,11,12,13]. Metabolic bypass pathways can circumvent blocked steps in biosynthetic routes, as seen in flucytosine resistance [14]. Biofilm formation further protects fungal cells through physical barriers and a tolerant subpopulation of persister cells [15]. Additionally, stress response pathways and epigenetic changes can transiently enhance tolerance, contributing to persistent fungal infections even in the absence of classical genetic resistance [16,17].
Permeability constraints play a critical role in antifungal resistance by limiting the intracellular accumulation of drugs through both reduced import and enhanced export [18,19]. Exporters play a central role in azole resistance by actively removing drugs from fungal cells, thereby lowering their intracellular concentration below therapeutic levels. The most prominent are ABC transporters, such as CDR1 and CDR2 in C. albicans and CDR1 in C. auris, which use ATP hydrolysis to efflux a broad range of azoles [20,21]. MFS transporters, notably MDR1 in C. albicans, also contribute to resistance by using the proton motive force to expel drugs [22]. Overexpression of these efflux pumps is often triggered by mutations or hyper activation of transcriptional regulators such as TAC1, which regulates CDR1 in C. auris [23], and MRR1 regulates both MDR1 and CDR1 in other Candida species [22,24]. This pump-mediated export not only confers resistance to multiple azoles but can also lead to cross-resistance to other structurally unrelated antifungals, making efflux systems a key and clinically significant barrier to effective azole therapy.
Cellular permeability constraints imposed by the overexpression of a battery of efflux proteins (exporters) remain as one of the prominent mechanisms of drug resistance employed by most Candida species, C. auris included [20]. However, more recent evidence suggests reduced drug uptake as another mechanism of drug resistance. Azole antifungals, such as FLC, generally enter fungal cells by facilitated diffusion rather than through dedicated high-affinity importers [25,26]. Their uptake is therefore strongly influenced by the physicochemical properties of the cell membrane. Recent studies have pointed out the existence of transporter proteins mediating entry of azoles under specific condition; however, no conserved, essential azole importer has been identified in pathogenic fungi [25]. Consequently, resistance related to import is largely indirect, arising from membrane remodelling that diminishes facilitated influx, often acting in concert with overexpression of efflux pumps to further reduce effective intracellular drug levels. Although a drug importer remains elusive, compelling evidence does point to the role of drug importer-mediated antifungal resistance [26,27].
Sugar importers, while primarily responsible for transporting monosaccharides and disaccharides to fuel fungal metabolism, can also contribute to antifungal drug resistance through more indirect but increasingly recognized mechanisms [28,29]. In Candida and other yeasts, certain hexose transporters and sugar–proton symporters influence the proton motive force and overall membrane potential, which in turn modulates the activity of proton-driven efflux pumps, particularly those of the MFS [30,31]. Sugar transport systems are also linked to nutrient-sensing pathways that regulate stress responses and transporter expression; in nutrient-replete conditions, these pathways can enhance efflux pump production, indirectly promoting azole resistance [32]. Additionally, shifts in carbon source utilization can remodel membrane lipid composition and cell wall architecture, further affecting drug permeability and susceptibility. Recently, HXT4/6/7 have been linked to azole import in Nakaseomyces glabratus (formerly called Candida glabrata), wherein mutations in these genes altered their import capacity, resulting in the development of FLC resistance [28]. In another context, the HGT13 in S. cerevisiae was reported to mediate efflux of the antifungal drug miltefosine, functioning as an efflux pump and thereby reducing intracellular drug accumulation [33]. Similarly, deletion of HXT11 and HXT9 in S. cerevisiae conferred resistance to cycloheximide, sulfometuron methyl, and 4-nitroquinoline-N-oxide (4-NQO), further supporting the role of HGTs in drug import [34]. Additionally, several multi-omics studies of C. auris reported upregulation of several HGT genes implying their role in FLC susceptibility [9,35].
To determine whether the sugar transporters in a WHO-designated critical-priority fungal pathogen C. auris modulate drug import and FLC susceptibility, we conducted a comprehensive analysis of the HGT gene family, coupled with species-specific and comparative phylogenetic studies across related fungi. Antifungal susceptibility testing (AFST) and functional assays revealed that all HGT genes exhibit basal expression, with most showing downregulation under FLC-induced stress. Among the tested HGT genes, Δhgt13 cells appeared to facilitate FLC import, suggesting a possible role in resistance. Molecular docking and simulation studies of the Hgt13p demonstrated a high affinity for FLC binding, involving conserved critical residues, thereby supporting its function as a potential drug importer.
2. Materials and Methods
2.1. Strains and Media
We used the C. auris clade II isolate B11220 (CBS10913T) as the wild type and constructed mutants in this strain. All media components and reagents were of molecular-grade quality and procured from standard commercial suppliers. Growth media included yeast extract, peptone, and dextrose (YPD), along with chemicals such as dimethyl sulfoxide (DMSO) and FLC. The PCR purification kit and genomic cDNA kit were obtained from Thermo Scientific.
2.2. Phylogenetic Analysis of Hgt13p with HGTs
The predicted HGT protein sequences of the C. auris were retrieved from the Candida genome database (CGD). Although with the C. auris sequence, we also retrieved all HGT protein sequences of C. albicans and N. glabratus from the CGD database, along with the HGT protein of the S. cerevisiae from the Saccharomyces Genome database (SGD). To confirm the identity of the 15 putative proteins, we performed the BLASTp analysis. To achieve this, each C. auris HGT protein sequence was BLAST against the C. albicans and S. cerevisiae genomes, and sequences were validated as HGTs based on their percent identity and statistical significance (p-value) (Supplementary Table S1). For the phylogeny construction, amino acid sequences were aligned using MEGA version 11 with the pairwise alignment of the MUSCLE algorithm. Phylogenetic analysis of the 15 C. auris transporters was performed using the Maximum Likelihood method with 1000 bootstrap replicates. The same procedure was applied to construct a multispecies phylogeny including C. albicans, N. glabratus, S. cerevisiae, and C. auris.
2.3. RNA Extraction
RNA was isolated using the hot phenol method. Yeast cells were harvested after cultivation, centrifuged at 4,000 rpm for 5 min, and washed twice with ice-cold DEPC-treated water. The pellet was resuspended in 400 µL TES buffer, mixed with 400 µL acid phenol, vortexed, and incubated at 65°C for 60 min with intermittent mixing. After centrifugation at 4°C for 5 min, the aqueous phase was extracted twice with acid phenol and twice with chloroform. RNA was precipitated with 2-2.5 volumes of 100% ethanol and 10% 3M NaOAc (pH 5.2) for 1 hrs on ice, centrifuged at 4°C for 15 min, washed with 70% ethanol, air-dried, and dissolved in RNase-free water. RNA concentration was determined using a NanoDrop and stored at -80°C.
2.4. cDNA Synthesis
2.4.1. DNase I Treatment
Residual DNA contamination was removed using Thermo Scientific DNase I. A 10 µL reaction containing 5 µg RNA, 1 U DNase I, and 1X DNase I buffer was incubated at 37°C for 60 min, followed by enzyme inactivation with 0.5 µL of 25 mM EDTA at 65°C for 10 min. RNA integrity and DNA removal were verified by PCR amplification of the CauTDH3 gene, with no product indicating successful digestion.
2.4.2. cDNA Synthesis
First-strand cDNA was synthesized using the RevertAid H Minus First Strand cDNA Synthesis Kit (Thermo Scientific). A 12 µL mixture containing 1 µg DNase-treated RNA, 50 µM oligo(dT), and 50 µM random primers was incubated at 65°C for 5 min. An 8 µL cDNA synthesis mix (including Riboloc, reverse transcriptase, 5X buffer, and dNTPs) was added, followed by incubation at 42°C for 60 min and 75°C for 5 min. cDNA quality was confirmed by successful CauTDH3 amplification.
2.5. Quantitative Real-Time PCR and Analysis
Total RNA was quantified using a NanoDrop 2000 spectrophotometer. cDNA was synthesized from 1 µg RNA using the RevertAid H Minus First Strand cDNA Synthesis Kit (Thermo Fisher Scientific, USA; Cat. No. K2562). Quantitative gene expression was analyzed with the CFX96 real-time PCR system (Bio-Rad, USA) using gene-specific primers (Supplementary Table S2) and iTaq Universal SYBR Green Supermix (Bio-Rad; Cat. No. 172-1544). Expression levels were normalized to the CauTDH3 housekeeping gene, and relative quantification was performed using the 2^−ΔCT method. All reactions were conducted in technical triplicates and biological duplicates.
2.6. Construction of HGTs Gene Deletion
C. auris ORFs were disrupted by homologous recombination using a fusion PCR-based cassette containing the NAT1 gene, which encodes nourseothricin acetyltransferase and confers resistance to nourseothricin. The 5′ and 3′ UTR flanking regions of the target gene were PCR-amplified by using gene-specific primers from wild-type genomic DNA, while two NAT1 fragments containing FRT sites were amplified using the NAT1 cassette-specific primers from plasmid pRK625. Each UTR fragment was fused to one half of the NAT1 cassette, with an overlapping region of ~300-350 bp between the two NAT1 halves. All oligonucleotides used in the construction of each gene were given in theSupplementary Table S3.
Transformation of C. auris
The fused PCR constructs were co-transformed into the wild-type strain using a modified lithium acetate/PEG method [36]. C. auris was cultured overnight in YPD at 30°C at 200 rpm, then subcultured to an OD₆₀₀ of 0.1 and grown to 0.6-0.8. Cells were chilled, harvested at 4,000 rpm, washed with sterile water, and resuspended in 50 µL of 100 mM lithium acetate. A transformation mix containing 50% PEG, 1M lithium acetate, denatured ssDNA (10 mg/mL), and 500-1000ng transforming DNA (final volume 360 µL) was added and incubated at 30°C for 45 min. After adding 43 µL DMSO, cells were heat-shocked at 42°C for 15 min, chilled, pelleted, resuspended and incubated in 1mL YPD broth for 1.5-2 hrs. Cells were then plated on YPD agar containing 200 µg/mL nourseothricin. Plates were incubated at 30°C for 24-48 hrs. Successful gene disruption was confirmed by PCR using specific primers flanking the recombination sites (Supplementary Table S3).
2.7. Minimum Inhibitory Concentration (MIC)
YPD media was used to culture C. auris cells at 30°C overnight, and MIC tests were carried out in accordance with Clinical and Laboratory Standards Institute (CLSI) recommendations [37]. For an OD600 nm of 0.1, the cells were diluted in 0.9% saline solution. After that, the cells were diluted 100 times in YPD media. Equal amounts of media and various drug concentrations were present in the wells of round-bottomed, 96-well microtiter plates before the diluted cell suspension was added. For 48 hrs, the plates were incubated at 30°C. Using a Bio-Rad iMark microplate reader, the optical density at OD600 nm was used to evaluate the MIC test endpoint, which was well-defined as the lowest antifungal drug concentration that produced 50% inhibition of growth (MIC50) in comparison to the growth of a drug-free control.
2.8. 3H-FLC Accumulation Assay
The 3H-FLC accumulation assay followed established guidelines [38]. Cells were grown for 16 hrs, washed three times with YNB, and starved of glucose for 3 hrs. Samples were then treated in technical triplicate with 3H-FLC in YNB ±2% glucose, shaken, and incubated for 24 hrs at room temperature. Post-incubation, OD600 was measured for each sample. Samples were mixed with stop solution (YNB + 20 mM FLC), washed once more with YNB, and vacuum-filtered over glass microfiber filters. Filters were rinsed, dipped in scintillation fluid, and radioactivity was measured as counts per minute (CPM). Accumulation values were normalized to CPM per 108 cells using the pre-filtration OD600. For 3H-FLC efflux assays, preloaded samples were washed, resuspended in fresh YNB ±2% glucose, and intracellular 3H-FLC levels were quantified at specified time intervals.
2.9. Membrane Permeability Assay by Using NPN-Based Assay
N-phenyl-1-naphthylamine (NPN), a hydrophobic dye, was used to assess membrane permeability with modification. NPN exhibits high fluorescence upon binding to phospholipids but low fluorescence in aqueous solution [39]. Wild Type and Δhgt13 Candida strains were cultured overnight at 30°C at 200 rpm, washed twice with milli-Q water, and resuspended to 1×10⁵ cells/mL. Cells were incubated with 10 µM NPN for 20 min at 37°C, and fluorescence was measured every 5 min until saturation. Subsequently, NPN-labelled cells were treated with 0.01% SDS (sub-MIC), and fluorescence intensity was recorded every 5 min using a spectrophotometer (λex = 350 nm, λem = 420 nm).
2.10. Glucose Accumulation Assay
To assess the impact of Δhgt13 on glucose accumulation; assays were carried out using both the Δhgt13 mutant and wild-type C. auris cells. Overnight cultures grown in YPD at 30°C with shaking at 200 rpm were harvested by centrifugation at 4000 rpm for 5 min. Secondary culture (OD600 = 0.1) was set up in 10 mL YPD containing 2% glucose. The cells were harvested and the resulting cell pellet was washed with sterilized 0.9% saline. Cell pellet used to determine the glucose content inside the cells was resuspended in 300 µL sterile water, boiled for 10 min at 100°C, centrifuged and the supernatant was collected. The intracellular glucose content in the samples was determined using glucose assay kit using the standard glucose control and following the manufacturer’s recommended protocol.
2.11. Homology Modelling and Docking
The three-dimensional structure of Hgt13p was generated using the AlphaFold3 server (Figure 3bc). The crystal structure of E. coli XylE transporter (PDB ID: 4GZB) with D-glucose served as the reference for the structural analysis of glucose binding with Hgt13p [40]. The SwissDock platform was used for the molecular docking of ligand D-glucose with XylE, using a grid box of size 26 Å ×26 Å ×26 Å, with the sampling exhaustivity 51 [41,42]. The same approach was applied for docking of ligands, D-glucose, and FLC with Hgt13p, us in the same grid box of size 26 Å ×26 Å ×26 Å was centred over the interactive residues of the corresponding XylE-D-glucose complex, conserved within Hgt13p. Out of the 20 best poses, the structure having the lowest RMSD and high binding affinity was selected for molecular interaction analysis, using PyMOL.
2.12. MD Simulation Setup
Molecular dynamics (MD) simulations of Hgt13p and its complexes with D-glucose and FLC were performed using GROMACS 2023.1 [43] with the CHARMM36 force field [44]. The protein and docked complexes were solvated in a cubic box using the TIP3P water model, maintaining a minimum distance of 1.0 nm between the protein surface and the box edge. Ligand parameters were generated using the CHARMM General Force Field (CGenFF) workflow and converted to Gromacs topology (cgenff_charmm2gmx.py) [45]. A symmetric POPC bilayer was constructed containing ~128 lipids (64 per leaflet) using CHARMM-GUI Membrane Builder [46]. The protein–ligand complex was placed approximately centred in the membrane such that membrane-facing regions of protein aligned with the bilayer normal (z-axis). Overlapping lipids within 0.12 nm of protein heavy atoms were removed. The counter ions (Na⁺/Cl⁻) were added to neutralize the system. Energy minimization was conducted using the steepest descent algorithm and conjugate gradient until the system reached a convergence threshold of 1000 kJ/mol/nm, respectively. The system was equilibrated under NVT and NPT ensembles for 100 ps each at 300 K and 1 bar using the V-rescale thermostat and Parrinello-Rahman barostat, respectively. The LINCS algorithm was applied to constrain all bond lengths, and long-range electrostatic interactions were treated with the Particle Mesh Ewald (PME) method. Finally, production MD simulations were run for 250 ns with a time step integration of 2fs, and coordinates were saved at an interval of every 10 ps.
2.13. Trajectory Analysis
The MD trajectories were analysed using standard GROMACS utilities, for root mean square deviation (RMSD), radius of gyration (Rg) and solvent-accessible surface area (SASA) for defining the global structural stability, whereas the free energy landscape (FEL) was constructed using RMSD and Rg as reaction coordinates to identify thermodynamically favourable conformational states [47,48].
2.14. MM-GBSA Free Energy Calculation
Binding free energy calculations were performed using the MM-GBSA (Molecular Mechanics/Generalized Born Surface Area) method as implemented in the gmx_MMPBSA package [47,48]. Representative snapshots extracted from the equilibrated 250 ns MD trajectories were used for analysis. The total binding free energy (ΔGbind) was estimated as the sum of van der Waals (ΔEvdW), electrostatic (ΔEEEL), polar solvation (ΔGGB), and nonpolar solvation (ΔGSA).The energy decomposition plots were used for identifying the spatial contribution of the Hgt13p active site residues in stabilising the ligands. Governing the stability of the Hgt13p-ligand complexes.
3. Results
3.1. Genome-Wide Identification, Homology and Phylogenetic Analysis of HGT Genes in C. auris
To explore the number of putative HGT genes in C. auris, we queried the Candida Genome Database (CGD) (http://www.candidagenome.org) using the updated genome assembly GCA_002759435.3 of clade I reference strain B8441v3 [49]. The corresponding 15 HGT protein sequences were retrieved in FASTA.
To gain deeper insights into the evolutionary relationships of C. auris HGTs, we constructed a phylogenetic tree based on the protein sequences of all 15 putative HGTs (Figure 1a). The resulting tree resolved into two major branches, likely indicating potential functional divergence within the C. auris HGT family. For comparative analysis, the complete sets of HGT protein sequences from C. albicans and N. glabratus were also retrieved. In addition, the full repertoire of hexose transporter (HXT) protein sequences from S. cerevisiae was retrieved from the Saccharomyces Genome Database (SGD) (https://www.yeastgenome.org). The number of HGT genes varied across species, with C. albicans containing 19 genes, S. cerevisiae containing 17 genes, C. auris containing 15 genes, and N. glabratus containing 10 genes (Figure 1b). The phylogenetic analyses were performed to validate transporter identity and assess evolutionary conservation. The comparative Maximum Likelihood phylogeny revealed that C. auris HGTs cluster more closely with orthologs in C. albicans than with those from N. glabratus and S. cerevisiae (Figure 1c). To validate the identity of the 15 predicted C. auris HGT genes, we performed BLASTp (protein-protein BLAST) analysis against the protein databases of C. albicans and S. cerevisiae. The comparative protein homology analysis revealed that the C. auris HGT protein shared sequence identities ranging from 50-79% with C. albicans, whereas the identities with S. cerevisiae were comparatively lower (Supplementary Table S1). These results support the evolutionary conservation of HGT genes between C. auris and C. albicans, while indicating a greater divergence from S. cerevisiae.
3.2. HGTs Exhibit Conserved Sugar-Transporter Domains with Variable Numbers of Transmembrane Helices
We examined the conserved evolutionary and structural features of the 15 predicted C. auris HGTs by analysing their protein sequences using InterProScan, which integrates multiple signature-recognition platforms, including Pfam, PROSITE, SMART, and TIGRFAMs. The analysis detected conserved HGT domains across all HGTs (Supplementary Figure S1a). The size of these conserved domains varied among the transporters, likely reflecting differences in the total length of the respective proteins. Despite this variability, the evolutionary conservation of the domains indicates that these transporters retain the core structural elements essential for substrate recognition and translocation, while also allowing functional diversification.
At the structural level, the HGT genes of C. auris are predicted to encode membrane-bound proteins belonging to the major MFS, a group typically characterized by 12 transmembrane (TM) helices arranged into two pseudo-symmetrical bundles, as described for other fungi [50,51]. To further evaluate this feature, we performed AlphaFold3, a deep learning–based algorithm capable of predicting protein structures with near-experimental accuracy [52]. Structural models of the 15 transporters revealed variation in both the number and arrangement of TM helices, with the number ranging from 9 to 12 helices (Supplementary Figure S1b). Notably, the genomic regions corresponding to these TM domains were not entirely conserved across the transporter genes, indicating potential topological diversity within the C. auris HGT family. Such variation in the number and arrangement of TM helices may reflect functional diversification among the C. auris HGTs. Collectively, these results highlight the evolutionary conservation of HGTs in C. auris, while also revealing structural heterogeneity that may underpin specialized functional roles.
3.3. HGT Genes Show Distinct Expression Patterns under Basal and Fluconazole-Induced Conditions
To investigate the role of HGTs in C. auris, we conducted quantitative real-time PCR (qRT-PCR) analysis to evaluate the basal and FLC-induced expression of 15 predicted HGT genes. We observed that several HGT genes, HGT2, HGT5, HGT7, HGT10, HGT17 and HGT19, exhibited higher basal expression levels than the other HGTs. To explore the relationship between HGT gene expression and antifungal resistance, we analysed transcriptional changes upon exposure to FLC. The FLC-exposed cells exhibited downregulation of several HGT genes, including HGT2, HGT4, HGT5, HGT7, HGT12, HGT13, and HGT14, compared to the control (Figure 2a). Notably, the expression of several other HGT genes (HGT3, HXT5, HGT10, HGT16, HGT17, HGT18 and HGT19) remained unchanged upon FLC treatment. This transcriptional repression may suggest a potential suppression of transporter activity with FLC treatment, which may reflect a broader cellular strategy to minimise drug uptake via facilitated diffusion.
3.4. Δhgt13 Exhibits Enhanced FLC Resistance and Reduced Intracellular Drug Accumulation
To investigate the functional role of HGTs, we deleted the downregulated genes (HGT2, HGT4, HGT12, and HGT13) and two genes (HXT5 and HGT19) whose expression remained non-responsive to drug exposure in CBS10913T using a fusion PCR-based gene disruption method (Table 1). To examine the role of HGTs in antifungal resistance, we performed antifungal susceptibility testing with HGT mutants. Among the mutants, Δhgt13 exhibited a 4-fold increase in MIC50 compared to the wild-type strain. At the same time, other HGT deletants did not show any change in FLC resistance (Figure 2b). To further elucidate the role of HGT13 in FLC susceptibility, we quantified the intracellular accumulation of FLC (3H-FLC) in Δhgt13 (Figure 2c). In the absence of glucose and thus limited ABC transporter activity, Δhgt13 cells exhibited approximately 4-fold less 3H-FLC accumulation than the wild type, indicating reduced drug import. Upon glucose addition (Figure 2c, +GLC), both strains showed a similar decline in intracellular 3H-FLC compared to the glucose deplete conditions, consistent with the activation of efflux. However, even with efflux transporters active in both strains, the Δhgt13 cells still had significantly less intracellular FLC than wild type, further indicating an efflux-independent mechanism of reduced FLC accumulation in the Δhgt13 strain. Collectively, these findings suggest that HGT13 may facilitate the import of FLC in C. auris.
3.5. Δhgt13 Elevates Membrane Rigidity Independently of Glucose Uptake
HGT13 encodes a membrane-localised transporter whose deletion may perturb membrane integrity and diffusion. To check, membrane integrity was assessed using the hydrophobic dye N-phenyl-1-naphthylamine (NPN), which exhibits minimal fluorescence in aqueous environments but becomes strongly fluorescent upon interaction with phospholipids in perturbed membranes [39]. Δhgt13 cells showed a consistent reduction in fluorescence over time compared to the WT strain, suggesting reduced membrane accessibility to NPN. Upon SDS treatment, fluorescence further decreased in the mutant compared to the wild type (Figure 2d), pointing to increased membrane rigidity. Notably, no difference in glucose accumulation was observed between Δhgt13 and its wild-type strains (Figure 2e).
3.6. Molecular Modelling and Docking of Hgt13p
To understand the molecular interaction of D-glucose and FLC with Hgt13p, the three-dimensional structure of the protein was predicted by the AlphaFold3 server [52]. The XylE protein was used as a reference to map the structure of Hgt13p, which is a well-characterized member of the MFS transporter, enabling the identification of the molecular interactions accountable for the and for binding and transportation of D-glucose (Supplementary Figure S2a). The active site residues of crystalized complex, XylE-D-glucose consist of Gln168, Gln175, Gln288, Gln289, Asn294, Gly388, Trp392, Gln415, Ile171, Ile172, Leu297, Tyr298, Gln325, Phe383, and Trp387, Gln419 which are crucial for molecular interactions at the binding pocket (Figure 3a) [40]. However, the crucial interactions of D-glucose with XylE show that ligand is largely stylized by hydrogen bonds interactions with Gln168, Gln175, Gln288, Q289, Asn294, Gly388, and Trp392. To examine the interaction of D-glucose, we additionally performed docking analyses, which yielded consistent results [40]. Docking of D-glucose with the XylE protein revealed that it engages the same active-site region, forming hydrogen-bond interactions specifically with residues Gln175, Gln288, Gln289, Asn294, Asn325, Gly388, and Trp392. Furthermore, to characterise the binding site of Hgt13p, we superimposed its structure with that of the binding site of XylE protein (Supplementary Figure S2b). The structural alignment indicates that the active site of Hgt13p consists of residues that occupy a comparable substrate-binding region, suggesting a conserved architecture underlying ligand recognition (Supplementary Figure S3). The docking of D-glucose with Hgt13p shows hydrogen bond interactions with Gln45, Gln302, Gln303, Tyr340, Asn308 and Asn439 (Figure 3b). Notably, the glucose binding residues (Gln302, Gln303 and Asn308) of Hgt13p occupy analogous positions to the glucose-interacting residues (Gln288, Gln289 and Asn294) in XylE, suggesting the structural conservation of the key substrate-binding domain of HGT proteins. This observation is further supported by the multiple sequence alignment of all 15 HGT proteins, along with XylE, which demonstrated the conserved substrate-interacting residues across the HGT family in C. auris (Figure 3d). Remarkably, three critical XylE residues Gln288, Gln289, and Asn294 are invariant from bacteria to yeast, underscoring their evolutionary importance in sugar molecule transportation, which were observed to be consistent in the HGT family and present within the HGT signature, which is also conserved in the HGT family (Figure 3d). Furthermore, the docking of FLC with Hgt13p revealed polar interactions with Leu408 and Trp412, in addition to Gln302 and Gln303 which also serve as key interaction sites for D-glucose (Figure 3c). This overlap in binding residues indicates that FLC can access the predicted substrate-binding cavity of Hgt13p; however, FLC is largely stabilised by hydrophobic interactions with the active site residues along with hydrogen bond interactions.
3.7. MD Simulations Indicate a High-Affinity Interaction Between Hgt13p and FLC, Supported by Conserved Active-Site Residues
To further validate the molecular interactions and spatial binding stability of D-glucose and FLC with Hgt13p, we performed MD simulations of the docked complexes embedded within a POPC bilayer membrane under physiologically relevant conditions for a period of 250 ns. The structural stability and conformational dynamics of docked complexes were examined using RMSD, Rg, SASA, and RMSF analyses, while hydrogen-bond profiles defined specific ligand interactions. Ligand stability was assessed via ligand-RMSD, and free energy landscape (FEL) analysis identified energetically favourable conformations. The binding free energy (ΔGbind) was further estimated using MM-GBSA calculations, offering a quantitative insight into molecular interactions in energetic terms, defining the binding stability and affinity of ligands with Hgt13p.
3.7.1. Structural Stability of Hgt13p and Docked Complexes
The results of Cα-RMSD show that Hgt13p rapidly stabilized within the initial 10 ns of simulation and remained stable thereafter, with an average RMSD 0.47±0.10 nm (Figure 4a). The Hgt13p-D-glucose complex reached equilibrium around the initial ~20 ns, and remained stable up to 250 ns, whereas the Hgt13p-FLC complex exhibited initial fluctuations before achieving a stable equilibrium at ~80 ns and observed consistent till the end of simulation at 250 ns, reflecting conformational adjustment during ligand accommodation. Another parameter, the radius of gyration (Rg), revealed compact structural conformations for both Hgt13p and the Hgt13p-D-glucose complex [53], with average Rg values of 2.54 ± 0.01 nm and 2.51 ± 0.01 nm, respectively (Figure 4b). The Rg trajectory of the Hgt13p-FLC complex stabilized around ~75 ns and remained quite stable thereafter, indicating that the protein undergoes structural rearrangements to spatially accommodate the FLC within the binding site. Similarly, the SASA analysis revealed stable structural dynamics for all three systems (Hgt13p, Hgt13p-D-glucose, and Hgt13p-FLC), with values remaining consistently stabilized around ~302 ± 2 nm² throughout the 250 ns simulation (Figure 4c). This indicates that the overall surface exposure and structural compactness of the protein remained well preserved during the simulation [53,54].
3.7.2. Spatial Stability of Ligands within the Active Site of Hgt13p
To assess the spatial stability of the ligands within the active site of Hgt13p, we also analysed the RMSD of ligands, D-glucose and FLC with respect to their initial docked conformations during the simulation period of 250 ns (Figure 4d) [47,54]. Results show that D-glucose remained stable (~0.025 nm) up to 150 ns, followed by a shift to ~0.125 nm, indicating a minor conformational reorientation before stabilizing until 250 ns. In contrast, FLC shows a consistent RMSD (~0.075 nm) throughout the simulation, reflecting better spatial stability of FLC within the Hgt13p active site as compared to D-glucose. Moreover, Figure 4d reveals that the Hgt13p-D-glucose complex is largely stabilized by three-six H-bonds interactions during the simulation, whereas only one H-bond interaction observed consistent with FLC during the simulation which indicates the limited contribution of polar interactions in spatially stabilizing FLC within the active site of Hgt13p (Figure 4e). This results observed consistent with molecular docking.
3.7.3. Free Energy Landscape of Hgt13p and Docked Complexes
Furthermore, to characterize the conformational dynamics and stability of Hgt13p and docked complexes with D-glucose and FLC, a two-dimensional free energy landscape (FEL) was constructed using the RMSD and Rg as collective variables (Figure 4f, g, h) [55,56,57]. As shown in Figure 4f, Hgt13p exhibited two major low-energy basins, centred approximately on the Rg value ~2.55-2.57 nm and RMSD ~0.35 nm and ~2.55-2.59 nm and RMSD ~0.50-0.58 nm, respectively, suggesting multiple stable conformations with minor structural flexibility while retaining overall fold stability. The FEL of the Hgt13p–D-glucose complex displayed a single and confined energy basin (Rg ~2.52–2.56 nm; RMSD ~0.28–0.33 nm), indicating a stable conformation of protein-ligand complex (Figure 4g). In contrast, the Hgt13p-FLC complex (Figure 4h) showed single and dominant energy basin (Rg ~2.50-2.55 nm; RMSD ~1.00-1.10 nm), consistent with RMSD results and confirming the stable binding of FLC to Hgt13p.
3.7.4. Binding Free Energy of Ligands
Finally, to quantitatively evaluate the binding affinities and energetic stability of ligand association with Hgt13p, MM-GBSA calculations were performed using equilibrated snapshots from the 250 ns MD trajectories [58]. The total binding free energy (ΔGbind) was decomposed into van der Waals (ΔEvdW), electrostatic (ΔEEEL), polar solvation (ΔGGB), and nonpolar solvation (ΔGSURF) components to elucidate the key energetic contributors to complex stability. The Hgt13p-D-glucose complex exhibited a favourable binding free energy of ΔGbind = -23.57±4.67 kcal/mol, primarily driven by strong electrostatic interactions (ΔEEEL= -45.07±7.20 kcal/mol) and supported by van der Waals forces (ΔEvdW = -20.37 ± 2.70 kcal/mol), which together compensated for the desolvation penalty from polar solvation. Consistent with the molecular docking results, D-glucose shows stable polar interactions with residues Gln303 and Asn308, while Gln302 and Ile174 contributed moderately to stabilize the ligand at the active site (Figure 4d).
Differently, the Hgt13p-FLC complex showed the major contribution of energetic term ΔEvdW -41.72 ± 2.39 kcal/mol followed by ΔEEEL -19.81 ± 4.17 kcal/mol, resulting in an overall binding free energy ΔGbind -34.03 ± 3.63 kcal/mol. FLC shows stable hydrophobic interaction with Ile174, Ile178, and Trp412with Gln302 and Gln303, complemented by polar interaction with Gln302 and Gln303. Additionally, Asn439 and Ile307 contributed moderate polar and hydrophobic interactions, respectively, in stabilizing the complex which was observed consistent with molecular docking (Figure 4e).
Taken together, the MD simulation and MM-GBSA analyses corroborated the molecular docking results, revealing that both ligands bind favourably to Hgt13p. However, FLC exhibited a stronger binding affinity and higher complex stability than D-glucose, consistent with its stable MD trajectory and compact FEL profile.
4. Discussion
Among the various strategies employed by Candida species, including C. auris, enhanced drug efflux mediated by primary ABC and MFS transporters remains the most well-established mechanism of antifungal resistance [18,59]. Although amphiphilic drugs are generally believed to enter cells through passive diffusion, recent evidence suggests that carrier-mediated drug import, resulting in altered intracellular accumulation, also contributes to resistance [27]. Notably, no dedicated drug importer has yet been identified. In this context, HGTs have emerged as potential candidates capable of facilitating drug uptake through a ‘piggyback’ mechanism. Our findings reinforce this emerging concept by demonstrating that HGTs can modulate drug uptake and consequently, influence the development of antifungal resistance in C. auris.
We identified 15 putative HGT genes in C. auris, and phylogenetic clustering suggests that C. auris HGTs are more closely related to those of C. albicans, indicating conserved structural and functional roles within the CTG clade [60,61] and reflecting essential roles of sugar transport systems in metabolic adaptation and environmental sensing in C. species [62,63,64]. Our findings also indicate that the HGT domain is conserved across all 15 identified transporters despite notable variation in protein size. The basal transcriptional activity of most HGT genes under basal conditions indicates that some transporters are actively involved in carbohydrate acquisition. Their altered transcriptional expression upon FLC exposure further indicates a broader physiological roles that extends beyond sugar uptake. This aligns with recent reports suggesting that sugar transport systems can influence cellular homeostasis, stress responses, and membrane energetics-factors that collectively impact antifungal susceptibility [65,66].
Functional analysis of the mini-library of HGT deletions highlighted the specific importance of HGT13 gene in modulating antifungal susceptibility. Notably, Δhgt13 showed a 4-fold increase in FLC resistance, a phenotype not observed in the other tested HGT mutants. This increased resistance was accompanied by decreased intracellular ³H-FLC accumulation, demonstrating that the Δhgt13 mutant cells internalise less FLC than the wild-type. Recent studies in Candida species have identified HGT transporters as contributors to drug import, with their deletion leading to increased drug resistance [28,33]. In contrast, glucose accumulation assays in the Δhgt13 mutant showed no significant change, likely due to compensation by the remaining 14 HGT genes in C. auris. This aligns with findings in C. albicans, where the HGT13 ortholog was also found to be dispensable for glucose transport [28,67]. The Δhgt13 mutant was also found to impact the plasma membrane homeostasis, as was evident from NPN uptake assays, which showed increased membrane rigidity. The combined phenotype, characterised by enhanced resistance along with reduced intracellular drug levels and increased membrane rigidity, supports the hypothesis that HGT13 could impact FLC-import-associated processes (Figure 5).
Furthermore, the computational analysis substantiates the experimental evidence of a functional link between Hgt13p and FLC import. Molecular docking revealed that FLC binds to the key residues of Hgt13p, which overlap with the molecular interactions of D-glucose with the XylE protein [40]. Importantly, MD simulations provided a dynamic characterization of these interactions, revealing their stability and conformational behaviours beyond the static docking predictions [53]. Throughout the simulation, FLC remained consistently engaged within the Hgt13p binding pocket, maintaining stable interactions with key conserved residues, whereas D-glucose exhibited more transient positioning. Moreover, the higher binding free energy calculated for FLC relative to D-glucose further indicates its more stable association with Hgt13p. Together, these computational analyses provide a structural interpretation of the molecular interactions of FLC and D-glucose with Hgt13p, aligning with experimental observation that HGT13 contributes to FLC import and influences susceptibility. The preferential and tighter binding of FLC to Hgt13p compared to D-glucose raises the possibility that azoles may exploit conserved HGT scaffolds as opportunistic entry points, a concept with implications for understanding intrinsic and acquired resistance. Thus, these findings expand the functional repertoire of HGT, highlighting their role as modulators of antifungal susceptibility beyond their conventional roles in nutrient transport.
Supplementary Materials
All supplementary data are available on Preprints.org. Supplementary file 1: DOCX file.
Author Contributions
Conceptualization, P.K., A.H.S., A.P. and R.P.; methodology, P.K., B.D.E., and A.P.; software, P.K. and A.P.; validation, P.K., M.K., A.B., A.H.S., A.P. and R.P.; formal analysis, P.K., M.K., A.S., B.A., O.S.M., B.D.E., A.B., T.C.W., N.A.G., A.H.S., A.P. and R.P.; investigation, P.K., A.H.S., A.P. and R.P.; resources, A.H.S., T.C.W., and R.P.; data curation, P.K., A.S., M.K., B.A., B.D.E., A.B., T.C.W., N.A.G., A.P., and R.P.; writing—original draft preparation, P.K.; writing—review and editing, M.K., A.B., A.H.S. T.C.H., A.P. and R.P.; visualization, P.K., M.K., A.B., A.P. and R.P.; supervision, A.P. and R.P.; project administration, R.P.; funding acquisition, A.B., A.P., A.H.S., and R.P. All authors have read and agreed to the published version of the manuscript.
Funding
This study was funded by the Department of Biotechnology (DBT), Government of India (BT/PR47834/MED/29/1656/2023), to R.P., A.H.S., A.B., and A.P. Acknowledges the Department of Biotechnology support under Boost to University Interdisciplinary Life Science Departments for Education and Research Programme (DBT -Builder), and DBT-PG TEACHING (BT/INF/22/SP25072/2022) support to Amity Institute of Biotechnology, Amity University Haryana. P.K. and S.O.M. acknowledge the Department of Biotechnology (DBT), Government of India, for the award of senior research fellowship (BT/PR47834/MED/29/1656/2023). A.S. acknowledges the Department of Biotechnology, Government of India, for the support of a laboratory assistant (BT/PR47834/MED/29/1656/2023).
Institutional Review Board Statement
Not applicable.
Informed Consent Statement
Not applicable.
Acknowledgments
P.K., M.K., A.S. and B. A. acknowledge the support of the Amity Central Instrument Research facility (CIRF) and Amity Lipidomics Research Facility (ALRF) in carrying out this work.
Conflicts of Interest
The authors declare no conflict of interest.
References
- Kim, J.-Y. Human Fungal Pathogens: Why Should We Learn? J Microbiol 2016, 54, 145–148. [CrossRef]
- Schelenz, S.; Hagen, F.; Rhodes, J.L.; Abdolrasouli, A.; Chowdhary, A.; Hall, A.; Ryan, L.; Shackleton, J.; Trimlett, R.; Meis, J.F.; et al. First Hospital Outbreak of the Globally Emerging Candida Auris in a European Hospital. Antimicrob Resist Infect Control 2016, 5, 35. [CrossRef]
- Forsberg, K.; Woodworth, K.; Walters, M.; Berkow, E.L.; Jackson, B.; Chiller, T.; Vallabhaneni, S. Candida Auris: The Recent Emergence of a Multidrug-Resistant Fungal Pathogen. Med Mycol 2019, 57, 1–12. [CrossRef]
- Anuradha Chowdhary, A.C.; Anupam Prakash, A.P.; Cheshta Sharma, C.S.; Kordalewska, M.; Anil Kumar, A.K.; Smita Sarma, S.S.; Bansidhar Tarai, B.T.; Ashutosh Singh, A.S.; Gargi Upadhyaya, G.U.; Shalini Upadhyay, S.U. A Multicentre Study of Antifungal Susceptibility Patterns among 350 Candida Auris Isolates (2009-17) in India: Role of the ERG11 and FKS1 Genes in Azole and Echinocandin Resistance. 2018.
- Jacobs, S.E.; Jacobs, J.L.; Dennis, E.K.; Taimur, S.; Rana, M.; Patel, D.; Gitman, M.; Patel, G.; Schaefer, S.; Iyer, K.; et al. Candida Auris Pan-Drug-Resistant to Four Classes of Antifungal Agents. Antimicrob Agents Chemother 2022, 66, e00053-22. [CrossRef]
- Carolus, H.; Pierson, S.; Muñoz, J.F.; Subotic, A.; Cruz, R.B.; Cuomo, C.A.; Dijck, P. Genome-Wide Analysis of Experimentally Evolved Candida Auris Reveals Multiple Novel Mechanisms of Multidrug Resistance. mBio 2021, 12, 03333–20. [CrossRef]
- Wasi, M.; Kumar Khandelwal, N.; Moorhouse, A.J.; Nair, R.; Vishwakarma, P.; Bravo Ruiz, G.; Ross, Z.K.; Lorenz, A.; Rudramurthy, S.M.; Chakrabarti, A.; et al. ABC Transporter Genes Show Upregulated Expression in Drug-Resistant Clinical Isolates of Candida Auris: A Genome- Wide Characterization of ATP-Binding Cassette (ABC) Transporter Genes. Front Microbiol 2019, 10. [CrossRef]
- Zhou, W.; Li, X.; Lin, Y.; Yan, W.; Jiang, S.; Huang, X.; Yang, X.; Qiao, D.; Li, N. A Comparative Transcriptome between Anti-Drug Sensitive and Resistant Candida Auris in China. Frontiers in Microbiology 2021, 12, 708009.
- Narayanan, A. Directed Evolution Detects Supernumerary Centric Chromosomes Conferring Resistance to Azoles in Candida Auris. MBio 2022, 13, 03052–22.
- Shivarathri, R.; Jenull, S.; Chauhan, M.; Singh, A.; Mazumdar, R.; Chowdhary, A.; Kuchler, K.; Chauhan, N. Comparative Transcriptomics Reveal Possible Mechanisms of Amphotericin B Resistance in Candida Auris. Antimicrob Agents Chemother 2022, 66, e02276-21. [CrossRef]
- Massic, L.; Doorley, L.A.; Jones, S.J.; Richardson, I.; Siao, D.D.; Siao, L.; Dykema, P.; Hua, C.; Schneider, E.; Cuomo, C.A.; et al. Acquired Amphotericin B Resistance Attributed to a Mutated ERG3 in Candidozyma Auris. Antimicrob Agents Chemother 2025, 69, e0060125. [CrossRef]
- Rybak, J.M.; Barker, K.S.; Muñoz, J.F.; Parker, J.E.; Ahmad, S.; Mokaddas, E.; Abdullah, A.; Elhagracy, R.S.; Kelly, S.L.; Cuomo, C.A.; et al. In Vivo Emergence of High-Level Resistance during Treatment Reveals the First Identified Mechanism of Amphotericin B Resistance in Candida Auris. Clin Microbiol Infect 2022, 28, 838–843. [CrossRef]
- Chauhan, A.; Carolus, H.; Sofras, D.; Kumar, M.; Kumar, P.; Nair, R.; Narayanan, A.; Yadav, K.; Ali, B.; Biriukov, V.; et al. Multi-Omics Analysis of Experimentally Evolved Candida Auris Isolates Reveals Modulation of Sterols, Sphingolipids, and Oxidative Stress in Acquired Amphotericin B Resistance. Molecular Microbiology 2025, 124, 154–172. [CrossRef]
- Phan-Canh, T.; Nguyen-Le, D.-M.; Luu, P.-L.; Khunweeraphong, N.; Kuchler, K. Rapid in Vitro Evolution of Flucytosine Resistance in Candida Auris. mSphere 2025, 10, e0097724. [CrossRef]
- LaFleur, M.D.; Kumamoto, C.A.; Lewis, K. Candida Albicans Biofilms Produce Antifungal-Tolerant Persister Cells. Antimicrob Agents Chemother 2006, 50, 3839–3846. [CrossRef]
- Iyer, K.R.; Robbins, N.; Cowen, L.E. The Role of Candida Albicans Stress Response Pathways in Antifungal Tolerance and Resistance. iScience 2022, 25, 103953. [CrossRef]
- Patra, S.; Raney, M.; Pareek, A.; Kaur, R. Epigenetic Regulation of Antifungal Drug Resistance. J Fungi (Basel) 2022, 8, 875. [CrossRef]
- Cowen, L.E.; Sanglard, D.; Howard, S.J.; Rogers, P.D.; Perlin, D.S. Mechanisms of Antifungal Drug Resistance. Cold Spring Harbor perspectives in medicine 2015, 5, a019752.
- Perlin, D.S.; Rautemaa-Richardson, R.; Alastruey-Izquierdo, A. The Global Problem of Antifungal Resistance: Prevalence, Mechanisms, and Management. The Lancet Infectious Diseases 2017, 17, e383–e392. [CrossRef]
- Rybak, J.M.; Doorley, L.A.; Nishimoto, A.T.; Barker, K.S.; Palmer, G.E.; Rogers, P.D. Abrogation of Triazole Resistance upon Deletion of CDR1 in a Clinical Isolate of Candida Auris. Antimicrob Agents Chemother 2019, 63:e00057-19. [CrossRef]
- Prasad, R. Molecular Cloning and Characterization of a Novel Gene of Candida Albicans, CDR1, Conferring Multiple Resistance to Drugs and Antifungals. Current genetics 1995, 27, 320–329.
- Sun, N.; Li, D.; Fonzi, W.; Li, X.; Zhang, L.; Calderone, R. Multidrug-Resistant Transporter Mdr1p-Mediated Uptake of a Novel Antifungal Compound. Antimicrob Agents Chemother 2013, 57, 5931–5939. [CrossRef]
- Rybak, J.M.; Muñoz, J.F.; Barker, K.S.; Parker, J.E.; Esquivel, B.D.; Berkow, E.L.; Lockhart, S.R.; Gade, L.; Palmer, G.E.; White, T.C.; et al. Mutations in TAC1B : A Novel Genetic Determinant of Clinical Fluconazole Resistance in Candida Auris. mBio 2020, 11, e00365-20. [CrossRef]
- Rajesh-Khanna, D.-S.; Piña Páez, C.G.; He, S.; Dolan, E.G.; Mirpuri, K.S.; Stajich, J.E.; Hogan, D.A. Coordinated Regulation of Mdr1- and Cdr1-Mediated Protection from Antifungals by the Mrr1 Transcription Factor in Emerging Candida Spp. mBio 2025, 16, e0132325. [CrossRef]
- Mansfield, B.E. Azole Drugs Are Imported by Facilitated Diffusion in Candida Albicans and Other Pathogenic Fungi. PLoS pathogens 2010, 6, 1001126.
- Esquivel, B.D.; Smith, A.R.; Zavrel, M.; White, T.C. Azole Drug Import into the Pathogenic Fungus Aspergillus Fumigatus. Antimicrob Agents Chemother 2015, 59, 3390–3398. [CrossRef]
- Galocha, M.; Costa, I.V.; Teixeira, M.C. Carrier-mediated drug uptake in fungal pathogens. Genes 2020, 11, 1324.
- Galocha, M. Genomic Evolution towards Azole Resistance in Candida Glabrata Clinical Isolates Unveils the Importance of CgHxt4/6/7 in Azole Accumulation. Communications Biology 2022, 5, 1118.
- Yasin, R.; Usman, S.; Qin, Q.; Gong, X.; Wang, B.; Wang, L.; Jin, C.; Fang, W. Key Sugar Transporters Drive Development and Pathogenicity in Aspergillus Flavus. Front Cell Infect Microbiol 2025, 15, 1661799. [CrossRef]
- Donzella, L.; Sousa, M.J.; Morrissey, J.P. Evolution and Functional Diversification of Yeast Sugar Transporters. Essays Biochem 2023, 67, 811–827. [CrossRef]
- K Redhu, A.; Shah, A.H.; Prasad, R. MFS Transporters of Candida Species and Their Role in Clinical Drug Resistance. FEMS Yeast Res 2016, 16, fow043. [CrossRef]
- Rubio-Texeira, M.; Van Zeebroeck, G.; Voordeckers, K.; Thevelein, J.M. Saccharomyces Cerevisiae Plasma Membrane Nutrient Sensors and Their Role in PKA Signaling. FEMS Yeast Research 2010, 10, 134–149.
- Biswas, C. Functional Characterization of the Hexose Transporter Hxt13p: An Efflux Pump That Mediates Resistance to Miltefosine in Yeast. Fungal genetics and biology 2013, 61, 23–32.
- Nourani, A.; Wesolowski-Louvel, M.; Delaveau, T.; Jacq, C.; Delahodde, A. Multiple-Drug-Resistance Phenomenon in the Yeast Saccharomyces Cerevisiae : Involvement of Two Hexose Transporters. Molecular and Cellular Biology 1997, 17, 5453–5460. [CrossRef]
- Zamith-Miranda, D.; Heyman, H.M.; Cleare, L.G.; Couvillion, S.P.; Clair, G.C.; Bredeweg, E.L.; Gacser, A.; Nimrichter, L.; Nakayasu, E.S.; Nosanchuk, J.D. Multi-Omics Signature of Candida Auris , an Emerging and Multidrug-Resistant Pathogen. mSystems 2019, 4, e00257-19. [CrossRef]
- Gietz, D.; Jean, A.St.; Woods, R.A.; Schiestl, R.H. Improved Method for High Efficiency Transformation of Intact Yeast Cells. Nucl Acids Res 1992, 20, 1425–1425. [CrossRef]
- Clinical; Institute, L.S. Reference Method for Broth Dilution Antifungal Susceptibility Testing of Yeasts; Approved Standard 2002.
- Esquivel, B.D.; White, T.C. Accumulation of Azole Drugs in the Fungal Plant Pathogen Magnaporthe Oryzae Is the Result of Facilitated Diffusion Influx. Front Microbiol 2017, 8, 1320. [CrossRef]
- Niemirowicz, K.; Durnaś, B.; Tokajuk, G.; Piktel, E.; Michalak, G.; Gu, X.; Kułakowska, A.; Savage, P.B.; Bucki, R. Formulation and Candidacidal Activity of Magnetic Nanoparticles Coated with Cathelicidin LL-37 and Ceragenin CSA-13., Sci. Rep 2017, 7, 4610. [CrossRef]
- Sun, L.; Zeng, X.; Yan, C.; Sun, X.; Gong, X.; Rao, Y.; Yan, N. Crystal Structure of a Bacterial Homologue of Glucose Transporters GLUT1–4. Nature 2012, 490, 361–366.
- Bugnon, M.; Röhrig, U.F.; Goullieux, M.; Perez, M.A.; Daina, A.; Michielin, O.; Zoete, V. SwissDock 2024: Major Enhancements for Small-Molecule Docking with Attracting Cavities and AutoDock Vina. Nucleic acids research 2024, 52, W324–W332.
- Eberhardt, J.; Santos-Martins, D.; Tillack, A.F.; Forli, S. AutoDock Vina 1.2.0: New Docking Methods, Expanded Force Field, and Python Bindings. J. Chem. Inf. Model. 2021, 61, 3891–3898. [CrossRef]
- Van Der Spoel, D.; Lindahl, E.; Hess, B.; Groenhof, G.; Mark, A.E.; Berendsen, H.J.C. GROMACS: Fast, Flexible, and Free. J Comput Chem 2005, 26, 1701–1718. [CrossRef]
- Khan, H.M.; MacKerell, A.D.; Reuter, N. Cation-π Interactions between Methylated Ammonium Groups and Tryptophan in the CHARMM36 Additive Force Field. J. Chem. Theory Comput. 2019, 15, 7–12. [CrossRef]
- Vanommeslaeghe, K.; MacKerell, A.D. Automation of the CHARMM General Force Field (CGenFF) I: Bond Perception and Atom Typing. J. Chem. Inf. Model. 2012, 52, 3144–3154. [CrossRef]
- Feng, S.; Park, S.; Choi, Y.K.; Im, W. CHARMM-GUI Membrane Builder : Past, Current, and Future Developments and Applications. J. Chem. Theory Comput. 2023, 19, 2161–2185. [CrossRef]
- Mishra, C.B.; Pandey, P.; Sharma, R.D.; Malik, M.Z.; Mongre, R.K.; Lynn, A.M.; Prasad, R.; Jeon, R.; Prakash, A. Identifying the Natural Polyphenol Catechin as a Multi-Targeted Agent against SARS-CoV-2 for the Plausible Therapy of COVID-19: An Integrated Computational Approach. Briefings in Bioinformatics 2021, 22, 1346–1360.
- Valdés-Tresanco, M.S.; Valdés-Tresanco, M.E.; Valiente, P.A.; Moreno, E. gmx_MMPBSA: A New Tool to Perform End-State Free Energy Calculations with GROMACS. J. Chem. Theory Comput. 2021, 17, 6281–6291. [CrossRef]
- Cauldron, N.C.; Shea, T.; Cuomo, C.A. Improved Genome Assembly of Candida Auris Strain B8441 and Annotation of B11205. Microbiol Resour Announc 2024, 13, e00512-24. [CrossRef]
- Structural Advances for the Major Facilitator Superfamily (MFS) Transporters - PubMed Available online: https://pubmed.ncbi.nlm.nih.gov/23403214/ (accessed on 17 November 2025).
- Quistgaard, E.M.; Löw, C.; Guettou, F.; Nordlund, P. Understanding Transport by the Major Facilitator Superfamily (MFS): Structures Pave the Way. Nat Rev Mol Cell Biol 2016, 17, 123–132. [CrossRef]
- Abramson, J.; Adler, J.; Dunger, J.; Evans, R.; Green, T.; Pritzel, A.; Ronneberger, O.; Willmore, L.; Ballard, A.J.; Bambrick, J. Accurate Structure Prediction of Biomolecular Interactions with AlphaFold 3. Nature 2024, 630, 493–500.
- Karplus, M.; McCammon, J.A. Molecular Dynamics Simulations of Biomolecules. Nature structural biology 2002, 9, 646–652.
- Gorelov, S.; Titov, A.; Tolicheva, O.; Konevega, A.; Shvetsov, A. DSSP in GROMACS: Tool for Defining Secondary Structures of Proteins in Trajectories. J. Chem. Inf. Model. 2024, 64, 3593–3598. [CrossRef]
- Moritsugu, K.; Terada, T.; Kidera, A. Free-Energy Landscape of Protein–Ligand Interactions Coupled with Protein Structural Changes. J. Phys. Chem. B 2017, 121, 731–740. [CrossRef]
- Stenström, O.; Diehl, C.; Modig, K.; Akke, M. Ligand-Induced Protein Transition State Stabilization Switches the Binding Pathway from Conformational Selection to Induced Fit. Proc. Natl. Acad. Sci. U.S.A. 2024, 121, e2317747121. [CrossRef]
- Ahmad, S.; Naiyer, A.; Kumar, P.; Parkash, A. Mechanism of Folding and Stability of Met80Gly Mutant of Cytochrome-c. Journal of Molecular Liquids 2024, 408, 125131.
- Genheden, S.; Ryde, U. The MM/PBSA and MM/GBSA Methods to Estimate Ligand-Binding Affinities. Expert Opinion on Drug Discovery 2015, 10, 449–461. [CrossRef]
- Sanglard, D.; Coste, A.T. Activity of Isavuconazole and Other Azoles against Candida Clinical Isolates and Yeast Model Systems with Known Azole Resistance Mechanisms. Antimicrob Agents Chemother 2016, 60, 229–238. [CrossRef]
- Butler, G.; Rasmussen, M.D.; Lin, M.F.; Santos, M.A.; Sakthikumar, S.; Munro, C.A.; Rheinbay, E.; Grabherr, M.; Forche, A.; Reedy, J.L. Evolution of Pathogenicity and Sexual Reproduction in Eight Candida Genomes. Nature 2009, 459, 657–662.
- Jackson, A.P.; Gamble, J.A.; Yeomans, T.; Moran, G.P.; Saunders, D.; Harris, D.; Aslett, M.; Barrell, J.F.; Butler, G.; Citiulo, F. Comparative Genomics of the Fungal Pathogens Candida Dubliniensis and Candida Albicans. Genome research 2009, 19, 2231–2244.
- Qadri, H.; Qureshi, M.F.; Mir, M.A.; Shah, A.H. Glucose - The X Factor for the Survival of Human Fungal Pathogens and Disease Progression in the Host. Microbiological Research 2021, 247, 126725. [CrossRef]
- Van Ende, M.; Wijnants, S.; Van Dijck, P. Sugar Sensing and Signaling in Candida Albicans and Candida Glabrata. Front Microbiol 2019, 10, 99. [CrossRef]
- Chattopadhyay, A.; Singh, R.; Das, A.K.; Maiti, M.K. Characterization of Two Sugar Transporters Responsible for Efficient Xylose Uptake in an Oleaginous Yeast Candida Tropicalis SY005. Arch Biochem Biophys 2020, 695, 108645. [CrossRef]
- Rutherford, J.C.; Bahn, Y.-S.; van den Berg, B.; Heitman, J.; Xue, C. Nutrient and Stress Sensing in Pathogenic Yeasts. Front Microbiol 2019, 10, 442. [CrossRef]
- Rodaki, A.; Bohovych, I.M.; Enjalbert, B.; Young, T.; Odds, F.C.; Gow, N.A.R.; Brown, A.J.P. Glucose Promotes Stress Resistance in the Fungal Pathogen Candida Albicans. Mol Biol Cell 2009, 20, 4845–4855. [CrossRef]
- Leandro, M.J.; Gonçalves, P.; Spencer-Martins, I. Two Glucose/Xylose Transporter Genes from the Yeast Candida Intermedia: First Molecular Characterization of a Yeast Xylose–H+ Symporter. Biochemical Journal 2006, 395, 543–549.
Figure 1.
HGT gene repertoire and phylogenetic relationships in Candida species. a. Phylogenetic tree of C. auris HGT genes constructed using the maximum likelihood method, showing evolutionary clustering patterns and potential functional groupings within the HGT and related transporter families. Bootstrap values from 1,000 replicates are indicated at branch nodes. b. Comparative distribution of predicted HGT genes across multiple Candida species and S. cerevisiae, illustrating species-specific variation in transporter abundance. c. Comprehensive inventory of annotated HGT genes in Candida species and S. cerevisiae, grouped by transporter family.
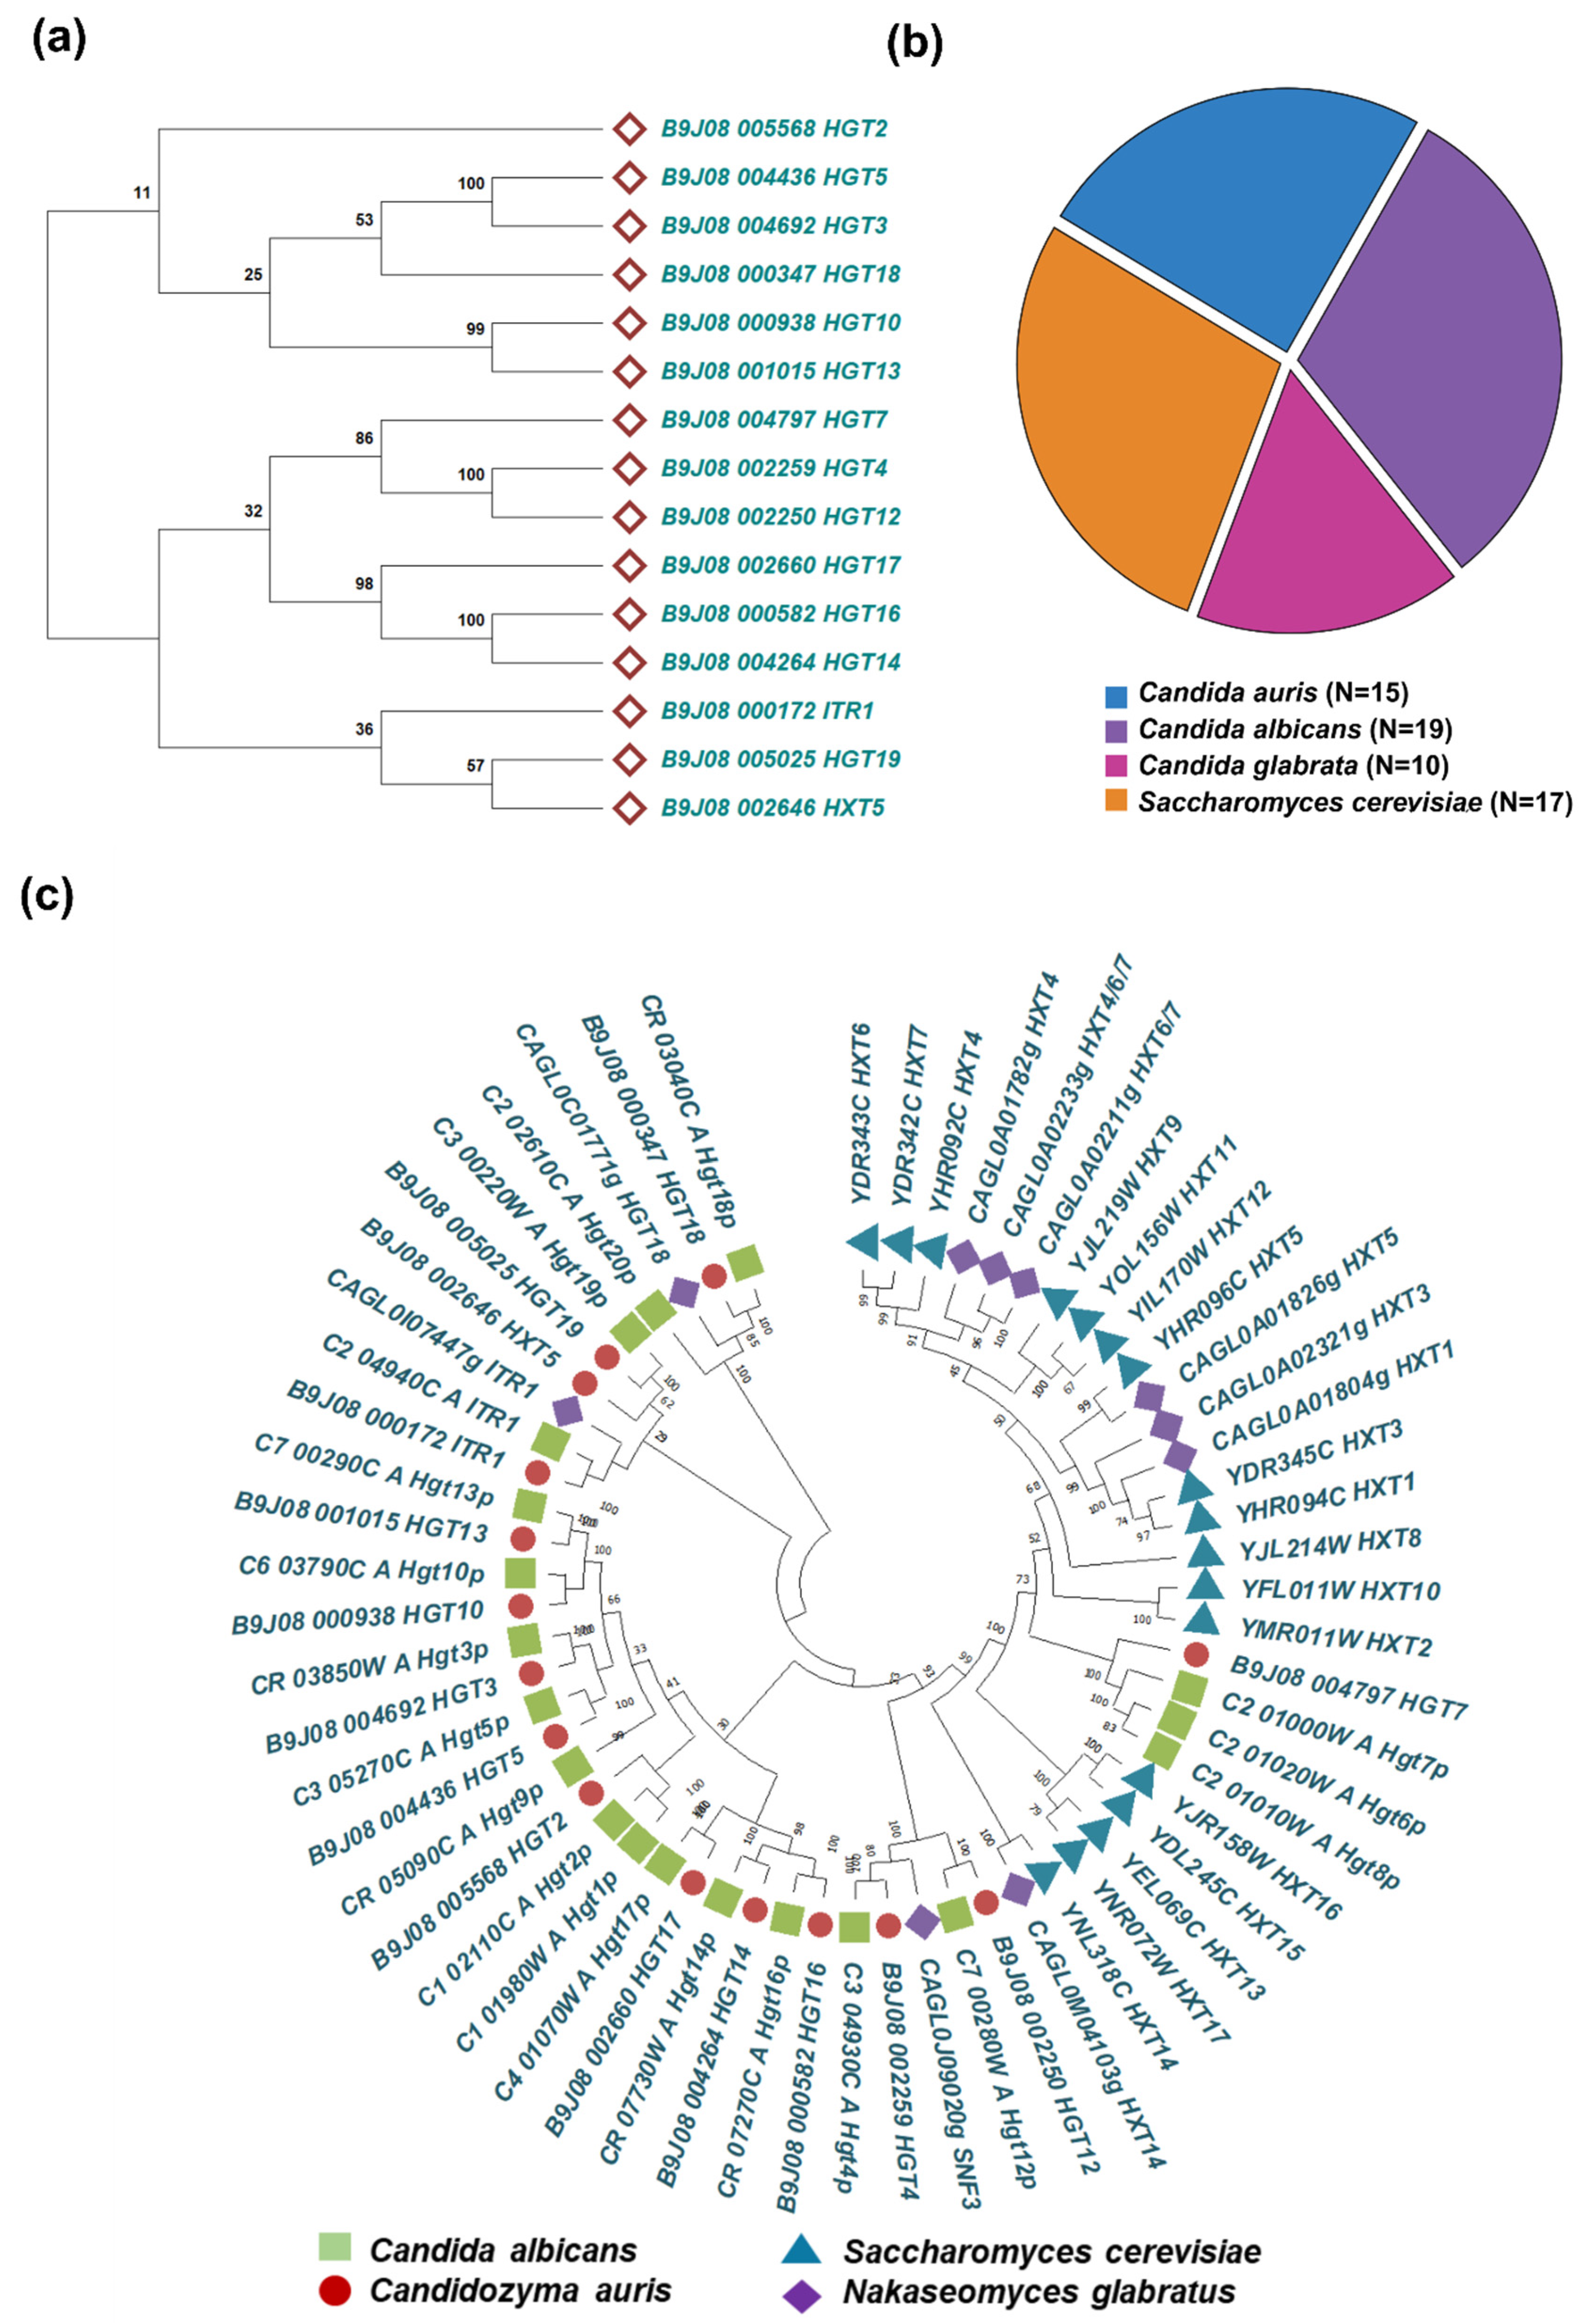
Figure 2.
Functional analysis of putative HGT genes in C. auris. a. Quantitative real-time PCR (qRT-PCR) analysis of 15 predicted HGT genes in the wild-type azole-susceptible strain CBS10913T. Expression values were calculated using the 2−ΔCT method and normalized to an internal control gene CauTDH3. Data represent the mean ± SD from three independent biological replicates. b. Drug susceptibility using the minimum inhibitory concentration of the △hgt13 with FLC in YPD media. c. 3H-FLC accumulation assay revealed that △hgt13 cells significantly contains less FLC in presence and absence of glucose comparative to the control. Data shows the mean ± SD from three independent biological replicates. d. Membrane permeability assay by using the NPN dye shows that △hgt13 mutant have more rigid membrane. Data represented as average of three independent experiments. e. The glucose accumulation assay showed no significant difference in glucose uptake between the Δhgt13 mutant and the wild-type strain. Data represented as an average of three independent experiments.
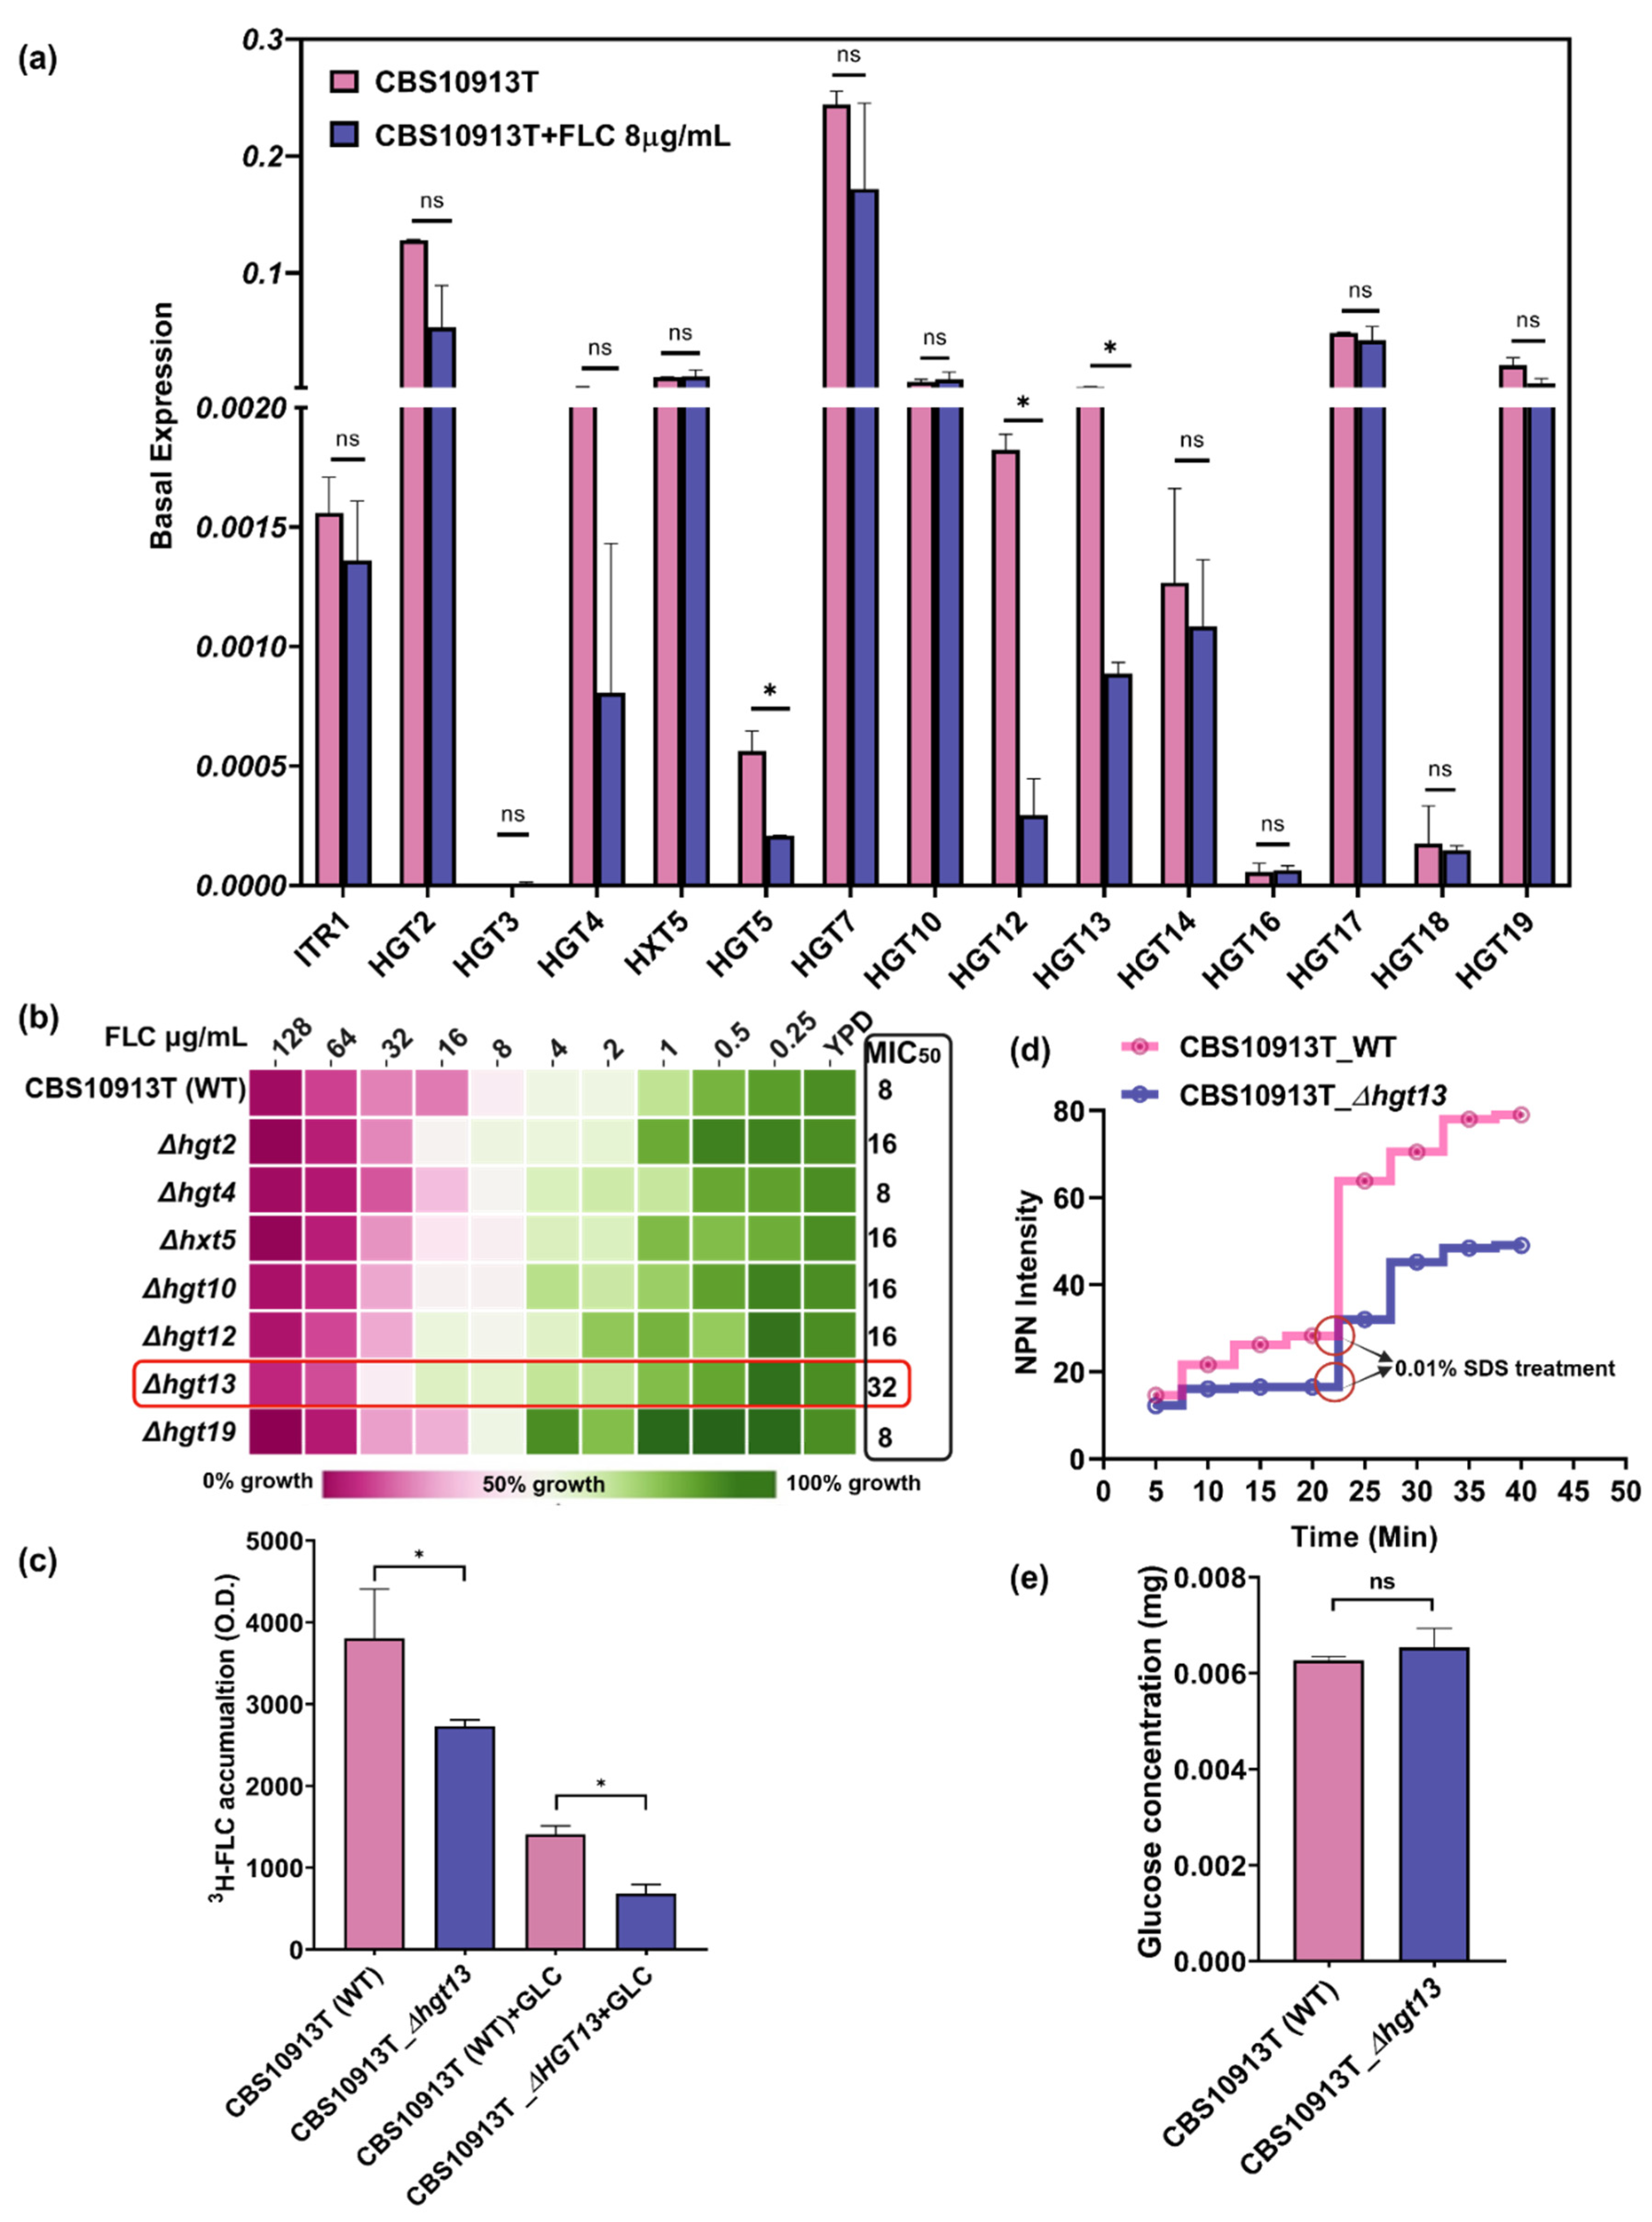
Figure 3.
In silico docking analysis of Hgt13p with D-glucose and FLC and comparison with bacterial XylE permease. a. Crystal structure of Escherichia coli XylE (PDB ID: 4GBZ) in complex with D-glucose. The substrate-binding pocket is shown in surface representation, with glucose depicted as magenta sticks. Key active site residues are shown as different colour sticks, highlighting hydrogen bonds (dashed yellow lines) stabilizing D-glucose. b. Predicted Hgt13p 3D structure generated via AlphaFold3 server, showing the docked complex with D-glucose (magenta sticks) in the binding cavity. Interacting residues are shown in different colour sticks, with hydrogen bonds indicated by dashed lines. c. Predicted Hgt13p 3D structure generated via AlphaFold3 server, showing the docked complex with FLC (magenta and cyan sticks) in the binding cavity d. Multiple sequence alignment of all 15 C. auris HGT proteins with XylE, highlighting conserved substrate-interacting residues. Three critical interacting residues (Gln288, Gln289 and Asn294 from XylE) are conserved from bacteria to yeast and maintained across the HGT family of C. auris.
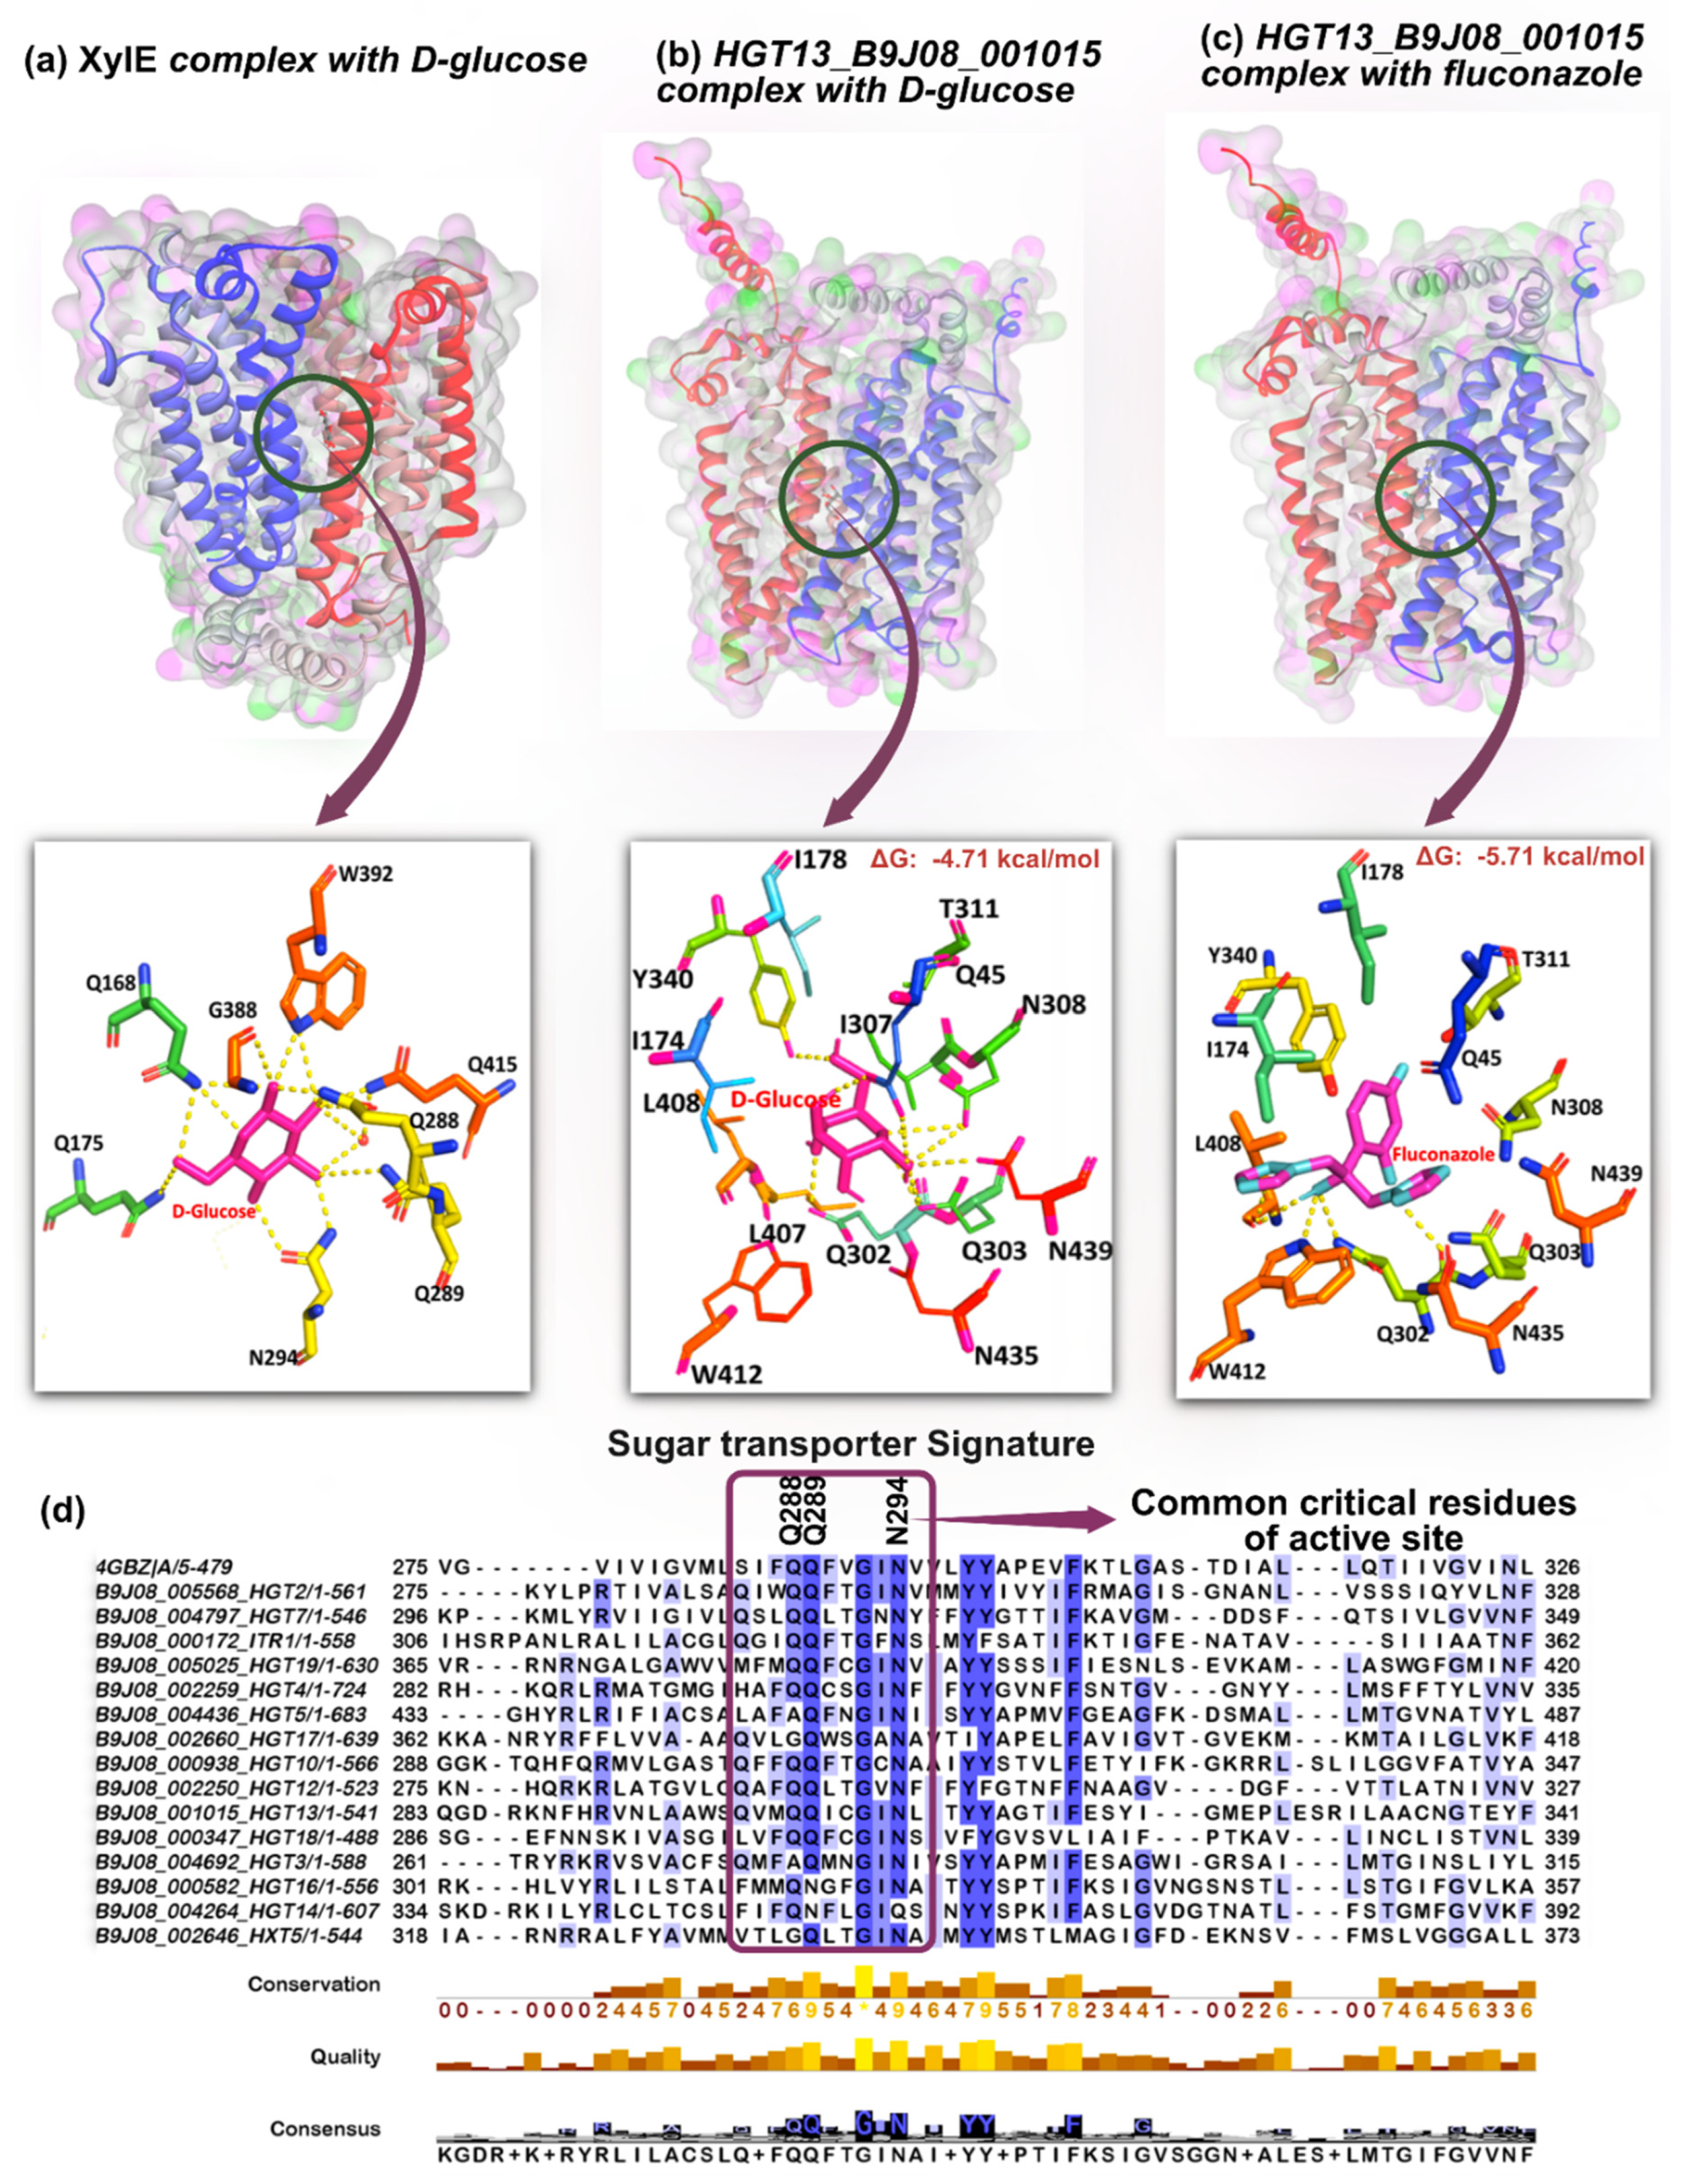
Figure 4.
MD simulation of HGT13 protein with D-glucose and FLC. a. RMSD of Hgt13p, Hgt13p_D-glucose and Hgt13p_FLC. b. Rg values of Hgt13p, Hgt13p_D-glucose and Hgt13p_FLC. c. Solvent accessible surface values of Hgt13p, D-glucose and FLC. d. The residue decomposition plot (MM-GBSA) representing the binding energy contribution of the active site residues of HGT, energetically stabilizing glucose at the binding pockets. e. The residue decomposition plot (MM-GBSA) representing the binding energy contribution of the active site residues of HGT, energetically stabilizing the FLC at binding pockets. Free energy landscape using the Rg and RMSD value f. FEL of the Hgt13p. g. FEL of the Hgt13p_D-glucose. h. FEL of the Hgt13p_FLC.
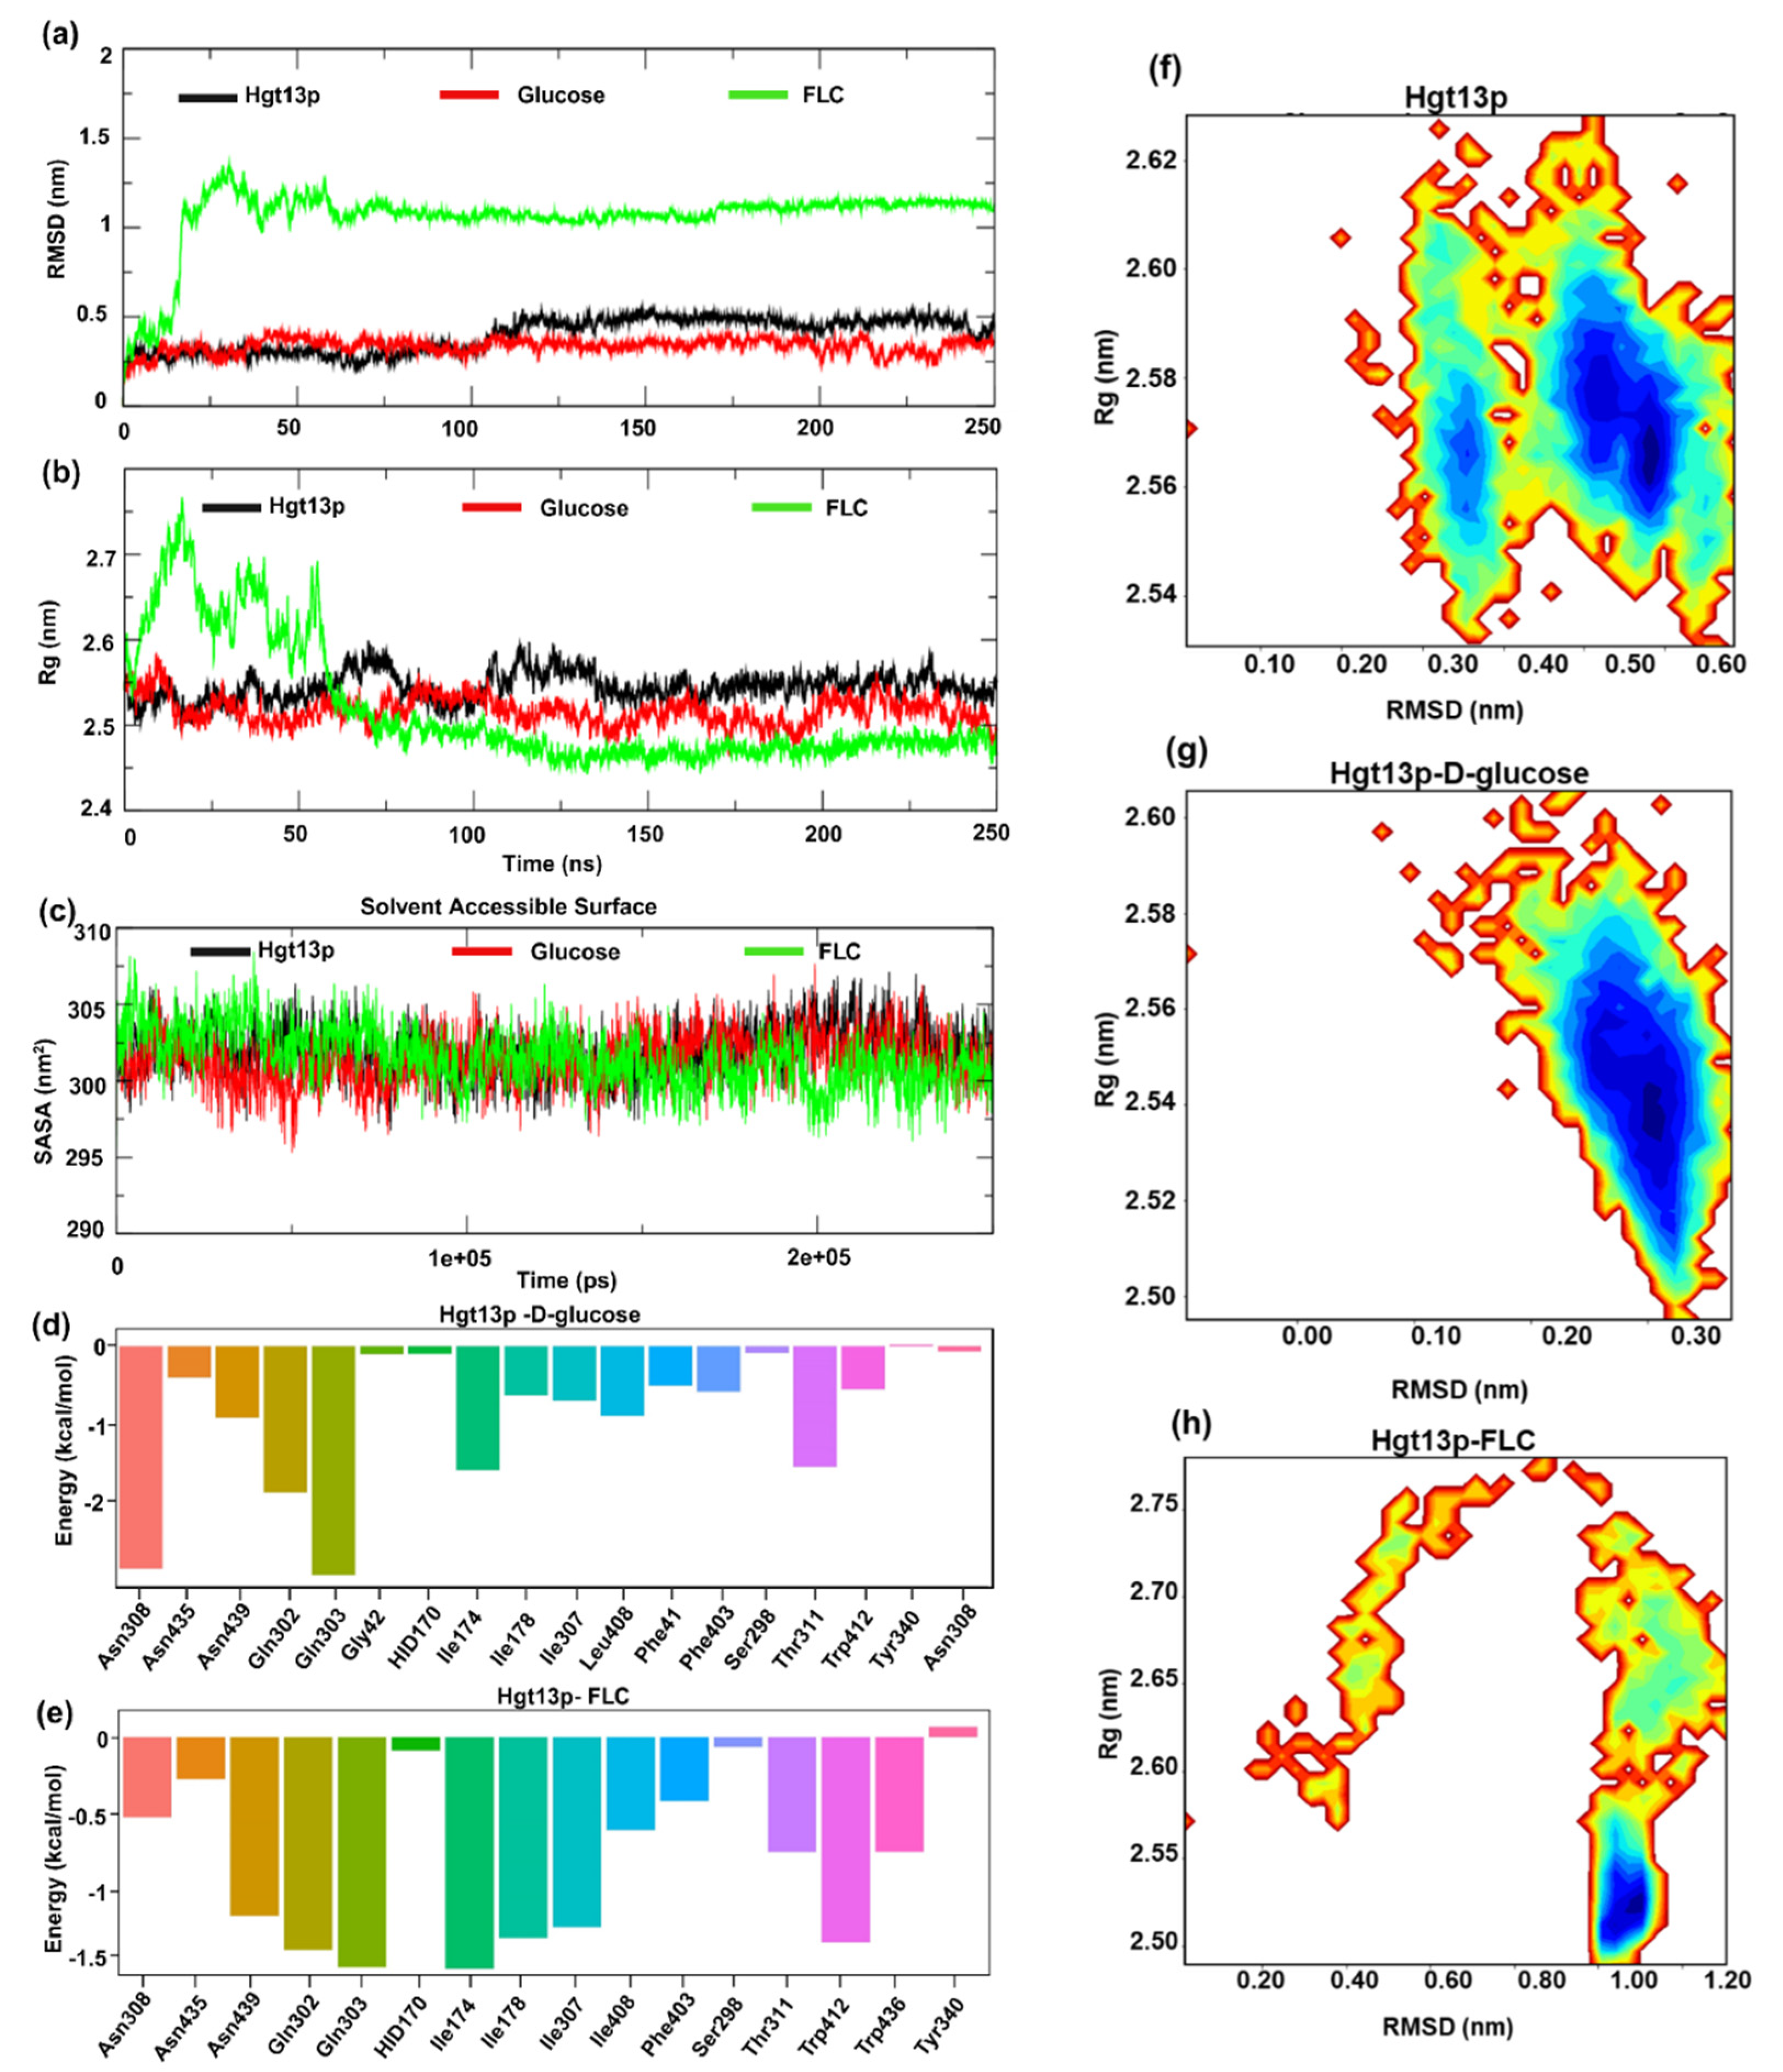
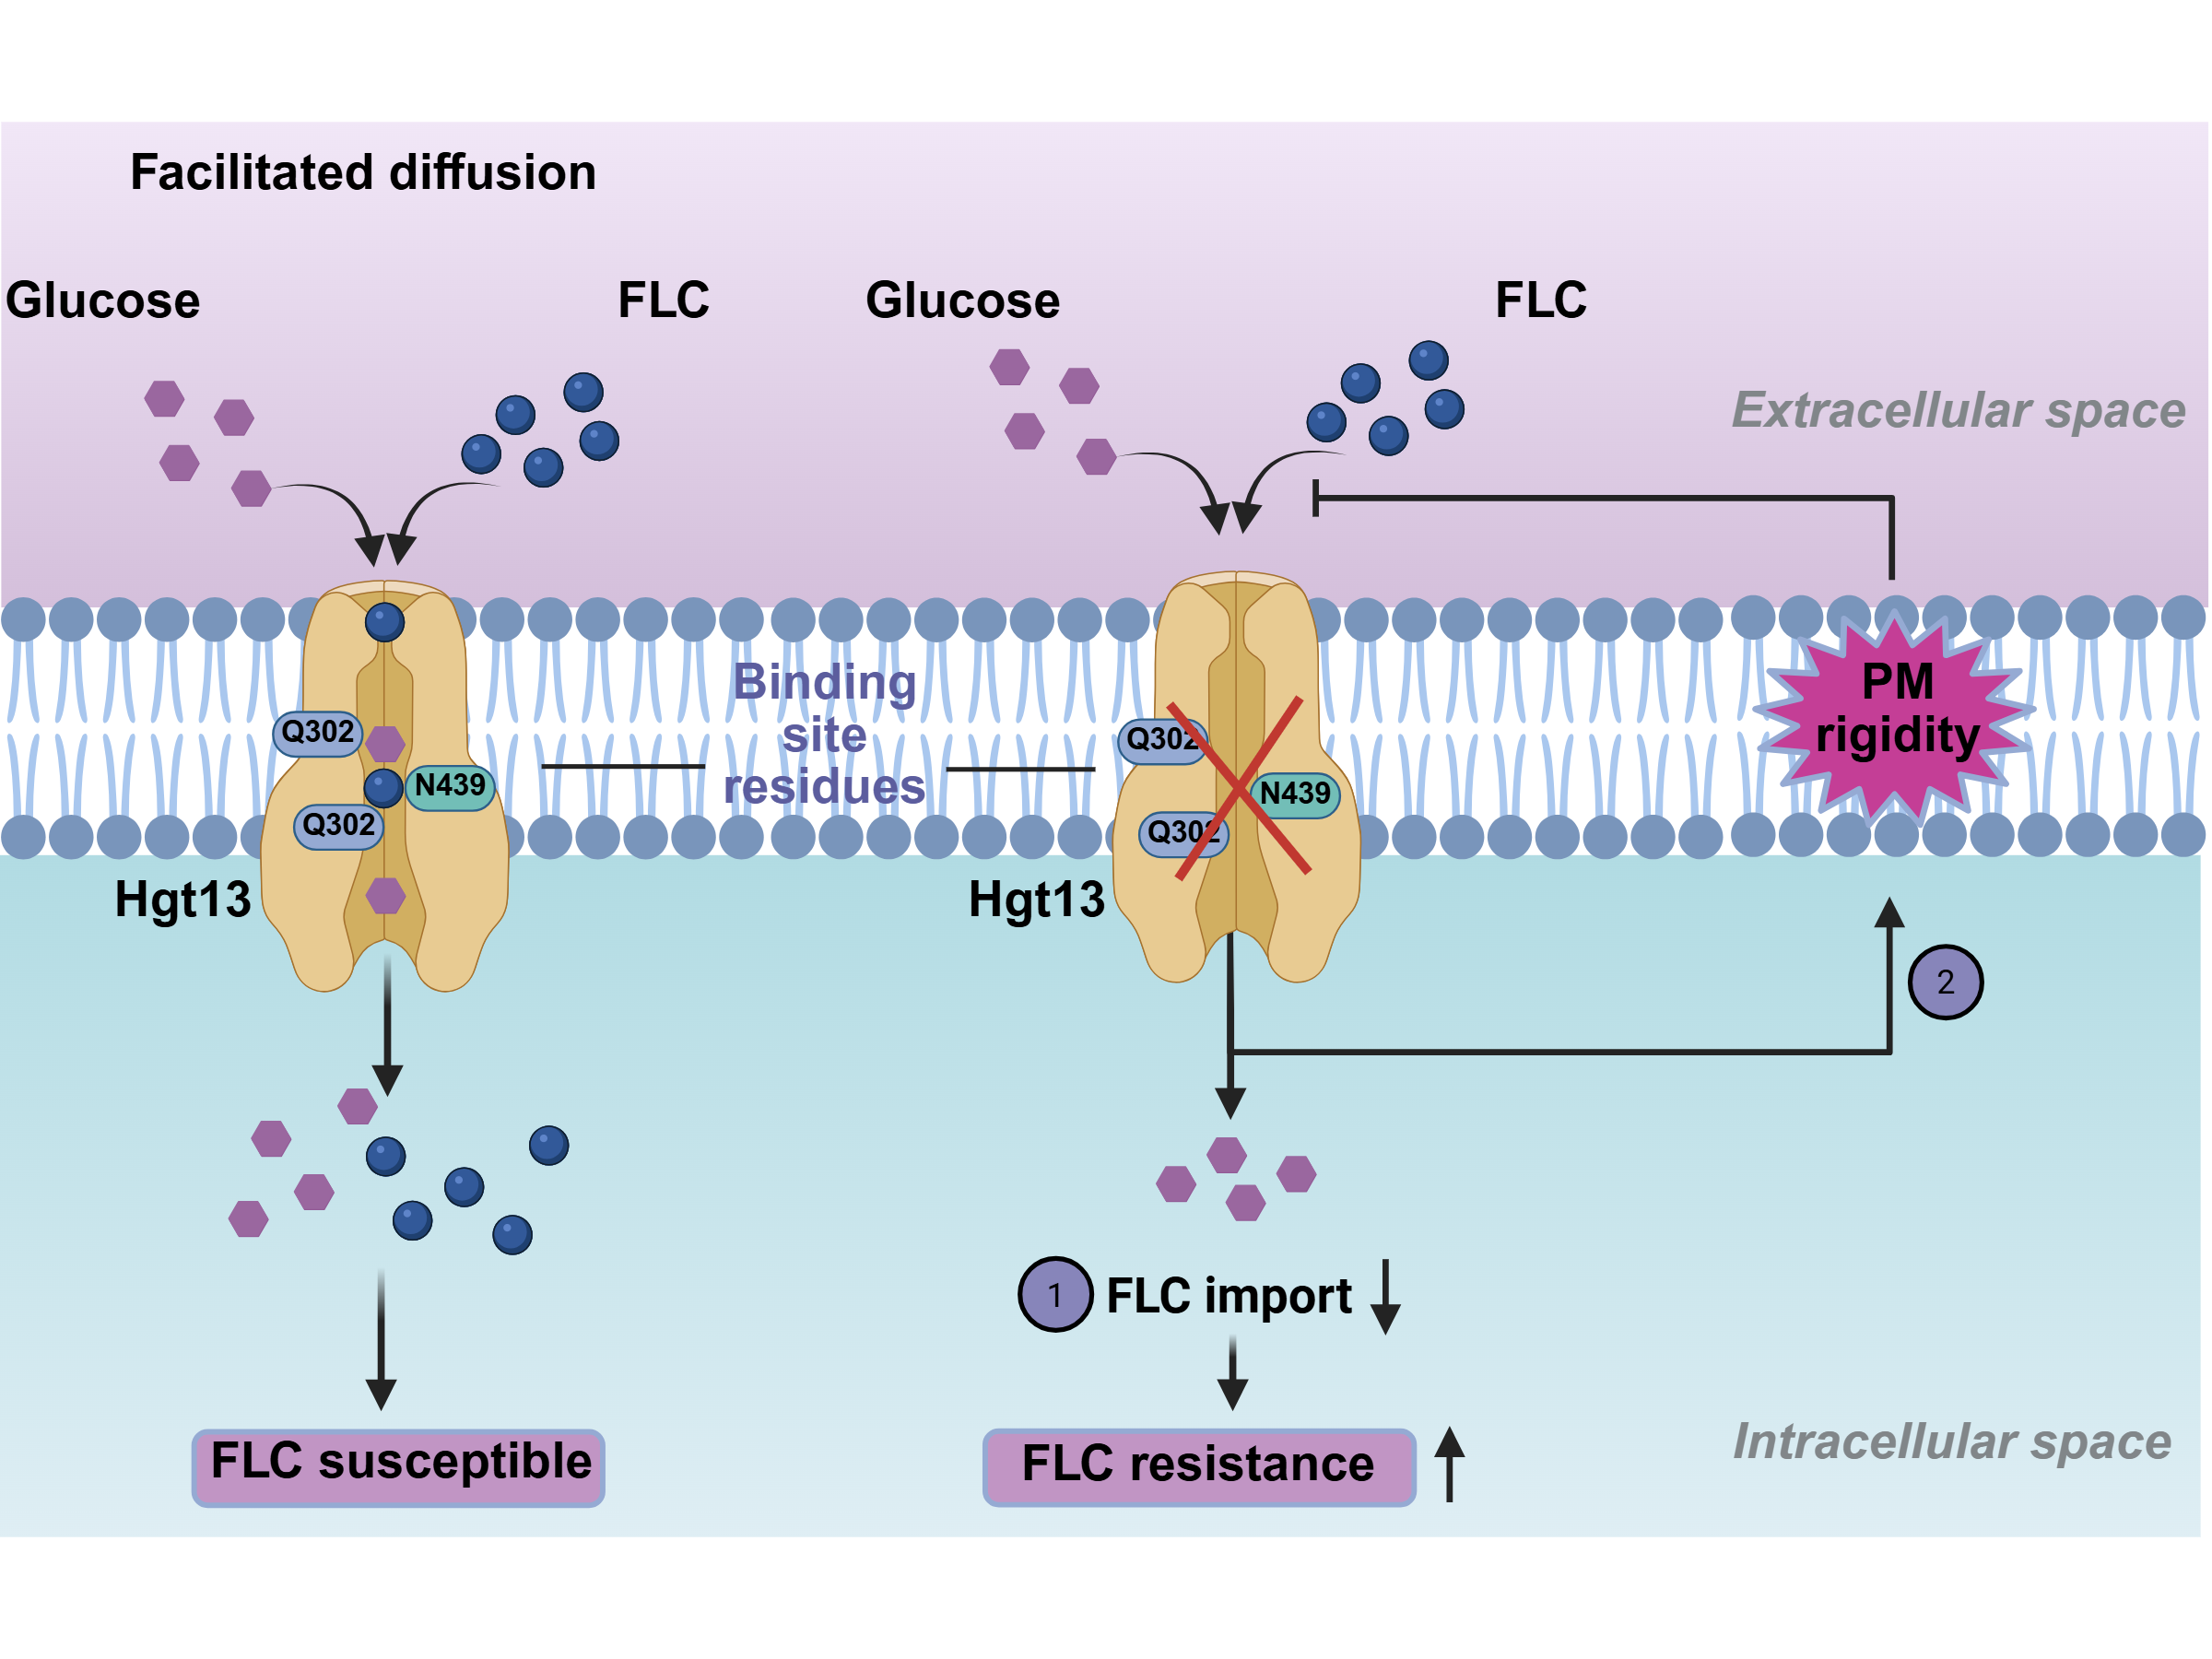
Figure 5.
Schematic overview of the pathway contributing to FLC resistance in C. auris. High binding affinity of FLC to Hgt13p supports a “piggyback” drug uptake mechanism. In contrast, loss of the HGT13 membrane transporter alters membrane rigidity, and together these pathways enhance FLC resistance in C. auris.
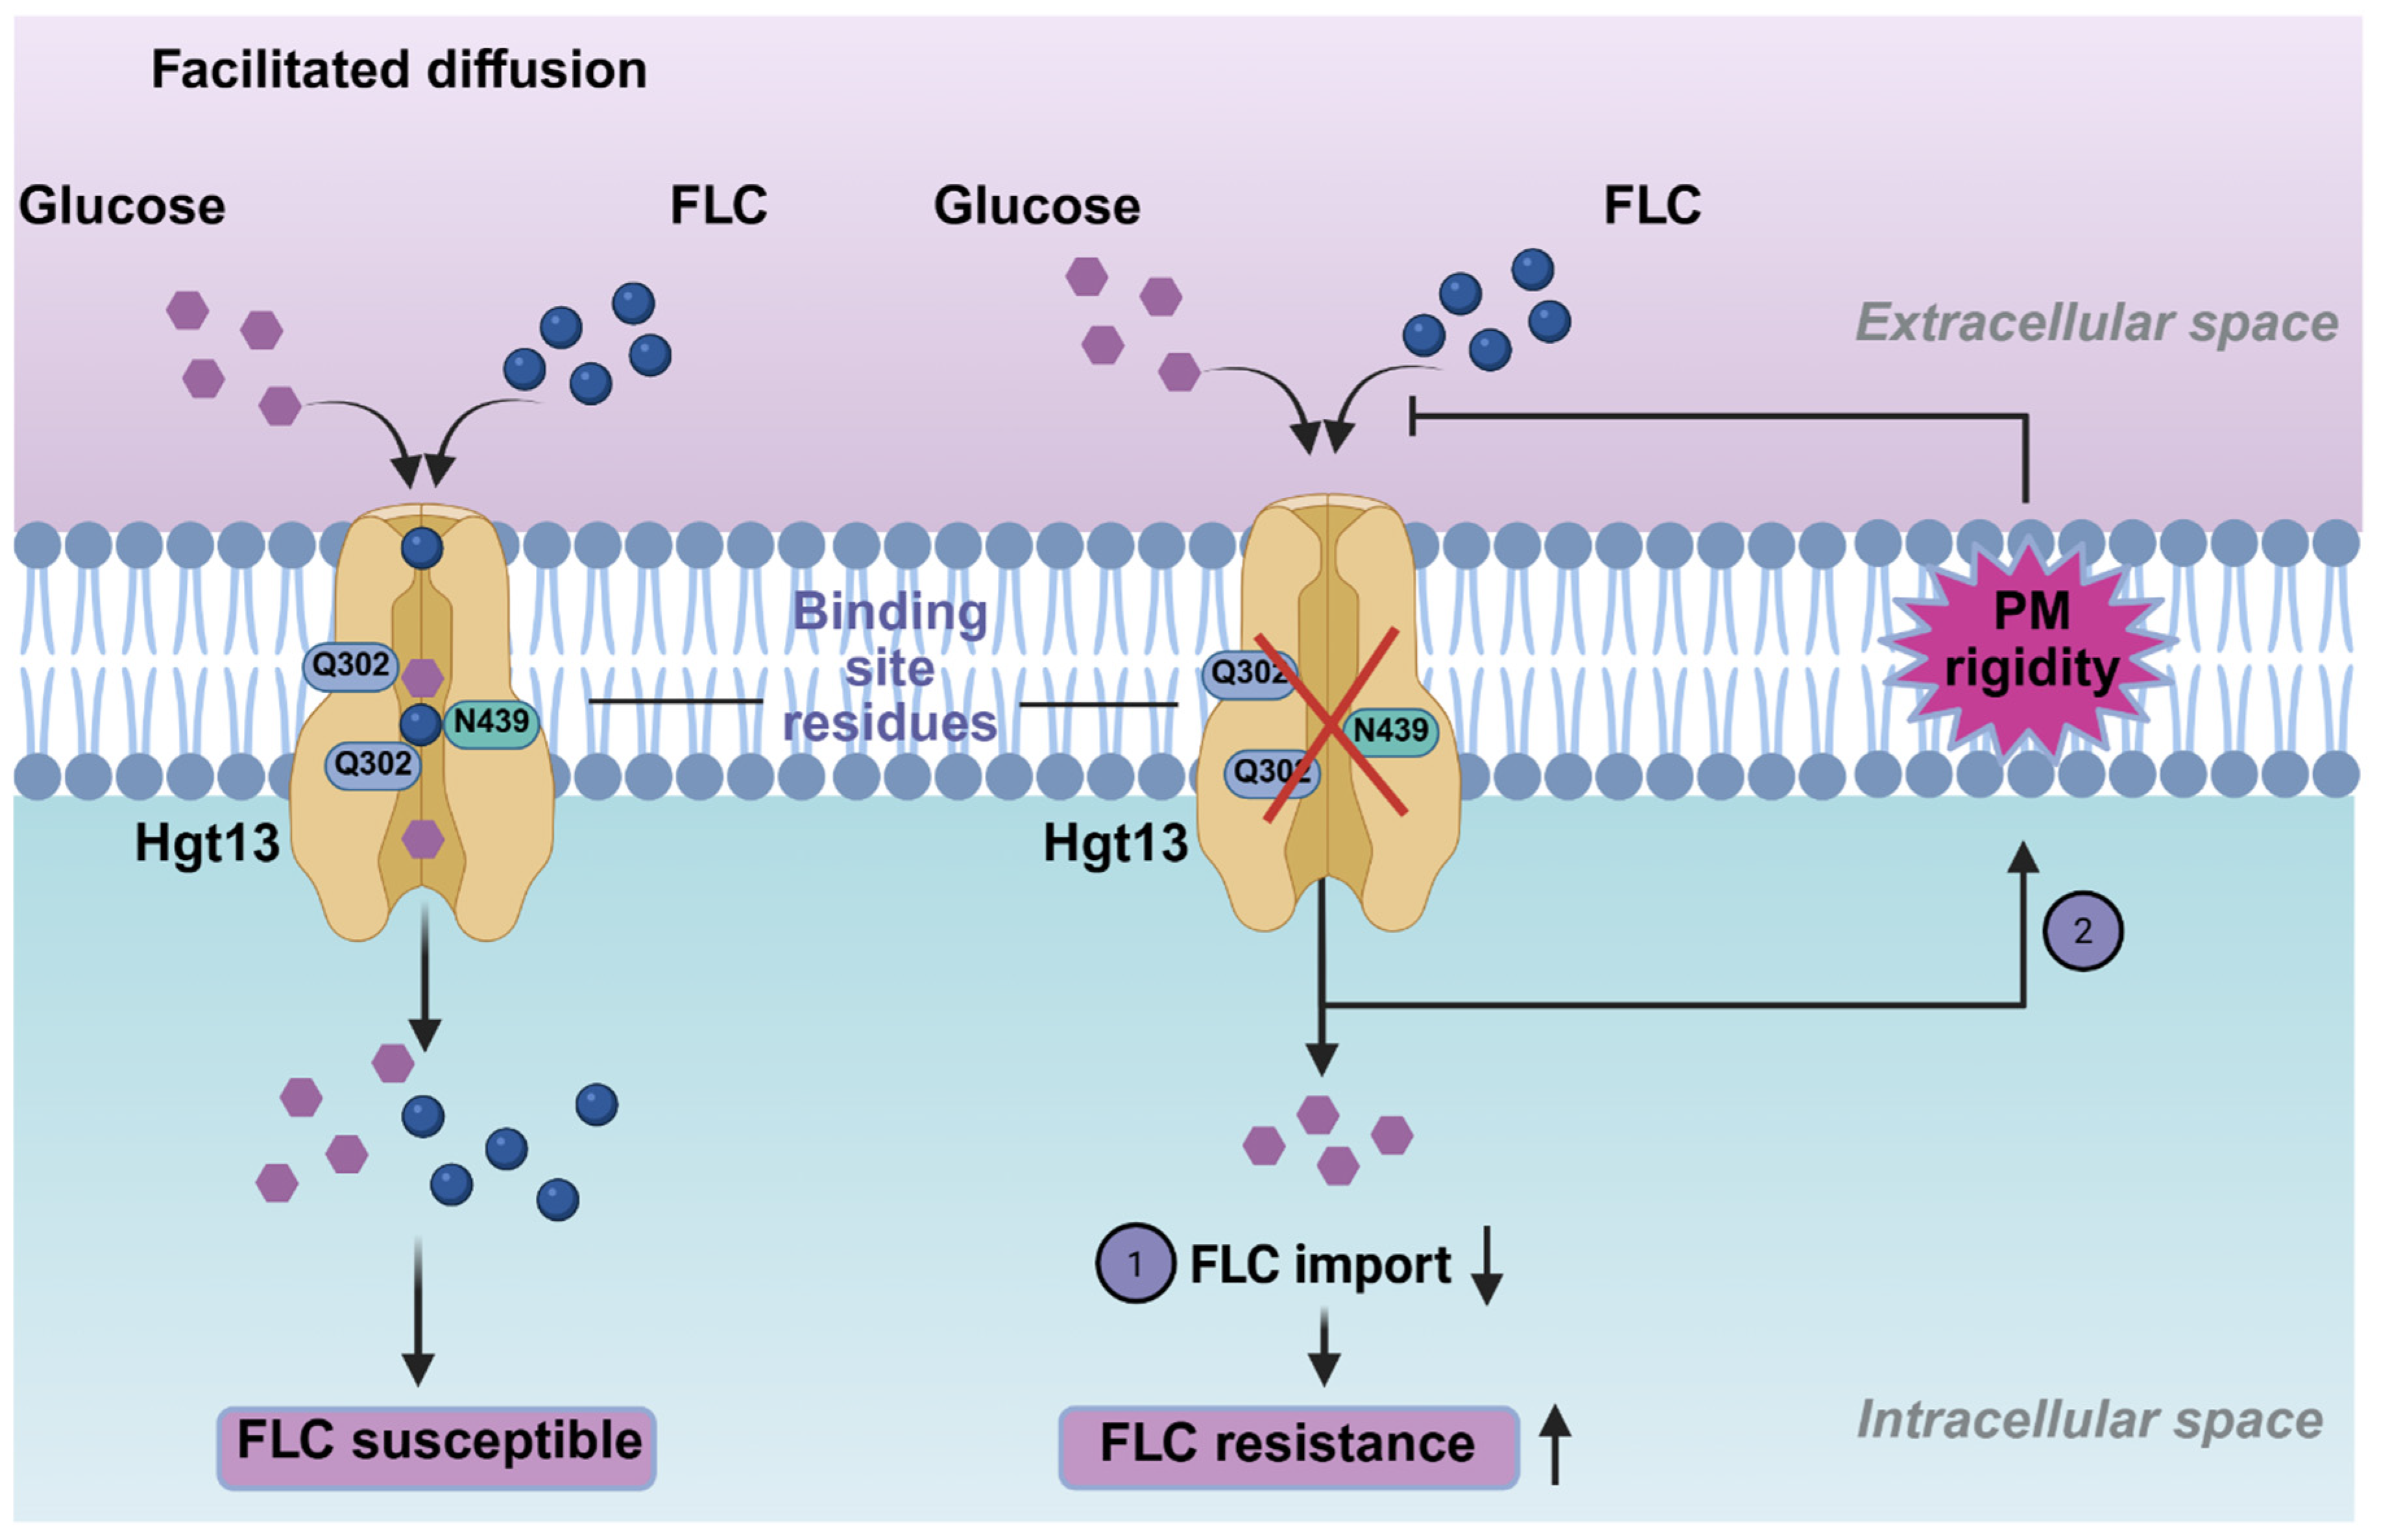

Table 1.
List of the constructed knockout mutants of HGT genes in C. auris wild type strain CBS10913T.
Table 1.
List of the constructed knockout mutants of HGT genes in C. auris wild type strain CBS10913T.
| Strains/Mutants | Genes name and ID |
| CBS10913T (wild type) | |
| CBS10913T_Δhgt2 | HGT2 (B9J08_005568) |
| CBS10913T_Δhgt12 | HGT12 (B9J08_002250) |
| CBS10913T_Δhgt13 | HGT13 (B9J08_001015) |
| CBS10913T_Δhgt19 | HGT19 (B9J08_005025) |
| CBS10913T_Δhxt5 | HXT5 (B9J08_002646) |
| CBS10913T_Δhgt4 | HGT4 (B9J08_002259) |
Disclaimer/Publisher’s Note: The statements, opinions and data contained in all publications are solely those of the individual author(s) and contributor(s) and not of MDPI and/or the editor(s). MDPI and/or the editor(s) disclaim responsibility for any injury to people or property resulting from any ideas, methods, instructions or products referred to in the content. |
© 2025 by the authors. Licensee MDPI, Basel, Switzerland. This article is an open access article distributed under the terms and conditions of the Creative Commons Attribution (CC BY) license (http://creativecommons.org/licenses/by/4.0/).
Copyright: This open access article is published under a Creative Commons CC BY 4.0 license, which permit the free download, distribution, and reuse, provided that the author and preprint are cited in any reuse.


