
Submitted:
29 December 2025
Posted:
30 December 2025
You are already at the latest version
Abstract
This research uses the stakeholder theory and dynamic capabilities theory to evaluate the relationship between stakeholder pressure, digital innovation, motivation, and the adoption of low-carbon operation management in enhancing manufacturing firms’ carbon reduction performance. A web-based survey of 412 Chinese manufacturing firms was used to analyze our conceptual model. This investigation implemented a hybrid approach known as structural equation modelling-artificial neural network (SEM-ANN) that involved two phases. Our research indicates that stakeholder pressures significantly motivate the emergence of low-carbon operations management practices and digital innovation, which has an auspicious correlation with motivation and low-carbon operation management. The study found mixed results regarding the impact of motivations on adopting low-carbon operations. While motivations significantly affected the adoption of low-carbon logistics, they did not significantly impact the emergence of low-carbon processes. Furthermore, the emergence of low-carbon products negatively impacted the firm’s carbon reduction performance, while low-carbon processes and logistics positively impacted the firm’s carbon reduction performance. A significant relationship between the adoption of digital innovation and low-carbon operations management practices, as well as the carbon reduction performance of the firm, are significantly correlated. Stakeholder pressure significantly impacts a firm’s carbon reduction performance. A contribution of the study is to advance stakeholder theory and dynamic capabilities theory frameworks in the context of sustainability initiatives for industries.
Keywords:
stakeholder pressure
; digital innovation
; motivation
; low‐carbon operations management practices
; carbon reduction performance
; SEM−ANN approach
1. Introduction
The manufacturing research field and its leading scholars Zhang et al. (2024), have been increasingly interested in more environmentally friendly production. In response to the escalating number of severe droughts and natural disasters, the government has implemented carbon impartiality enterprises that highlight net zero emissions. Huawei Cloud is one of these business entities. Gao et al. (2023) emphasize that the fundamental principle of carbon neutrality is the transition from the resource-based mode of progress to the fueled-by-technology green and intelligent mode of the manufacturing process. We realized that due to the extremely rapid development of digital technologies, nearly none of the technologies could be effectively developed without digital innovation, and nearly none of the efficiency issues could be effectively solved without digital innovation (Zhang et al., 2022). That is why the Huawei Langfang Cloud Data Center employed the iCooling solution. According to iCooling, the solution assists in ensuring on-demand and precise cooling of the data center. The solution, which was founded on artificial intelligence, enabled us to conserve approximately 13,129 tons of carbon emissions annually. Digital innovation, which involves the innovation of company activities and revenue formation through digital technologies, presents enterprises with thrilling prospects for expansion (Felicetti et al., 2024; Paul et al., 2024). This innovation is an unavoidable method of high-quality, low-carbon production (Tan et al., 2024). Regrettably, for numerous stakeholders and enterprises, digital innovation is a highly complex process, as their carbon reduction requirements cannot be simultaneously addressed. To foster companies’ low-carbon operations management and support their decision-making regarding the challenge of climate change (de Abreu et al., 2021; Liu, 2014; Stefanelli et al., 2021), additional research should be conducted into the motivations that companies may encounter in this endeavor as well as the role of operations in this process, with the necessity for scholars to develop a more comprehensive view on their role both in developed and emerging economies (de Jesus Pacheco et al., 2024).
The relevance of the carbon reduction requirement generated a significant demand for low-carbon operations management practices (LOMP). LOMPs are associated with the integration of carbon economy into the setting of business process planning, execution, and oversight in order to establish an edge over competitors (Sheng et al., 2023). The precise decisions associated with LOMP are both supported by digital innovation (Lopes de Sousa Jabbour et al., 2021; Wiredu et al., 2024), and guarantee production efficiency and turn into a pivotal hub of LOMP (Wang et al., 2024).
The literature suggests numerous advantages of climate change strategies (Orazalin et al., 2024), while also detailing a wide array of difficulties accompanied by decarbonizing (Oloruntobi et al., 2024; Xia-Bauer et al., 2024). Thus, the actions of the organization against the concerns of climate change have not been standardized. One of the reasons for standardizing organizational actions is the operation of low-carbon enterprises (Furlan Matos Alves et al., 2017). Understanding organizational motivations for decarbonized production systems is essential (Hegab et al., 2023), as organizations respond differently to the consequences of climate change. Several motivations exist for adopting a decarbonized production system. According to (Khamisu et al., 2024; Kitsis and Chen, 2021; Onjewu et al., 2023; Singh et al., 2022); Wang et al. (2020) pressure from stakeholders is a motivation for the adoption of a decarbonized process system. More research is warranted to provide insight towards organizational motivations for decarbonized production systems. However, several gaps have not yet been addressed regarding the subject of low-carbon operations and sustainability practices (Sun, W. et al., 2024). Most studies have also analyzed the two variables in isolation. An integrated framework should be developed to explore how pressure from stakeholders and digital innovations relate to low-carbon operations on the one hand and translate to implementation and impact of carbon reduction performance on the other hand (Li, M. et al., 2024). Existing research on low-carbon operations is typically limited to focusing on single, unitary aspects of this management form. For example, some interest has been devoted to the management of low-carbon supply chains or manufacturing processes. However, there is no comprehensive study with an emphasis on various aspects of LOMPs in the context of Chinese industries (Strøm-Andersen, 2019). The theory of dynamic capabilities may provide comprehensive insights into how firms adjust to environmental changes, yet their role in the management of low-carbon operations remains to be studied (Huang and Xiao, 2023).
Therefore, the question of how dynamic capabilities, particularly digital innovation, help companies respond to stakeholder pressure and improve their carbon performance has to be answered. In light of the importance of manufacturing industries or SMEs in China’s economy, it is important to have empirical evidence looking at low-carbon practices. Besides, there is a gap in understanding the challenges and opportunities for Chinese manufacturing industries to adopt low-carbon practices (Deng et al., 2024). Hence, this study seeks to plug the gap by offering a deeper insight into the factors that underpin or drive Chinese industries to have low-carbon operations. This study is expected to be of immense benefit to academia, industry, and policy. For the purpose of this article, the question is whether such stakeholder policies trigger motivations for the implementation of LOMP.
Hence, the research question serves as the focus of this article: (a) How do stakeholders make the motivation for low-carbon operations practice in China? (b) How do stakeholders affect the taking on of low-carbon items in Chinese businesses or industries? (c) Do inspirations or motivation impact embracing low-carbon items, cycles, and strategies in Chinese enterprises or industries? (d) How does embracing low-carbon items, cycles, and strategies affect firms’ carbon performance execution in Chinese manufacturing? (e) How does digital innovation influence the relationship between stakeholder influence and adoption of low-carbon products, processes, and logistics in the Chinese industries? (f) How does digital innovation impact the adoption of low-carbon products, processes, and logistics in the Chinese industries? (g) How do stakeholder influence and digital innovation affect firms’ carbon reduction performance in Chinese industries? (h) How do digital innovation and LOMPs interact to affect firms’ carbon reduction performance in Chinese industries?
Significance and Contributions of the Research
The main contribution of this work is the consolidation of theoretical perspectives and concepts that have been scattered in prior research, along with incorporating lessons from China, which is now the second-biggest economy in the world based on nominal GDP (Chen et al., 2024). The Chinese economy is distinguished by its notable manufacturing industry, swift technical progress, and large impact on international commerce. China is sometimes regarded as the greatest economy worldwide in terms of purchasing power parities (PPP), overtaking the United States. This is mostly due to the lower cost of living and increased domestic output (Eaglen, 2024). The aim of the study is to address the current gap in studies about low-carbon operations and focus specifically on the Chinese sector. This part of the world is mostly overlooked in the current research on developing economies because of the need for an increase due to the country’s impact on the environment and its leading role in world production (Liu et al., 2018). This study develops and tests a model of low-carbon operations and evaluates it together with the role of technological advancements and stakeholder pressure. The approach of the study is unique because, unlike previous research in the area, it results in an understanding of their interconnection in low-carbon operations and carbon reductions in firms. Further, the low carbon operation study’s limitations include studying several locations. It behaviors an inclusive examination of low-carbon products, processes, and logistics. (Furlan Matos Alves et al., 2017; Li and Zhang, 2024; Sheng et al., 2023); Su et al. (2023), and others contribute to this concurrent examination. This inclusive method divulges how organizations might reduce carbon emissions overall.
The work enlarges DCT applicability to low-carbon operations management practices. It looks at how dynamic capabilities—digital innovation in particular—help companies to better manage their carbon performance and react to demand from stakeholders. New insights into the flexibility and strategic reactions of companies in a low-carbon environment are provided by this use. Practitioners, especially supply chain managers and organizational managers, may learn from the results how to successfully use technology innovation and stakeholder pressure to improve low-carbon operations. Important advice on how to assist industrial sectors in switching to sustainable practices is also provided by the report for legislators and environmental authorities. The study emphasizes the need for specialized support for manufacturing industries and the need for regulatory frameworks that promote digital innovation and stakeholder involvement in low-carbon operations in its regulatory suggestions to manufacturing policymakers and environmental regulators. In general, this study closes important research gaps and offers a thorough, holistic evaluation that is immediately applicable to the particular setting of Chinese enterprises and SMEs, therefore enriching the present knowledge of low-carbon operations.
2. Theoretical Frameworks and Hypotheses Development
2.1. Stakeholder Theory, Dynamic Capability Theory and LOMPs
Some group or person that may influence or be impacted by the objectives of an organization is a stakeholder (Freeman, 2010). The requirement of businesses to constantly adapt their daily operations and strategies according to their stakeholders in order to prevent poor performance is linked by stakeholder theory to exogenous environmental changes (Freeman, 2010). Stakeholders may, ironically, be an element of both risk and collaboration for firms and, as such, a driving force behind choices and activities within the company. As such, strategic choices need to take stakeholders into account (Savage et al., 1991). These companies may apply different degrees of pressure (de Gooyert et al., 2022), and by controlling and cultivating relationships with stakeholders, firms can go from a reactive approach to a constructive environmental management strategy (Chan et al., 2022).
Climate change and sustainable company management have been related using stakeholder theory. According to Herold et al. (2019), have validated the notion that organizational reactions to climate change depend on the significance of stakeholders and that stakeholder pressure affects carbon disclosure. Including carbon efficiency in the planning, carrying out, and controlling of corporate operations to get a competitive edge is known as low-carbon operations management. Low-carbon operations are those that include the creation of low-carbon goods, manufacturing, and logistics methods (Lopes de Sousa Jabbour et al., 2021).
Low-carbon products aim to reduce carbon emissions over the whole life cycle of the good, which includes the use of more energy-effective manufacturing methods. Some instances of low-carbon processes involve the adoption of energy-efficient practices to mitigate greenhouse gas emissions and the diligent tracking and preservation of a carbon footprint for businesses (Yaman, 2024; Zhang et al., 2021). Low-carbon logistics mostly concern transportation, one of the main causes of greenhouse emissions from the use of petroleum and natural gas (Xu, 2024). Logistic manager have the ability to optimize the utilization of cargo space and reevaluate transportation options to reduce carbon emissions (Wild, 2021).
One study Pålsson and Kovács (2014), finds that stakeholder theory facilitates comprehension of firms’ reasons for lowering carbon emissions in transportation operations. Because stakeholders are "forcers" of environmental change (Lopes de Sousa Jabbour et al., 2021), they were shown to play a major role (e.g., workers, shareholders, governance, consumers, and rivals). According to Delgado-Ceballos et al. (2012), organizations that strive to meet the environmental requirements of stakeholders engage in aggressive environmental activities, such as implementing low-carbon practices. That is to say, stakeholders provide the drive for low-carbon activities. However, the implementation of LOMP techniques might confront obstacles when stakeholders exert less pressure in settings where regulatory authorities have fewer stringent regulations (Li, B. et al., 2024).
The literature shows that the substantial role of digital innovation in low-carbon operations is to change the core of traditional business operations and to introduce new sustainability work (Wang et al., 2023). According to Yunita et al. (2023), digital innovation or dynamic capability allows re-structurally to formed resources and activities in flaccid relationships relating to external stress and opportunities. The clear description of stakeholders in the low carbon operation stating differently, as suggested by Bukari et al. (2024), is the stakeholder theory, which involves contributors at every level, including customers, regulators, and investors, requiring organizations to embrace digital advancement and satisfy all low carbon pressures. Some companies become dedicated and motivated to low-carbon operations that support external stakeholders. The innovating company needs to align with these pressures because innovation and adopting low carbon is the right thing to do for firms regarding external pressure (Jiang et al., 2020).
Previous research has shown that digital innovation has a significant and positive effect on environmental performance and the adoption of appropriate, sustainable business practices. According to (Chen et al., 2023; Li, J. et al., 2024; Weiss and Anisimova, 2019), well-thought-out and designed environmental regulations may spur innovation that “may partially or more than fully offset costs of compliance”. Hence, it may be concluded that in the context of low-carbon operations, digital innovation serves as motivation for businesses. In addition, the emergence of new technologies brings about a range of opportunities and new markets. Therefore, businesses are further motivated to establish their operations as ecologically friendly. The above can be summarized in the following hypothesis:
H1. Stakeholders have a significantly positive effect on motivations to develop the operation as low-carbon.
H2. Digital innovation have a significantly positive effect on motivations to develop the operation as low-carbon.
Recent research has shown that stakeholder pressure can influence a company’s response to climate change (Alessa et al., 2024; Vázquez-Brust et al., 2023). However, these investigations have solely concentrated on the impact of stakeholder pressure on environmental management and carbon strategies within organizations. There is a lack of study about the impact of stakeholder pressure on the implementation of three particular LOMP that aim to reduce carbon emissions: the use of low-carbon items, low-carbon processes, and low-carbon logistics. These practices reflect various ways that organizations respond to stakeholder demand. This study aims to examine the following hypothesis.
H3a. The adoption of LCProd is significantly influenced by Stakeholder pressure.
H3b. The adoption of LCProc is significantly influenced by stakeholder pressure.
H3c. The adoption of LCLog is significantly influenced by Stakeholder pressure.
According to the dynamic capacity theory, developing internal resources and sustainable management skills of companies would increase the competitiveness of organizations (Otache, 2024). Organizations may improve their sustainable performance by making environmental upgrades investments. The DCT contends that sustainable development, product stewardship, and pollution reduction are the three most important strategic skills (Iddrisu, 2023). In the shift to a low-carbon economy, one crucial competitive reaction is to build resources and capacities for reducing carbon emissions (Busch et al., 2018).
The use of LOMP techniques approaches may be perceived as an essential capacity to respond to climate change concerns expressed by stakeholders. Low-carbon processes and logistics seek to improve process efficiency—including carbon efficiency and they are related to a company’s pollution avoidance plan. Since low-carbon goods modify aspects of product design from a life-cycle viewpoint, they are related to the product stewardship approach. Thus, it may be said that, according to the DCT, implementing low-carbon operations procedures offers an organizational reaction to stakeholders’ demands about the effects of climate change. Moreover, when stakeholder pressure varies, so does the adoption of low-carbon operating methods (Lopes de Sousa Jabbour et al., 2021).
The role that stakeholders play in shaping organizational actions regarding climate change has been covered in many studies. According to Kitsis and Chen (2021), the source of stakeholder pressure has minimal impact on organizational reactions and CO2 emission reduction measures. Bello-Pintado et al. (2023) appear to concur with Betts et al. (2015), in that various firms face stakeholder pressure differently depending on the particular characteristics of the industry to which they belong. However, the dynamic capability theory states that the pressure of the stakeholders does not affect the corporate response to environmental management techniques. It appears that there are two conflicting views on the influence of the stakeholders on the response of the organizations to such techniques as decreasing CO2 emissions; (Herold et al., 2019; Kitsis and Chen, 2021). Both authors claim that response of an organization to the pressure of the stakeholders depends on which stakeholder. Hence, the first hypothesis of this set is based on the abovementioned assumptions. According to them, the adoption of low-carbon operations manual practices, such as low-carbon product, low-carbon processes, and low-carbon logistics is correlated with the stakeholder pressure. Another assumption that underpins the hypotheses of this set is the idea that environmental assets and environmental capabilities play a crucial role in overcoming certain external ecological barriers and improving the competitive position of an organization. (Deng et al., 2024; Ibrahim et al., 2022).
H4a. The presence of motivations for LOMP has a positive effect on the acceptance and adoption of LCProd.
H4b. The presence of motivations for LOMP has a positive effect on the acceptance and adoption of LCProc.
H4c. The presence of motivations for LOMP has a positive effect on the acceptance and adoption of LCLog.
2.2. LOMP and Firms’ Carbon Reduction Performance
Carbon reduction programs and policies reduce environmental impact and improve company performance by focusing on carbon emissions (Baratta et al., 2023). Carbon performance measures environmental performance, especially an organization’s principal operations’ carbon emissions reduction. This comprises energy usage, carbon dioxide emissions, and high-carbon resource use per product (Baritto et al., 2023). Surprisingly, the correlation between the adoption of green practices by corporations and their real environmental impact has not been well researched, unlike the correlation between the implementation of environmental policies and financial performance. The scarcity of research on this topic may be attributed to businesses’ predominant focus on their financial performance. Moreover, the availability of data on environmental sustainability and carbon emissions is much more restricted compared to financial performance data (Rehman et al., 2024). There is a degree of uncertainty about the connection between LOMP and carbon reduction performance (Wanke et al., 2021). There is a limited amount of research that has examined the effects of low-carbon operational techniques on the decrease of greenhouse gas (GHG) emissions (Ekemezie and Digitemie, 2024). An essential component of evaluating this connection is ascertaining if it is beneficial for corporations to allocate substantial resources to such endeavors. Some argue that corporations may adopt specific practices as a type of “green washing" to enhance their reputation, although this does not necessarily lead to actual improvements in environmental performance. In such circumstances, the main goal is to send a positive signal to the marketplace (Crossley et al., 2021). Hence, conducting additional research on the correlation within low-carbon operations management practices and carbon reduction performance contributes to the existing body of knowledge by enhancing comprehension of the effectiveness of stakeholder pressure in promoting carbon operations practices and subsequently enhancing organizational efforts to reduce carbon emissions (Camel et al., 2024).
Prior research has shown inconsistent findings about the relationship between low-carbon operations management practices (LOMP), carbon reduction performance (CRP), and the scope of organizations (Sheng et al., 2023). Small-scale producers may prioritize process improvements above product redesign, as dictated by client requirements (Calignano and Mercurio, 2023). According to Jiang et al. (2022), it is often believed that larger companies are more inclined to implement carbon approaches or carbon management efforts when they face favorable external influences. Therefore, drawing on prior remarks about the correlation between LOMP and carbon reduction performance, it may be postulated that:
H5. The use of LCProd has a positive effect on firms’ CRP.
H6. The use of LCProc has a positive effect on firms’ CRP.
H7. The use of LCLog has a positive effect on firms’ CRP.
2.3. Digital Innovation and LOMP
Digital innovation encompasses the use of digital technology, including the web of things, machine learning, cloud computing and artificial intelligence, to revolutionize company operations, procedures, and value generation (Gupta and Jauhar, 2023). Digital innovation, which utilizes digital technology, delivers distinct transformations to the operations and value generation of organizations. It has gained widespread recognition as an exemplary business approach (Skare et al., 2023). It focuses on making efficient production choices in a volatile environment and serves as a crucial tool for achieving LOMP. Managers often exhibit a cautious stance towards LOMP due to the potential for its ambiguity to permanently disrupt the normal functioning of the firm. In accordance with the dynamic capabilities theory, we suggest that businesses may efficiently manage and analyze information by using digital innovation in order to address this very unpredictable environment (Yuan et al., 2024). Digital innovation enables the collection of data on productivity, cost, and energy consumption (Zhang et al., 2023), which supports the reduction of carbon emissions in manufacturing and is highly valued by businesses. As an example, SF Express used big data analytics technology to improve the distribution of storage resources, resulting in a decrease in energy consumption during production. Additionally, they implemented autonomous guided vehicle robots to accomplish complete automation in the sorting process. A combination of digital approaches facilitates the enhancement of low-carbon manufacturing and services.
The quantification of carbon emissions produced at various phases of a product’s lifetime may be ascertained during the creation of low-carbon goods (Kong et al., 2023). Therefore, it is necessary to promote the development of low-carbon product design via digital innovation. Digital innovation facilitates the connection and integration of information throughout the value chain (Surucu-Balci et al., 2024), enabling the identification of suitable renewable resources and strategies for reducing carbon emissions (Raihan et al., 2023). In addition, the energy consumption monitoring system implemented via digital technologies may provide prompt feedback on carbon emissions data for goods throughout their use phase (Zhao et al., 2022). This aids firms in the development of products with reduced carbon footprints.
The De-carbonization of manufacturing processes is another possibility presented by digital innovation. By use of digital tools, companies may encourage supply, manufacturing, and R&D cooperation, thus achieving integration and effective distribution of production resources (Zhao et al., 2024), In this sense, process information may be analyzed, planned, and reorganized thanks to the combination of digital and manufacturing technologies (Sheng et al., 2023). With that, enterprises or businesses can produce products with great efficiency in industries (Zheng and Luo, 2023). Furthermore, digital innovation contributes to identifying the source of carbon emissions. Companies might rethink their production methods using this vital knowledge (Adama et al., 2024). As such, digital innovation will result in a manufacturing process marked by advanced technology and reduced consumption of assets, therefore helping to decarbonize processes. Digital innovation allows manufacturers to develop low-carbon logistics (Sikiru et al., 2024; Söderholm, 2020). The best route is planned by digital technologies depending on the age and distance of the goods, and they also remind drivers to utilize fuel-saving algorithms and predictive navigation to save energy. Moreover, corporations use digital innovation to effectively align vehicles and merchandise by combining routes and transportation resources. Enterprises have long acknowledged the need for digital innovation in low-carbon logistics. The intelligent logistics platform created by the electrical equipment manufacturer CRRC Zhuzhou lowers the amount of wasteful transportation of cars and lowers carbon emissions. As such, we postulate:
H8a. Digital innovation positively influences the adoption of LCProd.
H8b. Digital innovation positively influences the adoption of LCProc.
H8c. Digital innovation positively influences the adoption of LCLog.
2.4. Stakeholder, Digital Innovation and Firms’ Carbon Reduction Performance
In order to foster the growth of a business, it is important to prioritize the concerns of shareholders and fulfil the demands of stakeholders such as the government and the community. Engaging in innovation without a clear objective often has counterproductive outcomes. Specifically, a high volume of inputs may result in little output, failing to provide the anticipated economic advantages for the firm and perhaps causing significant losses.
Hence, the selection of the innovation direction is of utmost importance. Establishing low-carbon strategies and the relevant countermeasures represent a beneficial and efficient way for enterprise innovation. The debt financing could also be a factor that facilitates the organizations’ responsibility of environment (Jiang et al., 2020). Meanwhile, to comply with national environmental rules, the debt financing has many advantages: if the manage appropriately, it will help the business pay their moral and legal dues. They also create a variety of financial sources, reduce the cost of financing, and assistance of digital innovation financing (Feng et al., 2022). Firms could take advantage of reducing the cost of product production by cutting the energy consumption costs or the pollution charge penalties and thus improving the quality of goods from enterprises to gain sustainable competitive advantage (Qiu et al., 2020; Song et al., 2017). Another benefit is that they provide much more effective bases for the organizational development as well as the financial performance. On the other hand, digital innovation represents one of the most influential ways to help the organizations fulfil their environment responsibilities. It is safe to say that the firms’ initiatives to reduce carbon emissions are not donations to the digital innovation field. Instead, they could be exercised to form the green patented technologies that are the focal points of the digital innovation. This sends a good message to the public that a proactive and efficient carbon strategy is enabled by encouraging these efforts by the associated digital impacts. Thus, these measures have a strong potential to support firm growth by alleviating customers’ buy apprehensions and increasing investors’ commitment (Yan et al., 2022). Undoubtedly, possessing strong technical innovation capabilities may assist firms in implementing carbon strategies, hence enhancing their financial performance (Lv et al., 2021; Zhou et al., 2023).
To summarize, adopting excellent carbon performance behavior guides the digital innovation of firms, while the capacity to innovate digitally ensures the successful implementation of carbon strategies. Both carbon performance and technology innovation have a mutually beneficial relationship with financial performance. This implies that carbon performance can have a significantly positive impact on the influence of technology innovation on financial performance, and at the same time, technology innovation can also have a positive impact on the influence of carbon performance on financial performance. They collaborate to enhance business financial performance. Furthermore, in China, there are two distinct sorts of companies. Non-state-owned firms, driven by the pursuit of profit, must strive to maximize their financial gains while reducing carbon emissions in a highly competitive market. State-owned firms, in contrast, have more social duties and are bound by government rules. This may diminish their incentive to prioritize financial gains due to their focus on adhering to policies. Given this information, two theories are put forward:
H9. Stakeholders positively influences of firms’ carbon reduction performance.
H10. Digital innovation positively influences of firms’ carbon reduction performance.
Figure 1 illustrates the conceptual model of this investigation.
3. Research Methods
3.1. Sampling and Data Collection
We chose Chinese manufacturers as our sample group for the questionnaire survey. China, as an emerging economy, has made a firm commitment to attaining carbon neutrality by the year 2060. China has a difficult task of fulfilling this commitment while ensuring its economic progress remains unaffected. Given that the effective implementation of economic activities hinges on the ability of manufacturing businesses to add something to society over and above the carbon they produce, the industry’s contribution to this goal is likely to be vital. The Chinese government has proposed to produce new engines for its economic growth by combining digitalization and green and low carbon. Consequently, this is an interesting time to examine the impact of digital innovation on LOMP and subsequent performance.
A web-based survey was distributed using Credamo, a platform that is recognized for leveraging a professional data collection solution. The platform has a pool of 1.5 million participants who are rigorously verified. In recent years, many scholars have chosen to use Credamo to conduct surveys and experiments. (Gai and Puntoni, 2021; Lin and Deng, 2024; Sheng et al., 2023). Several official studies have verified that the information provided on this website is particularly high quality. In fact, before it pulls in the questionnaire, Credamo provides two signals, credit ratings and historical adoption rates, to ensure that the data here are valid. In addition, each participant who gave their reply on the website had a credit score. The deduction will occur if the questionnaire submitted to the site is denied several times. In addition, the participants’ historically low rate of adoption, and the quality of this response was particularly high. Participants who get a score of 70 demonstrate exceptional achievement in both of these categories. Therefore, we deliberately selected people with an excellent credit rating and a history of acceptance rate exceeding 70 to ensure the questionnaire’s data integrity.
The survey technique is presented here with precision. At first, we distributed the survey to and compensated every participant. The research only included managers exclusively from industrial enterprises as participants. In addition, Credamo promptly sent the survey to all eligible participants who have registered on the site. After collecting all the surveys, we next proceeded to screen them. If the user consistently chooses the same option and the time it takes to respond is less than 10 minutes, the survey will be rejected rather than any payment. After excluding inadequate surveys, the platform continued to disseminate the survey responses to more people, therefore improving the accuracy of the data.
A grand total of 540 questionnaires were disseminated, and precisely 412 legitimate replies were received. The percentage of responses is 76.29%. Table 1 displays the attributes of the example firms. The sample encompasses many businesses, including medical and pharmaceutical, as well as Energy-efficient and innovative electric vehicles sectors, which suggests that the firms are representative.

Table 1.
Sample overview.
| Attributes of Manufacturers | Frequency | Percentage |
|---|---|---|
| Industry | ||
| Petroleum and related products | 13 | 3.16 |
| Food and beverage | 45 | 10.92 |
| Energy-efficient and innovative electric vehicles | 8 | 1.94 |
| Textile | 25 | 6.07 |
| Airline and space industry | 35 | 8.50 |
| Electricity and thermal energy | 18 | 4.37 |
| Transportation apparatus | 62 | 15.05 |
| Electrical machinery and equipment | 75 | 18.20 |
| Medical and pharmaceutical | 24 | 5.83 |
| Telecommunication and computer hardware | 76 | 18.45 |
| Chemicals and associated goods | 21 | 5.10 |
| Others | 10 | 2.43 |
| Number of employees | ||
| 1–199 | 25 | 6.07 |
| 200-599 | 32 | 7.77 |
| 600-999 | 85 | 20.63 |
| 1000-1999 | 98 | 23.79 |
| 2000-3999 | 52 | 12.62 |
| Over 4,000 | 120 | 29.13 |
| Type of ownership | ||
| Private-owned firms | 295 | 71.60 |
| State-owned and cooperative firms | 71 | 17.23 |
| Foreign-invested firms | 46 | 11.17 |
Source: Authors calculation.
The sample size of 412 exceeds the recommended minimum sample size of 111, as determined by G*Power using an effect size of 0.3, an alpha level of 0.05, and a power of 0.95 (Faul et al., 2009). Furthermore, this sample size has exceeded the recommended guideline for artificial neural network analysis, which suggests that the required sample size should be at least 50 times the number of adjustable parameters in the neural network (Alwosheel et al., 2018; Silik et al., 2023). Given that the neural network has 7 parameters, a minimum sample size of 350 is necessary. Hence, the population size of 412 is adequately substantial for the ANN assessment.
3.2. Measurement Instruments
This study used verified measures from previous research, either by adopting them as they were or by making necessary modifications. Initially, we translated the English version into Chinese and subsequently implemented the back-translation to guarantee multicultural equivalence in the development of size items (Sheng et al., 2023). The scale underwent evaluation by both academics and practitioners. In addition, we conducted a preliminary assessment using 52 samples and made adjustments to the questionnaire based on the received input. The items were operationalized using a seven-point Likert scale.
The measurement of digital innovation was conducted using a five-item scale developed by (Bharadwaj et al., 2013; Nwankpa et al., 2022). The measurement of stakeholder ambivalence used a scale consisting of six items sourced from previous studies conducted by (Böttcher and Müller, 2015; Liu, 2014). The measurement of motivation used a scale consisting of four items devised by (Böttcher and Müller, 2015; Liu, 2014). Three variables from Böttcher and Müller (2015) are used to measure incentives for low-carbon operations management. Three particulars were used to evaluate the three components of low-carbon operation management practices, namely low-carbon product, low-carbon processes, and low-carbon logistics. The participants were asked to provide their favorable and unfavorable assessments of LOMP. Three carbon performance measurement tools were devised by (Böttcher and Müller, 2015).
This analysis additionally accounted for the effects of variables such as business size, firm age, ownership structure, and industry type. Established and mature firms may possess a greater abundance of resources. Consequently, we managed to regulate the dimensions and longevity of the company. The evaluation was conducted using the natural logarithms of the number of workers and years of operation, respectively. This analysis additionally accounted for ownership structure since private firms’ exhibit more dynamism. The success of a company may be influenced by the kind of industry it operates in since various firms often have varying prospects for growth and development (Zhang et al., 2015). The ownership structure, indicated by a binary variable (1 for privately owned and 0 for others), and the industry type, indicated by another binary variable (1 for high-tech businesses and 0 for others), were both assessed using variables that were dummy.
Table 2 above illustrates the results of construct reliability and convergent validity. The following are the loading factor, average variance retrieved, and reliability values observed in the assessment model investigation for all variables. The loading factor is more than 0.708, and the Average Variance Extracted Baratta et al. (2023) is greater than 0.50, which satisfies the required criteria (Benitez et al., 2020). Nevertheless, some indications of the measuring model were kept, with a loading factor value greater than 0.60. According to Sarstedt et al. (2021), the loading factor indicates the amount of variation in a construct that is accounted for. Therefore, it is permissible to maintain content validity by retaining a measure with relatively small loading values in the construct if the AVE value exceeds 0.5.
Table 2.
Construct validity and reliability.
| Items | Factor Loading | Cronbach’s α | CR | AVE | Source | |
|---|---|---|---|---|---|---|
| Stakeholders | (Böttcher and Müller, 2015; Liu, 2014) | |||||
| Sth1 | 0.856 | 0.849 | 0.862 | 0.576 | ||
| Sth2 | 0.832 | |||||
| Sth3 | 0.871 | |||||
| Sth4 | 0.772 | |||||
| Sth5 | 0.790 | |||||
| Sth6 | 0.825 | |||||
| Digital Innovation | (Bharadwaj et al., 2013; Nwankpa et al., 2022) | |||||
| DI1 | 0.843 | 0.794 | 0.868 | 0.548 | ||
| DI2 | 0.750 | |||||
| DI3 | 0.715 | |||||
| DI4 | 0.822 | |||||
| DI5 | 0.719 | |||||
| Motivation | (Böttcher and Müller, 2015; Liu, 2014) | |||||
| Mot1 | 0.719 | 0.793 | 0.812 | 0.616 | ||
| Mot2 | 0.840 | |||||
| Mot3 | 0.815 | |||||
| Mot4 | 0.759 | |||||
| Low-Carbon Product | (Böttcher and Müller, 2015; Liu, 2014) | |||||
| LCProd1 | 0.843 | 0.762 | 0.688 | 0.597 | ||
| LCProd2 | 0.756 | |||||
| LCProd3 | 0.792 | |||||
| Low-Carbon Process | (Böttcher and Müller, 2015; Liu, 2014) | |||||
| LCProc1 | 0.923 | 0.725 | 0.788 | 0.650 | ||
| LCProc2 | 0.812 | |||||
| LCProc3 | 0.791 | |||||
| Low-Carbon Logistics | (Böttcher and Müller, 2015; Liu, 2014) | |||||
| LCLog1 | 0.878 | 0.860 | 0.881 | 0.782 | ||
| LCLog2 | 0.952 | |||||
| LCLog3 | 0.818 | |||||
| Carbon Reduction Performance | (Böttcher and Müller, 2015; Liu, 2014) | |||||
| CRP1 | 0.826 | 0.867 | 0.870 | 0.793 | ||
| CRP2 | 0.884 | |||||
| CRP3 | 0.957 |
Note (s): Cronbach’s α= Alpha, CR = Composite reliability, AVE = Average variance extracted. Source: Authors calculation.
3.3. Common Method Bias Assessment
We examined the data to detect prevalent procedure bias, a notable issue in social science research that has been extensively discussed over the previous three decades. This problem frequently arises in the context of self-reporting methodologies that involve the collection of data through questionnaire surveys, which may introduce measurement inaccuracies. Chouhan et al. (2023) offer academicians’ strategies to reduce this bias, thereby preventing the occurrence of inaccurate findings, such as exaggerated or diminished correlations. Inflation may result in a misinterpretation of a robust correlation between variables or provide evidence for a hypothesis that is actually unfounded (type I error). However, deflation can result in the denial of a theory that is actually valid or make the link between variables appear feeble (type II error). We employed the comprehensive collinearity technique detailed by de Sousa Jabbour et al. (2022) in PLS-SEM to resolve this issue, specifically by analyzing the average variance inflation factor (AFVIF) value. The results provided in Table 7 show that in the analysis, the AFVIF values are less than 3.3, which suggests that no substantive common method bias affected our findings.
3.4. Data Analysis Techniques
However, the Structural Equation Modelling (SEM) technique has been employed in the current study. It is considered the second generation of multivariate analysis. Evident in most fields and essential to quantitative research, structural equation modelling facilitates the analysis of links between concealed variables and the assessment of intricate connections. Structural Equation Modelling also accounts for a more complicated and advanced approach than such conventional methods as route analysis or multiple regression. SEM makes it possible to examine various samples simultaneously and without interference. Therefore, the method is appropriate for the research owing to the benefits it ensures. Hence, we have decided to use variance-based structural equation modelling (VB-SEM) with partial least squares structural equation modelling (PLS-SEM) for our data analysis. Partial least squares structural equation modelling is a flexible approach that has a higher potential for representing the interactions among multiple constructs. This method is appropriate when little theory exists to understand these interactions (Noonan and Wold, 1988). PLS-SEM is highly beneficial for the testing of some new theoretical or conceptual models, especially when examining the complex relationships between the variables. (Ramli et al., 2018); Usakli and Rasoolimanesh (2023) emphasized that traditional regression tools and covariance-based SEM could be applied within the chosen domain with fewer prepositions. At the same time, while using the PLS model, it is important to assume several factors, including the absence of the inaccurate definition of a model and multicollinearity among the predictor variables.
This research involves the use of data analysis technique, which is separated into two primary sub-processes. The first stage consisted of evaluating the measurement model to verify the precision and reliability of every indication. In the second step, the structural model is evaluated by analyzing the coefficient of determination (R2), Q2 predictive relevance, effect size (f2), and the degree of fit model. Figure 2 illustrates the methodology employed in the investigation.
4. Results
4.1. Descriptive Analysis
As seen in Table 3, the descriptive examination of latent constructs reveals mean scores of 4.81, 4.85, 5.05, 4.82, 4.61, 4.75, and 4.80 for Sth, DI, Mot, LCProd, LCProc, LCLog and CRP, respectively. In line with previous research conducted by Vogt and Williams (2011), the skewness values consistently stayed below the criteria of ±3 and ±10. An analysis of correlations revealed a maximum value of 0.965 between latent components, indicating the lack of multicollinearity, as shown in Table 4. The absence of multicollinearity indicates that the model is appropriate for further statistical evaluation.
Table 3.
Descriptive statistics.
| N | Mean | STDEV | Variance | Kurtosis | Skewness | |
|---|---|---|---|---|---|---|
| Sth | 412 | 4.8167 | 1.0957 | 0.706 | -0.857 | -0.142 |
| DI | 412 | 4.8560 | 1.1194 | 0.562 | -0.624 | -0.148 |
| Mot | 412 | 5.0575 | 1.1230 | 0.592 | -0.572 | -0.29 |
| LCProd | 412 | 4.8267 | 1.0290 | 0.683 | -0.474 | 0.521 |
| LCProc | 412 | 4.6133 | 1.0160 | 0.851 | -0.528 | 0.059 |
| LCLog | 412 | 4.7533 | 1.2393 | 0.663 | -1.432 | 0.179 |
| CRP | 412 | 4.8067 | 1.1063 | 0.738 | -0.654 | -0.095 |
Source: Authors calculation.
Table 4.
Correlation analysis.
| Sth | DI | Mot | LCProd | LCProc | LCLog | CRP | |
|---|---|---|---|---|---|---|---|
| Sth | 1 | ||||||
| DI | .825** | 1 | |||||
| Mot | .734** | .758** | 1 | ||||
| LCProd | .562** | .336** | .735** | 1 | |||
| LCProc | .769** | .602** | .499** | .697** | 1 | ||
| LCLog | .656** | .599** | .691** | .377** | .607** | 1 | |
| CRP | .868** | .796** | .784** | .515** | .808** | .731** | 1 |
**. Correlation is significant at the 0.01 level (2-tailed). Source: Authors calculation.
Table 5.
Fornell−Larcker criterion.
| CRP | DI | LCLog | LCProc | LCProd | Mot | Sth | |
|---|---|---|---|---|---|---|---|
| CRP | 0.890 | ||||||
| DI | 0.815 | 0.740 | |||||
| LCLog | 0.722 | 0.608 | 0.884 | ||||
| LCProc | 0.810 | 0.621 | 0.617 | 0.806 | |||
| LCProd | 0.533 | 0.365 | 0.419 | 0.695 | 0.772 | ||
| Mot | 0.781 | 0.792 | 0.686 | 0.504 | 0.254 | 0.785 | |
| Sth | 0.869 | 0.843 | 0.663 | 0.763 | 0.560 | 0.750 | 0.759 |
AVE’s square roots are indicated as bold values on the diagonal of the correlation matrix: Below the diagonal are off-diagonal elements that indicate interrelationships between concepts. Source: Authors calculation.
The heterotrait-monotrait ratio (HTMT) was proposed by Henseler et al. (2016) as a novel approach for calculating the differential value. This article used a mix of the Fornell-Larcker and HTMT criteria. Table 1 demonstrates that the square root of the Average Variance Extracted is greater than the correlation coefficients for each construct (Baratta et al., 2023). This indicates that the values of the Dependent Variable (DV) are established. According to Henseler et al. (2016), a construct that is theoretically identical has a threshold value of 0.90, while a construct that is conceptually dissimilar has a threshold value of 0.85. Table 6 indicates that all structures possess HTMTs below 0.85. Tang et al. (2018) did an investigation on multicollinearity utilizing the variance inflation factor (VIF), which should ideally be less than 5.
Table 6.
Heterotrait-monotrait ratio (HTMT)-Criterion.
| CRP | DI | LCLog | LCProc | LCProd | Mot | Sth | VIF | |
|---|---|---|---|---|---|---|---|---|
| CRP | 1.000 | 1.857 | ||||||
| DI | 0.810 | 1.000 | 1.591 | |||||
| LCLog | 0.821 | 0.516 | 1.000 | 1.646 | ||||
| LCProc | 0.722 | 0.585 | 0.722 | 1.000 | 1.155 | |||
| LCProd | 0.725 | 0.667 | 0.651 | 0.811 | 1.000 | 1.235 | ||
| Mot | 0.814 | 0.826 | 0.741 | 0.669 | 0.668 | 1.000 | 1.276 | |
| Sth | 0.711 | 0.783 | 0.513 | 0.516 | 0.691 | 0.774 | 1.000 | 2.021 |
Source: Authors calculation.
4.2. Structural Model Assessment
Once the reliability and validity of all the variables’ indicators were confirmed, the subsequent phase consisted of evaluating the outcomes of the structural model and conducting hypothesis testing. The PLS-PM algorithms use an iterative approach based on multiple regression analysis. In PLS-PM, the interpretation of path coefficients is equal to the standardization of regression coefficients. Moreover, according to Hidayat-ur-Rehman and Alsolamy (2023); (Latan, 2018), the concept of interpretation might also be extended to adjusted r-square, variance inflation factor (VIF), impact size (f2), and predictive relevance (Q2).
Before sharing the results of our study in this next phase, it would be necessary to note that we examined the collinearity of the structural model. In order to assess collinearity, we employed the same metric which was used in multiple regression. It is preferred to be below 3.3 for all variable predictors in the model. Latan proposed that values less than 5 should still be acceptable (Hidayat-ur-Rehman and Alsolamy, 2023; Latan, 2018). The analytical results presented in Table 7 demonstrate the absence of any issue of collinearity that could negatively influence the results. In addition, we assessed the structural model by examining the coefficient of determination (R2), f2, and Q2. The coefficient of determination quantifies the ability of the model to make accurate predictions and indicates the proportion of variability in the dependent variable that can be accounted for by the independent variables. A coefficient of determination beyond 0.20 is regarded as high in some fields, whereas values ranging from 0.25 to 0.50 are deemed acceptable.
Table 7.
Structural model results.
| Constructs | R2 | Adj.R2 | F2 | Q2 | AFVIF |
|---|---|---|---|---|---|
| Sth | - | - | 0.069–0.683 | - | - |
| DI | 0.060 | 0.052 | 0.075–0.239 | 0.056 | - |
| Mot | 0.418 | 0.423 | 0.049–0.145 | 0.483 | - |
| LCProd | 0.377 | 0.311 | 0.056 | 0.309 | - |
| LCProc | 0.386 | 0.375 | 0.256 | 0.410 | - |
| LCLog | 0.203 | 0.180 | 0.001 | 0.163 | - |
| CRP | 0.412 | 0.415 | - | 0.412 | 0.191 |
Source: Authors calculation.
The data in Table 7 shows that the R-square and Adj. R-square values produced by each endogenous construct are completely satisfactory. These numbers indicate that the predictor factors have a high degree of explanatory power for the outcome variables. The impact size values of each predictor variable in the framework vary from 0.01 to 0.68, indicating a range from small to big categories. The Q2 predictive relevance score shows that the endogenous variables are outstanding, with values greater than 0, indicating that the framework has predictive significance.
Subsequently, we will discuss the procedure for testing hypotheses once the measurement model has been executed. The study model was evaluated using Smart-PLS 4.0. The inner or structural model follows the measuring model. The inner model, used for hypothesis testing, is also used to compute the p-value and t-value. The hypothesis is considered valid when either the t-value or the p-value is more than 1.96 or less than 0.05. In this investigation, 5000 subsamples were bootstrapped and resampled using PLS-SEM. The data obtained from the testing of hypotheses are shown in Table 8 and Figure 3.
Table 8.
Results of hypothesis testing.
| Hypothesis | Structural Path | STDEV | Coefficient | T-Statistics | P Values | Remarks |
|---|---|---|---|---|---|---|
| H1 | STh -> Mot | 0.111 | 0.283** | 2.558 | 0.011 | Accepted |
| H2 | DI -> Mot | 0.099 | 0.553*** | 5.586 | 0.000 | Accepted |
| H3a | Sth -> LCProd | 0.117 | 0.958*** | 7.474 | 0.000 | Accepted |
| H3b | Sth -> LCProc | 0.125 | 0.873*** | 6.649 | 0.000 | Accepted |
| H3c | Sth -> LCLog | 0.135 | 0.389*** | 3.857 | 0.000 | Accepted |
| H4a | Mot -> LCProd | 0.138 | -0.305** | 2.214 | 0.027 | Accepted |
| H4b | Mot -> LCProc | 0.110 | -0.159 | 1.449 | 0.147 | Rejected |
| H4c | Mot -> LCLog | 0.124 | 0.463*** | 3.738 | 0.000 | Accepted |
| H5 | LCProd -> CRP | 0.074 | -0.087 | 0.502 | 0.175 | Rejected |
| H6 | LCProc -> CRP | 0.094 | 0.346*** | 3.687 | 0.000 | Accepted |
| H7 | LCLog -> CRP | 0.048 | 0.171* | 3.585 | 0.000 | Accepted |
| H8a | DI -> LCProd | 0.133 | -0.201** | 2.788 | 0.005 | Accepted |
| H8b | DI -> LCProc | 0.135 | 0.254** | 6.357 | 0.000 | Accepted |
| H8c | DI -> LCLog | 0.148 | 0.349*** | 2.563 | 0.000 | Accepted |
| H9 | Sth -> CRP | 0.086 | 0.286** | 7.295 | 0.000 | Accepted |
| H10 | DI -> CRP | 0.087 | 0.269** | 3.264 | 0.001 | Accepted |
Notes: Sth=Stakeholders, DI=Digital innovation, Mot=Motivation, LCProd= Low carbon product, LCProc=Low carbon process, LCLog= Low carbon logistics, CRP= Carbon reduction performance; ***= p < 0.001, ** = p < 0.01, and *=p < 0.05. Source: Author calculation.
According to our model’s results, all hypothesized relationships are significant except for two variables. In this study, hypotheses regarding the effects of firm dynamics on various relationships. Stakeholder pressure significantly affects motivation according to the direct effect analysis in Table 8 with a coefficient of 0.283 (t-statistics= 2.558, p= 0.011); thus, H1 is accepted. A significant direct effect of motivation is also observed for DI with a coefficient of 0.553 (t-statistics = 5.586, p = 0.000); thus, H2 is supported. Moreover, stakeholder has a significant impact on low carbon operation (low carbon product, low carbon process, low carbon logistics), (coefficient = 0.958, 0.873, 0.389, t-statistics = 7.474, 6.649, 3.857, p = 0.000, 0.000, 0.000); H3a, H3b, H3c are supported. Further motivation is a significant effect is also observed for low carbon processes, but not significance for low carbon processes and significance for low carbon logistics. Therefore, the coefficient of motivation for low carbon operation are -0.305, -0.159 and 0.463 (t= 2.214, 1.449, 3.738, p=0.027, 0.147, 0.000); thus, H4a and H4c are supported, and H4b is not supported.
Additionally, low-carbon product negatively impacts CRP, low-carbon processes positively impact CRP, and low-carbon logistics positively impact CRP; the coefficient value is -0.087, 0.346, 0.171 (t= 0.502, 3.687, 3.585, p= 0.175, 0.000, 0.000), thereby H5 is not supporting, H6 and H7 are supporting. A significant direct effect of DI is also observed for low carbon operation with a coefficient of -0.201, 0.254, 0.349 (t-statistics = 2.788, 6.357, 2.563, p = 0.000, 0.000, 0.000); thus, H8a, H8b, H8c are supported. Additionally, stakeholder pressure and DI significantly affect CRP according to the direct effect analysis in Table 8 with coefficients 0.286, 0.269 (t=statistics= 7.295, 3.264, p= 0.000, 0.001); thus, H9 and H10 are accepted.
4.3. ANN Analysis
Roy et al. (2024) have recently demonstrated that hybrid methods can be used to compare the results of PLS-SEM and ANN. Therefore, we selected the significant factors from the SEM-PLS path analysis as the input neurons for the ANN model (Figure 4). IBM’s SPSS neural network module was employed to conduct the ANN analysis. The ANN algorithm is capable of capturing both linear and nonlinear relationships and does not require a normal distribution (Jain and Raghuram, 2024). In our view, the algorithm can ever learn to predict the outcomes of the analysis. I believe so because, through the training process, the algorithm uses a feed-forward-backwards-propagation which means that the inputs are feed in a forward path whereas the estimated error is moved in a backward direction (Patruni and Rao, 2023). Also, the input and concealed layers have been facilitated with multilayer perceptron’s and sigmoid activation functions respectively (Lee et al., 2020). Through multiple learning cycles, the error is minimized and the accuracy of the prediction improved (Li et al., 2023).
In a manner similar to that of Suhail et al. (2024), we allocated 90% of the samples to the training procedure and the remaining 10% to the testing procedure. In order to prevent over fitting, we implemented a ten-fold cross-validation procedure and acquired the root mean square of errors (RMSE) (Hassan et al., 2023). The ANN model of the data yielded mean-RMSE values of 0.1393 and 0.0799, respectively, as illustrated in Table 9. The RMSE was employed to evaluate the accuracy of neural network models (Afzal et al., 2024). The RMSE results of our ANN model for training and testing data are relatively small, as illustrated in Figure 5, indicating that it is highly analytically accurate (Sun, Q. et al., 2024). Consequently, we affirm that the model is exceedingly well-suited.
Table 9.
Root mean square of errors values.
| Network | Training | Testing | |||||
|---|---|---|---|---|---|---|---|
| N | SSE | RMSE | N | SSE | RMSE | Total Samples | |
| 1 | 339 | 7.23 | 0.146 | 73 | .640 | 0.094 | 412 |
| 2 | 338 | 5.02 | 0.122 | 74 | 0.695 | 0.097 | 412 |
| 3 | 345 | 5.02 | 0.121 | 57 | 0.344 | 0.078 | 412 |
| 4 | 338 | 7.88 | 0.153 | 74 | 0.175 | 0.049 | 412 |
| 5 | 332 | 7.82 | 0.153 | 80 | 1.41 | 0.133 | 412 |
| 6 | 339 | 5.32 | 0.125 | 73 | 0.312 | 0.065 | 412 |
| 7 | 325 | 6.38 | 0.140 | 87 | 0.362 | 0.065 | 412 |
| 8 | 345 | 7.38 | 0.146 | 57 | 0.479 | 0.092 | 412 |
| 9 | 339 | 7.714 | 0.151 | 73 | 0.152 | 0.046 | 412 |
| 10 | 332 | 6.11 | 0.136 | 80 | 0.545 | 0.083 | 412 |
| Mean | 6.5874 | 0.1393 | 0.5114 | 0.0799 | |||
| SD | 1.1686 | 0.0128 | 0.3640 | 0.0259 | |||
Note: RMSE = Root mean square of errors, SSE = Sum square of errors, and N = sample size, SD=Standard deviation. Source: Author calculation.
In Table 10, we performed a sensitivity analysis to assess the predictive power of each input neuron. This analysis involved determining the normalized importance of these neurons by dividing their relative importance by the maximum importance (Tong et al., 2023). The results are presented as percentages. The findings indicate that digital innovation is the primary predictor, with stakeholder pressure being the second most influential factor, accounting for 80% of the overall significance. The subsequent categories are LCProd (49%), LCProc (41%), LCLog (45%), and motivation (13%). Figure 6 and Figure 7 provide precise data, where the locations of the values indicate whether they are overestimated or underestimated in the Residual by Predicted Value. The alignment with the 45-degree line demonstrates the model’s accuracy in predicting the Observed Value by the Predicted Value.
Table 10.
Sensitivity analysis for ANN Model.
| Neural Network (NN) | Sth | DI | Mot | LCProd | LCProc | LCLog |
|---|---|---|---|---|---|---|
| NN (i) | 1.00 | 0.35 | 0.07 | 0.51 | 0.58 | 0.46 |
| NN (ii) | 0.68 | 1.00 | 0.06 | 0.41 | 0.34 | 0.08 |
| NN (iii) | 0.42 | 1.00 | 0.08 | 0.32 | 0.44 | 0.42 |
| NN (iv) | 0.51 | 1.00 | 0.12 | 0.24 | 0.05 | 0.19 |
| NN (v) | 0.72 | 1.00 | 0.08 | 0.48 | 0.01 | 0.01 |
| NN (vi) | 0.59 | 0.73 | 0.15 | 0.31 | 0.83 | 1.00 |
| NN (vii) | 1.00 | 0.58 | 0.06 | 0.61 | 0.32 | 0.30 |
| NN (viii) | 0.50 | 1.00 | 0.15 | 0.75 | 0.36 | 0.65 |
| NN (ix) | 1.00 | 1.00 | 0.30 | 0.39 | 0.41 | 0.67 |
| NN (x) | 0.49 | 1.00 | 0.03 | 0.18 | 0.23 | 0.11 |
| Average importance | 0.69 | 0.87 | 0.11 | 0.42 | 0.36 | 0.39 |
| Normalized importance (%) | 80% | 100% | 13% | 49% | 41% | 45% |
Source: Author calculation.
5. Discussion
The current research explored the effect of stakeholder engagement and digital innovation on low-carbon operations in Chinese industries, particularly Chinese manufacturing. A hybrid SEM-ANN approach was used to elicit a comprehensive understanding of the phenomenon. The obtained results contain several major points and contribute to the existing body of knowledge. It has become evident that stakeholder pressure obviously affects companies’ motivation to launch low-carbon operations (H1). These findings are consistent with Khamisu et al. (2024); (Kitsis and Chen, 2021) insist that customers, regulators, investors, and other stakeholders are instrumental. Digital innovation is another factor that clearly improves motivation (H2). There is enough evidence that digital innovation may be employed to ensure the fast, efficient and sustainable production of goods (Gao et al., 2023). This study confirms the findings of other studies that stakeholders correlated with LOMP (Alessa et al., 2024; Lopes de Sousa Jabbour et al., 2021). The significant impact of stakeholder pressure on the adoption of low-carbon products, processes, and logistics (H3a, H3b, H3c) underscores the importance of external forces in shaping organizational behavior toward more sustainable practices.
The study found mixed results regarding the impact of motivations on adopting low-carbon operations. While motivations significantly affected the adoption of low-carbon logistics (H4c), they did not significantly impact the adoption of low-carbon processes (H4b). This may be due to the more complicated and resource-consuming characteristics of process changes compared to those of logistic adjustments. Particularly, the acceptance of low-carbon products negatively affected CRP (H5), whereas the acceptance of low-carbon processes and logistics positively affected CRP (H6, H7). As expected, the results suggest that product-related innovations in and of themselves may not readily reduce carbon use. Of course, process improvements and logistics feature better outcomes on CRP. According to these results, it is the case that LOMP, the same as previous research, enhances the CRP of manufacturers or industries (Jiang et al., 2022). It can continue to be asserted that larger corporations or companies are more likely to implement carbon approaches or carbon management practices when they face advantageous external forces.
The results obtained by the researchers provided evidence to assert that digital innovation is related to a profitable LOMP performance in innovation-less-developed industries in China (Sheng et al., 2023). The results of our study also indicated that this factor affected the adoption of low-carbon products, processes, and logistics positively. Specifically, H8a, H8c, and H8b were supported by the developments of the empirical analysis. From these outcomes, it is possible to conclude that the role of digital improvements cannot be underemphasized, and it is necessary to assume that investments in the field of innovation are ultimately critical for achieving low-carbon operations. At the same time, the effects of interactions between stakeholders’ influence and digital innovation in terms of the level of firms’ performance related to carbon reduction were also notable. H9 and H10 were also formulated, and the findings of this research confirmed that this interaction had a significant effect. This implies that a combination of external pressure and internal ability to innovate might significantly empower a firm’s carbon reduction outcomes. In essence, this implies that those firms whose responses to stakeholders’ demands are mediated through the prism of digital improvements are highly likely to achieve superior carbon performances.
5.1. Conclusions
The goal of the study is to reveal the impact of both stakeholder pressure and digital innovation on low-carbon operations in Chinese manufacturing industries. In other words, employing a hybrid SEM-ANN technique, its authors have managed to conclude that both stakeholder pressures and digital innovation have an impact on the tendency of firms to integrate low-carbon operations. More specifically, the greater the pressure on stakeholders, the greater the level of sustainability of operations, and the presence of digital innovations should contribute to more low-carbon products, processes, and logistics.
The synergy of both external and internal influences defines the firms’ carbon reduction performance, showing that a comprehensive strategy is required for sustainability. At the same time, the study also demonstrates that not all of the specific practices used have a positive effect on carbon reduction performance, with product innovations showing lesser results in terms of effects than the improvements suggested for processes and logistics. For managers, the suggestion of this study that the engagement with the stakeholder, digital innovation, a holistic approach, and the regular modifications in practices are likely to produce the better sustainability outcomes provided the stakeholder’s expectations will be also beneficial in their practical implications. While the knowledge of stakeholders’ opinion about the firm’s performance can assist in taking into account societal needs and making strategic decisions to respond to these needs, going beyond the corporate boundaries also requires improvisation of the low-carbon techniques. It also means that the successful firms willing to re-evaluate their strategies for sustainability will observe even more significant reductions in their carbon intensity. At the same time, these suggestions can also be limited by the fact that extreme reliance on the outside opinion and the broad implementation of digital innovation do not guarantee the strategic success for the firm.
5.2. Theoretical Implications
The combination of stakeholder and dynamic capability theory makes several theoretical contributions to the literature on low-carbon operations and sustainability. On the one hand, stakeholder theory focuses on the role of external pressures and stakeholders’ expectations. These stakeholders may include customers, final consumers, investors, intermediaries, competitors, industry associations, regulators, governments, media, researchers, other organizations, etc. In any case, organizations participating in corporate citizenship and various sustainability practices are expected to accept and use them. On the other hand, according to dynamic capability theory, organizational outcomes are determined by a firm’s capabilities and resources.
On the one hand, these capabilities are static. On the other hand, organizations must have a wide range of capabilities, such as complex cooperative routines. After all, capabilities and resources are responsible for the way companies respond to external pressures. As a whole, the results of the synthesis show that these two theories need to be combined. All in all, these two approaches are useful for being able to add the empirical results of the evaluation of different companies that have low-carbon operations.
The integrated model helps elaborate on the ways in which firms respond to stakeholder pressures by leveraging their dynamic capabilities. At a theoretical level, the contribution of the present study highlights the manner in which companies can develop and deploy firm-specific capabilities like digital innovation, operational flexibility, and strategic decision-making and management to address and manage stakeholder demands in the context of sustainability. This aspect is critical for theorizing the reasons for variations in how different firms’ industrial operations can achieve low-carbon status despite facing similar external pressures. For this study, the role of dynamic capabilities is theorized as mediators between stakeholder pressures and low-carbon operations. In this way, the study contributes to the theoretical literature on dynamic capabilities and establishing sustainability. More specifically, it is good to note that dynamic capabilities such as the capability to innovate and adopt digital tools at the workplace are not just direct antecedents of low-carbon practices but also an important mechanism via the stakeholder.
In the mediation role, it is notable that both theories are involved in the external-internal interplay affecting organizational sustainability, and the energy of the external-internal interplay is transformed by general dynamic capabilities as the “rate of conversion” of TCAs into firm-specific know-how through a process-based view of dynamic capabilities. It is not difficult to find the frameworks and principles of perspectives and understandings of firm perspectives, and our study points out valuable references, as demonstrated by using the theories in the contexts of Chinese manufacturing industries. Emerging economies have different stakeholder pressures and dynamic capabilities levels from developed ones. This paper contributes to theory in the more theoretical understanding of the applications of stakeholder and dynamic capabilities theories and important foundations for further research in practice, such as practical application in low-carbon operations practice and other sustainability contexts. Ways to rebuild the theoretical foundations leading to fruitful and practical perspectives are provided.
5.3. Managing and Implementing Policy
The results of this research have several meaningful implications for the managing of manufacturing firms, particularly in the context of the Chinese industry. First, low-carbon operation requires system users to manage the stakeholders, such as customers, regulators, and investors, by interacting effectively with them to understand their comprehensive demands and pressures to operate “sustainability”. Such stakeholder management can enhance the motivation and support to adopt low-carbon practices, thus improving the carbon performance of the organization. Second, low-carbon operation requires manufacturing firms to invest in digital innovation to improve their operations. Manufacturing managers should use digital techniques to realize exact control and operation, thus significantly reducing carbon emissions. For example, the successful operation of the Huawei Langfang Cloud Data Center’s cooling could save around 13,129 tons of carbon emissions annually.
It is necessary for managers to apply a systematic approach to low-carbon operations. Managers should consider the relationship between LOPM and recognize that developed processes and logistics have more benefits in the short term than the creation of low-carbon products. The other important point is developing dynamic capabilities. The managers must improve their ability to develop, integrate, and adapt both internal and external capabilities to address different environmental challenges that may arise in the future. That is why managers should stimulate innovations in the workplace and develop operational flexibility that will be able to respond to different environmental changes in the world.
The other important issue is to gather information about the legislative requirements, and to integrate business strategies with new environmental policies. Such measures may help to meet the complying requirements, and to be able to satisfy the needs of the stakeholders.
It is important for managers to develop long-term sustainability goals, monitor the track continuously, and be willing to change strategies to drive continuous improvement in the carbon performance of the firm. An effective monitoring system is necessary to identify improvement areas and to be able to measure the impact of low-carbon initiatives effectively. By addressing these managerial issues, companies can make low-carbon operations uncomplicated, align their strategies in accordance with stakeholder requirements, and improve general sustainability performance. This way of operation not only helps firms improve their environmental performance but also helps them have more solid ground on which to build their competitive advantages and as well survival in the near future when the entire world will be after firms which are aware of and take an interest in a sustainable future.
5.4. Research Limitations and Future Directions
There are several limitations in this study, although it has made some contributions. First, the sampling of only Chinese manufacturers will probably limit the ratio of the findings of the study to other contexts. In this case, future studies should consider using other regions and sectors. Second, while the findings of the study support the bilateral interrelationships between low-carbon innovations and stakeholder pressures, the new study dedicate to analyzing these relationships should use different and probably more analytical methods to validate the discussed findings. Third, Follow-up studies should focus on examining the long-run effects of low-carbon innovations and pressures applied by stakeholders on firm performance. From this perspective, we recommend that future research analyze the moderating effects of factors such as organizational culture and market conditions. Moreover, new studies may focus on growing criticisms of the role of dynamic capabilities in the processes by which firms work.
References
- Adama, H.E.; Popoola, O.A.; Okeke, C.D.; Akinoso, A.E. Theoretical frameworks supporting IT and business strategy alignment for sustained competitive advantage. International Journal of Management & Entrepreneurship Research 2024, 6(4), 1273–1287. [Google Scholar] [CrossRef]
- Afzal, S.; Shokri, A.; Ziapour, B.M.; Shakibi, H.; Sobhani, B. Building energy consumption prediction and optimization using different neural network-assisted models; comparison of different networks and optimization algorithms. Engineering Applications of Artificial Intelligence 2024, 127, 107356. [Google Scholar] [CrossRef]
- Alessa, N.; Akparep, J.Y.; Sulemana, I.; Agyemang, A.O. Does stakeholder pressure influence firms environmental, social and governance (ESG) disclosure? Evidence from Ghana. Cogent Business & Management 2024, 11(1), 2303790. [Google Scholar] [CrossRef]
- Alwosheel, A.; van Cranenburgh, S.; Chorus, C.G. Is your dataset big enough? Sample size requirements when using artificial neural networks for discrete choice analysis. Journal of choice modelling 2018, 28, 167–182. [Google Scholar] [CrossRef]
- Baratta, A.; Cimino, A.; Longo, F.; Solina, V.; Verteramo, S. The impact of ESG practices in industry with a focus on carbon emissions: Insights and future perspectives. Sustainability 2023, 15(8), 6685. [Google Scholar] [CrossRef]
- Baritto, M.; Oni, A.; Kumar, A. Estimation of life cycle greenhouse gas emissions of asphaltene-based carbon fibers derived from oil sands bitumen. Sustainable Materials and Technologies 2023, 36, e00627. [Google Scholar] [CrossRef]
- Bello-Pintado, A.; Machuca, J.A.; Danese, P. Stakeholder pressures and sustainability practices in manufacturing: Consideration of the economic development context. Business Strategy and the Environment 2023, 32(7), 4084–4102. [Google Scholar] [CrossRef]
- Benitez, J.; Henseler, J.; Castillo, A.; Schuberth, F. How to perform and report an impactful analysis using partial least squares: Guidelines for confirmatory and explanatory IS research. Information & management 2020, 57(2), 103168. [Google Scholar] [CrossRef]
- Betts, T.K.; Wiengarten, F.; Tadisina, S.K. Exploring the impact of stakeholder pressure on environmental management strategies at the plant level: what does industry have to do with it? Journal of Cleaner Production 2015, 92, 282–294. [Google Scholar] [CrossRef]
- Bharadwaj, A.; El Sawy, O.A.; Pavlou, P.A.; Venkatraman, N. Digital business strategy: toward a next generation of insights. MIS quarterly 2013, 471–482. Available online: https://www.jstor.org/stable/43825919.
- Böttcher, C.F.; Müller, M. Drivers, practices and outcomes of low-carbon operations: approaches of German automotive suppliers to cutting carbon emissions. Business Strategy and the Environment 2015, 24(6), 477–498. [Google Scholar] [CrossRef]
- Bukari, A.; Agyemang, A.O.; Bawuah, B. Assessing the moderating role of ESG performance on corporate governance and firm value in developing countries. Cogent Business & Management 2024, 11(1), 2333941. [Google Scholar] [CrossRef]
- Busch, J.; Foxon, T.J.; Taylor, P.G. Designing industrial strategy for a low carbon transformation. Environmental Innovation and Societal Transitions 2018, 29, 114–125. [Google Scholar] [CrossRef]
- Calignano, F.; Mercurio, V. An overview of the impact of additive manufacturing on supply chain, reshoring, and sustainability. Cleaner Logistics and Supply Chain 2023, 7, 100103. [Google Scholar] [CrossRef]
- Camel, A.; Belhadi, A.; Kamble, S.; Tiwari, S.; Touriki, F.E. Integrating smart Green Product Platforming for carbon footprint reduction: The role of blockchain technology and stakeholders influence within the agri-food supply chain. International Journal of Production Economics 2024, 272, 109251. [Google Scholar] [CrossRef]
- Chan, R.Y.; Lai, J.W.; Kim, N. Strategic motives and performance implications of proactive versus reactive environmental strategies in corporate sustainable development. Business Strategy and the Environment 2022, 31(5), 2127–2142. [Google Scholar] [CrossRef]
- Chen, C.; Zheng, L.; Lin, Y.; Guan, C. Can comprehensive environmental regulation trigger green innovation? evidence from the low-carbon city pilot policy and green patents of listed industrial enterprises. Applied Economics Letters 2023, 30(20), 2886–2893. [Google Scholar] [CrossRef]
- Chen, K.; Higgins, P.; Zha, T. Constructing quarterly Chinese time series usable for macroeconomic analysis. Journal of International Money and Finance 2024, 143, 103052. [Google Scholar] [CrossRef]
- Chouhan, S.S.; Kathuria, A.; Sekhar, C.R. The motorcycle rider behaviour questionnaire as a predictor of crashes: A systematic review and meta-analysis. IATSS Research 2023, 47(1), 61–72. [Google Scholar] [CrossRef]
- Crossley, R.M.; Elmagrhi, M.H.; Ntim, C.G. Sustainability and legitimacy theory: The case of sustainable social and environmental practices of small and medium-sized enterprises. Business Strategy and the Environment 2021, 30(8), 3740–3762. [Google Scholar] [CrossRef]
- de Abreu, M.C.S.; Webb, K.; Araújo, F.S.M.; Cavalcante, J.P.L. From “business as usual” to tackling climate change: Exploring factors affecting low-carbon decision-making in the Canadian oil and gas sector. Energy Policy 2021, 148, 111932. [Google Scholar] [CrossRef]
- de Gooyert, V.; Rouwette, E.; van Kranenburg, H.; Freeman, E.; van Breen, H. Cognitive change and consensus forming in facilitated modelling: A comparison of experienced and observed outcomes. European Journal of Operational Research 2022, 299(2), 589–599. [Google Scholar] [CrossRef]
- de Jesus Pacheco, D.A.; Rampasso, I.S.; Michels, G.S.; Ali, S.M.; Hunt, J.D. From linear to circular economy: The role of BS 8001: 2017 for green transition in small business in developing economies. Journal of Cleaner Production 2024, 439, 140787. [Google Scholar] [CrossRef]
- de Sousa Jabbour, A.B.L.; Jabbour, C.J.C.; Choi, T.-M.; Latan, H. ‘Better together’: evidence on the joint adoption of circular economy and industry 4.0 technologies. International Journal of Production Economics 2022, 252, 108581. [Google Scholar] [CrossRef]
- Delgado-Ceballos, J.; Aragón-Correa, J.A.; Ortiz-de-Mandojana, N.; Rueda-Manzanares, A. The effect of internal barriers on the connection between stakeholder integration and proactive environmental strategies. Journal of Business Ethics 2012, 107, 281–293. [Google Scholar] [CrossRef]
- Deng, N.; Gong, Y.; Wang, J. Promoting blockchain technology in low-carbon management to achieve firm performance from a socio-economic perspective: Empirical evidence from China. Journal of Cleaner Production 2024, 448, 141686. [Google Scholar] [CrossRef]
- Eaglen, M. Keeping Up with the Pacing Threat: Unveiling the True Size of Beijing’s Military Spending; American Enterprise Institute, 29 April 2024; Available online: https://www.jstor.org/stable/resrep59476.
- Ekemezie, I.O.; Digitemie, W.N. Climate change mitigation strategies in the oil & gas sector: a review of practices and impact. Engineering Science & Technology Journal 2024, 5(3), 935–948. [Google Scholar] [CrossRef]
- Faul, F.; Erdfelder, E.; Buchner, A.; Lang, A.-G. Statistical power analyses using G* Power 3.1: Tests for correlation and regression analyses. Behavior research methods 2009, 41(4), 1149–1160. [Google Scholar] [CrossRef]
- Felicetti, A.M.; Corvello, V.; Ammirato, S. Digital innovation in entrepreneurial firms: a systematic literature review. Review of Managerial Science 2024, 18(2), 315–362. [Google Scholar] [CrossRef]
- Feng, S.; Zhang, R.; Li, G. Environmental decentralization, digital finance and green technology innovation. Structural Change and Economic Dynamics 2022, 61, 70–83. [Google Scholar] [CrossRef]
- Freeman, R.E. Strategic management: A stakeholder approach; Cambridge university press, 2010. [Google Scholar]
- Furlan Matos Alves, M.W.; Lopes de Sousa Jabbour, A.B.; Kannan, D.; Chiappetta Jabbour, C.J. Contingency theory, climate change, and low-carbon operations management. Supply Chain Management: An International Journal 2017, 22(3), 223–236. [Google Scholar] [CrossRef]
- Gai, P.J.; Puntoni, S. Language and consumer dishonesty: a self-diagnosticity theory. Journal of Consumer Research 2021, 48(2), 333–351. [Google Scholar] [CrossRef]
- Gao, J.; Xu, N.; Zhou, J. Does digital transformation contribute to corporate carbon emissions reduction? Empirical evidence from China. Sustainability 2023, 15(18), 13414. [Google Scholar] [CrossRef]
- Gupta, M.; Jauhar, S.K. Digital innovation: An essence for Industry 4.0. Thunderbird International Business Review 2023, 65(3), 279–292. [Google Scholar] [CrossRef]
- Hassan, M.M.; Hassan, M.M.; Yasmin, F.; Khan, M.A.R.; Zaman, S.; Islam, K.K.; Bairagi, A.K. A comparative assessment of machine learning algorithms with the Least Absolute Shrinkage and Selection Operator for breast cancer detection and prediction. Decision Analytics Journal 2023, 7, 100245. [Google Scholar] [CrossRef]
- Hegab, H.; Shaban, I.; Jamil, M.; Khanna, N. Toward sustainable future: Strategies, indicators, and challenges for implementing sustainable production systems. Sustainable Materials and Technologies 2023, 36, e00617. [Google Scholar] [CrossRef]
- Henseler, J.; Ringle, C.M.; Sarstedt, M. Testing measurement invariance of composites using partial least squares. International marketing review 2016, 33(3), 405–431. [Google Scholar] [CrossRef]
- Herold, D.M.; Farr-Wharton, B.; Lee, K.H.; Groschopf, W. The interaction between institutional and stakeholder pressures: Advancing a framework for categorising carbon disclosure strategies. Business Strategy & Development 2019, 2(2), 77–90. [Google Scholar] [CrossRef]
- Hidayat-ur-Rehman, I.; Alsolamy, M. A SEM-ANN analysis to examine sustainable performance in SMEs: The moderating role of transformational leadership. Journal of Open Innovation: Technology, Market, and Complexity 2023, 9(4), 100166. [Google Scholar] [CrossRef]
- Huang, Z.; Xiao, Z. Dynamic capabilities, environmental management capabilities, stakeholder pressure and eco-innovation of Chinese manufacturing firms: a moderated mediation model. Sustainability 2023, 15(9), 7571. [Google Scholar] [CrossRef]
- Ibrahim, A.; Fernando, Y.; Tseng, M.-L.; Lim, M.K. Low-carbon warehousing practices and challenges: insights from emerging country. International Journal of Logistics Research and Applications 2022, 1–20. [Google Scholar] [CrossRef]
- Iddrisu, S. Sustain or perish: can environmental supply chain strategies predict sustainable performance of manufacturing firms? A third world nation’s perspective. Management of Environmental Quality: An International Journal 2023, 34(1), 99–118. [Google Scholar] [CrossRef]
- Jain, K.K.; Raghuram, J. Gen-AI integration in higher education: Predicting intentions using SEM-ANN approach. In Education and Information Technologies; 2024; pp. 1–41. [Google Scholar] [CrossRef]
- Jiang, Y.; Asante, D.; Zhang, J.; Cao, M. The effects of environmental factors on low-carbon innovation strategy: A study of the executive environmental leadership in China. Journal of Cleaner Production 2020, 266, 121998. [Google Scholar] [CrossRef]
- Jiang, Y.; Hu, Y.; Asante, D.; Ampaw, E.M.; Asante, B. The Effects of Executives’ low-carbon cognition on corporate low-carbon performance: A study of managerial discretion in China. Journal of Cleaner Production 2022, 357, 132015. [Google Scholar] [CrossRef]
- Khamisu, M.S.; Paluri, R.A.; Sonwaney, V. Environmental social and governance (ESG) disclosure motives for environmentally sensitive industry: an emerging economy perspective. Cogent Business & Management 2024, 11(1), 2322027. [Google Scholar] [CrossRef]
- Kitsis, A.M.; Chen, I.J. Do stakeholder pressures influence green supply chain Practices? Exploring the mediating role of top management commitment. Journal of Cleaner Production 2021, 316, 128258. [Google Scholar] [CrossRef]
- Kong, L.; Wang, L.; Li, F.; Li, J.; Wang, Y.; Cai, Z.; Zhou, J.; Guo, J.; Wang, G. Life cycle-oriented low-carbon product design based on the constraint satisfaction problem. Energy Conversion and Management 2023, 286, 117069. [Google Scholar] [CrossRef]
- Latan, H. PLS path modeling in hospitality and tourism research: The golden age and days of future past. In Applying partial least squares in tourism and hospitality research; 2018; pp. 53–83. [Google Scholar] [CrossRef]
- Lee, D.-H.; Kim, Y.-T.; Lee, S.-R. Shallow landslide susceptibility models based on artificial neural networks considering the factor selection method and various non-linear activation functions. Remote Sensing 2020, 12(7), 1194. [Google Scholar] [CrossRef]
- Li, B.; Yang, X.; Wang, Y.; Rady, A.; Zhang, Y. Intrinsic relationship of outdoor activities between climate change and coastal management: Fresh evidence from the spatial analysis of China. Environmental Research 2024, 244, 117961. [Google Scholar] [CrossRef]
- Li, F.; Zhang, Y. Simulation of Development Strategies and Evaluation of Low-Carbon Development Level in Jiangsu Province under Carbon Peaking and Carbon Neutrality Goals. Sustainability 2024, 16(4), 1597. [Google Scholar] [CrossRef]
- Li, G.; Deng, H.; Yang, H. Traffic flow prediction model based on improved variational mode decomposition and error correction. Alexandria Engineering Journal 2023, 76, 361–389. [Google Scholar] [CrossRef]
- Li, J.; Gao, J.; Liao, M. Operating risk of enterprises when adopting environmental regulation: Evidence from environmental protection law in China. Economic Analysis and Policy 2024, 81, 901–914. [Google Scholar] [CrossRef]
- Li, M.; Luan, J.; Li, X.; Jia, P. An Analysis of the Impact of Government Subsidies on Emission Reduction Technology Investment Strategies in Low-Carbon Port Operations. Systems 2024, 12(4), 134. [Google Scholar] [CrossRef]
- Lin, Y.; Deng, F. Psychological effect of confucianism on online self-disclosure among Chinese university students: the mediating role of life satisfaction. In Current Psychology; 2024; pp. 1–8. [Google Scholar] [CrossRef]
- Liu, S.; Tian, X.; Cai, W.; Chen, W.; Wang, Y. How the transitions in iron and steel and construction material industries impact China’s CO2 emissions: Comprehensive analysis from an inter-sector linked perspective. Applied energy 2018, 211, 64–75. [Google Scholar] [CrossRef]
- Liu, Y. Barriers to the adoption of low carbon production: A multiple-case study of Chinese industrial firms. Energy Policy 2014, 67, 412–421. [Google Scholar] [CrossRef]
- Lopes de Sousa Jabbour, A.B.; Chiappetta Jabbour, C.J.; Sarkis, J.; Latan, H.; Roubaud, D.; Godinho Filho, M.; Queiroz, M. Fostering low-carbon production and logistics systems: framework and empirical evidence. International Journal of Production Research 2021, 59(23), 7106–7125. [Google Scholar] [CrossRef]
- Lv, C.; Shao, C.; Lee, C.-C. Green technology innovation and financial development: do environmental regulation and innovation output matter? Energy Economics 2021, 98, 105237. [Google Scholar] [CrossRef]
- Noonan, R.; Wold, H. Partial least squares path analysis; Educational Research, Methodology and Measurement: An International Handbook, 1988; pp. 710–716. [Google Scholar]
- Nwankpa, J.K.; Roumani, Y.; Datta, P. Process innovation in the digital age of business: the role of digital business intensity and knowledge management. Journal of Knowledge Management 2022, 26(5), 1319–1341. [Google Scholar] [CrossRef]
- Oloruntobi, O.; Chuah, L.F.; Mokhtar, K.; Gohari, A.; Rady, A.; Abo-Eleneen, R.E.; Akhtar, M.S.; Mubashir, M. Decarbonising ASEAN coastal shipping: Addressing climate change and coastal ecosystem issues through sustainable carbon neutrality strategies. Environmental research 2024, 240, 117353. [Google Scholar] [CrossRef]
- Onjewu, A.-K.E.; Jafari-Sadeghi, V.; Kock, N.; Haddoud, M.Y.; Sakka, G. The catalyzing role of customer pressure on environmental initiatives and export intensity: A study of family firms. Journal of Business Research 2023, 166, 114134. [Google Scholar] [CrossRef]
- Orazalin, N.S.; Ntim, C.G.; Malagila, J.K. Board sustainability committees, climate change initiatives, carbon performance, and market value. British Journal of Management 2024, 35(1), 295–320. [Google Scholar] [CrossRef]
- Otache, I. Innovation capability, strategic flexibility and SME performance: the roles of competitive advantage and competitive intensity. African Journal of Economic and Management Studies 2024. [Google Scholar] [CrossRef]
- Pålsson, H.; Kovács, G. Reducing transportation emissions: A reaction to stakeholder pressure or a strategy to increase competitive advantage. International Journal of Physical Distribution & Logistics Management 2014, 44(4), 283–304. [Google Scholar] [CrossRef]
- Patruni, K.; Rao, P.S. Viscoelastic behaviour, sensitivity analysis and process optimization of aloe Vera/HM pectin mix gels: An investigation using RSM and ANN and its application to food gel formulation. LWT 2023, 176, 114564. [Google Scholar] [CrossRef]
- Paul, J.; Ueno, A.; Dennis, C.; Alamanos, E.; Curtis, L.; Foroudi, P.; Kacprzak, A.; Kunz, W.H.; Liu, J.; Marvi, R. Digital transformation: A multidisciplinary perspective and future research agenda. International Journal of Consumer Studies 2024, 48(2), e13015. [Google Scholar] [CrossRef]
- Qiu, L.; Jie, X.; Wang, Y.; Zhao, M. Green product innovation, green dynamic capability, and competitive advantage: Evidence from Chinese manufacturing enterprises. Corporate Social Responsibility and Environmental Management 2020, 27(1), 146–165. [Google Scholar] [CrossRef]
- Raihan, A.; Ibrahim, S.; Muhtasim, D.A. Dynamic impacts of economic growth, energy use, tourism, and agricultural productivity on carbon dioxide emissions in Egypt. World development sustainability 2023, 2, 100059. [Google Scholar] [CrossRef]
- Ramli, N.A.; Latan, H.; Nartea, G.V. Why should PLS-SEM be used rather than regression? Evidence from the capital structure perspective; Partial least squares structural equation modeling: Recent advances in banking and finance, 2018; pp. 171–209. [Google Scholar] [CrossRef]
- Rehman, I.U.; Shahzad, F.; Hanif, M.A.; Arshad, A.; Sergi, B.S. Financial constraints and carbon emissions: an empirical investigation. Social Responsibility Journal 2024, 20(4), 761–782. [Google Scholar] [CrossRef]
- Roy, S.K.; Singh, G.; Sadeque, S.; Gruner, R.L. Customer experience quality with social robots: Does trust matter? Technological Forecasting and Social Change 2024, 198, 123032. [Google Scholar] [CrossRef]
- Sarstedt, M.; Ringle, C.M.; Hair, J.F. Partial least squares structural equation modeling. In Handbook of market research; Springer, 2021; pp. 587–632. [Google Scholar]
- Savage, G.T.; Nix, T.W.; Whitehead, C.J.; Blair, J.D. Strategies for assessing and managing organizational stakeholders. Academy of management perspectives 1991, 5(2), 61–75. [Google Scholar] [CrossRef]
- Sheng, H.; Feng, T.; Liu, L. The influence of digital transformation on low-carbon operations management practices and performance: does CEO ambivalence matter? International Journal of Production Research 2023, 61(18), 6215–6229. [Google Scholar] [CrossRef]
- Sikiru, S.; Oladosu, T.L.; Amosa, T.I.; Olutoki, J.O.; Ansari, M.; Abioye, K.J.; Rehman, Z.U.; Soleimani, H. Hydrogen-powered horizons: Transformative technologies in clean energy generation, distribution, and storage for sustainable innovation. International Journal of Hydrogen Energy 2024, 56, 1152–1182. [Google Scholar] [CrossRef]
- Silik, A.; Noori, M.; Ghiasi, R.; Wang, T.; Kuok, S.-C.; Farhan, N.S.; Dang, J.; Wu, Z.; Altabey, W.A. Dynamic wavelet neural network model for damage features extraction and patterns recognition. Journal of Civil Structural Health Monitoring 2023, 13(4), 925–945. [Google Scholar] [CrossRef]
- Singh, S.K.; Del Giudice, M.; Chiappetta Jabbour, C.J.; Latan, H.; Sohal, A.S. Stakeholder pressure, green innovation, and performance in small and medium-sized enterprises: The role of green dynamic capabilities. Business Strategy and the Environment 2022, 31(1), 500–514. [Google Scholar] [CrossRef]
- Skare, M.; de Obesso, M.d.l.M.; Ribeiro-Navarrete, S. Digital transformation and European small and medium enterprises (SMEs): A comparative study using digital economy and society index data. International Journal of Information Management 2023, 68, 102594. [Google Scholar] [CrossRef]
- Söderholm, P. The green economy transition: the challenges of technological change for sustainability. Sustainable Earth 2020, 3(1), 6. [Google Scholar] [CrossRef]
- Song, H.; Zhao, C.; Zeng, J. Can environmental management improve financial performance: An empirical study of A-shares listed companies in China. Journal of cleaner production 2017, 141, 1051–1056. [Google Scholar] [CrossRef]
- Stefanelli, N.O.; Chiappetta Jabbour, C.J.; Liboni Amui, L.B.; Caldeira de Oliveira, J.H.; Latan, H.; Paille, P.; Hingley, M. Unleashing proactive low-carbon strategies through behavioral factors in biodiversity-intensive sustainable supply chains: Mixed methodology. Business Strategy and the Environment 2021, 30(5), 2535–2555. [Google Scholar] [CrossRef]
- Strøm-Andersen, N. Incumbents in the transition towards the bioeconomy: The role of dynamic capabilities and innovation strategies. Sustainability 2019, 11(18), 5044. [Google Scholar] [CrossRef]
- Su, J.; Shen, T.; Ma, W.-C.; Zhang, J.-X. Study on the Effect of Rural Low Carbon Logistics Industry Development on Rural Economic Growth. IEEE Access 2023. [Google Scholar] [CrossRef]
- Suhail, F.; Adel, M.; Al-Emran, M.; AlQudah, A.A. Are students ready for robots in higher education? Examining the adoption of robots by integrating UTAUT2 and TTF using a hybrid SEM-ANN approach. Technology in Society 2024, 77, 102524. [Google Scholar] [CrossRef]
- Sun, Q.; Ji, D.; Letu, H.; Ni, X.; Zhang, H.; Wang, Y.; Li, B.; Shi, J. A method for estimating high spatial resolution total precipitable water in all-weather condition by fusing satellite near-infrared and microwave observations. Remote Sensing of Environment 2024, 302, 113952. [Google Scholar] [CrossRef]
- Sun, W.; Shao, M.; Yang, D. Role of essential minerals in achieving low-carbon economy and sustainability. Resources Policy 2024, 90, 104716. [Google Scholar] [CrossRef]
- Surucu-Balci, E.; Iris, Ç.; Balci, G. Digital information in maritime supply chains with blockchain and cloud platforms: Supply chain capabilities, barriers, and research opportunities. Technological Forecasting and Social Change 2024, 198, 122978. [Google Scholar] [CrossRef]
- Tan, L.; Yang, Z.; Irfan, M.; Ding, C.J.; Hu, M.; Hu, J. Toward low-carbon sustainable development: Exploring the impact of digital economy development and industrial restructuring. Business Strategy and the Environment 2024, 33(3), 2159–2172. [Google Scholar] [CrossRef]
- Tong, Y.; Shu, M.; Li, M.; Liu, Y.; Tao, R.; Zhou, C.; Zhao, Y.; Zhao, G.; Li, Y.; Dong, Y. A neural network-based production process modeling and variable importance analysis approach in corn to sugar factory. Frontiers of Chemical Science and Engineering 2023, 17(3), 358–371. [Google Scholar] [CrossRef]
- Usakli, A.; Rasoolimanesh, S.M. Which SEM to use and what to report? A comparison of CB-SEM and PLS-SEM, Cutting edge research methods in hospitality and tourism; Emerald Publishing Limited, 2023; pp. 5–28. [Google Scholar] [CrossRef]
- Vázquez-Brust, D.; Jabbour, C.J.C.; Plaza-Úbeda, J.A.; Perez-Valls, M.; de Sousa Jabbour, A.B.L.; Renwick, D.W. The role of green human resource management in the translation of greening pressures into environmental protection practices. Business Strategy and the Environment 2023, 32(6), 3628–3648. [Google Scholar] [CrossRef]
- Vogt, W.; Williams, M. The SAGE handbook of innovation in social research methods. In The SAGE Handbook of Innovation in Social Research Methods; 2011; pp. 1–664. [Google Scholar] [CrossRef]
- Wang, J.; Cheng, S.; Guo, X.; Xu, X.; Wang, Z. An evolutionary analysis of the diffusion of low-carbon technology innovation in supply networks. Research in International Business and Finance 2024, 102400. [Google Scholar] [CrossRef]
- Wang, L.; Li, W.; Qi, L. Stakeholder pressures and corporate environmental strategies: A meta-analysis. Sustainability 2020, 12(3), 1172. [Google Scholar] [CrossRef]
- Wang, Y.; Qamruzzaman, M.; Kor, S. Greening the future: harnessing ICT, innovation, eco-taxes, and clean energy for sustainable ecology—insights from dynamic seemingly unrelated regression, continuously updated fully modified, and continuously updated bias-corrected models. Sustainability 2023, 15(23), 16417. [Google Scholar] [CrossRef]
- Wanke, P.F.; Jabbour, C.J.C.; Antunes, J.J.M.; de Sousa Jabbour, A.B.L.; Roubaud, D.; Sobreiro, V.A.; Gonzalez, E.D.S. An original information entropy-based quantitative evaluation model for low-carbon operations in an emerging market. International Journal of Production Economics 2021, 234, 108061. [Google Scholar] [CrossRef]
- Weiss, J.F.; Anisimova, T. The innovation and performance effects of well-designed environmental regulation: evidence from Sweden. Industry and Innovation 2019, 26(5), 534–567. [Google Scholar] [CrossRef]
- Wild, P. Recommendations for a future global CO2-calculation standard for transport and logistics. Transportation Research Part D: Transport and Environment 2021, 100, 103024. [Google Scholar] [CrossRef]
- Wiredu, J.; Yang, Q.; Sampene, A.K.; Gyamfi, B.A.; Asongu, S.A. The effect of green supply chain management practices on corporate environmental performance: Does supply chain competitive advantage matter? Business Strategy and the Environment 2024, 33(3), 2578–2599. [Google Scholar] [CrossRef]
- Xia-Bauer, C.; Gokarakonda, S.; Guo, S.; Filippidou, F.; Thomas, S.; Maheshwari, J.R.; Vishwanathan, S.S. Comparative analysis of residential building decarbonization policies in major economies: insights from the EU, China, and India. Energy Efficiency 2024, 17(5), 46. [Google Scholar] [CrossRef]
- Xu, B. Environmental regulations, technological innovation, and low carbon transformation: A case of the logistics industry in China. Journal of Cleaner Production 2024, 439, 140710. [Google Scholar] [CrossRef]
- Yaman, C. A Review on the Process of Greenhouse Gas Inventory Preparation and Proposed Mitigation Measures for Reducing Carbon Footprint. Gases 2024, 4(1), 18–40. [Google Scholar] [CrossRef]
- Yan, J.; Zhou, H.; Mu, J.; Zhang, Y.; Rahman, A. The synergistic effect of carbon performance and technological innovation on corporate financial performance. Frontiers in Psychology 2022, 13, 1060042. [Google Scholar] [CrossRef]
- Yuan, Y.; Tan, H.; Liu, L. The effects of digital transformation on supply chain resilience: A moderated and mediated model. Journal of Enterprise Information Management 2024, 37(2), 488–510. [Google Scholar] [CrossRef]
- Yunita, T.; Sasmoko, S.; Bandur, A.; Alamsjah, F. Organizational ambidexterity: The role of technological capacity and dynamic capabilities in the face of environmental dynamism. Heliyon 2023, 9(4). [Google Scholar] [CrossRef]
- Zhang, J.; Lyu, Y.; Li, Y.; Geng, Y. Digital economy: An innovation driving factor for low-carbon development. Environmental Impact Assessment Review 2022, 96, 106821. [Google Scholar] [CrossRef]
- Zhang, M.; Zhao, X.; Lyles, M.A.; Guo, H. Absorptive capacity and mass customization capability. International Journal of Operations & Production Management 2015, 35(9), 1275–1294. [Google Scholar] [CrossRef]
- Zhang, S.; Wang, X.; Xu, J.; Chen, Q.; Peng, M.; Hao, J. Green manufacturing for achieving carbon neutrality goal requires innovative technologies: A bibliometric analysis from 1991 to 2022. Journal of Environmental Sciences 2024, 140, 255–269. [Google Scholar] [CrossRef]
- Zhang, W.; Xu, N.; Li, C.; Cui, X.; Zhang, H.; Chen, W. Impact of digital input on enterprise green productivity: Micro evidence from the Chinese manufacturing industry. Journal of Cleaner Production 2023, 414, 137272. [Google Scholar] [CrossRef]
- Zhang, X.; Jiao, K.; Zhang, J.; Guo, Z. A review on low carbon emissions projects of steel industry in the World. Journal of cleaner production 2021, 306, 127259. [Google Scholar] [CrossRef]
- Zhao, F.; Liu, X.; Zhang, H.; Liu, Z. Automobile industry under China’s carbon peaking and carbon neutrality goals: challenges, opportunities, and coping strategies. Journal of Advanced Transportation 2022, 1–13. [Google Scholar] [CrossRef]
- Zhao, Y.; Shang, J.; Yang, X.; Shi, G. The road to sustainable development: exploring the impact of green technology innovation and environmental regulation on the green competitiveness of heavily polluting manufacturing industries. Journal of Environmental Planning and Management 2024, 1–28. [Google Scholar] [CrossRef]
- Zheng, Y.; Luo, M. Enhancing Operating Efficiency in China’s High-End Equipment Manufacturing Industry: Insights from Listed Enterprises. Sustainability 2023, 15(11), 8694. [Google Scholar] [CrossRef]
- Zhou, D.; Lu, Z.; Qiu, Y. Do carbon emission trading schemes enhance enterprise green innovation efficiency? Evidence from China’s listed firms. Journal of Cleaner Production 2023, 414, 137668. [Google Scholar] [CrossRef]
Figure 1.
Conceptual Model.
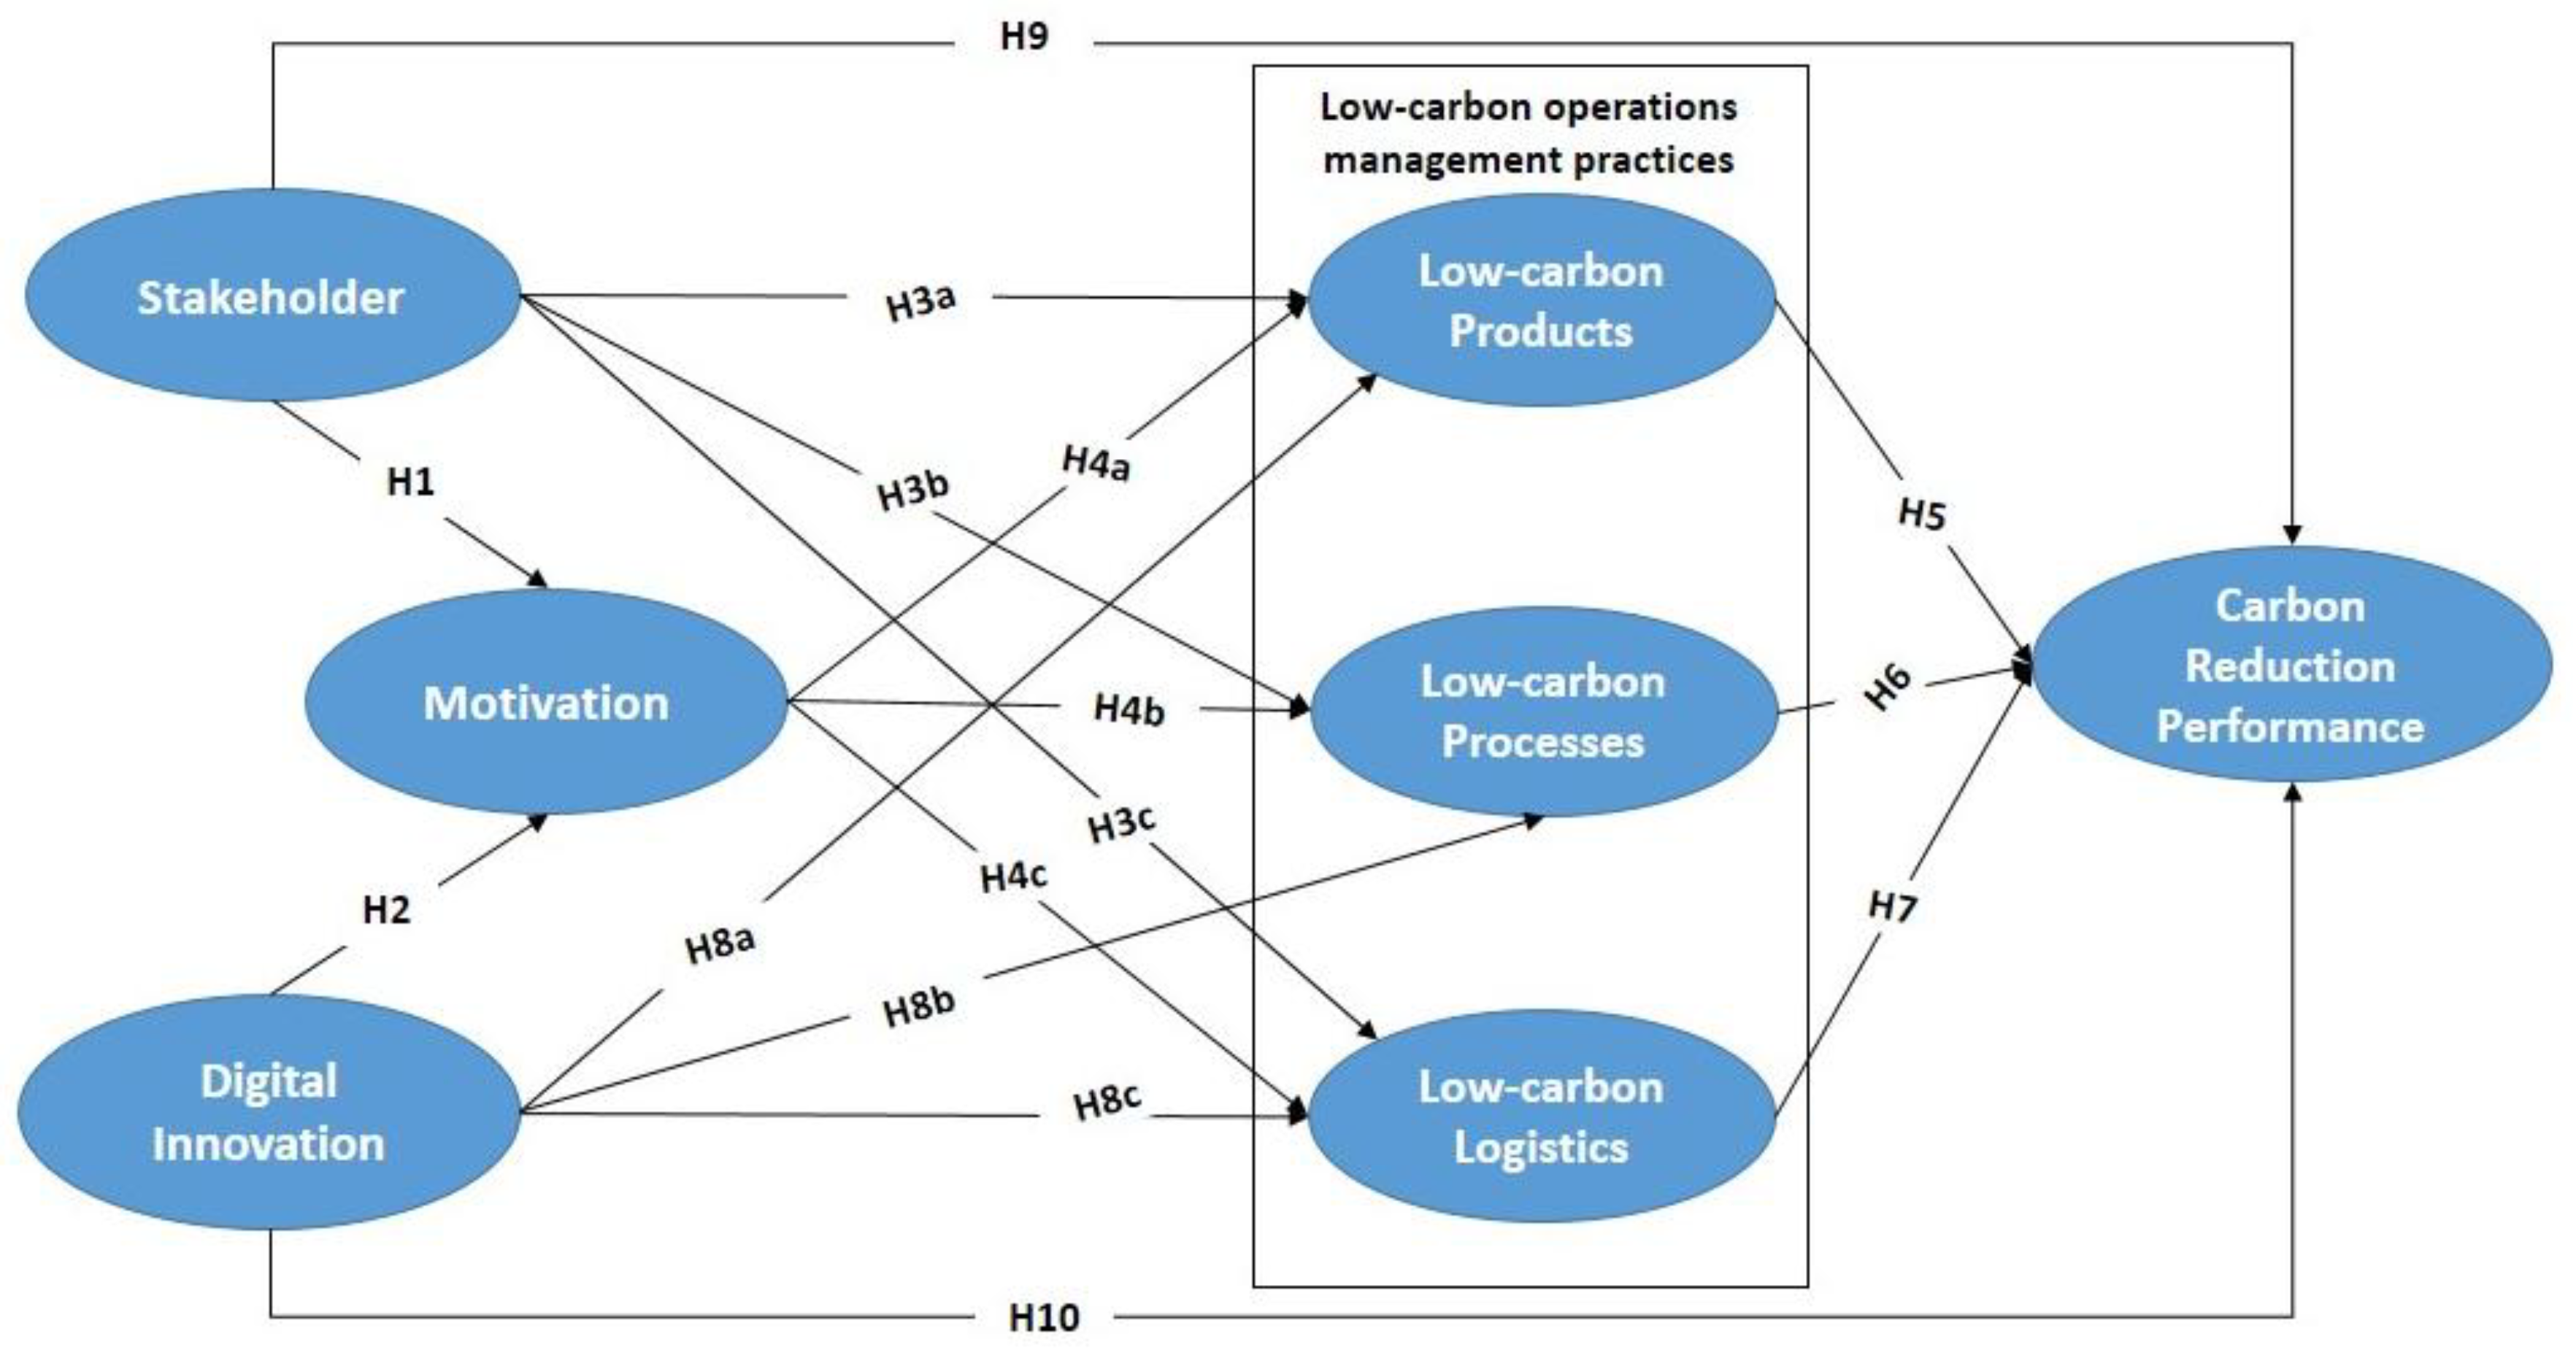
Figure 2.
Research methodology sequence diagram.
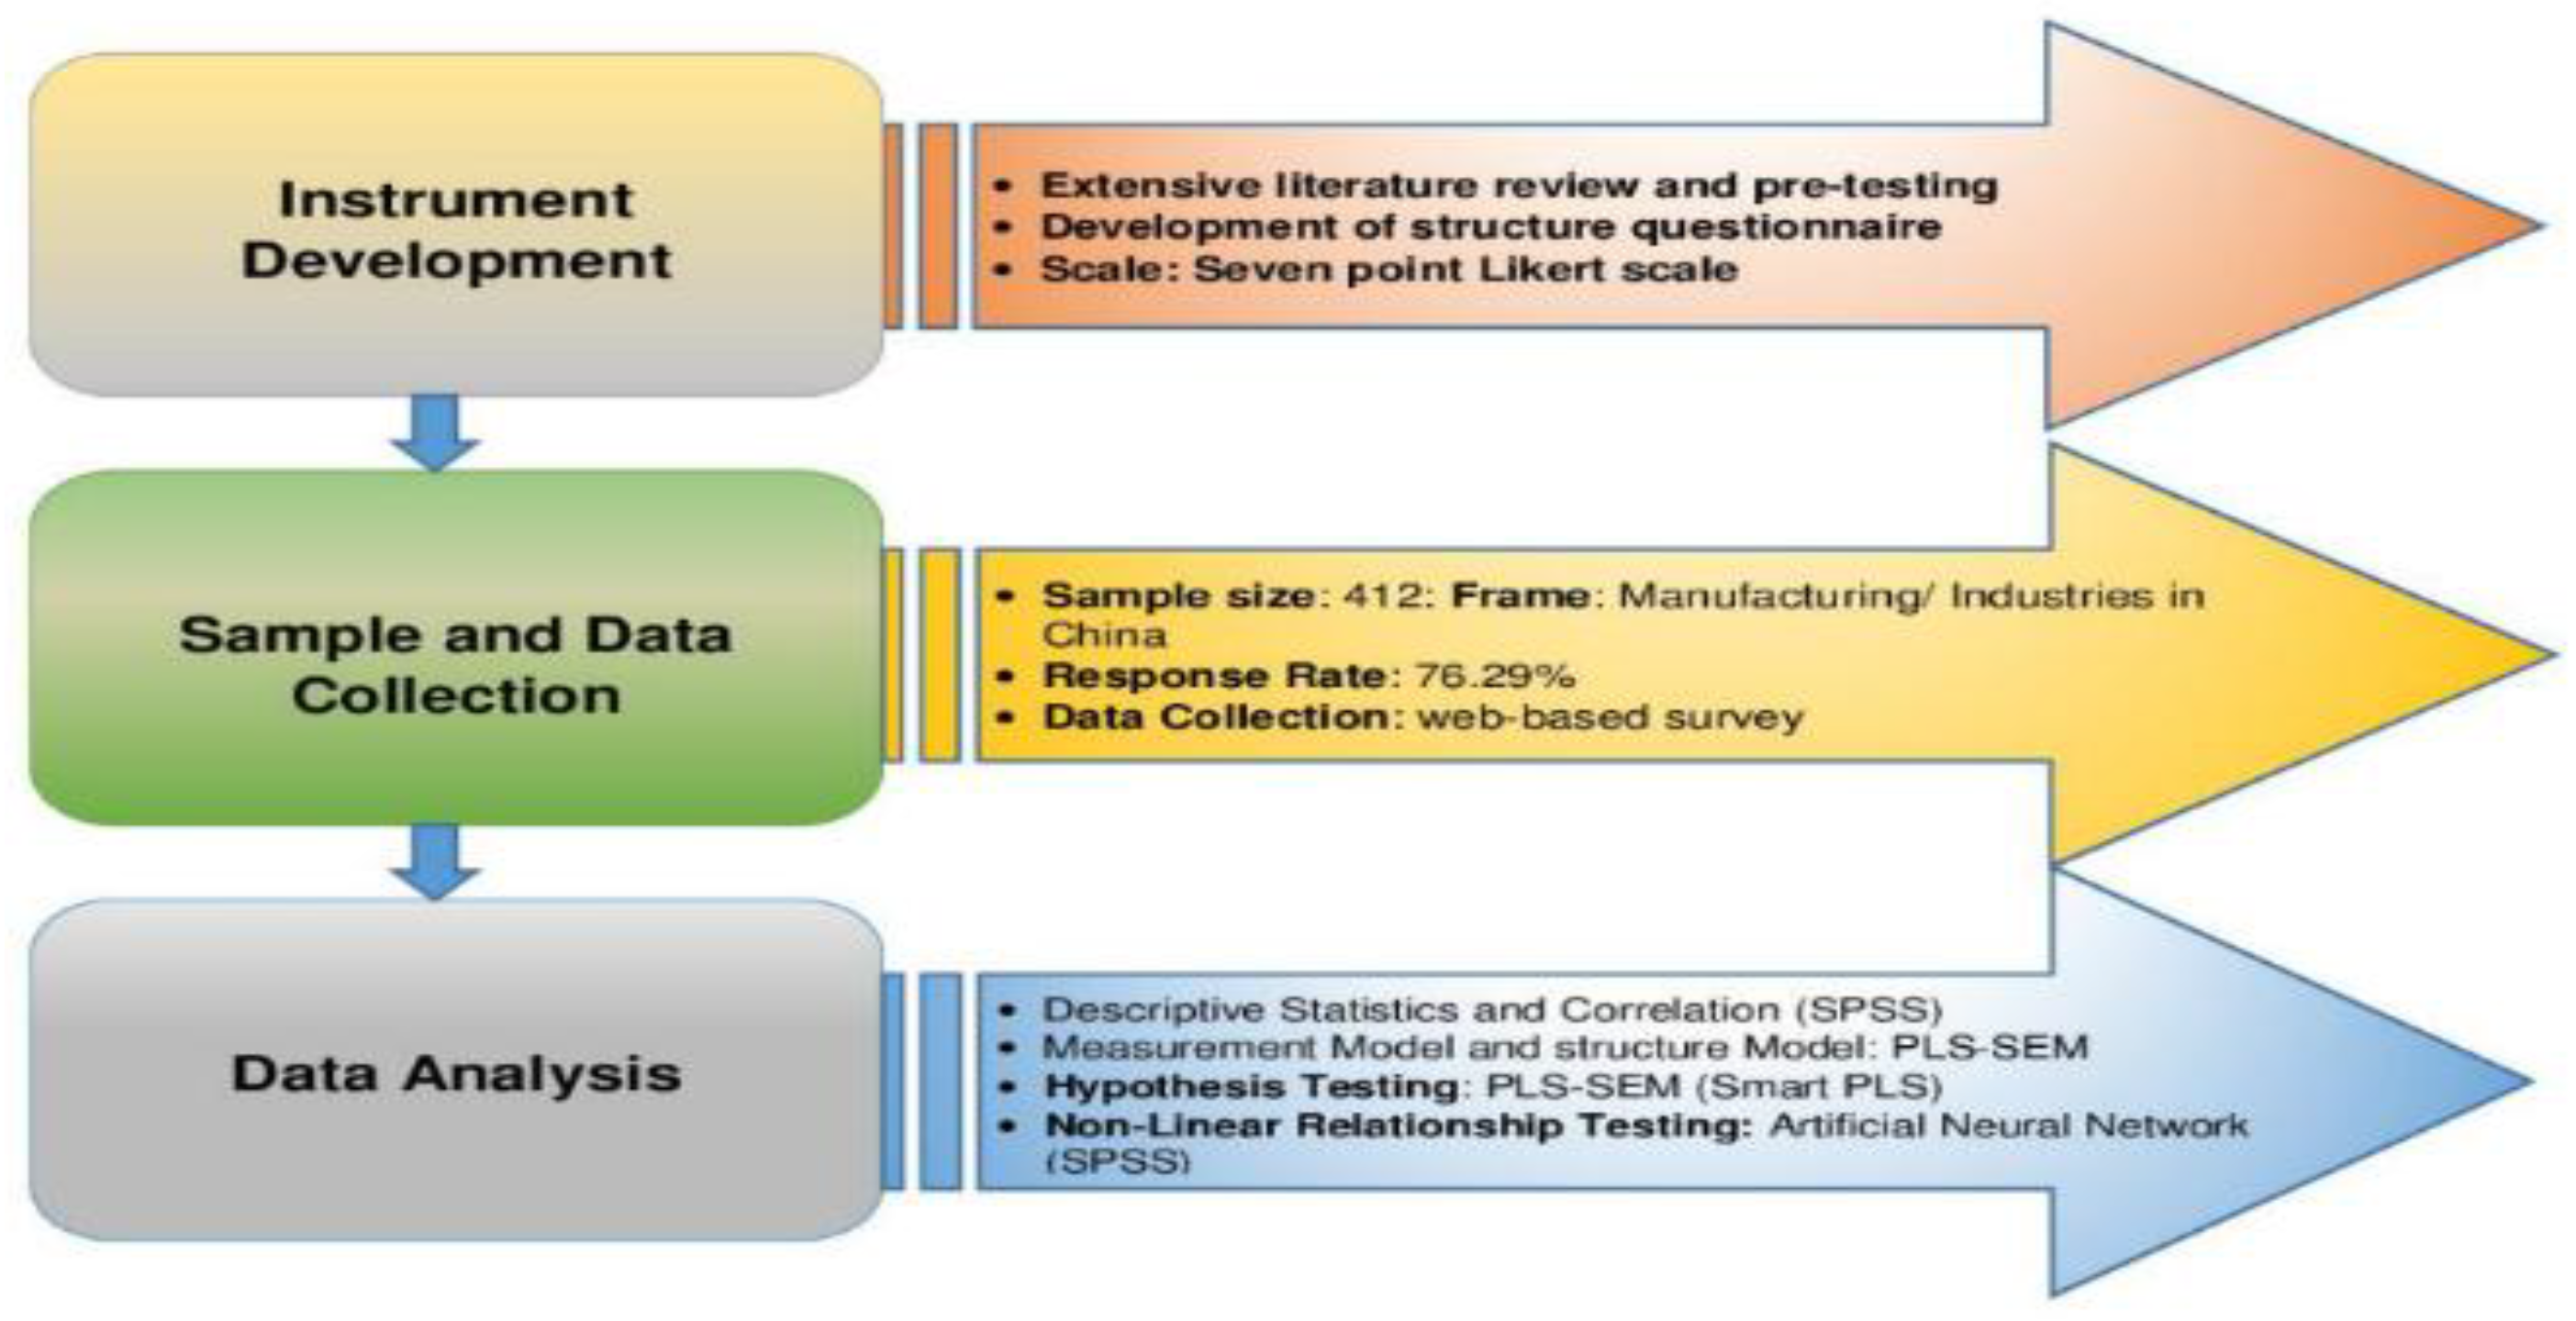
Figure 3.
Structural Model.
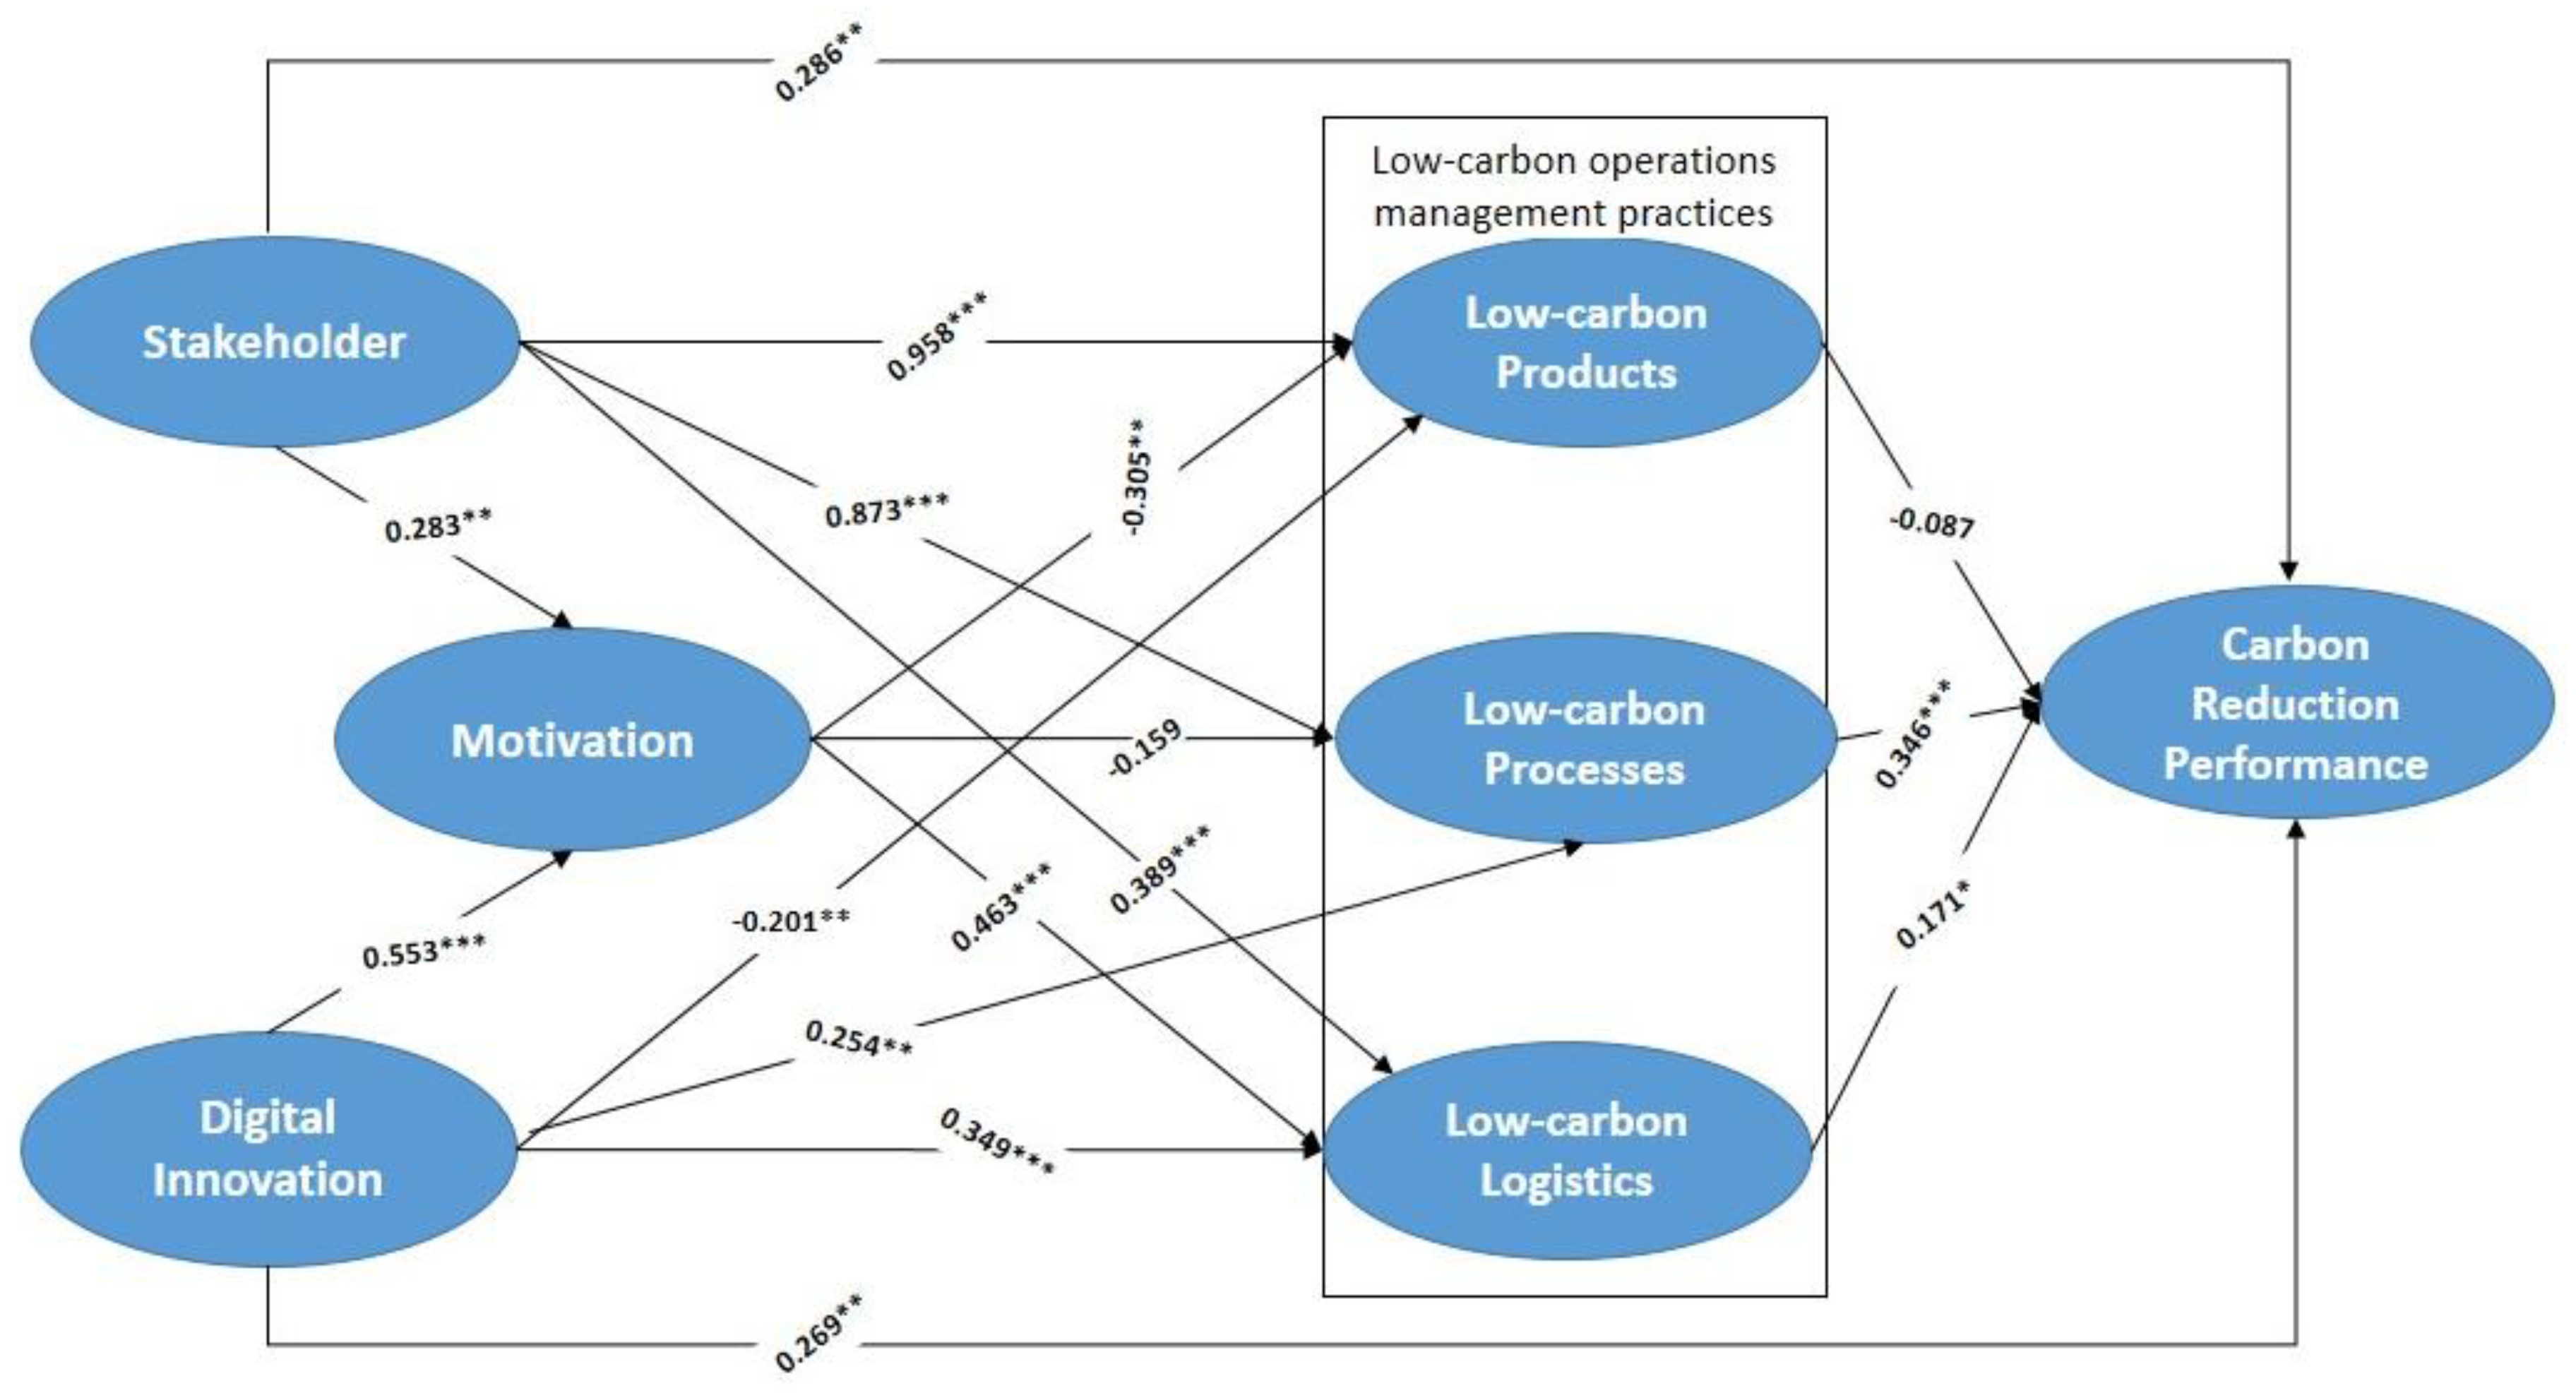
Figure 4.
Artificial neural network model.
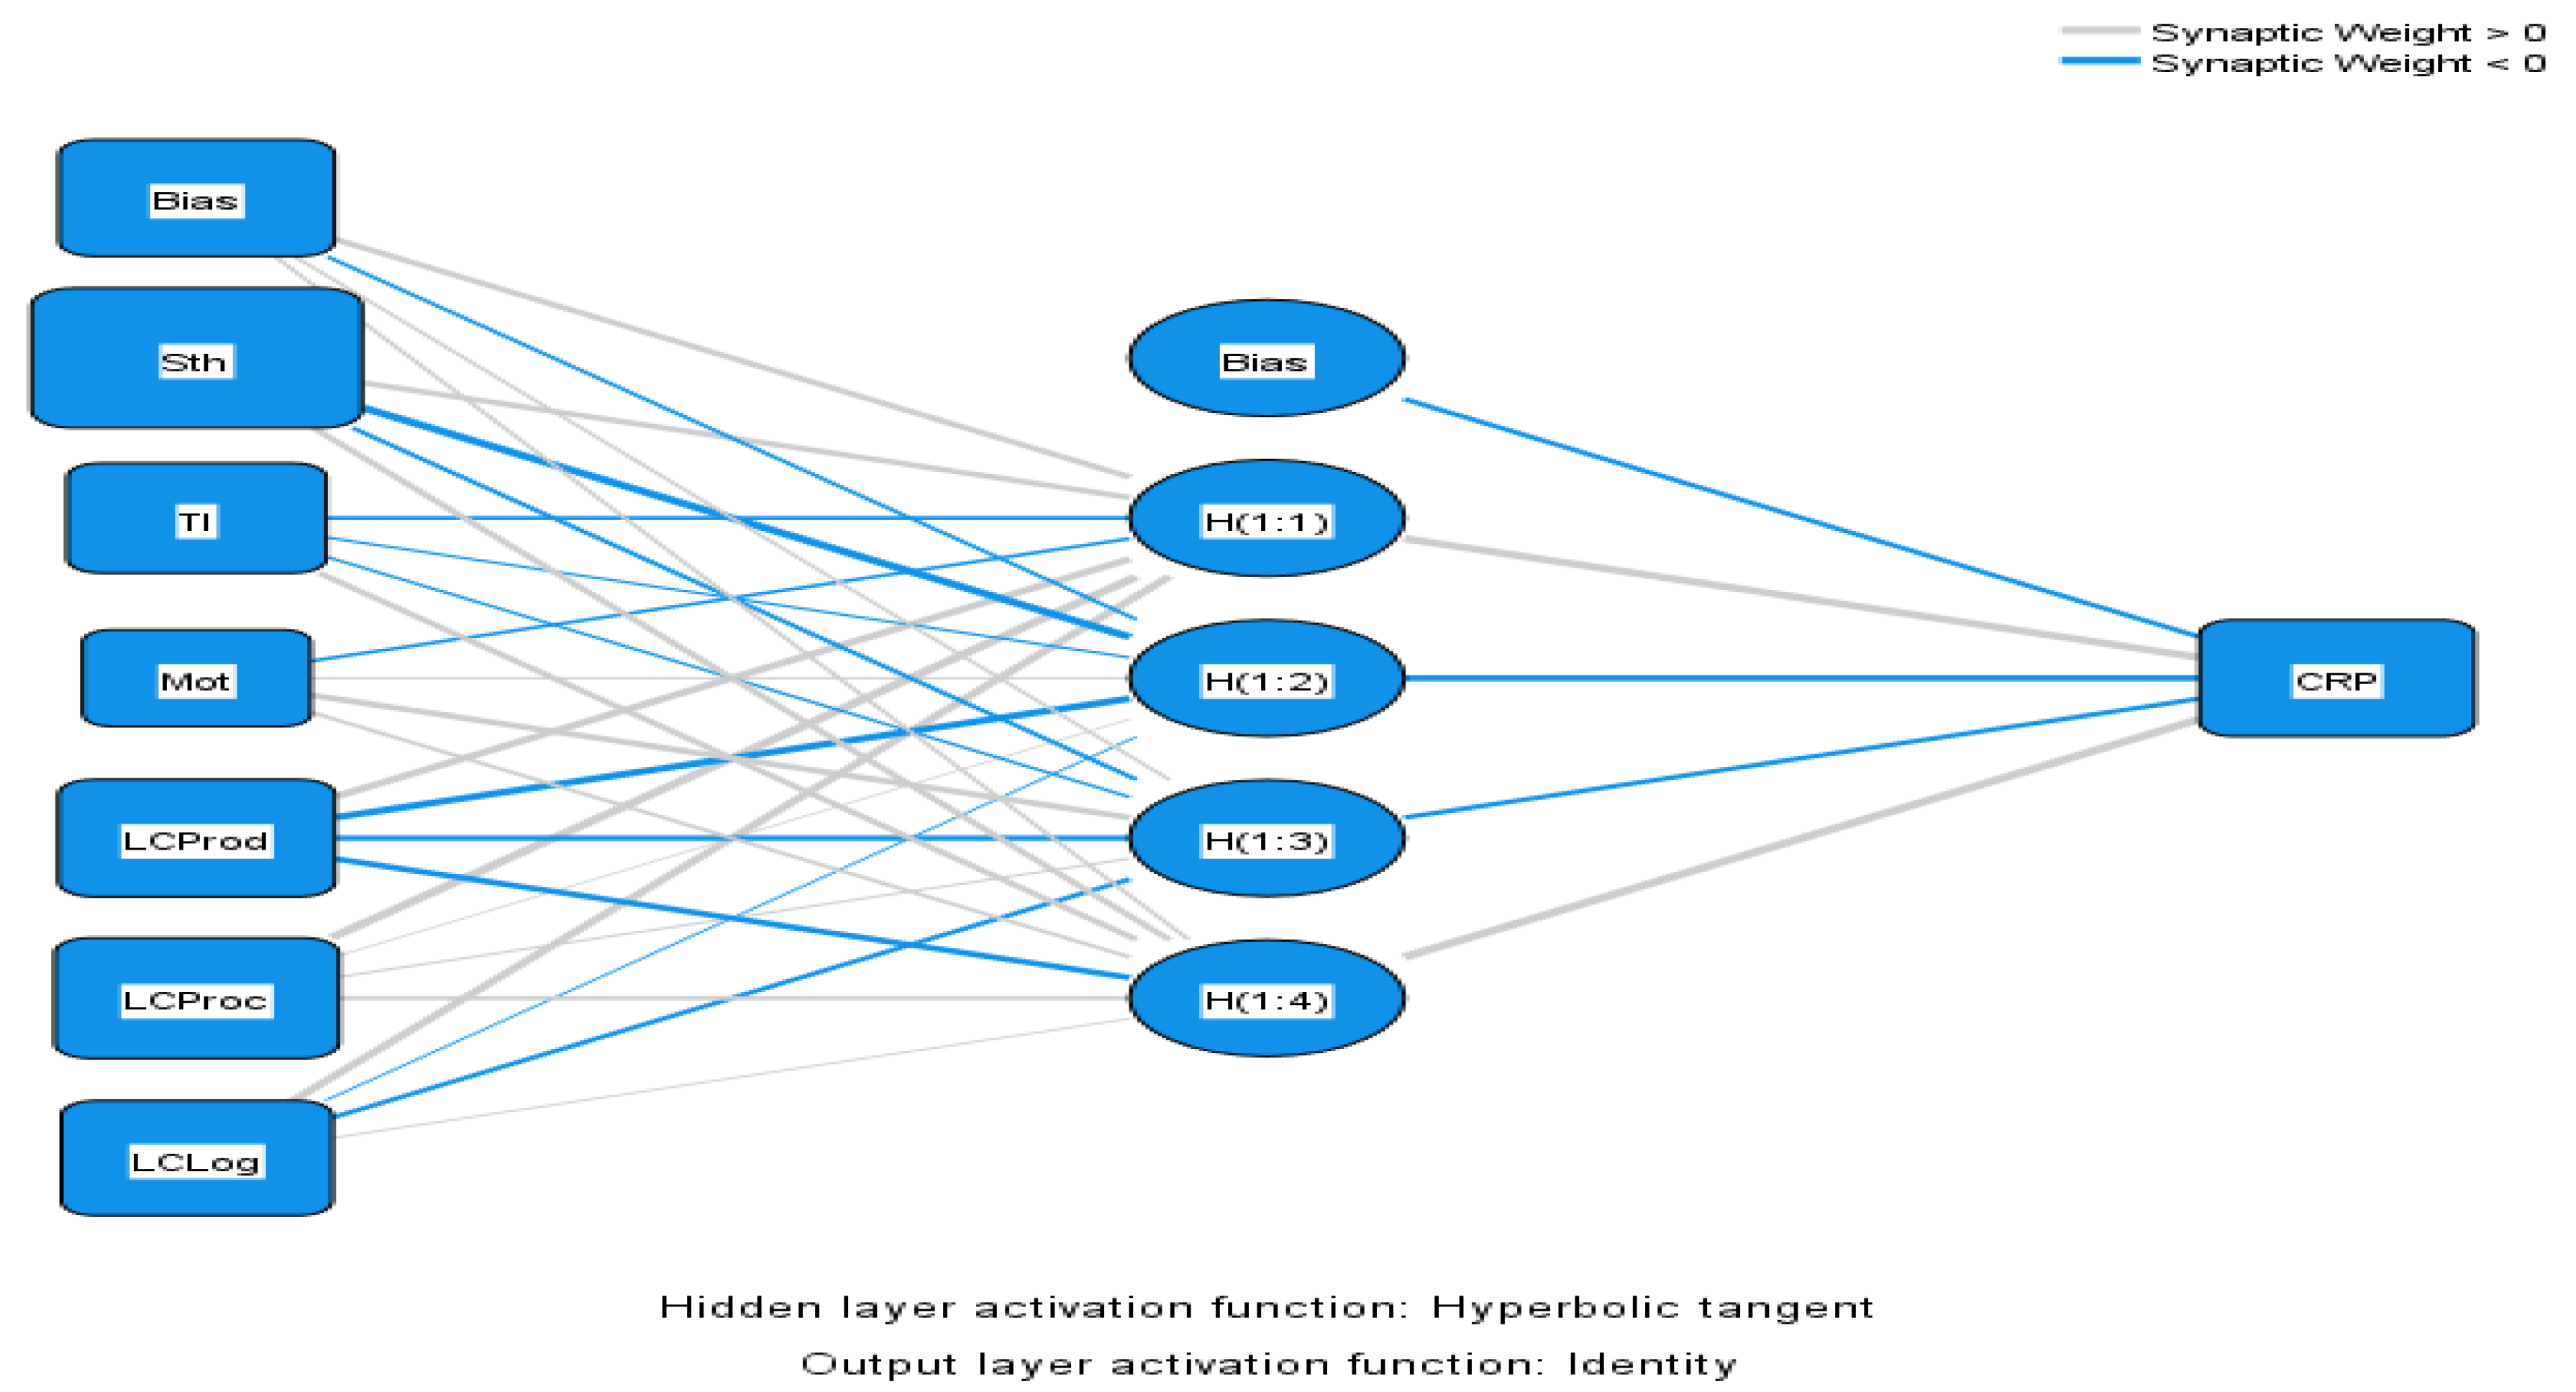
Figure 5.
RMSE values.
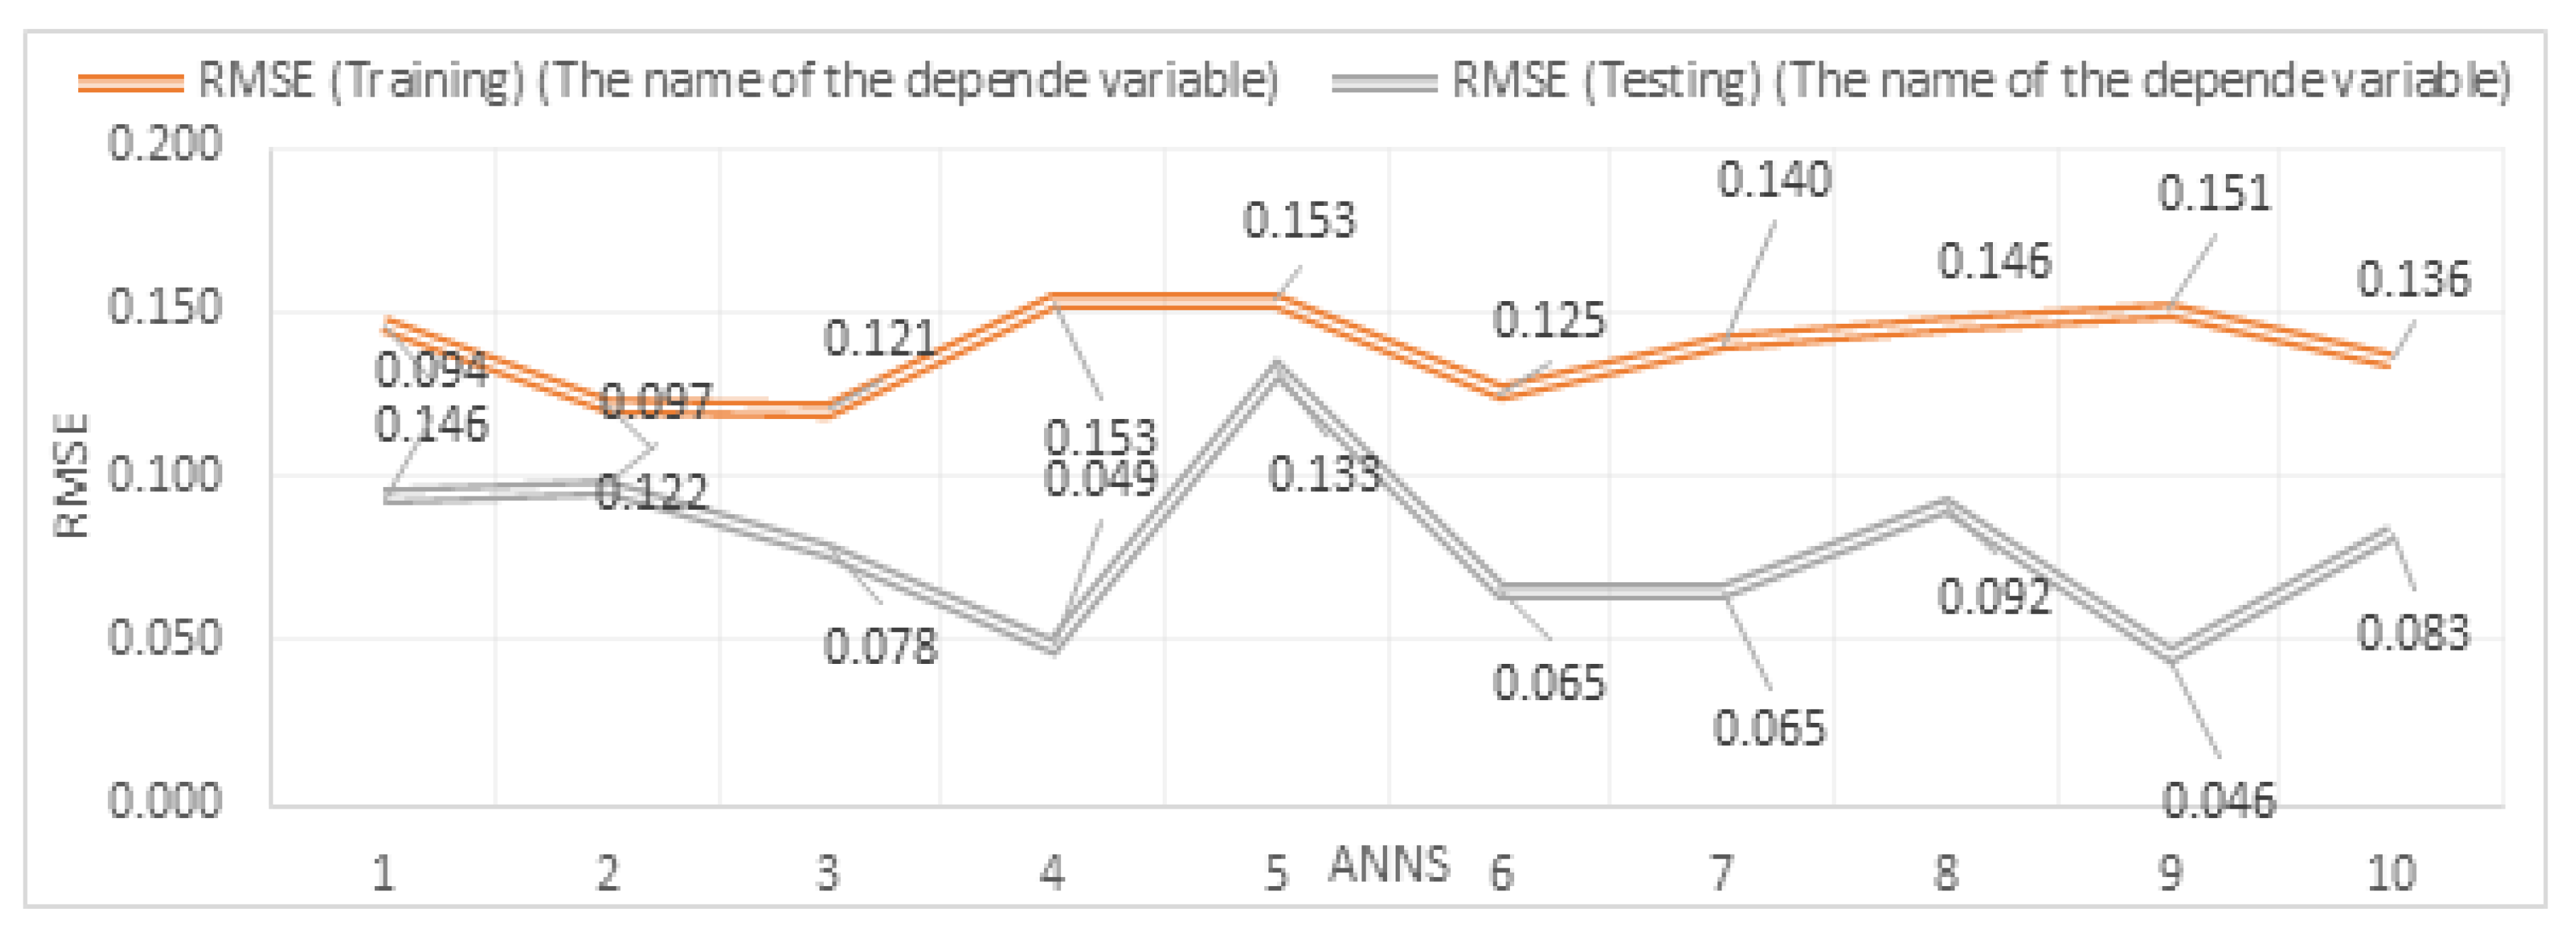
Figure 6.
Residual by Predicted value.
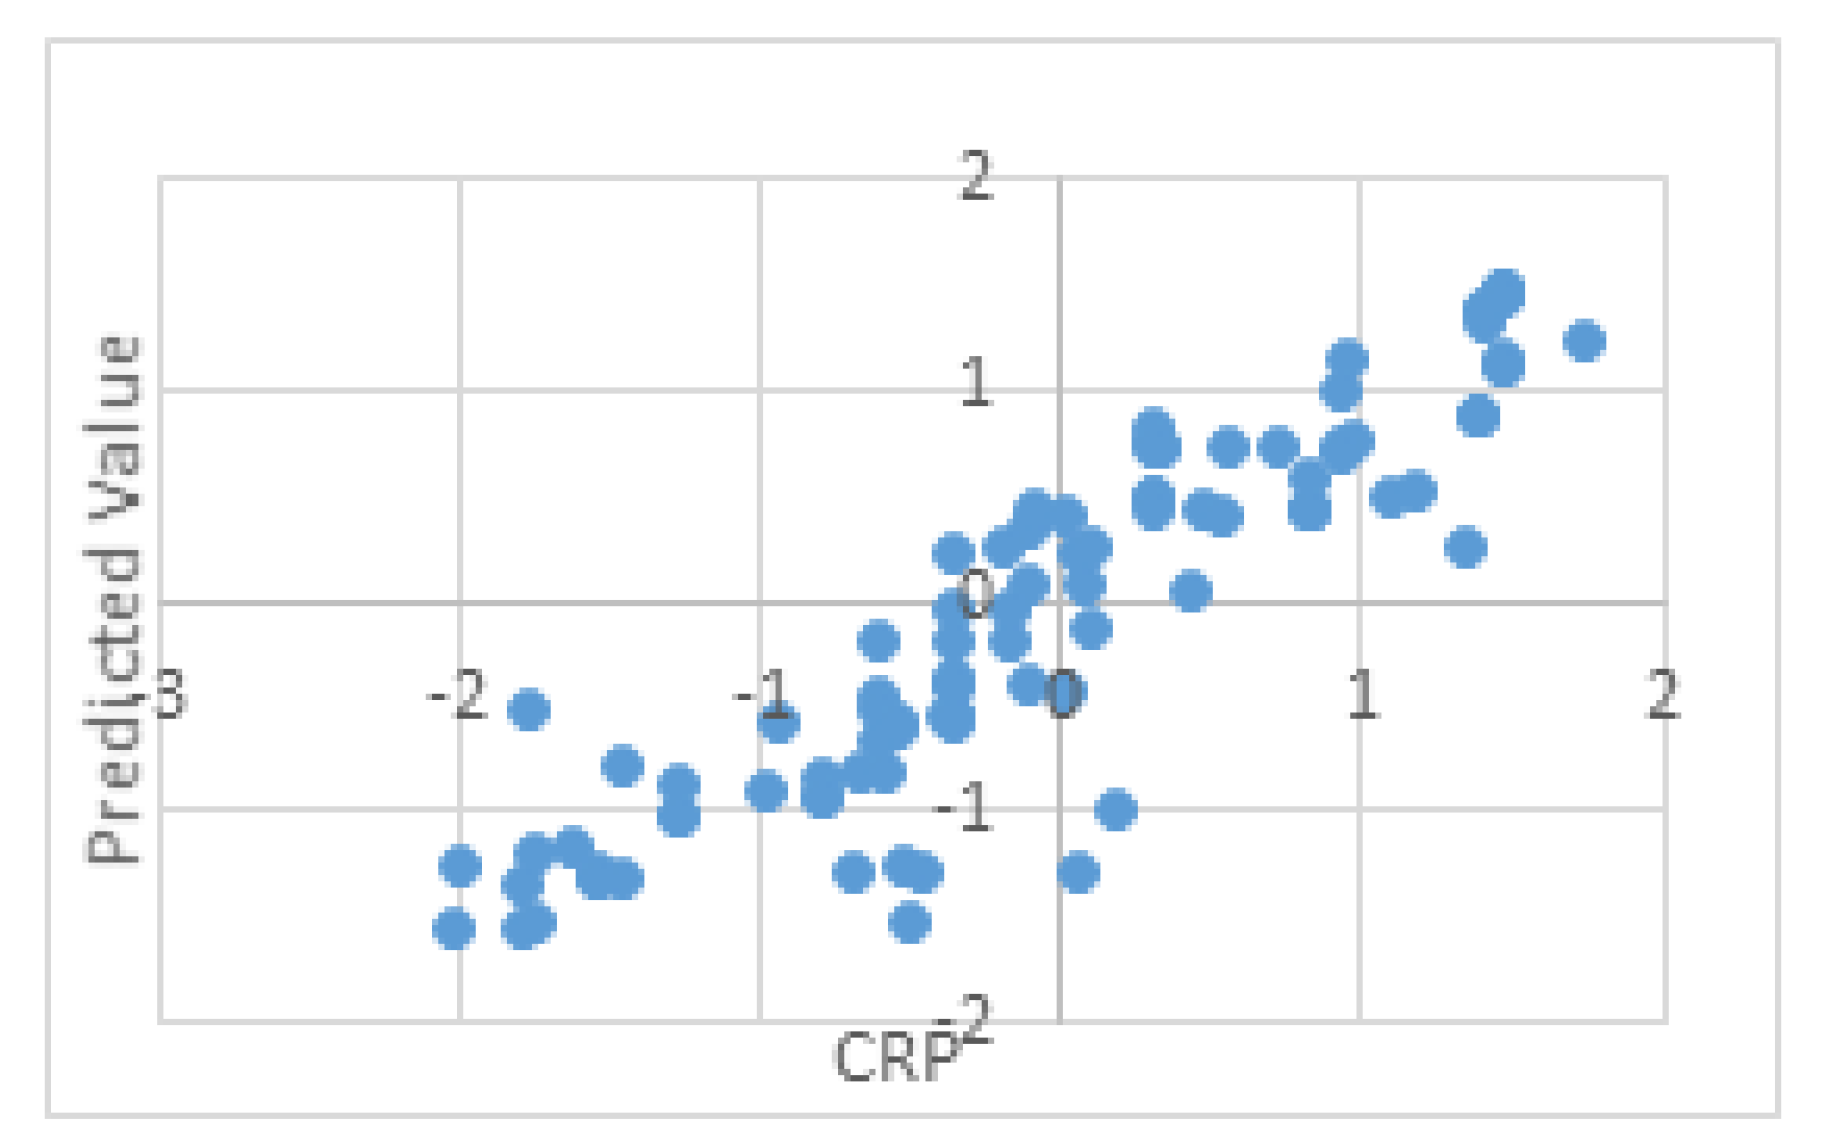
Figure 7.
Predicted value by observed.
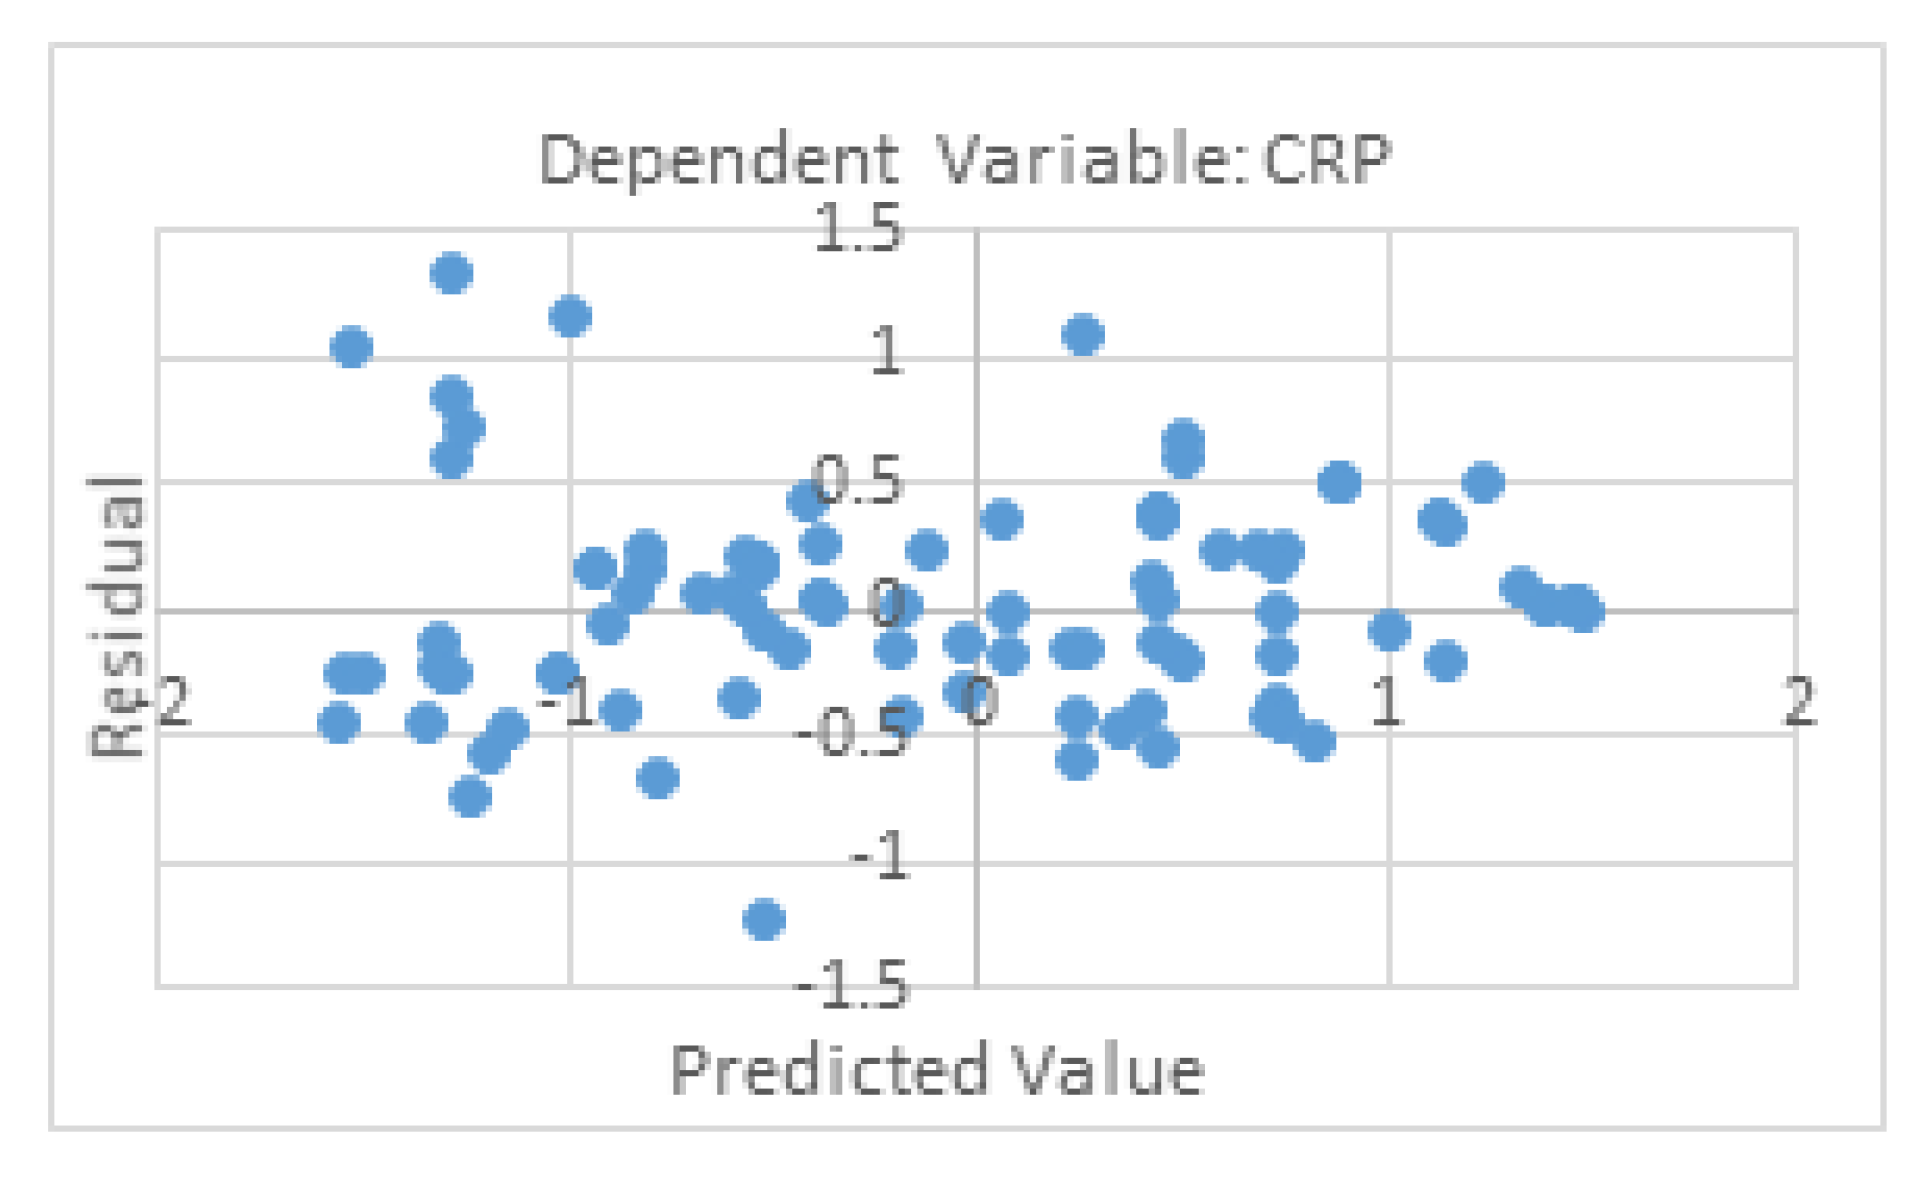
Disclaimer/Publisher’s Note: The statements, opinions and data contained in all publications are solely those of the individual author(s) and contributor(s) and not of MDPI and/or the editor(s). MDPI and/or the editor(s) disclaim responsibility for any injury to people or property resulting from any ideas, methods, instructions or products referred to in the content. |
© 2026 by the authors. Licensee MDPI, Basel, Switzerland. This article is an open access article distributed under the terms and conditions of the Creative Commons Attribution (CC BY) license.
Copyright: This open access article is published under a Creative Commons CC BY 4.0 license, which permit the free download, distribution, and reuse, provided that the author and preprint are cited in any reuse.


