
Submitted:
19 May 2025
Posted:
20 May 2025
You are already at the latest version
Abstract
Research background: environmental management accounting (EMA) plays a prominent role in helping small and medium enterprises towards the improvement of new goods (i.e., greener production), more complex technical practices, and improved methods of operation cost control. This in turn, enhances (e.g., cost declines through ecological efficiencies, the improvement of ecological markets and first-mover advantage, better community relations, and an improved image) and increase the likelihood of improving companies' sales levels and improve the sustainable competitive advantage (SCA). These opportunities are often not identified by organizations or competitors. Accordingly, firms’ which are looking for adopting EMA are required to obtain tangible resource (i.e., financial resources (FR), intangible resources (namely, natural environmental orientation (NEO)) and capabilities exemplified by environmental innovation capability (EIC). However, limited existing studies have been conducted on the combined effect of FR, NEO, and EIC on EMA adoption aimed at fostering SCA within small and medium-sized manufacturing enterprises in Kenya.
Purpose of the article: This study investigates the primary role of tangible resources, intangible resources, and capabilities, namely FR, NEO, and EIC in implementing EMA for SCA, and examines the mediating effect of EMA adoption between FR, NEO and EIC and SCA among manufacturing small and medium-sized enterprises (SMEs) in Kenya. To achieve these objectives, hypotheses were formulated on the basis natural resource-based view (NRBV) model and using information from previous research
Methods: A total of 206 usable questionnaires out of 350 were collected using an online survey, and the data were analyzed using Smart- PLS version 4 software
Findings & value added: Empirical evidence indicates no significant relationship between FR and EMA adoption. Nevertheless, a high correlation was found between NEO and EIC and EMA adoption. Furthermore, the findings of the study demonstrated a statistically significant and positive effect between EMA adoption and SCA and between NEO and EIC and SCA through EMA adoption. In summary, this study enhances our understanding of which organizations generate EMA by acquiring adequate intangible resources and capabilities. Additionally, this study emphasizes the significant use of EMA in providing Kenyan SMEs with information to facilitate improved competitive advantage.
Keywords:
Environmental Management Accounting
; Financial Resources
; Natural Ecological Orientation
; Environmental Innovation Capabilities
; Natural Resource Based View
1. Introduction
Currently, competitiveness of the manufacturing industry increasingly hinges not only on productivity, innovation, and employment but also on firms’ responsiveness to environmental challenges [1,2]. By the early 1990s, developed countries, particularly European countries (EUs), had legislated numerous environmental and pollution prevention acts that reached approximately 200 legislations to reduce ecological degradation [3]. This in turn, has influenced exporters in developing countries and limited their market share with their trading partners in EUs [4,5]. For example, Kenya ranks as the fourth biggest emerging economy in sub-Saharan Africa among 48 countries based on gross domestic product (GDP), many manufacturing firms experienced export instability to the EU during 2015–2021. One of the major reasons for this is market access barriers in terms of environmental standards and labelling requirements [6,7].
Accordingly, environmental commitment and reducing the negative environmental impact has become a necessity for firms seeking to promote industrialization, sustainable development, and competitive advantage [8]. In Kenya, the manufacturing sector—particularly Small and medium-sized enterprises (SMEs), which account for approximately 40% of GDP and 60–70% of industrial pollution—faces the dual challenge of environmental responsibility and global market competitiveness [9,10]. Hence, reducing industrial pollution requires firms to obtain a reliable environmental information system that can overcome export barriers and boost competitiveness. Within this context, environmental management accounting (EMA) serves as a critical mechanism for facilitating the development of environmentally sustainable innovations, including greener production, more complex technical practices, and improved methods of operation cost control [11,12]. These practices increase the probability of enhancing enterprises' sales levels through cost reductions via ecological efficiencies, advancements in ecological markets and first-mover advantages, improved community ties, and a stronger corporate image [13]. These opportunities are often not identified by organizations or competitors [14].
The adoption of EMA remains a contested area within the academic literature, with ongoing discussions surrounding its key determinants [15,16,17]. While, growing body of research has focused on various forms of intangible assets, including environmental strategy and top management commitment or perceptions [18]. Intangible resources are widely recognized as critical drivers of organizational success due to their difficulties in acquiring and replicating [19]. A growing body of research has focused on various forms of intangible assets, including environmental strategy and top management commitment or perceptions [19,20,21]. Several studies utilised environmental strategy which represents a bundle of the initiative strategic business planning to reduce the impact of enterprises' operations on the natural environment [22]. However, environmental strategy might not automatically be interpreted as concrete initiatives [23]. Rather, the pursuit of an organization to effectively convert disorganized environmental efforts such as product stewardship and pollution prevention requires the establishment of a positive environmental culture in different words, natural environmental orientation (NEO) [24]. This includes managerial attitudes, values, routines, commitments, standards and responses. In a corporation with an ecology-oriented culture, ecological protection is entrenched in the daily routines of the workers, and each worker actively embraces environmental responsibility, fostering a culture of engagement in ecological protection that encourages environmentally beneficial actions [25].
On the other hand, businesses especially SMEs cannot turn a blind eye on tangible resources and depend only on their intangible resources to accomplish SCA via EMA. Financial resources (FR) and other tangible resources are integral manifestations of the environment in which an organization's activities take place [26], hence it's important for them to be integrated. EMA captures a wider view of the firm’s cost structure, and it requires considerable expenditure (particularly at the preliminary stage of a new practice) because it often involves the modification and improvement of new products, more advanced methodological procedures and well-organized cost management [27]. Nevertheless, SMEs sometimes encounter a significant lack of financial resources, which hinders their ability to make financial commitments towards environmental initiatives [28]. Simultaneously, [29] highlighted that, the notion that the intrinsic worth of both intangible and tangible resources is contingent on the successful integration of effective capabilities. This is because of the inherent static characteristics of these resources. Capabilities can transform these static resources into a dynamic nature and turn them into a new configuration of resources that can sustain a competitive advantage [19]. While innovation capability in SMEs has been associated with enhanced environmental management practices that go beyond compliance [30]. On the other hand, there is a notable gap in the literature concerning environmental innovation capability (EIC), a dimension with a more explicit ecological orientation [31].
Although EMA have predominantly been limited to Western industrialized nations, with a select of a few Asian countries, such as China, Indonesia, and Siri Lanka. To date, Kenya has not been extensively included in the core discourse. There is increasing acknowledgment that Kenya is endeavoring to reform its economic and industrial framework from one that is characterized by scarce competences and high levels of contamination to a paradigm that prioritizes low environmental impact and high efficiency [10,16]. Furthermore, there is no consensus on antecedent factors such as intangible resources and/or capabilities that may influence EMA adoption. Up to now, several factors that could potentially impact EMA adoption, such as FR, NEO, and EIC, have not been extensively explored [21,32]. Moreover, scholars have emphasized the pressing necessity to prioritize the incorporation of sustainable development and EMA within the operational frameworks of SMEs. The aforementioned issue is common in recent empirical research, which has frequently concentrated on EMA application among larger organizations. This emphasis has resulted in a limited understanding of the role of EMA in SMEs, widening the disparity between theoretical knowledge and practical applications [33]. Lastly, empirical existent literature has more emphasized on the impact of EMA adoption on organizational performance—particularly economic and environmental aspects. Conversely, there is a scarcity of studies exploring the influence of EMA adoption in firms SCA [32,33,34]. Consequently, this study aims to rectify these gaps by examining the impact of EMA adoption on SCA.
There are various significant contributions that recent studies have made to the body of literature. First, there is a paucity of prior studies addressing EMA adoption within SMEs in developing countries [35]. Thus, a recent study extends the existing literature through EMA applications across Kenyan SMEs. Then, in light of Kenyan government orientations to improve the natural environment [36], and with the aspirations of Kenyan SMEs to access to developed markets such as the EU market, this empirical study responds to a call for a need to provide better insight into understanding the ecological responsiveness related to EMA adoption across Kenyan SMEs. Second, a relatively scarce area of knowledge discusses the association between tangible, intangible, and capability, which includes FR, NEO, and EIC, since little emphasis has been dedicated to evaluating the impact of these components in the EMA context [17]. Thus, this current study contributes to the literature by providing evidence on EMA adoption and its association with resources and capabilities in emerging countries especially Kenya. Third, a current study adds to the EMA literature by providing a theoretical framework that helps to understand EMA adoption across Kenyan SMEs and how EMA adoption will drive SCA. Furthermore, the study's findings suggested that manufacturing SMEs which looking to increase their competitive advantage should prioritize the deployment of novel systems such as EMA. Eventually, the results provide important insight into the important role of NEO and EIC for EMA adoption, hence strengthening a firm's competitive advantage.
In summary, to the best of our knowledge, there is a lack of empirical survey-based studies in the literature that examines the impact of integrated FR, NEO, and EIC on EMA adoption to promote SCA. In this context, this study is confined to EMA adoption among Kenyan manufacturing SMEs. It is driven by the notable absence of recent empirical research on the influence of resources and capabilities on EMA adoption and the potential of EMA practices to achieve SCA among Kenyan SMEs. The primary objectives of this study are as follows:
- To examine the direct effect of FR, NEO and EIC on EMA adoption
- To examine the indirect effect of FR, NEO and EIC on SCA through EMA adoption.
- To examine the direct effect of EMA adoption on SCA.
The structure of this empirical article proceeds as follows. The next section reviews existing literature on EMA adoption within Kenya's manufacturing SME sector. Hypotheses regarding the link between FR, NEO, EIC, and EMA and the association between EMA and SCA are then presented. The subsequent section covers the research design, followed by a detailed description of the data analysis findings. Finally, the study's discussing findings and conclusions are presented
2. Literature Review
EMA Adoption Across Kenyan Manufacturing SMEs
Kenya has suffered from extreme ecological degradation, with the country being home to 2nd most polluted city (i.e., Nairobi) among the Sub-Saharan African countries and rated 148th out of 180 globally in terms of the environmental performance index, with a current score of 30.80 in 2022 [37]. EMA adoption could be part of a solution, as it has been applied and explored in several industries to help managers recognize direct information needs to reduce environmental impact, increase material and energy efficiency, and create cleaner productions and industries. Academic researchers have repeatedly urged for the compelling need to emphasize the implementation of sustainability and environmental accounting within the operational frameworks of SMEs [15]. Although it is widely acknowledged that large corporations exert a significant influence on the natural environment, it is important to recognize that the contribution of SMEs should not be underestimated [38]. SMEs play a crucial role in most production systems and serve as a significant component of a robust and dynamic market economy. In Kenya, SMEs constitute a significant portion of the country's economy, making a substantial contribution of approximately 40% to its Gross Domestic Product (GDP) of Kenya. The total number of workers was approximately four million. Nevertheless, the economic importance of these entities implies that their ecological impacts should be given greater consideration [28]. According to the literature, SMEs cumulatively generate roughly 60–70 per cent of all industrial pollution. Furthermore, they generate a substantial quantity of waste contrasted to other sectors, which can range between 20 and 30% of the overall operating costs depending on the type of industry [39].
For this reason, SMEs have faced substantial pressure from other companies in developed countries in their supply chains to be involved in corporate environmental strategies. Conversely, failure to address these constraints could potentially lead to the exclusion of SMEs from the supply chains of larger corporations [28]. This could explain the instability of Kenya's exports to European countries, although it showed a growth of 10%, reaching $916 million in 2019. Kenyan exporters to the EU face various constraints and barriers, such as market access barriers in terms of environmental standards and labelling. SMEs are compelled to be environmentally responsible for surviving and maintaining a foothold among other corporations. From this standpoint, a few studies suggest that SMEs could have more advantages in embracing EMA than large corporations. Generally, SMEs are less formally standardized and structured, often controlled by their owners or managers, which can result in personal choices and attitudes that are heavily influenced by values. It is assumed that SMEs possess a higher degree of flexibility than large organizations. This enables SMEs to respond effectively to business environment changes and adequately address the acts undertaken by competitors. Moreover, SMEs tend to prioritize the cultivation of personal relationships and place importance on key stakeholders, which allows them to gain access to external financing and commercial prospects [40,41].
3. Hypotheses Development
3.1. Natural Resource-Based View
NRBV was developed from the foundational theories of the RBV [42]. It is a substantial contribution to environmental and sustainability discourse as it integrates resource management and ecological development concepts into a unified framework. NRBV illustrates how these principles can be applied in businesses to accomplish SCA and support development goals [43]. NRBV is composed of three essential strategic capabilities: pollution prevention, product stewardship, and sustainable development. The preliminary phase which represents pollution prevention aiming to reduce the generation of pollutants and waste through internal operations. It eliminates actions such as waste treatment, reuse or output recycling and trash disposal, as these produce waste before treating or controlling it. Instead, it focuses on efforts like diminishing raw material use, substituting resources, adjusting processes, and reducing compliance and liability costs [44]. However, product stewardship widens ecological consciousness to external activities, seeking conservation, elimination of hazardous substances, and recyclability through value chain or life cycle analysis (LCA) approaches. Sustainable development encourages worldwide consideration of economic, environmental, and social actions 1 [45] . The pressures driving towards sustainable development have been captured and addressed by several industries in different countries. This, in turn, enhances the quality of people’s lives while living within the stamina of the supporting ecosystems [46].
These strategies facilitate inclusive recognition of the environmental difficulties encountered by a corporation, particularly those pertaining to the preservation and safeguarding of the environment [47]. They aim to improve resource utilization efficiency by minimizing the need for inputs, safeguarding the environment, eradicating detrimental pollutants inside both the workplace and surrounding communities, and mitigating the emission of greenhouse gases [48]. EMA is a valuable system that can effectively measure and identify the costs related to pollution prevention, waste disposal, emissions treatment, and remediation based on expenditures related to environmental issues. Furthermore, it can delineate the cost structure of organizations and allocate those costs in certain cost centers into separate columns [49]. Thereby, by implementing EMA, firms will lead to cost reductions through ecological efficiency and the development of ecological markets, thereby increasing their ability to enter these markets, improve community relations, enhance their corporate image, and increase the probability of improving companies' sales levels and competitive advantage.
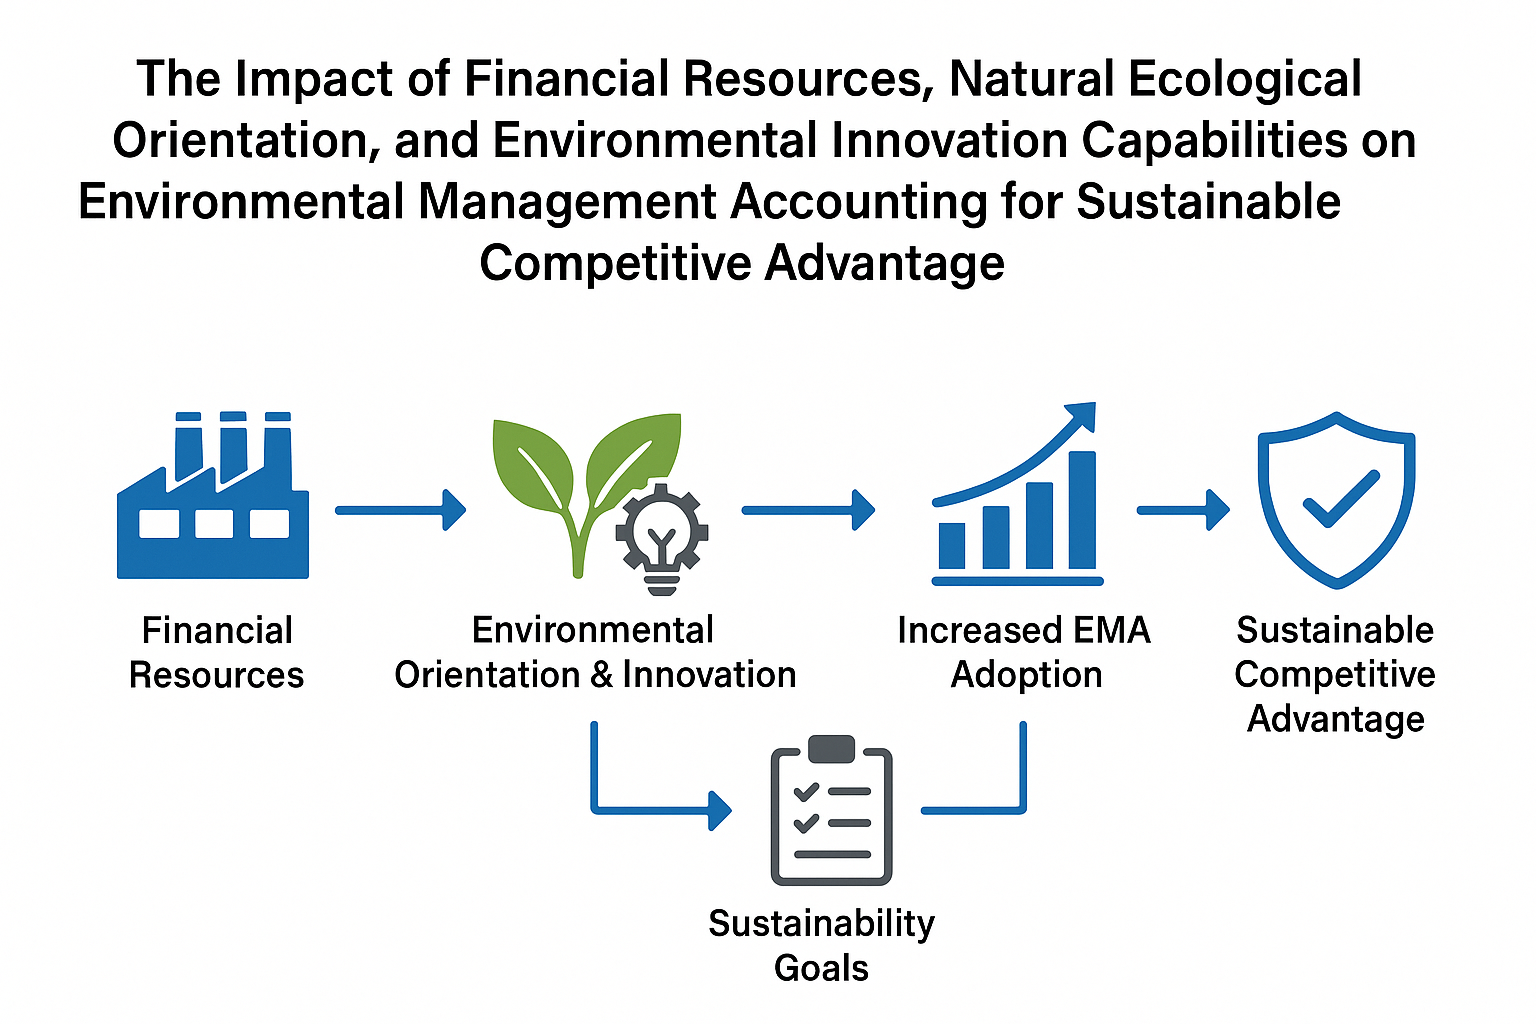
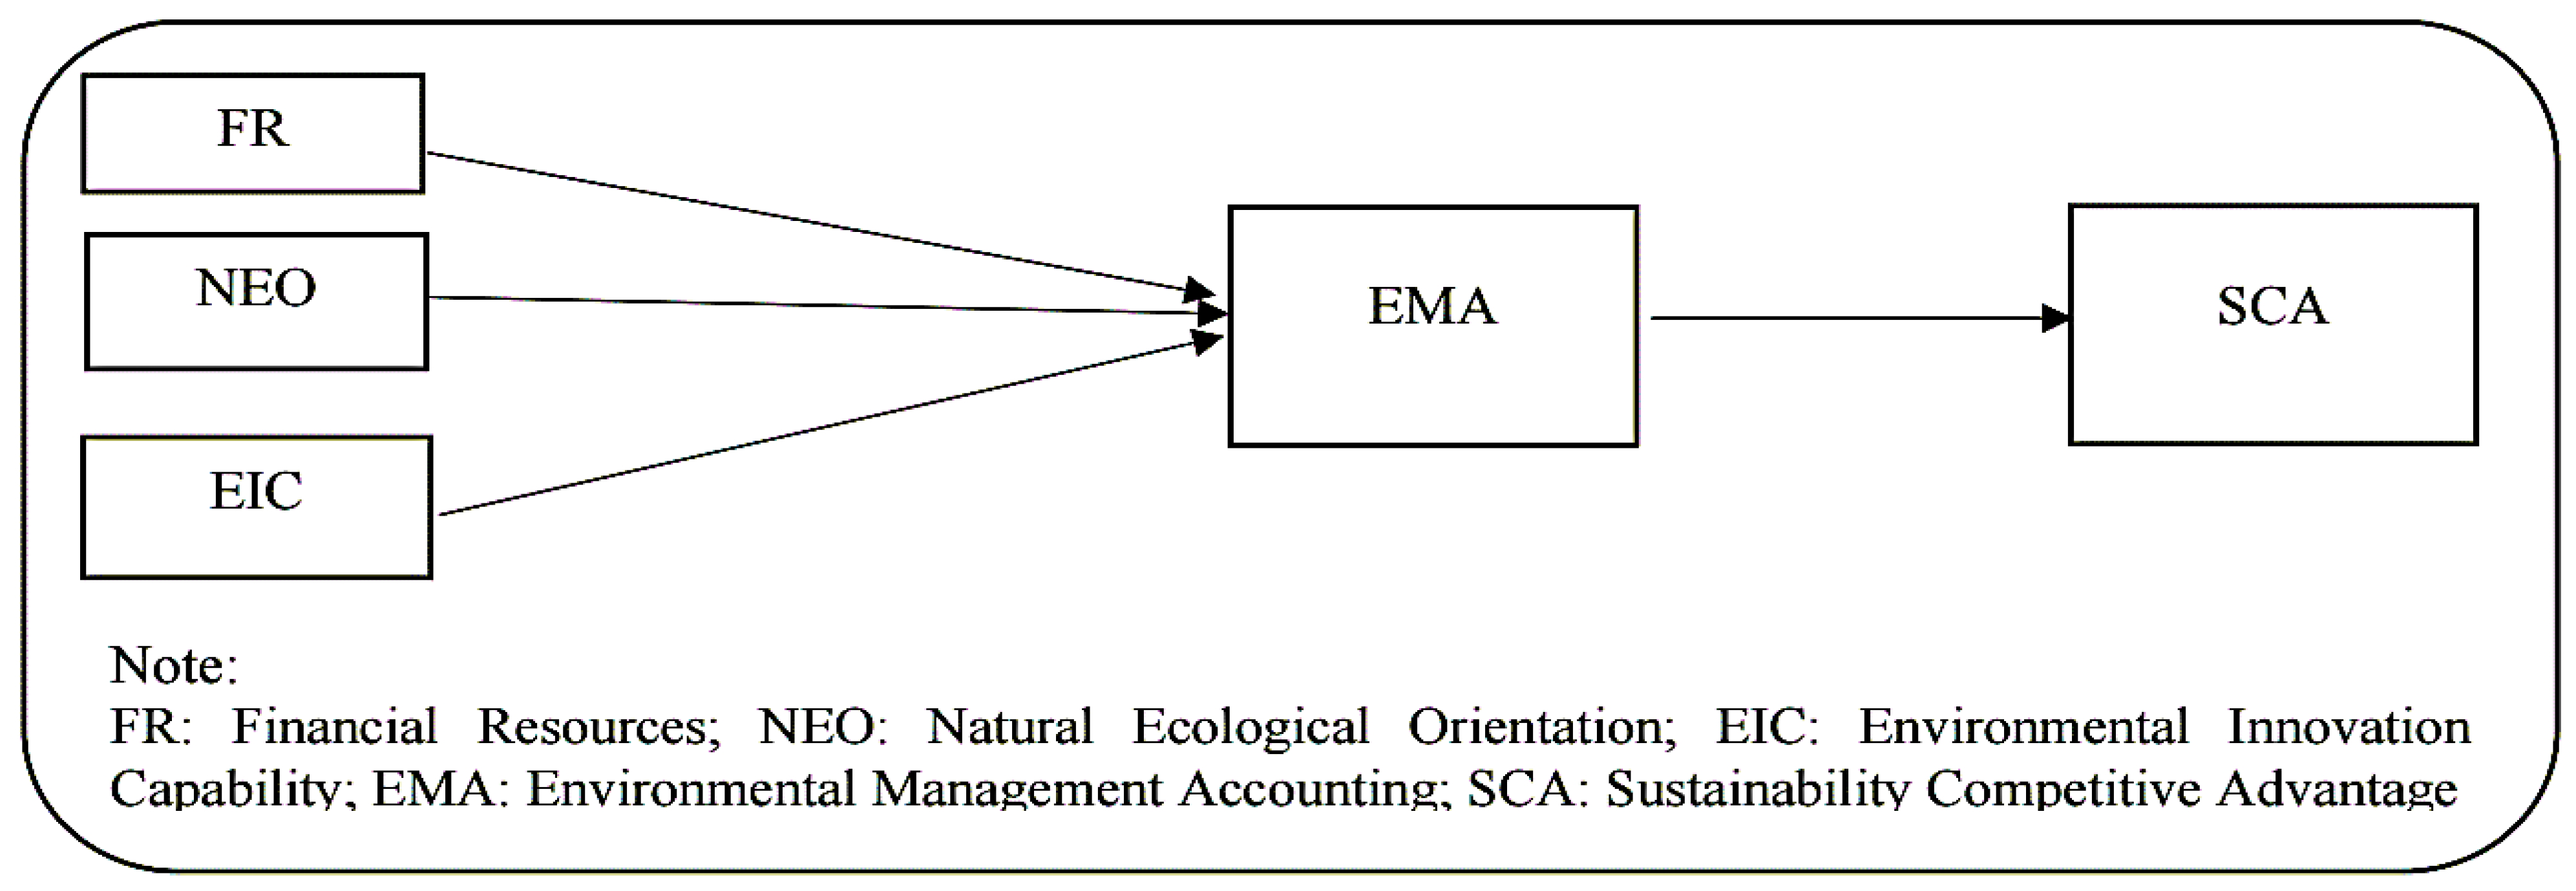
In the light of this reasoning, EMA as ecological innovation system is more complex and sophisticated than conventional management accounting tools [50]. EMA characterized by greater levels of novelty, uncertainty and variety [2]. It induces the corporations to develop novel products (i.e, cleaner production) and to improve existing system in order to decrease their usage of inputs and the ecological damage occasioned by their activities [11]. Thus, from the NRBV's perspective, the successful adoption of EMA inside companies for the purpose of competitive advantage is subjected to complementary organizational resources i.e., tangible resources and intangible resources that are accompanied by capability [44,51]. The key characteristics of these resources and capabilities are valuable, rare, inimitable, and non-substitutable [52], and other organizations and/or competitors frequently fail to recognize [14]. On the other hand, previous studies that utilised NRBV theory to identify EMA and control systems focused only on intangible resources or capabilities. Whereas, tangible resources such as financial resources investment physical resources such as plant, equipment, and stocks of raw materials is almost neglected [17,53,54]. [45] highlighted that, the NRBV framework can be applied to the concept of corporate sustainable development. This is because; (a) it is associated with organisational performance, (b) requires investments in financial and human resources, and (c) creates new opportunities through changes in technology, legislation, and market forces. In summary, as consumer preference for environmental initiatives grows, businesses need to acquire both tangible and intangible resources (e.g., FR and NEO) and capabilities (e.g., EIC) [24], [51], and EMA adoption [42], [55]. Accordingly, as illustrated in Fig 1, this study proposes that, Kenyan SMEs that possess appropriate and relevant tangible and intangible resources, supported by strong capabilities, are more likely to adopt EMA, thereby enhancing their SCA.
Figure 1.
Research model and associations between constructs: designed by the author.
3.2. Financial Resources, EMA and SCA
Firms’ adoption of eco-friendly production strategies and green management practices is significantly influenced by the availability of FR [56]. Enterprises with an abundance of FR are less likely to practice green management activities and vice a versa [57]. More specifically, SMEs might be more enthusiastic to enhance their environmental performance that aims to diminish environmental pollution and be more environmentally friendly with the availability of sufficient FR [58], however, lack in financial resources may hinder them from financially investing in environmental schemes such as EMA [28]. EMA, as one of the environmental management applications that captures a wider view of the firm’s cost structure, requires considerable expenditure (particularly at the preliminary stage of a new practice) because it involves modification through the entire operational process [27], [35]. At the same time, it is argued that SMEs have high uncertainty related to the feasibility of EMA investment [28]. They believed that changing to EMA represents only extra costs for a company, with no potential advantage other than to confirm compliance with laws and regulations and thus avoid possible penalties and fines. Such uncertainty stems from its relationship with customer demand response, and a substantial period before a satisfactory rate of return is achieved [46,59,60]. Accordingly, an important question has often been raised “Does it really pay to adopt EMA?”.
An obvious demonstration in the prior studies ascertains that investing in EMA can ultimately lead to actual cost savings, high revenue generation, and reduced environmental and social risks [17], [61]. Another pilot study on EMA across 38 Lithuanian SMEs from various industries (e.g., textile, food, electric equipment, electronics furniture, and timber production) showed that EMA assisted in reducing operating costs and saving natural resources. The total investments in the EMA covering the comprehensive companies’ modification process were more than 15 million EUR. The invested amount has annual payback periods of 2-3 years [62], [63]. On the other hand, a company may be curtailed towards competitiveness and performance when FR are not effectively invested in green technology such as EMA [58]. Firms that have effectively used financial resources to acquire a SCA have been capable to do so through a history of sensible judgements about the purchase and deployment of resources [64], and hence promotes competitive advantage via sustainable green activities among SMEs, especially in developing economies. For instance, [58] found that FR substantially and positively impact the sustainability performance among Pakistani SMEs. Likewise, [56], revealed that, FR and intellectual capital are highly desirable for competitiveness and high performance via configuration and efficient execution of ecological supply chain management techniques. Following this rationale, the subsequent hypotheses are articulated:
Hypothesis 1(a): FR has a positive and direct effect on EMA adoption.
Hypothesis 1(b): FR has a positive and indirect effect on firms’ SCA through EMA adoption
3.3. Natural Environmental Orientation, EMA and SCA
Within the framework of the NRBV, NEO is conceptualized as a strategic intangible factor that underpins the development of a pro-ecological corporate culture or strategic orientation. This strategic posture embodies a firm’s commitment to balancing environmental sustainability with the achievement of economic performance [24], [25]. The willingness of an organization to effectively convert disorganized environmental efforts into a clear natural environmental orientation for both internal and external stakeholders rely on certain essential conditions that align such efforts with a strategic vision [65]. The pursuit of environmental opportunities, such as product stewardship and pollution prevention, requires the establishment of a positive environmental culture. This includes managerial attitudes, values, routines, commitments, standards, and responses. In a corporation with an ecology-oriented culture, ecological protection is embedded in staff’s daily routines, and each employee actively postulates environmental responsibility, which generates a status of entire participation in ecological protection that promotes ecologically friendly behaviors [25]. [66], underlines the importance of NEO as a valuable and non-substitutable construct, since it is embedded in the unique knowledge potential, skills, resources, reliant on groups of people, or restricted to a certain organization. Accordingly, NEO are more prone to exhibiting diverse reactions to institutional pressures when it comes to managing the interaction between economic activities and the natural environment [67].
[22] divided NEO into two pillars, internal environmental orientation which represents a company's internal values, moral and ethical conduct, and obligation for environmental protection. The second pillar is an external environmental orientation which reflects a firm’s perception of external stakeholders and the demand to meet their expectations in terms of sustainable development, and ecological protection for future generations. Existing studies indicate that NEO in firms within developing countries is still at an early stage of development, mirroring the broader environmental awareness trends in these regions [3,67,68]. For instance, in Turkey many SMEs display a higher degree of environmental orientation, primarily because they serve as suppliers to European Union companies. EU companies in turn pressure them to comply with environmental norms and regulations [69]. Fostering an environmental orientation culture which stimulates environmentally friendly products needs a good quality environmental management practice [25]. EMA as an environmental management practice issues broad information (i.e. monetary and physical) which brings about organizational learning processes, allowing operational efficiency, cross-functional relationships and even enhancing organizational transparency [53].
Engaging NEO in EMA can contribute to the cultivation of a positive environmental perception of a company, resulting in increased overall sales and market share, ultimately leading to improved profitability and SCA. On the other hand, NEO has been invariably neglected by environmental management accounting literature [17]. For instance, [68] who attempted to address this limitation by using NEO to examine its influence on green supply chain management (GSCM). They concluded with great findings that, NEO exerts an important and positive influence on the practice of GSCM. They recommended future research to take additional avenues through other management system-based environmental practices to be mediated between NEO and ecological performance. Accordingly, a heightened level of NEO would expand its capacity to monitor the ongoing changes in institutional expectations and integrating this understanding through cross-functional collaboration. For these companies, investing in EMA is seen as a strategic use of resources that can contribute to SCA [24], [67]. Conversely, the minimal levels of NEO among companies will consider environmental protection and associated functioning entanglement as a risk or threat. Thus, the adoption of EMA by these companies is often characterized as a reactive or passive strategy, with the primary objective of establishing a superficial image of environmental responsibility, a practice that is frequently referred to as greenwashing [67]. [25], found that environmental orientation positively affects supplier green management. Similarly, [67] revealed that environmental orientation supports the potential of environmental management strategies and practices across manufacturing firms in China. Therefore, the following hypothesis was formulated:
Hypothesis 2(a): NEO has a positive and direct effects on EMA adoption
Hypothesis 2(b): NEO has a positive and indirect effect on firms’ SCA through EMA adoption
3.4. Environmental Innovation Capabilities, EMA and SCA
The Organisation for Economic Cooperation and Development (OECO) in 2009, defines EIC as “the application of new, or remarkably improved, products (goods or services), processes, marketing methods, organizational structures and institutional arrangements which, with or without intent, lead to environmental improvements compared to relevant alternatives [51]. EIC exhibits a reduced ecological burden compared with its precursors. This reduction manifests either through a lower environmental impact during manufacturing (process eco-innovations) or across the product’s entire life cycle (product eco-innovations) [70]. The notion being discussed pertains to the entire life cycle of a product, and its ultimate objective is to reduce environmental risk, pollution, and other adverse effects associated with resource use in comparison to alternative approaches [51].
There is a common belief that SMEs have fewer opportunities to obtain EIC than do large companies [71]. On the other hand, research by [72], based on a survey of approximately 540 manufacturing companies across Europe, Australia, and Southeast Asia, demonstrated that a firm's size does not significantly affect its ability to execute innovation capabilities [73]. SMEs can gain even more if they improve, communicate, and embrace an EIC. EIC is a prerequisite and mediator of the efficient and effective utilization of specialized product and process innovations that lead to SCA [71]. [41] indicated that SMEs with strong EIC can successfully implement sophisticated green management practices and activities. Accordingly, once a firm is armed with a good level of EIC, it is expected to align its practices with environmental priorities by adopting EMA [24]. By contrast, when a firm possesses a low level of EIC, it is more likely to respond to institutional forces reactively or even passively. The information provided by EMA encourages the improvement of new products, more advanced technological processes, and improved cost structures [11], which have an influence on business performance with regard to productivity, lead times, quality, and flexibility, and constantly achieve SCA [71]. All these factors allow SMEs to be more competitive, access global markets, and enabling them to remove obsolete products, and achieve customer demand satisfaction. Otherwise, SMEs without innovation may not be able to survive, adopt EMA, and create SCA [74]. Under these circumstances, it is predicted that:
Hypothesis 3(a): EIC has a positive and direct effects on EMA adoption
Hypothesis 3(b): EIC has a positive and indirect effect on firms’ SCA through EMA adoption
3.5. EMA Adoption and SCA
The SCA is a strategy aimed at enhancing market share and establishing a privileged market position [52]. Firms must possess a favorable perception of a significant portion of their client inside their specific target market [75]. SCA is a significant approach adopted by organizations to achieve a unique market position that is not currently pursued by any current or expected market’s competitors and is difficult to imitate by other companies. In a market characterized by growing client demand for cleaner production (CP), corporations are required to develop a strategic approach that encompasses distinct attributes, such as price, availability, specification, reliability and image. These attributes should be executed in a manner that sets the corporation apart from its competitors [52]. According to [76], firms can establish a competitive advantage through one of two primary strategies: differentiation or cost leadership. The differentiation strategy involves enhancing customer satisfaction by offering unique products with superior quality, flexibility, delivery, and design. In contrast, the cost leadership strategy, often referred to as low-cost production, allows firms to offer products at lower prices than their competitors. However, the simultaneous pursuit of cost leadership and differentiation, often termed green differentiation, is generally considered challenging, as achieving green differentiation typically incurs significant costs [77].
Green differentiation is grounded in the idea that reducing pollution levels can increase consumer demand, particularly among environmentally conscious individuals whose purchasing decisions are influenced by the ecological characteristics of products. As a result, this will improve the company's reputation, which will afterward boost sales and consequently increase profits. This in turn can help accomplishing an innovation-based competitive advantage in a variety of ways, such as product differentiation, the sale of contamination control technologies, the establishment of entry barriers, the creation of new opportunities such as cleaner production, and enhanced access to markets [78]. Taking an automobile corporation ‘Toyota’ as an example, pioneered the development of a hybrid engine technology as an environmentally conscious alternative. This innovation has the potential to reduce environmental pollution emissions by approximately 10% when compared with typical automobiles, while also utilizing only 50% of the fuel typically required [79].
Whereas, the integration of “cost leadership” with EMA, facilitates organizational compliance with regulatory standards, proactively mitigates potential legal exposures, and promotes systematic waste minimization [77], This is achieved through the disclosure of environmental cost information and identifying opportunities that are not commonly identified by organizations and their competitors [80]. In contrast, conventional cost accounting tends to obscure or omit environmental costs, either by allocating them to overhead accounts or by failing to record them [81]. For example, the environmental costs of Lithuanian textile SMEs using a traditional cost accounting technique reached €348,000. Nonetheless, following the EMA adoption, the environmental costs were appropriately re-calculated and assigned, resulting in a significantly elevated valuation of €8.5 million, approximately fivefold the traditional cost of €1.7 million. The achieved outcome served as a catalyst for a corporation to make a strategic decision and adopt an innovative cleaner production approach, resulting in a noteworthy reduction in overall costs by 10% within the initial year. According to [63], engaging in such activities might help firms to become more competitive in the market and potentially contribute to its future growth. Consequently, we formulate the following hypothesis:
Hypothesis 4: EMA adoption has a positive association with SCA.
4. Research Design
4.1. Data and Sampling
The data collection was obtained using an online survey approach in which the questionnaire was designed into a special application platform using Google Forms as well as SurveyToGo software. An online survey has a processing advantage over a conventional survey in terms of grabbing a large random sample in a record time, cheaper price charged, and economic scale [82]. The targeted respondents were Kenyan manufacturing SMEs. The focus on the manufacturing sector in the current study refers to its high impact on the natural environment [83]. In this study, manufacturing companies include seven different industries, namely food, metal, textiles, machinery, chemicals, furniture, and automobiles. The population samples were gathered from the database of fresh produce exporters association of Kenyan (FPEAK) and the Kenya national chamber of commerce and industry (KNCCI) 2. In Kenya, SMEs have a workforce of less than 100 employees [84], and an annual turnover of less than 1000 million shillings [6]. Thereby, this study utilizes World Bank's categories of 'micro' (1-4 employees), 'small' (5-19 employees), and 'medium' (20-99 employees), businesses, employed by the World Enterprise Survey [84]. In addition, this study uses the categorization of [6] in terms of turnover, which comprises three categories: less than 5 million, between 6 and 50, and 51 to 1000.
The initial target population of 1162 companies. They were gathered in cooperation with experts from the eco-research-limited firm located in Nairobi. Eco research facilitates the collection of respondents’ names and addresses using telephone calls and e-mails, as well as assists in distributing questionnaires. However, several challenges a researcher encountered with during the process of gathering data such as; respondents’ unavailability or unwillingness to participate in the survey. Additionally, some respondents were hesitant to engage due to the length of the questionnaire, while others were feeling not comfortable disclosing their annual sales turnover because of potential tax implications and the exposure it could bring to their companies. Another obstacle was that a few companies needed approval from local authorities, such as the National Environmental Management Authority (NEMA), despite having obtained authorization from the National Commission for Science, Technology, and Innovation (NACOSTI). Thus, the final sample size was reduced to just 350. Prior to the main survey distribution, a pre-test was conducted involving 12 participants, including four experts specializing in management accounting and corporate sustainability from academic and research institutions. The others from experts’ CEO/ manager of Kenyan SMEs as part of the concept validation procedure [13]. Minor improvements were made regarding phrasing, ordering, and presentation. Finally, the questionnaire underwent revision and refinement. After that, the questionnaire was distributed and emailed to CEOs, managers, or directors of Kenyan manufacturing SMEs during 1st of January until 16th February 16, 2022. A reliable and useful resource for obtaining information on environmental issues, eco-innovation, and continuous green progress of manufacturing firms is more likely to be provided by top management [39]. A questionnaire was emailed together with a cover letter elucidation to increase the response rate.
A total of 266 valid questionnaires were obtained. However, 60 companies were remarked with more than 100 employees, which means that those companies were out of the scope of this study and hence were excluded. Therefore, 206 usable questionnaires remained, yielding a response rate of 17.7%, which matches with figures observed in previous studies of environmental management applications [85], [86]. Consequently, the response rate observed in this study was considered highly satisfactory [87]. Generally, about 200 cases as sample size considered satisfactory for studies utilizing Structural Equation Modeling (SEM). Furthermore, for Partial Least Squares (PLS) models, it is advisable to have a minimum sample size of 10 times the highest number of formative indicators included to assess any one construct [88]. Reasons for non-response might involve the length of the questionnaire, time constraints, or an unwillingness to participate in surveys about sensitive and significant environmental topics [89]. A total of 94 questionnaires were received before the reminder and were categorized as early responses. Subsequently, 62 questionnaires were obtained after the reminder and classified as late responses. In order to detect any potential non-response bias, mean differences between early and late respondents were analyzed using an independent-samples t-test. At a 5% significance level (p > 0.05), no significant differences were found in the mean scores for any of the questions between early and late respondents. Therefore, it is justifiable to conclude that non-response bias does not have a substantial impact on the current study.
Table 1 involves summary of samples’ characteristics. Regarding company’s year of establishment, 89.8 % of the companies have been operating over 5 years and 43.2% of the companies have been operating for more than 20 years. At the management level, 47.6% of the respondents are part of the top management, while 43.2% and 9.2% are part of the middle management and junior management, respectively. Moreover, a significant proportion of the participants 34.5% possess 6-10 years of professional experience, and 32.5% have 1-5 years of work experience. 22.8% of respondents have accumulated 11-20 years of work experience with their present business. This suggests that the respondents are perceived as highly competent, well-informed, and appropriate for this study. Furthermore, in relation to type of industries, food category holds lions’ share of the respondents represents 49%. This was followed by category others specifically plantation sector with 31.5%. Next is the company that falls within the textiles and metal categories with 8.5% and 5% respectively. The distribution of the remaining sectors—chemicals (2.5%), furniture (1.5%), and machinery and automobiles (1%)—indicates that the sample reflects a diverse cross-section of Kenya’s industrial landscape. The statistics as well designated that most companies have a big export focused on Europe region with 86.9%. Regarding export share of annual sales turnover, the figures reflected a high percentage with 85% for KES 51 - 1000 million category. While, 75.7% of this category was for Europe.
4.2. Operationalization of Constructs
The constructs that drew our research model were developed by utilizing a wide-ranging of the relevant literature, as summarized in Table 2. Likert scales with five-point rating scores were used to operationalize the constructs. where responses ranged from 1 ("strongly disagree") to 5 ("strongly agree"). Participants were instructed to indicate the extent to which each statement aligned with their perspectives. To measure EMA adoption, fourteen items were utilized—drawing primarily from [35] and [2], supplemented by two additional items from [38], with overall fourteen items were employed to measure EMA adoption. Respondents were asked to indicate their level of agreement with statements pertaining to the application of EMA within their organizations. Descriptive analysis, using mean scores, was conducted to evaluate the responses, where a higher mean score indicated a greater perceived allocation of environmental costs within their accounting systems.
The financial resource construct was measured using a seven-item scale developed by [57] which aims to identify core dimensions of financial sufficiency. Participants rated their perceptions of their firms’ financial capacity to support various strategic activities, such as environmental sustainability initiatives. A five-point Likert scale (1 = "strongly disagree," 5 = "strongly agree") was utilized, with higher values indicating a more favorable financial standing. The underlying dimensions of NEO was identified and modified utilising [68] measurement on a list of eight items. Respondents were asked to answer each item, which briefly reflects a company's orientation toward environmental preservation. The measurements of these questions were conducted using a 5-point Likert scale, with a range from 1 indicating "strongly disagree" to 5 indicating "strongly agree". Furthermore, The EIC variable was measured through eight items, adapted from established scales developed by [51] and [90]. Respondents were asked to provide their opinions about the endeavors exerted by their companies to modify the products or the production process to decrease the environmental impact. The operationalization of the variable extent of EMA adoption is designed to measure the degree to which companies are implementing EMA techniques. The operationalization of this variable was achieved by employing a set of 14 items that were validated by [2,35,38]. The items presented in this study are representative of activities related to EMA. These activities were carefully chosen and drawn from a range of sources, including IFAC, (2005) and UNDSD, (2001). The criteria for item selection were derived from [92], whose framework promotes a comprehensive view of EMA by incorporating both monetary values and physical metrics. The instrument underwent adaptation in order to assess the EMA practices specifically within SMEs in Kenya. The measurements of these questions were conducted using a 5-point Likert scale, encompassing a range from 1 representing "strongly disagree" to 5 representing "strongly agree". Finally, SCA was assessed using a scale developed by [93]. Under these circumstances, this study did not assume that all respondents constantly shared similar opinions. Instead, their opinions were expected to be in harmony with their company’s vision.

Table 2.
Operationalization of variables.
| Constructs | Definition | Operationalization | Source |
|---|---|---|---|
| Financial Resources (FR) | The volume of fund possessed by the companies that can be exploited once they require to finance their investments, capital and current activities | Measured on a Likert scale: 1=Strongly disagree to 5=Strongly agree |
[57] |
| Natural Environmental Orientation (NEO) | An intangible organizational resource that embodies an environmentally conscious organizational culture or strategic orientation, reflecting the firm’s commitment to environmental sustainability and its overarching philosophy of operating in a socially and ecologically responsible manner. | Measured on a Likert scale: 1=Strongly disagree to 5=Strongly agree |
[24], [68] |
| Environmental Innovation Capabilities (EIC) | the application of new, or remarkably improved, products (goods or services), processes, marketing methods, organizational structures and institutional arrangements which, with or without intent, lead to environmental improvements compared to relevant alternatives | Measured on a Likert scale: 1=Strongly disagree to 5=Strongly agree |
[51], [90] |
| Environmental Management Accounting (EMA) | The producing, analysing, and using of financial and non-financial (or monetary and physical) environment-related information, which support firms in relation to resource allocation, cost saving and decision making while simultaneously improving SCA | Measured on a Likert scale: 1=Strongly disagree to 5=Strongly agree |
[2,35,38] |
| Sustainable Competitive Advantage (SCA) | A strategy that creates lasting value for a firm by differentiating it from competitors, making it difficult for others to replicate. It encompasses innovation, quality improvement, cost reduction, and socio-environmental initiatives to secure a dominant market position and enhance market share. | Measured on a Likert scale: 1=Strongly disagree to 5=Strongly agree |
[93] |
Source: Compiled by the author.
4.3. Data Analysis
The current study employed partial least squares structural equation modeling (PLS-SEM), to statistically analyze the data. Particularly when dealing with models that involve intricate linkages (such as multiple components, indicators, and relationships), the PLS approach is deemed more acceptable [11], [39,89,94]. This approach defines the fundamental criteria for levels of measurement and is applicable to situations involving limited sample sizes [95]. Nevertheless, the lowest possible accepted sample size should be 100 and above for PLS analysis [2]. The PLS algorithm, as detailed by [88], iteratively performs a sequence of ordinary least squares (OLS) regressions—both univariate and multivariate. This computational strategy facilitated the concurrent testing of the study’s hypotheses. The standardization of the regression coefficients may be equivalent to the interpretation of the route coefficient. Additionally, the factor loadings are determined by the measure loadings on the respective constructions of a structural model [89].
The PLS approach has two distinct models: (i) a measurement model, also known as the outer model, which investigates the connections between latent variables and their corresponding observable variables; and (ii) a structural model, sometimes referred to as the inner model, which explores the links between latent variables [95]. PLS confirm that robust solutions are used when estimating correlations among variables [96]. Because the inherent limitations of the estimating process, PLS analysis is particularly advantageous for analyzing small sample sizes, as opposed to covariance-based modelling. The application of covariance-based modeling imposes rigorous data requirements, often necessitating a sample size that exceeds the number of constructs to achieve reliable estimations [95]. Since PLS analysis involve various software programs version, this study utilized SmartPLS 4.0 primarily because of its flexibility and the inclusion of contemporary analytical techniques that were necessary for testing the formulated hypotheses. Confirmatory factor analysis (CFA) was employed by adapting and validating instruments that have been previously evaluated and derived from theoretical frameworks [97]. This technique aligns with the methodology suggested by [98], who proposed that, CFA might be used to identify and test certain theoretical associations among observed indicator items, thereby generating composite factors. According to the study conducted by [99], it was suggested that the utilization of CFA can contribute to the improvement of the robustness of both content and construct validity. Hence, the utilization of the CFA technique with SmartPLS is deemed suitable for survey-based research.
The current research utilized a sample of 206 cases and performed 1000 bootstraps to evaluate the hypotheses. The empirical sampling distribution of the complete model parameter and its standard error were validated by running 1000 bootstrapped samples. Consistent with established procedures, t-statistics were utilized to assess the significance of path coefficients. Bootstrapping was applied to accommodate the small sample size and the absence of multivariate normality [94]. Bootstrapping entails the selection of a substantial number of subsamples, which are then replaced with data from the original dataset [88]. An estimation for the model is computed by utilizing each individual subset. In brief, the analyses regarding the association of a model's construct could be delineated as follows: i) testing the psychometric properties—specifically reliability and validity for each construct-specific variable set; ii) assessing the structural model's adequacy in replicating the observed data structure; and iii) examining of both the direct relationships linking FR, NEO, and EIC to EMA and the mediating effect exerted by EMA on the achievement of SCA.
5. Results
5.1. Assessing Psychometric Properties
In order to verify the measurement model's reliability, convergent validity, and discriminant validity, this article incorporates a variety of prior studies. The reliability of the measurement model was assessed using Cronbach's alpha, composite reliability, and average variance extracted (AVE). Furthermore, Convergent and discriminant validity assessments, in accordance with established procedures [95] [88] were conducted to ensure the psychometric soundness of the constructs. The correlation coefficient value between 0 and 1 is a statistical measure known as Cronbach's alpha, which denotes the extent of positive association among components in a set [100]. Cronbach's alpha values approaching 1 indicate a high degree of internal consistency. As per, [101] a threshold of 0.70 is generally acceptable, while values as low as 0.60 may be tolerated in exploratory research. In this study, the Cronbach's alpha coefficients ranged between 0.630 and 0.906, suggesting acceptable to strong internal reliability across the constructs assessed [100].
Composite reliability and rho_A values obtained from the PLS analysis ranged between 0.757 and 0.924, satisfying the standard threshold of >0.70. However, several constructs recorded AVE values between 0.351 and 0.636, falling below the recommended 0.50 cut-off (see Table 3) [95] and [102]. However, [102] contend that when composite reliability surpasses 0.60, AVE values between 0.40 and 0.50 remain acceptable [103]. With respect to both convergent and discriminant validity. [101] emphasized that they regarded as subcategories or subtypes of construct validity. Convergent and discriminant validity tests were performed by analyzing the correlation matrix. This analysis helps determine whether the measures exhibit strong convergent and discriminant validity. Convergent validity can be assessed by examining the factor loadings of the measures on their corresponding variables [95]. PLS analysis evaluates the loadings and cross-loadings of each item to identify any issues and as criteria for the achievement of convergent validity. The outcome of the loading and cross-loading of indicators is displayed in Table 3. The analysis revealed that, the majority of indicator loadings on their corresponding constructs were statistically significant at the 1% level and surpassed the recommended cutoff value of 0.60, as shown in Table 3 [104].
According to [88], indicator loading and cross-loading should ideally surpass the threshold of 0.60. Nonetheless, items with loadings between 0.50 and 0.60 can still be acceptable, especially when developing new instruments or refining existing measurement scales [104]. Items with loadings below 0.50, particularly when their contribution is statistically insignificant, should be removed from the model to maintain the quality of the measurement structure [88]. Accordingly, out of 42 items, two were deleted (i.e., NEO1 and NEO2) because their loading was lower than 0.50. Discriminant validity was assessed using the Fornell-Larcker criterion, following the methodology outlined by [89]. This approach involves comparing the square root of each construct’s AVE with its correlations with other latent variables. As per the guidelines provided by [88], discriminant validity is established when the square root of a construct's AVE exceeds its highest correlation with any other construct. The results presented in Table 4 confirm that this condition is met, indicating adequate discriminant validity for all constructs included in the study. Hence, the psychometric properties of the instruments provided evidence in favor of the interpretation of the proposed structural model [94].
5.2. Descriptive Statistics
The major constructs' descriptive statistics are summarized in Table 5. Consequently, the statistics indicate a mean FR score of 3.916, which is relatively high. This illustrates the substantial influence of FR on the adoption of the EMA. Consequently, in order to implement environmental strategies, a company must acquire adequate financial resources and secure loans or credit from financial institutions. Additionally, the mean levels of NEO and EIC were 4.262 and 4.120, respectively. Intangible resources and capability are difficult for other actors to acquire or replicate due to their rare, valuable, inimitable, and non-substitutable nature. The figures also indicate that EMA adoption is substantial, with a mean score of 4.247. It seems that the combination of tangible resources (i.e., FR) and intangible resources NEO and EIC is a catalyst for SMEs to enhance their environmental status. Lastly, SCA recorded the lowest mean score among the constructs, with a moderate value of 3.847. This outcome suggests that there remains considerable room for SMEs to enhance their sustainable competitiveness, particularly through the adoption and effective application of EMA.
5.3. Hypothesis Testing
Upon establishing the reliability and validity of the measurement constructs, the analysis progressed to the evaluation of the structural model and the testing of the proposed hypotheses. Given that robust correlations among variables within a survey can exacerbate the likelihood of common method bias (CMB) and multicollinearity [105], these potential concerns were systematically evaluated prior to result interpretation. The study utilized the variance inflation factor (VIF) through SmartPLS version 4 to assess multicollinearity. In line with [101], maintaining VIF values below 5 is essential to validate the inclusion of all predictors within the model. The results outlined in Table 6 demonstrate the absence of critical multicollinearity or CMB issues, thereby confirming that all predictor variables meet the recommended VIF threshold and are suitable for model estimation. As presented in Table 6, the analysis confirmed the absence of significant CMB or multicollinearity, thereby safeguarding the integrity of the findings.
To assess the statistical power of the model, particularly in evaluating interaction effects via the product indicator approach, the interpretation of R² and adjusted R² values followed the threshold guidelines established by [106]. The coefficient of determination (R²) is a measure of the degree to which exogenous constructs explain the variance in endogenous variables. [106], classified R² values as small if they fall within the range of 0.02–0.12, medium if they fall within the range of 0.12–0.25, and large if they fall within the range of 0.25–1.00. The results shown in Table 7 indicate that the predictor constructs were able to provide a description of EMA and SCA, as indicated by the adjusted R² values of 0.375 and 0.613, respectively. These results suggest that EMA and SCA had a significant effect size. In conclusion, the relationships between the constructs exhibited sufficient statistical strength to effectively elucidate the theoretical framework of this research.
The evaluation of the research hypotheses, along with an assessment of the impact of the parameters and statistical significance, was conducted using non-parametric methodologies. The bootstrapping procedure involved generating 1,000 resamples from the original dataset using a replacement method, as suggested by [95]. Table 7 presents the structural model alongside the results of hypothesis testing related to the direct effects. The analysis encompassed the examination of path coefficients, their statistical significance (p = 0.05), and determination of multiple R-square values. Initially, a preliminary study model assessment was conducted, without considering the mediating influence of EMA adoption. In contrast to the prevailing expectations. The link between FR and EMA was found to be statistically insignificant (t = 0.249, p > 0.10, two-tailed). In contrast, NEO exhibited a significant positive relationship with EMA adoption, supported by a t-value of 3.736 and a p-value below 0.01. These results support previous studies [25], [67]. In contrast, EIC had a statistically significant positive relationship with EMA adoption, as evidenced by a t-value of 2.985 and a p-value less than 0.01. Likewise, EMA was found to be significantly correlated with SCA, as displayed at a t-value of 3.199 and a p-value less than 0.01.
The mediating role of EMA is detailed in Table 8. Mediation analysis was conducted using PLS-SEM, following the procedure outlined by [107] to compute individual indirect effects and construct confidence intervals. An Excel-based computational method was employed to estimate the magnitude of the mediating effects (a₁×b₂ + a₁×b₂) within the relationship between EMA and SCA. The findings suggest that EMA entirely mediates the link between NEO, EIC, and SCA. However, there was no evidence of an EMA-mediated relationship between FR and SCA. In other words, H1(b) was not supported, while H2(b)+H3(b) was supported.
6. Discussion
The findings highlight the distinct and autonomous roles of NEO and EIC as critical drivers in facilitating the adoption of EMA. However, the effect of FR varied slightly. Additionally, the results indicate that EMA may interact with SCA. Detailed findings are presented in Figure 2 and are discussed further below.
Regarding hypothesis 1(a)+ hypothesis 1(b), it was anticipated that financial resources would have both a direct positive effect on the adoption of of EMA among Kenyan SMEs, and an indirect positive effect on firms’ SCA through EMA adoption. Surprisingly, the analytical outcomes did not support H1(a) + H1(b). These findings diverge from a substantial body of prior empirical research such as [58], [108], which demonstrated a positive correlation between financial resources and environmental sustainability across SMEs. On the other hand, the empirical evidence was seen align more closely with [57] who argued that FR do not necessarily serve as the primary factors influencing the extent of environmental sustainability in manufacturing SMEs in the Philippines. Interestingly, the limited availability of financial resources, which is a prevalent challenge in small enterprises, does not seem to pose a significant obstacle to adopting a sustainability-oriented approach. This suggests the presence of other influential factors that drive SMEs to integrate sustainability into their operations and decisions, including the adoption of EMA. One possible explanation is the high cost of EMA implementation and the uncertain benefits it presents (Shu et al., 2016), which could discourage a good portion of SMEs in Kenya from investing in EMA applications. Likewise, the findings these findings may support the argument presented by scholars such as [2], [97], who argued that intangible assets are more instrumental than tangible assets in fostering SCA through EMA.
The analytical findings provide empirical support for hypotheses H2a and H2b, indicating that NEO exerts a significant direct influence on the adoption of EMA, and an indirect positive impact on firms’ SCA through the mediating role of EMA. These outcomes are consistent with the conclusions drawn by [23], who found that environmental orientation can improve environmental marketing. In addition, it is inconsistent with [25], who discussed the link between environmental orientation and supplier green management. which suggests. It is important to highlight that these findings could be attributable to the following reasons. An initial observation reveals that the majority of participating firms (71%) had surpassed ten years of business activity since their start-up phase. Similar to other business ventures, environmentally focused start-ups are susceptible to failure and, thus, may not fully achieve their intended environmental influence. The significant rate of failure can be related to the liabilities associated with being newly developed and very small. Organizations characterized by an environmentally oriented culture are more likely to demonstrate increased sensitivity and responsiveness to external stakeholder demands, with particular attention to customer influence. This increases the need to include these activities in the company's core corporate values by utilizing EMA as a means of reflection. In addition, EMA is widely recognized as a beneficial instrument that offers pertinent environmental data to bolster SCA implementation.
Likewise, the results fully supported both H3a and H3b, confirming that EIC significantly and positively affects EMA adoption directly, while also contributing indirectly to firms' SCA through this mediating mechanism. The outcomes are likely due to the combined effect of product and process innovations in enhancing quality, with a noticeable shift favoring process-oriented innovation strategies. This could refer to the role of EMA in motivating firms to develop techniques that identify hidden environmental costs and to design activities with the aim of manufacturing eco-friendly products that are less harmful to the environment. Thus, firms are more prone to encountering market fluctuations encompassing shifts in customer preferences, competitive challenges, and technological advancements. However, these findings are inconsistent with [90], the finding that innovation capabilities have a negative and insignificant impact on EMA adoption among manufacturing SMEs in Iran. The authors highlighted that the adverse consequences associated with EMA were not attributable to its inherent nature. However, the negative impact could be linked to external factors including the lack of a supportive context, managerial inexperience, and deficient technical of EMA implementation.
Finally, the relationship of EMA adoption and SCA was hypothesized to have a positive significant influence between EMA adoption and SCA. This hypothesis is completely supported. This finding was seen to be similar to the findings of [93], [109]. [93] found that green product innovation, green process innovation, green managerial innovation and greening the suppliers were positive and strongly correlations with competitive advantage. Similarly, [109] confirmed that cleaner production is the mean driver for SCA. EMA is anticipated to become a critical determinant of firms’ competitive advantage in the future, as its adoption facilitates cost reductions, enhanced operational efficiency, increased productivity, and improved product quality, all of which contribute to strengthening SCA. Moreover, by adopting EMA, firms can enhance their green reputation, thereby expanding opportunities to access new markets. Consequently, it is essential for organizations to implement EMA and to integrate natural environmental orientation and green innovation capabilities into their strategic frameworks to achieve and sustain competitive advantage. Although the adoption of EMA may involve significant capital investment, it represents a strategic investment in long-term organizational success. For Kenyan firms, continuous investment in EMA is imperative to comply with increasingly stringent environmental regulations and to secure a competitive position in the global marketplace.
7. Conclusions
The primary purpose of this study was threefold: 1) to examine the direct effects of FR, NEO, and EIC on EMA adoption. 2) to examine the indirect effect of FR, NEO and EIC on SCA through EMA adoption. 3) to examine the direct effect of EMA adoption on SCA. This study enhances our understanding of which organizations generate EMA by acquiring adequate intangible resources and capabilities. Additionally, it emphasizes the significant use of EMA in providing Kenyan SMEs with information to facilitate improved competitive advantage. Based on the NRBV theory and survey data from Kenyan manufacturing SMEs, the correlation results demonstrate a strong positive link between NEO, EIC, and the adoption of EMA practices. However, no correlation was observed between FR and EMA use. In addition, the findings revealed a robust and straightforward association between the role of EMA in achieving a sustainable competitive advantage. Therefore, the results were in close alignment with our initial expectations, except for the FR. Current empirical findings have deepened theoretical understanding and enhanced practical relevance in the domain of sustainability and EMA, building on and extending prior academic contributions as follows.
7.1. Theoretical Contributions
By integrating the constructs of FR, NEO, and EIC, this study offers a broadened perspective on the antecedents that may drive the adoption of environmental management accounting within organizations. Furthermore, this study advances the management accounting literature by applying the NRBV theory and empirically demonstrating that intangible resources and capabilities exert a significant influence on EMA adoption, thereby contributing to the development of a natural environmental framework within organizations. The literature in this area is scarce and represents one of the few studies that fill this knowledge gap by examining tangible resources, intangible resources, and capabilities, as little attention has been paid to examining the effect of those determinants and EMA adoption. Lastly, this study examined the impact of EMA adoption on SCA, associations that are difficult to find in prior studies. Most previous EMA studies concentrated on the influence of EMA adoption on firm performance.
7.2. Practical Contributions
The findings of this study also make significant practical contributions to policymakers and companies. Bearing in mind the insufficient incorporation of EMA practices among developing countries, and particularly in African countries including Kenya, the government and accounting professional groups might think about enhancing EMA practices. The outcomes highlight that strengthening innovation capabilities is essential for the effective usage of EMA tools, thereby fostering improvements in a company’s SCA. The present study has contributed to increased awareness among Kenyan companies regarding the importance of EMA in preserving the environment and mitigating their environmental footprints. This study also has the potential to enhance the consciousness of decision makers, either by creating or improving the industrial SMEs towards the EMA in improving and sustaining competitive advantage and supporting their international trade. Thus, this study represents a step toward protecting the environment, which is considered a global problem. Moreover, in today’s international business, all dimensions of sustainability - social, environmental, and economic are becoming increasingly important. Thus, this study highlights a crucial lesson for Western companies that suppliers in Kenya who prioritize sustainability tend to strategically address sustainability factors to enhance outsourcing contracts rather than simply complying with regulations. However, prior to imposing sustainability pressure on manufacturers, particularly in developing countries, foreign firms across developed countries should carefully evaluate their appropriateness, resource accessibility, capability, and practical implications.
7.3. Limitations and Scope for Future Research
This study contributes meaningfully to the growing body of literature on EMA and its connection to SCA. Despite certain limitations, which warrant further investigation in future studies. Nonetheless, these do not compromise the integrity of the current findings. While the research targets exporting SMEs to industrialized nations, it does not explore differences in EMA adoption between multinational and domestic enterprises. Moreover, although the sample is statistically sufficient for PLS-SEM analysis, it may not comprehensively represent the entire spectrum of service and manufacturing industries. When generalizing the results, it is important to evaluate the attentiveness, as they may not accurately represent the entire sample or community. Therefore, future research may also expand this assertion by contrasting multinational and local organizations in the context of developing countries, as well as various categories of firm size, including medium and large firms operating in Kenya. Second, this study specifically targeted a sample that included individual directors, managers, and CEOs from each company. Future research should broaden the scope of the study to include additional decision makers specifically targeting a particular category of managers (such as top, middle, or operational-level managers). Third, this study was prepared employing an online survey-based method that took into account social desirability bias. Future research could adopt a mixed-methods technique, combining surveys and interviews, or utilize case studies to validate and reinforce the findings. Eventually, this study relied on certain antecedent constructs: FRs, NEO, and EIC. Past research indicates that supplier cooperation is significant for corporations to carry out EMA [39]. Future empirical EMA studies could explore how supplier cooperation affects EMA adoption across Kenyan companies.
Author Contributions
Conceptualization, K.M.A.S.; methodology, K.M.A.S.; software, K.M.A.S.; validation, K.M.A.S., A.M.A.; formal analysis, K.M.A.S.; investigation, K.M.A.S.; resources, K.M.A.S.; data curation, K.M.A.S.; writing—original draft preparation, K.M.A.S.; writing—review and editing, K.M.A.S. and A.M.A.; visualization, K.M.A.S. and A.M.A.; supervision, A.M.A.; project administration, A.M.A.; funding acquisition, A.M.A. All authors have read and agreed to the published version of the manuscript.
Funding
This research is funded by the Faculty of Economics and Management at Universiti Kebangsaan Malaysia (UKM).
Institutional Review Board Statement
Not applicable. Informed Consent Statement: Not applicable.
Data Availability Statement
The datasets used and/or analyzed during the current study are available from the corresponding author upon reasonable request.
Acknowledgments
The authors acknowledge the anonymous reviewers for their supportive comments and suggestions on an earlier version of the manuscript.
Conflicts of Interest
The authors declare no conflicts of interest.
References
- Dechezleprêtre, A.; Sato, M. The Impacts of Environmental Regulations on Competitiveness. Rev. Environ. Econ. Policy 2017, 11, 183–206. [Google Scholar] [CrossRef]
- Latan, H.; Jabbour, C.J.C.; de S, A.B.L.; Wamba, S.F.; Shahbaz, M. “Effects of environmental strategy, environmental uncertainty and top management’s commitment on corporate environmental performance: The role of environmental management accounting,” J. Clean. Prod., vol. 180, pp. 297–306, 2018.
- Agan, Y.; Acar, M.F.; Borodin, A. Drivers of environmental processes and their impact on performance: a study of Turkish SMEs. J. Clean. Prod. 2013, 51, 23–33. [Google Scholar] [CrossRef]
- Massoud, M.A.; Fayad, R.; El-Fadel, M.; Kamleh, R. Drivers, barriers and incentives to implementing environmental management systems in the food industry: A case of Lebanon. J. Clean. Prod. 2010, 18, 200–209. [Google Scholar] [CrossRef]
- Qian, W.; Burritt, R.; Chen, J. The potential for environmental management accounting development in China. J. Account. Organ. Chang. 2015, 11, 406–428. [Google Scholar] [CrossRef]
- Osano, H.M. Global expansion of SMEs: role of global market strategy for Kenyan SMEs. J. Innov. Entrep. 2019, 8, 1–31. [Google Scholar] [CrossRef]
- Raga, S.; Mendez-Parra, M.; Velde, D.W.T. “Overview of trade between Kenya and the European Union (EU) ODI-FSD Kenya emerging analysis series Series Key messages,” no. December, 2021, [Online]. Available: www.odi.org/publications/overview-of-trade-.
- Hart, S.L.; Dowell, G. “A natural-resource-based view of the firm: Fifteen years after,” J. Manag., vol. 37, no. 5, pp. 1464–1479, 2011.
- Desouza, P. Air pollution in Kenya: a review. Air Qual. Atmosphere Heal. 2020, 13, 1487–1495. [Google Scholar] [CrossRef]
- Macharia, K.K.; Gathiaka, J.K.; Ngui, D. Energy efficiency in the Kenyan manufacturing sector. Energy Policy 2022, 161. [Google Scholar] [CrossRef]
- Ferreira, A.; Moulang, C.; Hendro, B. Environmental management accounting and innovation: an exploratory analysis. Accounting, Audit. Account. J. 2010, 23, 920–948. [Google Scholar] [CrossRef]
- Gunarathne, A.N.; Lee, K.; Kaluarachchilage, P.K.H. Institutional pressures, environmental management strategy, and organizational performance: The role of environmental management accounting. Bus. Strat. Environ. 2020, 30, 825–839. [Google Scholar] [CrossRef]
- Henri, J.-F.; Journeault, M. Eco-control: The influence of management control systems on environmental and economic performance. Accounting, Organ. Soc. 2010, 35, 63–80. [Google Scholar] [CrossRef]
- Castro, G.M.; Amores-Salvadó, J.; Navas-López, J.E. Environmental Management Systems and Firm Performance: Improving Firm Environmental Policy through Stakeholder Engagement. Corp. Soc. Responsib. Environ. Manag. 2015, 23, 243–256. [Google Scholar] [CrossRef]
- Asiaei, K.; Bontis, N.; Alizadeh, R.; Yaghoubi, M. Green intellectual capital and environmental management accounting: Natural resource orchestration in favor of environmental performance. Bus. Strat. Environ. 2021, 31, 76–93. [Google Scholar] [CrossRef]
- Gunarathne, N.; Lee, K.-H. Corporate cleaner production strategy development and environmental management accounting: A contingency theory perspective. J. Clean. Prod. 2021, 308. [Google Scholar] [CrossRef]
- Salim, K.M.; Amir, A.M.; Maelah, R.; Jalaludin, D. Effects of institutional pressures, organisational resources, and capabilities on environmental management accounting for sustainability competitive advantage. Int. J. Bus. Soc. 2023, 24, 1284–1313. [Google Scholar] [CrossRef]
- Hasan, S.A.S.; Waghule, S.N.; Hasan, M.B. Linking environmental management accounting to environmental performance: the role of top management support and institutional pressures. Cogent Bus. Manag. 2024, 11. [Google Scholar] [CrossRef]
- Kamasak, R. “The contribution of tangible and intangible resources, and capabilities to a firm’s profitability and market performance,” Eur. J. Manag. Bus. Econ., vol. 26, no. 2, pp. 252–275, 2017.
- Christ, K.L.; Burritt, R.L. Environmental management accounting: the significance of contingent variables for adoption. J. Clean. Prod. 2013, 41, 163–173. [Google Scholar] [CrossRef]
- Nguyen, T.H. Factors affecting the implementation of environmental management accounting: A case study of pulp and paper manufacturing enterprises in Vietnam. Cogent Bus. Manag. 2022, 9. [Google Scholar] [CrossRef]
- Banerjee, S.B. Corporate environmentalism: the construct and its measurement. J. Bus. Res. 2002, 55, 177–191. [Google Scholar] [CrossRef]
- Keszey, T. Environmental orientation, sustainable behaviour at the firm-market interface and performance. J. Clean. Prod. 2020, 243. [Google Scholar] [CrossRef]
- Chan, R.Y.K.; Ma, K.H.Y. Environmental Orientation of Exporting SMEs from an Emerging Economy: Its Antecedents and Consequences. Manag. Int. Rev. 2016, 56, 597–632. [Google Scholar] [CrossRef]
- Yu, Y.; Huo, B. The impact of environmental orientation on supplier green management and financial performance: The moderating role of relational capital. J. Clean. Prod. 2019, 211, 628–639. [Google Scholar] [CrossRef]
- Schriber, S.; Löwstedt, J. Tangible resources and the development of organizational capabilities. Scand. J. Manag. 2015, 31, 54–68. [Google Scholar] [CrossRef]
- Burnett, R.D.; Hansen, D.R. Ecoefficiency: Defining a role for environmental cost management. Account. Organ. Soc. 2007, 33, 551–581. [Google Scholar] [CrossRef]
- Brammer, S.; Hoejmose, S.; Marchant, K. “Environmental Management in SMEs in the UK: Practices, Pressures and Perceived Benefits,” Bus. Strategy Environ., vol. 21, no. 7, pp. 423–434, 2012.
- Newbert, S.L. Empirical research on the resource-based view of the firm: an assessment and suggestions for future research. Strat. Manag. J. 2006, 28, 121–146. [Google Scholar] [CrossRef]
- Cassells, S.; Lewis, K.V. Environmental management training for micro and small enterprises: the missing link? J. Small Bus. Enterp. Dev. 2017, 24, 297–312. [Google Scholar] [CrossRef]
- Saunila, M. Innovation capability in SMEs: A systematic review of the literature. J. Innov. Knowl. 2020, 5, 260–265. [Google Scholar] [CrossRef]
- Amorim, P.G.; Mathias, M.A.S.; da Rocha, A.B.T.; de Oliveira, O.J. “Understanding and implementing environmental management in small entrepreneurial ventures: supply chain management, production and design,” J. Small Bus. Enterp. Dev., vol. 30, no. 7, pp. 1445–1475, 2023.
- Jalaludin, D.; Sulaiman, M.; Ahmad, N.N.N. “Environmental management accounting: an empirical investigation of manufacturing companies in Malaysia,” J. Asia-Pac. Cent. Environ. Account., vol. 16, no. 3, pp. 31–45, 2010.
- Solovida, G.T.; Latan, H. Linking environmental strategy to environmental performance: Mediation role of environmental management accounting. Sustain. Accounting, Manag. Policy J. 2017, 8, 595–619. [Google Scholar] [CrossRef]
- Wang, S.; Wang, H.; Wang, J. Exploring the effects of institutional pressures on the implementation of environmental management accounting: Do top management support and perceived benefit work? Bus. Strat. Environ. 2018, 28, 233–243. [Google Scholar] [CrossRef]
- Mungai, E.M.; Ndiritu, S.W.; Rajwani, T. Do voluntary environmental management systems improve environmental performance? Evidence from waste management by Kenyan firms. J. Clean. Prod. 2020, 265. [Google Scholar] [CrossRef]
- Yale Universit Yale Center for Environmental Law & Policy, “Environmental Performance Index Ranking country performance on sustainability issues.” 2022.
- Jamil, C.Z.M.; Mohamed, R.; Muhammad, F.; Ali, A. Environmental Management Accounting Practices in Small Medium Manufacturing Firms. Procedia - Soc. Behav. Sci. 2015, 172, 619–626. [Google Scholar] [CrossRef]
- Salim, K.M.; Amir, A.M.; Sulaiman, M. Material Flow Cost Accounting, Perceived Ecological Environmental Uncertainty, Supplier Integration and Business Performance: A Study of Manufacturing Sector in Malaysia. Asian J. Account. Gov. 2017, 8, 107–121. [Google Scholar] [CrossRef]
- Klewitz, J.; Hansen, E.G. Sustainability-oriented innovation of SMEs: A systematic review. J. Clean. Prod. 2014, 65, 57–75. [Google Scholar] [CrossRef]
- Lee, K.H. “Why and how to adopt green management into business organizations?: The case study of Korean SMEs in manufacturing industry,” Manag. Decis., vol. 47, no. 7, pp. 1101–1121, 2009.
- Hart, S.L. A Natural-Resource-Based View of the Firm. Acad. Manag. Rev. 1995, 20, 986. [Google Scholar] [CrossRef]
- Salvado, J.A.; de Castro, G.M.; Lopez, J.E.N.; Verde, M.D. Environmental innovation and firm performance: A natural resource-based view. Palgrave Macmillan, 2012.
- Darnall, N.; Edwards, D. “Predicting the cost of environmental management system adoption: The role of capabilities, resources and ownership structure,” Strateg. Manag. J., vol. 27, no. 4, pp. 301–320, 2006.
- Bansal, P. Evolving sustainably: a longitudinal study of corporate sustainable development. Strat. Manag. J. 2004, 26, 197–218. [Google Scholar] [CrossRef]
- Schaltegger, S.; Bennett, M.; Burritt, R.L.; Jasch, C. Environmental Management Accounting (EMA) as a Support for Cleaner Producion. Springer, Dordrecht., 2008. [CrossRef]
- Sari, R.N.; Pratadina, A.; Anugerah, R.; Kamaliah, K.; Sanusi, Z.M. Effect of environmental management accounting practices on organizational performance: role of process innovation as a mediating variable. Bus. Process. Manag. J. 2020, 27, 1296–1314. [Google Scholar] [CrossRef]
- Derchi, G.B.; Burkert, M.; Oyon, D. Environmental management accounting systems: A review of the evidence and propositions for future research. Stud. Manag. Financ. Account. 2013, 26, 197–229. [Google Scholar] [CrossRef]
- Jasch, C. Environmental and Material Flow Cost Accounting: principles and procedures, vol. 53, no. 9. Springer Science & Business Media., 2008.
- Cainelli, G.; De Marchi, V.; Grandinetti, R. Does the development of environmental innovation require different resources? Evidence from Spanish manufacturing firms. J. Clean. Prod. 2015, 94, 211–220. [Google Scholar] [CrossRef]
- Hofman, P.S.; Blome, C.; Schleper, M.C.; Subramanian, N. Supply chain collaboration and eco-innovations: An institutional perspective from China. Bus. Strat. Environ. 2020, 29, 2734–2754. [Google Scholar] [CrossRef]
- Barney, J. “Firm Resources and Sustained Competitive Advantage,” J. Manag., vol. 17, no. 1, pp. 99–120, 1991.
- Pe, E.A.; Ruiz, C.C.; Fenech, F.C. “Environmental management systems as an embedding mechanism: a research note,” Account. Audit. Account. J., vol. 20, no. 3, pp. 403–422, 2007.
- Russo, M.V.; Fouts, P.A. “A resource-based perspective on corporate environmental performance and profitability,” Acad. Manage. J., vol. 40, no. 3, pp. 534–559, 1997.
- Journeault, M. The Influence of the Eco-Control Package on Environmental and Economic Performance: A Natural Resource-Based Approach. J. Manag. Account. Res. 2016, 28, 149–178. [Google Scholar] [CrossRef]
- Khan, N.U.; Anwar, M.; Li, S.; Khattak, M.S. Intellectual capital, financial resources, and green supply chain management as predictors of financial and environmental performance. Environ. Sci. Pollut. Res. 2021, 28, 19755–19767. [Google Scholar] [CrossRef]
- Roxas, B.; Chadee, D. Environmental sustainability orientation and financial resources of small manufacturing firms in the Philippines. Soc. Responsib. J. 2012, 8, 208–226. [Google Scholar] [CrossRef]
- Khattak, M.S.; Wu, Q.; Ahmad, M. Influence of financial resources on sustainability performance of SMEs in emerging economy: The role of managerial and firm level attributes. Bus. Strat. Dev. 2023, 6, 669–683. [Google Scholar] [CrossRef]
- Cuerva, M.C.; Triguero-Cano, Á.; Córcoles, D. Drivers of green and non-green innovation: empirical evidence in Low-Tech SMEs. J. Clean. Prod. 2014, 68, 104–113. [Google Scholar] [CrossRef]
- Leonidou, L.C.; Leonidou, C.N.; Fotiadis, T.A.; Zeriti, A. Resources and capabilities as drivers of hotel environmental marketing strategy: Implications for competitive advantage and performance. Tour. Manag. 2013, 35, 94–110. [Google Scholar] [CrossRef]
- Chang, H.-C.; Deegan, C. “Environmental Management Accounting and Environmental Accountability Within Universities: Current Practice and Future Potential,” Environ. Manag. Account. Clean. Prod., p. (pp. 301-320), 2008.
- Singh, M.; Brueckner, M.; Padhy, P.K. Environmental management system ISO 14001: effective waste minimisation in small and medium enterprises in India. J. Clean. Prod. 2015, 102, 285–301. [Google Scholar] [CrossRef]
- Staniskis, J.K.; Stasiskiene, Z. “Environmental management accounting in Lithuania: exploratory study of current practices, opportunities and strategic intents,” J. Clean. Prod., vol. 14, no. 14, pp. 1252–1261, 2006.
- Othman, R.; Arshad, R.; Aris, N.A.; Arif, S.M.M. Organizational Resources and Sustained Competitive Advantage of Cooperative Organizations in Malaysia. Procedia - Soc. Behav. Sci. 2015, 170, 120–127. [Google Scholar] [CrossRef]
- Aboelmaged, M. Direct and indirect effects of eco-innovation, environmental orientation and supplier collaboration on hotel performance: An empirical study. J. Clean. Prod. 2018, 184, 537–549. [Google Scholar] [CrossRef]
- Menguc, B.; Ozanne, L.K. “Challenges of the ‘“green imperative”’: a natural resource-based approach to the environmental orientation–business performance relationship,” J. Bus. Res., vol. 58, pp. 430–438, 2005.
- Kang, Y.; He, X. Institutional Forces and Environmental Management Strategy: Moderating Effects of Environmental Orientation and Innovation Capability. Manag. Organ. Rev. 2018, 14, 577–605. [Google Scholar] [CrossRef]
- Chan, R.Y.K.; He, H.; Kai, H.; Wang, W.Y.C. “Industrial Marketing Management Environmental orientation and corporate performance: The mediation mechanism of green supply chain management and moderating effect of competitive intensity,” Ind. Mark. Manag., vol. 41, no. 4, pp. 621–630, 2012.
- Tatoglu, E.; Bayraktar, E.; Arda, O.A. Adoption of corporate environmental policies in Turkey. J. Clean. Prod. 2015, 91, 313–326. [Google Scholar] [CrossRef]
- Hofmann, K.H.; Theyel, G.; Wood, C.H. Identifying Firm Capabilities as Drivers of Environmental Management and Sustainability Practices – Evidence from Small and Medium-Sized Manufacturers. Bus. Strat. Environ. 2012, 21, 530–545. [Google Scholar] [CrossRef]
- Saunila, M. Innovation capability in achieving higher performance: perspectives of management and employees. Technol. Anal. Strat. Manag. 2016, 29, 903–916. [Google Scholar] [CrossRef]
- Sloan, K.; Sloan, T. Firm size and its impact on continuous improvement. Int. J. Technol. Manag. 2011, 56, 241. [Google Scholar] [CrossRef]
- Saunila, M.; Ukko, J. “Facilitating innovation capability through performance measurement: A study of Finnish SMEs,” Manag. Res. Rev., vol. 36, no. 10, pp. 991–1010, 2013.
- Castela, B.M.; Ferreira, F.A.; Ferreira, J.J.; Marques, C.S. Assessing the innovation capability of small- and medium-sized enterprises using a non-parametric and integrative approach. Manag. Decis. 2018, 56, 1365–1383. [Google Scholar] [CrossRef]
- Hall, R. “A Framework Linking Intangible Resources and Capabilities to Sustainble Competitve Advantage,” Strateg. Manag. J., vol. 14, no. 8, pp. 607–618, 1993.
- Porter, M.E. “Techniques for analyzing industries and competitors.,” Compet. Strategy N. Y. Free, 1980.
- Do, B.; Nguyen, N. “The Links between Proactive Environmental Strategy, Competitive Advantages and Firm Performance : An Empirical Study in Vietnam,” Sustainability, vol. 12, no. 12, p. 4962, 2020.
- Junquera, B.; Barba-Sánchez, V. Environmental Proactivity and Firms’ Performance: Mediation Effect of Competitive Advantages in Spanish Wineries. Sustainability 2018, 10, 2155. [Google Scholar] [CrossRef]
- Porter, M.E.; Kramer, M.R. “The link between competitive advantage and corporate social responsibility,” Harv. Bus. Rev., vol. 84, no. 12, pp. 78–92, 2006.
- Gunarathne, N.; Lee, K.-H. “Environmental Management Accounting (EMA) for Environmental Management and Organizational Change: An Eco Control Approach,” J. Account. Organ. Change, vol. 11, no. 3, pp. 362–383, 2015.
- Jasch, C. Environmental management accounting (EMA) as the next step in the evolution of management accounting. J. Clean. Prod. 2006, 14, 1190–1193. [Google Scholar] [CrossRef]
- Dillman, D.A.; Smyth, J.D.; Christian, L.M. Internet, Mail and Mixed-Mode Surveys: The Tailored Design Method, no. 133. 2014.
- Banerjee, S.B.; Iyer, E.S.; Kashyap, R.K. Corporate Environmentalism: Antecedents and Influence of Industry Type. J. Mark. 2003, 67, 106–122. [Google Scholar] [CrossRef]
- Crick, F.; Eskander, S.M.; Fankhauser, S.; Diop, M. How do African SMEs respond to climate risks? Evidence from Kenya and Senegal. World Dev. 2018, 108, 157–168. [Google Scholar] [CrossRef]
- Henri, J.-F.; Boiral, O.; Roy, M.-J. The Tracking of Environmental Costs: Motivations and Impacts. Eur. Account. Rev. 2013, 23, 647–669. [Google Scholar] [CrossRef]
- Henri, J.-F.; Boiral, O.; Roy, M.-J. Strategic cost management and performance: The case of environmental costs. Br. Account. Rev. 2016, 48, 269–282. [Google Scholar] [CrossRef]
- Kline, R.B. Principles and Practice of Structural Equation Modeling. 2011.
- Hair, J.F.; Sarstedt, M.; Hopkins, L.; Kuppelwieser, V.G. “Partial least squares structural equation modeling (PLS-SEM): An emerging tool in business research,” Eur. Bus. Rev., vol. 26, no. 2, pp. 106–121, 2014.
- Pondeville, S.; Swaen, V.; De Rongé, Y. Environmental management control systems: The role of contextual and strategic factors. Manag. Account. Res. 2013, 24, 317–332. [Google Scholar] [CrossRef]
- Saeidi, S.P.; Othman, M.S.H.; Saeidi, P. The moderating role of environmental management accounting between environmental innovation and firm financial performance. Int. J. Bus. Perform. Manag. 2018, 19, 326. [Google Scholar] [CrossRef]
- I. F. of Accountants [IFAC, “International Guidance Document,” Environ. Manag. Account., no. New York: USA., 2005.
- Burritt, R.L.; Hahn, T.; Schaltegger, S. “Towards a Comprehensive Framework for Environmental Management Accounting -Links Environmental Management Accounting Tools Between Business Actors and,” Aust. Account. Rev., vol. 12, no. 2, pp. 39–50, 2002.
- De Guimarães, J.C.F.D.; Severo, E.A.; de Vasconcelos, C.R.M. “The influence of entrepreneurial, market, knowledge management orientations on cleaner production and the sustainable competitive advantage,” J. Clean. Prod. 2018, 174, 1653–1663. [Google Scholar] [CrossRef]
- Ylinen, M.; Gullkvist, B. The effects of organic and mechanistic control in exploratory and exploitative innovations. Manag. Account. Res. 2014, 25, 93–112. [Google Scholar] [CrossRef]
- Chin, W.W. “The partial least squares approach to structural equation modelling. In Marcoulides G. A. (Ed.),” Mod. Methods Bus. Res., vol. 295, no. 2, pp. 295–336, 1998.
- Chin, W.W. “How to Write Up and Report PLS Analyses,” in Handbook of Partial Least Squares, 2010. [CrossRef]
- Wijethilake, C. Proactive sustainability strategy and corporate sustainability performance: The mediating effect of sustainability control systems. J. Environ. Manag. 2017, 196, 569–582. [Google Scholar] [CrossRef]
- Sarros, J.C.; Gray, J.; Densten, I.L.; Cooper, B. The Organizational Culture Profile Revisited and Revised: An Australian Perspective. Aust. J. Manag. 2005, 30, 159–182. [Google Scholar] [CrossRef]
- Schriesheim, C.A.; Powers, K.J.; Scandura, T.A.; Gardiner, C.C.; Lankau, M.J. Improving Construct Measurement In Management Research: Comments and a Quantitative Approach for Assessing the Theoretical Content Adequacy of Paper-and-Pencil Survey-Type Instruments. J. Manag. 1993, 19, 385–417. [Google Scholar] [CrossRef]
- Sekaran, U.; Bougie, R. , Research Method for Business: A skill Building Approach, 7th edition. Wiley & Son Ltd., 2013.
- Hair, J.; Hult, G.T.; Ringle, C.; Sarstedt, M. , A Primer on Partial Least Squares Structural Equation Modeling (PLS-SEM)., 2nd Edition. Sage publications, 2017.
- Fornell, C.; Larcker, D.F. Evaluating Structural Equation Models with Unobservable Variables and Measurement Error. J. Mark. Res. 1981, 18, 39–50. [Google Scholar] [CrossRef]
- Huang, C.-C.; Wang, Y.-M.; Wu, T.-W.; Wang, P.-A. An Empirical Analysis of the Antecedents and Performance Consequences of Using the Moodle Platform. Int. J. Inf. Educ. Technol. 2013, 217–221. [Google Scholar] [CrossRef]
- Hulland, J. “Use of partial least squares (PLS) in strategic management research: A review of four recent studies,” Strateg. Manag. J., vol. 20, no. 4, pp. 195–204, 1999.
- Kock, F.; Berbekova, A.; Assaf, A.G. Understanding and managing the threat of common method bias: Detection, prevention and control. Tour. Manag. 2021, 86. [Google Scholar] [CrossRef]
- Cohen, J. , Statistical power analysis for the behavioral sciences. Routledge, 1988.
- Carrión, G.C.; Nitzl, C.; Roldán, J.L. “Mediation analyses in partial least squares structural equation modeling: Guidelines and empirical examples,” Partial Least Sq. Path Model. Basic Concepts Methodol. Issues Appl., pp. 173–195, 2017.
- Ye, J.; Kulathunga, K.M.M.C.B. How Does Financial Literacy Promote Sustainability in SMEs? A Developing Country Perspective. Sustainability 2019, 11, 2990. [Google Scholar] [CrossRef]
- Chiou, T.-Y.; Chan, H.K.; Lettice, F.; Chung, S.H. The influence of greening the suppliers and green innovation on environmental performance and competitive advantage in Taiwan. Transp. Res. Part E Logist. Transp. Rev. 2011, 47, 822–836. [Google Scholar] [CrossRef]
| 1 | The Brundtland Report from the World Commission on Economic Development (WCED) defines sustainable development as fulfilling current needs without hindering future generations from fulfilling their own needs [45]. |
| 2 |
Figure 2.
Evaluation of PLS path model.
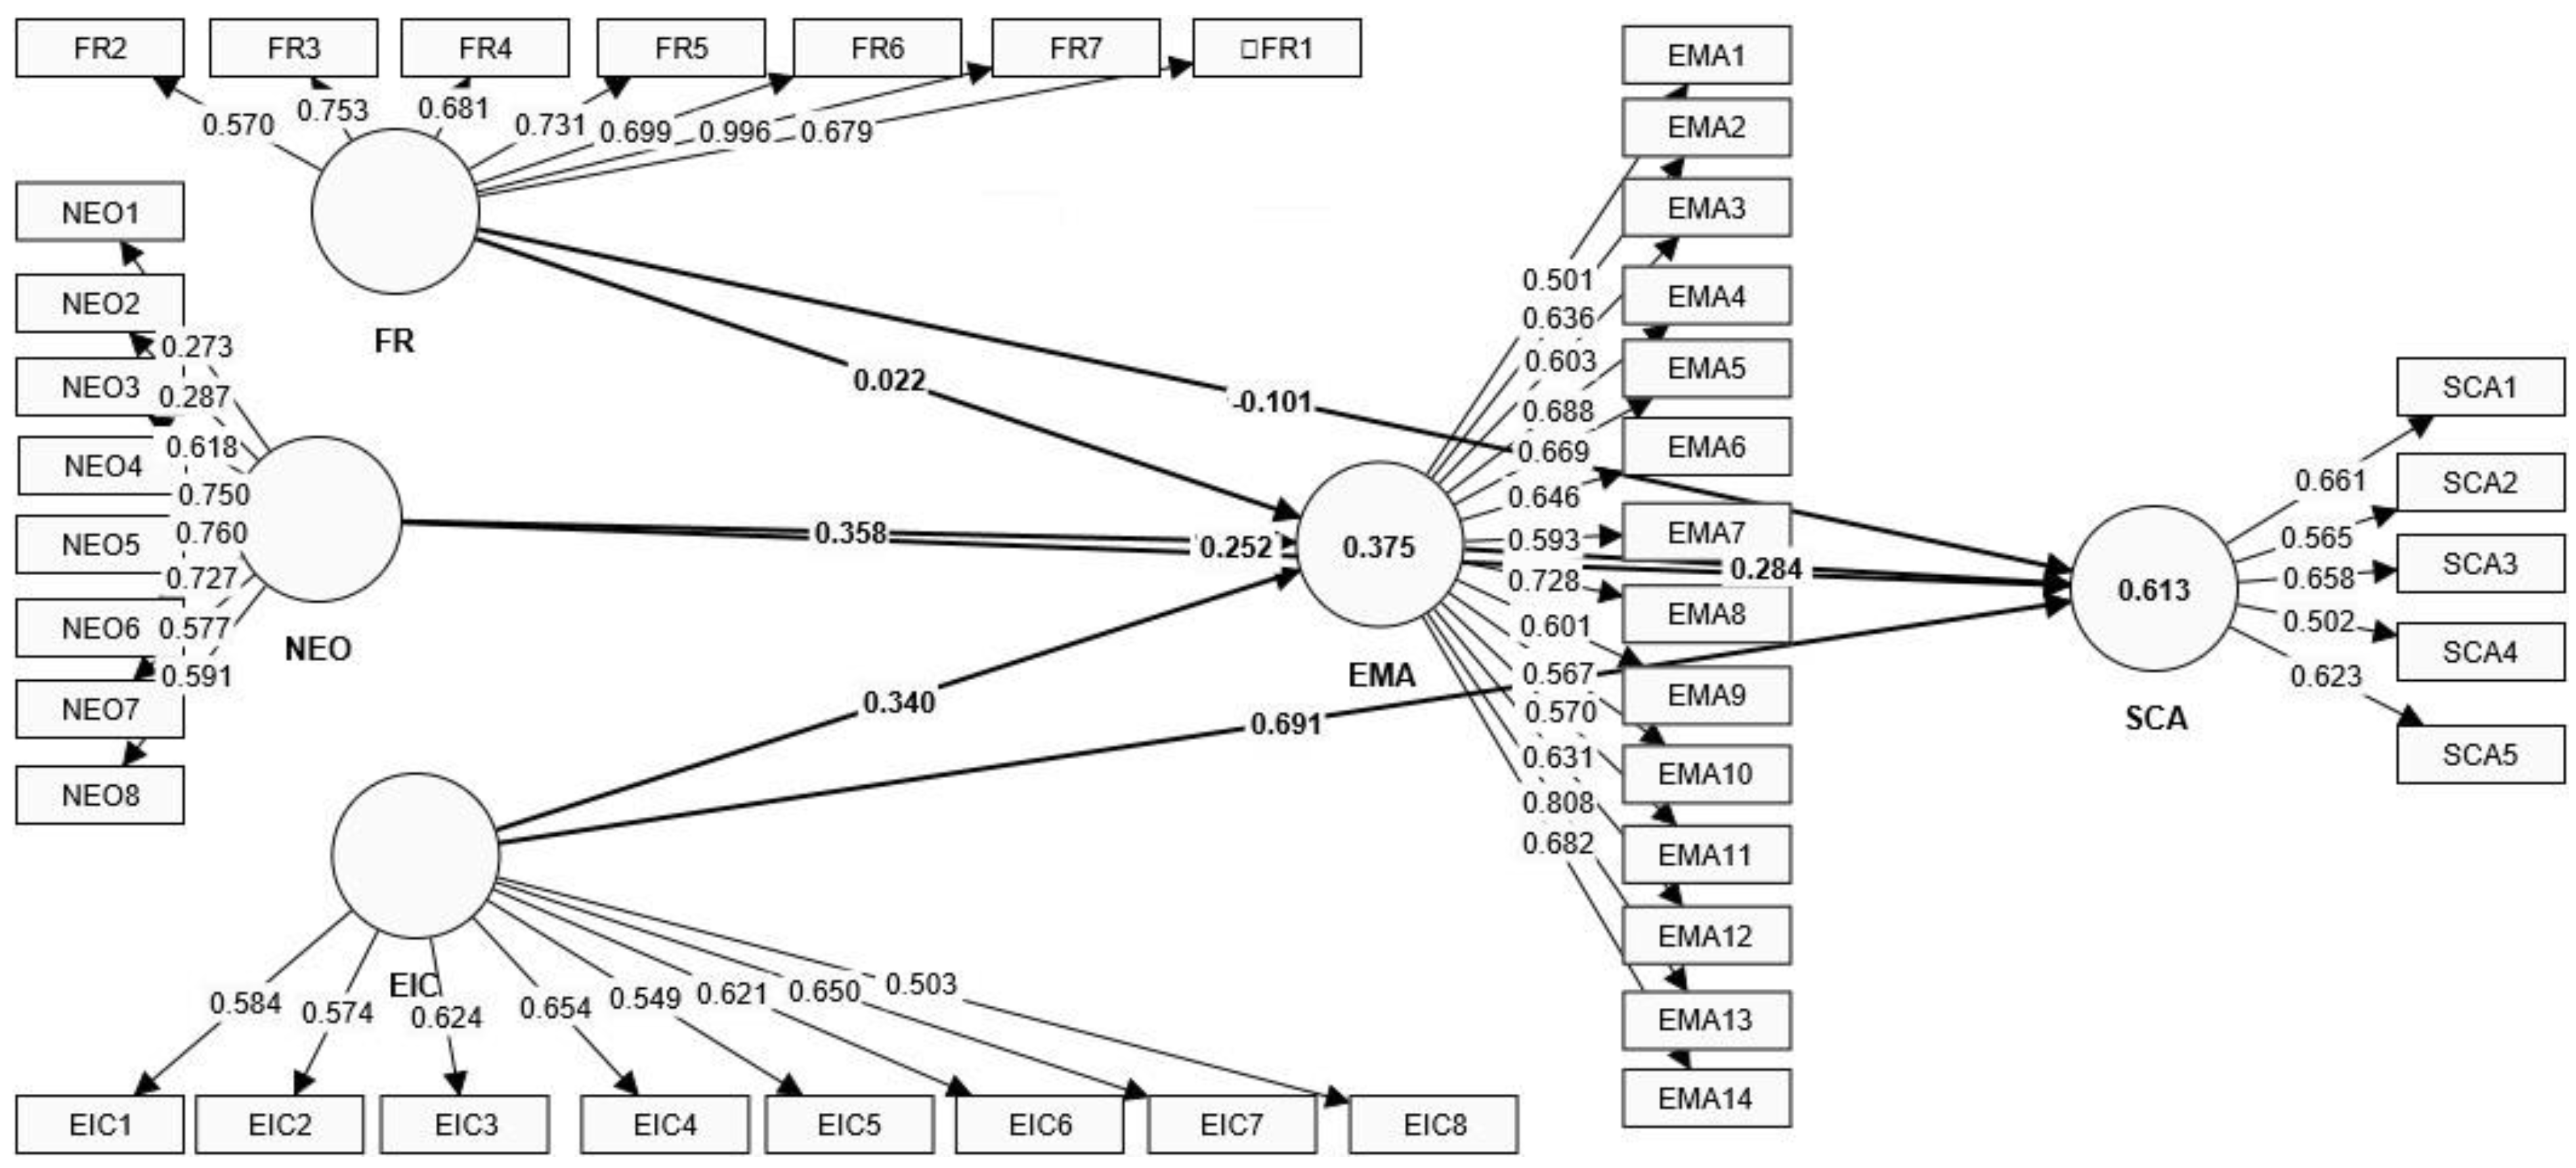
Table 1.
Characteristics regarding the respondents.
| Characteristics | Categories | Frequency | Percentage |
|---|---|---|---|
| Company’s year of establishment, | 0-5 | 21 | 10% |
| Between 5-10 | 39 | 19% | |
| Between 10-20 | 57 | 28 | |
| More than 20 | 89 | 43% | |
| Management Level | Junior management | 19 | 9.2% |
| Middle management | 89 | 43.2% | |
| Top management | 98 | 47.6% | |
| Experience Year | Less than a year | 5 | 2.4% |
| 1 - 5 years | 67 | 32.5% | |
| 6 - 10 years | 71 | 34.5% | |
| 11 - 20 years | 47 | 22.8% | |
| More than 20 years | 16 | 7.8% | |
| Type of Industries | Food | 101 | 49% |
| Metal | 11 | 5% | |
| Textiles | 18 | 8.5% | |
| Machinery | 1.5 | 1% | |
| Chemical | 5.5 | 2.5% | |
| Furniture | 3 | 1.5% | |
| Automobile | 1 | 1% | |
| Others | 65 | 31.5% | |
| Company Export Regions | Africa | 11 | 5.3% |
| Europe | 179 | 86.9% | |
| North America | 14 | 6.8% | |
| South America | 2 | 1% | |
| Export Share to Europe | KES 6 - 50 million | 50 | 24.3% |
| KES 51 - 1000 million | 156 | 75.7% |
Table 3.
Psychometric properties of measures.
| Construct | …+Items | Factor Loading | Cronbach’s Alpha | rho_A | Composite Reliability | AVE |
|---|---|---|---|---|---|---|
| FR | …+FR1 | 0.679 | 0.898 | 0.817 | 0.892 | 0.639 |
| …+FR2 | 0.570 | |||||
| …+FR3 | 0.753 | |||||
| …+FR4 | 0.681 | |||||
| …+FR5 | 0.731 | |||||
| …+FR6 | 0.699 | |||||
| …+FR7 | 0.996 | |||||
| NEO | …+NEO3 | 0.618 | 0.804 | 0.828 | 0.779 | 0.431 |
| …+NEO4 | 0.750 | |||||
| …+NEO5 | 0.760 | |||||
| …+NEO6 | 0.727 | |||||
| …+NEO7 | 0.577 | |||||
| …+NEO8 | 0.591 | |||||
| EIC | …+EIC1 | 0.584 | 0.810 | 0.817 | 0.813 | 0.434 |
| …+EIC2 | 0.574 | |||||
| …+EIC3 | 0.624 | |||||
| …+EIC4 | 0.654 | |||||
| …+EIC5 | 0.549 | |||||
| …+EIC6 | 0.621 | |||||
| …+EIC7 | 0.650 | |||||
| …+EIC8 | 0.503 | |||||
| EMA | …+EMA1 | 0.501 | 0.894 | 0.901 | 0.885 | 0.416 |
| …+EMA2 | 0.636 | |||||
| …+EMA3 | 0.603 | |||||
| …+EMA4 | 0.688 | |||||
| …+EMA5 | 0.669 | |||||
| …+EMA6 | 0.646 | |||||
| …+EMA7 | 0.593 | |||||
| …+EMA8 | 0.728 | |||||
| …+EMA9 | 0.601 | |||||
| …+EMA10 | 0.567 | |||||
| …+EMA11 | 0.570 | |||||
| …+EMA12 | 0.631 | |||||
| …+EMA13 | 0.808 | |||||
| …+EMA14 | 0.682 | |||||
| …+SCA1 | 0.661 | 0.739 | 0.747 | 0.740 | 0.493 | |
| …+SCA2 | 0.565 | |||||
| SCA | …+SCA3 | 0.658 | ||||
| …+SCA4 | 0.502 | |||||
| …+SCA5 | 0.623 |
Table 4.
The correlation matrix of the latent variables with the square root of the AVE displayed along the diagonal.
Table 4.
The correlation matrix of the latent variables with the square root of the AVE displayed along the diagonal.
| Construct | 1 | 2 | 3 | 4 | 5 |
|---|---|---|---|---|---|
| 1. EIC | 0.659 | ||||
| 2. EMA | 0.430 | 0.645 | |||
| 3. FR | 0.374 | 0.215 | 0.799 | ||
| 4. NEO | 0.424 | 0.450 | 0.263 | 0.657 | |
| 5. SCA | 0.419 | 0.223 | 0.288 | 0.170 | 0.702 |
Table 5.
Descriptive Statistics.
| Variables | Actual Range | Mean | Std. Deviation | |
|---|---|---|---|---|
| Minimum | Maximum | |||
| FR | 1 | 5 | 3.916 | 0.895 |
| NEO | 1 | 5 | 4.262 | 0.706 |
| EIC | 1 | 5 | 4.120 | 0.692 |
| EMA | 1 | 5 | 4.247 | 0.635 |
| SCA | 1 | 5 | 3.847 | 0.816 |
All variables are theoretically defined within the range of 1 to 5.
Table 6.
Collinearity Statistics Test.
| Constructs | Standardized Coefficients | Collinearity Statistics VIF | ||
|---|---|---|---|---|
| FR | 0.022 | 1.337 | ||
| NEO | 0.358 | 1.311 | ||
| EIC | 0.340 | 1.645 |
Table 7.
Path coefficients (direct effects).
| Hypothesis | Relationship | Coef (ß) | T-Value | P-value | Results |
|---|---|---|---|---|---|
| H1(a) | FR -> EMA | 0.022 | 0.249 | 0.804 | Not Supported |
| H2(a) | NEO-> EMA | 0.358** | 4.859 | 0.000 | Supported |
| H3(a) | EIC-> EMA | 0.340** | 4.536 | 0.003 | Supported |
| H4 | EMA-> SCA | 0.284** | 3.199 | 0.000 | Supported |
| R2 | EMA | 0.375 | |||
| R2 | SCA | 0.613 |
Note: ** Statistical significance at the 0.01 level with 2-tailed, and * indicate at the 1 percent and 5 percent level, respectively.
Table 8.
Path coefficients (mediating effects).
| Hypothesis | Relationship | Coef (ß) | T-Value | P-value | Results |
|---|---|---|---|---|---|
| H1(b) | FR -> EMA -> SCA | -0.101 | 0.824 | 0.410 | Not Supported |
| H2(b) | NEO-> EMA -> SCA | 0.252** | 2.768 | 0.006 | Supported |
| H3(b) | EIC-> EMA -> SCA | 0.691** | 6.378 | 0.000 | Supported |
Note: ** and * indicate statistical significance at the 1 percent and 5 percent level with 2-tailed, respectively.
Disclaimer/Publisher’s Note: The statements, opinions and data contained in all publications are solely those of the individual author(s) and contributor(s) and not of MDPI and/or the editor(s). MDPI and/or the editor(s) disclaim responsibility for any injury to people or property resulting from any ideas, methods, instructions or products referred to in the content. |
© 2025 by the authors. Licensee MDPI, Basel, Switzerland. This article is an open access article distributed under the terms and conditions of the Creative Commons Attribution (CC BY) license (http://creativecommons.org/licenses/by/4.0/).
Copyright: This open access article is published under a Creative Commons CC BY 4.0 license, which permit the free download, distribution, and reuse, provided that the author and preprint are cited in any reuse.


