Preprint
Article

This version is not peer-reviewed.

Grab Sampling or Passive Samplers? A Comparative Approach to Water Quality Monitoring

Submitted:

29 December 2025

Posted:

30 December 2025

You are already at the latest version

Abstract

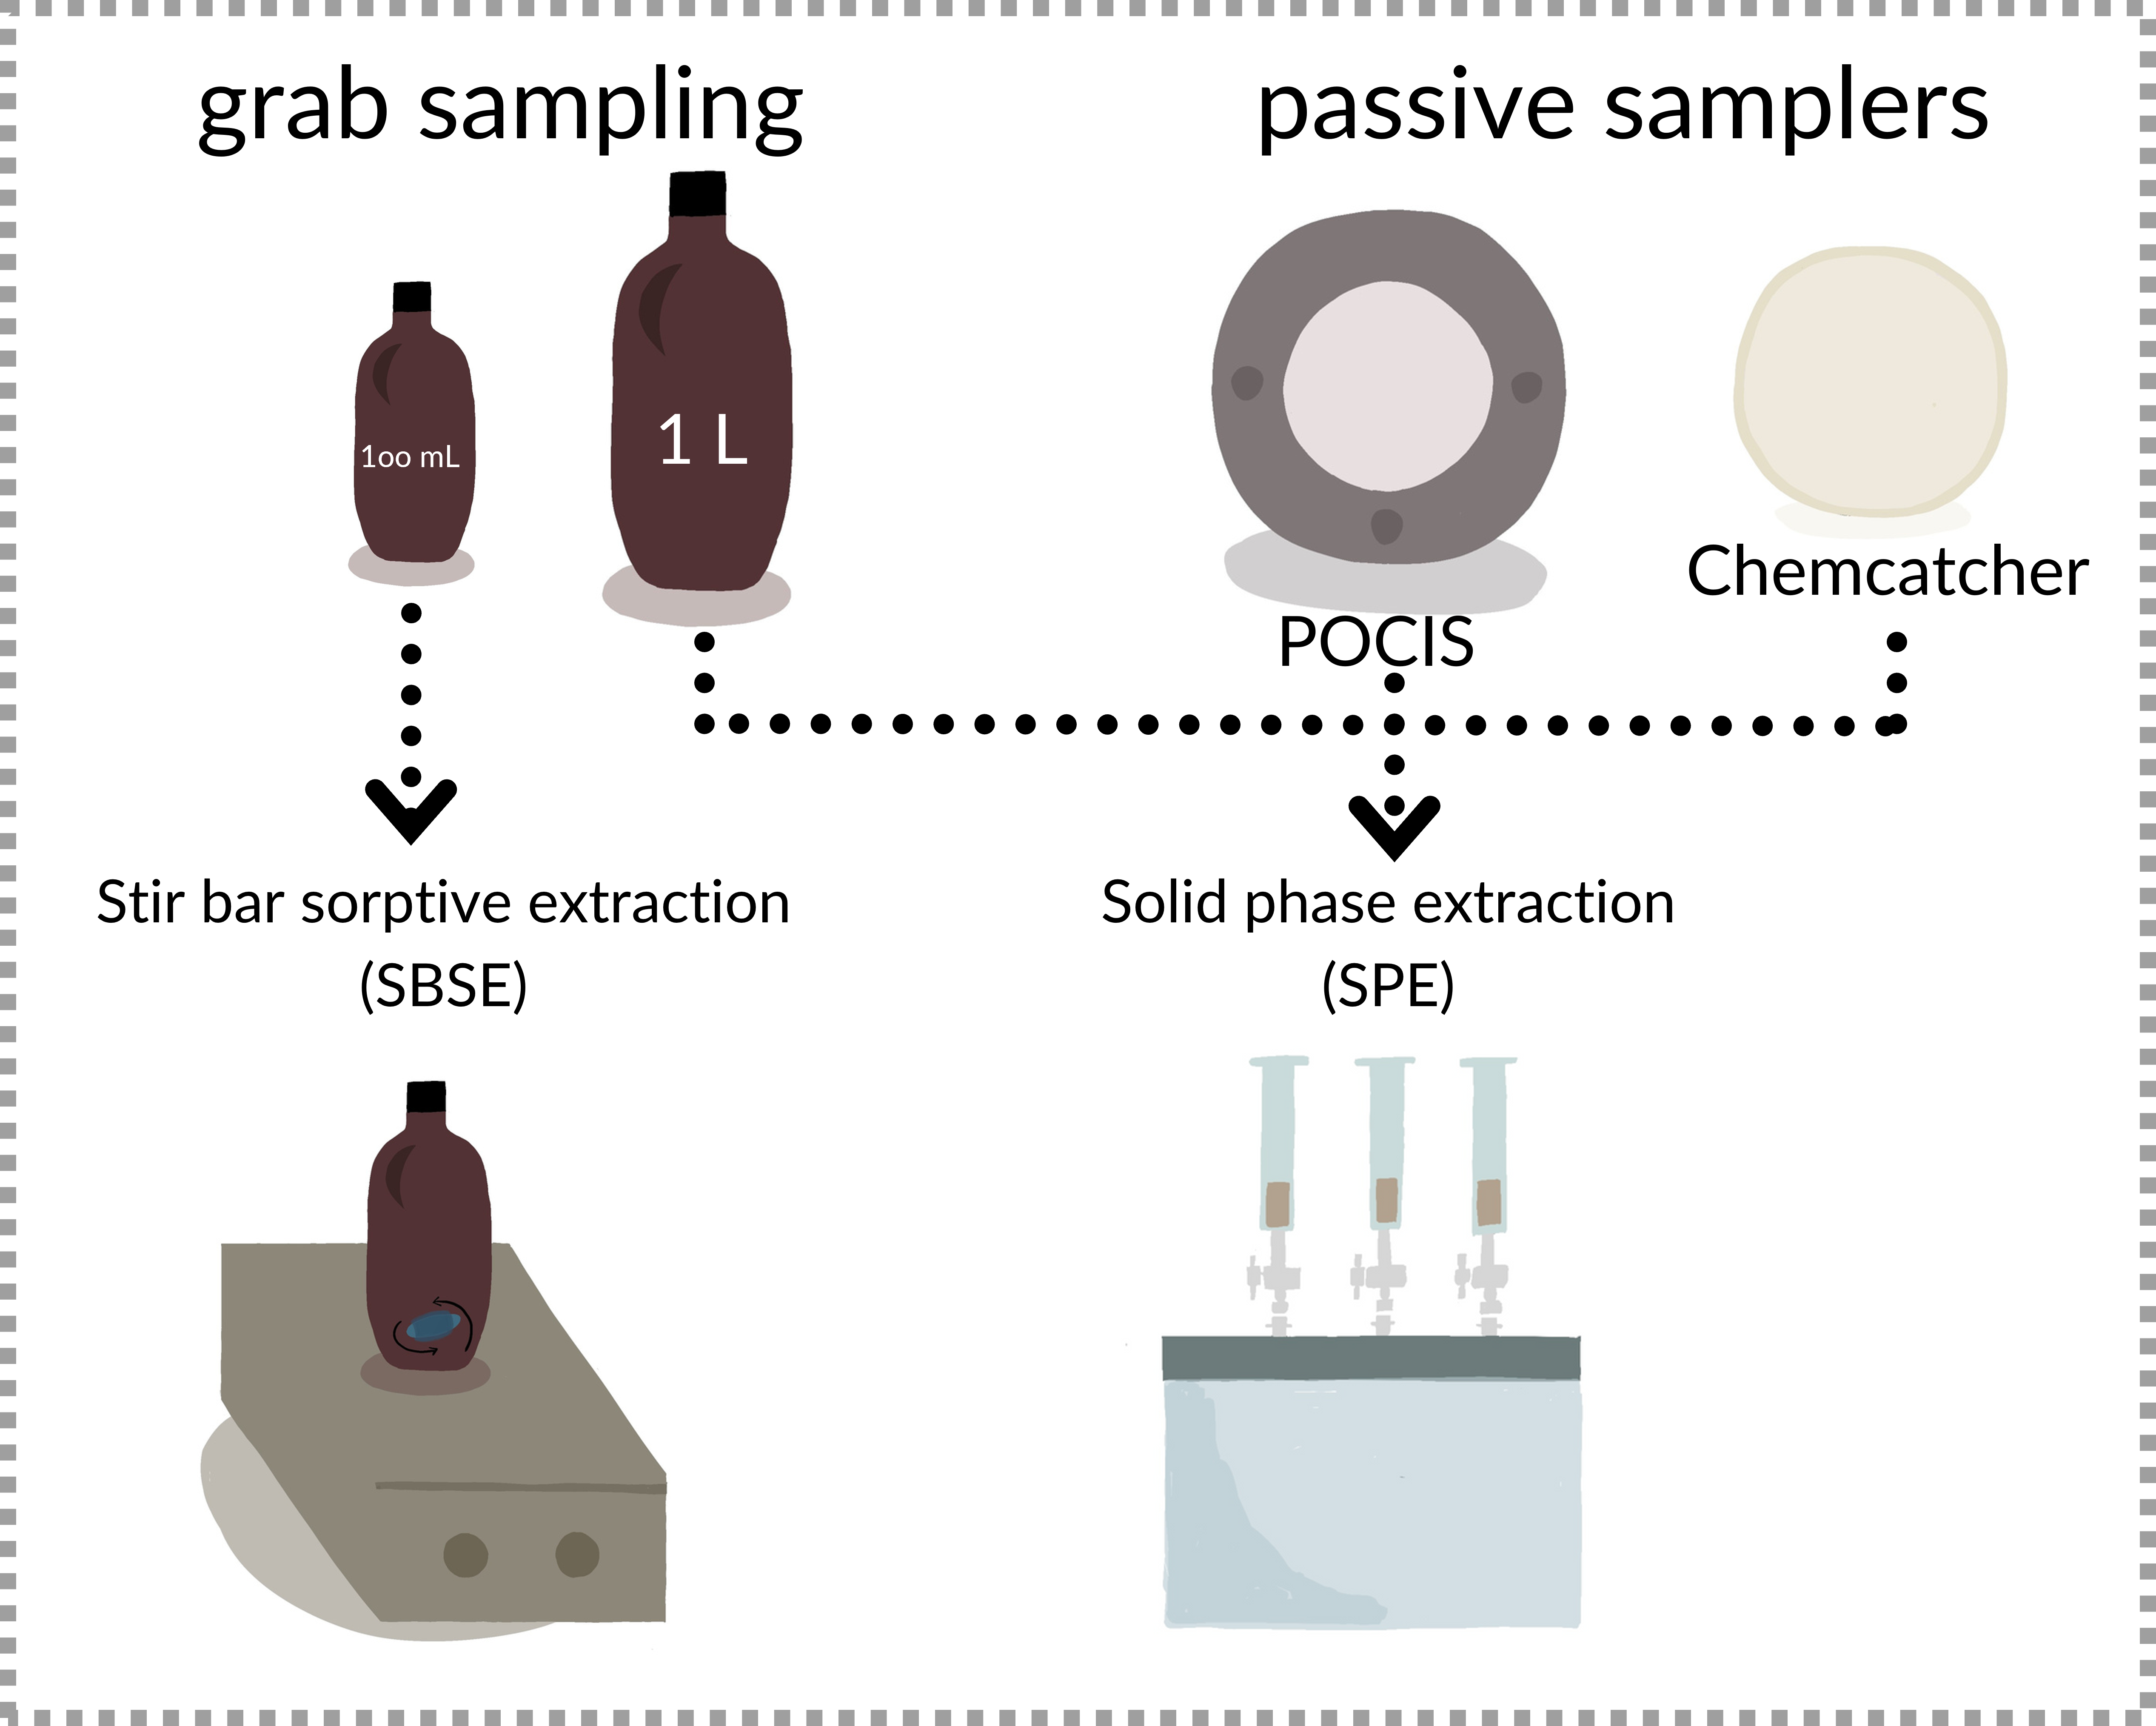
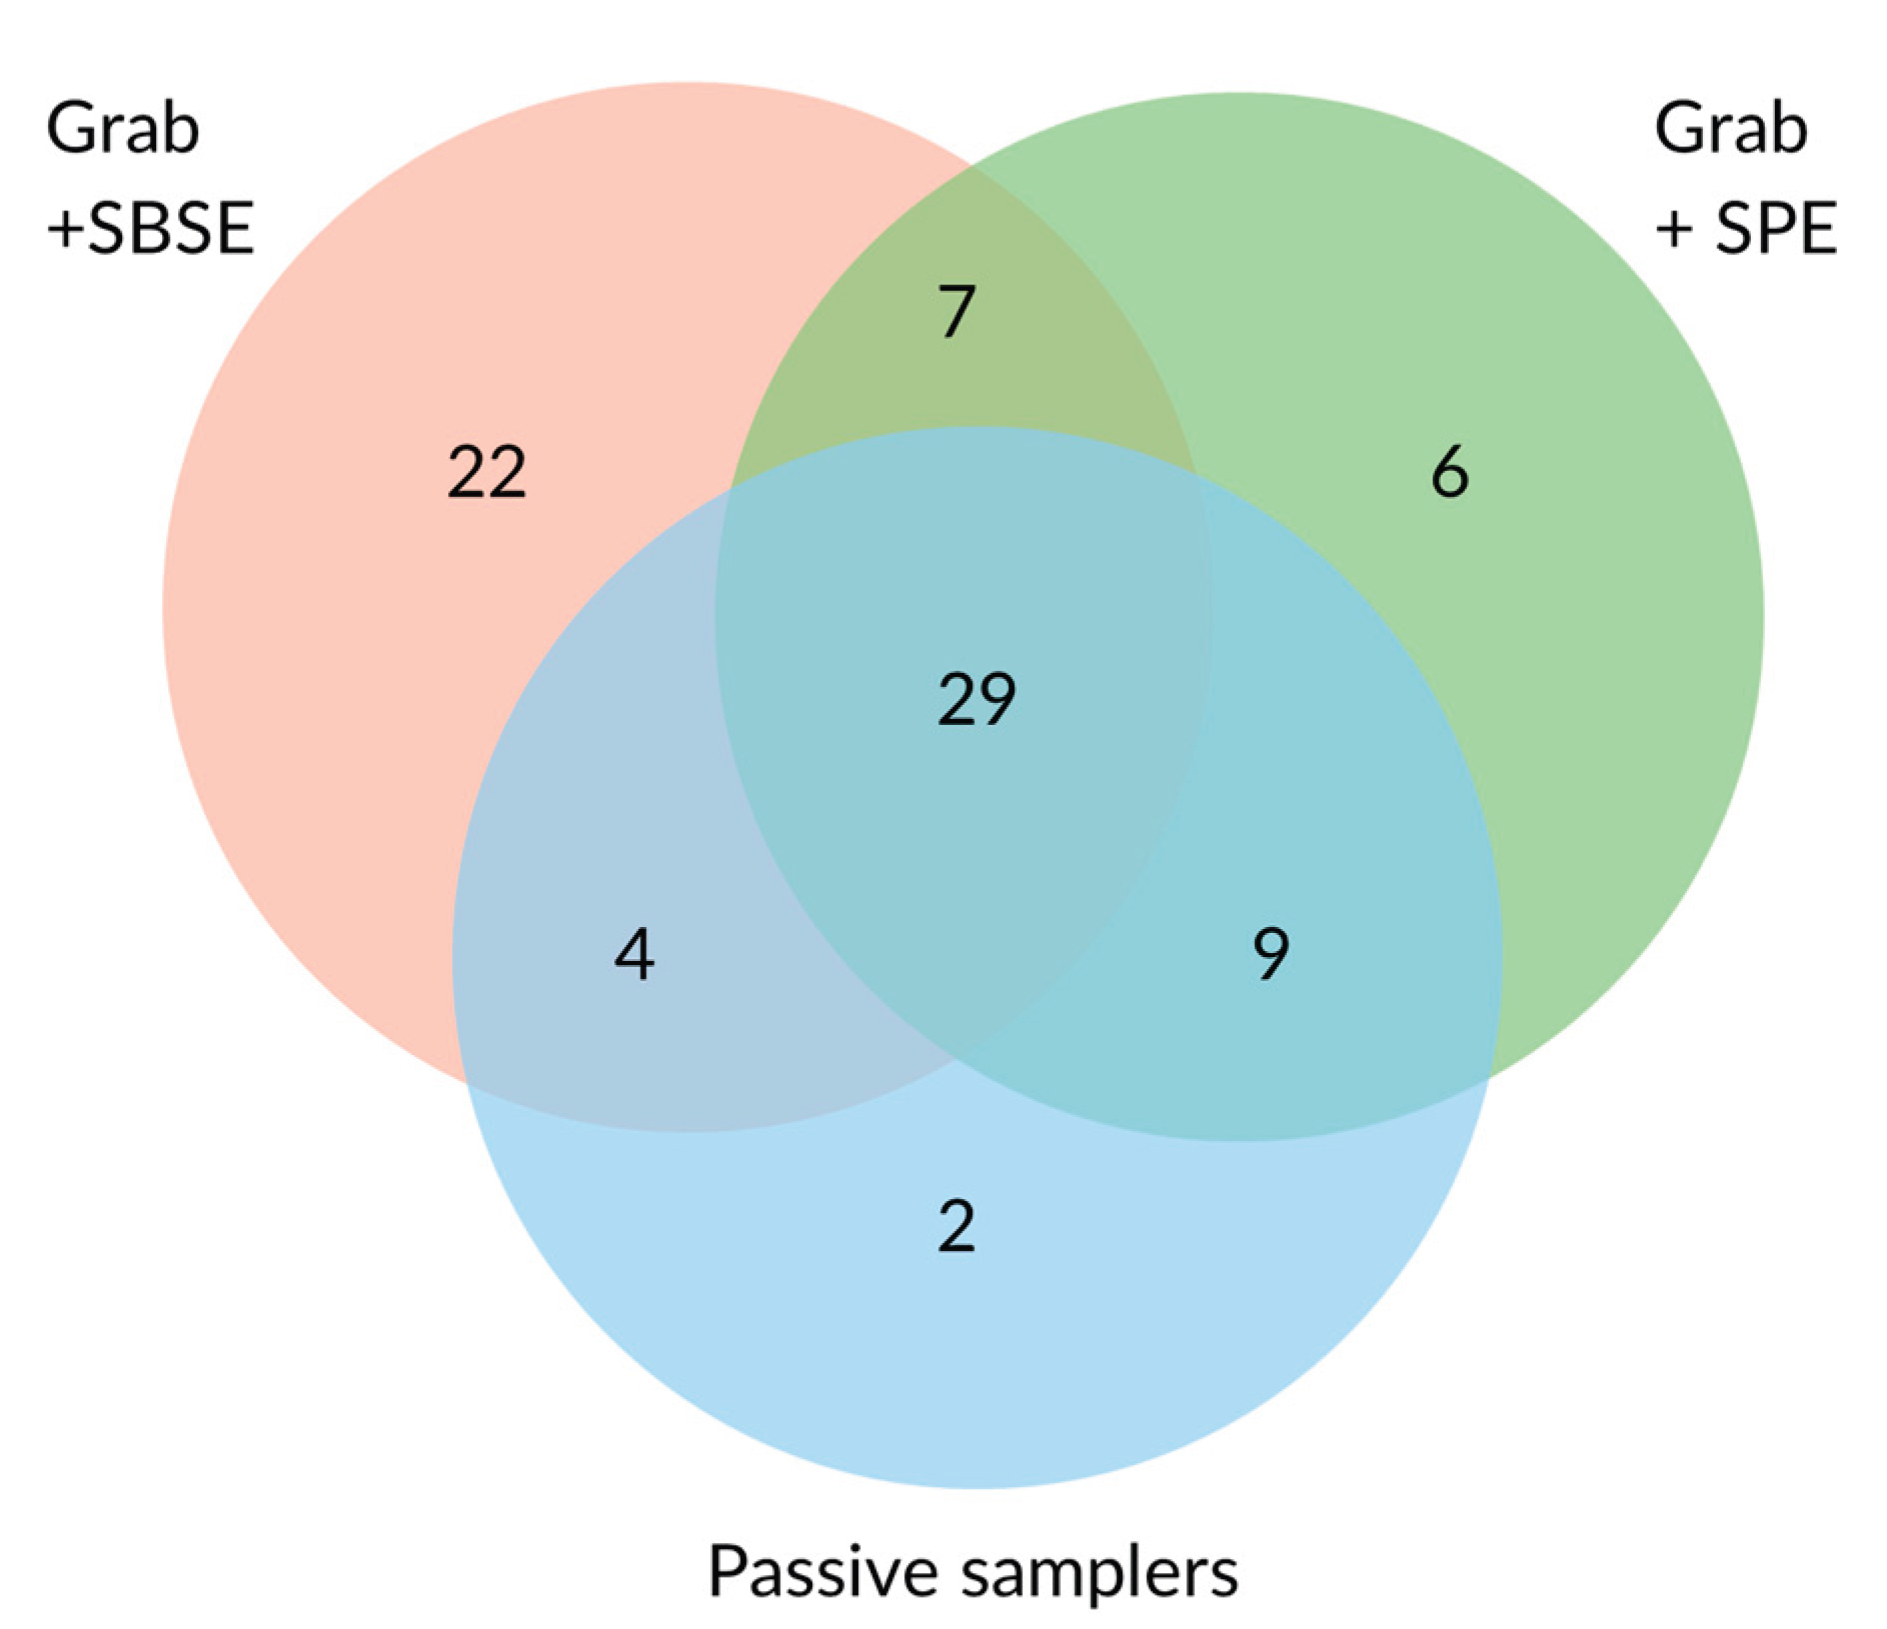
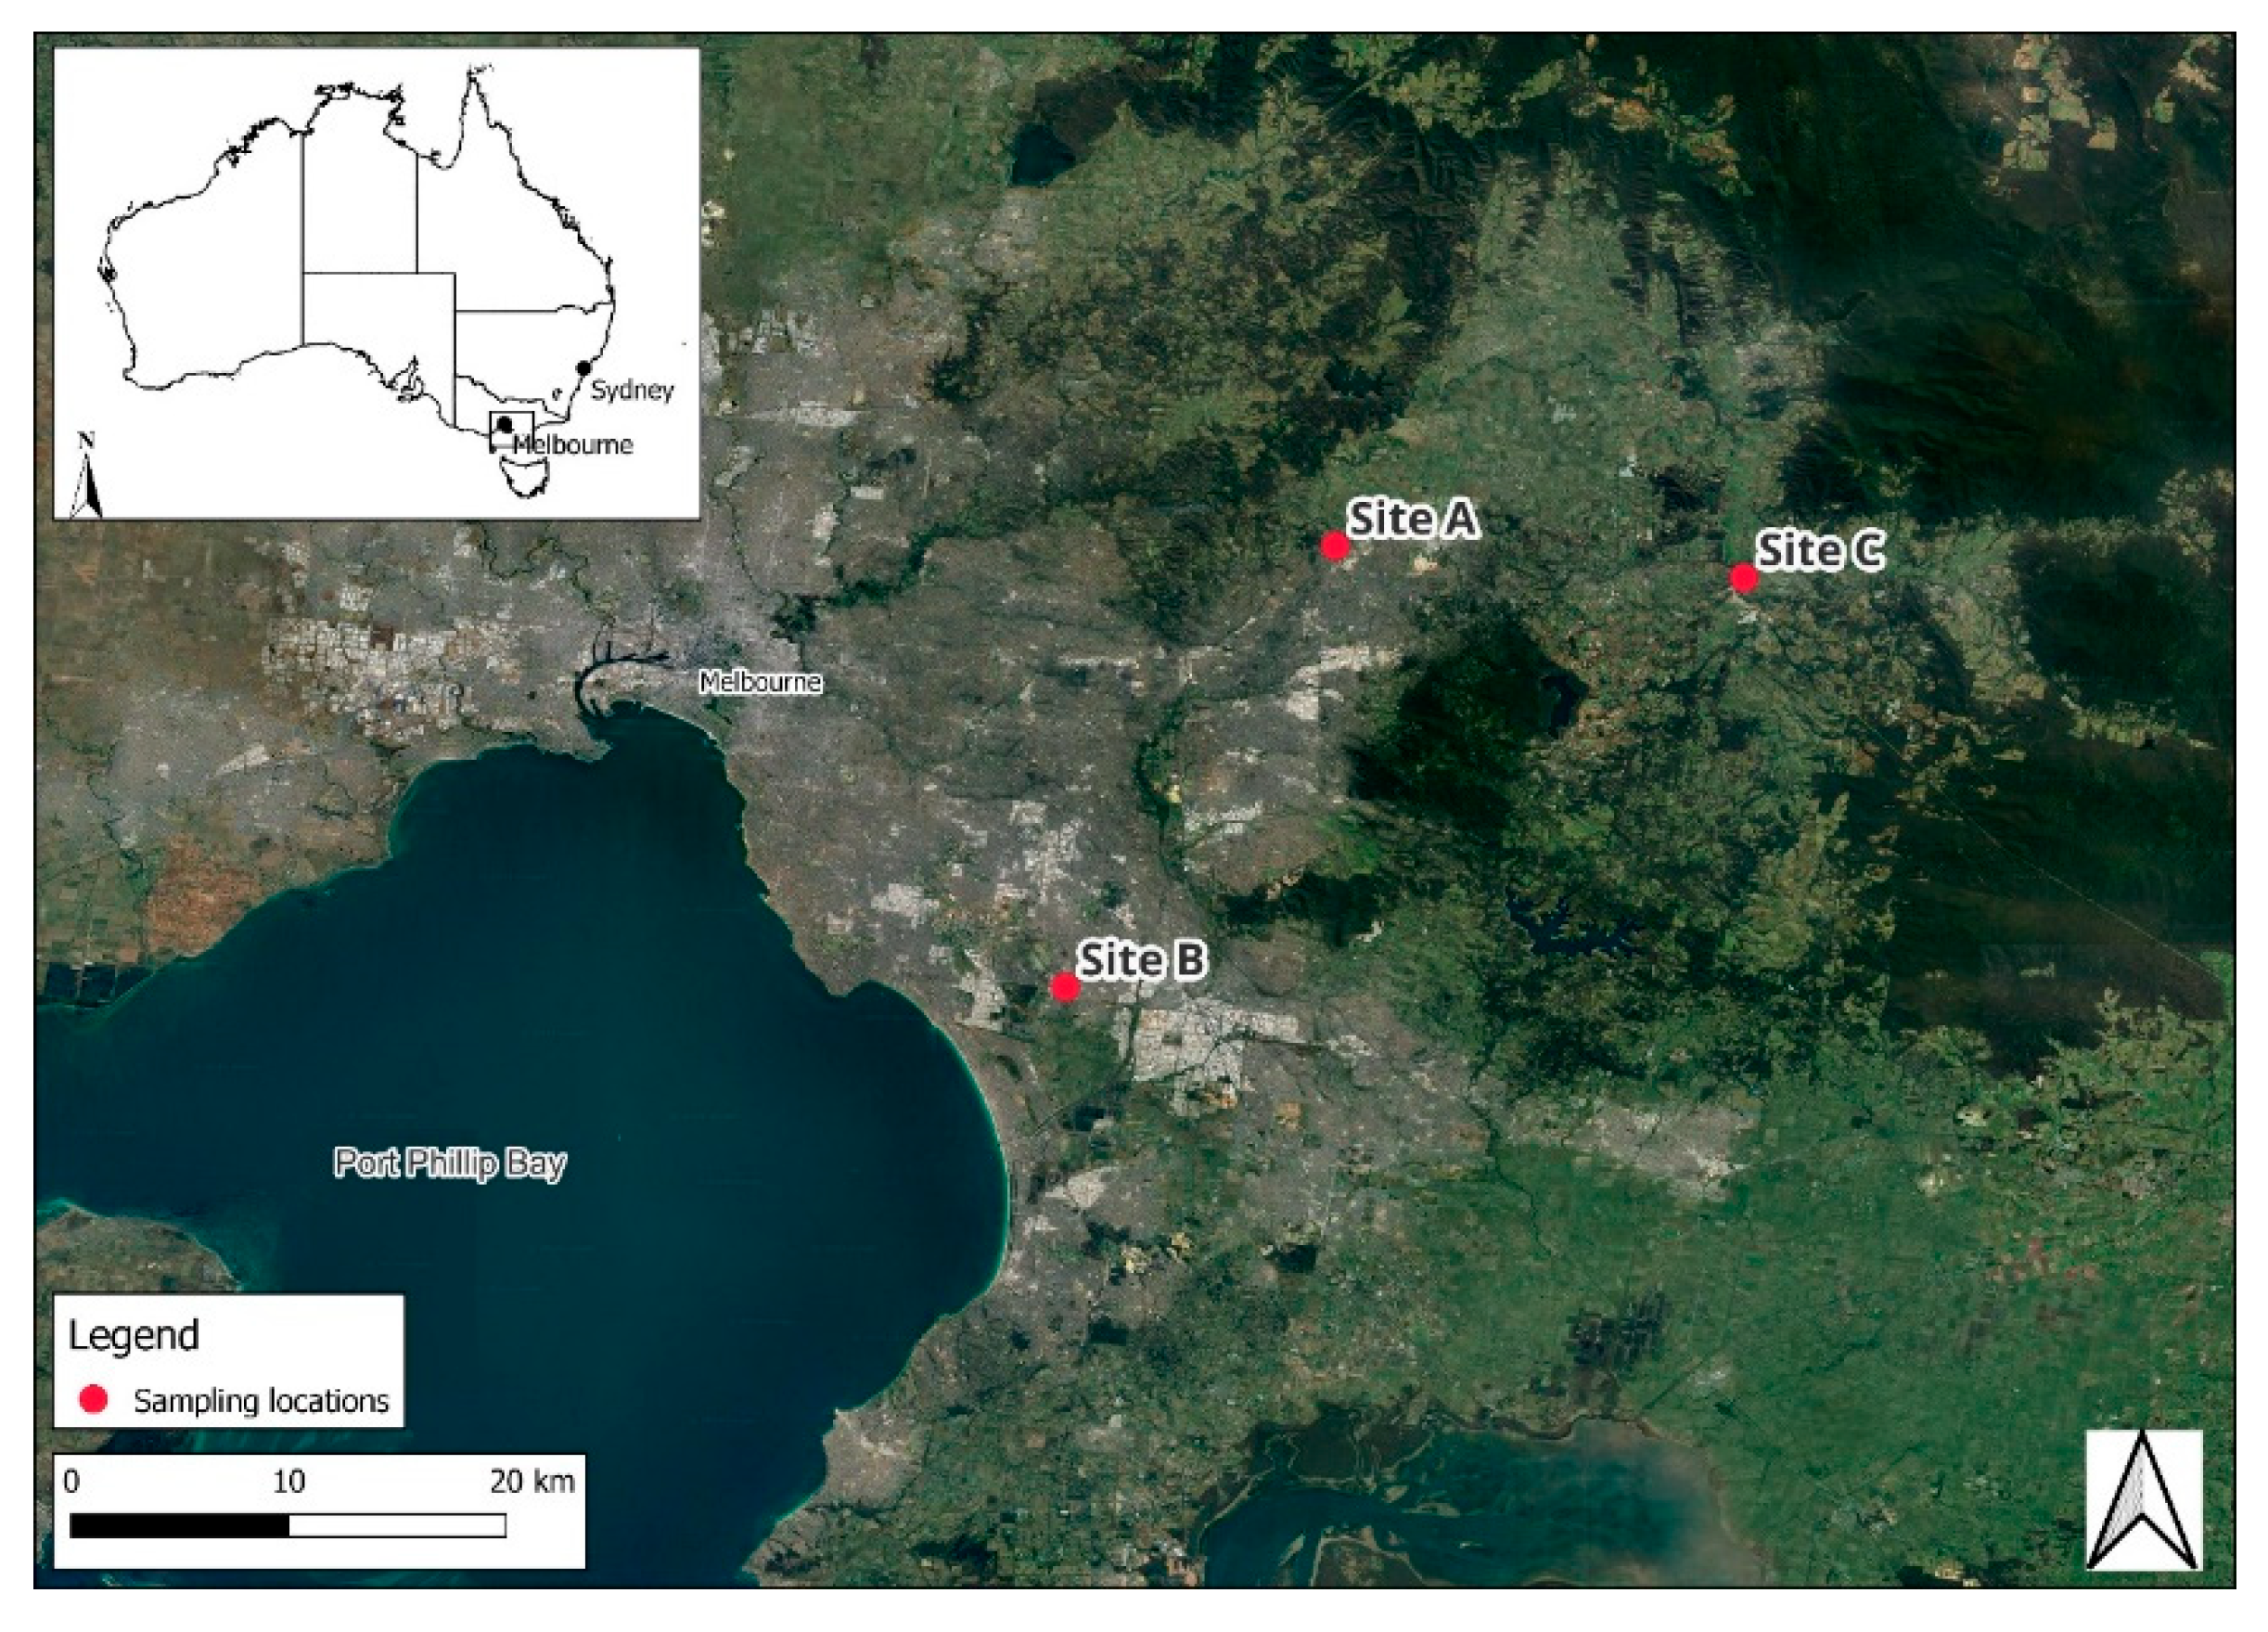
Pesticide contamination poses significant threats to both humans and the environment, with residues frequently detected in surface waters worldwide. This study compares the effectiveness of passive samplers (POCIS and Chemcatcher), and grab sampling coupled with Stir Bar Sorptive Extraction (SBSE) and Solid Phase Extraction (SPE) for monitoring pesticides in surface waters. The comparative study was conducted at three sites in Victoria, Australia, representing different land uses. A total of 230 pesticides were screened, with 79 different pesticides detected overall. SBSE extracted the highest number of pesticides from grab samples, followed by SPE and passive samplers. The study highlights the complementarity of different sampling and extraction techniques in detecting a wide range of pesticides. The study also explores the suitability of these techniques for citizen science applications, emphasizing the importance of selecting appropriate methods based on specific research objectives and available resources. The findings underscore the need for a tiered approach, combining passive samplers for initial screening and grab sampling for quantitative analysis, to develop a robust monitoring strategy for protecting water quality.

Keywords: 
;  ;  ;  ;  

1. Introduction

Pesticide contamination poses a significant threat to both humans and the environment [1]. Many pesticides are persistent, toxic and prone to bioaccumulation [2]. Their intensive and widespread application in agricultural and urban settings has led to substantial environmental and health concerns. Documented human health impacts range from acute intoxication to chronic diseases, including several cancers, Alzheimer’s disease, Parkinson’s disease, infertility, leukemia and diabetes [1]. Environmental impacts are equally concerning: pesticide runoff from agricultural and urban areas contributes to soil degradation, biodiversity loss, and contamination of aquifers [1].
Recent studies have consistently detected pesticides in surface waters worldwide. A global review revealed the frequent occurrence of atrazine and its metabolites, metolachlor, chlorpyrifos and tebuconazole, at concentrations capable of causing adverse health consequences [3]. Pesticides also frequently occur as mixtures, which are challenging to assess and may exert synergistic toxicity exceeding that of individual compounds [3]. The problem is exacerbated by the steady increase in pesticide use and sales over the last 50 years [4,5]. In Australia alone, approximately 10,000 pesticide products were sold in 2024, with a total market value of AUD 4 billion [6]. Around 2,000 active ingredients are currently authorized for use in the country [7], including compounds banned in many other countries such as atrazine, simazine, terbacil, and metolachlor [7,8]. Despite this large number, only a small subset is routinely monitored in water. For instance, the Australian Government’s National Measurement Institute (NMI) screens for approximately 230 pesticides [9].
The escalating use of pesticides and increasing human and ecosystem exposure underscore the need for more effective monitoring of pesticides in surface waters. Wide-screening methods and the incorporation of alternative data sources can enhance pesticide prioritization, enabling monitoring schemes that are more region-specific, feasible and fit-for-purpose. The choice of the monitoring techniques depend largely on the characteristics of target compounds, source water properties [2], and the availability of human, laboratory and financial resources [10].
Passive sampling approaches offer a cost-effective, long-term monitoring option. Devices such as the Polar Organic Chemical Integrative Sampler (POCIS) and Chemcatcher accumulate contaminants on different absorbing materials, such as membranes and bulk sorbents, over extended deployment periods, usually ranging from 10 to 30 days [11]. These methods have been successfully applied in south-eastern Australia. For example, [12] detected 21 pesticides across 22 waterways, with the greatest number of pesticides occurring in streams receiving runoff from intensive agriculture. Similarly, [13] reported up to 70 pesticides in more than 100 urban wetlands in Melbourne, Australia. Passive samplers are lightweight, require only two site visits (deployment and retrieval) and provide a more representative picture of fluctuating contamination compared to traditional grab sampling [13,14]. However, challenges include potential loss or vandalism of deployed devices as well as site-specific deployment considerations [2]. While passive samplers integrate larger volumes of water, can capture ultra-trace level contaminants and transient contamination events, calibration remains complex, and results cannot be compared to environmental quality standards guidelines or regulations [13]. [15] reported poor agreement between POCIS and grab sample concentrations of Endocrine Disrupting Chemicals (EDCs), limiting the acceptance of passive samplers as standalone monitoring tools under the European Union Water Framework Directive [2]. In contrast, grab-sampling provides quantitative concentrations aligned with regulatory guidelines, but is limited to small discrete water volumes, that may not capture temporal variability. Furthermore, pre-concentration and extraction procedures, such as SPE, often require large volumes of solvents or sample [10,16]. Newer micro-extraction methods, such as Stir Bar Sorptive Extraction (SBSE), address some of these limitations by reducing solvent requirements and simplifying workflows, while maintaining high analytical sensitivity [17].
Alternative data sources are also gaining attention. Citizen science is increasingly recognized by international and national organizations as a more cost-effective and socially beneficial approach to water quality monitoring [18,19,20,21,22]. Citizen science is deemed relevant in water quality monitoring because it can support generating valuable data, at a higher spatial and temporal resolution than traditional monitoring [21]. Furthermore, many are positive impact of citizen science on society. Citizens’ involvement raises environmental awareness, connects communities and policymakers and fosters well-being [23,24,25]. Most existing citizen science for water quality programs focus on simple on-site measurements, such as pH, turbidity, and nutrients [26,27,28]. To date, only two initiatives - Pesticide Detectives by RMIT Aquatic Environmental Stress Research Group (AQUEST) [29] and Pesticide Watch by Deakin University [30] have tried to integrate pesticide screening with citizen science. This highlights the opportunity to further evaluate the potential of applying advanced monitoring methods, such as passive samplers and micro-extraction techniques, in citizen science contexts.
Although several studies have examined the complementarity of passive samplers and their comparison with grab-sampling coupled with SPE [11,13,31,32], far fewer have evaluated passive samplers against SBSE for pesticide monitoring in surface waters [33]. Moreover, no study has systematically compared these methods across dimensions such as sampling time, compound selectivity, sample preparation and processing requirements, material use, and logistical practicality, especially in citizen science applications. Therefore, this study aims to (1) Evaluate the effectiveness of different sampling (three passive samplers and grab sampling) and extraction techniques (SBSE and SPE), (2) Determine advantages and disadvantages of grab and passive samplers (3) Assess the practicality, accessibility, and methodological suitability of these techniques for potential application in citizen science. The baseline comparison described in this paper provides insightful assessments of different techniques for “The Gems of Water” initiative [34], a joint initiative between RMIT AQUEST in Australia and the European Commission's Joint Research Centre (JRC), designed to deepen the understanding of pesticide occurrence in water through citizen science.

2. Results and Discussion

2.1. Performance of the Different Sampling and Extraction Methods in Terms of Pesticides Detected

79 different pesticides have been detected overall. Most compounds were extracted from grab-samples by SBSE (62), followed by SPE (51), and by passive samplers (44) (Figure 1). More on the comparison between SPE and SBSE extracted samples can be consulted in [35]. POCIS detected highest number of pesticides amongst the passive samplers (40), followed by Chemcatcher with SDB disks (37). The lowest number of pesticides were detected with Chemcatcher with HLB disks (31). Only around half of the pesticides detected by SBSE and by SPE were picked up by the passive samplers. Among the pesticides detected in all SBSE and SPE extracted samples, 54.4% and 87.5%, respectively, were detected by all passive samplers. The highest percentage of concordance between grab-samples SPE and passive samplers might be linked to the common use of HLB as sorbent material. Of the compounds found in less than 60% of SBSE and SPE extracted weekly samples, only 24.1% and 30% were detected by all passive samplers, respectively. Higher frequency of pesticides extracted in grab samples somewhat corresponded to a higher number of compounds being detected in parallel by passive samplers, probably due to the higher concentrations at which those compounds occur or due to a more consistent pollution over the weeks.
Among the compounds not detected by the passive samplers, the majority were detected at trace levels (0.1 – 8.5 ng/L). About 10 of those pesticides had Log Kow > 5. Conversely, 11 compounds extracted by the passive samplers were not detected by the SBSE. These compounds are relatively polar with an average Log KOW of 2.9. Only two compounds extracted by passive samplers were not extracted by SPE. SPE is performed with HLB cartridges, thus employing the same sorbent medium as Chemcatcher with HLB disks and POCIS. Most compounds detected by passive samplers were commonly detected among the three samplers.
According to Table 1, median Log Kow and the Log Kow 1st quartile are similar for compounds detected by passive samplers, while SBSE and SPE have slightly higher median and quartile value. 75% of compounds detected by SBSE have a log Kow above 5.3.
[31] reports higher median Log Kow of pesticides detected by POCIS (4.6) than by Chemcatcher with SDB disks (3.2). No such difference was reported in our study, for which median Log Kow of detected compounds is by 3.7 for both techniques. POCIS ideal polarity range is reported to be between 0 and 4 [36], while Chemcatcher SDB disks have been reported to extract compounds in the hydrophobicity range between 2 and 6 [37]. Chemcatcher HLB disks use the same absorbent material as POCIS and might therefore be more efficient in the extraction of semi-polar to polar compounds, while overcoming the possible POCIS solvent loss due to its bulky nature, which reduces the active sampling area [12]. The pesticides screen used in this study, which includes compounds with median Log Kow of 4.0 and with 75 % of compounds have log Kow > 3.4 could have played a role in the lower numbers of detected pesticides by passive samplers than by grab-samples. Ultimately, various studies have confirmed complementarity of POCIS and Chemcatcher, in terms of type of pesticides detected [12,13,31] supporting the use of multiple passive samplers to increase the screening capacity. These first observations hint at a complementarity among SBSE, SPE extracted grab samples and passive samplers. SBSE appears to extract more compounds at trace levels, while SPE and passive samplers, extract compounds of wider polarity, thanks to their common absorbent material (HLB).

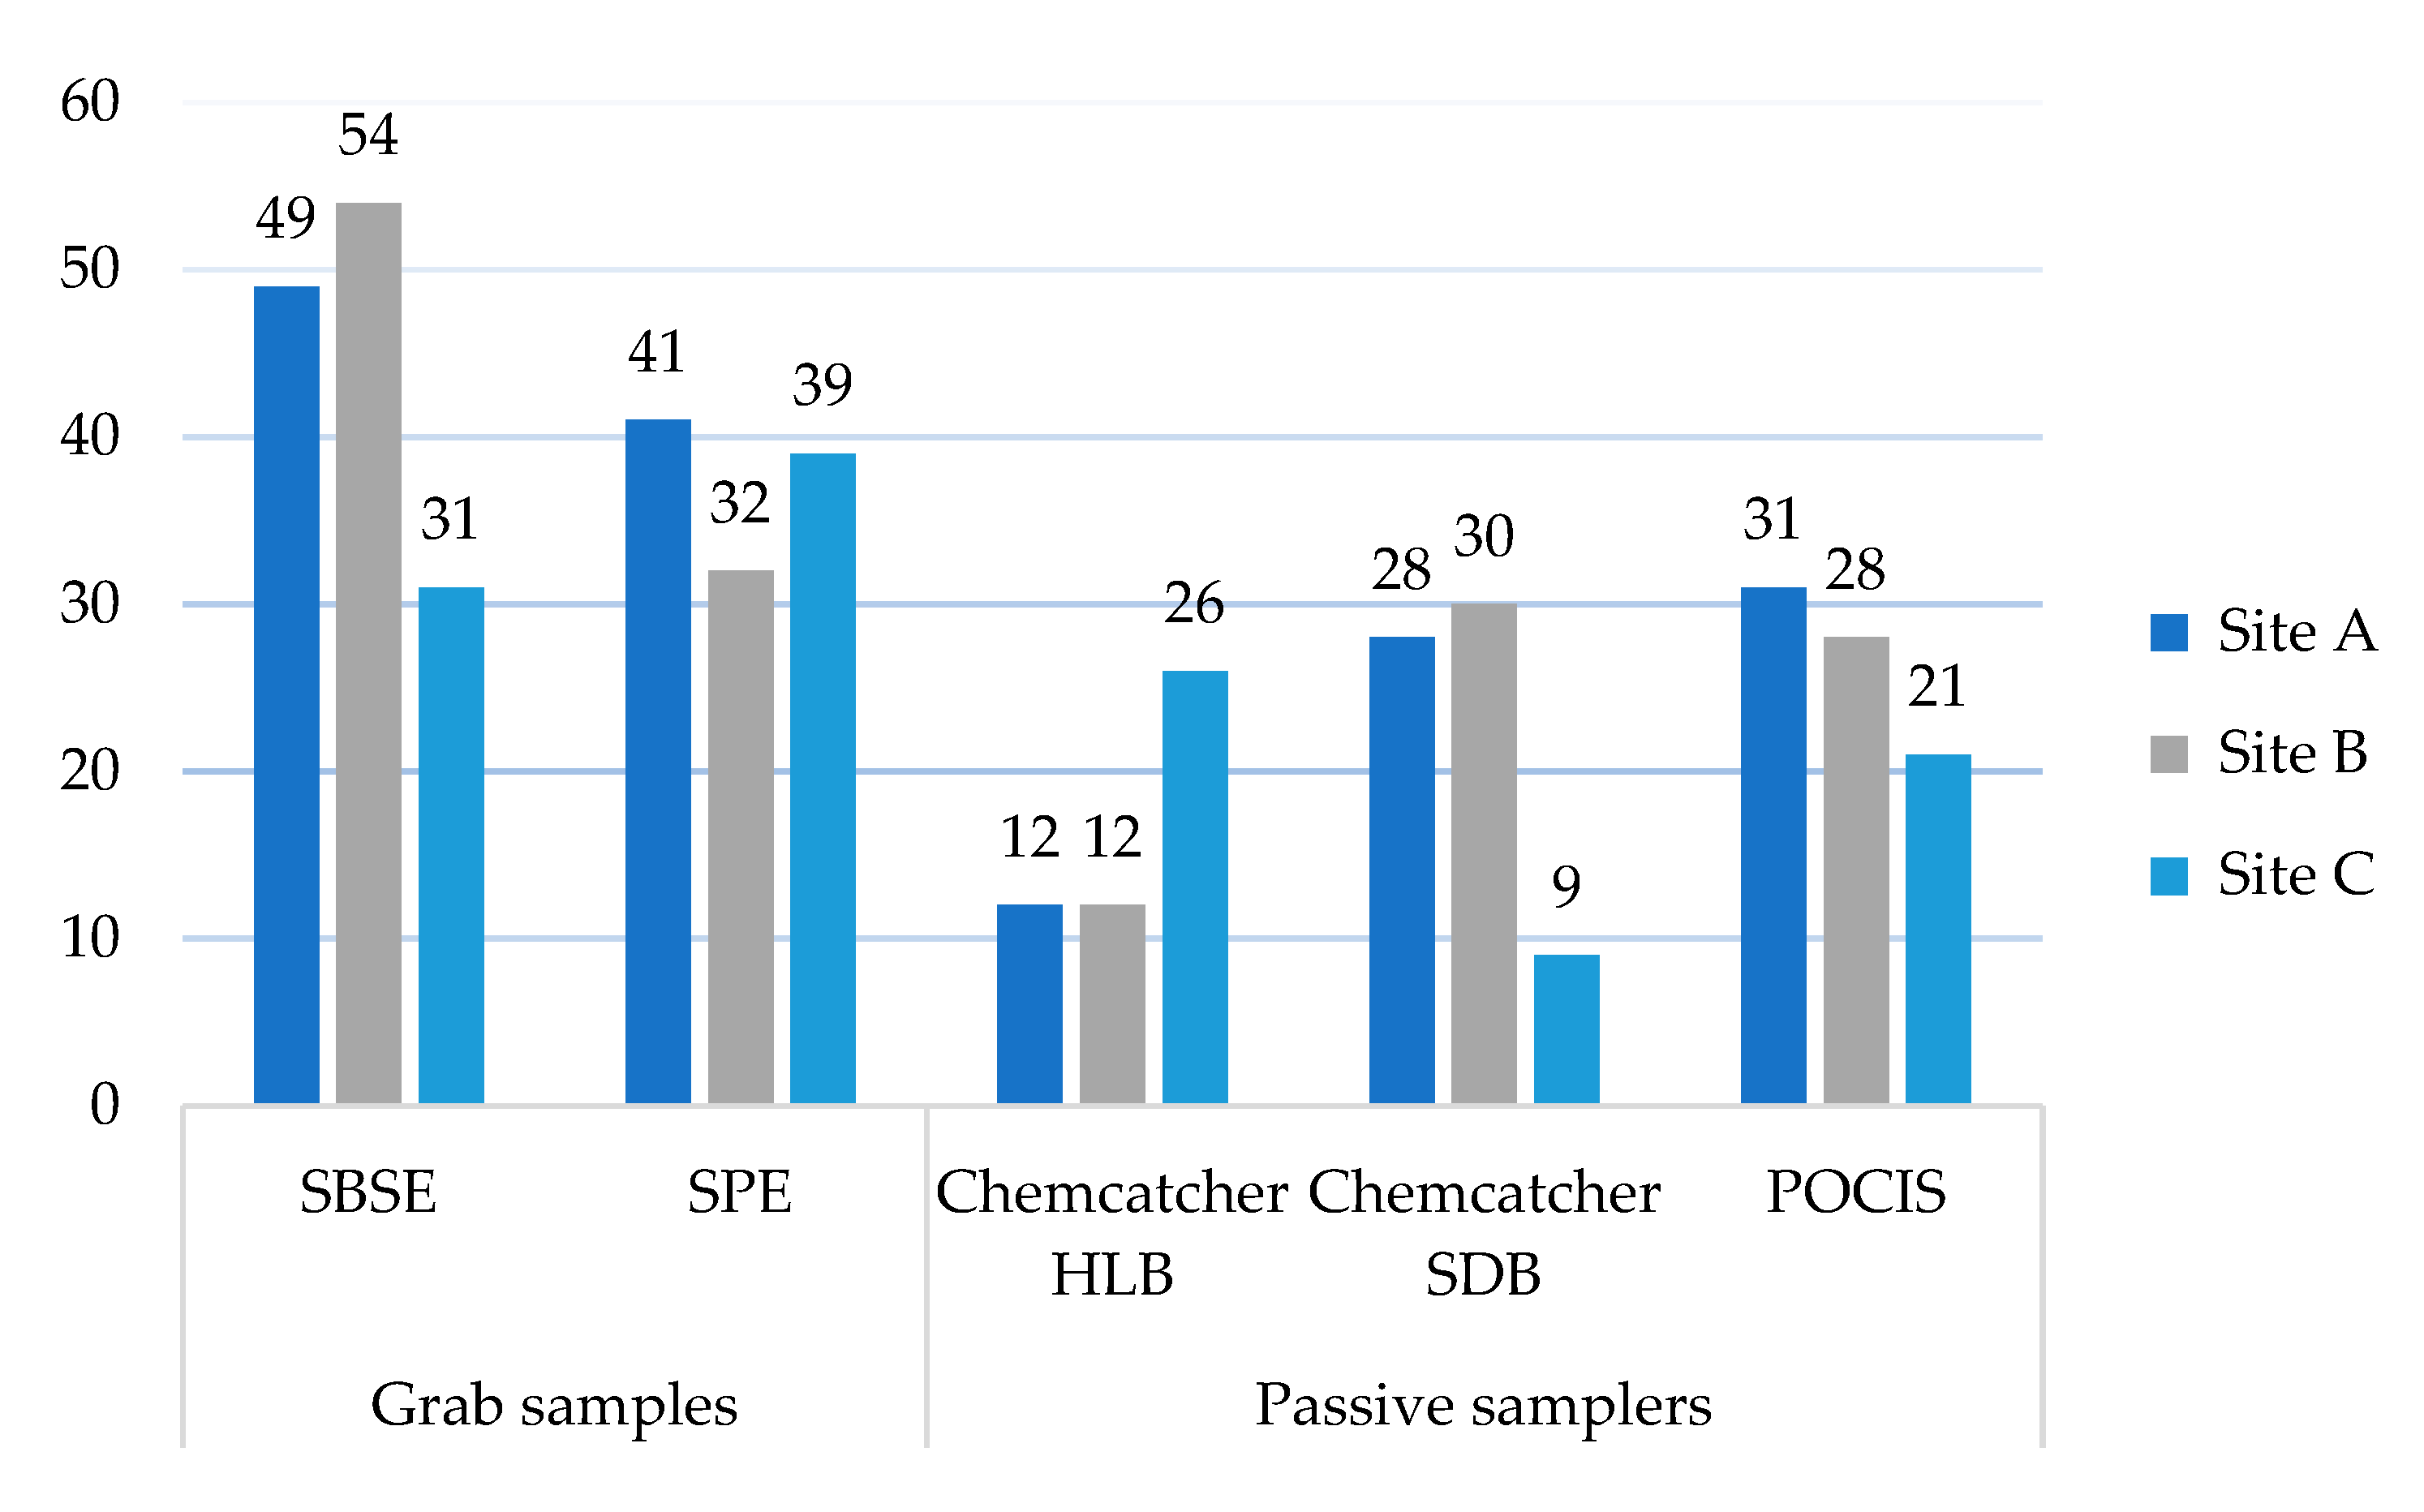
2.2. Performance at the Different Sampling Sites

In terms of performance of the different sampler types at the sites (Figure 2). The complete list of compounds found at each site, above LOQ, with indication of frequency for multiple grab-sampling event can be consulted in Table S3, of the Supplementary Material. At Site A and B, grab samples extracted the highest number of pesticides, SBSE (49; 54) and SPE (41; 32). The passive samplers count is similar, at the two sites, for POCIS and Chemcatcher with SDB disk (28-31). Chemcatcher with HLB disks detected around 10 pesticides (12) less than the other passive samplers at Site A and B. Unlike the other sites, site C had a more even distribution of pesticides extracted among grab and passive samplers. In grab samples, 31 and 39 pesticides were extracted respectively with SBSE and SPE. Notably, Chemcatcher using HLB disk performed best at site C, detecting up to 25 pesticides, in comparison to Chemcatcher with SDB disks (9) and POCIS (21). This might be linked to the matrix condition at the site or to desorption mechanisms, as it has been observed for SBSE [35]. Indeed, Site C reported a turbidity of 11.6 NTU as opposed to Site B, 6.1 NTU, and Site A, 2.1 NTU. SBSE detected the highest number of pesticides at all sites, except at site C. The lower performance of SBSE at Site C has been discussed in [35] and has been linked to potential desorption and matrix effect, linked to turbidity, at the different sample sites.
Due to limited observation, it is hard to understand how come Chemcatcher with HLB disk detected more compounds than the other two passive samplers at Site C. While this cannot be directly linked to land-use, it shows that performance might be affected by different elements and thus combined use can really help having a better overview. Eventually, beyond site C, Chemcatcher with HLB disk appears to be the least performant among passive samplers, both in terms of number of detected compounds as well as in terms of complementarity with other samplers, as no compound was solely detected by this sampler type. Beyond selectivity of absorption and extraction methods, pesticides load and matrix effect might play a role in the performance of the samplers.

2.3. Advantages and Disadvantages of Passive Samplers and Grab Samples

Previous sections highlight the complementarity of grab-sampling and passive samplers in terms of the type and information that can be obtained. Passive samplers provide qualitative information over a longer time span, while grab samples can indicate numbers and concentrations of pesticides found in a set volume for an instantaneous sample. In this study, passive samplers recovered pesticides reflected the trend of pesticides detected in grab sampling, where more consistent presence over the weeks in grab sampling has been related to higher probability of detections in passive samplers. From a logistic perspective, passive samplers present some advantages. Even if deployed over a four-week period, they limit the visit to the site to only two times, deployment and retrieval. At the same time, these steps might require entering the water course, which can be risky. Visits to the sites can quickly increase when collecting grab samples, making logistic more complex. On the other hand, frequent site visits provide a chance to check the water body over the sampling period, which could be beneficial to assess unexpected loss of passive samplers, change in water level or unwanted human removal.
Expanding the comparison to the preparation and extraction steps required for the different techniques deployed in this study can help assessing the appropriateness of each depending on context and for citizen science initiatives. [2] suggests a series of criteria which can be considered when choosing a sampling and extraction method. Those include sample preparation times, solvent use, selectivity, precision and sensitivity. Based on the presented study, Table 2 reports a basic comparison of the techniques used, with reference to materials, sample preparation and processing, sampling and analysis.
Sampler and sampling preparation and processing steps are more labor intensive for passive samplers, they require more material, solvent use and time (Table 2). Stir bar might also seem to have longer processing steps, but they are mostly passive, where active steps are reduced to moving the stir bar in the conditioning unit and to add it to the water sample for extraction. Contamination risk and sample loss are higher for POCIS and SPE, due to the bulk character of POCIS sorbent and due to additional steps required, such as extraction on HLB cartridges and pre-filtering of the grab samples. In case of SBSE, contamination might come from the passive nature of the PDMS rubber, which can potentially absorb contaminants found in the surrounding environment.
Passive samplers’ devices are relatively cheap, can screen for a wide polarity range and allow for over-time monitoring. Disadvantages are linked to the difficulties of assemblage and use of solvent, which requires specialized personnel. Additionally, Chemcatcher absorbed disks need to remain wetted before and after deployment. Furthermore, POCIS has been associated with sorbent loss during sample preparation and implementation, due to its bulk form. To overcome POCIS limitations, [32] has proposed the application of HLB disks in Chemcatcher, which use the same sorbent material but fixed in a glass fiber filter. HLB disks were deployed in Chemcatcher in this study as well. While they solve the sorbent loss issue of POCIS, the thickness of the HLB disks makes the assemblage even more difficult. Solid phase extraction (SPE) offers higher extraction efficiency and lower solvent usage, but is expensive, the procedure is long and complex and labor-intensive [10]. Just like passive samplers, SPE requires specialized personnel to perform sample preparation and handling protocols. SBSE main advantages are linked to the ease of application and the reduced use of solvents. Nonetheless, SBSE has limitations, including matrix effects and limited applicability to either hydrophobic or polar contaminants [38]. It is a rather costly technique, as it requires specific equipment for conditioning of the stir bars and for automatic stir bar desorption. Finally, it is a destructive technique with the whole sample being desorbed at once. [35] also found that SBSE tends to underestimate concentrations, if compared to SPE. Further study relating to how matrix effects impact stir bar absorption is suggested, as well as investigation on how to possibly expand the technique to wider polarity ranges.

2.4. Suitability for Applications in Citizen Science

All the techniques examined demonstrate to be suitable for citizen science application to monitor pesticides in surface waters. The selection of an appropriate method should be guided by the specific research objectives, available financial and human resources. Grab sampling coupled to SBSE is particularly suitable to citizen science due to its simplicity, safety and portability and it has already been deployed in various citizen science exercises around the world [39,40]. A key advantage is its ability to foster citizen engagement, allowing participation in both the sampling and extraction phases. However, it is a relatively costly technique that requires specialized laboratory equipment for conditioning, desorption and analysis, which may not be universally available. Grab sampling with SPE represents a mid-range option. It is less expensive than SBSE and provides robust quantitative data. A limitation for citizen engagement is that participation is typically restricted to sample collection, with extraction and analysis performed in a laboratory. Passive samplers (Chemcatcher and POCIS) are ideal for enhancing data collection over extended temporal scales within a watershed. They are highly cost-effective and and require relatively inexpensive, common laboratory equipment. Citizen participation is generally limited to deployment and retrieval. While those steps can represent logistical challenges, they can be easily overcome by providing clear instruction and trainings and sampling procedures. The fundamentally difference in data output must also be considered in the choice. Passive samplers provide qualitative information, over their deployment period, whereas grab sampling delivers quantitative snapshot of contaminant concentrations at a specific moment. A combined or tiered approach is ideal, where the complementarity of the methods allows to identify a wider range of pesticides. For instance, passive samplers can be used for an initial wide screening to identify contamination hotspots, followed by grab sampling for quantitative analysis at specific times and locations. This provides a more comprehensive understanding of local contamination, while engaging citizens with a variety of scientific techniques.

3. Materials and Methods

3.1. Sampling Sites

This study was conducted at three sampling sites in Victoria, south-eastern Australia. The sites, referred to as Site A, Site B, and Site C (Figure 3), were selected to represent distinct land uses, including a residential area downstream of a wastewater treatment plant outlet (Site A), an industrial urban residential neighbourhood (Site B), and a stream adjacent to horticultural and pastoral lands (Site C).
A combination of passive samplers and grab sampling, paired with two different extraction methods was evaluated. Grab water samples (1 L and 100 mL) were collected in duplicate on a weekly basis over a four-week period during the summer season (8th February 2023 - 8th March 2023), resulting in five sampling events at each site. Blank samples, consisting of spiked Milli-Q water, were processed weekly during extraction to ensure quality control. During the same period, three different passive samplers were deployed in duplicate at each site for four weeks (Figure 4). Field and laboratory blanks were included to ensure quality control during the preparation, deployment, and retrieval of the samplers. In addition, in situ water quality parameters (pH, turbidity, electro-conductivity, dissolved oxygen, and temperature) were measured at each sampling event.

3.2. Chemicals

A total of 230 pesticides were screened, representing three major classes: insecticides (41.7%), fungicides (24.3%), and herbicides (19.6%) (Table S1, Supplementary Material). A mix solutions of all pesticides screened for used for method development. The solutions purchased are part of the GC Multiresidue Pesticide Standard mixes by Restek Corporation (Bellefonte, PA, USA). Of the 230 pesticides screened, a standard solution was not available for 12 compounds, namely 2,4,6-tribromoanisole, 2-chloronaphthalene, 2-phenylphenol, 4,4'-methylenebis(N,N-dimethylaniline), acetophenone, dichlorbenzamide, chlorocre-sol, epoxiconazole, isoxadifen, phthalimide, quinoline, resorcinol. They were excluded from quantitative analysis (indicated in italic in Table S1, Supplementary Material). The internal standard solution contained trans-Nonachlor (¹³C₁₀, 98%, Cambridge Isotope Laboratories Inc., Tewksbury, MA, USA) Further details on the solutions used is detailed in [35]. Pesticide residue analysis-grade methanol, ethyl acetate and toluene were used as solvents (Merck KGaA, Darmstadt, Germany).
Passive samplers included POCIS and Chemcatcher. POCIS used Oasis HLB bulk sorbent (200 mg, 30 µm, Waters, Amberley, QLD, Australia) enclosed between two polyether sulfone (PES) membranes (0.1 µm, 90 mm Sterlitech, Auburn, WA, USA). Chemcatchers were equipped with either Empore SDB-XC disks (47 mm, Phenomenex, Lane Cove, NSW, Australia) or HLB disks (Atlantic HLB 47 mm, Horizon Technology, Lake Forest, CA, USA) both covered by a PES diffusion limiting membrane (47 mm, Sartorius Stedim Biotech GmbH, Germany).
For SBSE, stir bars coated with polydimethylsiloxane (PDMS; 2 mm × 0.5 mm) were obtained from Gerstel (Mülheim an der Ruhr, Germany). Water samples for SPE were first filtered using GF/C filters (47 mm, Whatman, Florham Park, NJ, USA) and then extracted on Oasis HLB cartridges (Waters Corporation, Milford, MA, USA).

3.3. Samplers Preparation

Stir bars are conditioned for 5 hours at 330 °C before use. No preparation is required for SPE extracted grab samples before extraction. Preparation of POCIS and SDB-XC Chemcatcher samplers followed the protocol by [13]. In POCIS samplers, 0.2 g powder HLB sorbent is sandwiched between two PES membranes in a metal casing. Polyethersulfone membranes were activated by soaking in methanol (30 mins) followed by Milli-Q water (30 mins). No treatment was applied on the HLB solvent.
Chemcatcher Empore SDB-XC disks were soaked in methanol (30 minutes), followed by Milli-Q water (30 minutes), for activation. Each Chemcatcher housing contained an SDB-XC disk covered by a PES membrane. To prevent drying of the disks, they were moistened with Milli-Q water and capped.
The HLB disks were conditioned in high-density polyethylene membrane (HDPE) holders by rinsing sequentially with ethyl acetate (2x 30 mL), followed by methanol (2x 30mL) and, Milli-Q water (1x 20mL), according to the protocol modified from [41] and [32]. These methods were tailored to the target compounds and the instrumentation available, namely Gas Chromatography-Quadruple Time of Flight –High Resolution Mass Spectrometry (GC-QToF-HRMS). After conditioning. the disks were dried under vacuum and placed into the Chemcatcher casing and covered with a PES membrane. Owing to the greater thickness of the HLB disks, the casings were additionally secured with waterproofed tape to ensure closure. For quality assurance, one laboratory blank was kept open during preparation of each type of passive sampler’.

3.4. Sample Processing

The graphical abstract shows how the samples were extracted. The extraction of water samples was performed using to primary methods: SBSE and SPE. For SBSE extraction, a 100 mL water sample is stirred with magnetic stir bar, on which rubber coating contaminants absorb. The total extraction procedure lasts 5 hours. For SPE extraction, 1 L samples is first filtered and then loaded on a HLB cartridge, a process that takes approximately one hour per sample. Extraction of grab samples by SBSE and SPE has been described in detail by [35]. For the passive samplers, processing followed established literature methods. The POCIS and SDB Chemcatcher were processed according to [13], while the HLB Chemcatcher samples followed the protocol by [41]. Before elution, Chemcatcher SDB and HLB disks were dried on a hot plate at 35°C for 1 to 1.5 hour. SDB-XC disks were then eluted using ethyl acetate (2 x 10 mL), whereas HLB disks were eluted using an automatic extractor system (PrepLinc AS4, J2 Scientific, Columbia, MI, USA) using ethyl acetate (3 x 20 mL). Similarly, POCIS HLB sorbent was transferred into empty SPE cartridges under vacuum and were eluted according to the protocol described in [35]. Prior to extraction (grab-samples SBSE and SPE) and prior to elution (POCIS and Chemcatchers), the internal standard (¹³C10 trans-Nonachlor), diluted in acetone (1 mL), was added to achieve a final concentration of 5 ng/L, for quality control and recovery calculation. Passive samplers and grab samples SPE eluate was concentrated by centrifugation (SPEED, approx. 30 min per sample) and reduced under a nitrogen flow to reach a final volume of 100 µL.

3.5. Chemical Analysis

All samples were analyzed using a Gas Chromatograph 8890 coupled with Quadruple Time-Of-Flight 7250 mass spectrometer (Agilent Technology, USA). SBSE samples were automatically transferred by a Multi-Purpose Sampler (MPS, Gerstel, Germany) for desorption in a Thermal Desorption Unit (TDU2, Gerstel, Germany), while all other extracts were injected directly. Separation was performed on an HP-5MS UI capillary column (length = 30 m, internal diameter = .25 mm, film thickness = 0.25 µm, Agilent Technology, CA, USA). Injection and desorption parameters are detailed in the Supplementary material (Table S2).
Quantitative methods including retention times, quantifier and qualifier ion masses for each compound and the internal standard (¹³C₁₀ trans-Nonachlor) are provided in Supplementary Table S1. Details on grab-sample quantification, calibration curve generation and determination of Method Detection Limits, Limit Of Detection and Limit Of Quantification are the same reported in [35]. Data acquisition data and analysis were performed using Quantitative Agilent Software (version 12.1).
Data analysis was performed in Microsoft Excel (Version 2502) and Spyder (Python 2.7).

4. Conclusions

The findings of this study highlight several key insights into the effectiveness and practicality of various sampling and extraction techniques for monitoring pesticides in surface waters in the context of a citizen science activity. First, Chemcatcher HLB disks were excluded from further application due to the difficulties encountered during their assemblage and their limited performance in the detection of pesticides and complementarity with other passive samplers. Except for Chemcatcher HLB disk, the comparison of different techniques, including passive samplers and grab sampling, demonstrated that each method detects different sets of compounds, emphasizing their complementarity in monitoring applications. This complementarity is crucial for a comprehensive understanding of pesticide contamination. While passive samplers do not provide quantitative concentrations, they are invaluable for identifying compounds of concern over a longer deployment time and supporting prioritization for follow-up quantitative analysis. However, passive samplers might miss compounds present at trace levels, which is an important consideration when designing a monitoring strategy. A tiered approach may be appropriate, where passive samplers are employed during an initial screening stage, followed by grab sampling with stir bar or solid phase extraction to generate quantitative information on a list of prioritized compounds. Additionally, land use should be considered when deciding a monitoring strategy. In catchments dominated by continuous point-source contamination, such as Site B wetland, less frequent grab-sampling may be sufficient. In contrast, catchments affected by variable diffuse sources, such as agricultural areas, may require sampling at shorter intervals to capture episodic contamination events. Finally, for citizen science application, the choice of one or the other sampling and extraction technique should be based on the purpose of the initiative. If the aim is to bring citizens closer to science through increased engagement in the analytical process, grab-SBSE might be more appropriate. If the focus is rather on complementing data on water quality, limited sampling and passive samplers might be already satisfactory. Financial resources available might also help determine which technique is fit-for-purpose, with passive samplers being a rather cheap technology while grab-sampling SBSE requiring expensive and specific laboratory equipment for analysis. Overall, this study underscores the importance of selecting appropriate sampling and extraction techniques based on the specific characteristics of the monitoring site, types of contaminants of interest, and citizen engagement activity. By leveraging the strengths of different methods, a more robust and comprehensive monitoring strategy can be developed to understand on-going surface water contamination by pesticides.

Supplementary Materials

The following supporting information can be downloaded at the website of this paper posted on Preprints.org, Table S1: List of screened pesticides and their category, retention time, quantifier and up to 3 qualifier ions; Table S2: Details of GC-QToF-MS acquisition methods by desorption and injection; Table S3: List of compounds detected at each site, with corresponding Log Kow and frequency (where applicable).

Author Contributions

Conceptualization and supervision: Pettigrove V., Myers J., Mariani G., Gawlik M. B.; Methodology: Myers J., Mariani G., Cacciatori C.; Data acquisition, analysis and interpretation: Cacciatori C., Myers J., Pettigrove V.; Original drafting: Cacciatori C.; Revision: Cacciatori C., Mariani G., Gawlik M. B., Vu H., Myers J., Pettigrove V., Approval for publication of content: Pettigrove V.

Funding

This research received no external funding.

Institutional Review Board Statement

Not applicable.

Informed Consent Statement

Not applicable.

Data Availability Statement

The original contributions presented in this study are included in the article/supplementary material. Further inquiries can be directed to the corresponding author(s).

Acknowledgments

We thank Daniel MacMahon for designing the map of the sampling locations and Hung Vu and Rebecca Reid for their technical support in the laboratory.

Conflicts of Interest

The authors declare no conflicts of interest.

Abbreviations

The following abbreviations are used in this manuscript:
POCIS Polar Organic Chemical Integrative Sampler
SBSE Stir Bar Sorptive Extraction
SPE Solid Phase Extraction
AUD Australian Dollars
NMI National Monitoring Institute
EDC Endocrine Disrupting Chemicals
RMIT Royal Melbourne Institute of Technology
AQUEST Aquatic Environmental Stress Research Group
GC Gas Chromatography
HLB Hydrophilic-Lipophilic Balance
PES Polyether Sulfone
SDB-XC Polystyrene-DivinylBenzene
PDMS Polydimethyl Siloxane
HDPE High-Density Polyethylene
GC-QToF-HRMS Gas Chromatography-Quadruple Time of Flight –High Resolution Mass Spectrometry
MPS Multi-Purpose Sampler
TDU2 Thermal Desorption Unit

References

  1. M. F. Ahmad et al., “Pesticides impacts on human health and the environment with their mechanisms of action and possible countermeasures,” Heliyon, vol. 10, no. 7, p. e29128, 2024. [CrossRef]
  2. E. F. Valenzuela, H. C. Menezes, and Z. L. Cardeal, “Passive and grab sampling methods to assess pesticide residues in water. A review,” Environmental Chemistry Letters, vol. 18, no. 4, pp. 1019–1048, Jul. 2020. [CrossRef]
  3. R. M. de Souza, D. Seibert, H. B. Quesada, F. de J. Bassetti, M. R. Fagundes-Klen, and R. Bergamasco, “Occurrence, impacts and general aspects of pesticides in surface water: A review,” Process Safety and Environmental Protection, vol. 135, pp. 22–37, 2020, . [CrossRef]
  4. FAO, Water quality in agriculture: Risks and risk mitigation. FAO; IWMI;, 2023. [CrossRef]
  5. A.Sharma et al., “Global trends in pesticides: A looming threat and viable alternatives,” Ecotoxicology and Environmental Safety, vol. 201, p. 110812, 2020, . [CrossRef]
  6. APVMA, “Agricultural (pesticides) product sales for the 2022–23 financial year,” Australian Pesticides and Veterinary Medicine Authority, 2024. [Online]. Available: https://www.apvma.gov.au/about/accountability-and-reporting/annual-product-sales-data/publication-annual-product-sales-data-2022-23.
  7. 2024. Available online: https://portal.apvma.gov.au/pubcris.
  8. Agriculture & Environment Research Unit (AERU), “IUPAC Pesticide Properties DataBase (PPDB).” University of Hertfordshire, 2018. [Online]. Available: http://sitem.herts.ac.uk/aeru /ppdb/en/.
  9. P. Serasinghe, H. T. K. Nguyen, T. D. Silva, D. Nugegoda, and V. Pettigrove, “A novel approach for tailoring pesticide screens for monitoring regional aquatic ecosystems,” Environmental Advances, vol. 9, p. 100277, 2022, . [CrossRef]
  10. C. Campanale, C. Massarelli, D. Losacco, D. Bisaccia, M. Triozzi, and V. F. Uricchio, “The monitoring of pesticides in water matrices and the analytical criticalities: A review,” TrAC Trends in Analytical Chemistry, vol. 144, p. 116423, Nov. 2021. [CrossRef]
  11. K. J. Hageman et al., “Current-use pesticides in New Zealand streams: Comparing results from grab samples and three types of passive samplers,” Environmental Pollution, vol. 254, p. 112973, 2019, . [CrossRef]
  12. P. Serasinghe, H. T. Nguyen, C. Hepburn, D. Nugegoda, and V. Pettigrove, “Use of passive sampling and high-resolution mass spectrometry for screening emerging pesticides of concern within surface waters,” Journal of Hazardous Materials Advances, vol. 13, p. 100408, 2024, . [CrossRef]
  13. V. Pettigrove et al., “Catchment sourcing urban pesticide pollution using constructed wetlands in Melbourne, Australia,” Science of The Total Environment, vol. 863, p. 160556, 2023, . [CrossRef]
  14. J. J. Grandy, V. Galpin, V. Singh, and J. Pawliszyn, “Development of a Drone-Based Thin-Film Solid-Phase Microextraction Water Sampler to Facilitate On-Site Screening of Environmental Pollutants,” Anal. Chem., vol. 92, no. 19, pp. 12917–12924, Oct. 2020, . [CrossRef]
  15. Z. Zhang, A. Hibberd, and J. L. Zhou, “Analysis of emerging contaminants in sewage effluent and river water: Comparison between spot and passive sampling,” Analytica Chimica Acta, vol. 607, no. 1, pp. 37–44, Jan. 2008, . [CrossRef]
  16. N. Ochiai et al., “Stir bar sorptive extraction and comprehensive two-dimensional gas chromatography coupled to high-resolution time-of-flight mass spectrometry for ultra-trace analysis of organochlorine pesticides in river water,” Journal of Chromatography A, vol. 1218, no. 39, pp. 6851–6860, Sep. 2011, . [CrossRef]
  17. A.Prieto et al., “Stir-bar sorptive extraction: A view on method optimisation, novel applications, limitations and potential solutions,” Journal of Chromatography A, vol. 1217, no. 16, pp. 2642–2666, 2010, . [CrossRef]
  18. D. Fraisl et al., “Mapping citizen science contributions to the UN sustainable development goals,” Sustain Sci, vol. 15, no. 6, pp. 1735–1751, Nov. 2020, . [CrossRef]
  19. S. Fritz et al., “Citizen science and the United Nations Sustainable Development Goals,” Nature Sustainability, vol. 2, no. 10, pp. 922–930, Oct. 2019, . [CrossRef]
  20. WWQA, “Technical Brief - The role of citizen science in improving ambient water quality.” Zenodo, 2024. [CrossRef]
  21. L. Carvalho et al., “Protecting and restoring Europe’s waters: An analysis of the future development needs of the Water Framework Directive,” Science of The Total Environment, vol. 658, pp. 1228–1238, 2019, . [CrossRef]
  22. J. von Gönner et al., “Citizen science shows that small agricultural streams in Germany are in a poor ecological status,” Science of The Total Environment, vol. 922, p. 171183, 2024, . [CrossRef]
  23. M. J. O. Pocock, I. Hamlin, J. Christelow, H. Passmore, and M. Richardson, “The benefits of citizen science and nature-noticing activities for well-being, nature connectedness and pro-nature conservation behaviours,” People and Nature, vol. 5, no. 2, pp. 591–606, Apr. 2023, . [CrossRef]
  24. E. Roger et al., “Open Access Research Infrastructures are Critical for Improving the Accessibility and Utility of Citizen Science: A Case Study of Australia’s National Biodiversity Infrastructure, the Atlas of Living Australia (ALA),” Citizen Science: Theory and Practice, vol. 8, no. 1, p. 56, Sep. 2023, . [CrossRef]
  25. S. Warner et al., “Empowering citizen scientists to improve water quality: from monitoring to action,” Frontiers in Water, vol. 6, 2024, . [CrossRef]
  26. S. Hegarty, A. Hayes, F. Regan, I. Bishop, and R. Clinton, “Using citizen science to understand river water quality while filling data gaps to meet United Nations Sustainable Development Goal 6 objectives,” Science of The Total Environment, vol. 783, p. 146953, Aug. 2021, . [CrossRef]
  27. M. A. Yevenes, H. Pereira, and R. Bermudez, “Citizen Science as a Co-Creative Measure to Water Quality: Chemical Data and Local Participation in a Rural Territory,” Front. Environ. Sci., vol. 10, p. 940778, Sep. 2022, . [CrossRef]
  28. Y. Zhang, R. Ma, M. Hu, J. Luo, J. Li, and Q. Liang, “Combining citizen science and land use data to identify drivers of eutrophication in the Huangpu River system,” Science of The Total Environment, vol. 584–585, pp. 651–664, 2017, . [CrossRef]
  29. RMIT AQUEST, “The Pesticide Detectives: national assessment of pesticides in waters.” Accessed: Jun. 25, 2025. [Online]. Available: https://www.rmit.edu.au/about/schools-colleges/science/research/research-centres-groups/aquatic-environmental-stress/pesticide-detectives.
  30. Deakin University, “Pesticide Watch.” Accessed: Jun. 25, 2025. [Online]. Available: https://blogs.deakin.edu.au/pesticidewatch/.
  31. L. Ahrens, A. Daneshvar, A. E. Lau, and J. Kreuger, “Characterization of five passive sampling devices for monitoring of pesticides in water,” Journal of Chromatography A, vol. 1405, pp. 1–11, 2015, . [CrossRef]
  32. M. Grodtke, A. Paschke, J. Harzdorf, M. Krauss, and G. Schüürmann, “Calibration and field application of the Atlantic HLB Disk containing Chemcatcher® passive sampler – Quantitative monitoring of herbicides, other pesticides, and transformation products in German streams,” Journal of Hazardous Materials, vol. 410, p. 124538, 2021, . [CrossRef]
  33. A.Assoumani, S. Lissalde, C. Margoum, N. Mazzella, and M. Coquery, “In situ application of stir bar sorptive extraction as a passive sampling technique for the monitoring of agricultural pesticides in surface waters,” Science of The Total Environment, vol. 463–464, pp. 829–835, Oct. 2013, . [CrossRef]
  34. EC JRC, “The Gems of Water: engaging citizens to monitor water quality,” European Commission The Joint Research Centre: EU Science Hub. [Online]. Available: https://joint-research-centre.ec.europa.eu/projects-and-activities/gems-water-engaging-citizens-monitor-water-quality_en.
  35. C. Cacciatori, J. Myers, G. Mariani, H. Vu, B. M. Gawlik, and V. Pettigrove, “Comparison of Extraction Techniques for Wide Screening of 230 Pesticides in Water,” Separations, vol. 12, no. 6, 2025, . [CrossRef]
  36. B. Mathon et al., “Polar organic chemical integrative samplers as an effective tool for chemical monitoring of surface waters – Results from one-year monitoring in France,” Science of The Total Environment, vol. 824, p. 153549, 2022, . [CrossRef]
  37. B. Vrana et al., “Passive sampling techniques for monitoring pollutants in water,” TrAC Trends in Analytical Chemistry, vol. 24, no. 10, pp. 845–868, 2005, . [CrossRef]
  38. Posada-Ureta et al., “Applicability of polydimethylsiloxane (PDMS) and polyethersulfone (PES) as passive samplers of more hydrophobic organic compounds in intertidal estuarine environments,” Science of The Total Environment, vol. 578, Nov. 2016, . [CrossRef]
  39. A.Cacciatori et al., “Citizen-engaged screening of 230 pesticides in the Lake Naivasha catchment, Kenya, using stir bar sorptive extraction and GC-QToF-HRMS,” Frontiers in Environmental Science, vol. Volume 13-2025, 2025, . [CrossRef]
  40. A.Cacciatori et al., “Stir bar sorptive extraction TDU-GC-QToF-HRMS for screening 230 pesticides in waters surrounding banana plantations in Costa Rica through community engagement,” Chemosphere, vol. 376, p. 144251, 2025, . [CrossRef]
  41. G. Mariani et al., “EMBLAS Plus - Joint Black Sea Survey 2019: ‘JRC Chemical Contaminant Measurements,’” no. KJ-NA-30512-EN-N (online),KJ-NA-30512-EN-C (print), 2020, doi: 10.2760/438289 (online),10.2760/946379 (print).
Figure 1. Number of pesticides detected by grab sampling (SPE and SBSE) and passive samplers.
Preprints 191952 g001
Figure 2. Summary of results of pesticides detection at samples sites A, B, C.
Preprints 191952 g002
Figure 3. Map of sa0mpling locations, in Eastern Melbourne, Victoria, Australia.
Preprints 191952 g003
Figure 4. Deployment scheme of passive samplers and grab-sampling monitoring plan over 4 weeks.
Preprints 191952 g004
Table 1. Simple statistics for Log Kow of detected pesticides by sample type.
Sample type
Passive samplers Grab samples
Log Kow Chemcatcher
HLB disk
Chemcatcher
SBD disk
POCIS
HLB powder
SBSE SPE
Median 3.7 3.7 3.7 4.1 3.8
Average 3.7 3.6 3.7 4.3 3.8
1st Quartile 2.9 2.8 2.9 3.4 3.0
3rd Quartile 4.5 4.2 4.4 5.3 4.3
Table 2. Summary of comparison between samplers and extraction techniques regarding material used, samples preparation and processing, analysis. The calculation of solvent volumes and times are estimation based on this study, therefore calculated for several ca. 12 samples.
Material Sampler type Chemcatcher Chemcatcher POCIS SBSE SPE
Absorbent material HLB disk SBD disk HLB bulk PDMS HLB cartridge
Selectivity (Log Kow) -5 - 8 2 - 6 0 - 4 3 - 7 -5 - 8
Sampler &
sampling preparation
Steps (1) Cleaning of casing
(2) Cleaning of PES membrane
(3) Pre-cleaning and activation of disks
(1) Cleaning of casing
(2) Cleaning of PES membrane
(3) Pre-cleaning and activation of disks
(1) Cleaning of casing
(2) Cleaning of PES membrane
(1) Cleaning sampling bottles (2) Cleaning sampling bottles
Estimated duration 1 hour 45 minutes 45 minutes 15 minutes 15 minutes
Solvent use (est. volume) Methanol (1 L); MilliQ-water (350 mL); Ethyl acetate (60 mL) Methanol (2 L); MilliQ-water (500 mL) Methanol (1 L); MilliQ-water (300 mL); Aceton (ca. 100) Aceton (ca. 200 mL)
Sampling Exposure time 4 weeks 4 weeks 4 weeks Instantaneous Instantaneous
Sample volume Unknown Unknown Unknown 100 mL 1 L
Sampling casing 1 PES membrane
PTFE casing
1 PES membrane
PTFE casing
2 PES membranes
stainless steel casing
None None
Control over monitoring Low Low Low High High
Practicality Medium Medium Medium Medium Medium
Sample processing Steps (1) Drying of disks
(2) Elution
(3) Extract concentration
(1) Drying of disks
(2) Elution
(3) Extract concentration
(1) Extraction on HLB cartridges
(2) Elution
(3) Extract concentration
(1) Thermal conditioning
(2) Extraction by magnetic agitation
(1) Filtering of samples
(2) Extraction on HLB cartridges
(3) Elution
(4) Extract concentration
Estimated duration 8 h 8 h 8 h 10 hours 8 h
Solvent use (est. volume) Ethyl acetate (60 mL)
Acetone (1 mL)
Ethyl acetate (20 mL)
Acetone (1 mL)
Ethyl acetate (10 mL)
Acetone (1 mL)
Acetone (1 mL) Ethyl acetate (10 mL)
Acetone (1 mL)
Contamination risk Low Low Medium Medium Medium
Analysis & results Injected volume of sample volume N.A. N.A. N.A. 100 mL 20 mL
Type of information Long-term
chemical exposure
Long-term
chemical exposure
Long-term
chemical exposure
Instantaneous,
concentration
Instantaneous,
concentration
Units ng/tot ng/tot ng/tot ng/L ng/L
Citizen science Suitability Limited (deployment and retrieval) High (sampling and extraction, portable, laboratory safe) Limited (sampling)
Advantages Wide polarity range
Cheap
Continuous monitoring
Wide polarity range
Cheap
Continuous monitoring
Wide polarity range
Cheap
Continuous monitoring
Quantitative
Easy to apply
Wide polarity range
Quantitative
Widely used standardized method
Disadvantages Difficult to assemble
PES membrane needs to be humid
High solvent use
Requires manual skills
Qualitative
Specialized personnel for laboratory work
Difficult to assemble
PES membrane needs to be humid
High solvent use
Requires manual skills
Qualitative
Specialized personnel for laboratory work
Difficult to assemble
Limited to polar range
Sorbent loss
Requires manual skills
Qualitative
Specialized personnel for laboratory work
Instantaneous
Limited to hydrophobic range
Potential environmental contamination
Expensive
Destructive sample
Instantaneous
Labour intensive process
Sample loss
Expensive
Specialized personnel for laboratory work
Suggestions Casing needs to be adapted to thicker disks
Deployment should be made easier
Deployment should be made easier Deployment should be made easier Expand polarity range
Investigate matrix effects
Shorten and simplify the procedure
Disclaimer/Publisher’s Note: The statements, opinions and data contained in all publications are solely those of the individual author(s) and contributor(s) and not of MDPI and/or the editor(s). MDPI and/or the editor(s) disclaim responsibility for any injury to people or property resulting from any ideas, methods, instructions or products referred to in the content.
Copyright: This open access article is published under a Creative Commons CC BY 4.0 license, which permit the free download, distribution, and reuse, provided that the author and preprint are cited in any reuse.
Prerpints.org logo

Preprints.org is a free preprint server supported by MDPI in Basel, Switzerland.

Subscribe

Disclaimer

Terms of Use

Privacy Policy

Privacy Settings

© 2026 MDPI (Basel, Switzerland) unless otherwise stated