Preprint
Article

This version is not peer-reviewed.

Effects of Everolimus on Tacrolimus-Accelerated Progression of Renal Interstitial Fibrosis in Subtotal Nephrectomized Rats

Submitted:

29 December 2025

Posted:

30 December 2025

You are already at the latest version

Abstract

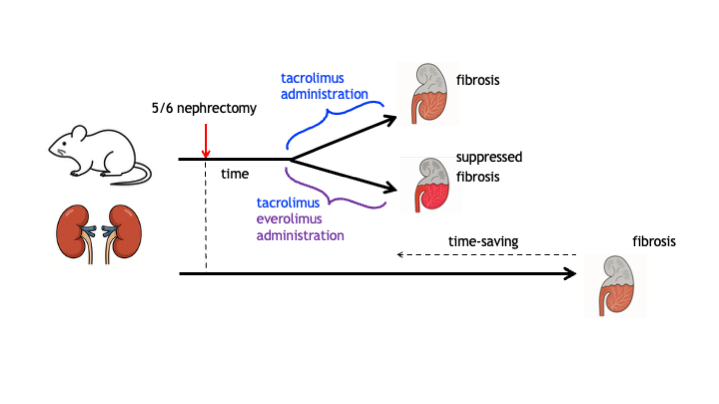
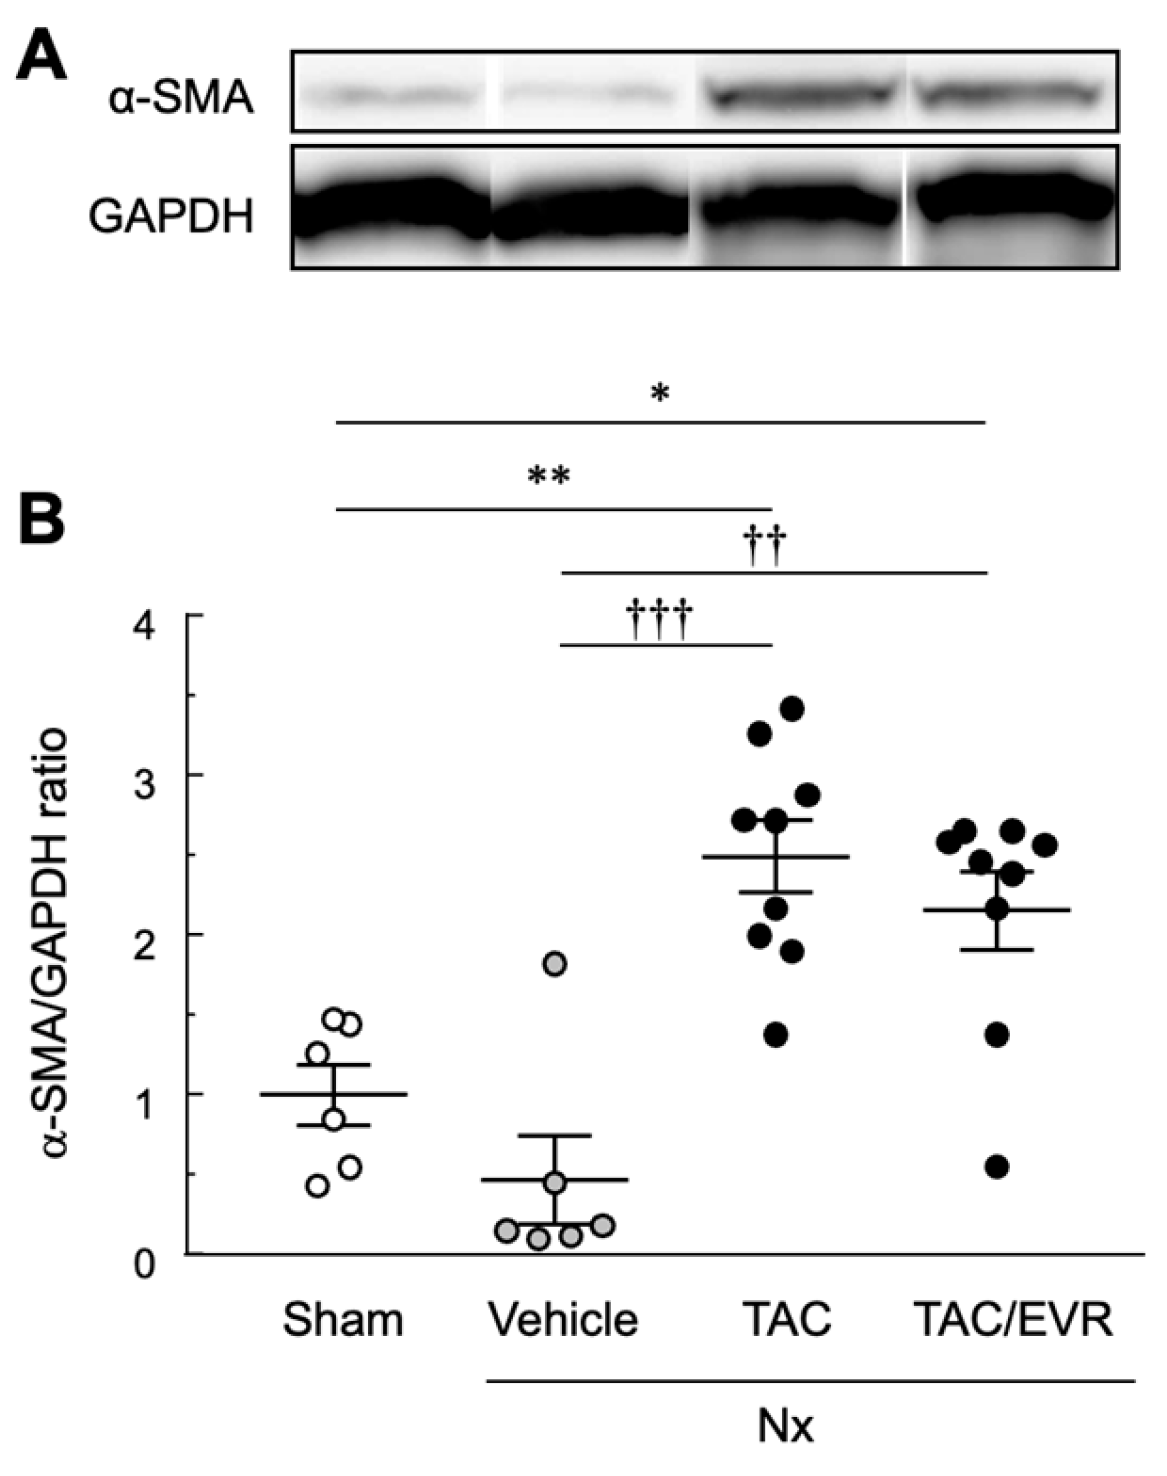
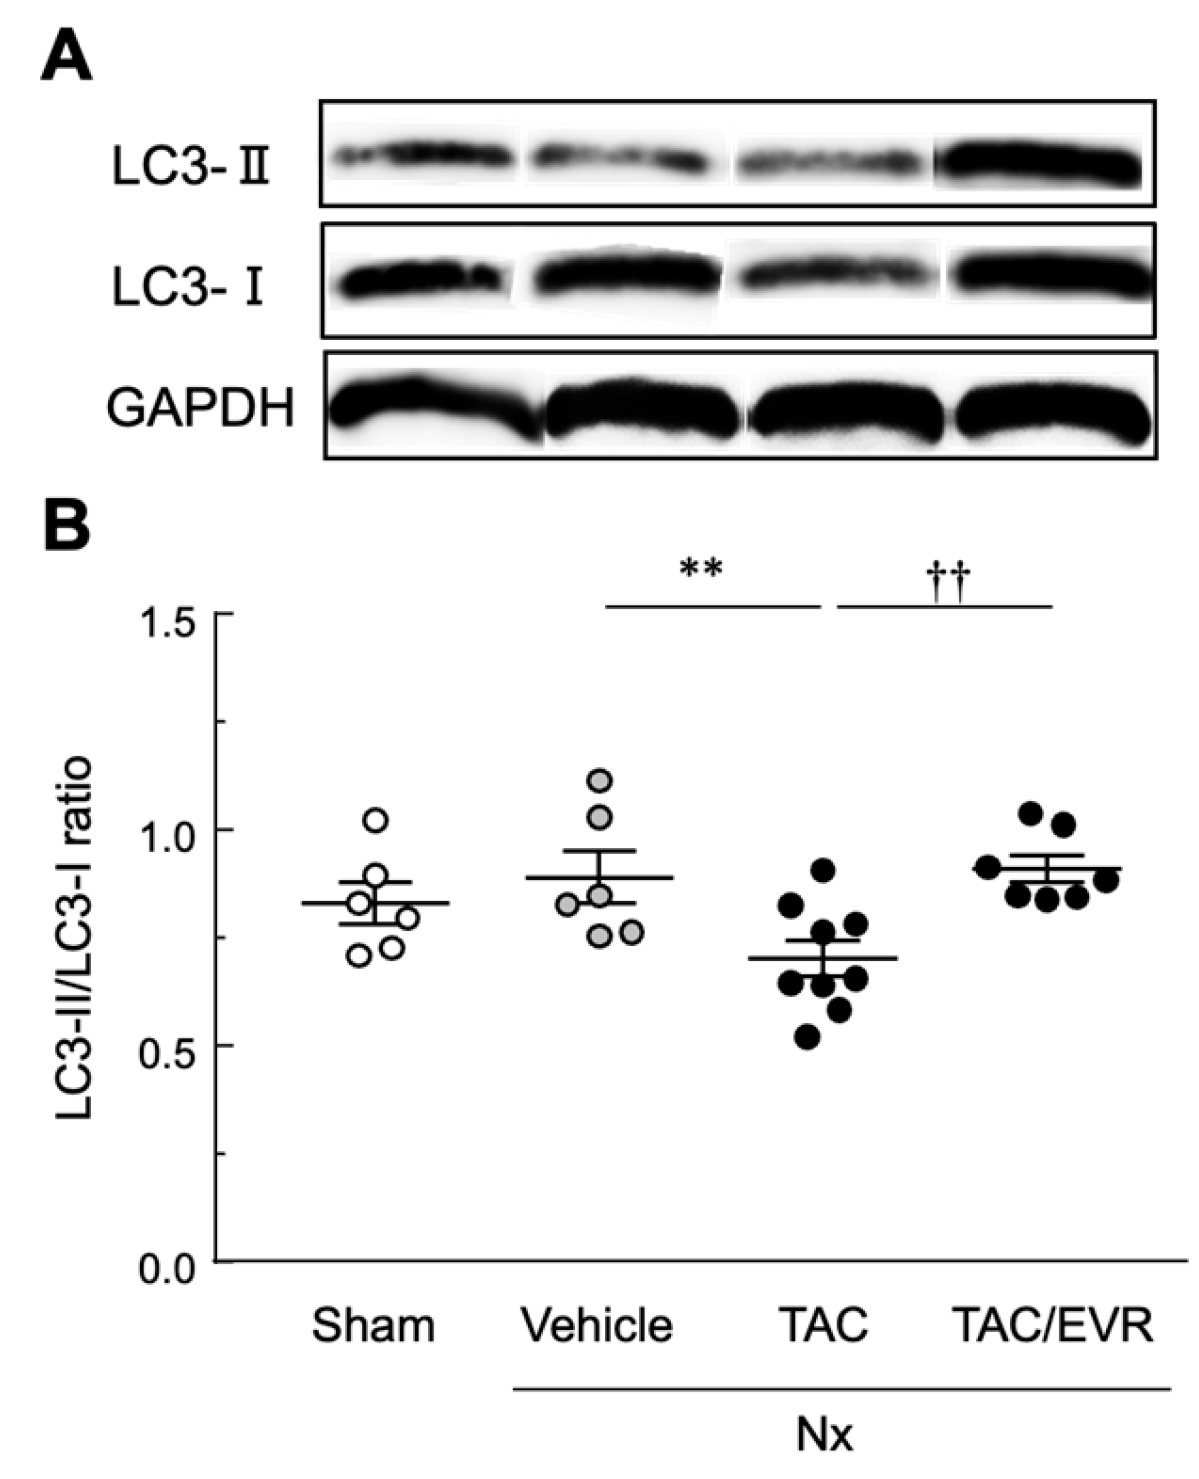
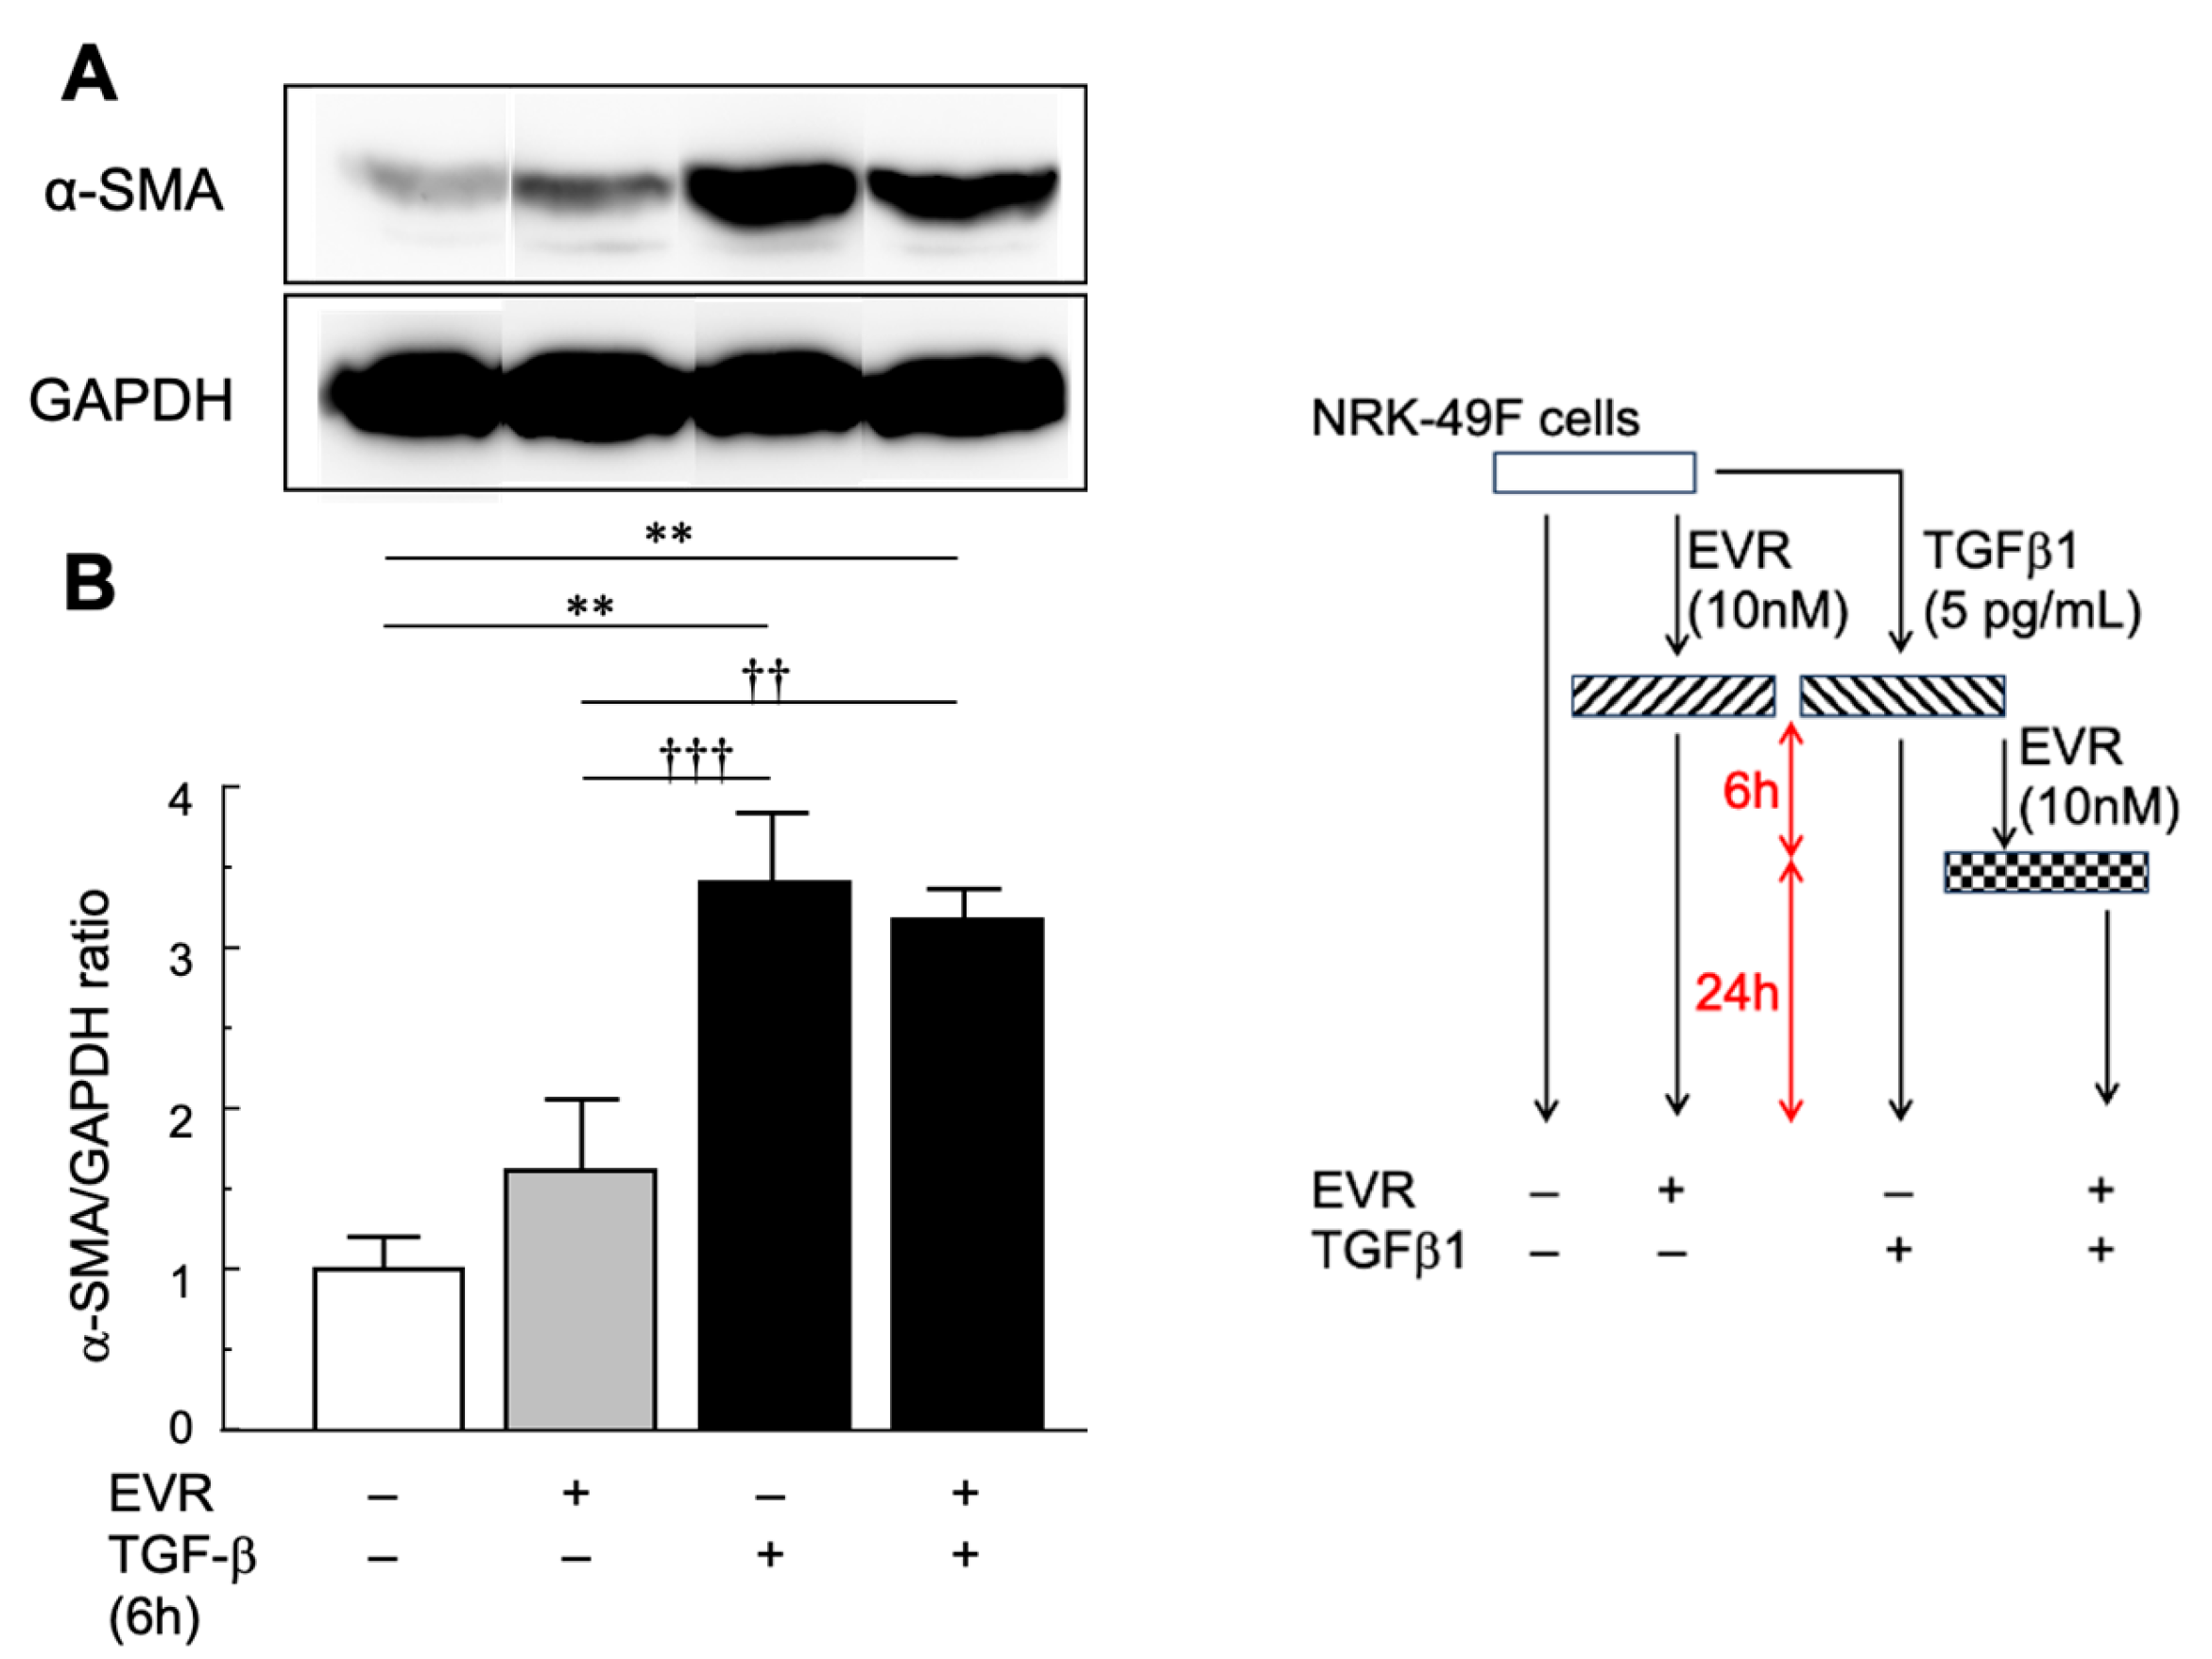
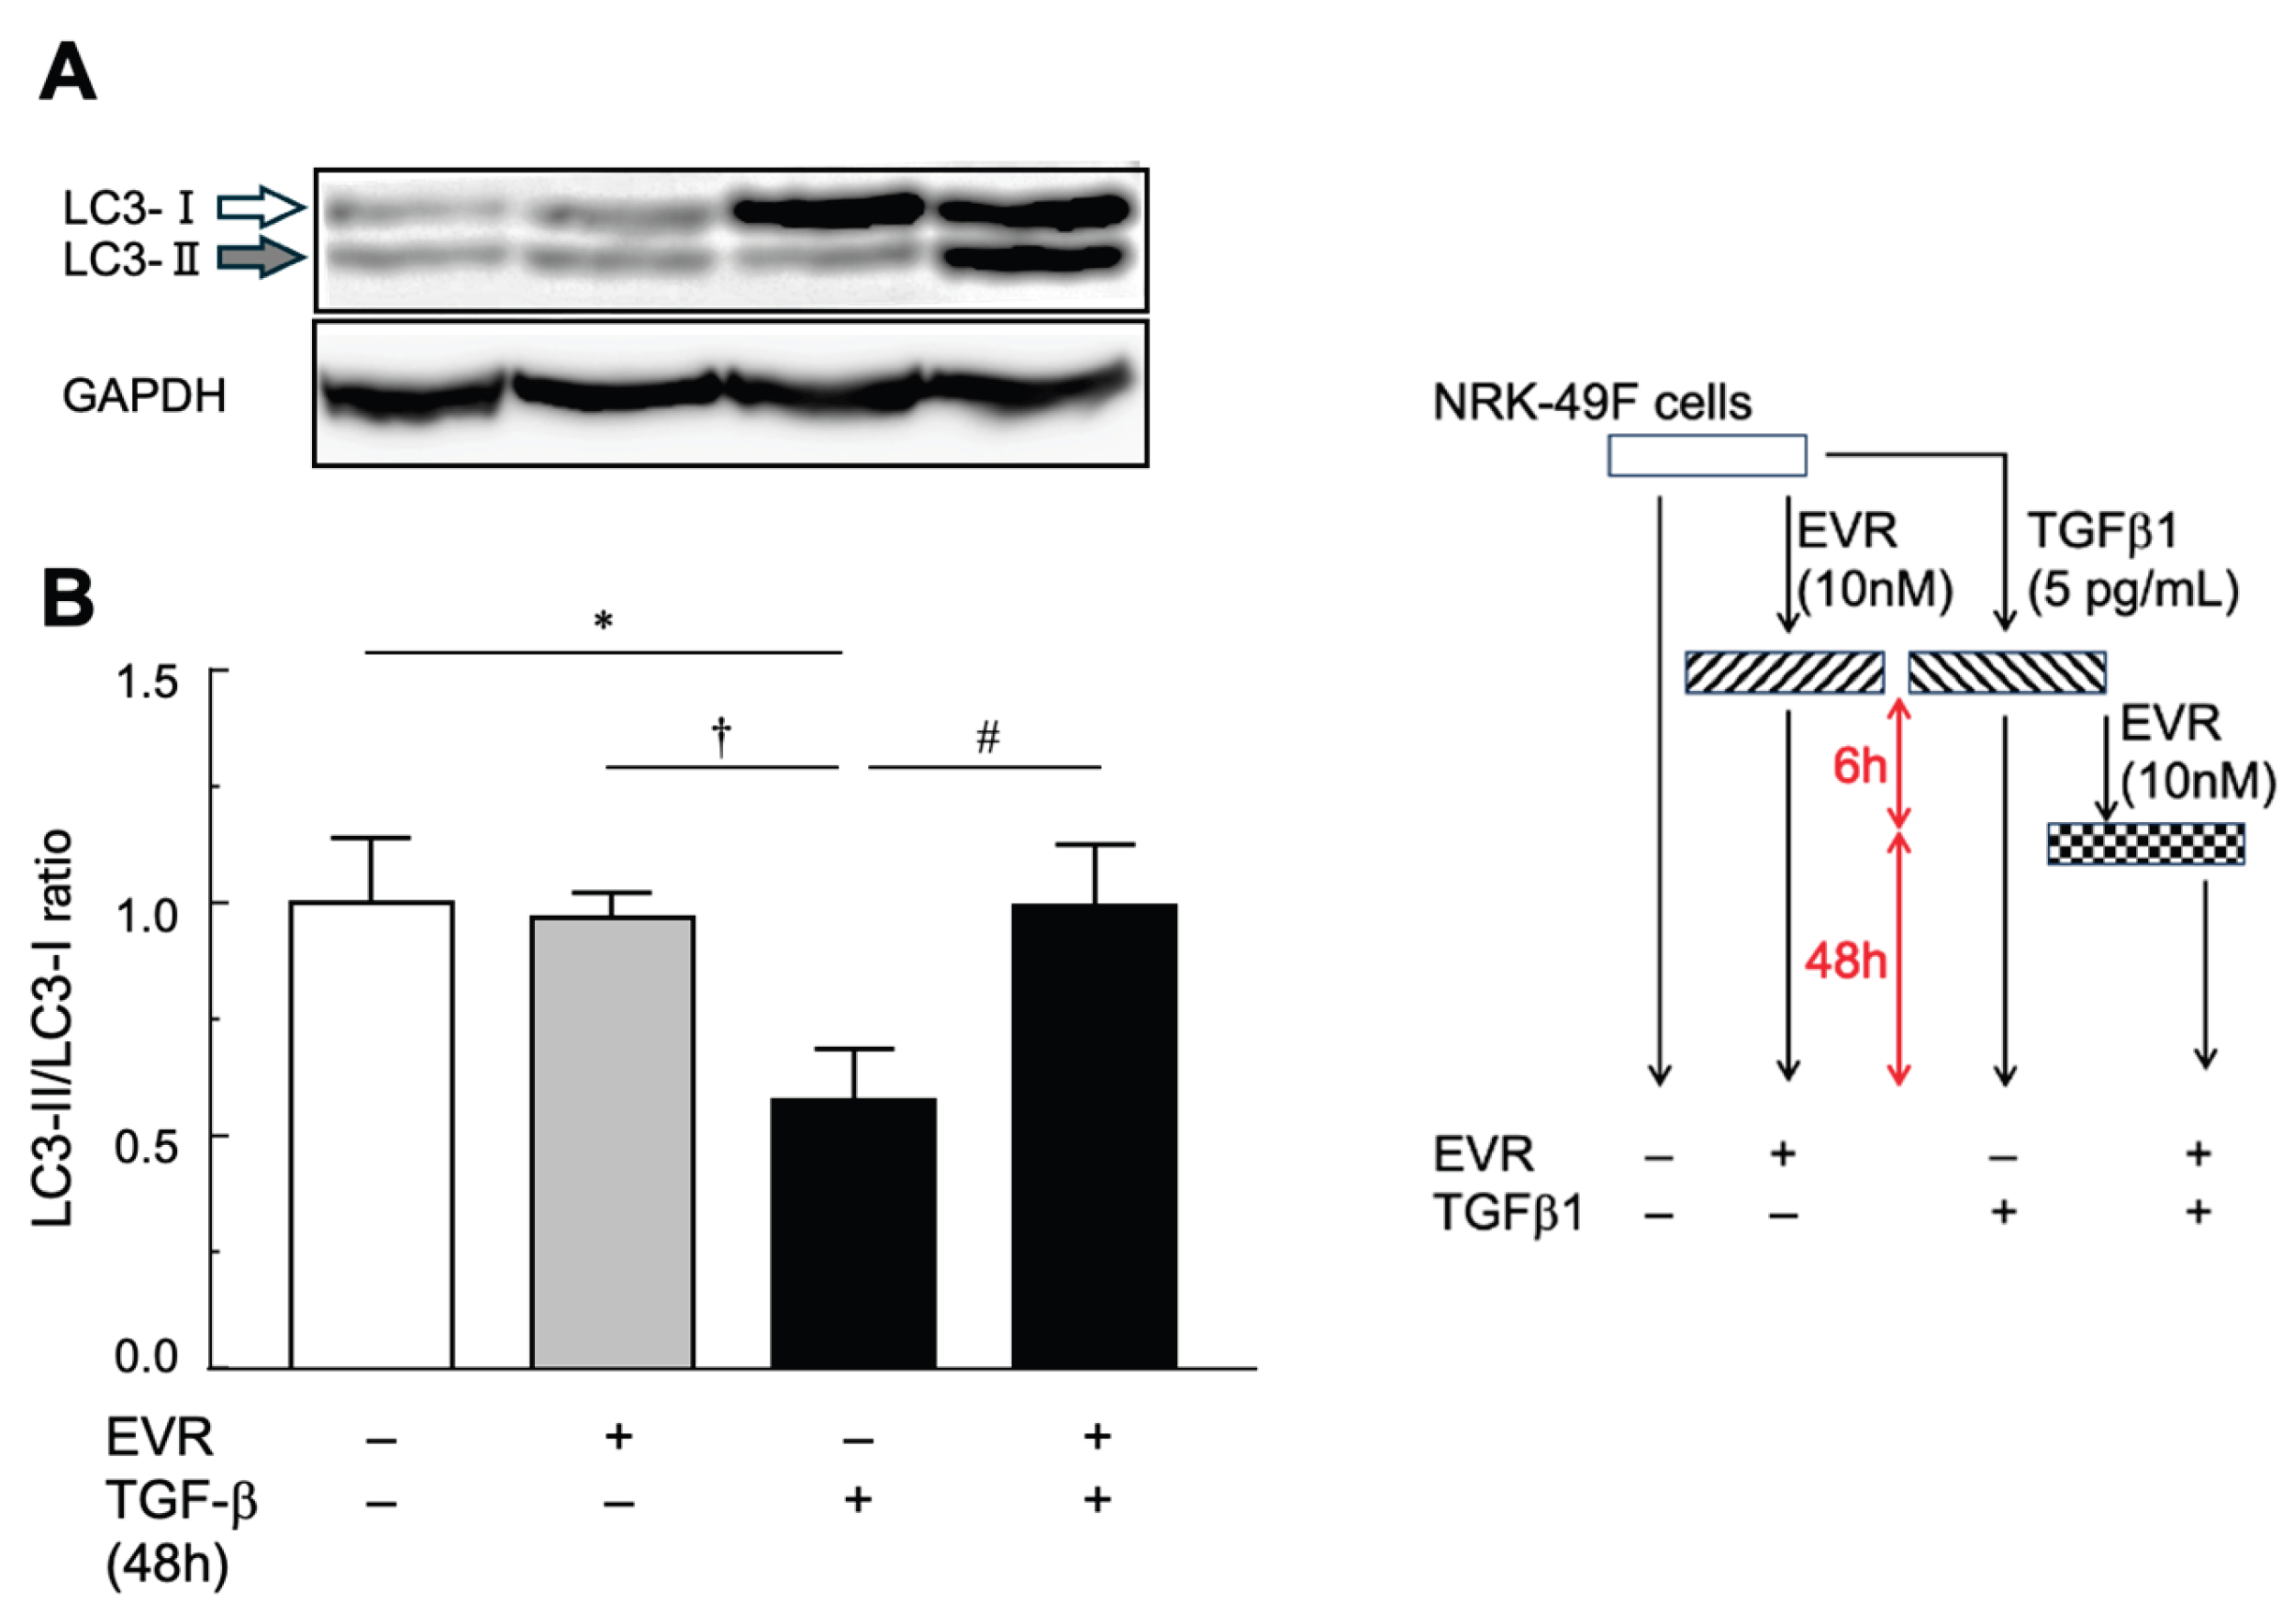
Chronic kidney disease (CKD) is characterized by progressive glomerulosclerosis and interstitial fibrosis, ultimately leading to irreversible renal dysfunction. Tacrolimus, a calcineurin inhibitor widely used after kidney transplantation, is known to accelerate chronic renal injury, whereas everolimus has been introduced as a calcineurin inhibitor–sparing agent. However, their direct effects on renal fibrogenesis remain incompletely defined. In this study, we established a chronic renal failure model using 5/6 nephrectomized rats to evaluate tacrolimus-accelerated renal interstitial fibrosis and the impact of concomitant everolimus treatment. Low-dose tacrolimus (1 mg/kg every other day) administered for two weeks starting four weeks after nephrectomy markedly accelerated interstitial fibrotic progression, accompanied by histological deterioration and increased albuminuria. Co-administration of low-dose everolimus (1 mg/kg every other day) significantly attenuated tacrolimus-accelerated fibrosis and improved functional and structural renal parameters. Histological analyses demonstrated reduced interstitial fibrosis and glomerular alterations in the everolimus-treated group. Although α-smooth muscle actin expression was not significantly suppressed, everolimus restored autophagic activity, as indicated by normalization of the LC3-II/LC3-I ratio in both in vivo and in vitro experiments. These findings indicate that tacrolimus accelerates renal fibrogenesis in a remnant kidney model and that concomitant low-dose everolimus effectively mitigates this progression, providing a time- and cost-efficient experimental platform for evaluating antifibrotic strategies in CKD.

Keywords: 
;  ;  ;  ;  

1. Introduction

Chronic Kidney Disease (CKD) is defined by either structural or functional abnormalities of the kidney—such as albuminuria, atypical urinary sediment, structural changes on imaging, or histopathological findings—or by a persistent reduction in glomerular filtration rate (GFR) below 60 mL/min/1.73 m² for at least three months [1]. Histopathologically, CKD is characterized by glomerulosclerosis, tubular atrophy, and interstitial fibrosis. In many cases, the progression of lifestyle-related diseases such as diabetes mellitus and hypertension, along with aging, contributes to renal tissue injury and promotes the development of CKD[2,3,4]. In Japan, the prevalence of CKD was estimated to be approximately 13.3 million individuals in 2005, corresponding to one in eight adults. More recently, the number of affected individuals has been estimated to reach around 20 million, suggesting that nearly one in five adults may be living with CKD [5,6,7]. As the aging population continues to grow, the burden of CKD is expected to increase further, making it a significant public health concern. Progression of CKD may ultimately lead to end-stage renal disease (ESRD), necessitating renal replacement therapy such as hemodialysis, peritoneal dialysis, or kidney transplantation.
Among these, kidney transplantation is considered one of the most effective treatment options, particularly in terms of improving quality of life (QOL) and long-term outcomes. In Japan, the number of kidney transplants has steadily increased, exceeding 2,000 cases in 2024 [8]. A substantial proportion of these procedures involve living donors, reflecting the country’s reliance on living-donor transplantation. Advances in immunosuppressive therapy have further improved graft survival and long-term clinical outcomes [8,9,10]. Immunosuppressive therapy is indispensable following kidney transplantation, and tacrolimus—a calcineurin inhibitor (CNI)—is widely used as a principal agent. Although tacrolimus provides potent immunosuppressive effects, its prolonged use has been associated with the development of interstitial fibrosis, contributing to chronic allograft dysfunction. These findings have been consistently reported in clinical and histopathological studies [11,12,13,14,15]. Tacrolimus-induced nephrotoxicity is thought to promote structural alterations in renal tissue through mechanisms involving activation of transforming growth factor-beta (TGF-β) signaling, oxidative stress, and vascular injury, and is recognized as a critical determinant of long-term graft outcomes [16,17,18]. Given the efficacy and toxicity profile of tacrolimus, immunosuppressive strategies aimed at reducing CNI-related nephrotoxicity while preserving immune function have been implemented.
Everolimus, an mTOR inhibitor, is recommended in both domestic and international kidney transplant guidelines as a CNI-sparing agent. Clinical studies have demonstrated its efficacy in minimizing CNI-induced renal injury and maintaining long-term graft function [19,20,21,22,23]. Everolimus acts by selectively inhibiting the mammalian target of rapamycin (mTOR), a serine/threonine kinase that integrates environmental and intracellular signals to regulate a broad spectrum of cellular processes, including cell growth, metabolism, proliferation, autophagy, immune responses, survival, and differentiation [24,25].
Recently, we reported the establishment of a rat model of tacrolimus-induced kidney injury with interstitial fibrosis using ischemia-reperfusion (I/R) treatment, demonstrating that tacrolimus alone can induce nephrotoxicity [26]. This model effectively mimics the pathological features observed after kidney transplantation and has been utilized in subsequent studies to investigate the complex mechanisms of tacrolimus-induced nephrotoxicity involving both drug effects and I/R-induced injury. However, assessment of the long-term consequences of ischemia–reperfusion (I/R) injury generally requires more complex experimental designs, such as unilateral nephrectomy combined with I/R, rather than bilateral I/R alone. Such complexity makes it difficult to isolate and interpret tacrolimus-specific effects on chronic fibrotic processes [27].
To overcome these limitations, we therefore employed a 5/6 nephrectomy (Nx) model, which more accurately reflects the progressive nature of chronic renal failure (CRF) and enables consistent, injury-independent assessment of drug-induced renal pathology. The Nx model is well-established for its ability to induce sustained renal dysfunction and interstitial fibrosis through hemodynamic alterations, compensatory hypertrophy, and structural remodeling [28,29,30]. This makes it particularly suitable for dissecting the direct effects of pharmacological agents on renal fibrogenesis. Using this model, we investigated the fibrogenic potential of tacrolimus monotherapy and assessed the therapeutic effects of co-administration with everolimus. Although this combination is clinically applied, its direct impact on renal fibrogenesis and the underlying molecular mechanisms remains insufficiently understood. In the present study, we established a model in which low-dose tacrolimus administration in Nx rats accelerates renal interstitial fibrosis. In addition, the effect of evrolimus coadministration on tacrolimus-accelerated fibrosis was also examined.

2. Results

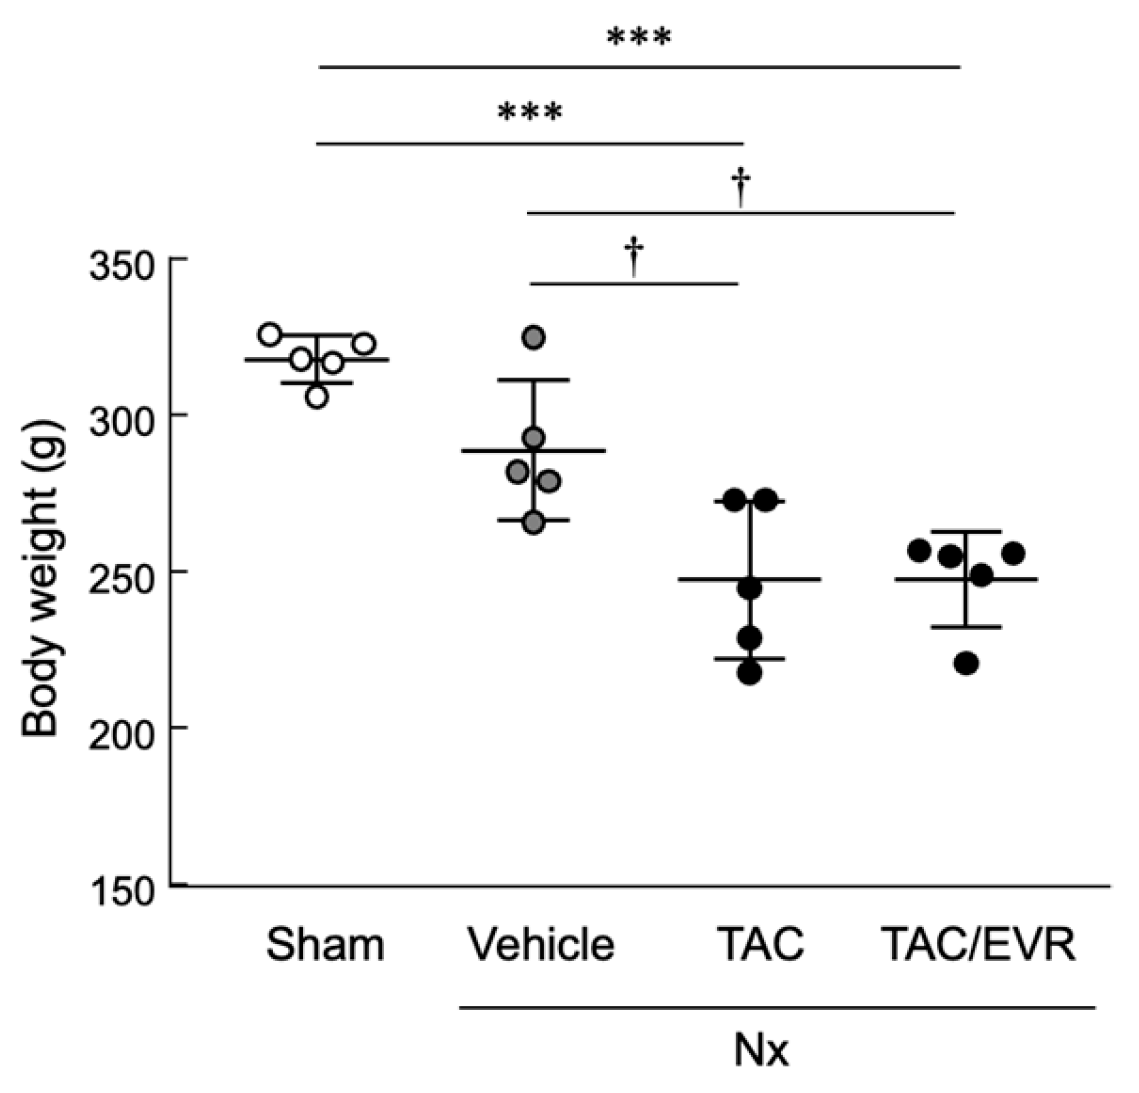
2.1. Evaluation of Renal Functions Following Drug Administration in Nx Rats

Significant body weight loss (approximately 12–21%) was observed in both the TAC and TAC+EVR groups compared to Sham and Vehicle controls in a 5/6 nephrectomy (Nx)-induced CKD rat model (Figure 1). Renal function was concurrently evaluated to assess the effects of tacrolimus (TAC) monotherapy and its combination with everolimus (EVR). Renal function parameters are summarized in Table 1. Plasma creatinine (Pcr) levels were elevated in all Nx rats in comparison with Sham group. TAC administration resulted in a significant increase compared to Vehicle, and EVR co-treatment also led to a significant elevation. Urinary creatinine (Ucr) levels were significantly increased or decreased in all Nx rats compared to Sham grooup. TAC monotherapy further elevated Ucr relative to Vehicle, while EVR co-treatment attenuated this increase, showing no significant difference from Vehicle. Urinary albumin (Ualb) was significantly elevated only in the TAC group compared to Sham group as well as Vehicle group. This increase was mitigated by EVR co-treatment, resulting in values comparable to Vehicle. The urinary albumin-to-creatinine ratio (UACR) was significantly increased in both Vehicle and TAC groups compared to Sham group. Although the UACR was also elevated in the TAC/EVR group, the difference from Sham group was not statistically significant.

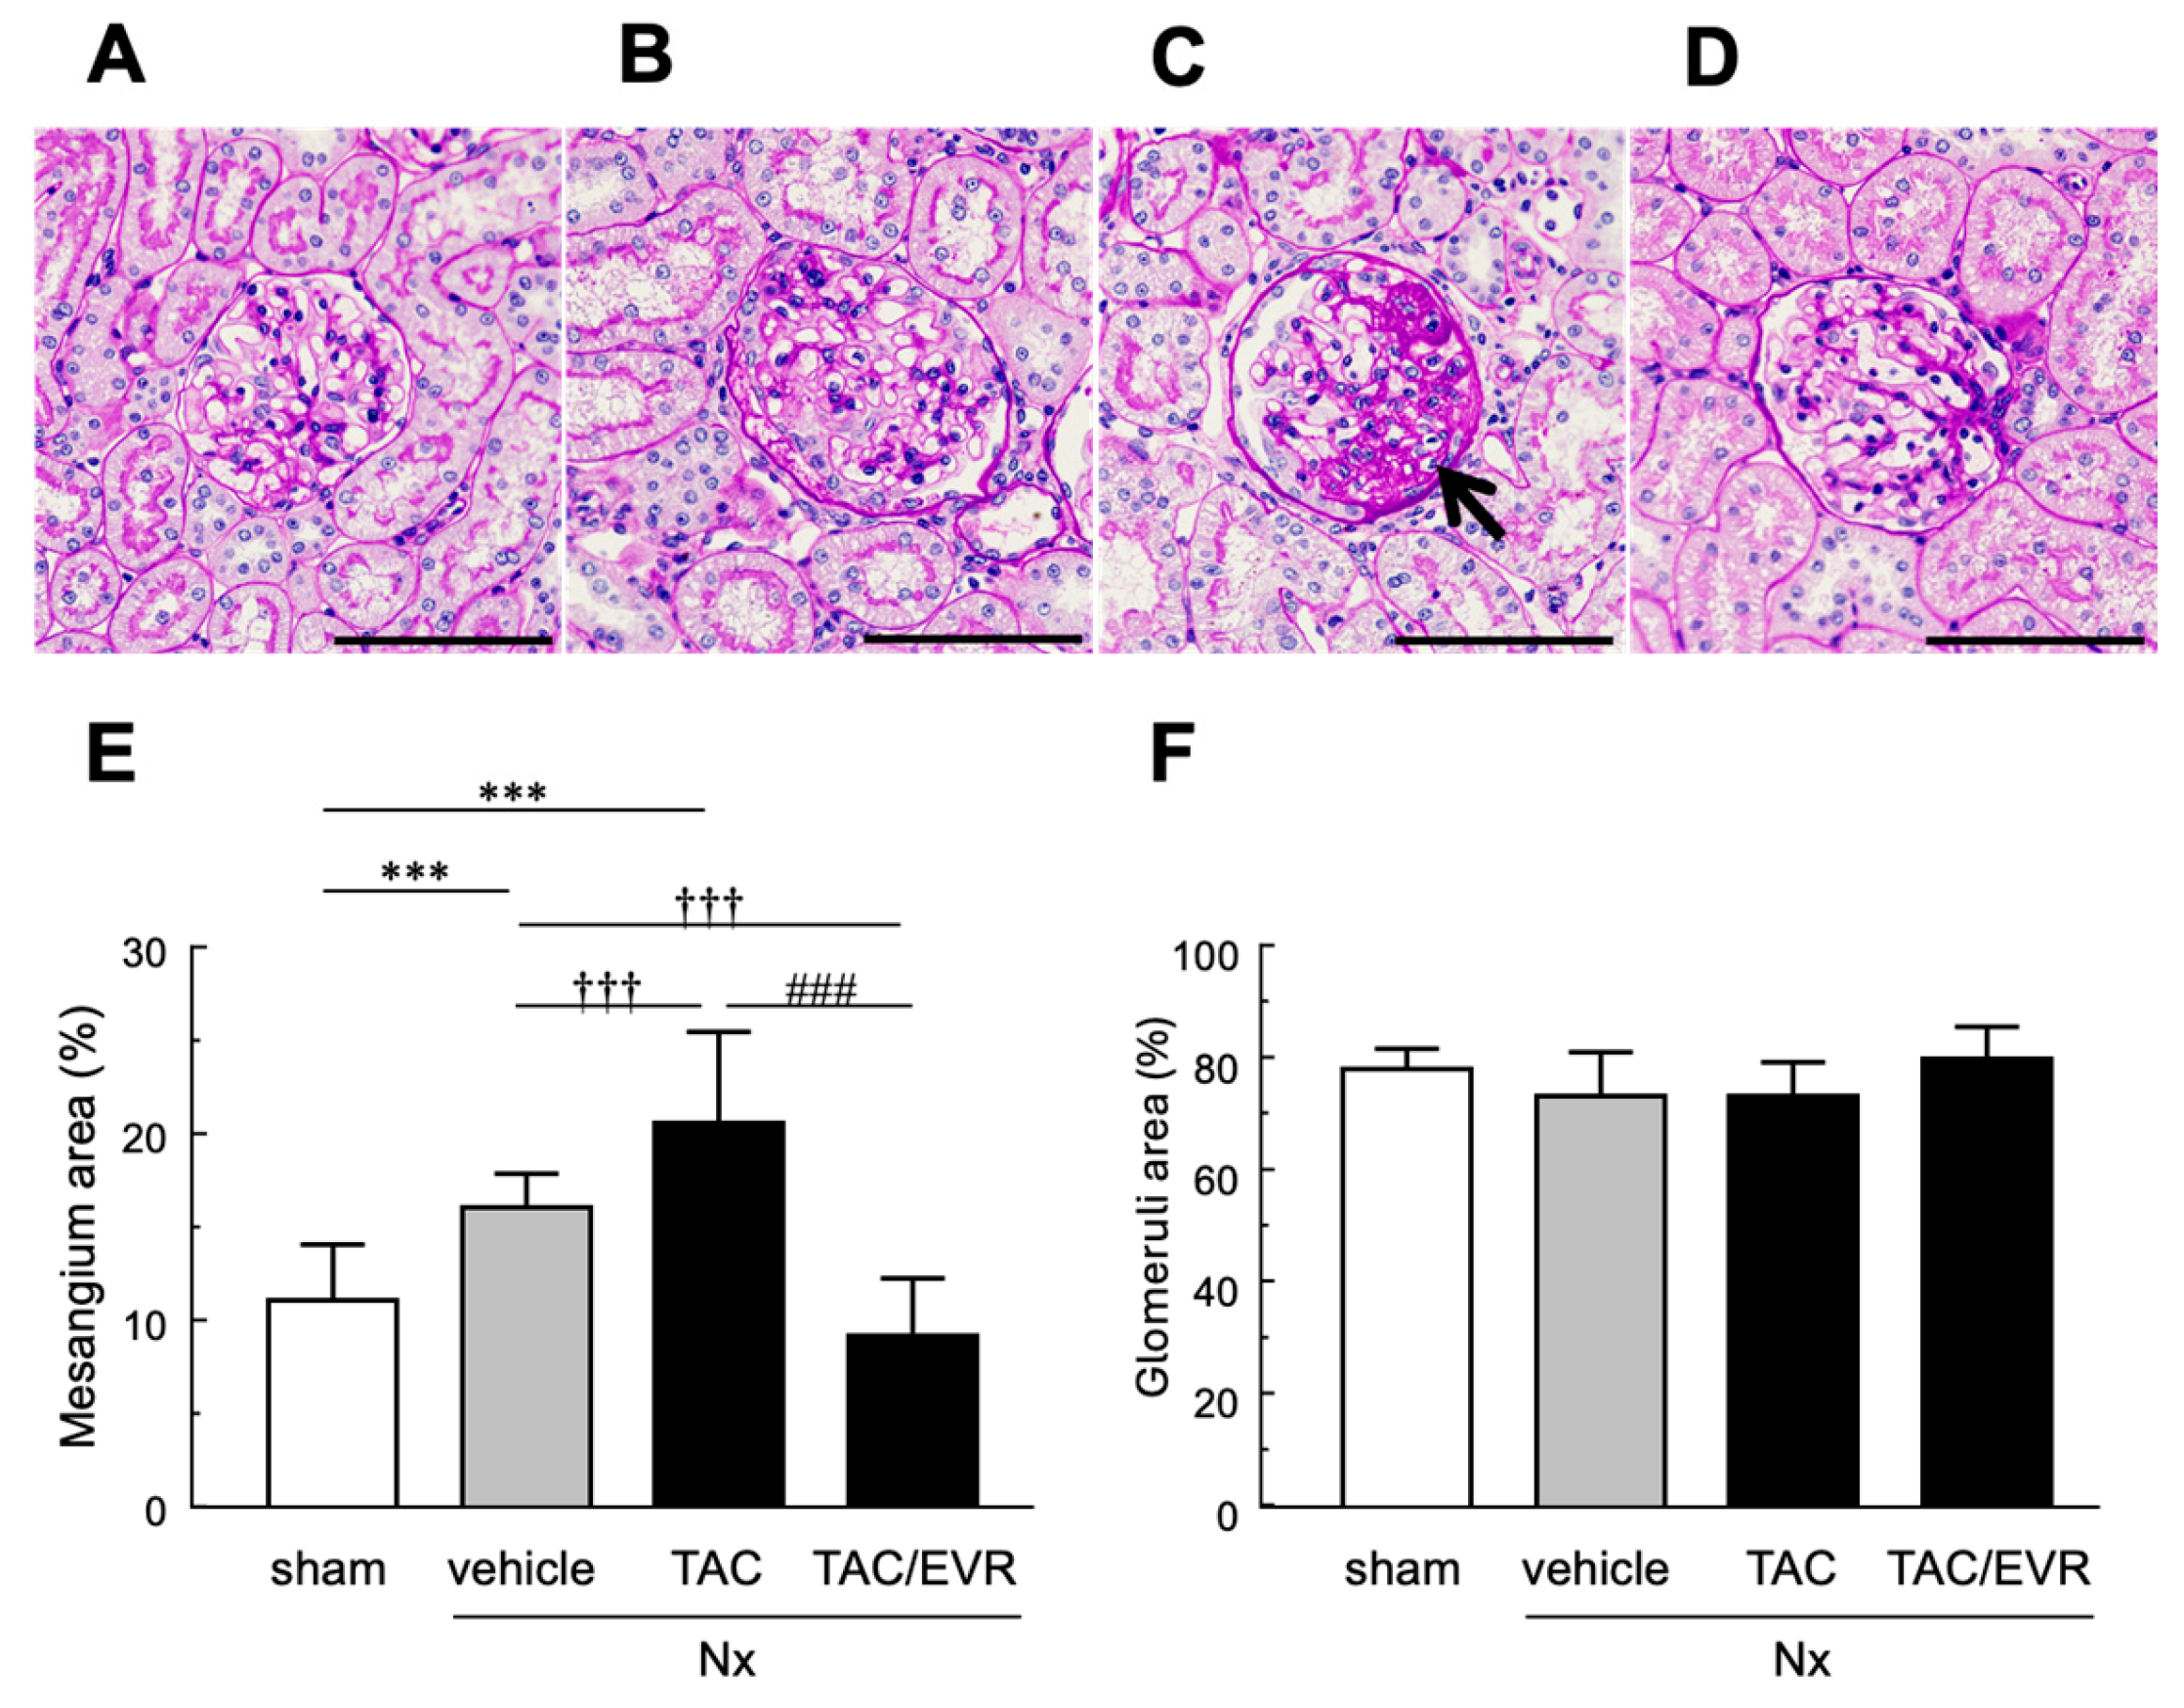
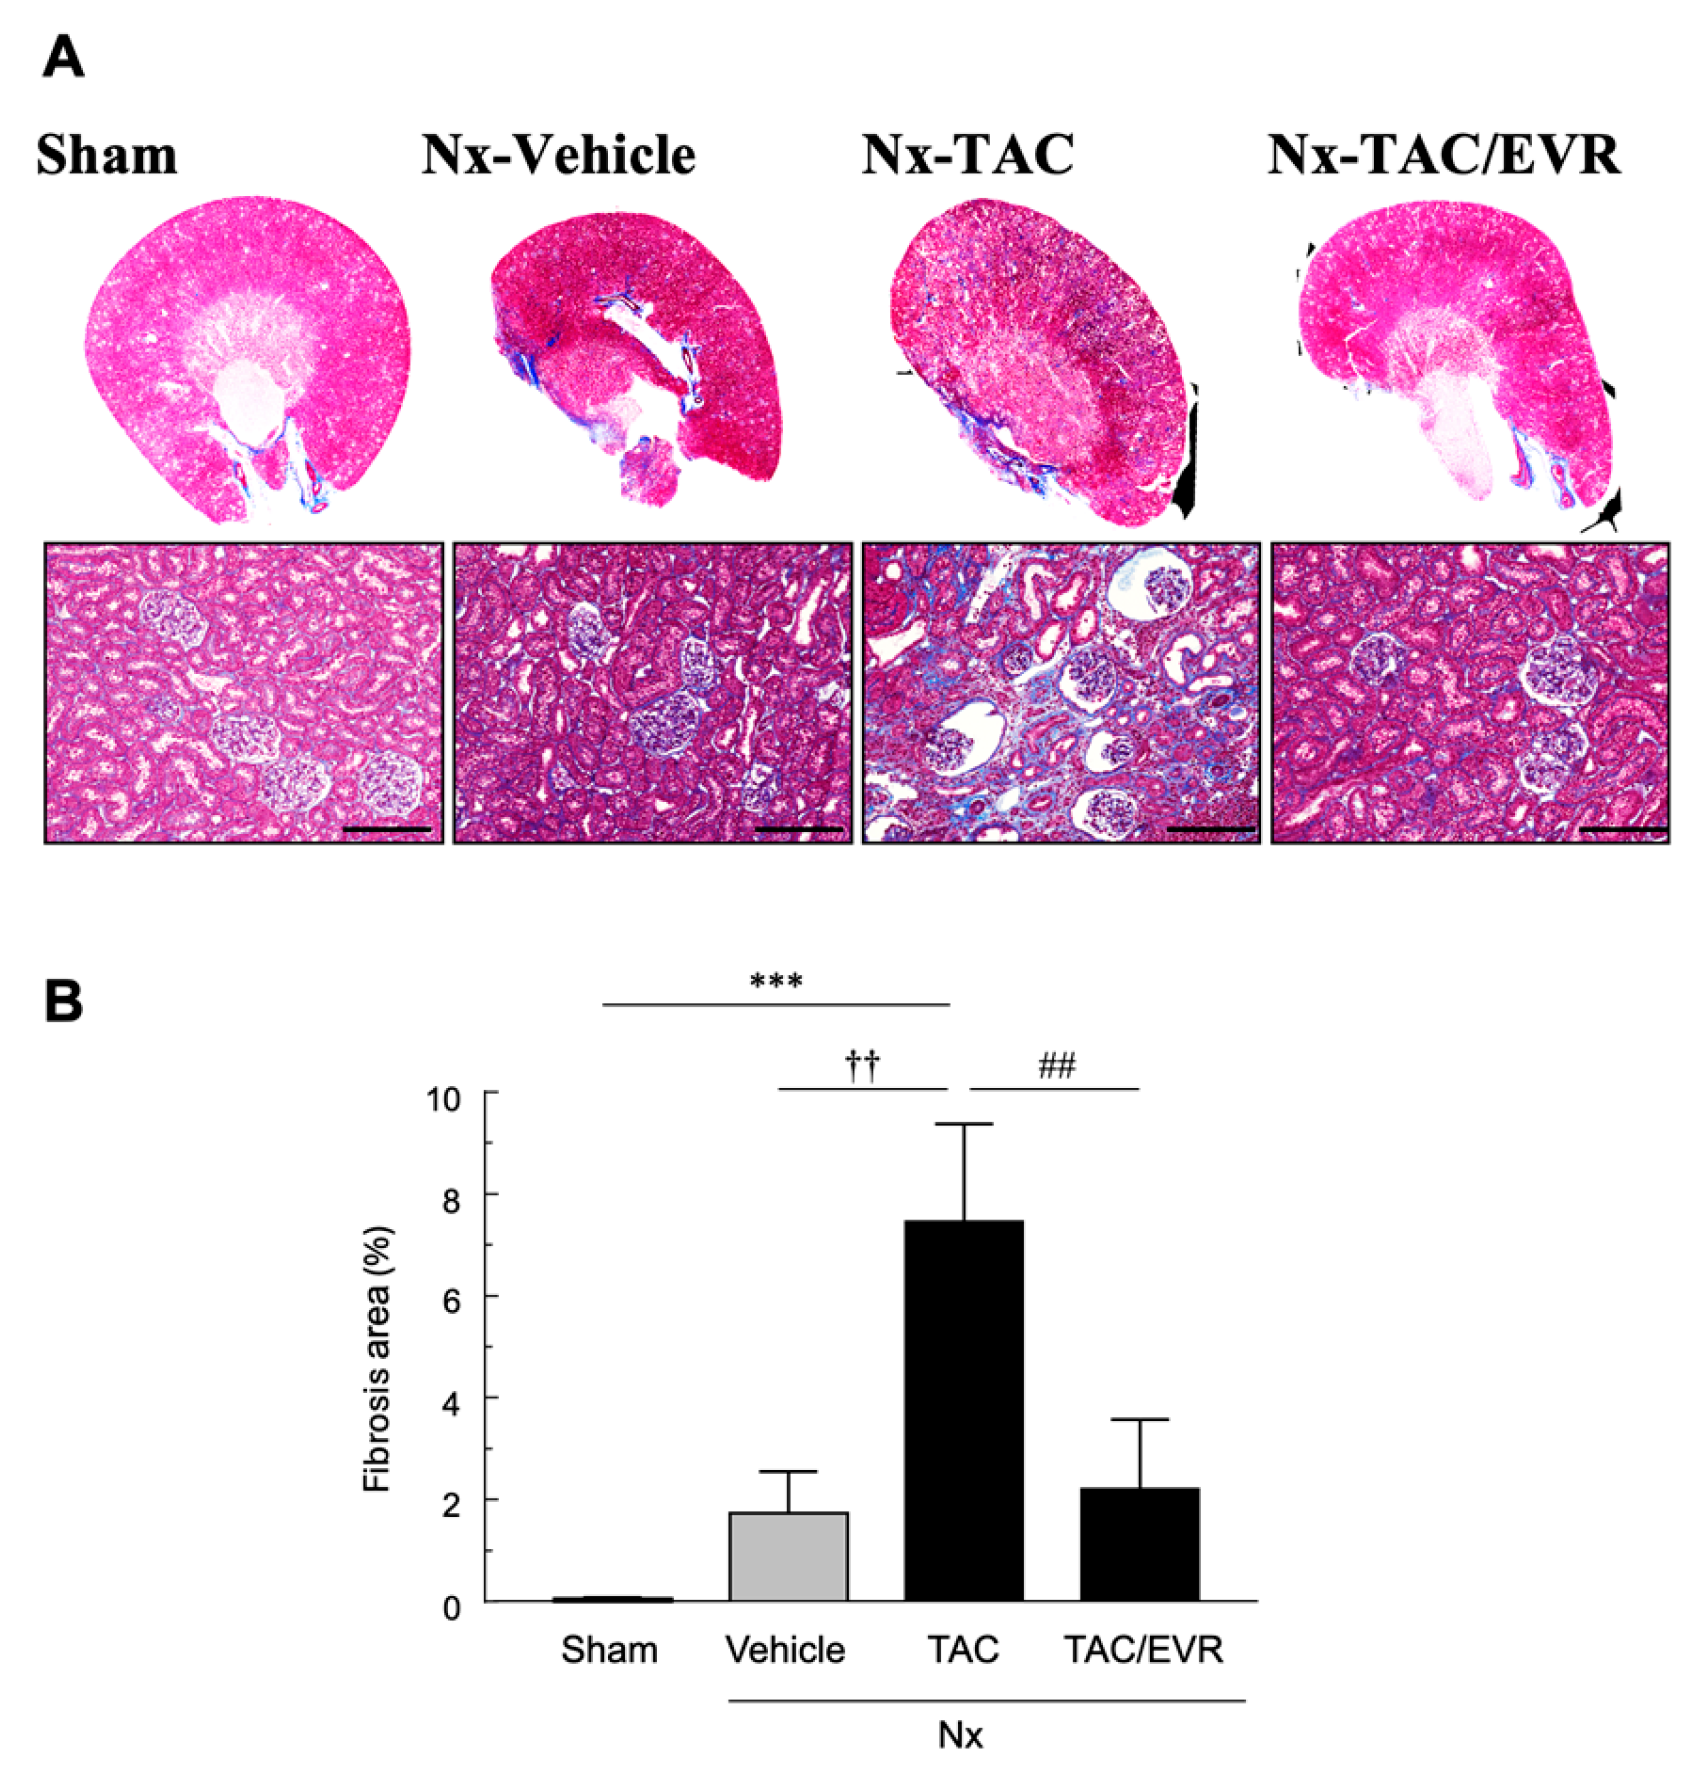
2.2. Histological Evaluation of Renal Tissue Following Drug Treatment

To assess structural changes in the kidneys, the periodic acid–Schiff. (PAS)-stained sections were analyzed to determine the impact of TAC and EVR on glomerular and Bowman’s capsule morphology (Table 2). In the Sham group, the glomerulus diameter (GD)/Bowman’s diameter (BD) ratio was approximately 0.91, and a similar value was observed in the Vehicle group (0.90). In contrast, the TAC group exhibited a significant enlargement of Bowman’s capsule diameter (128 ± 11 µm), while glomerular diameter remained at 106 ± 10 µm, resulting in a reduced ratio of 0.83, indicating glomerular shrinkage and capsular expansion. This structural alteration was not evident in the TAC+EVR group, where the ratio recovered to 0.90, suggesting that combined administration of EVR with TAC mitigated TAC-induced morphological changes. Histological analysis revealed distinct glomerular architecture among groups (Figure 2). Sham group exhibited well-organized capillary loops, minimal mesangial expansion, and normal basement membrane thickness. In the Vehicle group, glomerular hypertrophy and mesangial expansion were observed, accompanied by mild disarray of capillary loops and increased cellularity. Bowman’s capsule showed mild dilation, and PAS-positive regions tended to increase. TAC-treated rats displayed marked glomerular enlargement, pronounced mesangial expansion, loss of capillary loops, and widespread PAS-positive regions. Bowman’s capsule dilation, parietal epithelial cell proliferation, and adhesions were also prominent. In contrast, the TAC/EVR group exhibited only mild to moderate changes, with a tendency toward reduced mesangial area and preserved capillary loop structure. PAS-positive regions and basement membrane thickening remained mild. Analysis of mesangial and glomerular areas (Figure 2E and 2F) confirmed that mesangial area was significantly increased in the Vehicle and TAC groups compared to Sham, whereas it was reduced when EVR was added with TAC. No significant differences in total glomerular area were detected among 4 groups, indicating that the observed mesangial expansion represents a pathological change rather than an artifact of sectioning position.
Histological evaluation using Masson’s trichrome (MT) staining revealed a clear increase in blue-stained interstitial areas in the TAC group. This observation was further supported by quantitative analysis showing a significant elevation in fibrotic area (%). Importantly, this increase induced by TAC was significantly attenuated when EVR was administered in combination with TAC (Figure 3A and 3B).
Western blot analysis demonstrated significant upregulation of α-smooth muscle actin (α-SMA), a fibrosis marker, in both TAC and TAC/EVR groups compared to Sham and Vehicle (Figure 4A). Although EVR was administered in combination with TAC and slightly reduced α-SMA expression relative to TAC alone, the difference was not statistically significant (Figure 4B). Autophagic activity, which is an indicator of pharmacological effect of EVR, assessed by the LC3-II/LC3-I ratio, was significantly decreased in the TAC group compared to Vehicle. EVR co-treatment significantly restored autophagic activity, with LC3-II/LC3-I levels comparable to Vehicle (Figure 5).

2.3. In Vitro Experiments Using NRK-49F Cells

The effects of EVR on fibrogenesis and autophagy were evaluated in vitro using NRK-49F cells derived from rat renal fibroblasts (Figure 6 and Figure 7). EVR alone did not significantly suppress α-SMA expressions compared to untreated controls. TGF-β1 stimulation for 6 hours significantly increased α-SMA levels. After 24 hours from EVR was added to the post-stimulation by TGF-β1, a downward trend in α-SMA expression was observed without statistical significance (Figure 6). Autophagic activity, assessed by LC3-II/LC3-I ratio as a pharmacological effect of EVR, was compared at 48 hours post-TGF-β1 stimulation (Figure 7). TGF-β1 stimulation led to a reduction in LC3-II/LC3-I ratio. Co-treatment with EVR significantly restored LC3-II/LC3-I ratio levels to those of unstimulated controls.

3. Discussion

In the subtotal nephrectomized rat model, progression of CRF is generally characterized by the development of advanced glomerulosclerosis beginning approximately four weeks after surgery, followed by the gradual emergence of interstitial fibrosis over the subsequent weeks [28,30,31,32]. In this context, tacrolimus is known to accelerate the progression of renal injury rather than initiate fibrosis de novo. In the present study, administration of low-dose tacrolimus (1 mg/kg every other day) for two weeks starting four weeks after subtotal nephrectomy markedly accelerated the progression of renal interstitial fibrosis, allowing the establishment of a CRF model with pronounced fibrotic changes within a relatively short experimental period. Importantly, concomitant treatment with low-dose everolimus (1 mg/kg every other day) attenuated tacrolimus-accelerated interstitial fibrosis. In our previous work, everolimus administered at a higher dose (2 mg/kg/day) starting eight weeks after subtotal nephrectomy reduced established interstitial fibrosis [31]. The present findings are consistent with those observations and extend them by demonstrating that a lower-dose regimen, initiated at an earlier stage and in combination with tacrolimus, is sufficient to modulate fibrotic progression, thereby offering a time- and cost-efficient experimental approach.
In the present study, plasma creatinine (Pcr) levels were significantly elevated in the TAC monotherapy group and urinary albumin (Ualb) levels were markedly increased, indicating a disruption of glomerular selective permeability. Albuminuria is widely recognized as an early marker of glomerular injury and is associated with structural damage to the glomerular basement membrane and podocyte injury, contributing to the progression of CRF. In contrast, the EVR co-administered group exhibited significant suppression of Pcr and Ualb elevations, suggesting that EVR mitigated TAC-induced renal injury. As a mammalian target of rapamycin complex 1 (mTORC1) inhibitor, EVR modulates cellular proliferation, metabolic activity, and inflammatory signaling, thereby contributing to the preservation of glomerular architecture and attenuation of fibrotic remodeling [24,25]. Consistent with these effects, glomerular hypertrophy and mesangial expansion were alleviated in the EVR group, and the fibrotic area, as assessed by PAS and MT staining, was significantly reduced (Figure 2 and Figure 3). These structural improvements likely contributed to the normalization of glomerular permeability and reduction in albuminuria. Moreover, albuminuria is not only a marker of glomerular injury but also a pathogenic driver of tubulointerstitial fibrosis and tubular atrophy. Accordingly, the reduction in albuminuria observed with EVR treatment may reflect both glomerular protection and attenuation of downstream tubulointerstitial damage. Taken together, the elevations in Pcr and Ualb observed in the TAC group indicate impaired renal function and glomerular barrier dysfunction, whereas their improvement with EVR co-treatment suggests renoprotective effects at both structural and molecular levels.
The expression of α-SMA, a marker of myofibroblast activation, was significantly increased in both the TAC and EVR groups. Upregulation of α-SMA reflects fibroblast activation and enhanced extracellular matrix (ECM) production. Although a downward trend was observed in the EVR group, the difference was not statistically significant compared to the TAC group, indicating that EVR did not exert sufficient inhibitory effects on fibroblast differentiation (Figure 6). This may be attributed to the fact that mTORC1, the primary target of EVR, does not directly suppress α-SMA transcription. By contrast, the LC3-II/LC3-I ratio, a dynamic marker of autophagic activity, was significantly decreased in the TAC group and significantly restored in the EVR group in both experiments with rat in vivo (Figure 5) and NRK-49F cells (Figure 7). LC3 is essential for autophagosome formation, and the conversion of LC3-I to LC3-II reflects autophagic flux. A reduced LC3-II/LC3-I ratio indicates impaired autophagy and stagnation of intracellular degradation pathways. Furthermore, the recovery of the LC3-II/LC3-I ratio in the EVR group suggests that EVR enhances autophagic activity via mTORC1 inhibition, thereby alleviating cellular stress and suppressing fibrotic progression. These findings suggest that EVR may modulate fibroblast behavior through pathways associated with mTOR inhibition. Collectively, EVR appears to exert multifactorial anti-fibrotic effects against TAC-induced renal injury, potentially contributing to the preservation of glomerular architecture, attenuation of fibroblast activation, and restoration of autophagic homeostasis. As an mTORC1 inhibitor, EVR modulates cellular proliferation, metabolic activity, and inflammatory signaling, which may underlie its renoprotective properties [31,33]. Taken together, EVR offers a dual capacity to suppress fibrogenic signaling and restore autophagic homeostasis, providing a strong rationale for future translational studies to optimize post-transplant immunosuppressive strategies.
A limitation of this study is that fibrogenic signaling pathways were not comprehensively analyzed; however, our primary objective was to establish a practical and reproducible model for evaluating drug-accelerated renal fibrosis rather than to dissect detailed molecular mechanisms.

4. Materials and Methods

4.1. Test Substances and Reagents

TAC (FK-506) and EVR were purchased from LC Laboratories, Inc. (Boston, MA, USA). Midazolam, used in the preparation of the mixed anesthetic solution, was obtained from Sandoz, Inc. (Tokyo, Japan), while medetomidine and butorphanol were purchased from Meiji Seika Pharma Co., Ltd. (Tokyo, Japan) and combined according to standard protocols. Cremophor EL, used as a vehicle, was purchased from Nacalai Tesque, Inc. (Kyoto, Japan), dissolved in physiological saline, and administered accordingly. All other reagents used in this study were of special grade or higher.

4.2. In Vivo Experiments Using Rats

4.2.1. Drug Administration in the CRF Model

An Nx model was employed to reproduce the pathological features of CRF in the present study. Mixed anesthetic agents were administered subcutaneously at 1 mL/kg body and the kidneys were exposed under aseptic conditions via a ventral abdominal incision. The right kidney was removed, and the posterior and anterior apical segmental branches of the left renal artery were individually ligated as described [34,35]. In sham-operated animals used as controls, the peritoneal cavity was exposed, both kidneys were gently manipulated, and the abdominal incision was closed with 4-0 silk sutures. After surgery, all animals were allowed free access to water and standard rat chow. The administration of drugs was initiated at 4 weeks after surgery.
A total of 20 rats underwent surgery and were randomly assigned to four groups: Sham, untreated CRF: Nx, TAC-treated CRF: Nx-TAC, and TAC+EVR-treated CRF: Nx-TAC/EVR. TAC (1 mg/kg) and TAC+EVR (1 mg/kg each) were administered subcutaneously every other day for two weeks. The control group received vehicle (20% w/v Cremophor EL in saline, 1 mL/kg).

4.2.2. Evaluation of Renal Function and Injury

Blood samples were centrifuged immediately after collection, and plasma was used to measure plasma creatinine using the LabAssay™ Creatinine Kit (FUJIFILM Wako Pure Chemical Industries, Ltd., Osaka, Japan). Urinary creatinine and albumin concentrations were measured using the QuantiChrom™ BCG Albumin Assay Kit (BioAssay Systems, Hayward, CA, USA). The UACR was calculated to assess glomerular and tubulointerstitial injury.

4.2.3. Morphological Evaluation of Renal Lesions

The remnant left kidney was fixed in Carnoy’s solution (ethanol: chloroform: acetic acid = 6:3:1), embedded in paraffin, and sectioned at 3–4 μm thickness. Sections were stained with MT and PAS using standard protocols. Stained slides were examined using a BZ9000 microscope (KEYENCE Ltd., Osaka, Japan), and images were analyzed with ImageJ® software (NIH, Bethesda, MD, USA) to quantify stained areas. For PAS-stained sections, glomerular hypertrophy due to basement membrane thickening and mesangial expansion was evaluated by imaging 15 glomeruli per kidney at 60× magnification. The diameters of glomeruli and Bowman’s capsules were calculated as the median of 12 Martin’s diameters measured across each glomerulus

4.2.4. Western Blot Analysis

The remnant kidney was snap-frozen in liquid nitrogen and stored at −80 °C. After thawing on ice, 100 mg of tissue was homogenized in 1 mL of lysis buffer (50 mM Tris-HCl pH 8.0, 150 mM NaCl, 10 mM NaF, 1 mM Na₄P₂O₇, 1% NP-40, 1% protease inhibitor cocktail [Sigma-Aldrich Inc., USA]) using a homogenizer (QIAGEN GmbH, Germany). Lysates were centrifuged at 13,000 rpm for 15 min at 4 °C. Protein concentrations were determined by the Bradford method [36], and equal amounts (10 µg/20 µL) were subjected to SDS-PAGE. Proteins were transferred to PVDF membranes, blocked, and probed with primary antibodies: anti-α-SMA (1:1000; Sigma-Aldrich, USA), anti-GAPDH (1:20000; Proteintech, USA), and anti-LC3 (1:3000; MBL, Japan). HRP-conjugated goat anti-mouse IgG (Abcam plc, Cambridge, UK) was used as the secondary antibody. Signals were detected using ImmunoStar® LD (FUJIFILM Wako) and visualized with LAS3000 (FFHC, Tokyo, Japan). Band intensities were normalized to GAPDH and quantified using ImageJ®.

4.3. In Vitro Experiments Using Cell Lines

4.3.1. Cell Culture and Drug Treatment

NRK49F cells were obtained from JCRB (Osaka, Japan) and cultured at 37 °C in 5% CO₂/95% air at 37 °C using Dulbecco’s modified Eagle’s medium (DMEM, high glucose; FUJIFILM Wako, Japan) supplemented with 5% or 10% FBS, respectively. After switching to 0.5% FBS medium, cells were seeded in 6-well plates, and simultaneously treated with 5 ng/mL TGF-β1 and 10 nM EVR for 48 h. In a separate experiment, cells were pretreated with TGF-β1 for 6h, washed, and then treated with EVR for an additional 48 h.

4.3.2. Western Blot Analysis

After treatment, NRK49F cells were washed with PBS and lysed using either CelLytic M® reagent (Sigma-Aldrich) with protease inhibitors or custom lysis buffer (50 mM Tris-HCl pH 8.0, 150 mM NaCl, 10 mM NaF, 1 mM Na₄P₂O₇, 1% NP-40, 1% protease inhibitor cocktail [P8340, Sigma-Aldrich]). Lysates were centrifuged at 15,000 × g for 15 min at 4 °C. Protein concentrations were measured by the Bradford method and adjusted to 10 µg/20 µL. Samples were mixed with EzApply® (ATTO, Osaka, Japan) containing DTT and heated at 100 °C for 5 min. Western blotting was performed using primary antibodies against α-SMA (1:1000; Sigma-Aldrich), LC3 (1:1000; MBL), and GAPDH (1:10000; Proteintech), followed by HRP-conjugated goat anti-mouse IgG (Abcam). Signals were detected using ImmunoStar LD and LAS3000, and quantified using ImageJ with GAPDH as the internal control.

4.4. Statistical Analysis

Data are expressed as the mean ± standard error of the mean (SEM). Statistical comparisons among groups were performed using one-way ANOVA. A p-value < 0.05 was considered as statistically significant.

5. Conclusions

In the present study, we established a CRF model in which low-dose TAC administration accelerated the progression of renal interstitial fibrosis following subtotal nephrectomy. Importantly, concomitant treatment with low-dose EVR attenuated TAC-accelerated fibrotic progression and improved functional and structural renal parameters. Compared with previously reported high-dose or late-intervention regimens, the present low-dose and early-intervention approach enables efficient evaluation of drug-induced fibrogenic progression within a shorter experimental period. This model provides a practical and reproducible platform for assessing pharmacological modulation of chronic renal fibrosis and may contribute to optimizing immunosuppressive strategies aimed at minimizing long-term renal injury.

Author Contributions

Conceptualization, Y.N. and S.M.; methodology, S.M.; investigation, Y.N, S.K. and S.M.; data curation, Y.N.; writing—original draft preparation, Y.N.; writing—review and editing, S.M.; visualization, S.K.; supervision, S.M.; funding acquisition, Y.N. and S.M. All authors have read and agreed to the published version of the manuscript.

Funding

This work was partially supported by the Japan Society for the Promotion of Science (JSPS) KAKENHI (Grant Numbers JP23K14399 to Y.N. and JP22K06736 to S.M.).

Institutional Review Board Statement

The animal study protocol was approved by the Institutional Review Board of Himeji Dokkyo University (protocol code R03-02) on 27th August, 2021.

Informed Consent Statement

Not applicable.

Data Availability Statement

The data supporting the findings of this study are not publicly available but can be shared by the corresponding author upon reasonable request.

Acknowledgments

The authors would like to express their sincere gratitude to Mrs. Miho Sumita for her dedicated care and technical assistance in animal handling throughout this study. The authors also thank the undergraduate members of our laboratory for their valuable support in data collection and daily maintenance of the experimental animals.

Conflicts of Interest

The authors declare no conflicts of interest.

Abbreviations

The following abbreviations are used in this manuscript:
CRF chronic renal failure
CKD chronic kidney disease
ESRD end-stage renal disease
GFR glomerular filtration rate
TAC tacrolimus
EVR everolimus
Nx 5/6 nephrectomy
PAS periodic acid–Schiff
MT Masson’s trichrome
Pcr plasma creatinine
Ucr urinary creatinine
Ualb urinary albumin
UACR urine albumin-creatinine ratio
GD glomerulus diameter
BD Bowman’s diameter
ANOVA 1-way analysis of variance
α-SMA alpha-smooth muscle actin
GAPDH glyceraldehyde-3-phosphate dehydrogenase
LC3 microtubule-associated protein 1 light chain 3
TGF-β transforming growth factor-beta
SEM standard error of the mean
mTORC1 mammalian target of rapamycin complex 1
ECM extracellular matrix
SDS-PAGE Sodium Dodecyl Sulfate–Polyacrylamide Gel Electrophoresis
PVDF polyvinylidene difluoride
DMEM Dulbecco’s modified Eagle’s medium
PBS phosphate-buffered saline
DTT dithiothreitol
HRP horseradish peroxidase

References

  1. Chen, T. K.; Knicely, D. H.; Grams, M. E. Chronic Kidney Disease Diagnosis and Management: A Review. JAMA 2019, 322(13), 1294–1304. [Google Scholar] [CrossRef]
  2. Huang, R.; Fu, P.; Ma, L. Kidney fibrosis: from mechanisms to therapeutic medicines. Signal Transduct Target Ther 2023, 8(1), 129. [Google Scholar] [CrossRef] [PubMed]
  3. Jiang, M.; Chen, H.; Luo, J.; Chen, J.; Gao, L.; Zhu, Q. Characterization of diabetic kidney disease in 235 patients: clinical and pathological insights with or without concurrent non-diabetic kidney disease. BMC Nephrology 2025, 26, 29. [Google Scholar] [CrossRef] [PubMed]
  4. Yamamoto, T.; Isaka, Y. Pathological mechanisms of kidney disease in ageing. Nat Rev Nephrol 2024, 20(9), 603–615. [Google Scholar] [CrossRef]
  5. Imai, E.; Horio, M.; Watanabe, T.; Iseki, K.; Yamagata, K.; Hara, S.; Ura, N.; Kiyohara, Y.; Moriyama, T.; Ando, Y.; Fujimoto, S.; Konta, T.; Yokoyama, H.; Makino, H.; Hishida, A.; Matsuo, S. Prevalence of chronic kidney disease in the Japanese general population. Clin Exp Nephrol Correction in Clin Exp Nephrol 2009, 13, 631–632. https://doi.org/10.1007/s10157-009-0238-7.. 2009, 13(6), 621–30. [Google Scholar] [CrossRef] [PubMed]
  6. Kobayashi, A.; Hirano, K.; Okuda, T.; Ikenoue, T.; Yokoo, T.; Fukuma, S. Estimating the prevalence of chronic kidney disease in the older population using health screening data in Japan. Clin Exp Nephrol 2025, 29(3), 276–282. [Google Scholar] [CrossRef]
  7. Japanese Society of, N., CKD Clinical Guide 2024; Tokyo Igakusha: Tokyo, 2024.
  8. Japanese Society for Clinical Renal, T.; Japanese Society for, T. Renal transplant registry report in Japan: Annual statistics and follow-up results of cases performed in 2023. Japanese Journal of Transplantation 2024, 59(3), 217–236. [Google Scholar]
  9. Goto, S.; Fujii, H.; Mieno, M.; Yagisawa, T.; Abe, M.; Nitta, K.; Nishi, S. Survival benefit of living donor kidney transplantation in patients on hemodialysis. Clin Exp Nephrol 2024, 28(2), 165–174. [Google Scholar] [CrossRef]
  10. Hamahata, Y.; Tanabe, K.; Takagi, T. Outcomes of kidney transplants from elderly living donors: A retrospective cohort study in Japan. Tokyo Women’s Medical University Journal 2024, Advance Publication.
  11. Henkel, L.; Jehn, U.; Tholking, G.; Reuter, S. Tacrolimus-why pharmacokinetics matter in the clinic. Front Transplant 2023, 2, 1160752. [Google Scholar] [CrossRef]
  12. Kim, H.; Han, A.; Ahn, S.; Min, S. K.; Ha, J.; Min, S. Association of high intra-patient variability in tacrolimus exposure with calcineurin inhibitor nephrotoxicity in kidney transplantation. Sci Rep 2023, 13(1), 16502. [Google Scholar] [CrossRef]
  13. Okumi, M.; Unagami, K.; Kakuta, Y.; Ochi, A.; Takagi, T.; Ishida, H.; Tanabe, K.; Japan Academic Consortium of Kidney, T. Elderly living donor kidney transplantation allows worthwhile outcomes: The Japan Academic Consortium of Kidney Transplantation study. Int J Urol 2017, 24(12), 833–840. [Google Scholar] [CrossRef] [PubMed]
  14. Schagen, M. R.; Volarevic, H.; Francke, M. I.; Sassen, S. D. T.; Reinders, M. E. J.; Hesselink, D. A.; de Winter, B. C. M. Individualized dosing algorithms for tacrolimus in kidney transplant recipients: current status and unmet needs. Expert Opin Drug Metab Toxicol Correction in Expert Opin Drug Metab Toxicol 2023, 19(9), i. https://doi.org/10.1080/17425255.2023.2264099. 2023, 19(7), 429–445. [Google Scholar] [CrossRef] [PubMed]
  15. Wang, X.; Liu, Z.; Chen, J.; Chai, Y.; Shao, X.; Xie, W.; Zheng, K.; You, J.; Wang, Z.; Feng, M. Impact of intra-patient variability of tacrolimus on allograft function and CD4 + /CD8 + ratio in kidney transplant recipients: a retrospective single-center study. Int J Clin Pharm 2024, 46(4), 918–925. [Google Scholar] [CrossRef] [PubMed]
  16. Liang, K.; Garvi, E. S.; Slaats, G.; Verhaar, M.; Masereeuw, R.; van Genderen, A. M. #2617 Advanced kidney models to better understand tacrolimus-induced nephrotoxicity. Nephrology Dialysis Transplantation 2025, 40 (Supplement_3), gfaf116.1098. [Google Scholar] [CrossRef]
  17. Maslauskiene, R.; Vaiciuniene, R.; Radzeviciene, A.; Tretjakovs, P.; Gersone, G.; Stankevicius, E.; Bumblyte, I. A. The Influence of Tacrolimus Exposure and Metabolism on the Outcomes of Kidney Transplants. Biomedicines 2024, 12(5), 1125. [Google Scholar] [CrossRef]
  18. van Schaik, M.; Bredewold, O. W.; Priester, M.; Michels, W. M.; Rabelink, T. J.; Rotmans, J. I.; Teng, Y. K. O. Long-term renal and cardiovascular risks of tacrolimus in patients with lupus nephritis. Nephrol Dial Transplant 2024, 39(12), 2048–2057. [Google Scholar] [CrossRef]
  19. Arns, W.; Philippe, A.; Ditt, V.; Hauser, I. A.; Thaiss, F.; Sommerer, C.; Suwelack, B.; Dragun, D.; Hillen, J.; Schiedel, C.; Elsasser, A.; Nashan, B. Everolimus plus reduced calcineurin inhibitor prevents de novo anti-HLA antibodies and humoral rejection in kidney transplant recipients: 12-month results from the ATHENA study. Front Transplant 2023, 2, 1264903. [Google Scholar] [CrossRef]
  20. Budde, K.; Chadban, S.; Ciechanowska, D.; et al. Two-year outcomes in de novo renal transplant recipients receiving everolimus-facilitated calcineurin inhibitor reduction regimen: results from the randomized TRANSFORM study. Transplantation 2021, 105(1), 101–110. [Google Scholar]
  21. Mulgaonkar, S.; Pascual, J.; Chadban, S.; et al. In Everolimus with reduced calcineurin inhibitor exposure in de novo kidney transplant recipients: efficacy and safety outcomes from the TRANSFORM study, American Transplant Congress 2018, Seattle, WA, 2018; Seattle, WA, 2018.
  22. Philippe, A.; Arns, W.; Ditt, V.; Hauser, I. A.; Thaiss, F.; Sommerer, C.; Suwelack, B.; Dragun, D.; Hillen, J.; Schiedel, C.; Elsasser, A.; Nashan, B. Impact of everolimus plus calcineurin inhibitor on formation of non-HLA antibodies and graft outcomes in kidney transplant recipients: 12-month results from the ATHENA substudy. Front Transplant 2023, 2, 1273890. [Google Scholar] [CrossRef]
  23. Su, L.; Tam, N.; Deng, R.; Chen, P.; Li, H.; Wu, L. Everolimus-based calcineurin-inhibitor sparing regimens for kidney transplant recipients: a systematic review and meta-analysis. Int Urol Nephrol 2014, 46(10), 2035–44. [Google Scholar] [CrossRef]
  24. Kajiwara, M.; Masuda, S. Role of mTOR Inhibitors in Kidney Disease. International Journal of Molecular Sciences 2016, 17(6), E975. [Google Scholar] [CrossRef]
  25. Masuda, S.; Lemaitre, F.; Barten, M. J.; Bergan, S.; Shipkova, M.; van Gelder, T.; Vinks, S.; Wieland, E.; Bornemann-Kolatzki, K.; Brunet, M.; de Winter, B.; Dieterlen, M.-T.; Elens, L.; Ito, T.; Johnson-Davis, K.; Kunicki, P. K.; Lawson, R.; Lloberas, N.; Marquet, P.; Millan, O.; Mizuno, T.; Moes, D. J. A. R.; Noceti, O.; Oellerich, M.; Pattanaik, S.; Pawinski, T.; Seger, C.; van Schaik, R.; Venkataramanan, R.; Walson, P.; Woillard, J.-B.; Langman, L. J. Everolimus Personalized Therapy: Second Consensus Report by the International Association of Therapeutic Drug Monitoring and Clinical Toxicology. Therapeutic Drug Monitoring 2025, 47(1), 4–31. [Google Scholar] [PubMed]
  26. Fu, R.; Tajima, S.; Shigematsu, T.; Zhang, M.; Tsuchimoto, A.; Egashira, N.; Ieiri, I.; Masuda, S. Establishment of an experimental rat model of tacrolimus-induced kidney injury accompanied by interstitial fibrosis. Toxicol Lett 2021, 341, 43–50. [Google Scholar] [PubMed]
  27. Yang, B.; Jain, S.; Pawluczyk, I. Z.; Imtiaz, S.; Bowley, L.; Ashra, S. Y.; Nicholson, M. L. Inflammation and caspase activation in long-term renal ischemia/reperfusion injury and immunosuppression in rats. Kidney Int 2005, 68(5), 2050–67. [Google Scholar] [PubMed]
  28. Brenner, B. M.; Lawler, E. V.; Mackenzie, H. S. The hyperfiltration theory: A paradigm shift in nephrology. Kidney Int 1996, 49(6), 1774–1777. [Google Scholar]
  29. Horiba, N.; Masuda, S.; Takeuchi, A.; Saito, H.; Okuda, M.; Inui, K. Gene expression variance based on random sequencing in rat remnant kidney. Kidney Int 2004, 66(1), 29–45. [Google Scholar]
  30. Nakamura, N.; Masuda, S.; Takahashi, K.; Saito, H.; Okuda, M.; Inui, K. Decreased expression of glucose and peptide transporters in rat remnant kidney. Drug Metab Pharmacokinet 2004, 19(1), 41–7. [Google Scholar] [CrossRef]
  31. Nakagawa, S.; Masuda, S.; Nishihara, K.; Inui, K. mTOR inhibitor everolimus ameliorates progressive tubular dysfunction in chronic renal failure rats. Biochem Pharmacol 2010, 79(1), 67–76. [Google Scholar] [CrossRef]
  32. Nishihara, K.; Masuda, S.; Ji, L.; Katsura, T.; Inui, K. Pharmacokinetic significance of luminal multidrug and toxin extrusion 1 in chronic renal failure rats. Biochem Pharmacol 2007, 73(9), 1482–90. [Google Scholar]
  33. Nakagawa, S.; Nishihara, K.; Inui, K.; Masuda, S. Involvement of autophagy in the pharmacological effects of the mTOR inhibitor everolimus in acute kidney injury. Eur J Pharmacol 2012, 696(1-3), 143–54. [Google Scholar]
  34. Ji, L.; Masuda, S.; Saito, H.; Inui, K. Down-regulation of rat organic cation transporter rOCT2 by 5/6 nephrectomy. Kidney Int 2002, 62(2), 514–24. [Google Scholar] [CrossRef]
  35. Takeuchi, A.; Masuda, S.; Saito, H.; Doi, T.; Inui, K. Role of kidney-specific organic anion transporters in the urinary excretion of methotrexate. Kidney Int 2001, 60(3), 1058–68. [Google Scholar] [CrossRef]
  36. Bradford, M. M. A rapid and sensitive method for the quantitation of microgram quantities of protein utilizing the principle of protein-dye binding. Anal Biochem 1976, 72, 248–54. [Google Scholar] [CrossRef] [PubMed]
Figure 1. Post-treatment body weight changes in Sham and Nx rats. The drug administration was initiated at four weeks after surgery (n=5 each) in the 5/6 nephrectomized (Nx) rats. Each 20% w/v Cremophoe EL (Vehicle, 1mL/kg), tacrolimus (TAC, 1mg/kg) or tacrolimus and everolimus (TAC/EVR, 1mg/kg each) was administered subcutaneously every other day for two weeks. Sham-operated rats were not administered any agents and drugs. Data are presented as mean ± SD for 5 rats. Statistical analysis was performed using one-way ANOVA followed by Dunnet’s multiple comparison tests. *** P < 0.001 compared with Sham rats. † P < 0.05 compared with rats in the Nx rats receiving vehicle.
Preprints 191966 g001
Figure 2. Renal histology of Sham rats (A) and Nx rats receiving vehicle (B), TAC (C) and TAC/EVR (D) as well as quantitative analysis of mesangium area (E) and glomerular area (F). (A)–(D) Histological analysis with PAS staining is shown. Bar indicates 100 µm. The arrows (C) indicate areas of severe glomerular sclerosis. (E) The mesangium area was calculated with ImageJ® software with 10 glomeruli in each tissue section. Each bar represents the mean ± SD (n = 5 per group). Statistical analysis was performed using one-way ANOVA followed by Dunnet’s multiple comparison tests. *** P < 0.001 compared with Sham rats. †††P < 0.001 compared with Nx rats receiving vehicle treatment. ###P<0.001 compared with Nx rats receiving TAC treatment. (F) The glomerular area was calculated with ImageJ® software.
Preprints 191966 g002
Figure 3. Masson’s trichrome (MT) staining of the kidney section (A) and quantitative analysis of MT-positive fibrosis area (B). The MT-positive area was calculated with ImageJ® software in each tissue section. Each bar represents the mean ± SD (n = 5 per group). Statistical analysis was performed using one-way ANOVA followed by Dunnet’s multiple comparison tests. *** P < 0.001 compared with Sham rats. ††P < 0.01 compared with Nx rats receiving vehicle treatment. ##P<0.01 compared with Nx rats receiving TAC treatment.
Preprints 191966 g003
Figure 4. Western blot analysis of alpha-smooth muscle actin (α-SMA) in Sham and Nx rats. (A) Representative Western blot image for α-SMA (upper) and gyceraldehyde-3-phosphate dehydrogenase (GAPDH, lower) as a house keeping protein are shown. (B) The quantitative analysis of α-SMA protein expression corrected by each GAPDH expression analyzed by ImageJ® software in renal tissue from Sham and Nx rats are shown. Data are expressed as the mean ± SEM (n = 6-9). Statistical analysis was performed using one-way ANOVA followed by Dunnet’s multiple comparison tests. *P<0.05, ** P < 0.01 compared to Sham rats. ††P < 0.01, †††P < 0.001 compared to Nx rats receiving vehicle treatment.
Preprints 191966 g004
Figure 5. Western blot analysis of microtubule-associated protein 1 light chain 3 (LC3) in Sham and Nx rats. (A) Representative Western blot image for LC3-II (upper), LC3-I (middle) and GAPDH (lower) are shown. Data are expressed as mean ± SEM. Statistical analysis was performed using one-way ANOVA followed by Dunnet’s multiple comparison tests. ** P < 0.01 compared to Nx rats receiving vehicle treatment. ††P < 0.01 compared with Nx rats receiving TAC treatment.
Preprints 191966 g005
Figure 6. Western blot analysis of α-SMA in NRK-49F cells. (A) Representative Western blot image for α-SMA (upper) and GAPDH (lower) are shown. Fibroblasts was incubated EVR (10nM) or TGFβ1 (5 pg/mL) for 6 hours, following additional 24 hours incubation with or without EVR (10nM). (B) The quantitative analysis of α-SMA protein expression corrected by each GAPDH expression analyzed by ImageJ® software are shown. Each column shows a mean ± SEM of 3-separated experiments with 5 cells were used in an experiment. Statistical analysis was performed using one-way ANOVA followed by Dunnet’s multiple comparison tests. **P < 0.01 compared to control cells. ††P < 0.01, †††P < 0.001 compared to cells in the presence of EVR.
Preprints 191966 g006
Figure 7. Western blot analysis of LC3-I and LC3-II in NRK-49F cells. (A) Representative Western blot image for LC3-II (upper), LC3-I (middle) and GAPDH (lower) are shown. Fibroblasts was incubated EVR (10nM) or TGFβ1 (5 pg/mL) for 6 hours, following additional 48 hours incubation with or without EVR (10nM). (B) The quantitative analysis of α-SMA protein expression corrected by each GAPDH expression analyzed by ImageJ® software are shown. Each column shows a mean ± SEM of 3-separated experiments with 5 cells were used in an experiment. Statistical analysis was performed using one-way ANOVA followed by Dunnet’s multiple comparison tests. *P < 0.05 compared to control cells. P < 0.05 compared to cells in the presence of EVR. #P<0.05 compared to cells pretreated with TGFβ1.
Preprints 191966 g007
Table 1. Renal functional data after Nx with or without drug administration.
treatment Pcr Ucr Ualb UACR
(unit) (mg/dL) (mg/dL) (mg/dL)
Sham 0.57±0.04 28.3±6.7 30.5±2.0 1.5±0.4
Nx
Vehicle 0.82±0.14 11.7±0.9** 80.0±30.1 7.4±3.4*
TAC 1.74±0.20**†† 26.3±5.2†† 155.1±57.5**† 6.4±2.3*
TAC/EVR 1.40±0.19**† 14.9±1.5** 84.8±18.9 5.7±1.2
Plasma creatinine (Pcr), urinary creatinine (Ucr), urinary albumin (Ualb) and urine albumin-creatinine ratio (Ualb/Ucr, UACR) are expressed as mean ± SEM (n=5 per data). Blood samples were collected from Sham and Nx (5/6 nephrectomized) rats at 6 weeks after surgery including 2-weeks drug administration. All values are presented as mean ± SEM (n = 5 per group). Statistical analyses were performed using one-way ANOVA, and multiple comparisons were adjusted with the Dunnet’s correction with Sham rats or Nx rats receiving vehicle as reference. *P<0.05, **P<0.01, significantly different from Sham rats, respectively. †P<0.05, ††P<0.01, significantly different from Nx rats of vehicle treatment, respectively.
Table 2. Indicators of glomerular pathology in Nx rats.
Indicator BD ratio to Sham GD ratio to Sham GD/BD ratio
(unit) (µm) (µm)
Sham 110±9 100±9 0.91
Nx
Vehicle 106±10 0.96 95±9 0.95 0.90
TAC 128±11**†† 1.16 106±10†† 1.06 0.83
TAC/EVR 114±11†† 1.04 103±9 1.03 0.90
Glomerulus diameter (GD) and Bowman’s diameter (BD) are expressed as mean ± SEM (n=5 per data). The ratio to Sham group of BD and GD is expressed. Each GD/BD ratio is also expressed. Data are expressed as means ± SD of 5 rats. Multiple comparisons were performed with Dunnet’s correction after ANOVA. *P<0.05, **P<0.01, significantly different from Sham group. P<0.05, ††P<0.01, significantly different from Nx rats of vehicle treatment.
Disclaimer/Publisher’s Note: The statements, opinions and data contained in all publications are solely those of the individual author(s) and contributor(s) and not of MDPI and/or the editor(s). MDPI and/or the editor(s) disclaim responsibility for any injury to people or property resulting from any ideas, methods, instructions or products referred to in the content.
Copyright: This open access article is published under a Creative Commons CC BY 4.0 license, which permit the free download, distribution, and reuse, provided that the author and preprint are cited in any reuse.
Prerpints.org logo

Preprints.org is a free preprint server supported by MDPI in Basel, Switzerland.

Subscribe

Disclaimer

Terms of Use

Privacy Policy

Privacy Settings

© 2026 MDPI (Basel, Switzerland) unless otherwise stated