
Submitted:
01 December 2025
Posted:
29 December 2025
You are already at the latest version
Abstract
Evaluating innovation and optimising its role in the inventions is fundamental for applied research, where tracing it requires planning the use of available resources. Traditional assessment approaches often miss to capture how innovation stagnates between the ideation and prototyping phases (the Valley of Death), and to learn how innovation emerges from intermediate-steps contributed by individuals. This paper focuses on tracing innovation as an in-itinere approach enabling mapping of pathways of intermediate-steps and opportunities for valorising unplanned outcomes. We adopt a qualitative case study approach to explore how innovation pathways can be conceptualised through technological readiness levels. The operational settings of an EU-funded project defined the boundaries of the study. A network analysis explored relationships among themes that emerged from respondents involved in the activities, following an inductive approach to derive themes from data. Findings indicate that intermediate innovation steps, including failures, are viewed as cumulative contributions to novelty. Their documentation is seen as an investment for unlocking latent value embedded in distributed knowledge. Within this scope, we outline a blockchain-based knowledge graph for tracing cumulative contributions, identifying breakthroughs leading to maturity and supporting generation of hypothesis grounded on experimental trials. As a result, we theorize that paths recombining prior knowledge into novelty encode latent value that can be quantified as a function of the network topology.
Keywords:
scientometrics
; innovation
; scientific discovery
; value quantification
; research
; knowledge discovery
; network topology
; policy
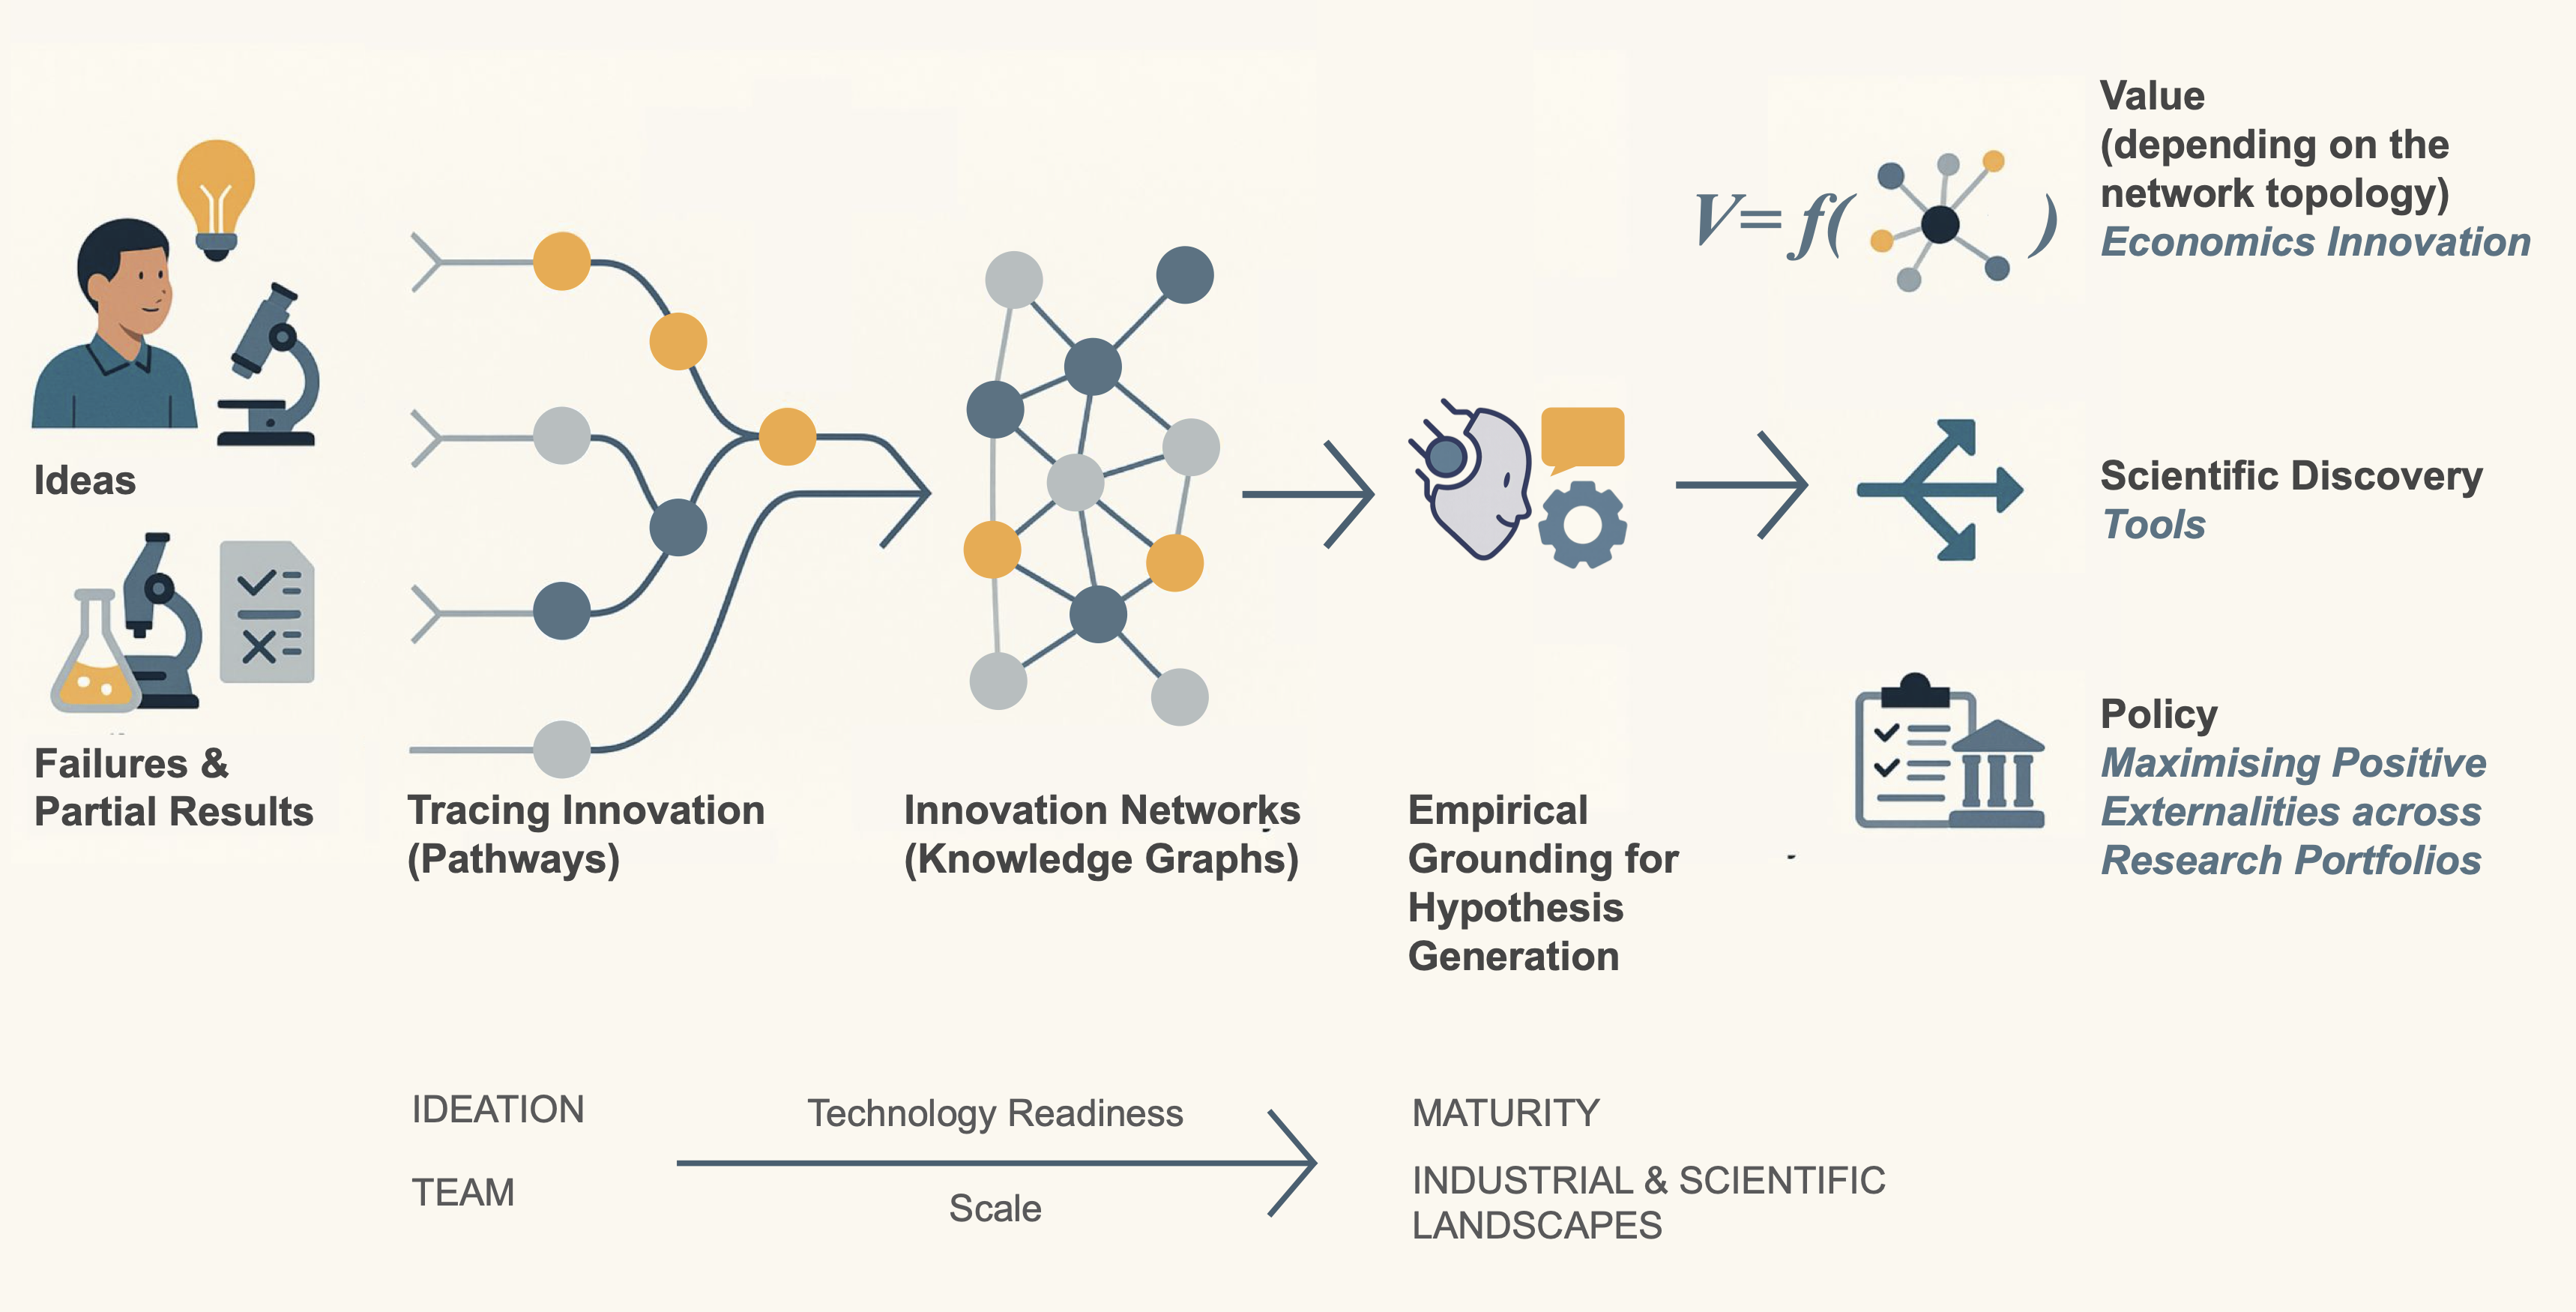
1. Introduction
Evaluating the capacity to innovate is a significant problem in applied research, for which diverse frameworks have been developed both for research & development (R&D), processes in business [1], as well as in academic management [2]. Tracing innovation is a practice that addresses the capacity to innovate by planning the use of available resources, eventually tackles the acquisition of unavailable resources, and ultimately addresses strategies that employ resources under uncertainties. It is usually evaluated through ex-post and/or ex-ante approaches. Ex-ante approaches aim to assess behavioral and organisational conditions enabling the capacity to innovate, whereas ex-post approaches assess innovation once it meets predefined developmental achievements or gets established in markets. The drawback of such approaches is a missed understanding of how the emergence of innovation stagnates between the ideation and prototyping phases and a missed opportunity to learn how innovation emerges from intermediate-steps contributed by individuals, while it is being created. This work therefore focuses on exploring benefits and challenges for tracing innovation as an in-itinere approach to: i) map pathways of intermediate-steps, that recursively use prior processes and resources towards inventions, and ii) explore opportunities for valorising the use of not predefined outcomes. The context of this work is a research consortium funded by the European Innovation council and Small and Medium Enterprise Agency (EISMEA).
We believe that a semantic analysis of the roots of the two words “innovation” and “invention” might be beneficial to the reader, as they often are considered sharing an apparent semantic proximity but originate from distinct Latin roots encoding fundamentally different modes of creation. Innovation derives from innovatio, innovare (“to make new within”) [3]. The Proto-Indo-European (PIE) root néwos or newós was spread across Indo-European languages: Greek neos, Sanskrit nava, English new, Russian novyj, Welsh newydd, German neu, all expressing renewal or freshness [4]. Thus, innovation denotes the act of introducing newness within an existing framework: a process of systemic restructuration. By contrast, invention stems from Latin inventio, invenire (“to come upon, to find”). The verb venire traces back to the PIE root gwem which yields Greek baino, Sanskrit gam-, English come, French venir, German kommen [3]. In its classical sense, invention signified the rhetorical process of “finding” ideas or arguments [5] rather than pure creation. Over time, however, invention acquired a generative connotation, describing the emergence of something radically new or unprecedented, a shift evident in Renaissance humanism and the modern patent system. From a systemic and cybernetic perspective [6,7], invention can be interpreted as a discontinuous event, a leap to a novel attractor in the state space of possibilities. Innovation, conversely, represents the integration and stabilization of such novelty within an existing system, an intra-systemic adaptation that ensures coherence and propagation [8]. Therefore we identify the first step as a peak in Fisher and mutual information generating new spectral signatures, the second as a homeostatic, diffusive plasticity that consolidates the collective asset [9].
2. Background
This section outlines three identified key challenges in evaluating innovation in public-funded research. Namely, persistent gaps in existing policy and assessment frameworks, limitations of the current evaluation metrics and organisational approaches, as well as emerging opportunities from network-based models and complexity science to support the tracing of invention and innovation steps beyond conventional outputs.
2.1. Gaps in Policy and Evaluation Frameworks
A shift in innovation policy thinking has been proposed, moving from market-fixing approaches to mission-orientated frameworks for creating portfolios that tackle social challenges through cross-sectoral investments [10]. Such mission-oriented strategies aim to intentionally create new markets and foster positive externalities. In the context of publicly funded research, such externalities include knowledge spillovers and technology transfer beyond the original sites of knowledge production. However, maximising the public benefits requires a shift in how the value of innovation is conceptualised and measured, cf., e.g., [11]. Traditional market-based metrics often fail to capture the full contribution of research, especially when its outcomes are not immediately monetised, revealing their inadequacy. Moreover, the goal of maximizing public disclosure can conflict with the private utility derived from exclusive property rights. Patents anticipate commercialisation, but also restrict access to knowledge and conflict with a broader societal impact that an open communication could generate. This tension highlights the need for new theoretical frameworks capable of defining and assessing invention and innovation in terms of systemic utility, rather than competitive capitalistic advantage alone. A central limitation of creating mission-driven portfolios is the lack of empirical insights on how research practices at micro-level generate innovation pathways that support these macro-level missions [12]. That is, how knowledge generated at the level of teams may recombine and eventually enable breakthroughs in alternate domains.
Current frameworks to asses the value of innovation struggle to capture their dynamics beyond pricing metrics or technological maturity assessments [13,14,15,16]. For example, public research efforts that do not yield patentable or market-ready outcomes may still bridge fundamental links between science and technology. Yet, their value is typically overlooked within evaluation systems shaped by strictly entrepreneurial logic, where emphasis is placed on ownership, patentability and bibliometric productivity, or blind metrics functional to gauge impact towards predefined business goals [17] – which necessarily would discard contributions not functional to those metrics. The assumption that innovation equals patentable deliverables and the efficacy of relying on single bibliometrics methods have been criticised for neglecting the non-linear, co-evolutionary nature of knowledge production [13]. Knowledge flows, such as patent citations, should also trace the interactions with complementary aspects of interfacing science and technology further entailing that activities such as inventor-author relationships, feedback loops on prior knowledge, knowledge co-produced by the interaction of academics, and industrial and policy environments should be accounted for.
Indicators such as Technological Readiness Levels (TRLs), originally developed by NASA and adopted by the EU since 2014 (see Table A1) assess technological maturity in R&D but offer limited insights into how knowledge evolves into inventions and which impact leads to (see Table A2). For example, TRL methods overlook usability in context — especially relevant in public administration — and omit assessments of societal or legal readiness [14]. Also, TRL metrics rely heavily on ex-ante and ex-post evaluations that fail to trace the dynamics of innovation processes. Innovation typically evolves non-linearly, often stagnating in intermediate prototyping phases (TRL 4–7) [18], and ex-ante or ex-post evaluation-methods may be not effective to understand how interdependecies of knowledge flows from micro-level eventually lead to desired transformations at the level of macro-level sustainability instances [19]. To address these shortcomings, extensions of TRLs have been proposed to include societal (SRL), organisational (ORL), and legal (LRL) readiness dimensions, revealing failures even in cases of high TRL but low stakeholder engagement or legal compliance [14] (see Table A3).
Other approaches put emphasis on forecasting pathways of innovation by mapping the scientific and patent landscapes as multi-partite networks, for example to extract pathways of innovations between diverse fields and claims [20] or to profile linkages between R&D and potential alternate industrial fields in the future. This could be done by an experts panel evaluating and forecasting TRL in workshops and surveys [21], (see Figure 1). However, these approaches remain biased towards macro-level scale and positioning of innovation within industries or for identifying distribution channels, but lack a systematic tracking about how knowledge is reused at a micro-scale and overlook the value created by contributions. A fair mechanism to attribute economic value to both inventions and innovation processes, including the knowledge spillovers that enable spin-offs to emerge, is still lacking and may be integrated into the assessment of publicly funded innovation.
2.2. Limits of Innovation Metrics and Organisational Approaches
Systematic stagnation in intermediate TRL phases has been attributed to a “lack of resources and expertise that impedes new ideas in their transition from lab to market”. Simulations have been proposed to estimate the impact of R&D prototypes and support financial models, for instance in order to provide input data for life-cycle assessments [18]. But such approaches rarely incorporate micro-level innovation steps that could be reused in alternate contexts or fields. For example, disclosing the settings for tuning an extant technology to be effective under given conditions may constitute input data that is not patentable or valuable by predefined metrics, but still useful for up-taking the new technology and estimating its impacts in alternate domains.
Patent citations are widely used in scientometrics to trace links between science and technology. They can help diffuse research results by differentiating their applications by scoping new claims across industries [13]. However, both patents and peer-reviewed publications under-report negative or intermediate results. This omission decreases the accuracy and spread of scientific knowledge [23], but also reflects a broader lack of theoretical understanding of how patents generate advantages across industries beyond their monopolistic use, such as keeping innovation idle to protect current market positions or block competitors [13].
Additionally, non-disclosure can generate systemic inefficiencies and undermine public value creation. In particular, disclosure of unsuccessful experimentation or failures may in theory offer a strategic advantage for accelerating innovation, but there is little understanding of how this advantage concretely translates into value and under which conditions [10,15]. For example, knowledge about failures is expected to reduce time for replicating desired outcomes, and innovation deemed invaluable at present time may contribute value in fields of application different from those originally planned. If so, it follows that failures should be rendered with economic value as well, since they contribute to reduce the cost of researching and engineering new artifacts by reducing waste of resources (time and energy) for replicating state-of-the-art as a baseline of future steps. Likewise, disclosing successful experimentation and patentable ideas could spread inventions and foster a systemic evolution, setting the attractor to a new equilibrium point and multiplying future inventions exponentially.
Measuring innovation depends heavily on the scale where it is developed [24], and the choice of methods that determine what gets labeled as “innovation” [15]. At the individual, team, organisational, and national levels, evaluation relies on either aggregate quantitative indicators such as, e.g., number of patents, R&D expenditures, and market share growth – or on qualitative ones such as, e.g., behavioral indicators, self-assessments, and peer-review evaluations as ex-ante methods. Notably, a gap persists at the team level, particularly for non-R&D teams who must interface with research outputs and leverage on their actual capabilities and limitations [24].
Because “all valuation metrics for innovation are static measures”, there is a solid risk of generating circular assessments tied to the specific moment when an evaluation is made [15], and could also be skewed towards the predefined business objective for which a metric was chosen [17]. This can reinforce stagnation, especially observed at TRL 4–7, by failing to capture emerging novelty or potential breakthroughs. Innovation indexes may integrate behavioral and scientometric approaches, but truly effective tools must focus on team-scale dynamics and enable identification of innovation not predefined in evaluation criteria [24]. Hence, stagnation raises the hypothesis that current survey methods for evaluating innovation – even if conducted periodically and updated with new indicators aligned with the level of technological maturity – may systematically overlook the value of early-stage incremental steps or prototypes. This could be due to an inherent bias among evaluators; for example, domain experts may focus primarily on the impact within their own field, while consistently diminishing contributions from other domains or interdisciplinary backgrounds.
Intrinsic bias and lack of metrics capturing the scientific value of an idea also affect the domain of AI-assisted scientific discovery: Large Language Models (LLMs) trained on large corpora (e.g. scientific articles to automate literature review for hypothesis generation) tend to reproduce biases that can skew research priorities against dominant perspectives and exclude under-represented ones; fine-tuning risk to overfit a desired domain, but hinder generalisations and integration with other fields (an aspect relevant for applied science); generating new hypotheses with AI (e.g. through Retrieval-Augmented Generation (RAG) based on LLMs ) poses unaddressed challenges - authorship; accountability; misuse and misleading hypotheses (e.g. plausibility of text that lack empirical grounding or hallucinations from condensing multiple summarised contexts) - requiring robust governance mechanisms [25].
In business management, three main evaluation approaches dominate; behavioral conditions, performance assessment, and pathway-enabling methods – respectively at individual, team, organisational-and-above levels (such as pathways for innovating industrial fields or national portfolios). Behavioral approaches promote social aspects enhancing creativity [26], behavioral incentives for engaging a team towards innovation [27], and supportive environments like “changes that do not punish innovation attempt” [15]. Yet, their effectiveness is limited in contexts where researchers lack voting power on decisions, or lack adequate monetary incentives [27]1.
Performance indicators, often used in agile management, aim to correlate business objectives with innovation results [28,29]. Since performance indicators rely on predefined milestones, they can overlook contributions that fall outside established output measures including innovations not directly contributing to the core business [24], and they often undervalue transformative innovation. Hence, they may be inadequate for high-risk but potentially high-reward policies aimed at creating new markets or maximising the positive externalities of a research portfolio [10].
The concept of pathways describe structured routes from research to impact, although there is not a unique consensus on its definition. In organisational learning, the likelihood of research impact is measured indirectly through methods that assess the soft skills needed to uptake research outputs at the policy level [30]. These approaches are biased towards stakeholders at institutional level (representatives of an organisation) and typically ignore daily micro-contributions by individuals who actually forged paths of innovations such as activities related to advancing early-stage ideas, refining failed components and prototypes towards reaching market-ready products or services. Ex-post evaluations of skills, while informative, are expensive. Surveys summarise progress but fail to capture the know-how relevant to replicating and transferring research outcomes. Enterprise-level knowledge-graph approaches map paths of innovations as relationships between processes and resources [17], but focus narrowly on business optimisation, ignoring emergent novelty and “secondary impacts” from unanticipated innovations, i.e. the value that outputs can have in longer-term or alternate industrial context [15,28]. Network models at country-level also exist to chart connections between industrial sectors and prospect new options of commercialisation across industries, but rely heavily on expert supervision making it an expensive practice. They are rarely applied at the team level to repurpose outputs from other domains as inputs that support ideation and advance technical maturity through prototyping [22].
2.3. Complexity and Network-Based Approaches to Innovation
Recent perspectives rooted in network science and complexity economics offer promising alternatives to assess innovation and potentially to objectify the value of a novelty. Since scale invariant properties enable self-organisation [31], and innovation systems can be modelled as self-organizing structures pertaining to third order cybernetic systems [32], diffusion efficiency and resilience emerge from network connectivity, which is a central aspect in propagating innovation and in resistance to stochastic perturbations[16]. Innovation is seen here as a process of entropy reduction (consolidation of knowledge and standards) while invention as a process of entropy generation (diffusion of knowledge and increasing variety of entities) [23]. In complexity economics, growth is understood as the recombination of accumulated knowledge into more complex artifacts. Innovation policies should therefore aim to diversify “the set of capabilities […] so that economies can create more complex products […]” rather than optimise for existing competitive advantages [33]. From this view, innovation becomes a combinatorial problem in which the connectivity of the network reconfigures extant information into high entropy structures.
We consider an innovation / invention process described by a dynamic network , where is the set of nodes (agents, ideas, or functional components); E is the set of edges (connections, channels of interaction); is the weight of the edge between nodes i and j, possibly time-dependent; represents the probability associated with node i, i.e., its share of information at time t. The quantity of information of a node changes in time, depending on the connectivity of the network. The network’s state evolves according to Eq. 1:
where denotes the instantaneous connectivity configuration. Changes in connectivity () represent structural transformations of the informational landscape, potentially leading to invention and innovation. The global Shannon entropy of the dynamic network G is so defined (Eq. 2):
which quantifies the overall informational diversity of the system. A high indicates a wide distribution of information across nodes (many alternatives), while a low corresponds to concentration around few dominant nodes (oligopolies). In the invention phase, typically increases as the system explores new configurations. During innovation, entropy may slightly decrease as patterns consolidate while maintaining a rich state-space. We now introduce the discrete Fisher information of the network to measure local coherence (Eq. 3):
Here, differences between neighboring probabilities indicate gradients of informational structure. High values correspond to well-formed local patterns and strong differentiation; low indicates uniformity, loss of structure and ultimately diffusion noise.
A change in connectivity induces a transformation of the node distribution and correspondingly, . Innovation could then be represented as a motion in the Fisher–Shannon plane (see: Table 1).
In this plane, each point represents the global informational state of the network. We could then define a simple innovation functional, Eq. 4:
where M is the number of entities or communities in the network; is the Fisher information within module m; are coefficients balancing global diversity, structural coherence, and modular organization. The interpretation is straightforward: the first term rewards a higher global entropy, the second term penalizes excessive loss of structure, the third term rewards the emergence of coherent local patterns. An optimal innovation process maximizes , yielding high global variety and strong local structure. In a network of interacting agents, invention corresponds to a topological rupture that increases informational diversity (), while innovation is the organized reconstruction that transforms this diversity into functional coherence (). The overall process is a combinatorial reconfiguration in the Fisher–Shannon plane, driven by a principle of autosynthesis [9]: the dynamic balance between order and novelty, between local coherence and global variety. We propose a conceptual mapping between the physics terms and innovation policy terms for practical applicability to information systems or economics innovation tools, in Table 2.
In our view, framing innovation in this way challenges traditional definitions of economic value – based primarily on monetary metrics and property or exploitation rights over knowledge outputs – and instead posits graph theory as a basis for measuring value created in function of the combinatorial dynamics of prior knowledge inputs. A natural corollary is the case for mission-oriented policies that seek to maximise positive externalities. If knowledge is treated as intangible capital, then a capital-return function can be modelled to maximise the societal benefits generated by its diffusion and accessibility.
While property or exploitation rights, such as patents, convert innovation into value by restricting its use, diversification strategies can generate positive externalities by enabling usage rights to knowledge and its intermediate outputs that facilitate recombination, such as paths instructing how to link different fields to generate new artifacts. This distinction challenges strategies that rely solely on extracting value from intellectual property monopolies and may help reconcile the apparent conflict between economic policies advocating for the state’s strategic role as an entrepreneur seeking to maximise public returns [10] and those promoting private-sector competition as a means to maximise value through the free circulation of knowledge.
This reconciliation, however, requires enabling conditions that remains to be explored, such as mechanisms for value sharing that accounts for the graph topology. For example, if state investment seeds an innovation, property rights frameworks could incorporate public return clauses such as revenue-sharing across the innovation supply chain, price caps, or open access after a defined period, to ensure that society benefits directly, potentially also reducing the cost of the capital required to innovate.
Graph-based tools have been applied to patent and scientific data to uncover trends and dependencies, for instance in the visualisation of chemical processes using generative knowledge graphs [34], or in forecasting technological saturation within technological domains by using reinforced Bernoulli processes to capture how “success” in the form of a filed patent propagates and stabilises in long-run patterns of specialisation.[35]. However, these applications operate on aggregate data and have yet to be deployed for tracing innovation emerging from collaborative processes within research teams and consortia. Also, a Bernoulli process counts discrete events in sequence but ignores the time gaps between them, and assume each trial as independent. The pace at which innovation evolve, and making reinforcement from prior knowledge procedures other than patents more explicit and granular, remains gaps to be explored for mapping how incremental steps at micro-level may impact a success at macro-level context.
Recent developments in AI and language models suggest further potential. Knowledge graphs derived from scientific papers and large language models have been tested to evaluate novelty in ideation [36], which may impact early stage TRL from further integration with local knowledge data to foster the development of ideas into prototypes within research consortia, and in general understand how ideas evolve into final products and by-products, where the latter refers to knowledge output not labeled as innovation but still useful. Business use cases demonstrate value for entity linking and filtering noisy data, though challenges remain in integrating multiple information sources and aligning schemata [37]. These limitations are especially pertinent to experimental research design, where the integration of uncertain or spurious knowledge is intrinsic to prototyping.
Despite the promise, a clear research gap remains in applying graph representation learning to innovation processes at team-level, and in developing scale-independent metrics that could capture the emergence and maturity of innovation. Addressing this gap would support novel metrics grounded in information theory and network topology, enabling assessments of innovation that transcend static, market-based indicators. In the context of a research consortium, this study empirically investigate perceptions of advantages and disadvantages for tracing innovation paths and their evolution towards technological maturity, aiming to inform tools and theory for quantifying and managing the “value of innovation ” in relation to prior knowledge and the diffusion of knowledge in new domains.
3. Research Problem
In this study, we draw upon a gap concerning how innovation can be traced from ideation through engineering and industrialisation phases, at the scale of individual contributions within collaborative R&D teams. The opportunity problem is defined as tracing innovation pathways and articulated against the background of conventional innovation assessments methods. Conventional ex-ante evaluations, for instance participatory impact pathway analysis, articulate expected outcomes and assumptions but do not capture what unfolds during ideation and prototyping phases. Ex-post evaluations, such as bibliometrics output or granted patents, may miss to recognise as innovation such outputs whose utility depends on the business goals and metrics that were chosen, and thus fail to valorize information that could inform future endeavors [38]. This problem is significant because, as we have argued, intermediate research stages are central to project evaluation frameworks employing TRL metrics. These frameworks would benefit from an increased understanding of how innovation stagnate or eventually emerges from intermediate steps and distributed interaction of knowledge, ideas and know-how [16,24].
Our work frames the problem in the context of innovation management under uncertainty, focusing on how to make visible the incremental steps that are not predefined and that may not directly result in planned outputs, but nonetheless carry latent value for future applications. The scope is limited to understanding the perception of R&D practitioners about benefits or disadvantages for introducing traceability of intermediate steps along the conventional assessment metrics used in TRL, in order to explore insights that can inform conceptual prototypes of IT-frameworks for tracing innovation paths and for objectifying the value of innovation with metrics independent from the subjective utility of the stakeholders involved in a research program. Quantifying the value of innovation with alternative metrics than the monetary utility accrued from property or rights of exploitation is a wicked problem in economics, and particularly significant in the context of public welfare policies that shall aim to maximise the utility of a system, rather then a local set of its nodes.
Innovation pathways (or, equivalently, paths of innovation) are here defined as sequences of decisions for combining sets of resources and processes [22], whose output is expected to be significantly novel with respect to prior conditions, enabling for societal impact. Paths and evolution of complexity are not linear, unintended consequences and emergent properties often co-occur with intended results [30] and the output of an experiment may fail. This study adopts a qualitative case study approach to inductively explore how micro-level innovation pathways can be conceptualised and potentially operationalised through traceability practices. The intention is not to land on generalizable conclusions but to develop propositions that can inform subsequent research policy and prototyping efforts.
3.1. Aim and Research Question
Our aim is to explore how tracing innovation steps at micro-level can contribute to file mission-oriented strategies and generate latent value from intermediate results that are typically underreported. The study engages on stakeholders’ perspectives on what innovation is and how it is evaluated in the context of research program from ideation to industrialisation, to inform the design of conceptual frameworks and indicators for assessing value created through public R&D investments and facilitating the uptake of research outputs. This focus is grounded on exploratory theory building emphasising the role of case studies to inductively develop new constructs and propositions where prior theory is underdeveloped [39].
This study addresses the following research questions: : How can tracing intermediate innovation-steps in research portfolios unlock new value, beyond ex-ante and ex-post evaluation metrics?
: What additional value is revealed by systematically tracing intermediate innovation steps, from inception to industrialisation stages?
3.2. Research Strategy
This study adopted a qualitative case study strategy to support inductive theory formulation about how innovation emerges from intermediate steps within publicly funded R&D programs. Case studies are considered appropriate when the research question explores how or why phenomena unfold in real-life contexts, especially when boundaries between phenomena and context are not clearly evident, and enable researchers to develop novel theoretical insights grounded in empirical data [39].
Surveys as research strategy could have provided structured quantitative insights on perceptions of traceability within R&D processes, such as assessing expectations for introducing alternative metrics to conventional bibliometrics and impact assessments utilised during the life-span of the project. However, surveys research presupposes a well-defined conceptual framework and an adequate sample, and it was excluded due to limited prior knowledge about tracing innovation pathways in teams involved in intermediate TRL phases [16], which constrained the feasibility of identify in advance relevant hypothesis to ask, the small size of the available population () and infeasibility of enduring the study during the life-span of the project (4 years). Grounded theory may be considered to be suitable for researching emerging constructions of innovation in teams, through periodic comparison of respondents and simultaneous data collection and analysis during the project lifespan. It was, however, excluded because the resources required to sustain theoretical sampling and achieve saturation exceeded the operational constraints of this study, and because the research focus was more on what mechanisms transform knowledge into innovation within research contexts, rather than understanding meaning-making of innovation emerging from their interactions.
A case study approach was therefore selected to balance feasibility with analytical depth, enabling the exploration of perceptions, experiences, and expectations of primary data sources. This strategy supports an inductive inquiry into how innovation emerges, while critically examining the opportunities, challenges, and relevance of tracing innovation. The goal is to ground theoretical insights in data models that map innovation steps and the mapping of process-assets relationship in function of predefined business goals in [17] adapted to research contexts where outputs are uncertain and their maturity changes with respect to the application domain maturity through R&D stages [40].
3.3. Application of the Method
The boundaries of the study were defined by operational settings defined by the project coordinator of an EISMEA-funded project in bio-inspired liquid robotics [41], who helped to address confidentiality constraints with interviewed members of public research institutes (universities and private companies that partnered in the project). Participants were inquired if current practices to assess R&D may benefit from new approaches leveraging on prior R&D steps and how they could help in managing the uncertainty of experimental trials during the intermediate steps towards potential embodiments of final artifacts. Answers of informants were utilised to enrich insights from ICT frameworks [17,26], in particular whether tracing processes should be done at the scale of teams, by the very individuals who daily “make research happen” [16]. Semi-structured interviews and questionnaires were collected to facilitate triangulation of qualitative data [39] and align prior studies investigating innovation pathways and socio-technical complexity [22,42]. data collection was designed on three aspects informing the overall research questions:
- i.
- Should scientometrics be complemented with measures describing how scientific- evolves into technical- innovation?
- ii.
- To which extent should researchers decide on intellectual property and on business models that exploit the innovation they authored in first-place?
- iii.
- How could innovation pathways be valued outside of the network of stakeholders, their affiliated partners or related fields?
Within the limits of potential researcher bias in case study research, the study incorporated systematic coding of collected data, a thematic analysis of emerging themes, a network analysis of relationships between topics, and transparency in analytic procedures and validation of interpretations with participants.
3.4. Data Collection
Primary data was collected through semi-structured interviews and, if respondents were unavailable, self-completion questionnaires. The total population included nine team members. Data was obtained from four respondents in the time-span of 1.5 months, with interviews scheduled based on availability.
Initial plans for a focused group were revised due to scheduling constraints, leading to individual interviews conducted via video calls. These were prioritised over questionnaires to enable deeper exploration of nuanced topics—such as R&D process traceability, intellectual property, open innovation, and the assessment of innovation in EU-funded programs. The bias was limited by inclusion of informants from different responsibility roles and type of organisations partners of the project, being one university, one national research institute and one private company [39], leveraging participants’ expertise in research, tech transfer and entrepreneurship.
Interview guides were drafted in advance and iteratively refined as the study progressed. The topics included; role of participant; experience and former exposure to business or innovation management methods, definition of innovation, insights about daily activities for qualifying innovation and time-scale to trace progress, insights about cost-opportunities for tracing intermediate-steps, perceptions about the utility of tracing innovation outside the scope of this specific project, and potential blockers or improvements with respect to current practices in authorship and property rights. Questions concerning the utility to trace intermediate innovation-steps were progressively expanded, based on the depth of information provided by former respondents on these matters. The questionnaire was developed after three interviews, after acquisition of a degree of saturation over topics, and included Likert-scale items to overcome lack of direction of the investigator with respect to web-call interviews.
Each session lasted approximately 75 minutes for interviews and 60 minutes for the questionnaire. One questionnaire and three interviews were completed, each from a different stakeholder organisation. Despite limited participation (4 out of 9), the quality of responses was high as participants shared detailed examples and reflected openly on the subject. While semi-structured interviews where used in case-studies to test confirmation bias of the investigators assessing factors influencing innovation pathways [30], this study focused more on potential advantages for tracing intermediate innovation steps, than seeking to disconfirm it. This approach was considered more suitable for addressing the research question and potentially contributing to the adaptation of enterprise models or the design of new innovation management frameworks.
3.5. Participants
This study involved participants from a single EISMEA-funded research consortium composed of five organisations being one university, two research institutes, and two private companies, each based in a different European country. The full population included nine members, each holding a PhD and a minimum of five years of research experience. A subset of four participants was recruited for interviews and questionnaires, representing diverse organisational affiliations and roles.
Participants were selected for their combined experience across public and private research environments, as well as involvement in both technical R&D and strategic decision-making. At least one had prior management responsibilities in both academic and industrial settings, making them particularly suited to reflect on innovation practices and potential improvements. The sampling strategy aimed to engage the full population but prioritised individuals from different organisations to minimise potential bias from shared institutional perspectives. Selection was aided by the project coordinator, who provided background information used to ensure diversity across relevant dimensions: years of R&D experience, funding source exposure (public/private), sector affiliation, and entrepreneurial activity.
Although the sample was small and limited to a single case study, the diversity of roles and institutions provides a valuable exploratory lens. The aim was not statistical generalisation but to gather grounded insights into how innovation pathways are perceived and whether intermediate innovation steps - such as experimental conditions, partial results, configurations of processes, networks of resources and processes - could hold latent value.
The sample was considered adequate for identifying emergent themes that could guide two future research directions: (i) replication across additional case studies to deepen theoretical development; and (ii) prototyping of digital tools for tracing innovation steps. In this second direction, a sample of this size aligns with established practice in exploratory user research, where small groups are sufficient to define key user roles and requirements for early stage design.
3.6. Data Analysis Methods
3.6.1. Data Preparation
Interviews were conducted and video-recorded on video conferencing platform, and questionnaires administered via email. While being conducted, interviews were annotated with keywords and sketches of logical implications to summarise the arguments reasoned by the interviewee, who were asked to confirm if logical conditions were sufficient to infer the annotated conclusions, and to make premises explicit.
Arguments were reviewed on the same day, and annotated with hypotheses to be asked to the next respondent, aiming for theoretical saturation on complex topics such as relationships between innovation-metrics, authorship, and property rights. The interviewer used own sensitivity and background to elicit clarification when appropriate, while pairwise comparison, Likert-scale, scored checklists and open-ended questions were used in the questionnaire for the purpose of; rank intensity of preference over factors affecting impact of innovation, rank agreement on the utility of tools for strategising and directing research, grade importance on communicating innovation to non-technical public audiences and on potential formats, grade importance and elicit explanations on correlations between factors affecting innovation and its impact, like property rights, attribution-rewarding, purpose of alternative forms of quantifying innovation in terms of its “embedded” complexity.
3.6.2. Thematic Analysis
Sentences from interviews and questionnaires were indexed and tagged with sets of classes and codes. Classes were assigned depending on the sections covered and on the depth of answers. Codes connoted aspects highlighted by respondents. Codes were finally ranked by frequency, and binned into nine temes, describing different dimensions of the research question: Perception, Opportunity, Insight, Current Situation, Uncertainty, Assets, Appropriate language, Critics, and Disadvantages.
The significance of distribution of codes-per-theme ratio was evaluated by means of coefficient of variation (CV) and of unlikeability (U) [43]. Unlikeability is a function in the range (0 representing no variability) representing how often observations of codes assigned to themes differed from one another. With CV and U = , the code distribution showed moderate consistency without strong polarisation, thus considered sufficiently informative to extract insights on each theme.
3.6.3. Network Analysis
The final stage concerned the construction of the bi-partite networks between codes and sentences, codes and classes, and codes and themes. The codes were tags labelling the areas covered by interviews and questionnaires, the themes represented emerging topics from sets codes, summarizing insights to answer the research questions. Community detection algorithms to isolate emerging themes and identify which codes supported each. Narratives were explored using bipartite networks connecting themes, or sets of themes constructed using boolean operators.
The relationships between themes and their codes were explored to identify which codes, and related sentences, connected common narratives (see Fig. 3). Narratives within a theme, or between multiple themes, were explored by querying the codes belonging to each Theme or to each theme intersection, and back to the original sentences. For example, it is possible to query the context of a single theme, like “Opportunity”, or an intersecting Theme, like “Uncertainty AND Disadvantages”, or a boolean theme, like “Uncertainty AND NOT Disadvantages”.
3.7. Research Ethics
Participation in the study was voluntary, with informed consent obtained from all respondents. Participants were informed about the research scope, anonymity measures, and their right to withdraw at any time. The project coordinator authorised the data collection within the consortium.
To preserve confidentiality, references to personal identities, proprietary techniques, and project-specific details were anonymised or rephrased to retain the meaning of responses without disclosing sensitive information. Minor edits were made to transcripts to present participants’ reasoning in clear, structured arguments. The anonymised version of the transcribed and coded interviews has been published as open data to support protocol replication and extension in future case studies across different research contexts.
4. Results
4.1. Thematic and Network Analysis of Primary Data
Three main topics where extracted from queries against codes connecting the themes, and retrieving the corresponding sentences:
- i.
- Opportunities and disadvantages of tracing intermediate innovation-steps,
- ii.
- insights about the potential to unlock value embedded in intermediate innovation steps, with respect to innovation metrics used in EU-funded projects, and
- iii.
- some conditions for unlocking that value.
Clustering of themes is highlighted by means of community detection over codes: interestingly, the theme Assets appears central to all (Fig. 2). In order to appreciate the nuances of intersecting themes, interconnecting codes between themes are plotted (Fig. 3) to visualise how many they share in common.
Critics, Insights, Opportunities and Disadvantages are found to be the most informative themes to answer the research question. Beyond advantages and disadvantages, prescriptive knowledge were found to inform the development of potential artifacts, i.e. how data should be inputted if tracing intermediate innovation was a frequent task. In this regard, the Theme Assets appeared to be a central aspect also for adapting knowledge graphs used to map process-assets relationships for business management to IT-frameworks for innovation management, that take into account the conditions that emerged and are discussed in the Section ?? and Section 5.2.
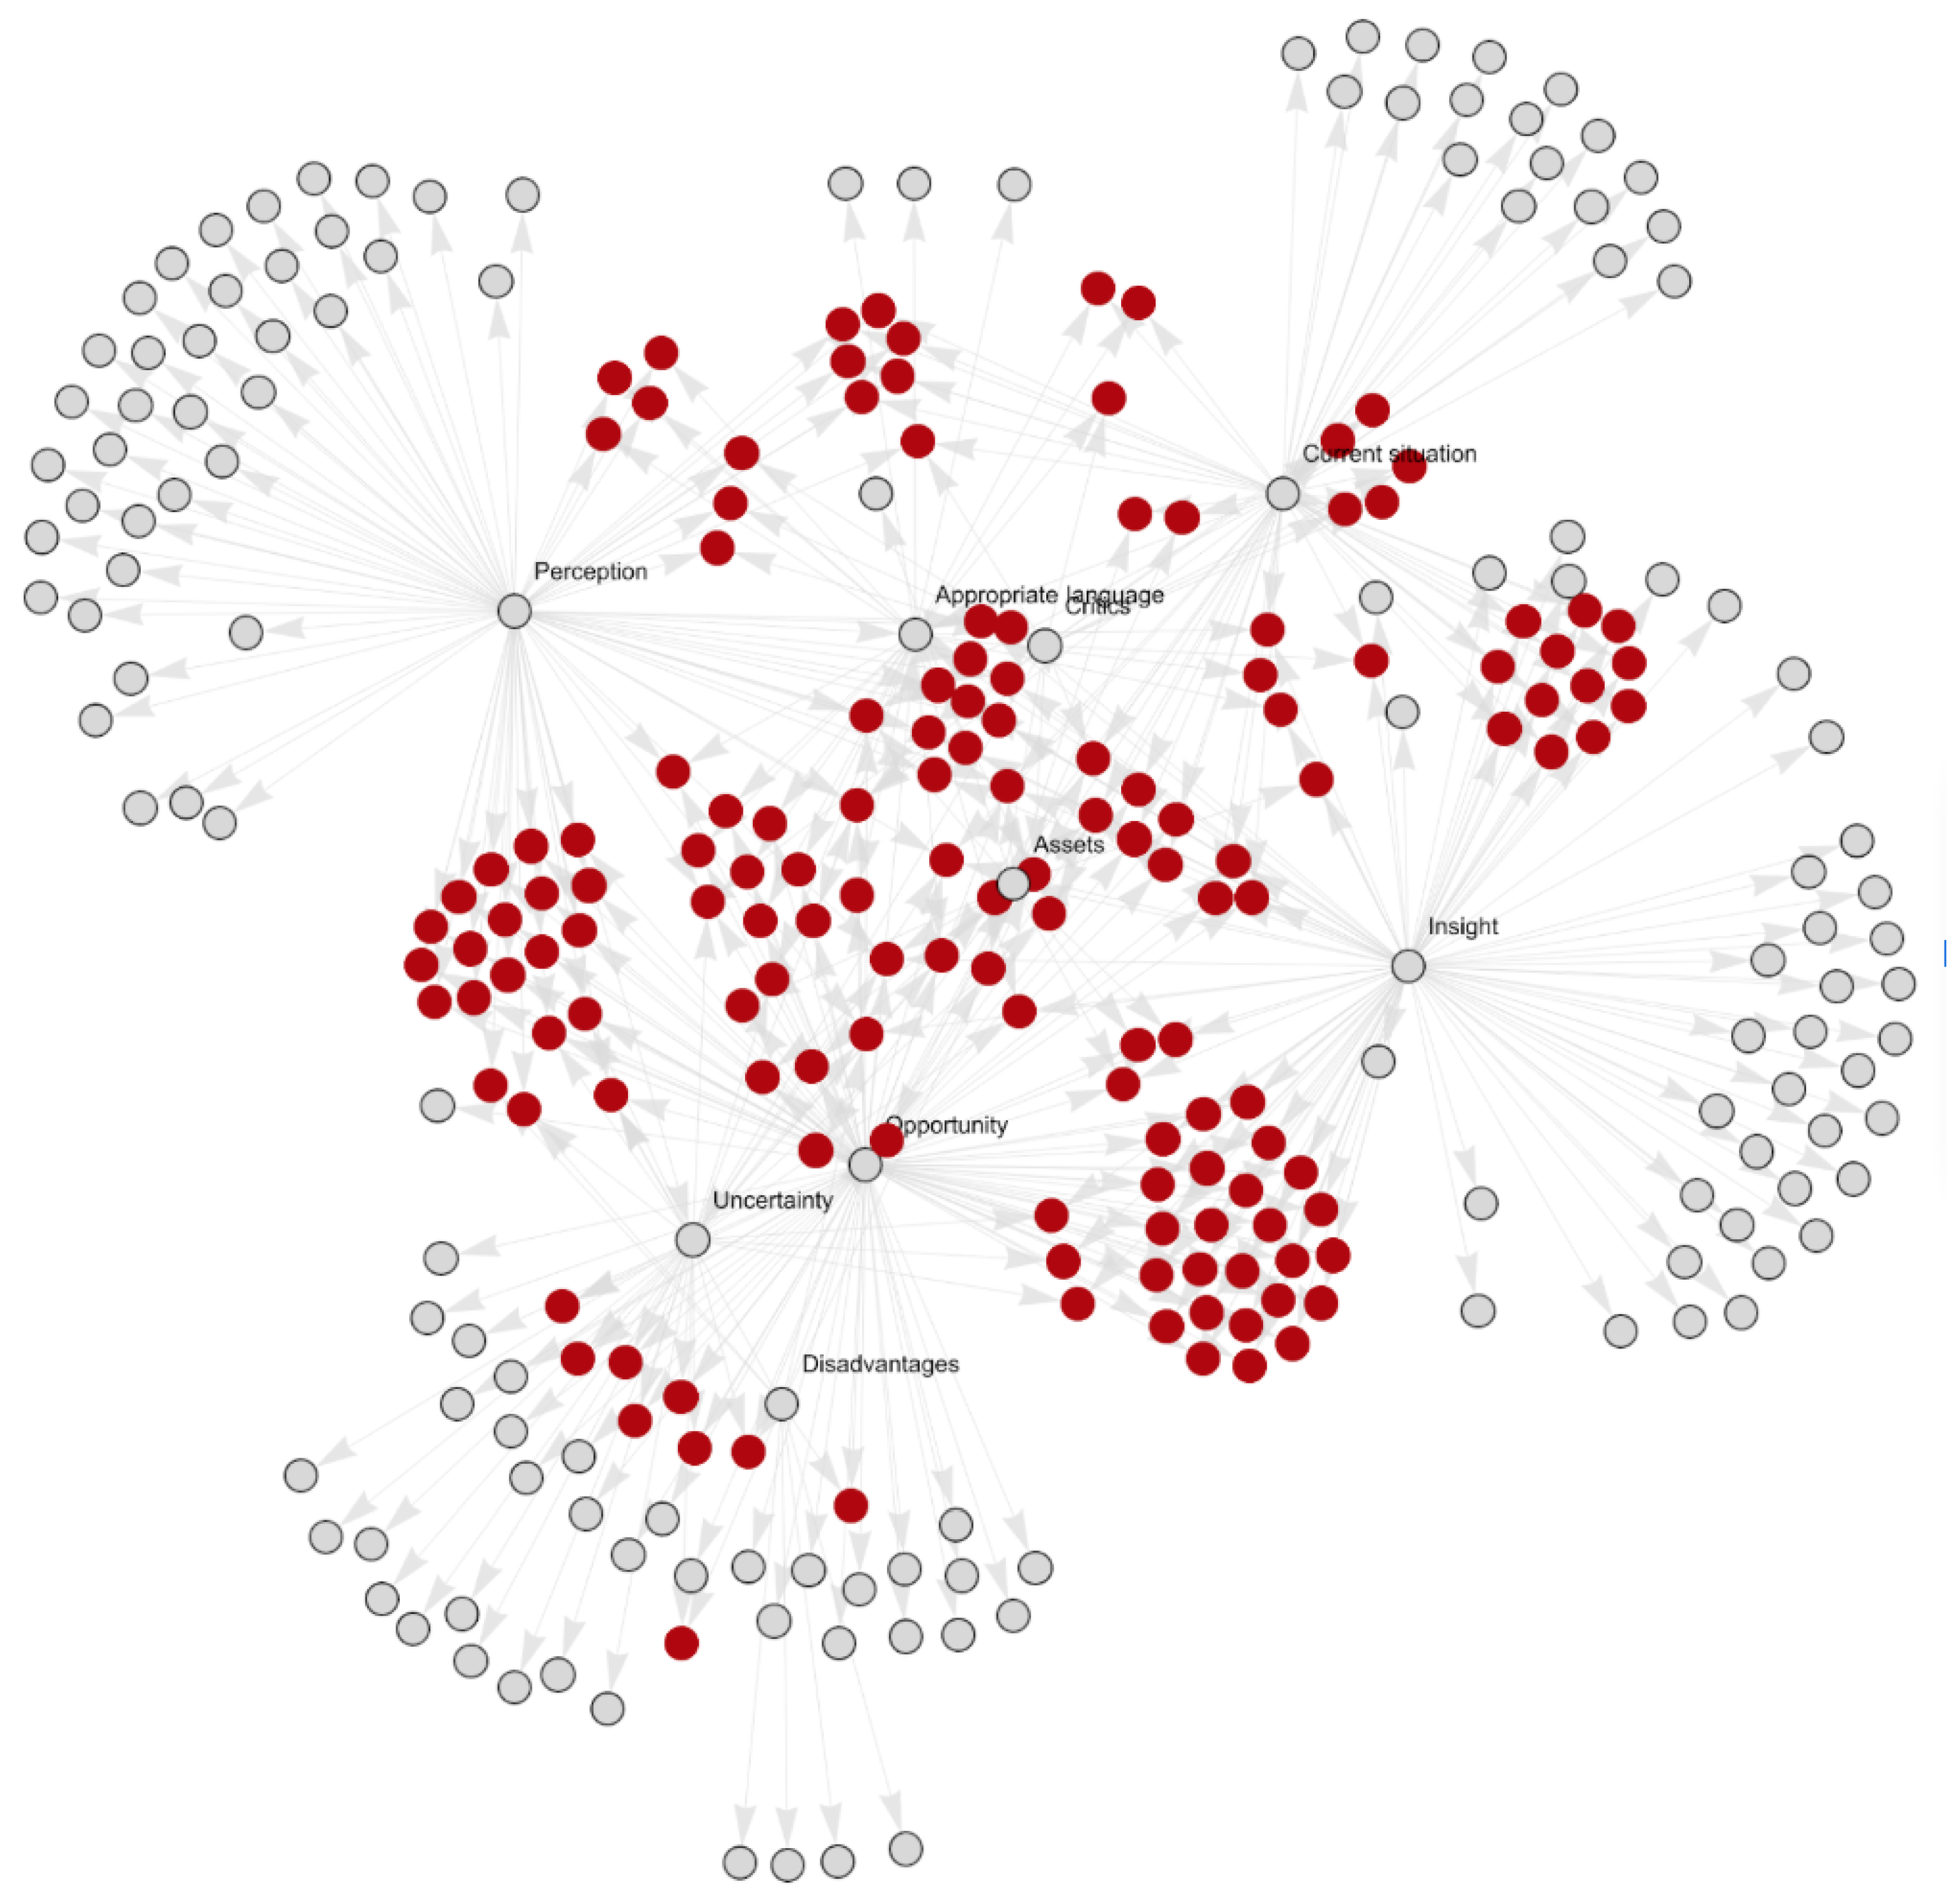
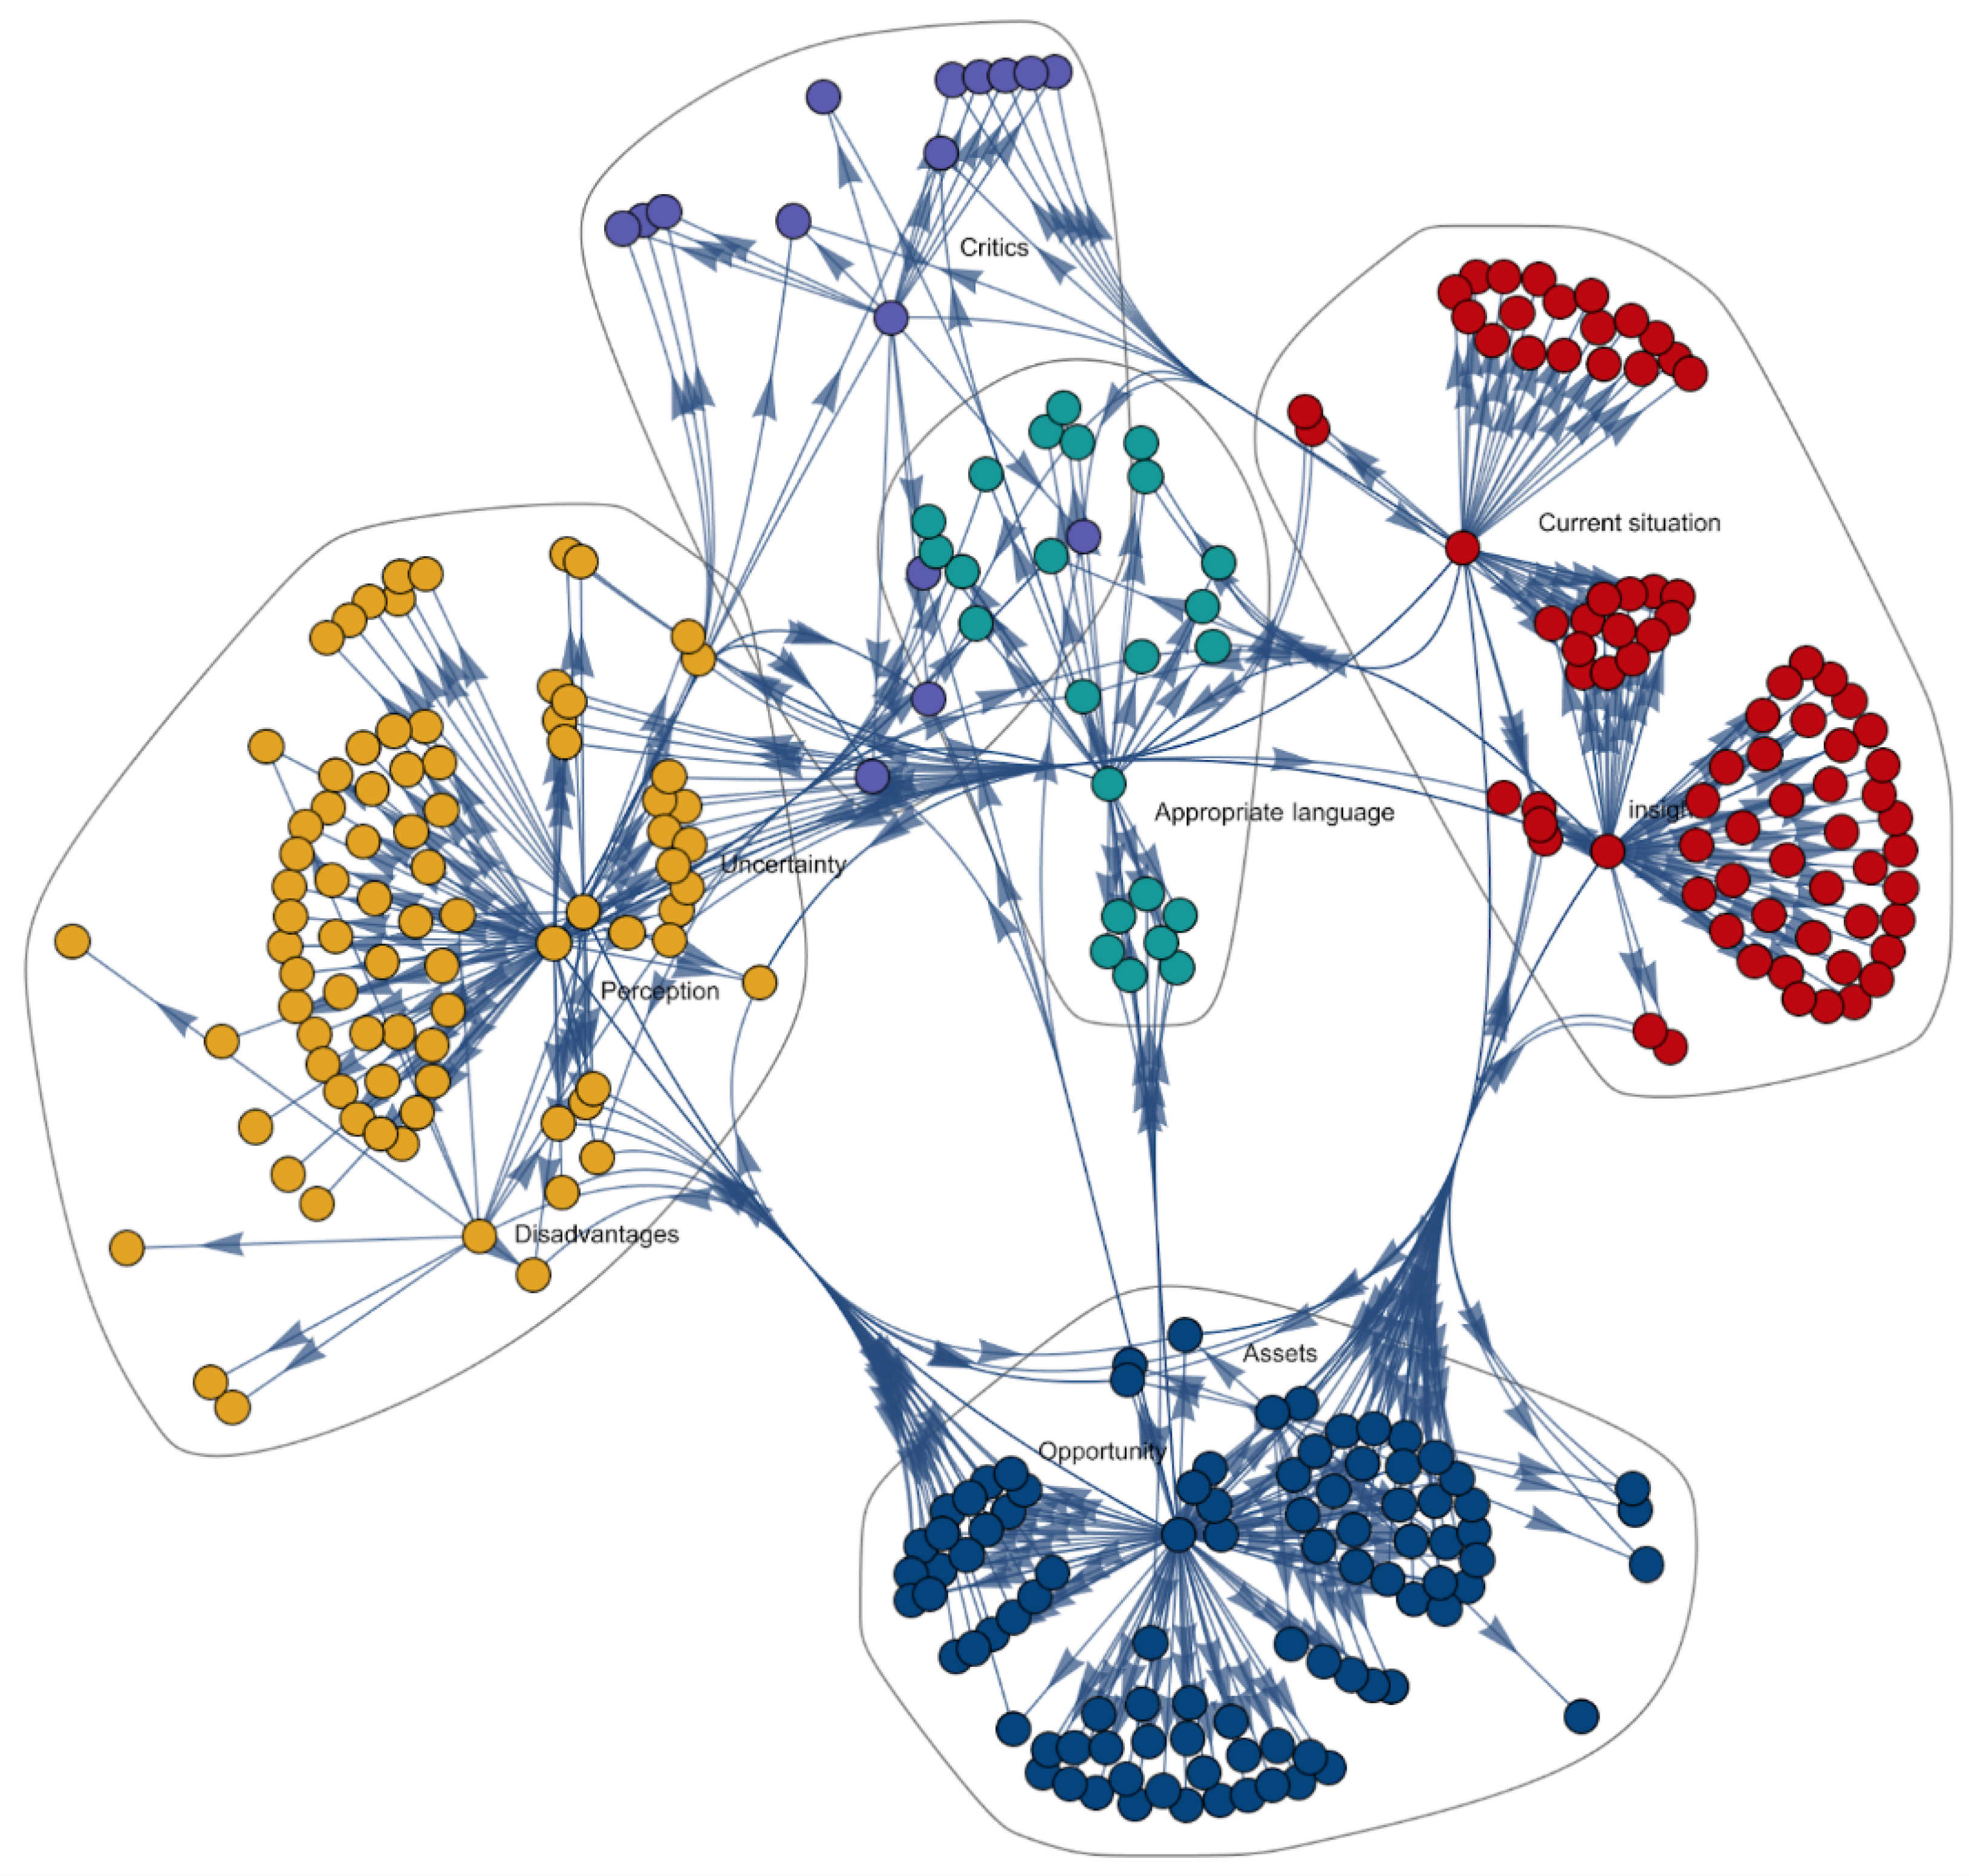
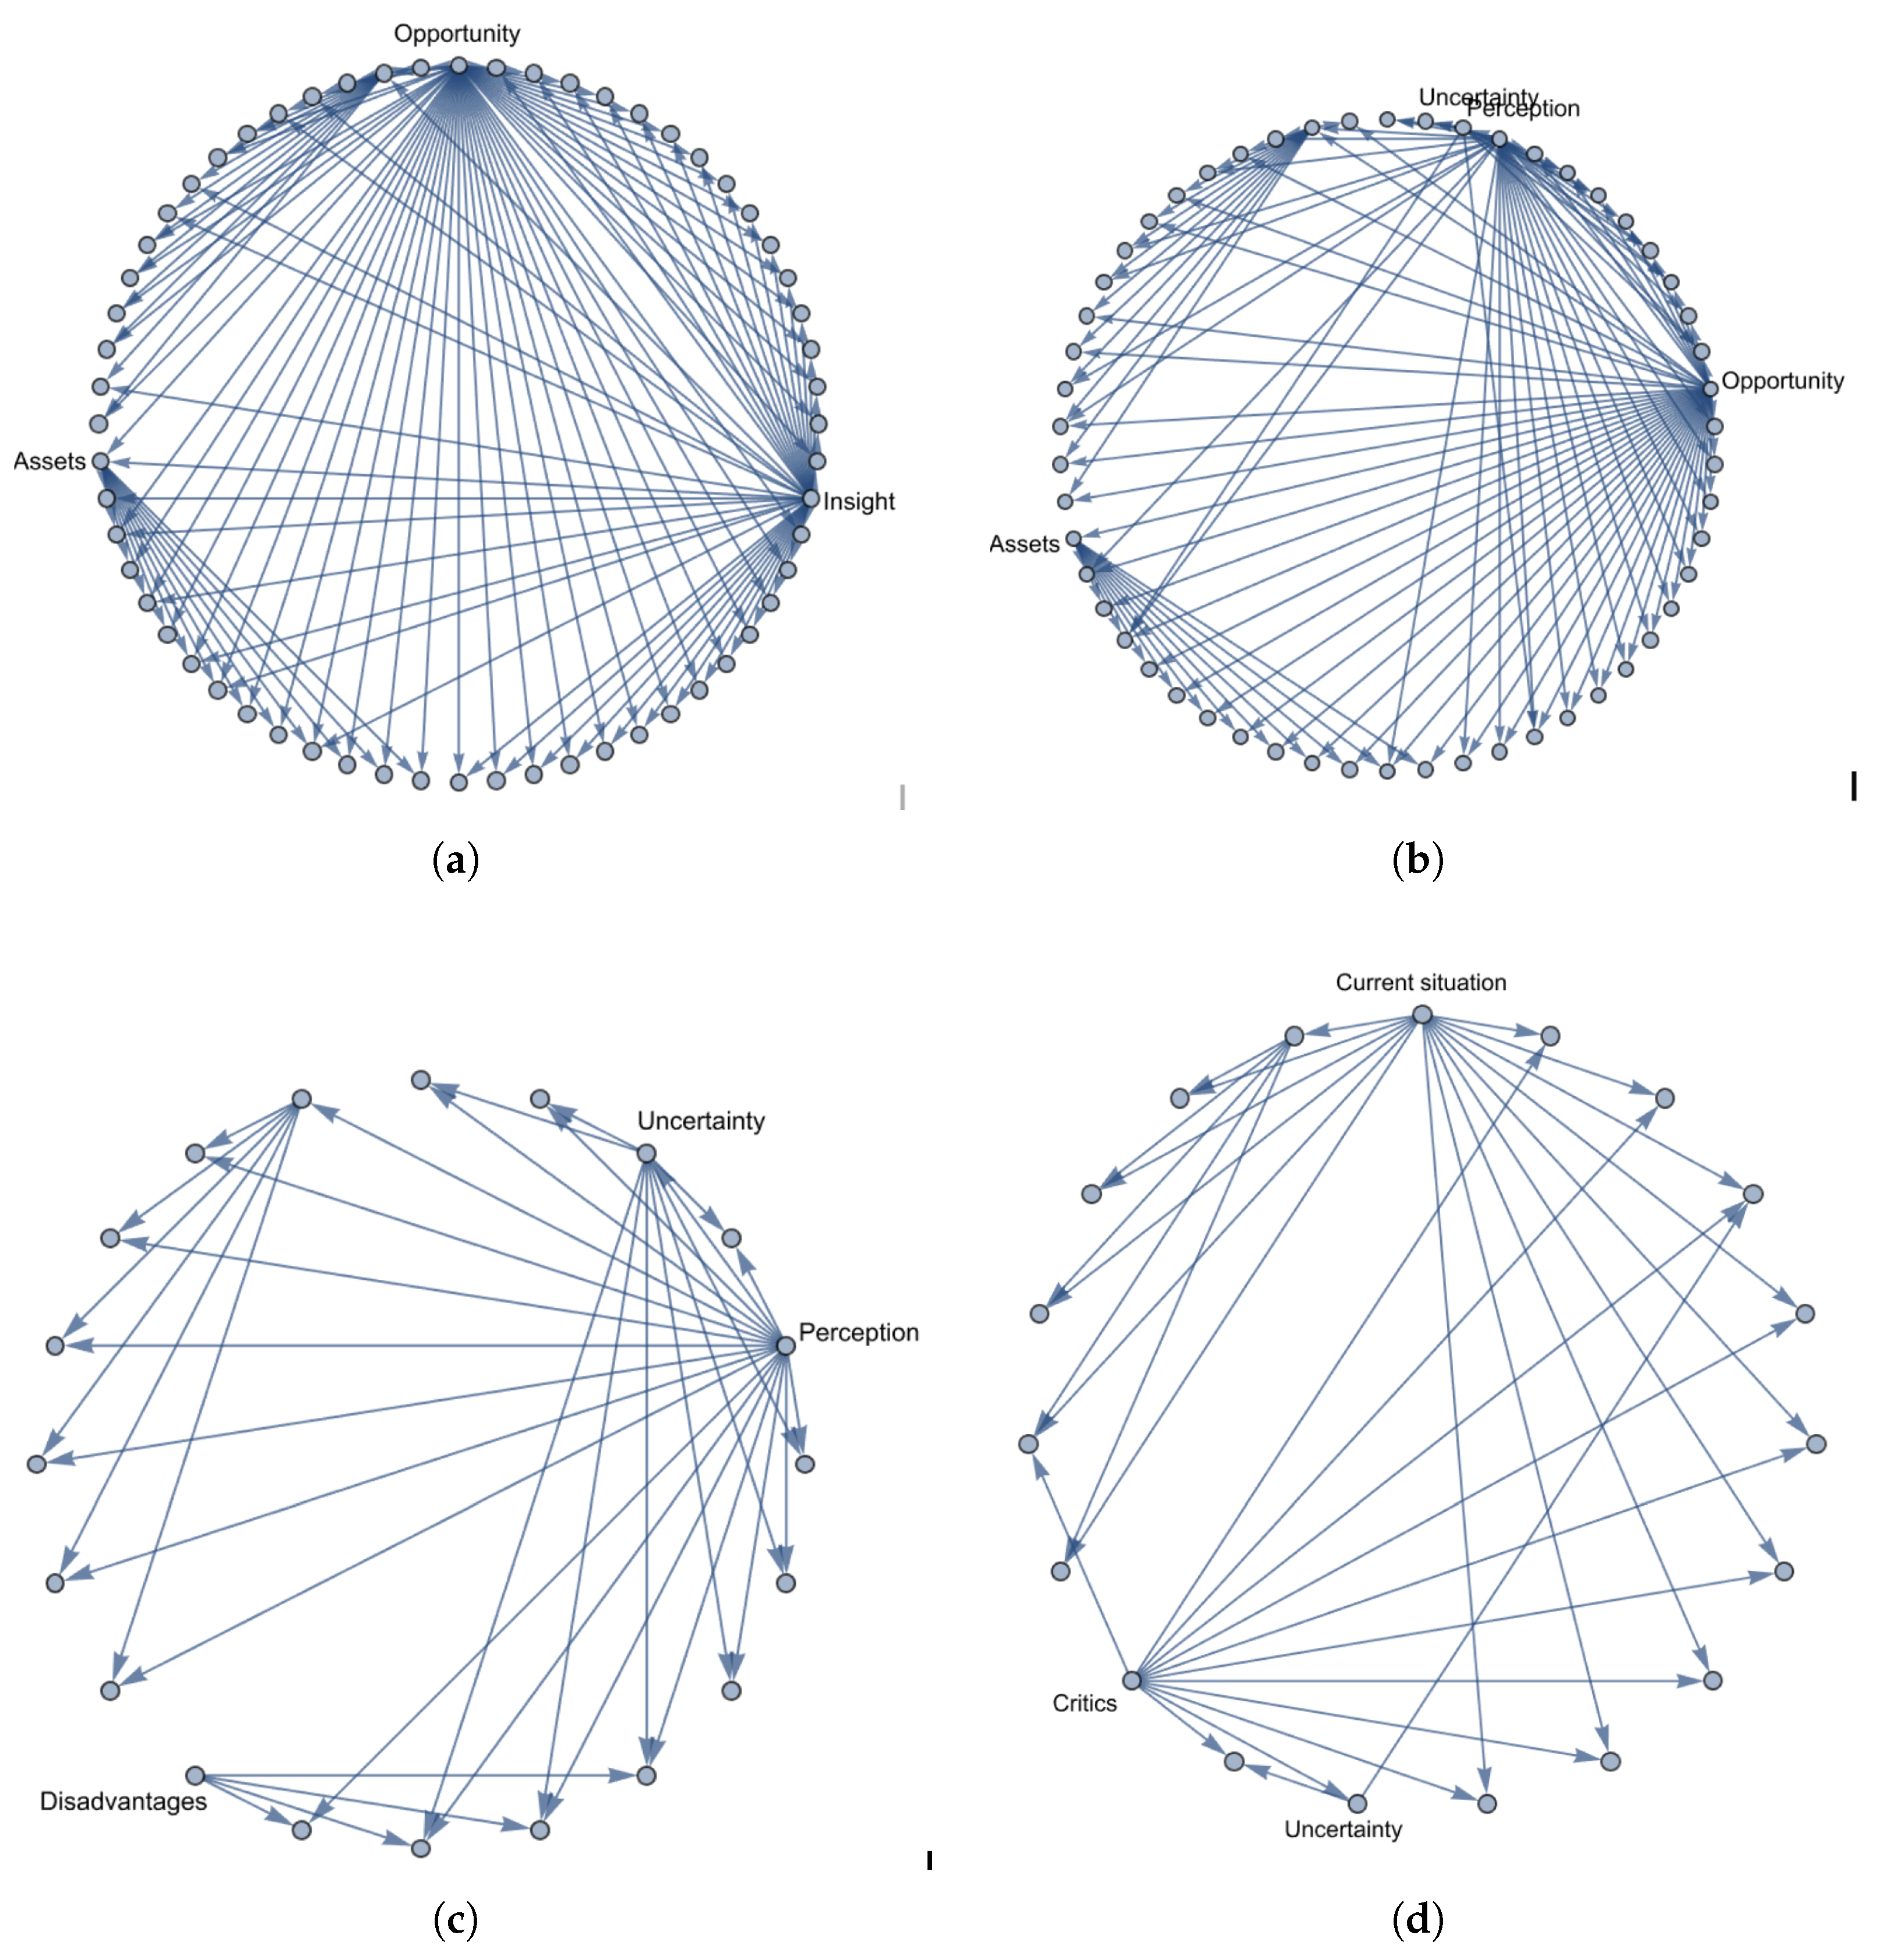
Figure 2.
Semantic network of narratives. The narratives’ network is represented as a directed graph between themes and codes. Themes are labeled; interconnecting codes are highlighted in red. The Theme "Assets" is found to play a central aspect.
Figure 2.
Semantic network of narratives. The narratives’ network is represented as a directed graph between themes and codes. Themes are labeled; interconnecting codes are highlighted in red. The Theme "Assets" is found to play a central aspect.
Figure 3.
Communities formed by the topology of graphs between themes and codes. The following clusters are formed: Current Situation and Insights (Red); Assets and Opportunities (Blue); Perception, Uncertainty, Disadvantages (Yellow); Critics (Purple); Appropriate Language (Tidal). Community detection allows to identify which codes interlink different themes, and inspect the narrative from the original sources.
Figure 4.
Narratives between themes. (a) The narrative in common between Opportunity and Insight, shows that several codes are about Assets. (b) The narrative between Opportunity and Perception is supported by codes related to both Uncertainty and Assets themes. (c) Uncertainty relates to both Disadvantages and Perception, and to (d) Critics with respect to Current Situation, e.g., codes concerning critics over the current situation, and uncertainty of proposals affecting the current situation.
4.2. Advantages
The theme Insights uncovered perceptions about definitions of innovation in the context of research management, functional to the research question. Key findings include:
- Failure as innovation: Failure is perceived as a form of innovation in itself (R1:28). Failure provides information on what assets did not produce actionable results and helps avoid faulty repetitions (R1:31;R1:75;R2:84).
- Integration of heterogeneous data: Researchers expressed interest in services that allow integration of diverse datasets to forecast the outcome of experiments by adjusting asset configurations, typically in the form of different bodies of materials and methods (R1:81-84; R2:41; R2:89; R2:135):
“So an output I would expect of a service for supporting research is in helping us generate hypotheses and experimental design [..] to first construct a functional prototype and then improve performance on manyfolds aspects of the KPIs we’re using.” (R2:41)
- Extension to intangible assets: These insights may enrich existing literature [17] by extending process-asset mapping models to include intangible assets such as experimental settings, material usage, required knowledge on procedures and methods from scientific literature and/or patents, required knowledge from prior tested procedures and in general any source of information that is used in the process of ideation (R1:25; R1:41-R1:45; R2:41; R3:10). Any intermediate steps, also ones not producing immediate actionable results, contributes information towards subsequent steps (R1:86; R1:91; R2:41). The last innovation-step represents an embodiment of all previous pathways that led to it.
- Recommended timescale for tracing observations: Respondents supported regular monitoring of innovation steps, ideally every two weeks but no less than once per month (R0:123; R1:133; R2:111; R3:30).
- Need for new metrics: A respondent introduced the metaphor of two innovation “geometries”, that we can associate to the concepts of innovation and invention previously discussed:
This motivates the development of new key performance indicators (KPIs) based on in-itinere analysis of prior steps, rather than relying solely on ex-ante or ex-post metrics on bibliometrics. Such metrics could lift on the historical path of prior results towards new options for valorising intermediate results that were not planned (R3:90). KPIs based on innovation paths could be integrated in IT-frameworks for supporting decisions towards the next R&D process (R1:78). For example, logging innovation-steps and querying innovation-paths backward would help to summarise prior knowledge towards the next experimental configuration (R1:27 : R1:29; R1:41), and capitalise on time invested on not-yet successful results. For instance, trials can last months, and in between there are many innovation-steps with many “failures”.“The horizontal one, where innovation is generated by connecting distant fields; the vertical one, where innovation emerges suddenly by an unexpected event.” (R3:16–R3:18)
Appropriate language emerged as a theme related to communication strategies:
- All respondents agreed that communication style must depend on the type of audience.
- For marketing (R0:96) activities, disclosing visual representations of intermediate innovation-steps can be functional to engage in open science (R3:35-R3:37; R1:54) or suited for sharing results to non-technical audiences (R3:163; R1:61).
- For evaluating patentable results of innovation steps (R0:129 : R0131; R0:133; R0:139; R2:71;R2:74-R2:75), prior innovation pathways could be useful to identify what has been tested before (R1:78) and to extract quantitative insights as alternatives to scientometric indicators (R3:25), such as the possibility of forecasting of a technological saturation of patents associated to candidate innovation-steps [35]. A fortnightly update pace was suggested to support periodic patentability assessments (R0:122–R0:129).
The theme Opportunity reinforced expected benefits from tracking innovation fortnightly (see an extract in Annex):
-
Tracing failures can provide:
- -
- Knowledge of previously tested approaches
- -
- Know-how for successful replication
- -
- Basis for generating new hypotheses (R2:41)
- -
- Complement to literature that omits failure cases or practices to avoid
-
Tracing innovation steps can support:
- -
- Resource planning and experimental output forecasting
- -
- Discovery of new options to valorize an output, beyond traditional scientometrics or surveys (R1:17; R1:20; R1:27–R1:31; R1:75; R1:84; R2:85; R0:49; R0:63)
The theme Assets provided prescriptive insights for digital tools to trace innovation pathways, improving the limitations of representing input-process-output or process-assets models only by means of diagrams :
- Asset categories should include intangible resources, (e.g., knowledge, know-how, experimental settings
- Tracing should record the purpose and expectations for asset use
- The input interface should use minimalist design to reduce friction
- Pathways should be visualised through graphs and charts
- Integration with existing organisational databases is crucial for mapping and comparing use of resources (for example, compare the chemical properties of materials used in experiments)
- Communication tools should adapt to audiences, interactive maps may help to schematise innovation (knowledge graphs for explaining what an innovation is and what are the outcomes and how they are produced ) and interactive charts may help to summarizing prior pathways at desire time-scale (all prior steps to a given point in time). Traditional media, especially short-videos for social network dissemination, are envisioned as most effective for engaging in open science
4.3. Disadvantages
Themes Critics, Uncertainty, and Disadvantages informed possible improvements of current practices, highlighted limitations of increased costs for tracing innovation at a more granular level:
- Intellectual property concerns: Some respondents questioned current intellectual property rules, where the EU supports research with public funding but property rights of any invention are only ascribed to the private companies of the consortium (R1:155–R1:158; R3:151; R0:152).
- Surveys’ weakness: The reliability of surveys as method to report results to the EU was critiqued because the way that questions are posed or rephrased in function of target stakeholders, could yield different answers.
- Authorship and ownership: Respondents were challenged if tracing innovation pathways should also trace authorship and grant a legal value to authors for utilizing the intermediate-steps they contributed for future innovation outside of the original project (R3:56; R3:113; R1:165; R0:152). There was a mixed view if an author should be free to carry-on development over unused innovation-steps on an independent basis, but a general agreement if done in a context of business and entrepreneurship such as with affiliated spin-off companies.
- Resource burden: Introducing a new workload for granular tracing of innovation-steps is expected to increase time-costs and might even call for full-time duties (R1:35; R3:101; R2:150–151). However, if attuned to current practices and a plausible periodicity (fortnightly), time-cost was perceived as an investment (R1:130; R1:148; R3:101).
- Limited applicability: Tracing innovation paths could only be relevant for internal use or dissemination, as TRL metrics must use consolidated approaches (i.e. bi-monthly surveys).
-
Perception bias:
- -
- A tendency to discuss opportunities more than drawbacks, possibly due to participants’ roles in research space may be inclined to discussing options more than conservative management roles.
- -
- Unclear if tools for tracing innovation pathways would be up-taken by small organisations or organisation with tight schedules.
5. Discussion
The following section discuss findings of the thematic research as implications on digital tools for tracing innovation, on policy, and on theoretical aspects to compute the value of innovation and the contributions that led to it.
In response to , we found that intermediate innovation steps is expected to unlock new value by revealing the cumulative knowledge embedded in failures and intermediate outputs: these are assets that can be reused for increasing successful replications of components across a research portfolio or alternative industrial fields, and generating new hypothesis principled by empirical evidence. Section 5.1 elaborates on how data can be collected for tracing how innovation evolves from early stages to maturity, and draws from perceptions on expected benefits, usability and utility (e.g. integration with external datasets) reported in Section 4.2; Section 5.2 discuss articulate the use of pathways of innovation as support to policy for optimizing research portfolios.
In response to , we found that alternative metrics of value are expected to consider the temporal perspective of innovation (innovation being the apex of a long pathway) and the capacity to connect fields which have been usually separated; these are two aspects that scientometrics and conventional metrics used in TRLs or innovation management do not address. Section 5.3) discuss theoretical implications for objectifying value in function of the topology of innovation networks, which can utilize the data collected from digital tool as a support for practical implementations in scientific discovery and innovation economics.
Finally, Section 5.4 summarise the expected impacts and follow-ups.
5.1. Design Implications for Prototyping Tools to Assess Innovation Emerging from Knowledge-Networks
Although the primary research question was focused on exploring perceptions of tracing innovation steps, the insights gathered through interviews and questionnaires also informed the complementary design of a conceptual prototype. This model was conceived as a knowledge graph implemented on a blockchain infrastructure, aimed at recording the resources, processes, and outputs involved in each experimental activity. Specifically, the prototype conceptualised innovation as a function represented with a 3-partite directed graph (see Figure 6), with node types:
- Inputs: Resources used by the process (materials, data about experimental conditions, procedures extracted from scientific literatures and/or patents).
- Processes: Conceptually representing any process (experiments, procedures) as a function with arity equal to the number of inputs which return at least one output.
- Outputs: Results, or outputs, of the process, including both successful and failed attempts.
The nodes’ properties collect information describing the experiments in terms of required resources (`What` property), motivation (`Why`), procedure for using resources and replicate the process (`How`), `Expected output`, `Expected outcome` and the expected impact for utilizing the outcome. Querying innovation pathways allows to extract information from chains of experiments, providing context for driving generation of hypothesis in LLMs-RAG systems as chained of reasoning and enabling empirical validation with prior results.
Processes can be registered only if inputs and outputs are specified. Prior outputs can be used as inputs in future time steps, they can be generalised to a single set of “resources”, functional to model circular economics networks and prior-art networks, and the tree of prior processes can be reconstructed, from inception at any given time. All the transactions are recorded on a ledger, which track the temporal development of the graph. The consensus policy for saving an immutable innovation step on the ledger can be adjusted on a preferred consensus. For instance, saving an innovation step may require only the signature of the research manager, or the signature of at least two of its contributors. The scheme of the knowledge graph concurrently recording the authors’ contributions on a blockchain ledger is shown in Figure 5.
This graph-based representation was designed to enable retrospective analysis of innovation pathways and to empirically explore how value can be objectified as a function of the novelty or of the complexity embedded in the underlying informational structures such as node embeddings, graphlets, or other features used in graph representation learning, cf. [35]. The platform was prototyped with APIs for network analytics, including shortest-paths, clustering, and graphlets. It supported interactive visualisations, such as Sankey diagrams to illustrate flows of knowledge, resource-use and resource-outcome over time. These capabilities were conceived to help teams and decision-makers explore how innovation emerges from early-stage ideation through iterative refinement and towards potential spin-off opportunities or industrial adoption at future stages. Figure 7 shows a macro-level query of how inputs where processed into outputs of higher complexity through the stages of TLRs, while Figure 8 shows a micro-level query of specific configurations required to replicate experiments that led to results published by the consortium.
We suggest that these knowledge graphs can improve the effectiveness and reduce the biases of Large Language Models (LLMs) and Retrieval-Augmented Generation (RAG) systems when used for scientific discovery, aiding in overcome the limitations of hallucination, training bias, and transparency of generative models for scientific discovery [25]. The details of experimental inputs, processes, and outcomes (including failures) provide context for generating hypotheses that are empirically grounded, while the innovation pathways make the reasoning that led to hypotheses formulation more transparent for evaluating coherence and plausibility. The directionality of edges can shape chain-of-thought by reflecting the sequences of reasoning in terms of that inputs precede processes, followed by outcomes of these processes. Information about failed experiments can also support automated adversarial prompting in multi-agent systems, where one agent challenges new hypotheses using evidence from past failures.
Future studies could build on this conceptual framework to pilot systems for real-time capture and visualisation of innovation steps, compare their performance and user acceptance against conventional ex-ante or ex-post indicators, e.g., the number of publications, patents, and TRL levels, and further explore policy implications related to intellectual property governance, attribution, and open science dissemination.
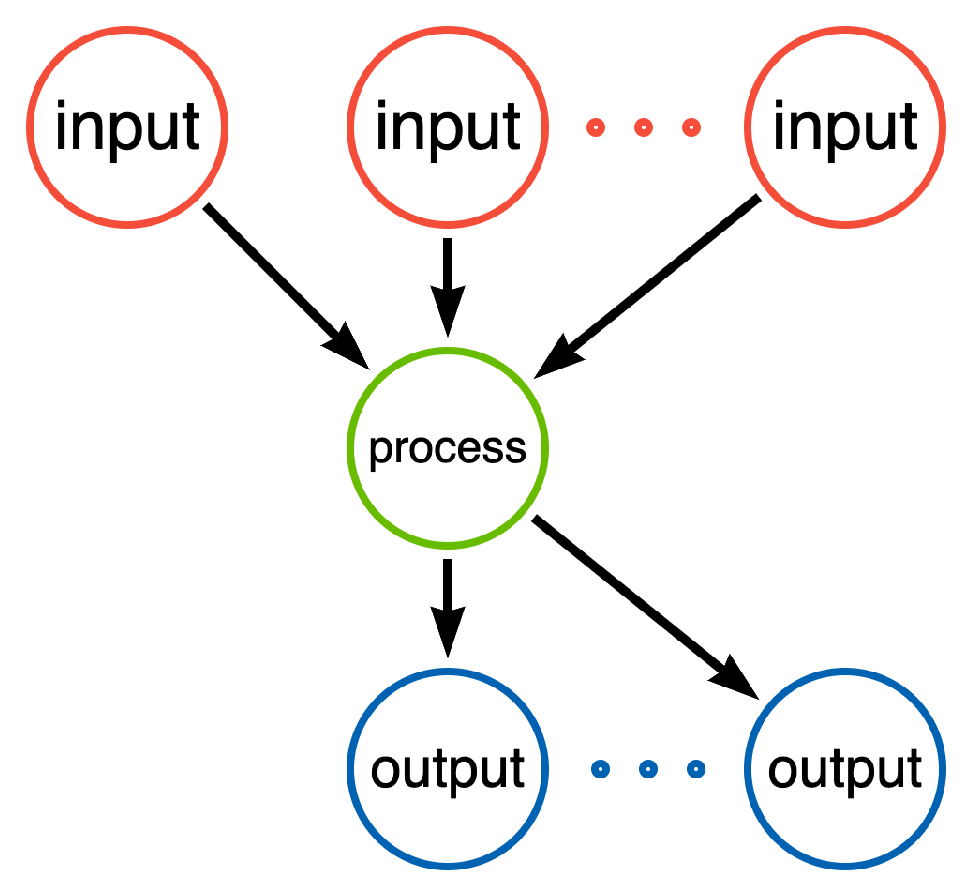
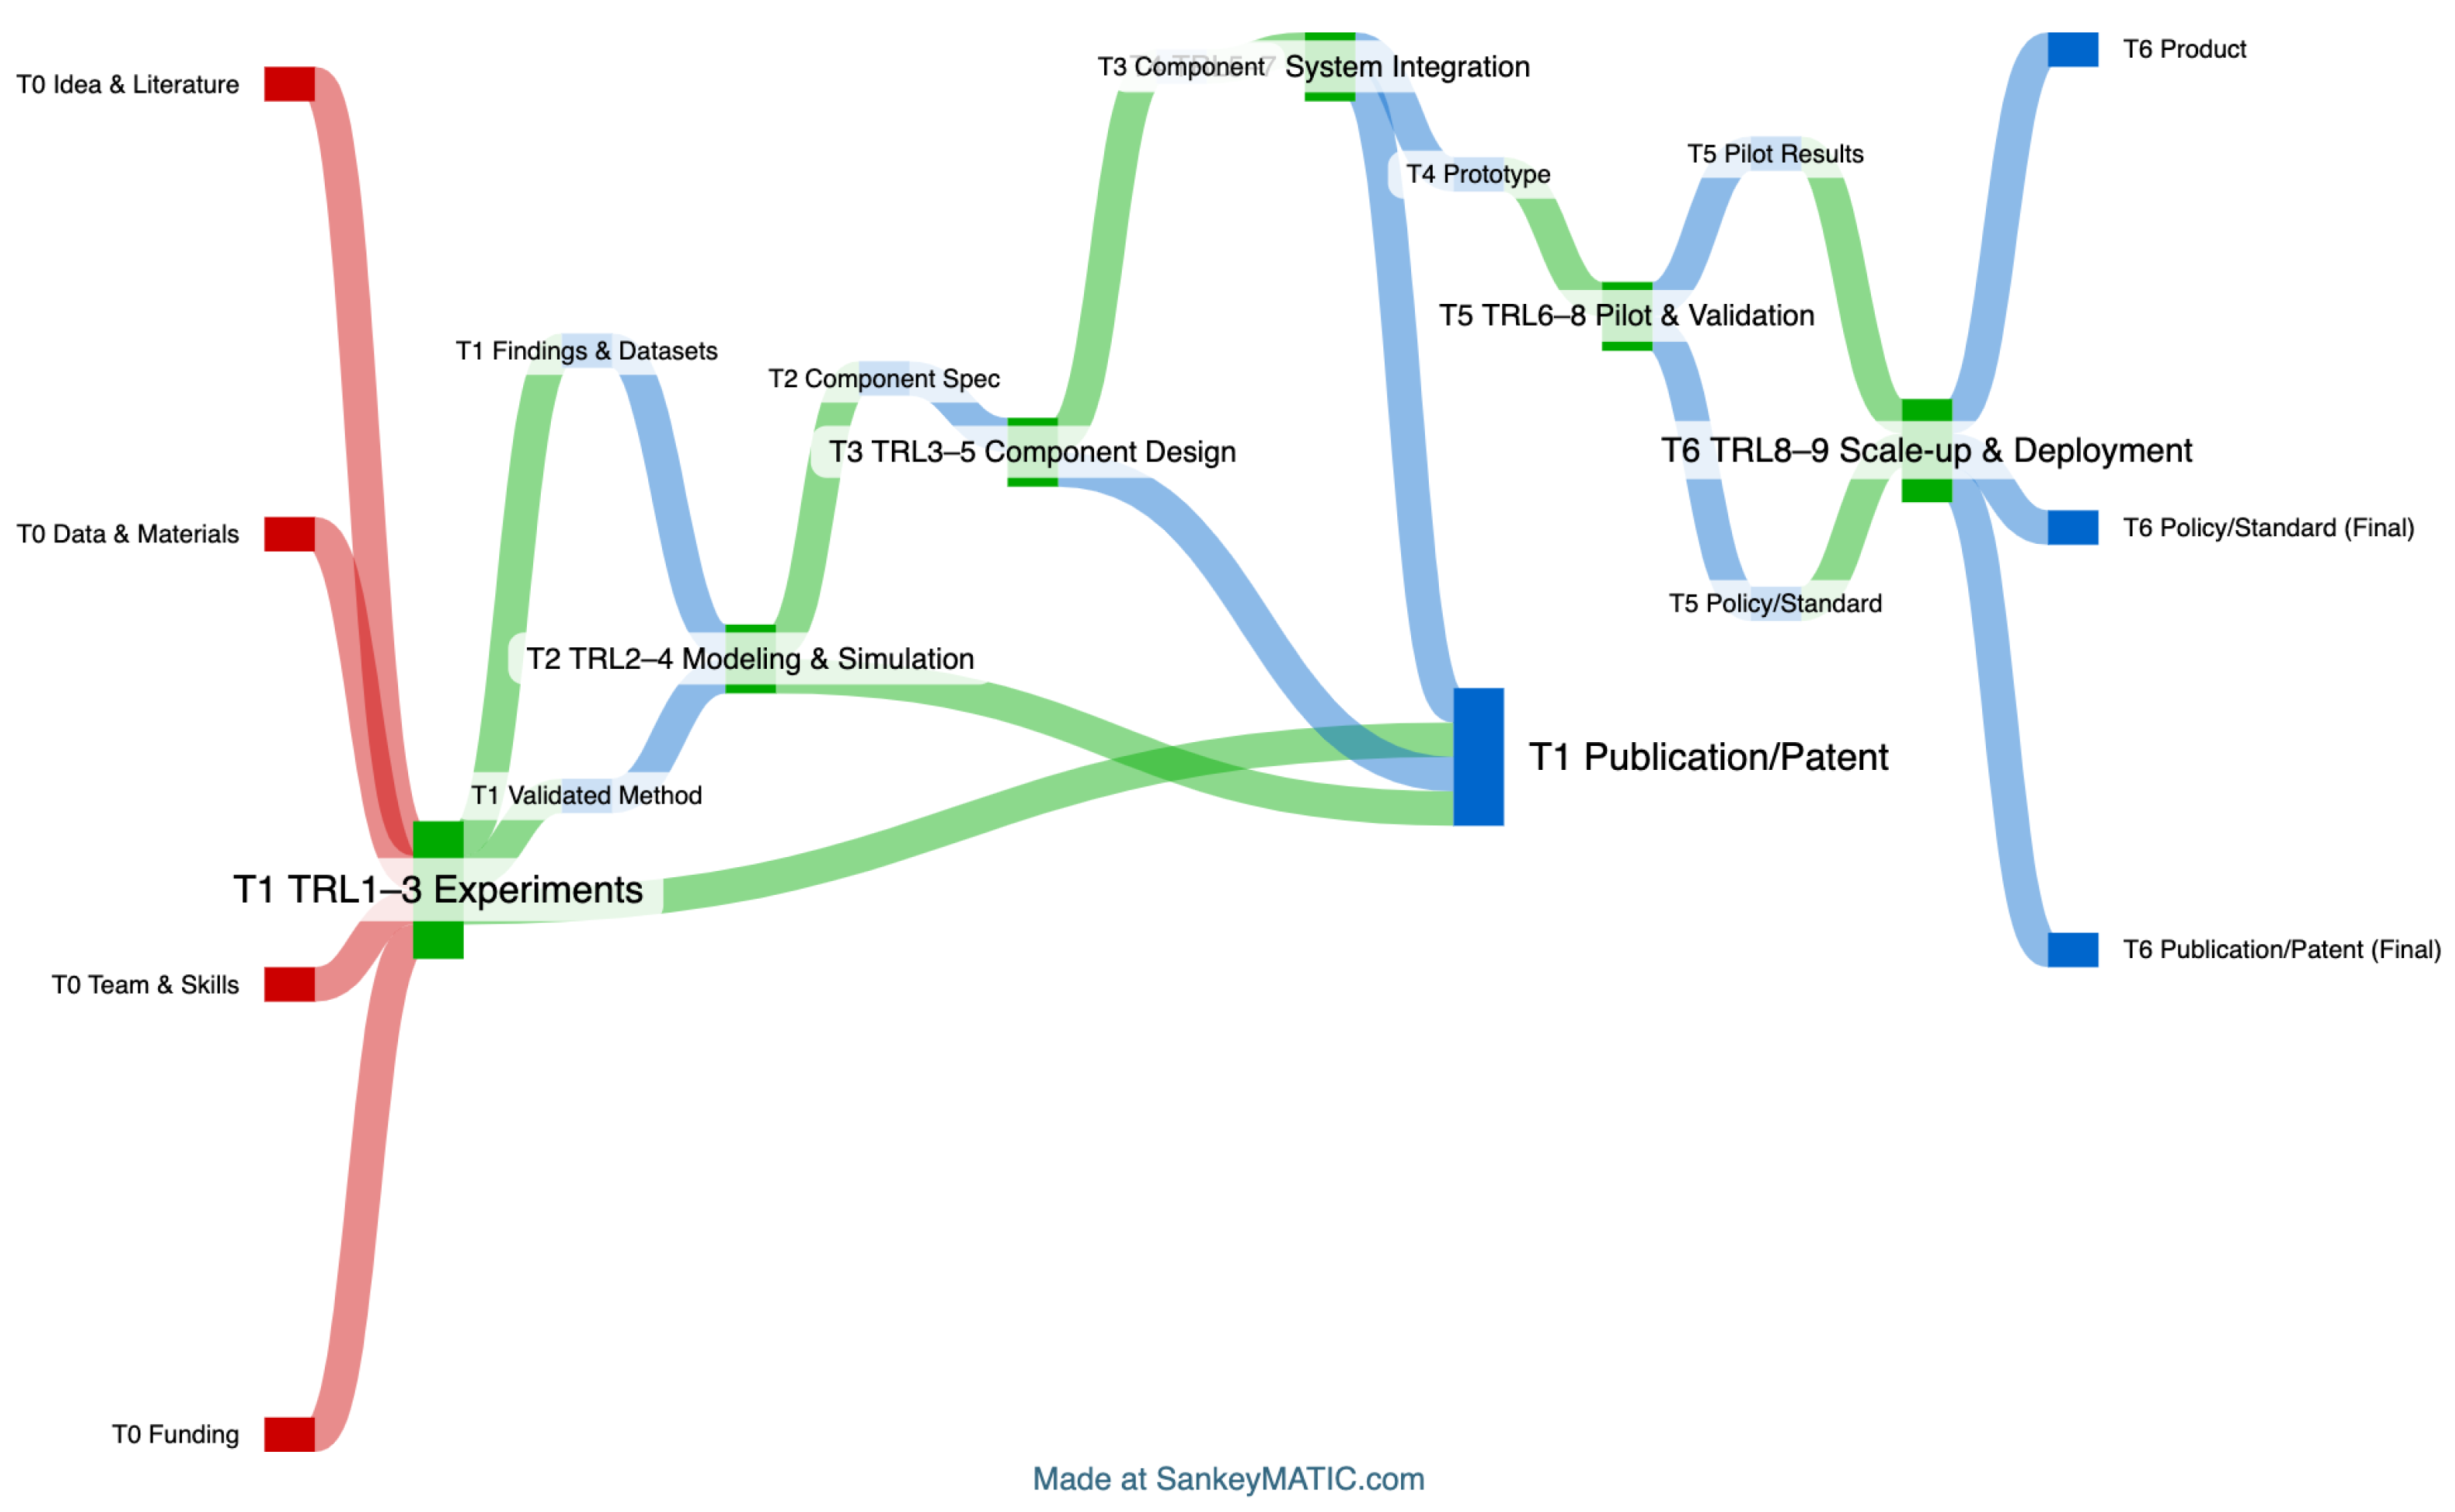
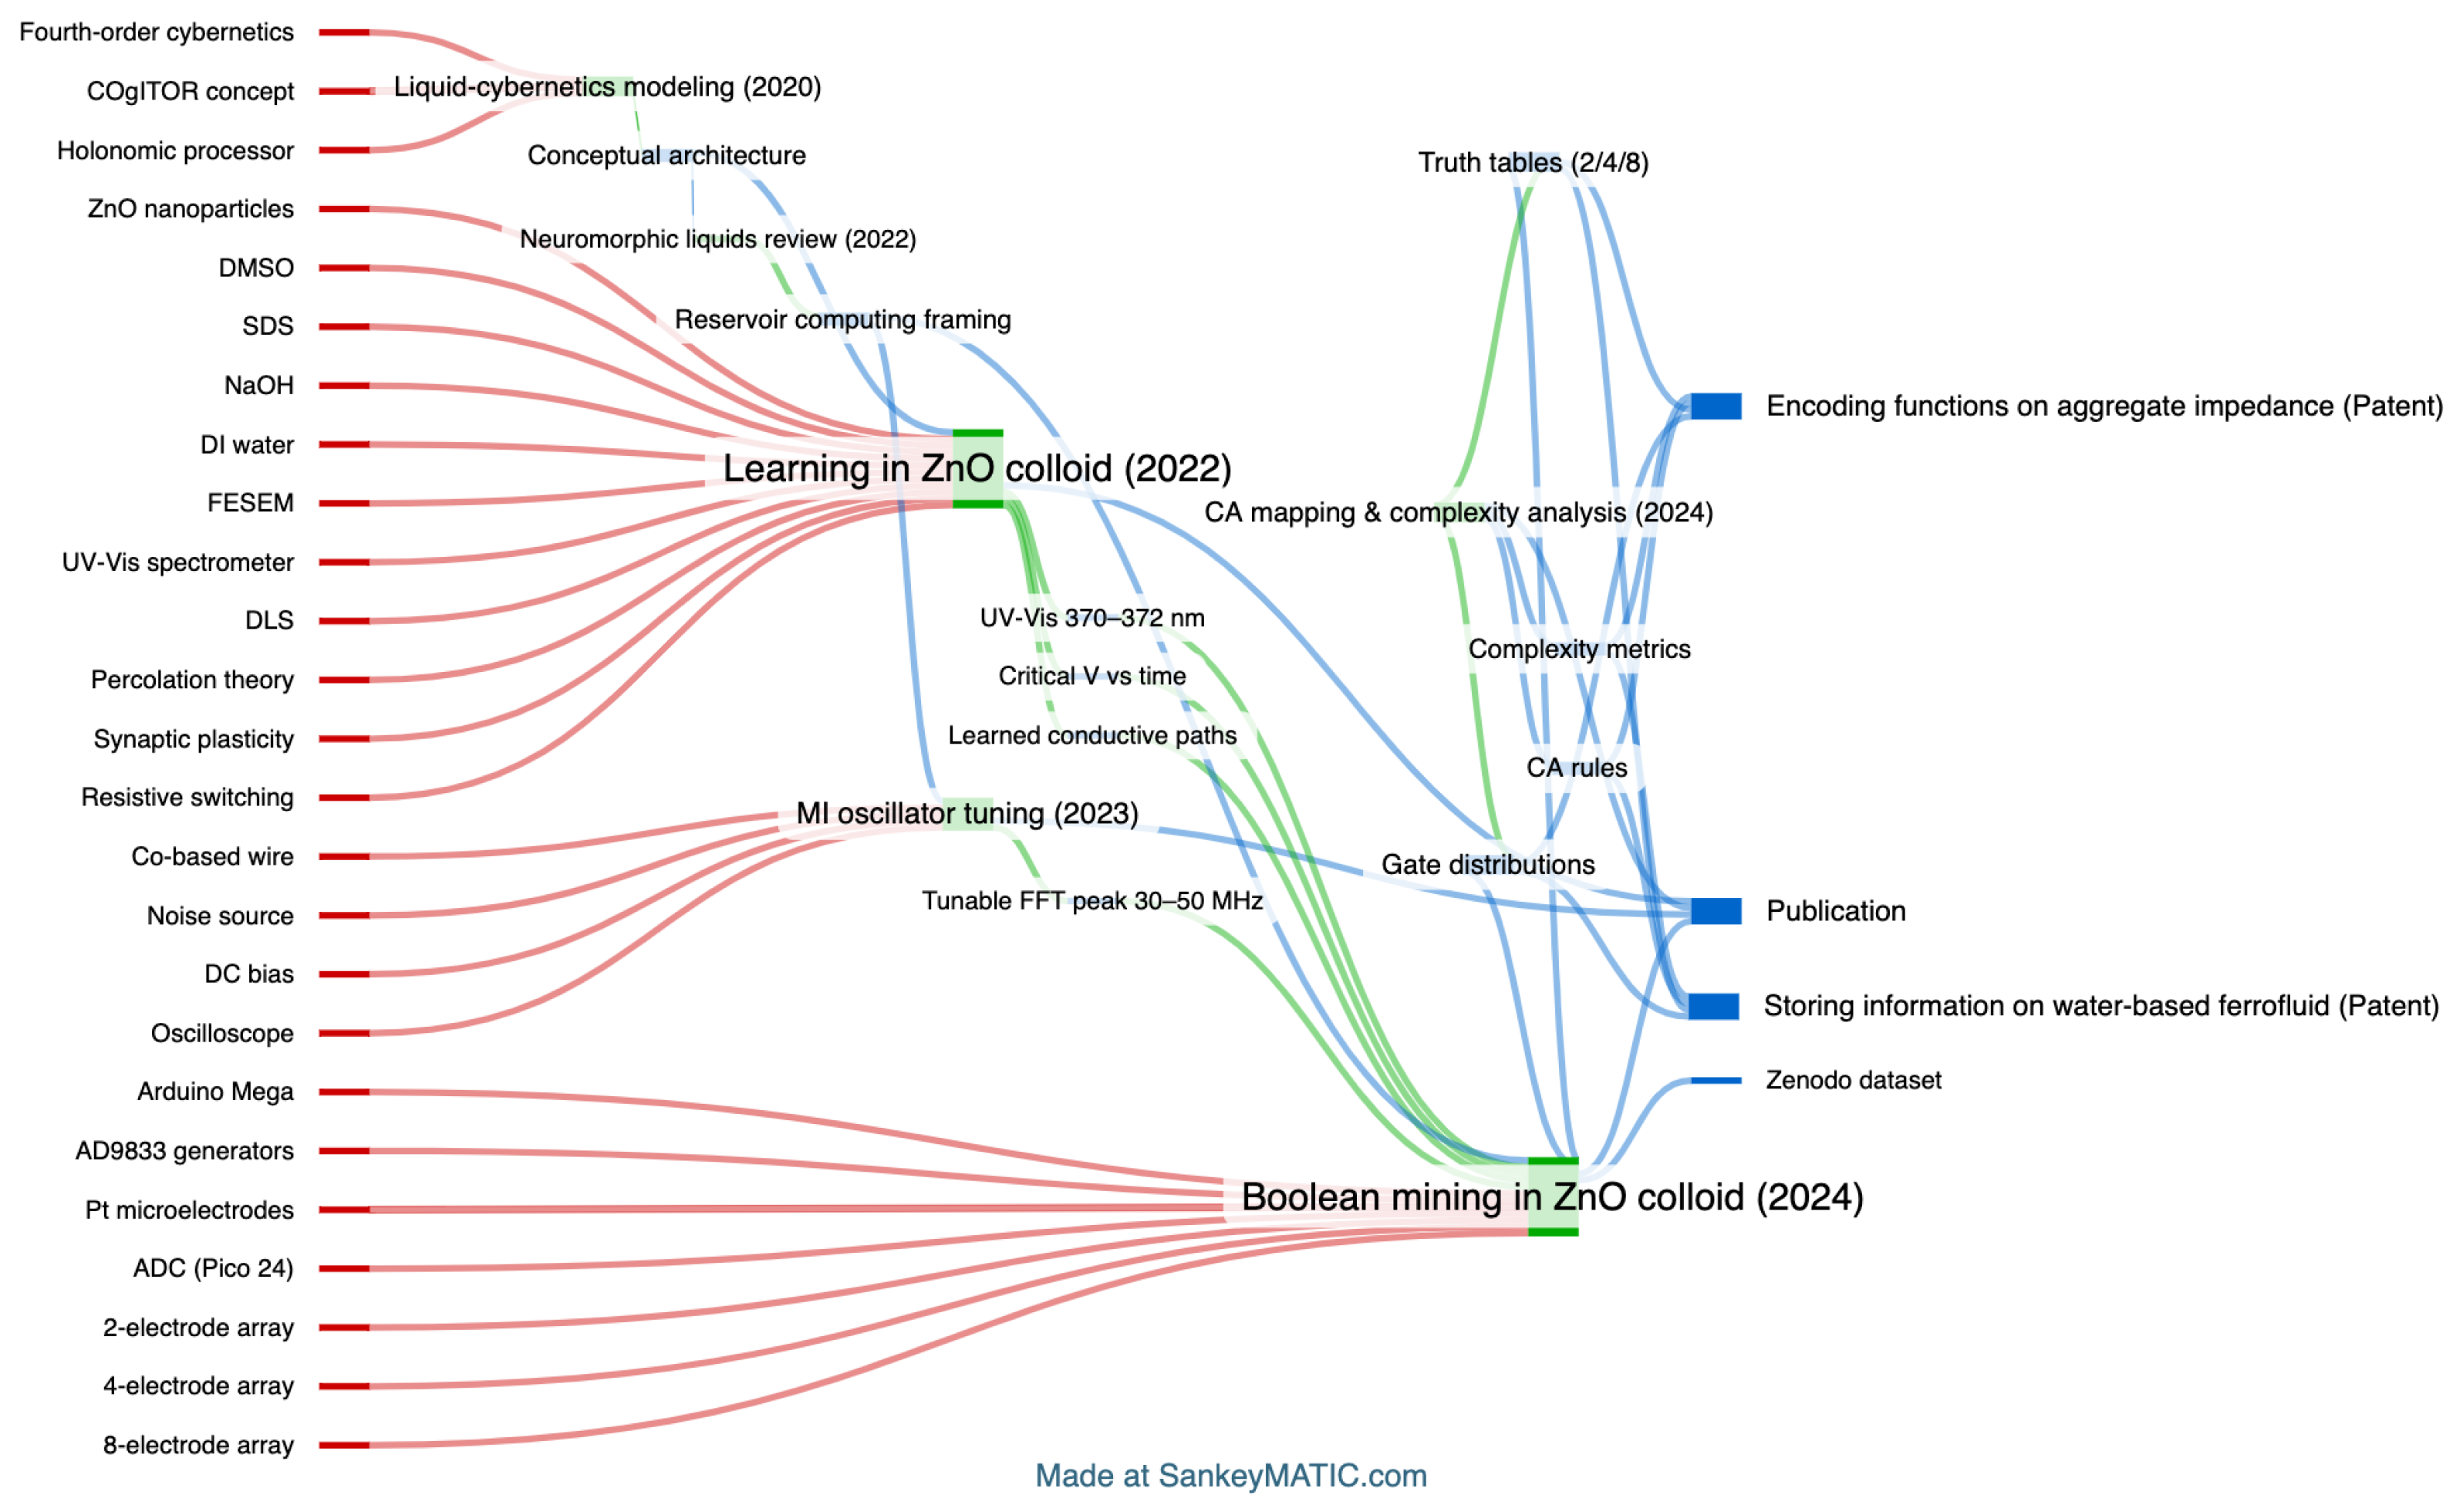
Figure 6.
Graph representation of an innovation function. Innovation is defined as a process that require a set of inputs and compute a set of outputs. Graph properties can further specify properties and conditions for effective replication of the process.
Figure 6.
Graph representation of an innovation function. Innovation is defined as a process that require a set of inputs and compute a set of outputs. Graph properties can further specify properties and conditions for effective replication of the process.
Figure 7.
Example of a macro-level query retrieved from the knowledge graph. Illustrative flows of innovation paths through TRLs. Inputs (in red) contributed at T0 are ideas, prior art, know-how from teams, and funding, are computed by processes (in green) at T1-T3 being experiments, simulations, and components, which returns outputs (in blue) in terms of system integrations, first publications, and patents) for T1; T3. The outputs can be reused as inputs for new processes, such as pilot validations and upscaling, that return more consolidated outputs like new patents and final products at the later stages T6-T9.
Figure 8.
Example micro-level query retrieved from the knowledge graph. Illustrative flows of innovation paths developed within the research consortium. Queries can recall sequences of innovation steps against specified temporal intervals. Innovation flows can display how early-stage data (TRL 1) mapped onto final policies (TRL 9 or after project conclusion). The network can be plugged into other research consortia to facilitate tech transfer to other research portfolio. Flows represent types of resources (in red) such as data, equipments, and settings that are required for each methods (in green) and the outcomes (in blue) they produce in terms of, e.g., patents, publications, and policy outcomes. Failures or not-patentable contributions can be recalled in the future. Authorship is revealed for all innovation steps, enabling flexibility to tune economic value along the supply chain of innovation in economic policies.
5.2. Policies Implications of Non-Linear Innovation Emergence
Innovation paths, in this study, were interpreted and formally implemented as a network, whose topology is recorded periodically through a proof-of-concept. The structural properties of networks leverage points to trace the emergence of order from iterative experimentation and feedback. These patterns can help identify under what conditions computational properties, materials, or design strategies gain robustness, scalability, or capacity of generalisation or across domains. For example, a successful prototype may only emerge after multiple reconfigurations of inputs and intermediate experiments. Such pathways carry informative value even when intermediate steps did not yield success. This perspective suggests a shift from measuring innovation by predefined outcomes or final products such as patents, to evaluating the contribution of each step that, even if not successful, is part of a cumulative knowledge process.
Policies aligned with this view would require tools capable of capturing latent value embedded in intermediate results, which could infer reusable insights from failure, and possibly set public readability permission to information about failures as an intangible capital whose return is expected to lower costs of technological transfer. This is particularly relevant to the role of investment in research from public funding, where market-based indicators systematically undervalue the collective benefits produced by public R&D [10]. With reference to managing innovation in welfare economics, maximising diffusion of knowledge across a portfolio of public investments may benefit from metrics that promote technological saturation across domains as networks of cumulative knowledge, for instance in the form of measuring patent propagation, cf. [35].
Also, the current logic for managing public funded portfolios often lacks indicators to evaluate how research contributes to long-term ecosystem resilience or cross-sector innovation. Extending the proof-of-concept corollary of this study could address this gap by making visible the cumulative contributions that underpinned patentable innovation such as partial results or failed trials which could be a valuable byproduct in future markets [15,21].
In this view, tracing the origin of contributions, e.g., ideas, unconventional approaches, and experimental settings, that allow replication. Recommendations that reduce trial-and-error provides an empirical base to shape policies that support knowledge transfer while complementing the limitation of intellectual property with respect to maximise diffusion of knowledge as a positive externality.
In this context, we interpret the diffusion of knowledge as a function of redistributed capital return toward the human capital that enabled innovation, thus formally proposing a base to operationalise two transformations of governmental structures aiming to achieve sustainable development: i) valuing the contribution of human capital in education of science and technology for promoting economic growth, and ii) providing digital technologies that make up-taking of unsuccessful scientific effort more readily available for accelerating development of new technologies [19].
While this view was not explicitly shared or challenged by participants in this study, respondents acknowledged some practical benefits of innovation traceability and potential value of tracing intermediate steps and unsuccessful steps. Some were comfortable with traditional forms of compensation (salary), while others saw opportunities in valorising granular authorship as a basis for future innovation rights, especially in spin-off contexts. The proposed network-based approach does not aim to replace existing TRL or scientometric models, but to complement them by enabling ex-post, in-itinere, and even predictive analytics based on the structure of prior networks of innovation steps.
These digital artifacts, if adopted across public funding ecosystems, may provide a new layer of visibility into how innovation actually evolves and contribute to:
- Accelerate innovation by identifying critical turning points and bottlenecks within projects.
- Allocate funding not only based on expected outcomes, but also on the diversity and recombination potential of exploratory steps.
- Encourage the diffusion of negative or null results, thus reducing systemic inefficiencies.
- Recognise and valorize contributions beyond the traditional patent or publication models.
5.3. Theoretical Implications of Latent Value of Exploration in Innovation Networks
Building on the analysis of results and the design of a corollary proof-of-concept, this study proposes an inductive theory of innovation as a process of value accumulation in knowledge networks. Conventional methods for evaluating innovation in TRLs prioritise outputs that meet predefined goals, e.g., business goals, academic or, in general, market fitness goals. In doing so, they adopted predefined metrics functional of the desired goal, and omit the latent value embedded in exploratory steps, failed experiments, or intermediate configurations that ultimately shape trajectories towards novelty and its embodiments. On this foundation, the study inductively proposes the theory that paths recombining prior knowledge into novelty hold latent value that can be quantified in function of the network topology, so that value reflects the cumulative contributions of both failures and successes, and appreciates when breakthrough leads to innovation maturity. To provide a conceptual bridge between the practice of mapping innovation and a formal basis of latent value emerging from network dynamics, we frame innovation as a dynamic system evolving over time where every exploratory step (such as an experiment or prototype component) perturbs the topology of the innovation network. Network-based metrics such as centrality, modularity, page-rank, or other indices could instantiate the probability distribution used in the Fisher–Shannon framework, enabling empirical computation of innovation diversity and coherence.
We now might return to the functional theory of Eq. 4 and elaborate further to express the Latent Value of Exploration (LVE) as the expected improvement in achievable system value due to an updated knowledge occurring at the exploratory step s, that might be a new experimental trial, a topological perturbation, or a different configuration test (Eq. 5):
Here the innovation functional of the network is denoted by , C encodes the connectivity configuration, s a single exploratory step yielding data , the space of possible connectivity configurations, the network configuration before (C) and after () exploration, is the expectation value (statistical) over data outcomes, and is the cost of the exploratory step. Even when the immediate experimental outcome does not improve performance, such a step may still expand the reachable maxima of , increasing future adaptability. Subtracting the cost term yields the net LVE. As we have seen, innovation can be represented as a trajectory in the Fisher–Shannon plane (see Figure 9), where we track both global diversity (entropy), and local order (Fisher information). An exploratory step can shift the system’s trajectory closer to a desirable regime even if the current innovation functional does not improve. This trajectory shift defines as we have seen the LVE, that captures such directional progress, valuing exploration that shapes long-term adaptability. Exploratory steps move the system along a trajectory, and LVE is the projection of this motion toward the region of maximal desirability. Fisher–Shannon transitions between attractors can even help in quantifying the dynamics. Escaping from an attractor can occur within a measurable time and lead to the notion of escape frequency, the most probable escape path minimises a quasi-potential landscape. Quasi-potential barriers separate attractors, and default-network modes exist for high-dimensional networks, providing basin stability. If an exploratory step reduces the effective quasi-potential barrier toward a target attractor, then according to Kramers’ law, it exponentially increases the transition rate and decreases the mean escape time.
The latent value is often missed by conventional metrics, because those metrics reflect the preferences (or utility) of a subset of economic agents with rights over procedures or even on the resources necessary to reproduce a desired output. On the opposite, the paths leading to innovation, including dead branches, may contribute to a broader economy of knowledge when structured as networks of contributions.
The theory rests on the following propositions:
- Innovation emerges from temporal networks that encode the transformation of resource sets into new ones.
- In scientific research, failed or inconclusive steps have intrinsic value by informing what does not work.
- In entrepreneurial systems, the value of innovation only depends on predefined metrics or on outcomes that can be rendered proprietary.
- This asymmetry leads to under-utilisation of public investments and a loss of knowledge for recombining resources, in future market or in alternate domains (e.g. industrial fields with less technical saturation).
- If contributions, whether successful or not, are encoded as structured data in a network of innovation steps, their potential to recombine resources into novelty can be traced, quantified, and valorized.
- Graph representations of economic landscapes can help to objectify the value of innovation in function of its topology, thus beyond proprietary outputs accrued by a set of nodes, and support new evaluation metrics integrated with policy design that can gauge the trade-off between impact contributed to the system (i.e. the graph) and impact accrued from nodes who hold proprietary or exploitative rights.
- (corollary) Graph representation methods can be directly integrated with machine and representation learning to model innovation dynamics, enabling the mapping of contributions and their authorship to the emergent properties of the network.
This framework proposes a pathway for complementing ex-ante and ex-post models with in-itinere metrics that account for the emergence, not just the outcomes, of innovation. The theory aligns with recent calls to reconsider how public R&D is evaluated and rewarded, particularly regarding the aim to optimise portfolios of public investments [10]. Its corollary opens a new line of research at the intersection of representation learning and innovation economics: computational sustainability models aiming to maximise the positive externalities of knowledge diffusion within knowledge networks, and to objectify value in function of complexity contributed to economic networks. We posit these metrics can be grounded in information theory (see Eqs. 4 and 5), thus offering opportunity of scale-invariant applicability. (e.g. measuring innovation at micro-scale, as within teams, or at macro-scale, as within industries) and of optimizing funding strategies attuned to increase complexity in innovation ecosystems.
5.4. Expected Impact and Follow-Ups
The impact of this work spans practice, policy, and theory in innovation management. On the practice perspective, the study contributes to closing gaps in tracing innovation that emerges at individuals and teams level [16] and in informing the design of tools that support valuing failures and by-products in future market or cross-domains [15]. Four main potential were identified: i) historical reconstruction of decisions that inform the evolution of an idea to theoretical results and practical embodiments, providing structured context for LLM–RAG or multi-agent systems to generate hypotheses grounded in experimental pathways, ii) valorisation of research byproducts beyond contractual or proprietary outputs, iii) extending input–process–output models from business to research management settings, characterised by uncertain and emergent outputs whose value is underestimated, or even not captured by predefined metrics for evaluating a research program [15,17], and iv) improving communication with technical and non-technical audiences for the uptake of emerging technologies.
At the policy level, this study offers both qualitative and quantitative evidence to support mechanisms that valorize research outcomes beyond predefined deliverables—including the systematic reuse of failed or intermediate results. Such mechanisms help advance policy goals aimed at maximizing the positive externalities of public research investments, such as the diffusion of knowledge across research portfolios [10]. Mapping the cumulative knowledge network and the contributions leading to innovation can also inform how public R&D is evaluated and how the human capital behind it is recognised and rewarded. This impact aligns with two key transformations in the knowledge economy essential for sustainable development [19]: (i) recognizing the value of human capital in education, science, and technology - especially relevant where capital-intensive technologies like AI may concentrate ownership and diminish the role of human labor - and (ii) developing digital infrastructures that accelerate discovery by enabling transfer of critical information across research portfolios.
Future iterations of the prototype could explore whether forecasting technological saturation informed by the topology of patents’ graph [35] can be informed also by innovation graphs within research consortia, so as to support policies that maximise diffusion of information that was critical for stemming novelty within cumulative innovation networks. We envision the blockchain ledger to be functional to persist the traceability of innovation paths and attribute economic value in function of the networks of its contributors, and the knowledge graph to enrich the ontology schema employed by innovation processes for supporting generative tasks such as ideation of novelty by merging disconnected domains [34] and graphical representation from patent networks [20].
On the theory level, a framework wherein latent value emerges from the temporal structure of knowledge networks implies opportunities to quantify innovation in terms of the underpinning network, complementary – or independently – from the utility accrued from property rights, market fitness or market fluctuations [10,15]. Future studies could operationalise this theory across multiple cases to explore the evolution and diffusion of innovation via representation learning in knowledge and economic networks. The theoretical framework we proposed allows to define differentiable loss functions for graph representation learning.
Other proposed topics for further research include to investigate new metrics to objectify the value of innovation based on the topological properties of innovation graphs, align those metrics with policy goals to maximise societal returns from publicly funded science and technology and overcome the limitations of pricing systems that reflect only the subjective utility preferences of economic agents holding proprietary or commercialisation rights.
6. Conclusions
This case study identifies conditions under which tracing incremental innovation steps can generate new value with respect to conventional assessments of Technology Readiness Level (TRL) in publicly funded research. The study collected responses from stakeholders of a consortium working in bio-inspired robotics, and combined thematic and network analysis to examine their perspectives and reveal both descriptive findings and prescriptive insights. The findings indicate that intermediate innovation steps, including failures, are viewed as cumulative contributions to novelty. Their documentation is seen as an investment for unlocking latent value embedded in distributed knowledge.
The insights over scope and data-models of digital tools for tracing innovation, and documentation frequency not to make it an overhead, informed the design of a blockchain-based knowledge graph as proof-of-concept to querying prior knowledge for generating new experimental hypotheses and for tracing what, how, and when, combination of prior knowledge emerged in stable and replicable results leading to more developed TRL phases. An innovation step was represented as a directed tripartite graph interlinking resources, processes, and outcomes. The model enabled to record data and contributions of both failed and successful steps of the innovation process and to visualise the evolution of paths from project inception onward in terms of innovation sequences and the merging and forking of branches. Pathways extracted from the directed graph can support context in LLM-RAG or multi-agent systems for generating hypotheses grounded on sequential reasoning.
A theory is finally proposed based upon the perceptions collected from respondents and the evaluation of the proof-of-concept, to describe novelty in relation to the cumulative knowledge embedded in temporal networks. Of importance, the value innovations could be computed in function of the contributors that enabled them, thus moving beyond the limitations of valuing innovation only if it yields proprietary outputs or market-fitness, and potentially creating a market of failures to be reused across portfolios and equitable opportunities to assign the economic return of an innovation on the network of its contributors.
Author Contributions
Conceptualisation, L.A. and A.L.; methodology, L.A.; software, L.A.; validation, L.A.; formal analysis, A.C.; investigation, L.A.; resources, A.C.; data curation, L.A.; writing—original draft preparation, ALL; writing—review and editing, ALL; visualization, ALL; supervision, A.C and A.L..; project administration, A.C. and A.L.; funding acquisition, A.C. and A.L. All authors have read and agreed to the published version of the manuscript.
Funding
This research has received funding from the European Innovation Council and SMEs Executive Agency (EISMEA) under grant agreement No. 964388 and from the Impact Innovation programme SustainGov of the Swedish Innovation Agency Vinnova under grant No. 2023-03607.
Informed Consent Statement
Informed consent was obtained from all subjects involved in the study.
Data Availability Statement
The original data presented in the study are openly available through Zenodo with DOI 10.5281/zenodo.17639087.
Conflicts of Interest
The authors declare no conflicts of interest.
Abbreviations
The following abbreviations are used in this manuscript:
| AI | Artificial Intelligence |
| LLMs | Large Language Models |
| RAG | Retrieval Augmented Generation |
| TRLs | Technology Readiness Levels |
Appendix A

Table A1.
Description and main activities of TRLs (adapted from NASA1 and EU2).
| TRL Level | Objective | Description | Main Activities |
|---|---|---|---|
| TRL 1 | Basic observations and reports | Scientific research begins and results are translated into future R&D. | Scientific reviews |
| TRL 2 | Technology concept | Basic principles have been studied, and practical applications are considered. | Generation of ideas, hypotheses, candidate parameters, and initial testing |
| TRL 3 | Experimental functions in proof-of-concept | Active research and design begin, including construction of proof-of-concept models. | Hypothesis testing |
| TRL 4 | In-laboratory validation (components) | Proof-of-concept technology is ready; multiple components tested together. | Proof-of-concept demonstration |
| TRL 5 | On-field validation (components) | Breadboard technology tested in near-real environments. | Pilot deployment |
| TRL 6 | On-field validation (prototype) | Fully functional prototype developed and tested. | Prototype testing (e.g., safety) |
| TRL 7 | On-field demonstration (working model) | Prototype demonstrated in real environment. | Prototype testing (e.g., efficacy) |
| TRL 8 | On-field testing (working model) | Technology tested and qualified for implementation. | Patenting, registration |
| TRL 9 | Deployment and industrialisation (product) | Technology approved (regulatory compliant). | Legal compliance for market distribution |
Table A2.
Common Assessment Methods in TRLs.
| TRL | Common Assessment Methods | Example Metrics |
|---|---|---|
| TRL 1 | Literature review, expert interviews | Number of supporting publications, novelty score |
| TRL 2 | Feasibility studies, concept design documents | Completeness of design spec, clarity of use case |
| TRL 3 | Lab experiments, bench tests | Prototype functionality %, performance vs. spec |
| TRL 4 | Controlled environment trials | Reliability %, reproducibility rate |
| TRL 5 | Simulated real-world tests, stakeholder observation | Performance stability, stakeholder satisfaction score |
| TRL 6 | Pilot projects, field trials | Operational uptime %, defect rate, feedback loops implemented |
| TRL 7 | Full-scale trial in operational setting | System interoperability score, safety incidents logged |
| TRL 8 | Certification tests, QA audits | Compliance % to standards, mean time between failures |
| TRL 9 | Post-deployment monitoring | ROI, adoption rate, market penetration % |
Table A3.
Extension of evaluations for technological readiness (adapted from: [14]).
Table A3.
Extension of evaluations for technological readiness (adapted from: [14]).
| Dimension | Purpose |
|---|---|
| TRL (Technology) | Tracks the technical maturity of the solution (as already established) |
| SRL (Societal) | Measures societal awareness, acceptance, and adoption of the solution |
| ORL (Organizational) | Measures the public administration’s ability to integrate and sustain the solution |
| LRL (Legal) | Measures the solution’s compliance with existing laws and regulatory alignment |
| 1 | A problem that in the private sector is mitigated by stock-option incentives, while might suffer from limited applicability to the public sector, and that may, as Mazzucato notes, be abused by top management to extract value rather than create it. |
References
- De Weerd-Nederhof, P. Innovation Management, Strategy and Implementation Using the Pentathlon Framework. R&D Management 2007, 37, 90–92. [Google Scholar] [CrossRef]
- Burroughs Wellcome Fund.; Howard Hughes Medical Institute. Making the Right Moves. https://www.hhmi.org/science-education/programs/resources/making-right-moves, 2006. Accessed: 2022-08-21.
- de Vaan, M. Etymological Dictionary of Latin: and the other Italic Languages; Brill: Leiden, The Netherlands, 2008.
- Mallory, J.P.; Adams, D.Q. The Oxford Introduction to Proto-Indo-European and the Proto-Indo-European World; Oxford University Press, 1997. [CrossRef]
- Cicero, M.T. De Inventione; Number 386 in Loeb Classical Library, Harvard University Press: Cambridge, MA, 1949. Original Latin text, written ca. 55 BCE.
- Wiener, N. Cybernetics or Control and Communication in the Animal and the Machine; The MIT Press, 2019; [https://direct.mit.edu/book-pdf/2254528/book_ 9780262355902.pdf]. [CrossRef]
- von Foerster, H. Understanding Understanding: Essays on Cybernetics and Cognition; Springer: New York, 2003.
- Schumpeter, J.A. The Theory of Economic Development: An Inquiry into Profits, Capital, Credit, Interest, and the Business Cycle; Harvard University Press: Cambridge, MA, 1934. First English edition translated from the 1911 German original Theorie der wirtschaftlichen Entwicklung.
- Yolles, M.; Chiolerio, A. Quantum-Informed Cybernetics for Collective Intelligence in IoT Systems. Preprints 2025. [Google Scholar] [CrossRef]
- Mazzucato, M. Mission-oriented innovation policies: challenges and opportunities. Industrial and Corporate Change 2018, 27, 803–815. [Google Scholar] [CrossRef]
- Johnston, L.; Fenwick, J. New development: Public service innovation. Public Money & Management 2025, 45, 151–156. [Google Scholar]
- Mazzucato, M. From Market Fixing to Market Creating: A New Framework for Innovation Policy*. In Innovation Systems, Policy and Management; Niosi, J., Ed.; Cambridge University Press: Cambridge, 2018; pp. 79–103. Niosi, J. (Ed.). [CrossRef]
- Meyer, M. Tracing knowledge flows in innovation systems. Scientometrics 2002, 54, 193–212. [Google Scholar] [CrossRef]
- Bruno, I.; Lobo, G.; Covino, B.V.; Donarelli, A.; Marchetti, V.; Panni, A.S.; Molinari, F. Technology readiness revisited: a proposal for extending the scope of impact assessment of European public services. In Proceedings of the Proceedings of the 13th International Conference on Theory and Practice of Electronic Governance, Athens Greece, sep 2020; pp. 369–380. [CrossRef]
- Townsend, W.R. Innovation and the value of failure. International journal of management and marketing research 2010, 3, 75–84. [Google Scholar]
- Hartmann-Sonntag, I.; Scharnhorst, A.; Ebeling, W. Modelling selforganization and innovation processes in networks. arXiv preprint cond-mat/0406425 2004. [Google Scholar] [CrossRef]
- Bider, I.; Perjons, E.; Elias, M.; Johannesson, P. A fractal enterprise model and its application for business development. Software and Systems Modeling 2017, 16, 663–689. [Google Scholar] [CrossRef]
- Hensen, J.L.; Loonen, R.; Archontiki, M.; Kanellis, M. Using Building Simulation for Moving Innovations across the ‘Valley of Death.’. REHVA Journal 2015, 52, 58–62. [Google Scholar]
- Sachs, J.D.; Schmidt-Traub, G.; Mazzucato, M.; Messner, D.; Nakicenovic, N.; Rockström, J. Six Transformations to achieve the Sustainable Development Goals. Nature Sustainability 2019, 2, 805–814. Publisher: Nature Publishing Group. [CrossRef]
- Assom, L.; Codello, A. Multi-partite graph database. US-20150169758-A1, 2013.
- Robinson, D.K.R.; Huang, L.; Guo, Y.; Porter, A.L. Forecasting Innovation Pathways (FIP) for new and emerging science and technologies. Technological Forecasting and Social Change 2013, 80, 267–285. [Google Scholar] [CrossRef]
- Robinson, D.K.; Huang, L.; Guo, Y.; Porter, A.L. Forecasting Innovation Pathways (FIP) for new and emerging science and technologies. Technological Forecasting and Social Change 2013, 80, 267–285. [Google Scholar] [CrossRef]
- Shi, Y.; Yang, A.J.; Deng, S. Entropy in Science of Science. arXiv 2025, arXiv:2503.20543. [Google Scholar] [CrossRef]
- Haar, P.t. Measuring innovation: A state of the science review of existing approaches. Intangible Capital 2018, 14, 409–428. [Google Scholar] [CrossRef]
- Alkan, A.K.; Sourav, S.; Jablonska, M.; Astarita, S.; Chakrabarty, R.; Garuda, N.; Khetarpal, P.; Pióro, M.; Tanoglidis, D.; Iyer, K.G.; et al. A Survey on Hypothesis Generation for Scientific Discovery in the Era of Large Language Models. arXiv 2025, arXiv:2504.05496. [Google Scholar] [CrossRef]
- Hülsheger, U.; Anderson, N.; Salgado, J. Team-level predictors of innovation at work: a comprehensive meta-analysis spanning three decades of research. Journal of Applied Psychology 2009, 94, 1128–1145. [Google Scholar] [CrossRef] [PubMed]
- Stieler, M.; Henike, T. Innovation nudging—A novel approach to foster innovation engagement in an incumbent company. Creativity and Innovation Management 2022, 31, 35–48. [Google Scholar] [CrossRef]
- Banua, G.S. Measuring innovation using key performance indicators. In Proceedings of the Procedia Manufacturing, 2017. 11th International Conference Interdisciplinarity in Engineering, INTER-ENG 2017, 5-6 October 2017, Tirgu Mures, Romania.
- Al-Baik, O.; Miller, J. The kanban approach, between agility and leanness: a systematic review. Empirical Software Engineering 2015, 20, 1861–1897. [Google Scholar] [CrossRef]
- Barjolle, D.; Midmore, P.; Schmid, O. Tracing the Pathways from Research to Innovation: Evidence from Case Studies. EuroChoices 2018, 17, 11–18. [Google Scholar] [CrossRef]
- Katz, J.S. What is a complex innovation system? PloS one 2016, 11, e0156150. [Google Scholar] [CrossRef]
- Chiolerio, A. Liquid Cybernetic Systems: The Fourth-Order Cybernetics. Advanced Intelligent Systems 2020, 2, 2000120. [Google Scholar] [CrossRef]
- Hausmann, R.; Yildirim, M.A.; Chacua, C.; Hartog, M.; Matha, S.G. Innovation policies under economic complexity. World Intellectual Property Organization (WIPO) Economic Research Working Paper Series 2024.
- Trappey, A.J.; Liang, C.P.; Lin, H.J. Using machine learning language models to generate innovation knowledge graphs for patent mining. Applied Sciences 2022, 12, 9818. [Google Scholar] [CrossRef]
- Aletti, G.; Crimaldi, I.; Ghiglietti, A.; Nutarelli, F. Modeling Innovation Ecosystem Dynamics through Interacting Reinforced Bernoulli Processes. arXiv 2025, arXiv:2505.13364. [Google Scholar] [CrossRef]
- Gao, X.; Zhang, Z.; Xie, M.; Liu, T.; Fu, Y. Graph of AI Ideas: Leveraging Knowledge Graphs and LLMs for AI Research Idea Generation. CoRR 2025.
- Dong, X.L. Generations of knowledge graphs: The crazy ideas and the business impact. arXiv 2023, arXiv:2308.14217. [Google Scholar] [CrossRef]
- Maria, A.; Puente, D.; María, J.; Young, S. D5.1 Report on the State of the Art of innovation impact assessment.
- Eisenhardt, K.M.; Graebner, M.E. Theory building from cases: Opportunities and challenges. Academy of management journal 2007, 50, 25–32. [Google Scholar] [CrossRef]
- Gregor, S.; Hevner, A.R. Positioning and presenting design science research for maximum impact. MIS quarterly 2013, 337–355. [Google Scholar] [CrossRef]
- COgITOR Project Consortium. COgITOR Project: Cybernetic Organic Intelligent Technologies for Open Regeneration. https://www.cogitor-project.eu, 2025. Accessed: 28 October 2025.
- Zhou, X.; Huang, L.; Porter, A.; Vicente-Gomila, J.M. Tracing the system transformations and innovation pathways of an emerging technology: Solid lipid nanoparticles. Technological Forecasting and Social Change 2019, 146, 785–794. [Google Scholar] [CrossRef]
- Kader, G.D.; Perry, M. Variability for categorical variables. Journal of statistics education 2007, 15. [Google Scholar] [CrossRef]
Figure 1.
Mapping scientific and intellectual property landscapes. (a) Example of industrial dependencies of biosensor research, reproduced from: [22] (b) Example of query of similar patents, in a multipartite graph (the code represents the patent entities, the thickness of the link represents the similarity between entities as function of a chosen set of parameters, reproduced from: [20]
Figure 5.
Innovation network concurrently recording contributions on a blockchain ledger. An innovation step is represented by resources required in Inputs, Processes, and Resources produced as outputs; each user can add new innovation steps and encode how previous resources are utilized.
Figure 5.
Innovation network concurrently recording contributions on a blockchain ledger. An innovation step is represented by resources required in Inputs, Processes, and Resources produced as outputs; each user can add new innovation steps and encode how previous resources are utilized.
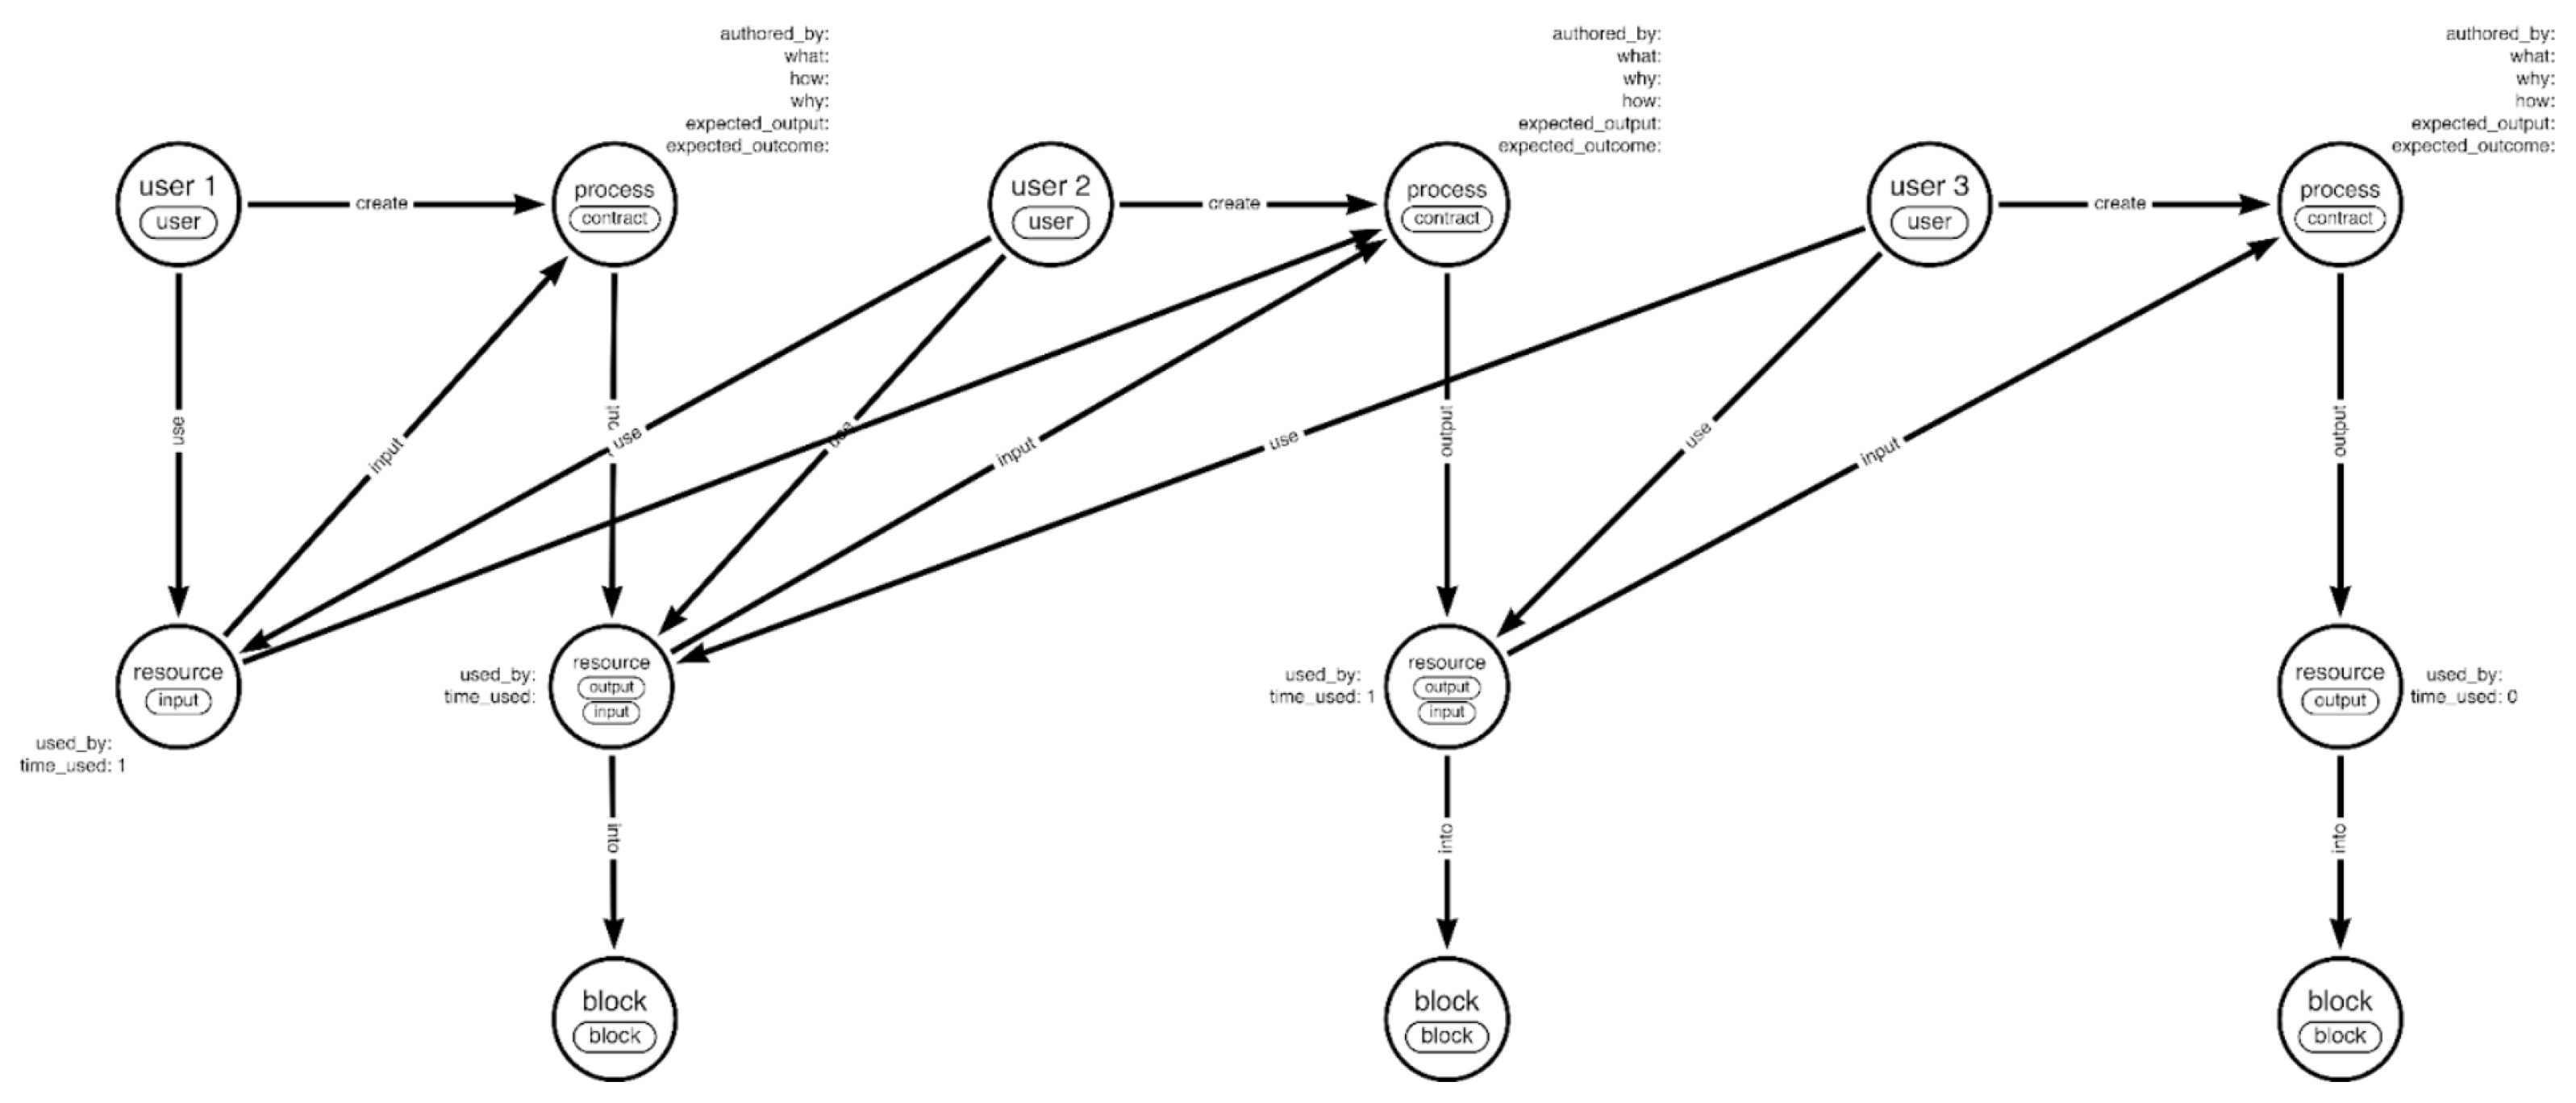
Figure 9.
Fisher-Shannon innovation plane. Two innovation paths have been depicted, one corresponding to an exploratory process (blue line) that reduces the order and generates diversity, and to an adaptive trajectory that moves around the current attractor (bottom left white marker) and explores the higher diversity (green line). Occasionally, innovation jumps to another attractor (top right white marker) through a sudden process (black line) that leads to an invention maximising the innovation functional (yellow area).
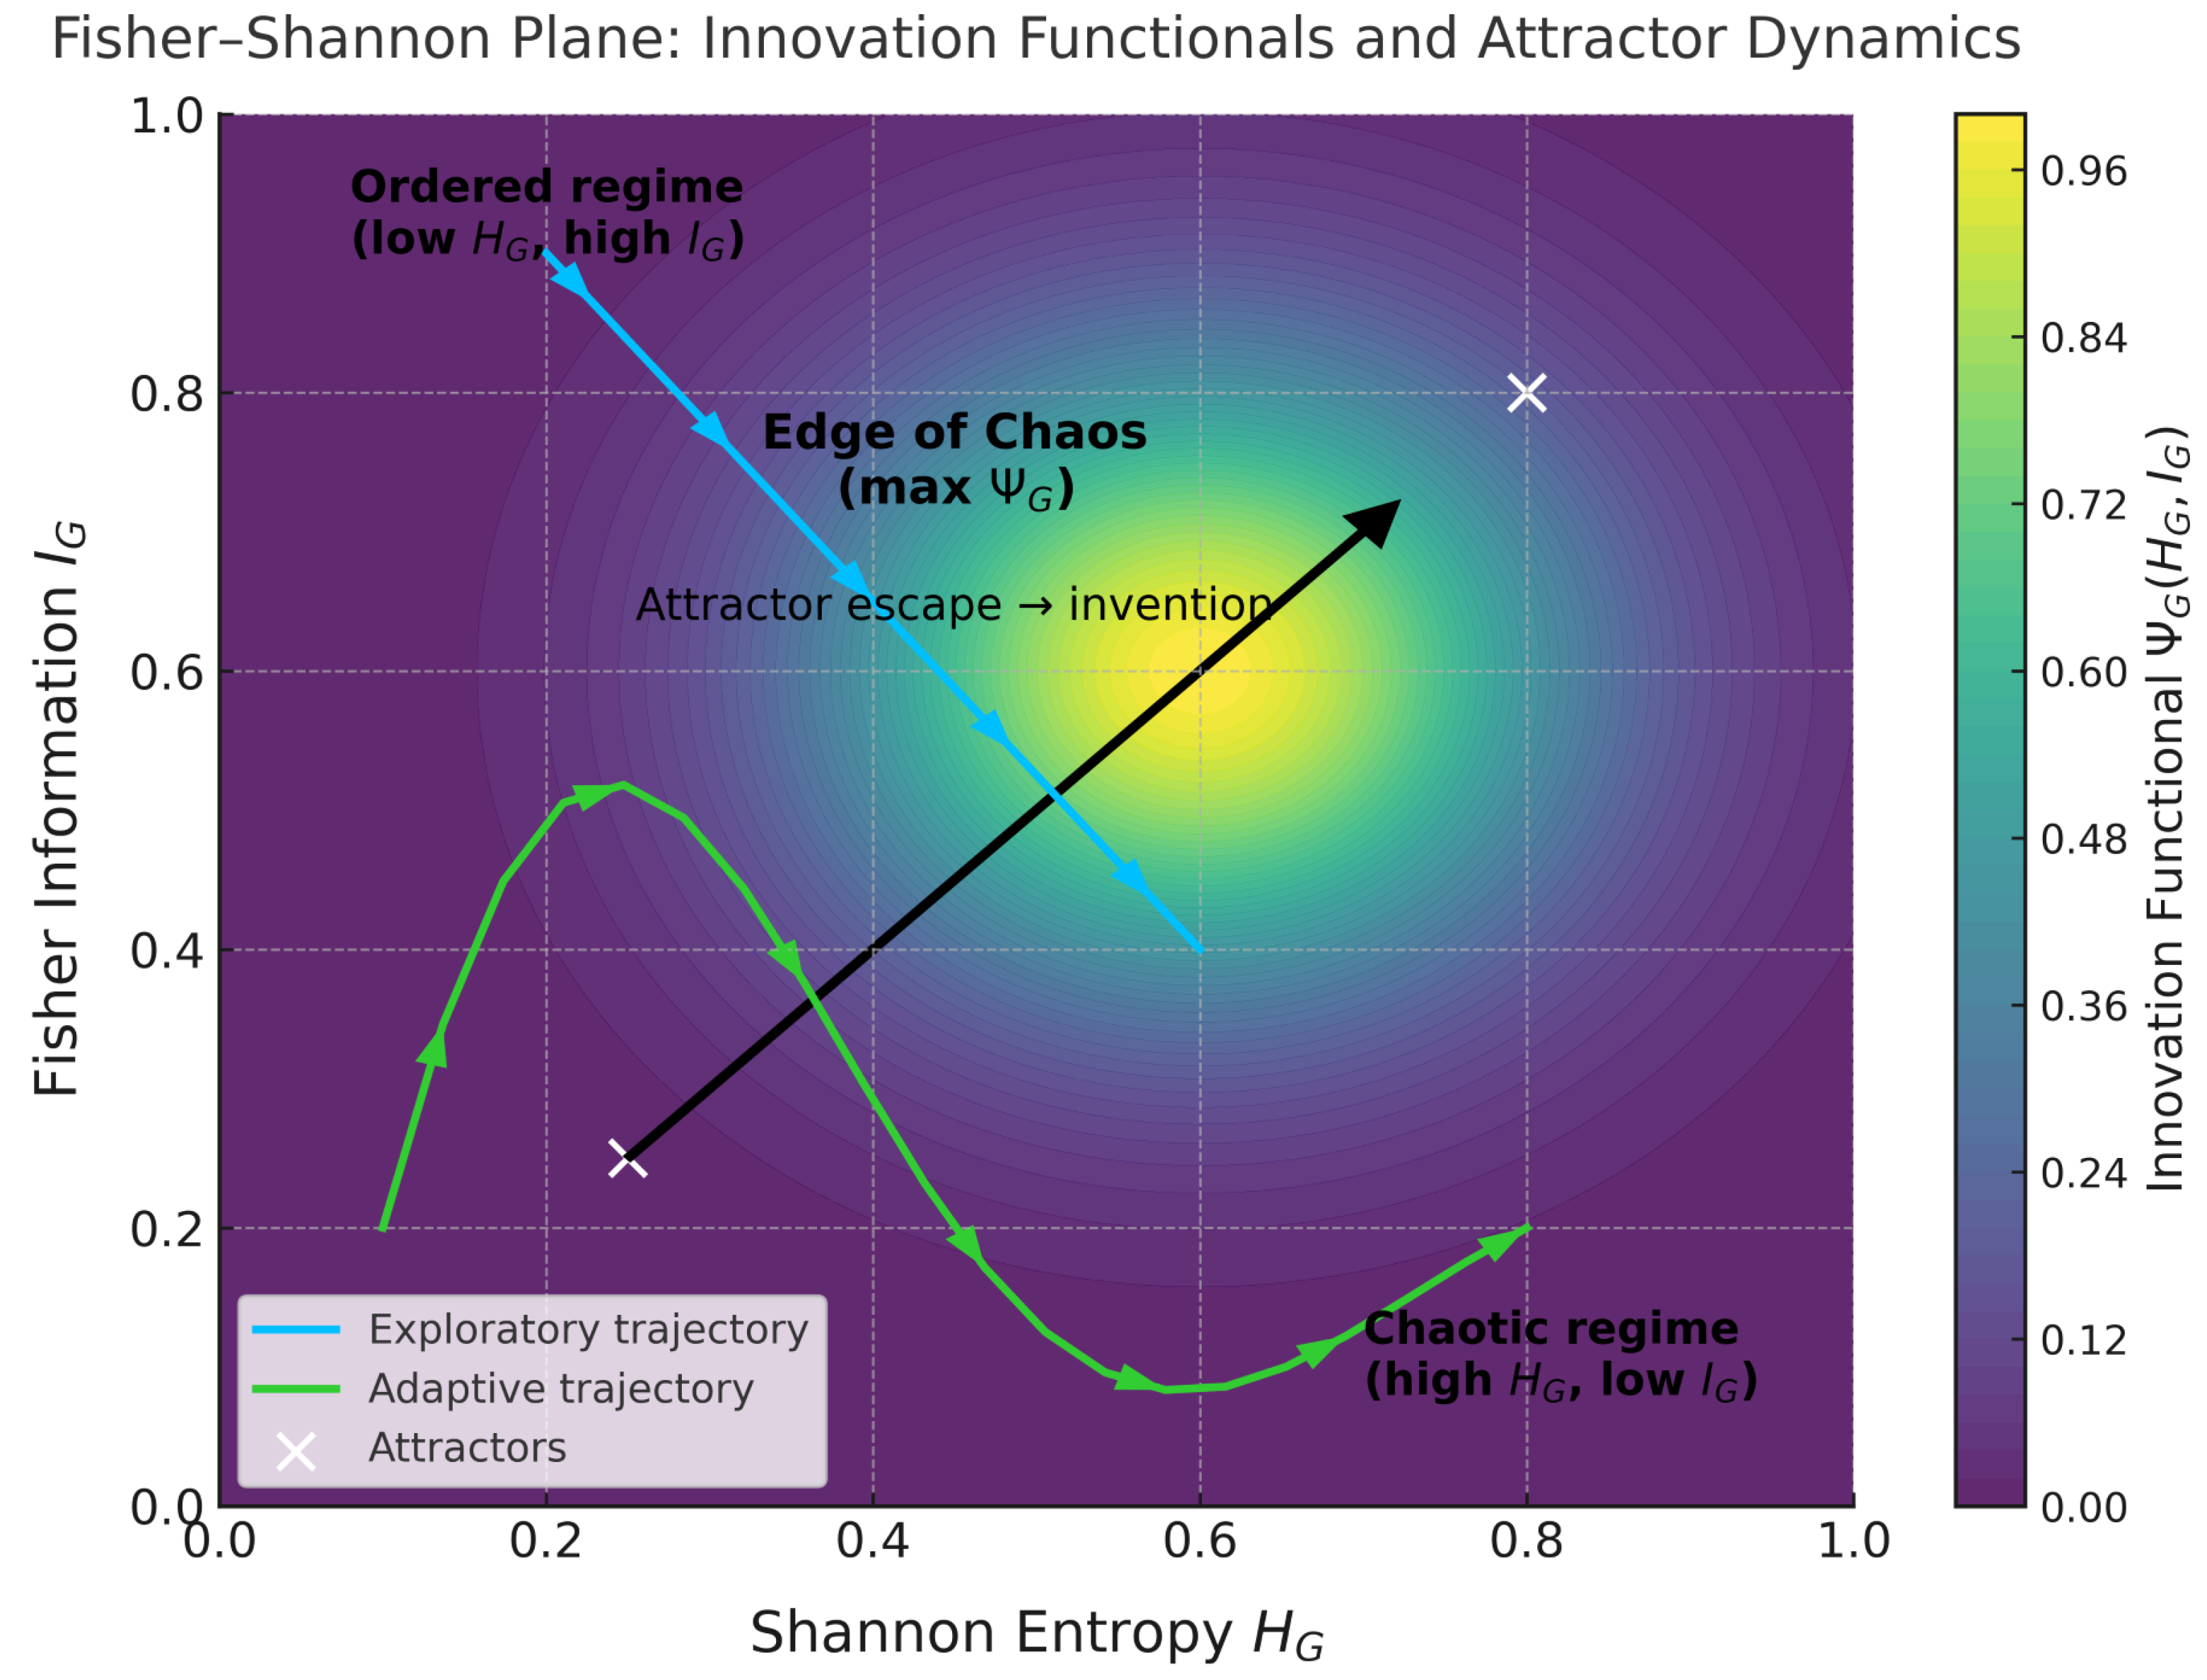
Table 1.
Fisher–Shannon plane describing the information state of the network. See further Figure 9.
Table 1.
Fisher–Shannon plane describing the information state of the network. See further Figure 9.
| Phase | Interpretation | ||
|---|---|---|---|
| Invention | System explores new configurations: variety increases, structure decreases. | ||
| Innovation | System consolidates coherent local patterns within a rich global state. | ||
| Stagnation | The network evolves to informational homeostasis. |
Table 2.
Conceptual translations of physics terms for innovation studies.
| Physics Term | Interpretation for Innovation Studies |
|---|---|
| (Shannon entropy) | Global diversity of information distributed across nodes. Describe the variety of ideas. |
| (Fisher information) | Local coherence. Structural coherence of collaboration or specialization in a field. |
| (innovation functional) | Balanced innovation objective: Trade-off between exploration of novel ideas and consolidation of existing ones. |
Disclaimer/Publisher’s Note: The statements, opinions and data contained in all publications are solely those of the individual author(s) and contributor(s) and not of MDPI and/or the editor(s). MDPI and/or the editor(s) disclaim responsibility for any injury to people or property resulting from any ideas, methods, instructions or products referred to in the content. |
© 2025 by the authors. Licensee MDPI, Basel, Switzerland. This article is an open access article distributed under the terms and conditions of the Creative Commons Attribution (CC BY) license (http://creativecommons.org/licenses/by/4.0/).
Copyright: This open access article is published under a Creative Commons CC BY 4.0 license, which permit the free download, distribution, and reuse, provided that the author and preprint are cited in any reuse.


