
Submitted:
26 December 2025
Posted:
29 December 2025
You are already at the latest version
Abstract
Due to the allergenicity of soy protein, this study aimed to develop a hypoallergenic, dysphagia-friendly matrix using pea protein. We investigated the effects of three hydrocolloid thickeners—xanthan gum (XG), guar gum (G), and carrageenan (C) at various concentrations on the beverage's rheological properties, textural characteristics, and dysphagia diet classification. The unthickened pea protein base was unstable, exhibiting rapid phase separation and low viscosity, unsuitable for dysphagia diets. The addition of XG (0.4-0.6 g), G (0.5-1.0 g), and C (0.8-1.2 g) successfully produced matrices meeting the slightly, mildly, and moderately thick levels of the Japanese Society of Dysphagia Rehabilitation (JSDR) framework. However, discrepancies were noted between instrumental viscosity and syringe flow test classifications. Rheological analysis revealed that XG samples were predominantly elastic (G' > G") in the linear visco-elastic region (LVR) and exhibited shear-thinning behavior. In contrast, G and C samples were predominantly viscous (G" > G'). Frequency sweeps characterized XG samples as weak gels, G samples as dilute polymer solutions, and C samples as gel-like structures. Texture profile analysis further showed that xanthan gum imparted the highest firmness and thickness, whereas guar gum provided the best flowability.
Keywords:
dysphagia
; xanthan gum
; guar gum
; carrageenan
; rheological properties
; texture analysis
1. Introduction
Advances in medical technology have extended human lifespan. However, the elderly face a higher risk of various illnesses due to age-related factors, such as immune senescence and the increased prevalence of chronic diseases [1]. Nutritional intake plays a significant role in these health issues. A common condition among this group is oropharyngeal dysphagia, which involves difficulty or pain with swallowing foods and liquids, often caused by physiological impairments such as esophageal strictures or neuromuscular problems [2]. This can result in inadequate nutrient intake, further raising the risk of disease. Age-related degeneration of laryngeal and esophageal muscle tissue makes the elderly particularly vulnerable to swallowing difficulties [3]. As a result, employing food thickeners to produce textures suitable for individuals with dysphagia is widely regarded as an effective way to tackle this problem [4].
Rheology provides parameters for evaluating and understanding the characteristics of dysphagia-friendly foods, thereby improving their palatability and safety [6]. It is used to measure and analyze parameters such as the viscosity, viscoelasticity, and other fluid properties of these foods. These properties are critical to the behavior of food in the oral cavity and pharynx during swallowing. Thickeners alter the flow properties of foods and liquids, making them easier for individuals with dysphagia to swallow safely. In the diets of the elderly, thickeners are widely used to modify food texture and prevent dysphagia-related problems, including improper swallowing of foods and liquids [7]. According to previous research, samples thickened with xanthan gum (XG) exhibit weak-gel-like behavior [8], samples thickened with guar gum (G) behave as dilute polymer solutions [9], and those thickened with carrageenan (C) demonstrate gel-like behavior [10,11].
Dysphagia can negatively impact an individual’s health and quality of life. In severe cases, individuals with dysphagia are unable to eat normally, leading to issues such as weight loss, malnutrition, respiratory tract obstruction, and pneumonia. Malnutrition is often accompanied by insufficient protein intake [12]. Protein is one of the essential nutrients required by the human body; proteins are the fundamental components of tissues and cells and are involved in numerous metabolic and physiological processes. Moreover, in specific populations, certain proteins can trigger allergic reactions. A protein allergy is an immune system response in which the body identifies specific proteins as foreign invaders and mounts an immune reaction, which can lead to various symptoms, including itchy skin, redness, swelling, diarrhea, vomiting, shortness of breath, and hypotension [13]. These symptoms can make it difficult for these populations to meet their daily protein requirements, thus necessitating the search for alternative protein sources. Pea protein isolate (PP), an extract made from peas, is a complete protein rich in essential amino acids. Furthermore, pea protein is free of gluten, lactose, cholesterol, and common food allergens, making it highly suitable for vegetarians, individuals with lactose intolerance, and those with protein allergies [14].
While previous research has established the distinct thickening behaviors of xanthan, guar, and carrageenan gums in various solutions, there is a notable gap in the literature concerning their application within plant-based protein systems. Specifically, studies focusing on a Pea Protein Isolate (PPI) base are particularly scarce. To address this research gap, the present study aims to develop novel, hypoallergenic protein matrices suitable for individuals with dysphagia. The primary objectives are to prepare formulations using varying ratios of these three common hydrocolloids with pea protein and to subsequently analyze the resulting rheological behavior and textural properties. A crucial aspect of this work will be to investigate the correlation between these physicochemical characteristics and the established levels of the International Dysphagia Diet Standardisation Initiative (IDDSI) framework, providing critical data for the development of safe and effective nutritional products.
2. Materials and Methods
2.1. Preparations of the Sample Matrix
Three low-allergenic pea protein formulations were utilized to achieve the thin (JSDR 1), medium (JSDR 2), and thick (JSDR 3) consistency levels as defined by the Japanese Society of Dysphagia Rehabilitation [15]. Each formulation was based on 15 g of pea protein isolate mixed with specific amounts of xanthan gum (XG), guar gum (G), and carrageenan (C). The JSDR 1 formulation contained 0.4 g of XG, 0.5 g of G, and 0.8 g of C; the JSDR 2 formulation contained 0.5 g of XG, 0.8 g of G, and 1.0 g of C; and the JSDR 3 formulation contained 0.6 g of XG, 1.0 g of G, and 1.2 g of C. For each preparation, the dry powder mixture was incorporated with reverse osmosis water to a final weight of 200 g. Then it was homogenized at 6000 rpm for 3 minutes at room temperature (T 25 digital, IKA-Werke GmbH & Co. KG, Staufen, Germany).
2.2. Sedimentation Index (SI)
The sedimentation index (SI) was assessed using a modified protocol based on the report by Yang et al. [16]. Briefly, place each sample into a 50 mL centrifuge tube and maintain it at room temperature without disturbance. The sedimentation index test was performed every 5 minutes to assess the progression of sedimentation over time. The SI was calculated according to Equation 1:
SI (%)=(Vsediment / Vtotal) ×100
Where Vsediment represents the volume of the sediment layer, and Vtotal is the initial total volume of the sample.
2.3. Dysphagia-Friendly Evaluations
2.3.1. Rheological Measurement
Rheological properties were analyzed with a TA Instruments DHR-2 stress-controlled rheometer (double-gap cylinder geometry) at 25 °C. A strain sweep (0.01–100% strain at 1 Hz) identified the linear viscoelastic region, after which a frequency sweep (0.1–100 Hz at 1% strain) measured the storage (G’) and loss (G”) moduli. Steady-state viscosity was determined by applying a constant shear rate of 50 s−1 [17] , with average values used for sample classification in accordance with JSDR standards.
2.3.2. Empirical Syringe Flow Test
Each sample’s flow properties were evaluated with the syringe flow test according to the guidelines set out by the JSDR [15]. For this procedure, a 10 mL Luer-slip tip syringe with the plunger removed served as the apparatus. To fill the syringe to the 10 mL mark, the outlet was initially blocked. After filling, the outlet was opened to allow the sample to flow downward by gravity for precisely 10 seconds. After this step, the outlet was blocked again, and the volume of sample remaining in the syringe (in milliliters) was determined. This measurement helped determine the sample’s consistency based on standards set by both the JSDR and the International Dysphagia Diet Standardisation Initiative (IDDSI) framework [18].
2.4. Texture Profile Analysis (TPA)
A TA.XTplus texture analyzer (Stable Micro Systems, Godalming, Surrey, UK) was used to evaluate the texture of the samples, following a modified method inspired by [19]. A 40 mm diameter disc probe was used to perform a back extrusion test (A/BE). Exponent Lite software was used to collect and analyze data, assessing seven textural properties: liquidity, firmness, uniformity, consistency, cohesiveness, viscosity index, and subsidiary. The detailed instrumental parameters used appear in Table 1.
2.5. Statistical Analysis
Experiments were repeated three times, and results are presented as the mean ± SD. Data were analyzed using SPSS 19.0; one-way ANOVA was used to evaluate group differences, and Duncan’s test was employed for post hoc comparisons (p < 0.05). Sigmaplot® (SYSTAT Software, Inc., Palo Alto, CA) was employed to present the figure results.
3. Results and Discussion
3.1. Incorporation of Thickeners in Low-Allergenic Pea Protein Isolate (PP) Matrix
3.1.1. Sedimentation Index of Matrices Without Thickening
Before adding thickening agents, it was necessary to assess the baseline physical stability of the standalone low-allergenic pea protein isolate (PP) matrix. The native pea protein matrix showed poor stability, with quick and noticeable sedimentation. As shown in Table 2, phase separation into a clear liquid supernatant and a protein-rich sediment occurred within the first 5 minutes. Sedimentation was complete within 30 minutes, and the sediment volume remained stable thereafter. This behavior is typical of plant-based protein dispersions, which often have limited solubility and poor suspension stability in water [20]. For people with dysphagia, who usually take longer to eat, this phase separation is a safety issue, as the inconsistent textures of the separated layers could raise the risk of choking or aspiration.
3.1.2. Sedimentation Stability of Thickened Low-Allergenic PP Matrices
Thickening with various gums at different concentrations (Table 2) effectively stabilized the low-allergenic pea protein isolate (PP) matrices designed for individuals with dysphagia; these results are consistent with the IDDSI syringe test presented in Table 3. Phase separation was absent in all samples within the first thirty minutes after thickening, which is essential for ensuring safe consumption by patients with swallowing difficulties. However, the thickened, low-allergenic PP matrices remained homogeneous throughout the 24 hours (Table 4), demonstrating that our sample gums improve and maintain product stability. This consistent level of stability is crucial for dysphagia management, as phase separation—where liquid separates from the solid or thickener—raises the risk of aspiration (food or liquid entering the airway) during swallowing. Incorporating gum (thickener) ensures a uniform, safer texture for consumption.
3.2. JSDR and IDDSI Categorizations
According to literature, the human swallowing rate is approximately 50 s−1 [20]. As a result, food for various degrees of dysphagia is commonly classified based on its viscosity measured at this specific shear rate.
The JSDR measurement method is the same as the one described previously and is divided into thin consistency (50-150 cP), medium consistency (150-300 cP), and thick consistency (300-500 cP). From Table 4, it can be observed that different gums require different amounts to achieve the different viscosity levels of the JSDR classification. The usage amounts are in the order: Carrageenan > Guar Gum > Xanthan Gum. The data in the table indicates that minimal quantities of xanthan gum are sufficient to attain varying degrees of dysphagia suitability in beverages, which aligns with findings reported in prior studies [20,21]. The current cost per kilogram for the three thickening gums is: Xanthan Gum: 700 NTD, Guar Gum: 180 NTD, Carrageenan: 1200 NTD. Therefore, in product development, cost is also a consideration, alongside product characteristics.
The JSDR association added the syringe measurement method reported by Kayashita et al. [15]. This approach does not require advanced equipment, allowing medical staff, food preparers, and caregivers to classify thickened liquids by measuring the residual volume after a set time through a syringe. The classifications include thin consistency (2.2-7.0 ml), medium consistency (7.0-9.5 ml), and thick consistency (9.5-10.0 ml), enabling quick classification.
From Table 5, we observed that the classification of samples using the syringe measurement method slightly differs from that of the viscosity measurement method. Samples with the highest concentrations of Xanthan Gum, Guar Gum, and Carrageenan are considered thick because their viscosity measurements classify them as such. However, when using the syringe measurement method, the highest-concentration samples of these thickening gums are classified as medium consistency. Therefore, under the same standard system, different measurement methods can yield different results: XG0.6, G1.0, and C1.2 classified as category 2 in the syringe test instead of category 3 in the viscosity measurements. However, the matrices can still be safe to swallow. We recommend that the formula designers adjust the thickener concentrations to avoid such minor discrepancies.
The IDDSI thickened liquid classification is as follows: Level 0 Thin (0.0-1.0 ml), Level 1 Slightly Thick (1.0-4.0 ml), Level 2 Mildly Thick (4.0-8.0 ml), Level 3 Moderately Thick (8.0-10.0 ml), and Level 4 Extremely Thick (10 ml, does not flow out of the syringe at all). This is different from the JSDR classification of thin consistency (2.2-7.0 ml), medium consistency (7.0-9.5 ml), and thick consistency (9.5-10.0 ml). The corresponding IDDSI Level 1 Slightly Thick (1.0-4.0 ml) and Level 2 Mildly Thick (4.0-8.0 ml) are similar to the JSDR’s thin consistency (2.2-7.0 ml). However, IDDSI Level 3 Moderately Thick (8.0-10.0 ml) almost completely covers the JSDR’s medium consistency (7.0-9.5 ml) and thick consistency (9.5-10.0 ml). This results in different classifications in Table 6: only XG 0.4 in the xanthan gum group, and G0.8 and C1.0 have different classifications.
3.3. Rheological Measurement
3.3.1. XG-Thickened PP Matrices
The strain-sweep results for thickened PP matrices with different xanthan gum (XG) concentrations are shown in Figure 1 (a). At all three concentrations, the linear viscoelastic region (LVER) of the XG-thickened pea protein beverages exhibited G’ > G’’, indicating that the systems were in the elastic domain. As the strain increased, the sample’s behavior transitioned from G” > G’ to G’>G”, becoming a viscous domain and exhibiting shear-thinning behavior.
A “weak-strain overshoot” phenomenon was observed at higher strain values. This is attributed to the polymer chain structure resisting deformation under increasing strain, which leads to an increase in G”. As the sample experiences increased deformation, the polymer chains straighten and orient along the flow direction, which causes G” to decrease [22]. As the xanthan gum concentration in the sample increased, the weak-strain overshoot became more pronounced, which is consistent with previous research (Yang et al., 2021).
Figure 1 (a) displays the frequency sweep data for the PP matrices thickened with XG. For the XG 0.4 (JSDR1) group, the sample transitioned from critical gel characteristics to gel-like characteristics. However, at high frequencies, a crossover (G” > G’) occurred, where viscous properties exceeded elastic properties, demonstrating liquid-like behavior. This is consistent with previous findings [8] and is a characteristic often observed in low-concentration xanthan gum samples. With increasing xanthan gum concentration, the XG 0.5 and XG 0.6 groups showed G’ > G” with both G’ and G” increasing with frequency, indicating weak-gel-like behavior.
3.3.2. G-Thickened PP Matrices
The strain-sweep results for pea protein matrices with different guar gum concentrations (G-thickened PP matrices) are shown in Figure 2(b). At all three concentrations, the linear viscoelastic region of the G-thickened PP matrices showed G” > G’, indicating that the systems were in the viscous domain. As both strain and guar gum concentration increased, the samples remained in the same viscous domain, consistent with previous findings [23].
The frequency sweep results for the G-thickened PP matrices are shown in Figure 2 (b). As the scanning frequency increased, the viscous modulus remained greater than the elastic modulus (G” > G’), indicating that the emulsion solution was in a state of good fluidity, consistent with diluted polymer solutions. Guar gum (G) acts as a macromolecular biopolymer in aqueous solutions, and its frequency sweep results typically show the loss modulus (G”) being higher than the storage modulus (G’) [9].
3.3.3. C-Thickened PP Matrices
The strain-sweep results for pea protein beverages with different carrageenan concentrations are shown in Figure 1(c). At all three concentrations, the linear viscoelastic region of the carrageenan-thickened pea protein beverages showed G”> G’, indicating that the systems were viscous-oriented. However, as the carrageenan concentration increased, the gap between G’ and G” gradually narrowed, and in the C 1.2 (JSDR3) group, G’ and G” are similar.
Figure 2 (c) displays the frequency-sweep results for pea protein beverages thickened with carrageenan. For all groups, G’> G” at the initial (low) frequencies, but as the scanning frequency increased, a crossover occurred where the viscous modulus became greater than the elastic modulus (G”> G’). This demonstrates gel-like behavior and is consistent with previous research (10,11).
3.4. Texture Analysis
3.4.1. Liquidity
Liquidity is defined as the gradient from zero to the yield point; a smaller value indicates better sample liquidity. As shown in Table 7, the liquidity values for the XG group were 6.24 g/sec, 6.60 g/sec, and 7.05 g/sec, respectively. As the hydrocolloid concentration increased, the sample’s liquidity decreased. In the G group, a significant difference was observed between the JSDR 2 sample and the low- and high-concentration groups, with the medium-concentration sample exhibiting better liquidity than the other two. In the C group, increasing hydrocolloid concentration had no significant effect on sample liquidity; JSDR 1: G> XG > C, JSDR 2: G> XG = C, JSDR 3: Liquidity (best to worst): G > XG = C. (best to poorest).
3.4.2. Firmness
Firmness is the maximum positive peak force on the curve, representing the sample’s firmness. As shown in Table 7, in the XG, G, and C groups, sample firmness increased with gum concentration, and there were significant differences among the concentration groups (p < 0.05). In the JSDR 1 group, the firmness from largest to smallest was XG > G = C. In the JSDR 2 group, it was XG > G = C. In the JSDR 3 group, it was XG = G > C.
The above results are consistent with previous literature, which shows that samples prepared with xanthan gum have higher firmness than those without xanthan gum [24].
3.4.3. Uniformity
Homogeneity is the linear distance from the yield point to the maximum positive peak force, representing the smoothness of the sample. A smaller value indicates better internal homogeneity of the sample.
As shown in Table 7, there were no significant differences in homogeneity across all groups, indicating that the gum was evenly distributed in the samples during preparation and that the samples’ internal homogeneity was good.
3.4.4. Consistency
Consistency is the positive peak area on the curve; a larger value indicates a thicker consistency. As shown in Table 7, in the XG, G, and C groups, sample consistency increased with gum concentration, and there were significant differences among the concentration groups (p < 0.05). In the JSDR 1 group, the consistency from largest to smallest was XG > G = C. In the JSDR 2 group, it was XG > G = C. In the JSDR 3 group, it was XG > G > C.
3.4.5. Cohesiveness
Cohesiveness is the maximum negative peak force value on the curve, reflecting the strength of the intermolecular bonding within the sample. A larger value indicates greater cohesiveness. As shown in Table 7, sample cohesiveness increased with gum concentration in the XG, G, and C groups. This indicates that as the gum concentration in the sample increased, the internal intermolecular bonding became stronger. There were significant differences between the different concentration groups (p < 0.05). The cohesiveness from largest to smallest was: JSDR 1 group, XG > C > G; JSDR 2 group, XG > G > C; JSDR 3 group, G > XG > C.
3.4.6. Viscosity
Viscosity is the area of the negative peak on the curve; a larger value indicates greater viscosity of the sample. As shown in Table 7, in the XG, G, and C groups, as the gum concentration increased, the sample viscosity also increased, and there were significant differences among the concentration groups (p < 0.05). In the JSDR 1 group, the consistency from largest to smallest was XG = C > G. In the JSDR 2 group, it was G > XG = C. In the JSDR 3 group, it was G > XG = C.
3.4.7. Mouthcoating (Subsidiary)
Mouthfeel is the ratio of the maximum positive peak force to the maximum opposing peak force, indicating the ease with which the sample dissolves in the mouth. The results in Table 7 show no differences in the mouthfeel among the three XG concentration groups. In the G and C groups, as gum concentration increased, the sample’s mouthfeel also increased, and there were significant differences between the concentration groups (p < 0.05). In the JSDR 1 group, the mouthfeel difficulty, from most to least, was XG = C = G. In the JSDR 2 group, G > XG, while C showed no difference with either. In the JSDR 3 group, it was G > C > XG.
The systematic comparison of xanthan gum (XG), guar gum (G), and carrageenan (C) in a hypoallergenic pea protein (PP) matrix provides critical data for the development of safe, palatable, dysphagia-friendly matrices. The results clearly demonstrate that each hydrocolloid imparts a unique set of rheological and textural properties, which must be carefully matched to the target dysphagia classification. The strain-sweep analysis effectively characterized the fundamental viscoelastic nature of the thickened matrices. Xanthan Gum (XG): The LVR for all XG concentrations showed G’ > G”. This signifies in the elastic (solid-like) domain, consistent with XG’s ability to form a strong, ordered network, even in the presence of PP. The observation of shear-thinning behavior and the “weak-strain overshoot” phenomenon confirms that the XG structure resists initial deformation but rapidly breaks down under high strain, a beneficial property for easing the swallowing process. Guar Gum (G): In contrast, G samples remained in the viscous (G” > G’) domain in the LVR. The frequency sweep further classified them as dilute polymer solutions, indicating that guar gum primarily acts as an effective non-gelling thickener, increasing the fluid’s resistance to flow but not significantly its elastic structure. Like G, C was viscous-oriented (G” > G’) in the strain sweep LVR. However, the frequency sweep demonstrated gel-like behavior, where the elastic modulus (G’) dominated at low frequencies before a crossover occurred, indicating the formation of a recoverable, structured network. This is a crucial distinction from guar gum, as carrageenan provides a more structured matrix, especially at rest. Texture Profile Analysis (TPA) provided quantitative measurements corresponding to oral processing attributes. Xanthan Gum imparted the highest firmness and consistency across most JSDR categories. This suggests XG creates the most rigid and thickest feel, which is essential for maximizing bolus control and reducing pharyngeal flow speed, but may require more effort to swallow. Guar Gum provided the best liquidity (flowability). Crucially, G surpassed XG and C in both cohesiveness and viscosity in the medium (JSDR 2) and thick (JSDR 3) consistency groups This indicates that while G is more flowable at rest, its high concentration creates strong internal molecular bonding and resistance (viscosity) during extrusion, potentially optimizing bolus integrity and ease of movement. Guar Gum also resulted in the highest mouth-coating (Subsidiary) in the JSDR 2 and 3 groups. This attribute relates to how easily the sample dissolves in the mouth and its sensation. A higher mouth-coating may be desirable for certain dysphagia patients, as it provides a clearer sensory signal of the bolus and reduces the perception of a dry mouth, regarding formulation efficiency and classification discrepancies. The study highlighted practical implications regarding usage, cost, and classification: once in classification results between the instrumental viscosity measurement (rheometer at 50 s-1) and the empirical syringe flow test. Samples with the highest concentrations (XG0.6, G1.0, and C1.2) were rated “thick consistency” (JSDR 3) by viscosity measures, but “medium consistency” (JSDR 2) by the syringe test. This underscores the importance of using multiple assessment methods (rheology and empirical flow) in quality control to ensure products meet safety standards, as flow properties determined by gravity-driven tests may better mimic real-world swallowing mechanics than those from fixed-shear-rate viscosity measurements. As for concentration efficiency, the required usage amount to achieve target viscosities followed the order: Carrageenan > Guar Gum > Xanthan Gum. XG’s high thickening efficiency translates to lower material costs per batch, making it potentially the most cost-effective thickener. A key finding was the difference in classification results between the instrumental viscosity measurement (rheometer at 50 s-1) and the empirical syringe flow test. Specifically, the highest-concentration samples (XG0.6, G1.0, and C1.2) were classified as “thick consistency” (JSDR 3) by viscosity but only as “medium consistency” (JSDR 2) by the syringe test. This underscores the importance of using multiple assessment methods (rheology and empirical flow) in quality control to ensure products meet safety standards, as flow properties determined by gravity-driven tests may better mimic real-world swallowing mechanics than those from fixed-shear-rate viscosity measurements.
4. Conclusions
This study compared rheological and textural properties of formulations with xanthan gum (XG), guar gum, and carrageenan that meet dysphagia standards. Strain-sweep analysis showed that XG was predominantly elastic, whereas guar gum and carrageenan were more viscous. In frequency sweeps, XG at 0.4% behaved as a weak gel, shifting to liquid-like at high frequencies; guar gum acted as a dilute solution, and carrageenan remained gel-like. Texture profile analysis found XG had the greatest firmness and consistency, whereas guar gum provided superior flowability and mouth-coating (especially in JSDR 2 and 3). At low concentration (JSDR 1), XG led in cohesiveness and viscosity; at medium/high concentrations, guar gum surpassed XG in these metrics. Thus, hydrocolloid selection strongly affects viscoelastic traits and texture, which are important for safe swallowing.
References
- Locke, A.; Schneiderhan, J.; Zick, S. M. Diets for health: goals and guidelines. Am. Fam. Physician 2018, 97, 721–728. [CrossRef]
- Sokoloff, L. G.; Pavlakovic, R. Neuroleptic-induced dysphagia. Dysphagia 1997, 12, 177. [CrossRef]
- Hudson, H. M.; Daubert, C. R.; Mills, R. H. The interdependency of protein-energy malnutrition, aging, and dysphagia. Dysphagia 2000, 15, 31–38.
- Cho, H. M.; Yoo, B. Rheological characteristics of cold thickened beverages containing xanthan gum–based food thickeners used for dysphagia diets. J. Acad. Nutr. Diet. 2015, 115, 106–111. [CrossRef]
- Zargaraan, A.; Rastmanesh, R.; Fadavi, G.; Zayeri, F.; Mohammadifar, M. A. Rheological aspects of dysphagia-oriented food products: A mini review. Food Sci. Hum. Wellness 2013, 2, 173–178. [CrossRef]
- Garcia, J. M.; Chambers, E.; Matta, Z.; Clark, M. Serving temperature viscosity measurements of nectar- and honey-thick liquids. Dysphagia 2008, 23, 65–75.
- Yang, H.; Tsai, C. C.; Jiang, J. S.; Hua, C. C. Rheological and textural properties of apple pectin-based composite formula with Xanthan gum modification for preparation of thickened matrices with dysphagia-friendly potential. Polymers 2021, 13, 873. [CrossRef]
- Mudgil, D.; Barak, S.; Khatkar, B. S. Guar gum: processing, properties and food applications—a review. J. Food Sci. Technol. 2014, 51, 409–418. [CrossRef]
- Musampa, R. M.; Alves, M. M.; Maia, J. M. Phase separation, rheology and microstructure of pea protein–kappa-carrageenan mixtures. Food Hydrocolloids 2007, 21, 92–99. [CrossRef]
- Patel, P.; Mujmer, K.; Aswal, V. K.; Gupta, S.; Thareja, P. Structure, rheology, and 3D printing of salt-induced $\kappa$-carrageenan gels. Mater. Today Commun. 2023, 35, 105807. [CrossRef]
- Bartali, B.; Frongillo, E. A.; Bandinelli, S.; Lauretani, F.; Semba, R. D.; Fried, L. P.; Ferrucci, L. Low nutrient intake is an essential component of frailty in older persons. J. Gerontol. A Biol. Sci. Med. Sci. 2006, 61, 589–593. [CrossRef]
- Cordle, C. T. Soy protein allergy: incidence and relative severity. J. Nutr. 2004, 134, 1213S–1219S. [CrossRef]
- Lam, A. C. Y.; Karaca, A.; Tyler, R. T.; Nickerson, M. T. Pea protein isolates: Structure, extraction, and functionality. Food Rev. Int. 2018, 34, 126–147. [CrossRef]
- Kayashita, J.; Imai, S.; Minagawa, H.; Ino, M. New standards for thickened liquids and viscosity-measurement methodology for dysphagia diets: Classification of thickened liquids with the 10-mL syringe test. J. Jpn. Soc. Dysphagia Rehabil. 2021, 25, 233–244. [CrossRef]
- Yang, H. W.; Dai, H. D.; Huang, W. C.; Sombatngamwilai, T. Formulations of dysphagia-friendly food matrices with calorie-dense starchy thickeners and their stability assessments. J. Food Meas. Charact. 2020, 14, 3089–3102. [CrossRef]
- Yang, H.; Chou, L.-Y.; Hua, C.-C. Effects of Calcium and pH on Rheological Thermal Resistance of Composite Xanthan Gum and High-Methoxyl Apple Pectin Matrices Featuring Dysphagia-Friendly Consistency. Foods 2024, 13, 90. [CrossRef]
- Cichero, J. A.; Steele, C.; Duivestein, J.; Clavé, P.; Chen, J.; Kayashita, J.; Murray, J. The need for international terminology and definitions for texture-modified foods and thickened liquids used in dysphagia management: foundations of a global initiative. Curr. Phys. Med. Rehabil. Rep. 2013, 1, 280–291. [CrossRef]
- Miocinovic, J.; Miloradovic, Z.; Josipovic, M.; Nedeljkovic, A.; Radovanovic, M.; Pudja, P. Rheological and textural properties of goat and cow milk set type yoghurts. Int. Dairy J. 2016, 58, 43–45. [CrossRef]
- Stone, A. K.; Avram, D.; Warkentin, T. D.; Nickerson, M. T. Comparison of the emulsifying properties of lentil (Lens culinaris) protein isolates and derived peptides to commercial proteins. Food Hydrocolloids 2015, 43, 747–756. [CrossRef]
- Emadzadeh, B.; Razavi, S. M.; Schleining, G. Dynamic rheological and textural characteristics of low-calorie pistachio butter. Int. J. Food Prop. 2013, 16, 512–526. [CrossRef]
- Moret-Tatay, A.; Rodríguez-García, J.; Martí-Bonmatí, E.; Hernando, I.; Hernández, M. J. Commercial thickeners used by patients with dysphagia: Rheological and structural behaviour in different food matrices. Food Hydrocolloids 2015, 51, 318–326. [CrossRef]
- Hyun, K.; Kim, S. H.; Ahn, K. H.; Lee, S. J. Large amplitude oscillatory shear as a way to classify the complex fluids. J. Non-Newtonian Fluid Mech. 2002, 107, 51–65. [CrossRef]
- Alghooneh, A.; Razavi, S. M.; Kasapis, S. Classification of hydrocolloids based on small amplitude oscillatory shear, large amplitude oscillatory shear, and textural properties. J. Texture Stud. 2019, 50(6). [CrossRef]
- Nakashima, R.; Furukawa, S.; Fukamachi, K.; Kimura, T. Formation of stable and highly viscous structures of $\beta$-lactoglobulin/xanthan gum mixture. Food Hydrocolloids 2019, 93, 308–315. [CrossRef]
Figure 1.
Strain-dependent rheological patterns of low-allergenic pea protein thickened dysphagia-friendly matrices: (a) XG: xanthan gum; (b) G: guar bean gum; (c) C: Carrageenan.
Figure 1.
Strain-dependent rheological patterns of low-allergenic pea protein thickened dysphagia-friendly matrices: (a) XG: xanthan gum; (b) G: guar bean gum; (c) C: Carrageenan.
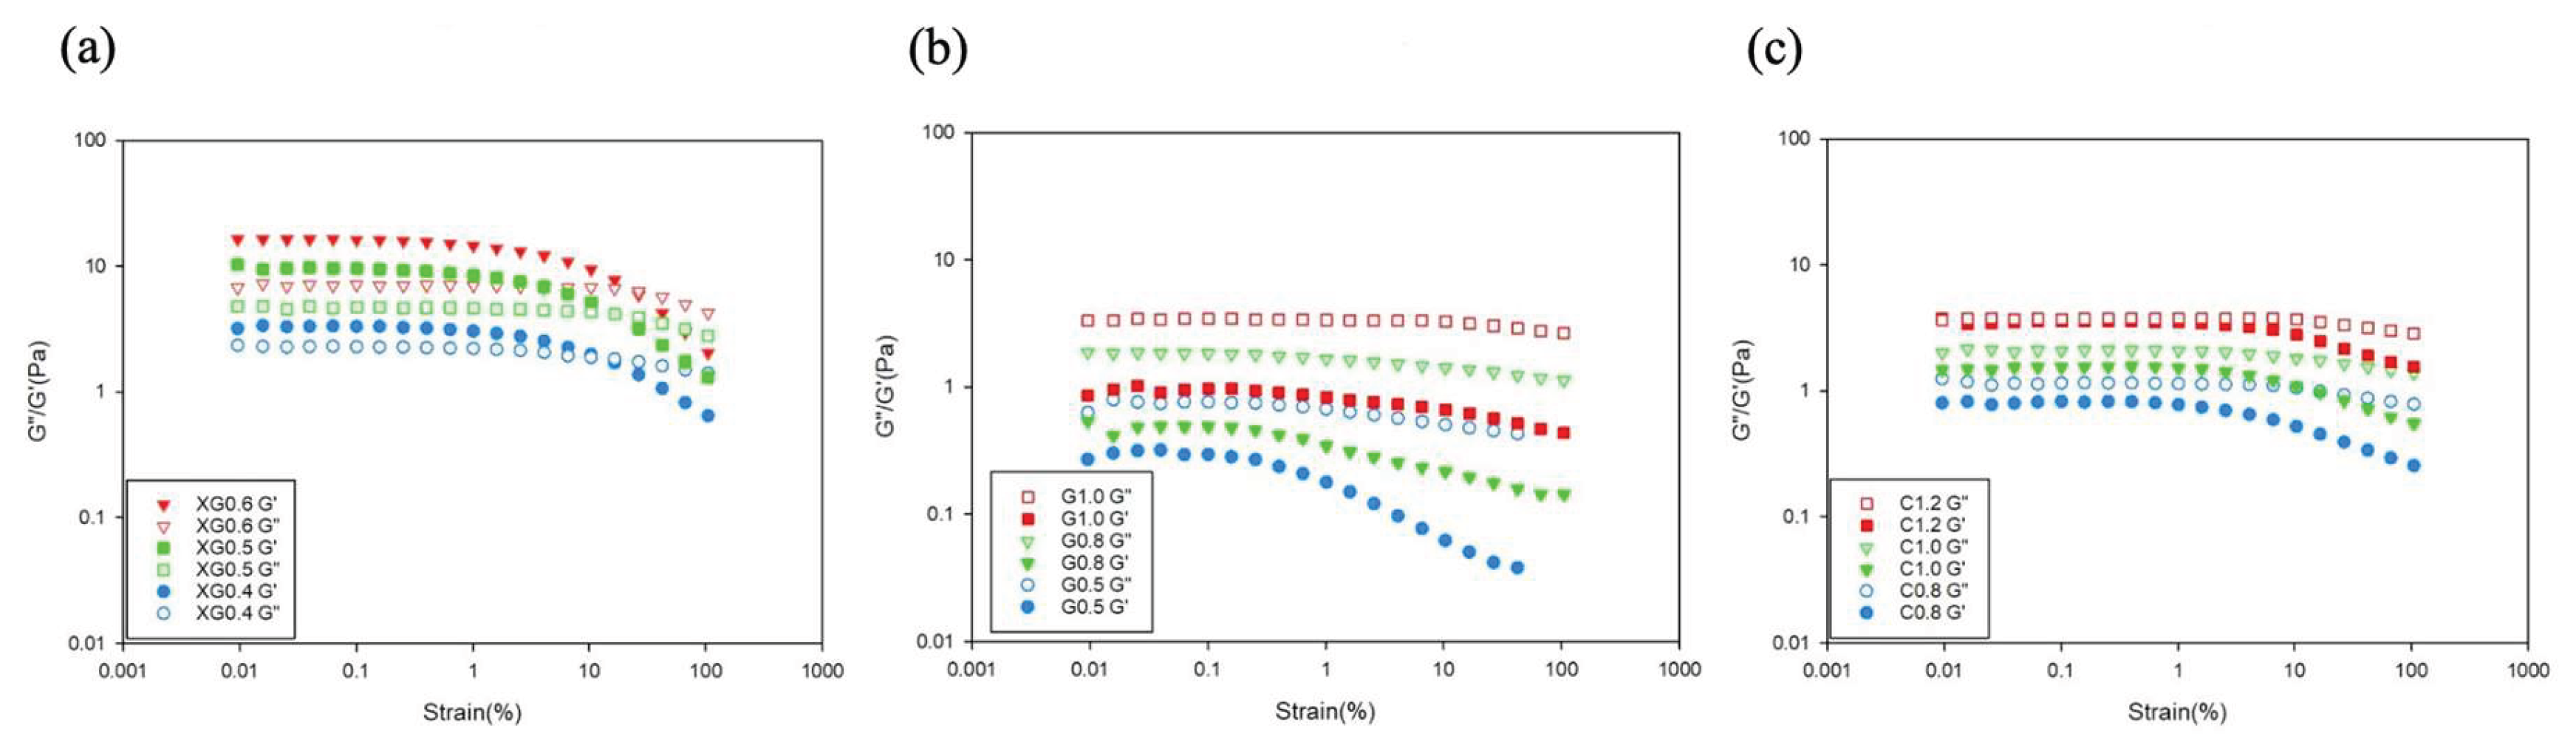
Figure 2.
Frequency-dependent rheological patterns of low-allergenic pea protein thickened dysphagia-friendly matrices: (a) XG: xanthan gum; (b) G: guar bean gum; (c) C: Carrageenan.
Figure 2.
Frequency-dependent rheological patterns of low-allergenic pea protein thickened dysphagia-friendly matrices: (a) XG: xanthan gum; (b) G: guar bean gum; (c) C: Carrageenan.
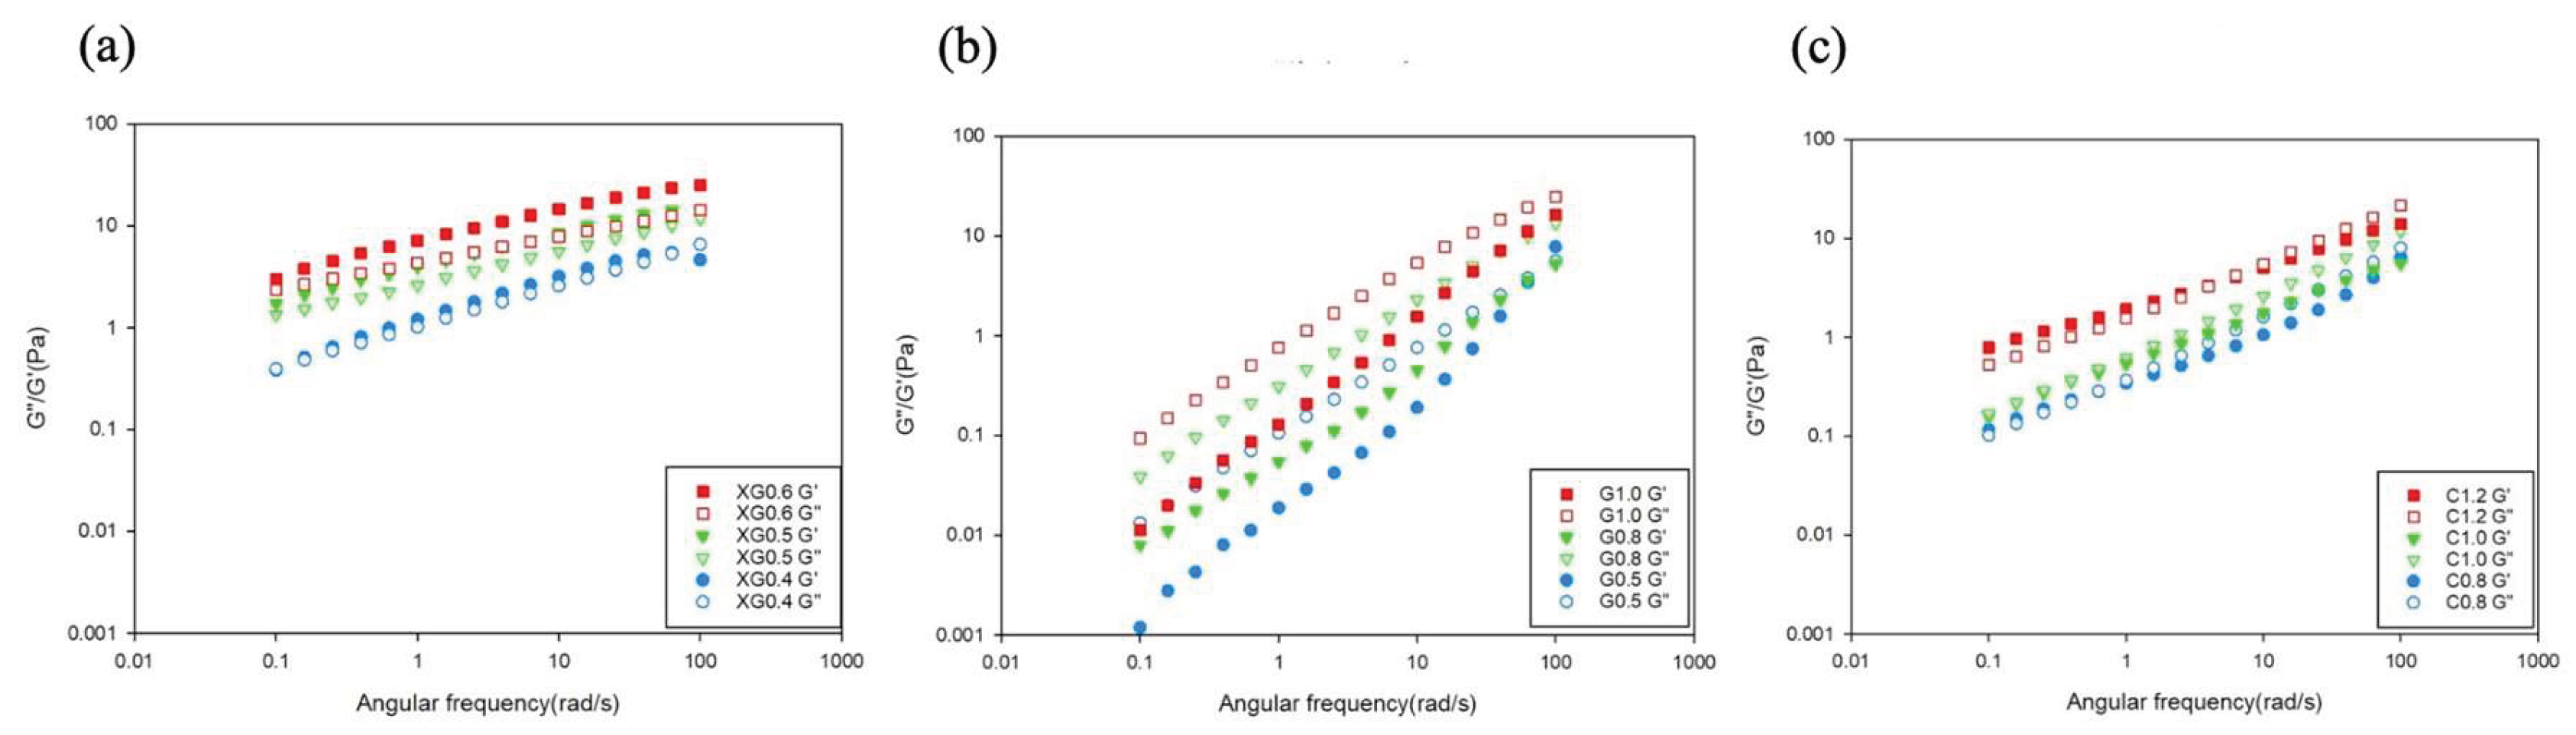

Table 1.
Experimental sample formulation list*.
| Formulation (category) | Thickener + PP (g/100g) |
| XG 0.4 (JSDR 1) | 0.4 g XG + 15 g PP |
| XG 0.5 (JSDR 2) | 0.5 g XG + 15 g PP |
| XG 0.6 (JSDR 3) | 0.6 g XG + 15 g PP |
| G 0.5 (JSDR 1) | 0.5 g G + 15 g PP |
| G 0.8 (JSDR 2) | 0.8 g G +15 g PP |
| G 1.0 (JSDR 3) | 1.0 g G + 15 g PP |
| C 0.8 (JSDR 1) | 0.8 g C + 15 g PP |
| C 1.0 (JSDR 2) | 1.0 g C + 15 g PP |
| C 1.2 (JSDR 3) | 1.2 g C + 15 g PP |
*XG: xanthan gum; G: guar bean gum; C: carrageenan; PP: pea protein isolate; data shown as mean ± SD (n=3).
Table 2.
Sedimentation changes of low-allergenic PP dysphagia-friendly matrices without thickening*.
Table 2.
Sedimentation changes of low-allergenic PP dysphagia-friendly matrices without thickening*.
| Time (min | Sedimentation Index (%) |
| 5 | 90.0 ± 2.00 |
| 10 | 81.3 ±1.15 |
| 15 | 70.6 ± 1.15 |
| 20 | 60.0 ± 2.00 |
| 25 | 49.3 ± 1.15 |
| 30 | 38.6 ± 3.05 |
*Values are mean ± SD (n=3); PP concentration is 15 g per 100 g reverse osmosis water.
Table 3.
JSDR qualification and IDDSI categorizations of PP dysphagia-friendly matrices without thickening*.
Table 3.
JSDR qualification and IDDSI categorizations of PP dysphagia-friendly matrices without thickening*.
| Measuring apparatus | Outcome | Level |
| Rheometer | 7.79±1.28 cP | JSDR N.Q. |
|
10-mL syringe |
Remaining volume | JSDR N.Q. |
| 0 mL | ||
| Remaining volume | IDDSI 0 | |
| 0 mL |
*Values are mean ± SD (n=3); PP concentration is 15 g per 100 g reverse osmosis water; N.Q. stands for the sample not qualified as dysphagia-friendly.
Table 4.
JSDR viscosity classification of low-allergenic PP dysphagia-friendly matrices employed with hydrocolloidal thickeners after 24 h*.
Table 4.
JSDR viscosity classification of low-allergenic PP dysphagia-friendly matrices employed with hydrocolloidal thickeners after 24 h*.
| Sample thickener | Viscosity(cP) | JSDR level |
| XG0.4 | 141.5±0.62 | 1 |
| XG0.5 | 251.4±0.95 | 2 |
| XG0.6 | 307.0±0.55 | 3 |
| G0.5 | 91.7±0.63 | 1 |
| G0.8 | 187.4±0.80 | 2 |
| G1.0 | 367.3±0.36 | 3 |
| C0.8 | 139.1±1.91 | 1 |
| C1.0 | 216.8±4.05 | 2 |
| C1.2 | 366.4±15.75 | 3 |
*XG: xanthan gum; G: guar bean gum; C: Carrageenan; values are mean ± SD (n=3); the sample thickeners correspond to Table 1.
Table 5.
JSDR Syringe residue classification of PP dysphagia-friendly matrices.
| Sample thickener | Remaining volume (mL) | JSDR category |
| XG0.4 | 6.8±0.20 | 1 |
| XG0.5 | 7.8±0.10 | 2 |
| XG0.6 | 8.8±0.10 | 2 |
| G0.5 | 5.4±0.30 | 1 |
| G0.8 | 8.6±0.10 | 2 |
| G1.0 | 9.4±0.10 | 2 |
| C0.8 | 7.2±0.10 | 1 |
| C1.0 | 8.6±0.10 | 2 |
| C1.2 | 9.4±0.10 | 2 |
*XG: xanthan gum; G: guar bean gum; C: Carrageenan; values are mean ± SD (n=3); the sample thickeners correspond to Table 1.
Table 6.
IDDSI Syringe residue classification of low-allergenic PP dysphagia-friendly matrices.
| Sample thickener | Remaining volume (mL) | IDDSI level |
| XG0.4 | 6.8±0.20 | 2 |
| XG0.5 | 7.8±0.10 | 2 |
| XG0.6 | 8.8±0.10 | 3 |
| G0.5 | 5.4±0.30 | 2 |
| G0.8 | 8.6±0.10 | 3 |
| G1.0 | 9.4±0.10 | 3 |
| C0.8 | 7.2±0.10 | 2 |
| C1.0 | 8.6±0.10 | 3 |
| C1.2 | 9.4±0.10 | 3 |
*XG: xanthan gum; G: guar bean gum; C: Carrageenan; values are mean ± SD (n=3); the sample thickeners correspond to Table 1.
Table 7.
Textural properties of thickened low-allergenic pea protein dysphagia-friendly matrices*.
| sample | Liquidity (g/sec) | |||
| JSDR1 | JSDR2 | JSDR3 | ||
| XG | 6.2±0.09B, b | 6.6±0.28AB, a | 7.0±0.31A, a | |
| G | 6.8±0.09A, a | 6.2±0.03B, a | 6.9±0.19A, a | |
| C | 5.7±0.09A, c | 5.8±0.11A, b | 5.9±0.17A, b | |
| sample | Uniformity (g.sec) | |||
| JSDR1 | JSDR2 | JSDR3 | ||
| XG | 1.1±0.74A, a | 0.7±0.45A, a | 0.3±0.32A, b | |
| G | 0.8±0.69A, a | 1.1±0.67A, a | 1.8±0.56A, a | |
| C | 0.6±0.58A, a | 0.5±0.41A, a | 0.5±0.27A, b | |
| sample | Cohesiveness (g) | |||
| JSDR1 | JSDR2 | JSDR3 | ||
| XG | -13.9±0.11A, c | -15.6±0.05B, c | -17.7±0.32C, b | |
| G | -11.6±0.11A, a | -15.3±0.05B, b | -20.5±0.29C, c | |
| C | -12.0±0.11A, b | -13.9±0.88B, a | -16.8±0.43C, a | |
| sample | Viscosity (g.sec) | |||
| JSDR1 | JSDR2 | JSDR3 | ||
| XG | -18.8±0.75A, b | -22.6±0.47B, a | -26.4±0.55C, a | |
| G | -14.5±0.47A, a | -25.1±1.17B, b | -37.2±1.61C, b | |
| C | -17.6±0.52A, b | -21.8±0.86B, a | -27.7±1.76C, a | |
| sample | Subsidiary | |||
| JSDR1 | JSDR2 | JSDR3 | ||
| XG | -0.8±0.01A, a | -0.8±0.03A, a | -0.7±0.00A, a | |
| G | -0.7±0.03A, a | -0.8±0.00B, b | -0.9±0.01C, c | |
| C | -0.7±0.02A, a | -0.8±0.02B, ab | -0.8±0.02C, b | |
*XG: xanthan gum; G: guar bean gum; C: Carrageenan; upper case letters in the same thickener are significantly different (p < 0.05); lower case letters in the same JSDR level are significantly different (p < 0.05); values are mean ± SD (n=3).
Disclaimer/Publisher’s Note: The statements, opinions and data contained in all publications are solely those of the individual author(s) and contributor(s) and not of MDPI and/or the editor(s). MDPI and/or the editor(s) disclaim responsibility for any injury to people or property resulting from any ideas, methods, instructions or products referred to in the content. |
© 2025 by the authors. Licensee MDPI, Basel, Switzerland. This article is an open access article distributed under the terms and conditions of the Creative Commons Attribution (CC BY) license (http://creativecommons.org/licenses/by/4.0/).
Copyright: This open access article is published under a Creative Commons CC BY 4.0 license, which permit the free download, distribution, and reuse, provided that the author and preprint are cited in any reuse.


