
Submitted:
26 December 2025
Posted:
29 December 2025
You are already at the latest version
Abstract
The Hedgehog (Hh) signaling pathway is a key regulator of adipogenesis and lipid metabolism. However, the specific role of its receptor, Patched2 (Ptch2), in these processes remains unknown. Here, using a CRISPR/Cas9-mediated ptch2 homozygous mutation model in Nile tilapia (Oreochromis niloticus), we found that Ptch2 deficiency induced visceral and perirenal lipomatosis characterized by small, multinucleated adipocytes. Comparative adipose transcriptomics revealed pronounced adipogenic reprogramming, with marked upregulation of genes governing de novo lipogenesis (e.g., acaca, fasn), fatty acid desaturation (e.g., scd, fadsd6), and triglyceride synthesis (e.g., dgat2, lpl). Biochemically, mutants exhibited elevated blood glucose and liver transaminases (alanine aminotransferase, aspartate aminotransferase) with reduced alkaline phosphatase, indicating systemic metabolic dysregulation and hepatic stress. Our findings demonstrate that loss of Ptch2 triggers lipoma formation and adipogenic transcriptome reprogramming, highlighting its essential role in maintaining adipose tissue homeostasis.
Keywords:
Patched2 (Ptch2)
; lipoma
; Nile tilapia
; transcriptome
; lipid metabolism
1. Introduction
Adipose tissue is a dynamic endocrine organ primarily composed of adipocytes, serving as the central hub for systemic energy homeostasis through lipid storage and mobilization [1,2]. The differentiation and development of adipocytes, a process termed adipogenesis, are tightly regulated by complex transcriptional cascades [3,4]. Dysregulation of this process is implicated not only in prevalent metabolic diseases like obesity and type 2 diabetes but also in localized pathologies such as lipoma formation [5,6]. Lipoma is a benign mesenchymal tumor characterized by the uncontrolled growth of adipose tissue [7,8], and its pathogenesis is not yet clear.
Hedgehog (Hh) signaling pathway, a highly conserved pathway crucial for cell fate determination, tissue patterning, and stem cell regulation, is a potential regulator in adipose biology and tumorigenesis [9,10,11,12]. In canonical Hh signaling, the binding of ligands to the Patched (Ptch) receptor relieves its inhibition on Smoothened (Smo), ultimately activating Gli transcription factors [13,14]. In adipose biology, canonical Hh signaling acts as a potent inhibitor of white adipocyte differentiation [15]. In mice, the canonical Hh signaling, which is transduced via primary cilia, inhibits adipogenesis, whereas omega-3 fatty acids, which are sensed via the free fatty acid receptor 4 (FFAR4) in the cilium, promote adipogenesis [16,17]. In humans, Gli2-mediated Hh signaling is enriched in adipose progenitor cells and in dedifferentiated liposarcoma, where it promotes malignant progression by driving stromal formation and suppressing immune infiltration [18].
Patched2 (Ptch2) is a pivotal transmembrane receptor in the Hh pathway, functioning as the primary negative regulator of the pathway [13]. Ptch2 plays a crucial tumor-suppressive role in the development and progression of various cancers. In basal cell carcinoma, the absence of Ptch2 leads to abnormal activation of the Hh signaling pathway, which promotes tumor growth [19,20]. In breast cancer, truncating mutations in Ptch2 disrupt its transmembrane structure, activating the MAPK, PI3K/mTOR pathways and driving tumor cell proliferation [21,22]. These studies indicate that the normal function of Ptch2 is vital for inhibiting tumor development, and its mutations or deletions can activate oncogenic signaling pathways, thereby promoting tumorigenesis. However, the role of Ptch2 in lipomas remains elusive.
Nile tilapia (Oreochromis niloticus) is a valuable vertebrate model for genetic and physiological studies due to its well-annotated genome, suitability for CRISPR/Cas9-mediated genome editing [23,24]. In this study, we systematically investigated the effects of Ptch2 deficiency on adipogenesis and lipid metabolism. Our results showed that Ptch2 deficiency leads to the formation of coelomic lipomas in Nile tilapia. Further histological and transcriptomic analyses demonstrated that Ptch2 acts as a key inhibitor of the adipogenesis program in vivo. These findings highlight a novel and critical role for Ptch2 in lipid metabolic homeostasis and tumor suppression.
2. Materials and Methods
2.1. Animals
Nile tilapias (Oreochromis niloticus) were reared in circulating aerated fresh water tank under natural light at 26 ± 0.5 °C. The water quality parameters were monitored daily (pH: 7.2 ± 0.5; dissolved oxygen: 6.5–7.0 mg/L). Fish were fed three times a day with commercial feed (Shengsuo, Yantai, China). All progenies were obtained by crossing XY male with XX female. Larvae and juveniles were raised under the same conditions as the parental fish. All animal experiments were carried out in accordance with the regulations of the Guide for Care and Use of Laboratory Animals and approved by the Institutional Animal Care and Use Committee of Southwest University (NO. IACUC-20181015-12).
2.2. Cloning and sequence analysis
The putative coding sequence containing the complete open reading frame (ORF) of Nile tilapia ptch2 was obtained through a search in GenBank (Gene ID: 100692939). The sequence was amplified via RT-PCR using primers specific to ptch2 (Table S1), followed by sequencing and bioinformatic analyses. The ClustalX 1.83 program and GeneDoc 2.6 software were utilized to perform multiple amino acid sequence alignment and identity analysis. Additionally, MEGA 7.0 software was employed to construct neighbor-joining phylogenetic trees, while the Ensembl Genome Browser (http://www.ensembl.org) was used for gene syntenic analyses.
2.3. Hematoxylin and Eosin (H&E) Staining
The ptch2-/- fish were generated through CRISPR/Cas9-mediated knockout and hybridization, as described in our previous study [25]. Wild-type (WT) and ptch2-/- fish at 90 days after hatching (dah) were fixed in Bouin’s solution for 24 h at room temperature with agitation. The fixed samples were then processed as follows: serial dehydration in 60%, 70%, 80%, 90%, and 95% ethanol for 1 h each, followed by three 1-h immersions in 100% ethanol; sequential clearance in a xylene and ethanol mixture (1:1) for 30 min, followed by two 10-min immersions in xylene; and infiltration in paraffin for 2 h. The samples were sectioned at a thickness of 5 µm using a Leica Microsystems microtome (Wetzlar, Germany) and subsequently stained with H&E. Images were captured using an Olympus BX53 light microscope (Tokyo, Japan).
2.4. RNA-seq
Adipose tissues were harvested separately from WT and ptch2-/- fish at 90 dah, with three biological replicates performed for each group. Total RNA was extracted from each group using RNAiso Plus (Takara). Libraries were sequenced on an Illumina platform (GENEBOOK Biotechnology), and clean reads were aligned to the reference genome using HISAT2. Gene expression levels, quantified as fragments per kilobase per million mapped reads (FPKM), were determined using featureCounts. Differentially expressed genes (DEGs) were analyzed with DESeq2 and identified based on the following criteria: P value < 0.05 and |log2(fold change) | ≥ 1.5. Kyoto Encyclopedia of Genes and Genomes (KEGG) and Gene Ontology (GO) pathway enrichment analyses were conducted on the DEGs using an online analysis platform (https://www.genescloud.cn/login).
Total RNA from the aforementioned samples was reverse-transcribed into complementary DNA (cDNA) using the PrimeScript II 1st Strand cDNA Synthesis Kit (Takara). Quantitative real-time PCR (qRT-PCR) was performed on an ABI-7500 system (Applied Biosystems) following the SYBR® Premix Ex TaqTM II (Takara Bio Inc., Japan) protocol. Relative mRNA levels were normalized to β-actin and calculated using the formula R = 2−ΔΔCt (primers listed in Table S1).
2.5. Serum Biochemistry
Blood was collected from the tail vein of WT and ptch2-/- fish at 90 dah, and serum was separated by centrifugation. Levels of glucose, alanine aminotransferase (ALT), aspartate aminotransferase (AST), alkaline phosphatase (ALP), total protein (TP), albumin (ALB), lipase, triglycerides (TG), total cholesterol (TC), high density lipoprotein cholesterol (HDL) and low-density lipoprotein cholesterol (LDL) were measured using the biochemical analyzer SMT-120VP (Seamaty, China).
2.6. Data Analysis
Statistical analyses were conducted using the GraphPad Prism 8 software package (GraphPad Software, La Jolla, CA, USA). Data are presented as mean ± SD derived from at least three independent experiments; each performed in triplicate. Statistical significance was assessed using a two-tailed Student’s t-test. The levels of statistical significance are indicated as follows: **P < 0.01; *P < 0.05; NS, not significant.
3. Results
3.1. Sequence Analyses
The ORF of Nile tilapia ptch2 was successfully cloned and validated. The resulting protein, composed of 1491 amino acids, exhibits a high sequence identity with vertebrate Ptch2 homologs, exceeding 65% (Table 1), and is phylogenetically clustered with these homologs, distinct from the Ptch1 clade and the Drosophila Ptch outgroup (Figure 1A). A comparative analysis of neighboring genes across species reveals that the chromosome 18, which contains ptch2 in Nile tilapia, maintains good synteny with zebrafish chromosome 2 and human chromosome 1, both of which also harbor Ptch2 (Figure 1B). Structural analysis indicates that Nile tilapia Ptch2 possesses characteristic domains, including a N-terminal cytoplasmic domain (Ncyto) and 12 transmembrane domains, akin to its homolog Ptch1, although notable divergence is observed in the C-terminal cytoplasmic domains (Ccyto) (Figure 1C). These findings suggest that Nile tilapia Ptch2 is orthologous to mammalian Ptch2, while exhibiting divergence from Ptch1.
3.2. ptch2 Deficiency Leads to Visceral and Perirenal Lipomatosis
Homozygous ptch2 mutants were viable at early stages but exhibited a striking internal phenotype by 90 dah. External morphology showed no significant difference from WT siblings. However, upon opening the body cavity, WT fish exhibited an intact peritoneum (Figure 2A), while ptch2-/- mutants displayed prominent, encapsulated fatty masses (lipomas) attached to the inner body wall, with some causing visible rupture of the peritoneal lining (Figure 2B, B’). Furthermore, the kidneys of mutant fish were abnormally encapsulated by adipose tissue, unlike the clean surface of WT kidneys (Figure 2C, D). These results demonstrate that Ptch2 deficiency induces ectopic lipoma formation in the coelom and perirenal region.
Histological examination confirmed the macroscopic observations. H&E staining of peritoneal tissue from WT fish showed a normal, thin mesothelial layer (Figure 3A). In contrast, ptch2-/- mutants exhibited a massive accumulation of adipocytes forming a discrete lipoma above the peritoneal layer (Figure 3B). The glomeruli, anterior renal tubules, and mesorenal tubules in the kidneys of WT fish developed normally (Figure 3C, E). Although kidney histology appeared normal in ptch2-/- mutants (Figure 3F), the organ surface was covered by adipocyte clusters (Figure 3D).
Analysis of adipose tissue depots revealed a significant alteration in adipocyte morphology. Contrary to hypertrophy, adipocytes in ptch2-/- fish were significantly smaller in area compared to those in WT (Figure 3G, H). Quantification confirmed a significant decrease in adipocyte area in mutants (Figure 3I). Notably, some mutant adipocytes contained increased nuclei within the lipid vacuole (Figure 3H), a feature occasionally associated with active adipogenesis or remodeling.
3.3. Transcriptomic Reprogramming in ptch2-/- Adipose Tissue
To investigate the molecular basis of the phenotype, we performed RNA-seq on abdominal adipose tissue. Hierarchical clustering clearly separated WT and mutant samples (Figure 4A). We identified 2675 DEGs, with 1621 upregulated and 1054 downregulated in ptch2-/- adipose tissue (Figure 4B). GO term enrichment analysis of upregulated DEGs revealed strong association with biological processes such as “complement activation” and “cell cycle” (Figure 4C). Consistently, KEGG pathway analysis showed significant enrichment for “PPAR signaling pathway”, “cell cycle”, “DNA replication”, “fatty acid biosynthesis”, “glycerolipid metabolism” and “biosynthesis of unsaturated fatty acids”. (Figure 4D). These data indicate a global transcriptional shift towards enhanced lipid synthesis and adipogenesis in the absence of ptch2.
Focusing on the core lipogenic pathway, RNA-seq data showed a significant increase in the expression of key regulators and enzymes, including novo fatty acid synthesis (acaca, fasn, acsl3), fatty acid desaturation (scd, fadsd6, elovl6), and triglyceride synthesis (dgat2, lpl, fabp4a, slc27a4, acsbg2) (Figure 5A). This upregulation was independently validated by qRT-PCR, which confirmed a highly significant increase in the mRNA levels of these genes in ptch2-/- adipose tissue compared to WT (Figure 5B).
3.4. Systemic Metabolic Changes in ptch2 Mutants
Serum biochemical analysis showed that ptch2-/- mutants had elevated blood glucose levels (Figure 6A) and increased activities of alanine aminotransferase (ALT) and aspartate aminotransferase (AST), along with reduced alkaline phosphatase (ALP) activity (Figure 6B). No significant changes were observed in total protein, albumin, lipase, or lipid profiles (triglycerides, total cholesterol, HDL, LDL) (Figure 6B–D).
4. Discussion
This study reveals that Ptch2 deficiency in Nile tilapia results in a distinct pathological syndrome characterized by visceral lipomatosis and systemic metabolic dysregulation. The formation of coelomic and perirenal lipomas, alongside reduced post-juvenile survival (Figure S1), underscores a critical role for Ptch2 in maintaining adipose tissue homeostasis.
The mutant phenotype is not merely one of adipose hypertrophy but of true neoplastic transformation. Histological analysis confirmed that the ectopic fatty masses exhibited key diagnostic features of lipoma, including densely packed, small adipocytes and the presence of multinucleated cells (Figure 3G-I). Critically, H&E staining indicated that the internal architecture of the kidney remained histologically intact in mutants (Figure 3F), yet the organ was extensively displaced and encased by the lipomatous growth (Figure 2D, 3D). This distinction suggests that mortality likely stems not from a primary developmental defect or intrinsic organ failure, but from a progressive pathological process in which the mechanical compression and displacement of vital organs by uncontrolled adipose overgrowth ultimately compromises their function.
To define the molecular drivers of this transformation, we performed transcriptional profiling of mutant adipose tissue. The profound shift in gene expression, with over 2,600 differentially expressed genes, points to a comprehensive adipogenic reprogramming. KEGG pathway analysis pinpointed the specific metabolic routes activated, showing significant enrichment in “Fatty acid biosynthesis,” “Glycerolipid metabolism,” and “Biosynthesis of unsaturated fatty acids” (Figure 4D). Crucially, the PPAR signaling pathway—a master transcriptional regulator of adipogenesis—was among the most significantly enriched. This finding is mechanistically coherent, as it aligns with the concerted upregulation of a suite of direct PPAR target genes and core lipogenic enzymes, including fasn and acaca (for de novo synthesis), scd and fadsd6 (for desaturation), and dgat2 (for triglyceride synthesis) (Figure 5). We therefore propose that the loss of Ptch2 relieves a constitutive inhibition on the adipogenic transcriptional program, leading to sustained activation of the PPAR pathway. This, in turn, initiates a feed-forward loop driving uncontrolled lipid synthesis, which ultimately manifests as lipoma formation. However, the precise molecular mechanism linking Ptch2 to PPAR pathway repression remains a key question for future study.
When considering the broader genetic context, the severe embryonic lethality of ptch1 mutants in tilapia has prevented a direct comparison of the two Hh receptors in postnatal adipose biology. Our work establishes Ptch2 as a non-redundant, essential suppressor of pathological adipogenesis in vivo. Whether Ptch1 plays a complementary role, or whether functional compensation occurs, remains an open and interesting avenue for future investigation.
Finally, the systemic metabolic alterations, notably elevated blood glucose and liver transaminases (Figure 6), demonstrate that the local disruption of adipose homeostasis has whole-organism consequences. Hyperglycemia suggests the development of insulin resistance, which is a common sequela of dysfunctional adipose tissue [26]. Concurrently, elevated AST and ALT levels signal secondary hepatic stress [27], likely resulting from altered systemic lipid flux or inflammatory signals originating from the pathological fat depots. These findings integrate the local tumor phenotype into a framework of systemic metabolic disease, enhancing the translational relevance of this model.
5. Conclusions
In summary, our results delineate a novel pathway in which Ptch2 acts as a guardian of adipose tissue integrity. Its deficiency initiates a transcriptional cascade through the activation of the PPAR pathway, resulting in lipomatous transformation and subsequent metabolic dysfunction. This study not only identifies Ptch2 as a critical regulator of fat biology but also establishes a robust aquatic model for dissecting the mechanisms of adipogenesis and systemic fat metabolic comorbidities.
Supplementary Materials
The following supporting information can be downloaded at the website of this paper posted on Preprints.org.
Author Contributions
Conceptualization, C.Z., X.L. and J.W.; methodology, C.Z., X.L., X.P. and J.W.; validation, Y.C. and S.P.; formal analysis, X.L., Y.C. and L.L.; investigation, X.P., Y.C.and L.L.; resources, D.W. and J.W.; writing—original draft preparation, C.Z. and X.L.; writing—review and editing, C.Z. and J.W.; visualization, S.P. and L.L.; supervision, X.L., X.P. and J.W.; project administration, C.Z. and J.W.; funding acquisition, D.W. and J.W. All authors have read and agreed to the published version of the manuscript.
Funding
This research was funded by the National Natural Science Foundation of China (Grant No. 32573507, 32172969), the National Key Research and Development Program of China (Grant No. 2022YFD1201600) and the Southwest University of Graduate Student Research Innovation Project (SWUS25088).
Institutional Review Board Statement
All animal experiments were carried out in accordance with the regulations of the Guide for Care and Use of Laboratory Animals and approved by the Institutional Animal Care and Use Committee of Southwest University (NO. IACUC-20181015-12).
Informed Consent Statement
Not applicable.
Data Availability Statement
The data that support the findings of this study are available from the corresponding author upon reasonable request.
Conflicts of Interest
The authors declare no conflicts of interest.
References
- Díaz-Castro, F.; Morselli, E.; Claret, M. Interplay between the brain and adipose tissue: a metabolic conversation. EMBO Rep 2024, 25, 5277–5293. [Google Scholar] [CrossRef]
- Chait, A.; den Hartigh, L.J. Adipose Tissue Distribution, Inflammation and Its Metabolic Consequences, Including Diabetes and Cardiovascular Disease. Front Cardiovasc Med 2020, 7, 22. [Google Scholar] [CrossRef]
- Mota de Sá, P.; Richard, A.J.; Hang, H.; Stephens, J.M. Transcriptional Regulation of Adipogenesis. Compr Physiol 2017, 7, 635–674. [Google Scholar] [CrossRef]
- Rosen, E.D.; MacDougald, O.A. Adipocyte differentiation from the inside out. Nat Rev Mol Cell Biol 2006, 7, 885–896. [Google Scholar] [CrossRef]
- Li, Q.; Hagberg, C.E.; Silva Cascales, H.; Lang, S.; Hyvönen, M.T.; Salehzadeh, F.; Chen, P.; Alexandersson, I.; Terezaki, E.; Harms, M.J.; et al. Obesity and hyperinsulinemia drive adipocytes to activate a cell cycle program and senesce. Nat Med 2021, 27, 1941–1953. [Google Scholar] [CrossRef]
- Chu, C.Y.; Chen, C.F.; Rajendran, R.S.; Shen, C.N.; Chen, T.H.; Yen, C.C.; Chuang, C.K.; Lin, D.S.; Hsiao, C.D. Overexpression of Akt1 enhances adipogenesis and leads to lipoma formation in zebrafish. PloS One 2012, 7, e36474. [Google Scholar] [CrossRef]
- Le Duc, D.; Lin, C.C.; Popkova, Y.; Yang, Z.; Akhil, V.; Çakir, M.V.; Grunewald, S.; Simon, J.C.; Dietz, A.; Dannenberger, D.; et al. Reduced lipolysis in lipoma phenocopies lipid accumulation in obesity. Int J Obes 2021, 45, 565–576. [Google Scholar] [CrossRef]
- Tarikere, I.; Shenoy, M.; Anand, R.; Sreeram, S.; Mohammed, A. Unveiling a rare surgical phenomenon: Symptomatic pancreatic lipoma’s diagnosis and management. Int J Surg Case Rep 2025, 134, 111709. [Google Scholar] [CrossRef]
- Pak, E.; Segal, R.A. Hedgehog Signal Transduction: Key Players, Oncogenic Drivers, and Cancer Therapy. Dev Cell 2016, 38, 333–344. [Google Scholar] [CrossRef]
- Zhang, Y.; Beachy, P.A. Cellular and molecular mechanisms of Hedgehog signalling. Nat Rev Mol Cell Biol 2023, 24, 668–687. [Google Scholar] [CrossRef]
- Amakye, D.; Jagani, Z.; Dorsch, M. Unraveling the therapeutic potential of the Hedgehog pathway in cancer. Nat Med 2013, 19, 1410–1422. [Google Scholar] [CrossRef] [PubMed]
- Briscoe, J.; Thérond, P.P. The mechanisms of Hedgehog signalling and its roles in development and disease. Nat Rev Mol Cell Biol 2013, 14, 416–429. [Google Scholar] [CrossRef]
- Carpenter, D.; Stone, D.M.; Brush, J.; Ryan, A.; Armanini, M.; Frantz, G.; Rosenthal, A.; de Sauvage, F.J. Characterization of two patched receptors for the vertebrate hedgehog protein family. Proc Natl Acad Sci U S A 1998, 95, 13630–13634. [Google Scholar] [CrossRef]
- Ingham, P.W.; Nakano, Y.; Seger, C. Mechanisms and functions of Hedgehog signalling across the metazoa. Nat Rev Genet 2011, 12, 393–406. [Google Scholar] [CrossRef]
- Iacobini, C.; Vitale, M.; Haxhi, J.; Menini, S.; Pugliese, G. Impaired Remodeling of White Adipose Tissue in Obesity and Aging: From Defective Adipogenesis to Adipose Organ Dysfunction. Cells 2024, 13. [Google Scholar] [CrossRef]
- Sieckmann, K.; Winnerling, N.; Silva Ribeiro, D.J.; Yüksel, S.; Kardinal, R.; Steinheuer, L.M.; Frechen, F.; Corrêa, L.H.; Schermann, G.; Klausen, C.; et al. BBS8-dependent ciliary Hedgehog signaling governs cell fate in the white adipose tissue. EMBO J 2025, 44, 5315–5336. [Google Scholar] [CrossRef]
- Hilgendorf, K.I. Primary Cilia Are Critical Regulators of White Adipose Tissue Expansion. Front Physiol 2021, 12, 769367. [Google Scholar] [CrossRef]
- Beadle, E.P.; Bennett, N.E.; Rhoades, J.A. Bioinformatics Screen Reveals Gli-Mediated Hedgehog Signaling as an Associated Pathway to Poor Immune Infiltration of Dedifferentiated Liposarcoma. Cancers 2023, 15. [Google Scholar] [CrossRef]
- Adamska, A.; Woźniak, D.; Regulski, P.; Zawadzki, P. Comparison of Symptoms and Disease Progression in a Mother and Son with Gorlin-Goltz Syndrome: A Case Report. J Clin Med 2025, 14. [Google Scholar] [CrossRef]
- Yang, X.H.; Xu, B.H.; Zhou, D.L.; Long, Y.K.; Liu, Q.; Huang, C.; Ye, Z.L.; He, C.Y. Inherited rare and common variants in PTCH1 and PTCH2 contributing to the predisposition to reproductive cancers. Gene 2022, 814, 146157. [Google Scholar] [CrossRef]
- Skoda, A.M.; Simovic, D.; Karin, V.; Kardum, V.; Vranic, S.; Serman, L. The role of the Hedgehog signaling pathway in cancer: A comprehensive review. Bosn J Basic Med Sci 2018, 18, 8–20. [Google Scholar] [CrossRef]
- Xing, Z.; Park, P.K.; Lin, C.; Yang, L. LncRNA BCAR4 wires up signaling transduction in breast cancer. RNA Biol 2015, 12, 681–689. [Google Scholar] [CrossRef]
- Li, M.; Sun, L.; Zhou, L.; Wang, D. Tilapia, a good model for studying reproductive endocrinology. Gen Comp Endocrinol 2024, 345, 114395. [Google Scholar] [CrossRef]
- Li, M.; Yang, H.; Zhao, J.; Fang, L.; Shi, H.; Li, M.; Sun, Y.; Zhang, X.; Jiang, D.; Zhou, L.; et al. Efficient and heritable gene targeting in tilapia by CRISPR/Cas9. Genetics 2014, 197, 591–599. [Google Scholar] [CrossRef]
- Zhao, C.; Chen, Y.; Liu, L.; Liu, X.; Xiao, H.; Wang, F.; Huang, Q.; Dai, X.; Tao, W.; Wang, D.; et al. Desert Hedgehog mediates stem Leydig cell differentiation through Ptch2/Gli1/Sf1 signaling axis. bioRxiv 2025. [Google Scholar] [CrossRef]
- Xu, H.; Barnes, G.T.; Yang, Q.; Tan, G.; Yang, D.; Chou, C.J.; Sole, J.; Nichols, A.; Ross, J.S.; Tartaglia, L.A.; et al. Chronic inflammation in fat plays a crucial role in the development of obesity-related insulin resistance. J Clin Invest 2003, 112, 1821–1830. [Google Scholar] [CrossRef]
- Farrell, G.C.; Larter, C.Z. Nonalcoholic fatty liver disease: from steatosis to cirrhosis. Hepatology (Baltimore, Md.) 2006, 43, S99–s112. [Google Scholar] [CrossRef]
Figure 1.
Sequence analysis of Nile tilapia Ptch2. (A) Phylogenetic analysis of Ptch proteins. The phylogenetic tree was constructed using the neighbor-joining method within the MEGA7.0 program. The length of the line is proportional to the evolutionary distance of the species to the branching point. Node values represent percent bootstrap confidence derived from 1000 replicates. Human, Homo sapiens, PTCH2, NP 003729.3; Mouse, Mus musculus, Ptch2, NP 032984.1; Chicken, Gallus gallus, Ptch2, XP 025008840.1; Zebrafish, Danio rerio, Ptch2, NP 571063.2; Medaka, Oryzias latipes, Ptch2, XP_023820931.1; Nile tilapia, Oreochromis niloticus, Ptch2, XP 005476341.1; Human, PTCH1, NP 000255.2; Nile tilapia, Ptch1, XP 013127348.1; Fruit fly, Drosophila melanogaster, Ptch, NP 523661.2. (B) Chromosomal synteny analysis of the genomic region surrounding the ptch2 gene in Nile tilapia (LG18), zebrafish (Chr 2), and human (Chr 1). (C) Schematic representation of the domain structure of Nile tilapia Ptch1 and Ptch2, and sequence alignment of their C-terminal cytoplasmic domains (Ccyto). Ncyto: N-terminal cytoplasmic domain; TM: transmembrane domain; Ccyto: C-terminal cytoplasmic domain. Amino acid numbers are indicated on the right. Dashes indicate deletions, and shaded areas indicate shared sequences.
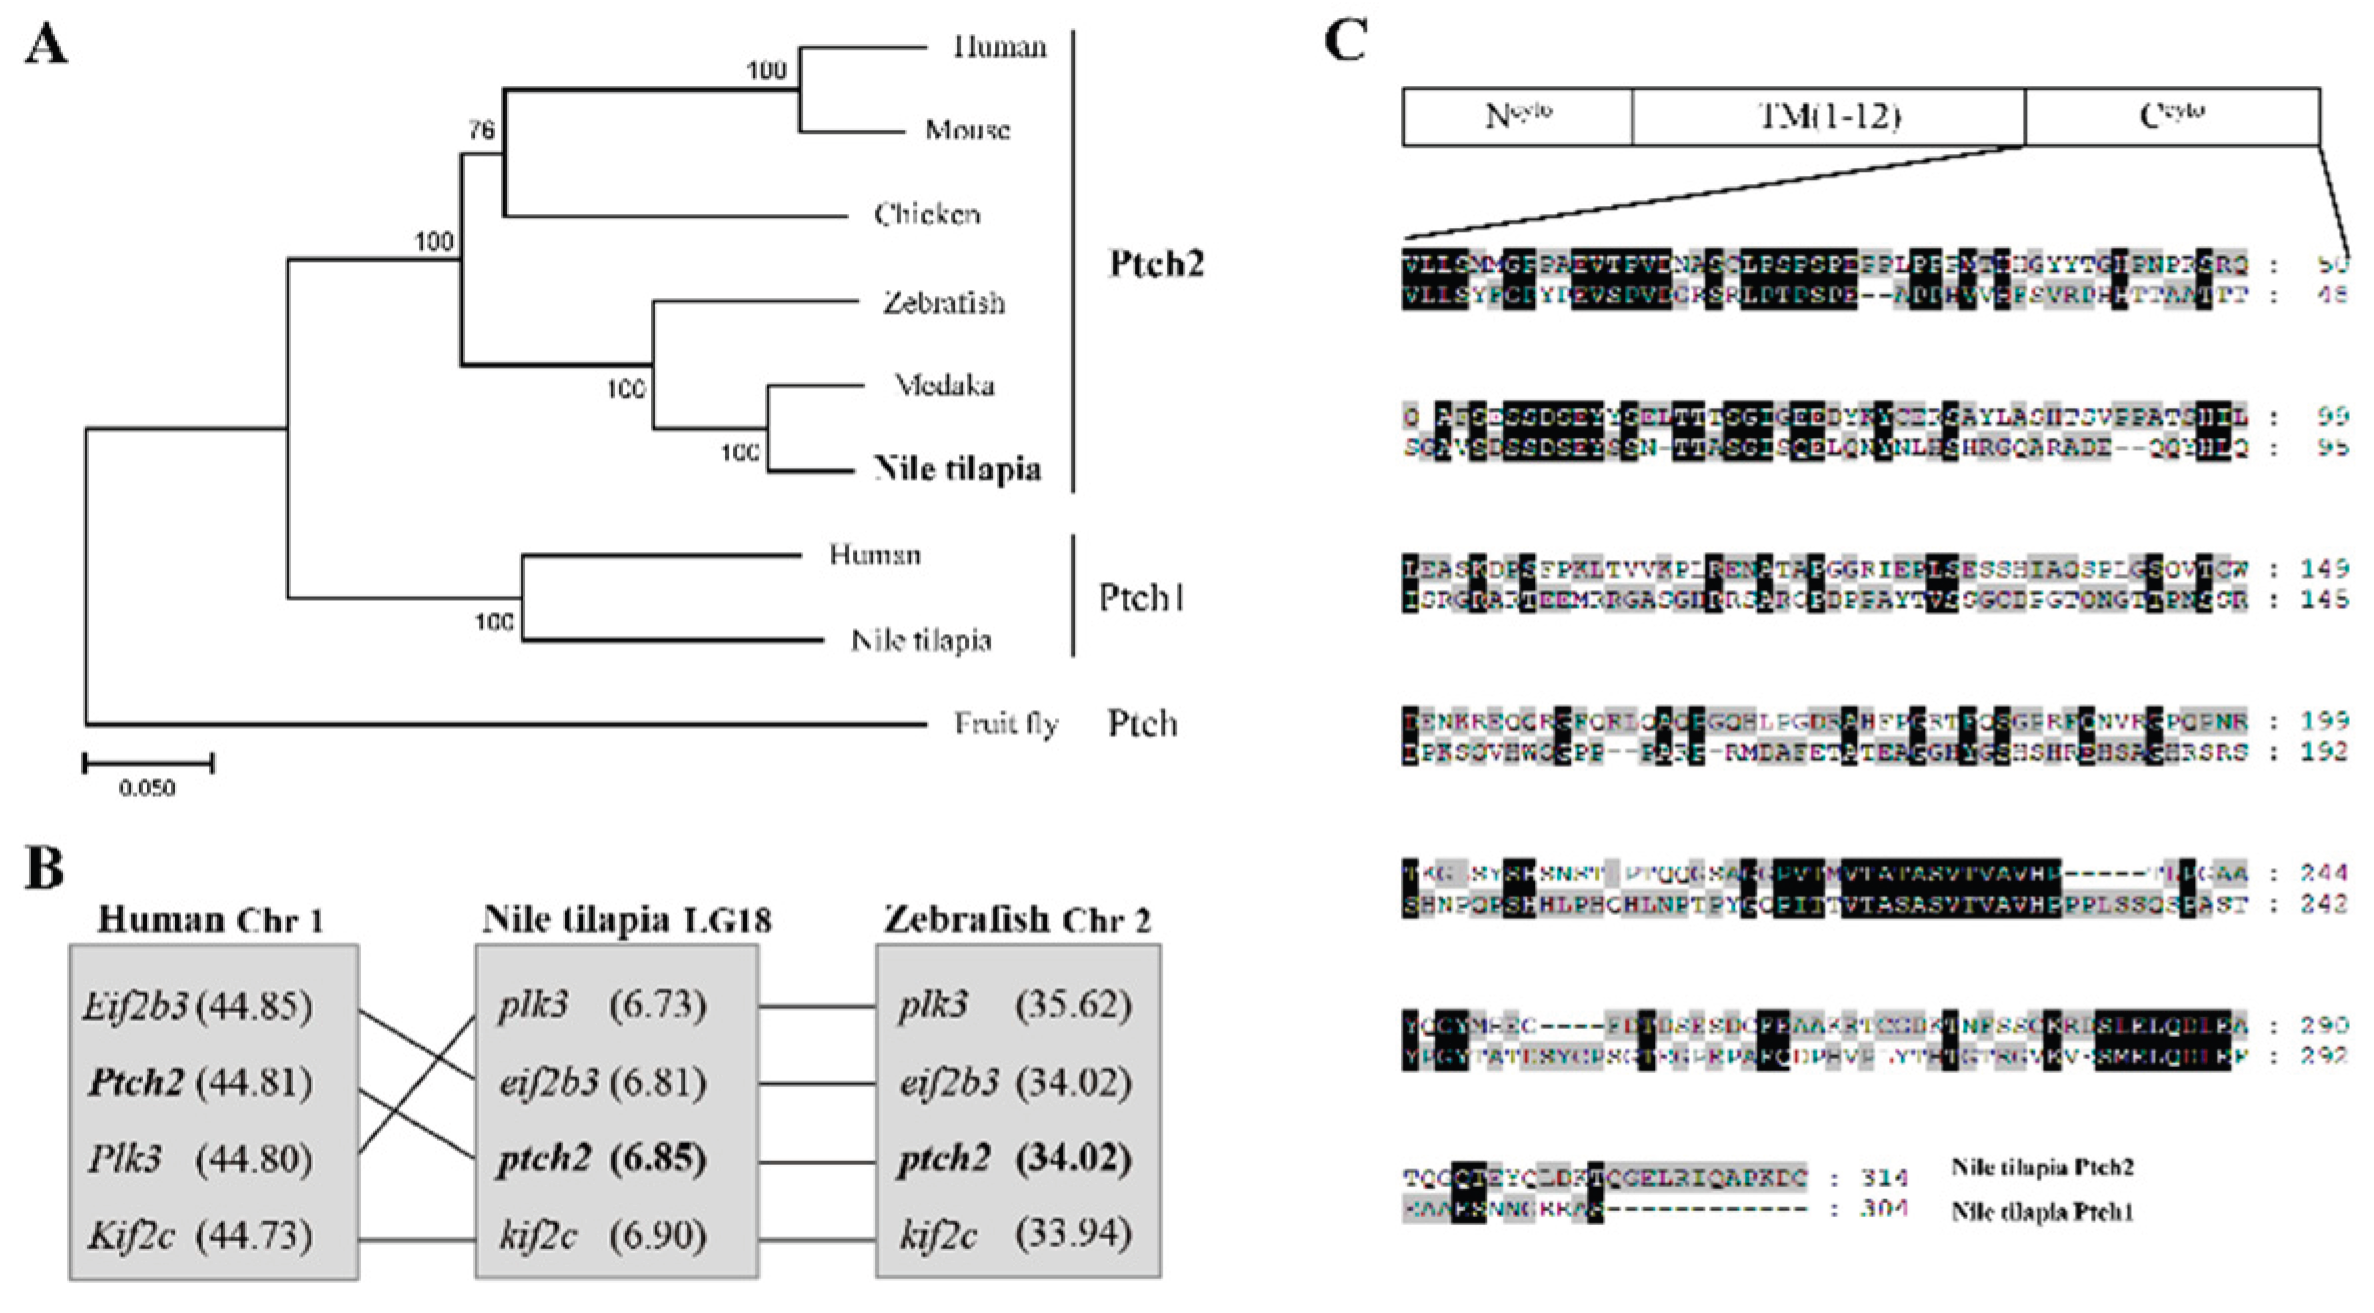
Figure 2.
Phenotypes of WT and ptch2-/- Nile tilapia at 90 dah. (A–B’) Coelom phenotypes of WT and ptch2-/- fish after visceral removal at 90 dah. The red dashed line in figure A represents the intact peritoneum, the white dashed line in figure B represents the lipoma, and the red dashed line in figure B’ represents the site of the ruptured peritoneum. (C,D) Mesonephros phenotypes of WT and ptch2-/- fish at 90 dah. The yellow dashed line in figure C represents a normal kidney, while the yellow dashed line in figure D represents a kidney wrapped with lipoma. Scale bars: 1 cm.
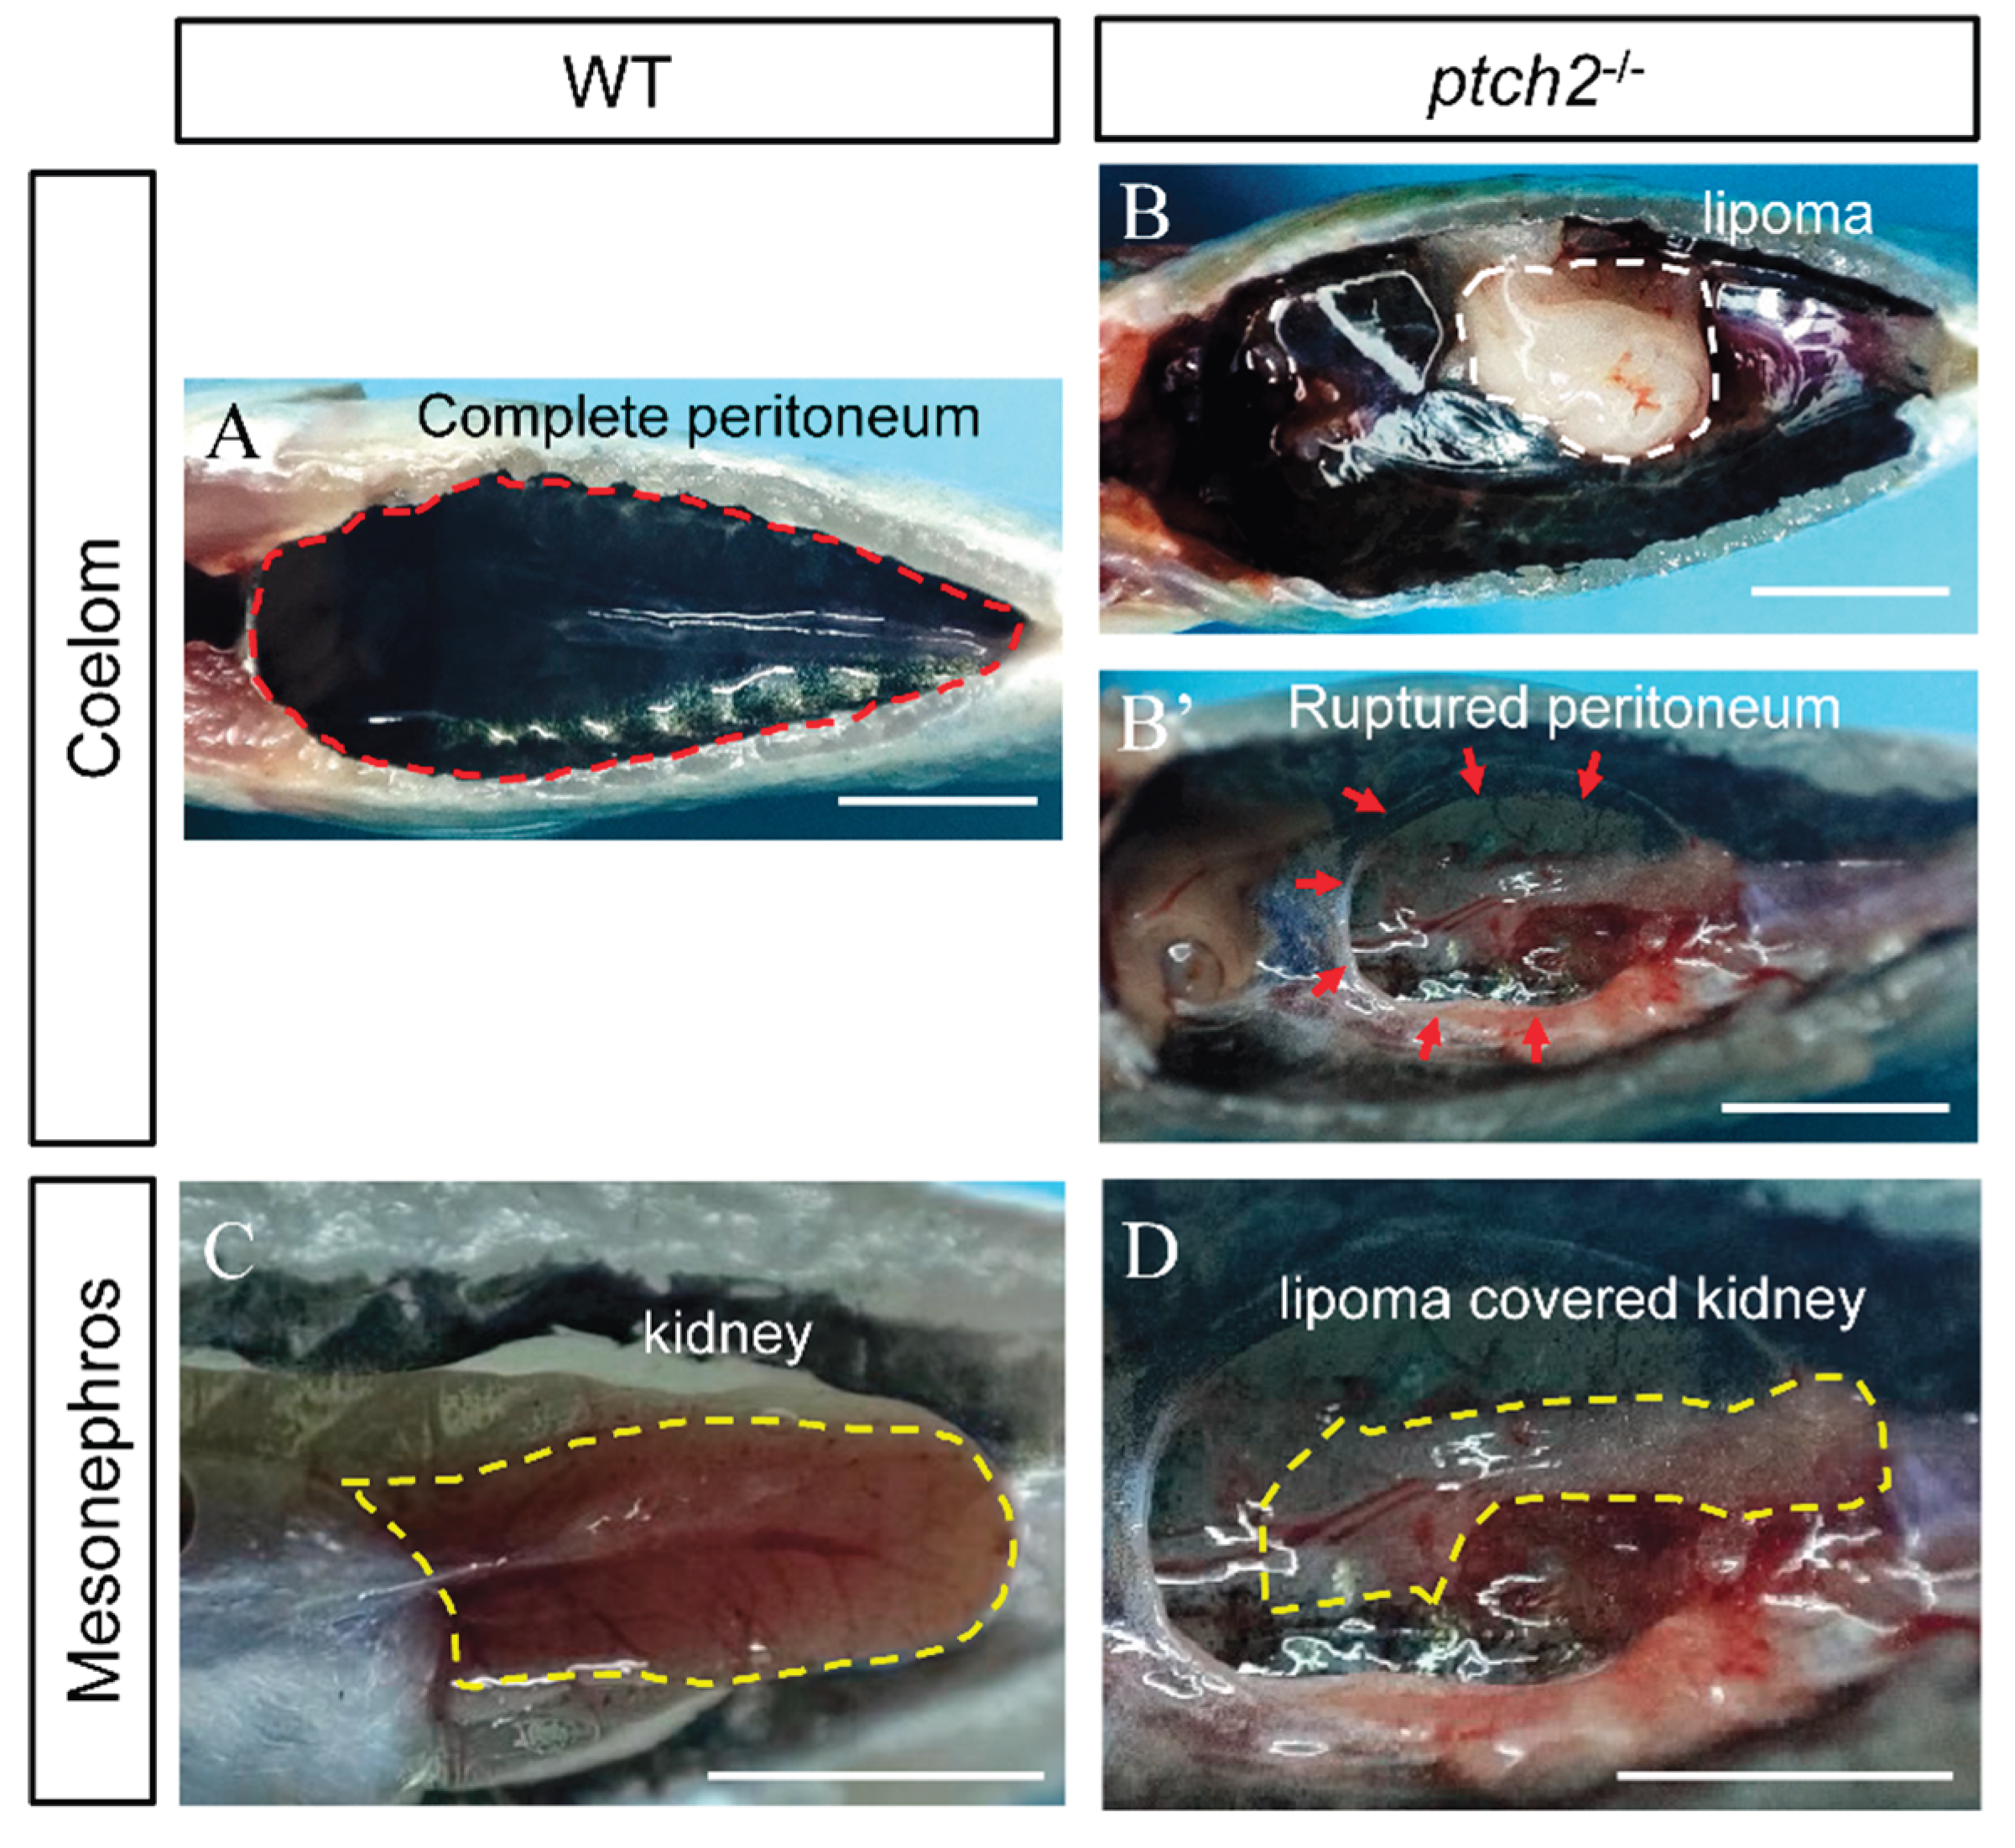
Figure 3.
Histological analysis of coelomic tissues from WT and ptch2-/- Nile tilapia at 90 dah. (A-B) H&E staining of peritoneal tissue. WT (A) shows normal peritoneal structure, whereas ptch2-/- mutants (B) exhibit lipoma formation above the peritoneum (arrow). (C-F) H&E staining of Kidney tissue. WT (C, E) showing normal kidney structure. ptch2-/- mutants showing normally in kidney tissue (F), but is covered with adipocyte clusters on the surface (arrows) (D). (G-H) H&E staining of adipose tissue. WT (G) showing typical adipose tissue morphology. ptch2-/- mutants (H) showing smaller adipocytes and some cells with increased nuclearity (black dashed circles). (I) Statistical analysis of adipocyte area. Data are presented as mean ± SD. Significant differences between WT and ptch2-/- groups were determined by Student’s t-test (**P < 0.01). Scale bars, A, B, E, F, 50 μm; C, D, G, H, 100 μm.
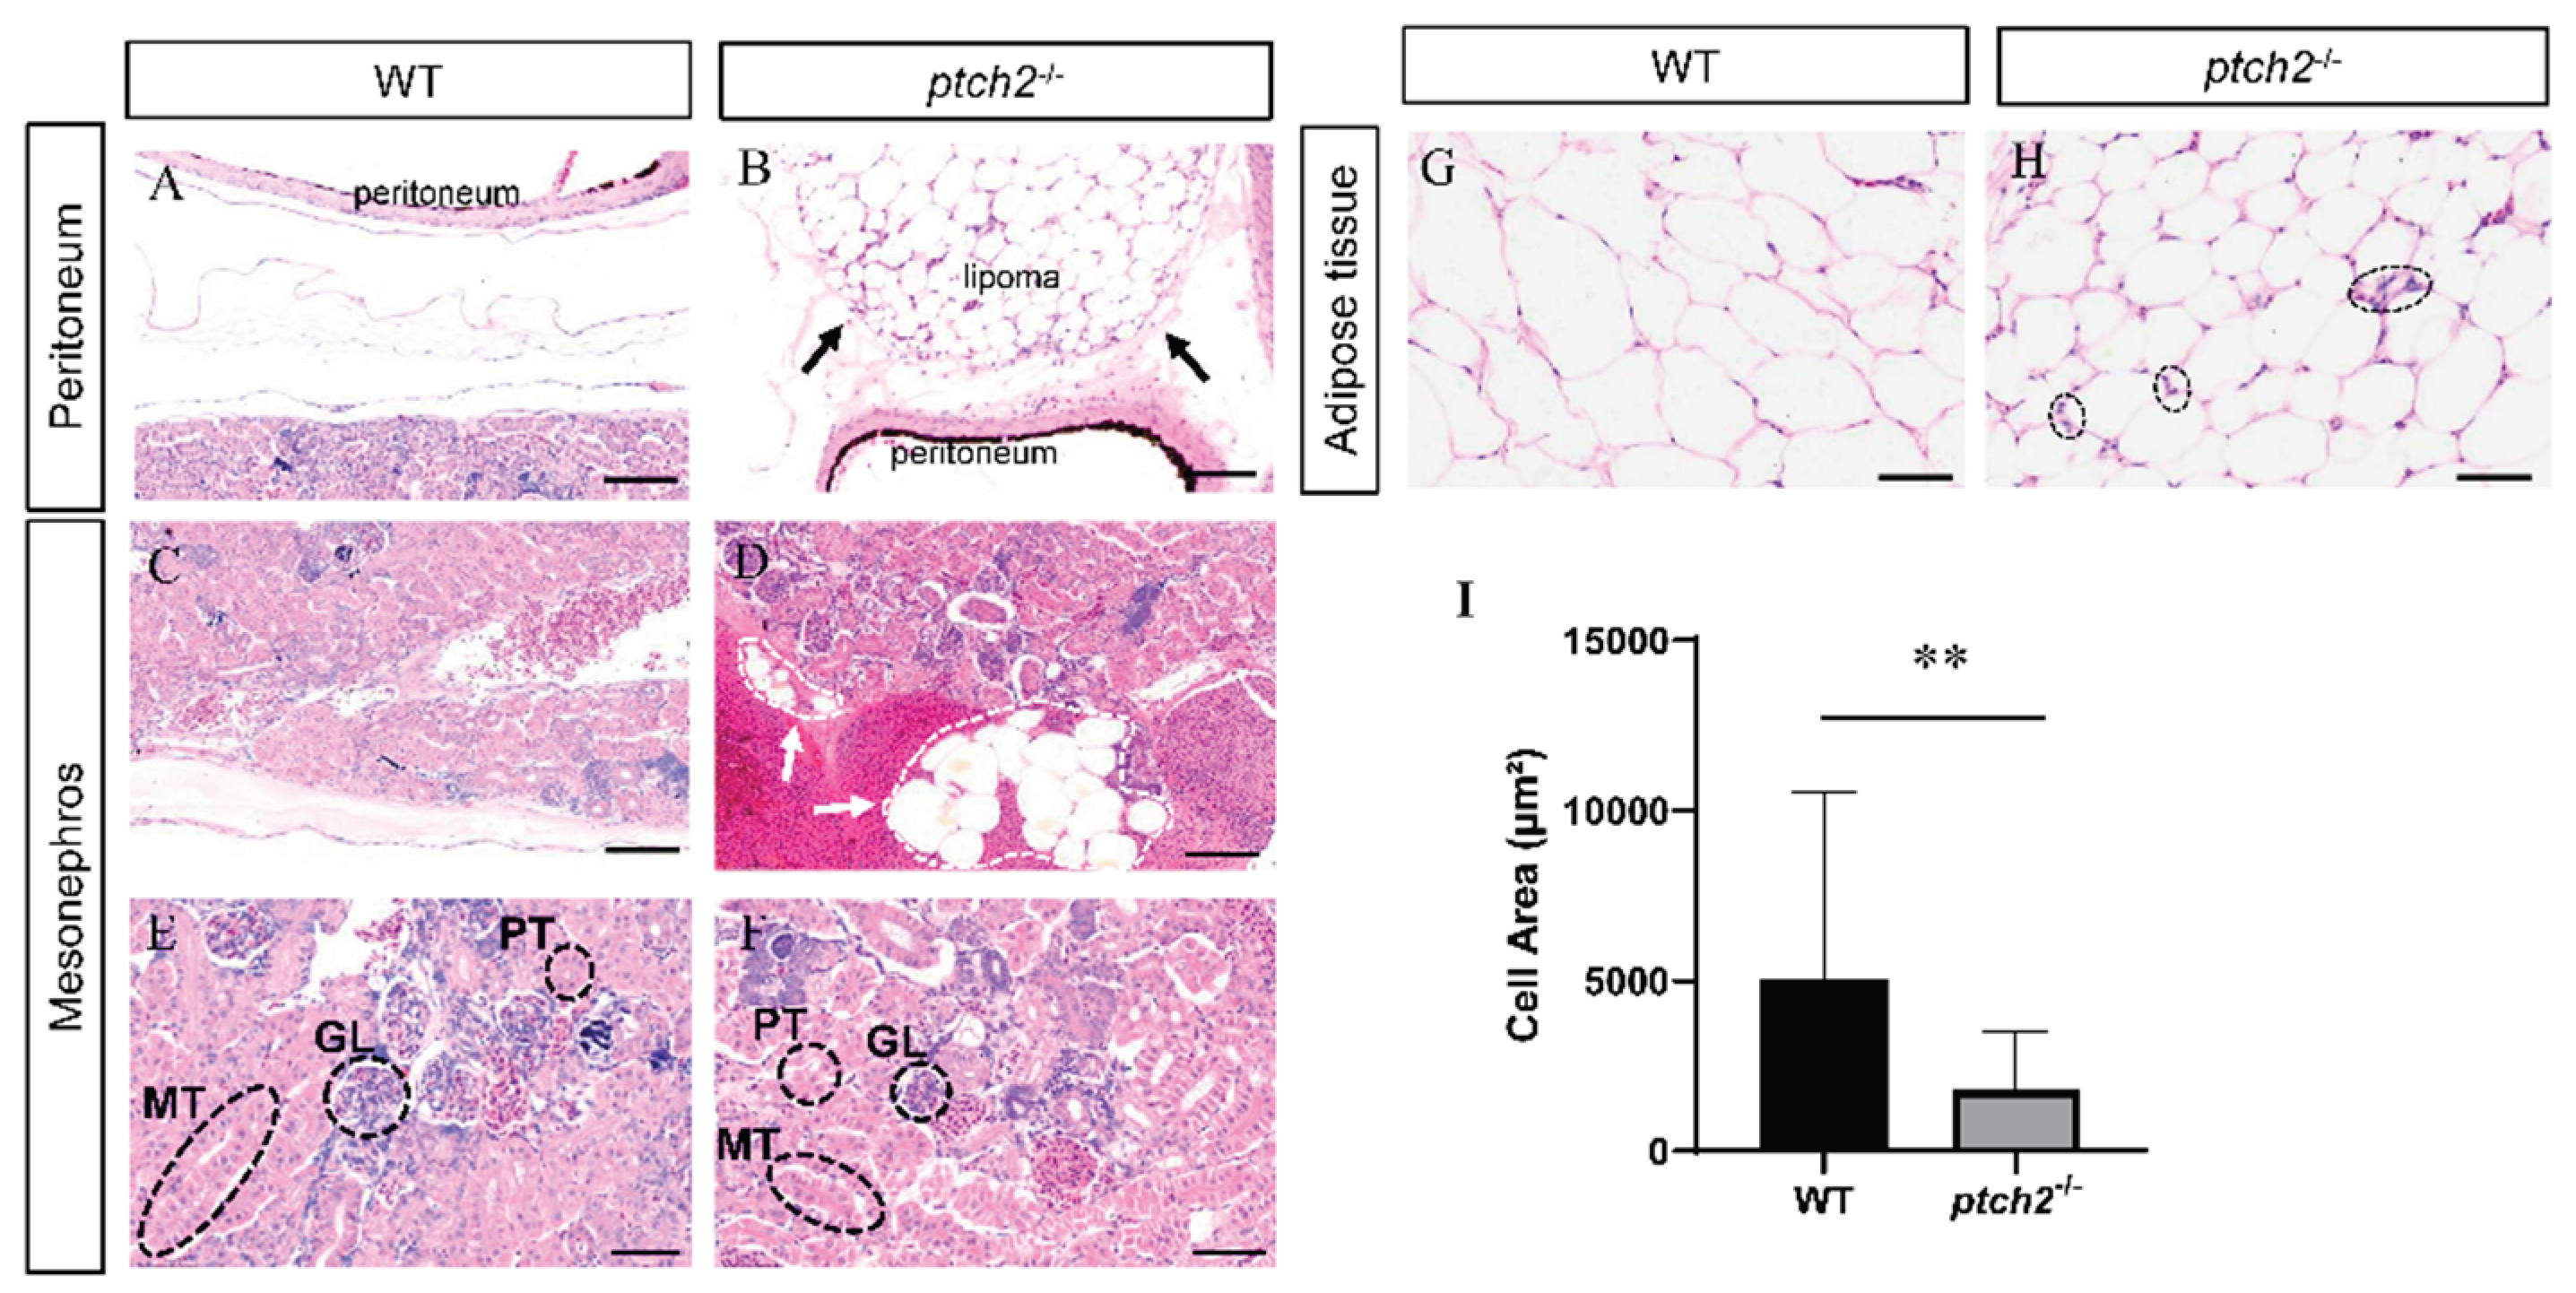
Figure 4.
Transcriptome analysis of adipose tissue from WT and ptch2-/- Nile tilapia at 90 dah. (A) Hierarchical clustering analysis of global gene expression patterns. Red indicates upregulated genes; blue indicates downregulated genes. (B) Volcano plot of differentially expressed genes (DEGs). A total of 1054 and 1621 genes were downregulated and upregulated, respectively, in the adipose tissue from ptch2-/- mutants compared with the WT. (C) Scatter plot of the enriched GO terms for the DEGs. The sizes and colors of the dots represent the number of genes and the significance of the difference, respectively. (D) Scatter plot of the enriched KEGG pathways for the DEGs. The sizes and colors of the dots represent the number of genes and the significance of the difference, respectively.

Figure 5.
Expression of lipid synthesis-related genes in adipose tissue of WT and ptch2-/- Nile tilapia at 90 dah. (A) FPKM values of representative DEGs related to de novo lipogenesis (acaca, fasn and acsl3), fatty acid desaturation (scd, fadsd6 and elovl6) and triglyceride synthesis (dgat2, fabp4a, lpl, slc27a4 and acsbg2) in adipose tissue of WT and ptch2-/- Nile tilapia at 90dah. The number inside the square is the FPKM value of genes in each sample. (B) RT-qPCR validation. The β-actin gene was used as an internal control. Three biological replicates were analyzed, and significant differences were determined using Student’s t-test. The values are presented as the mean ± SD. **, P < 0.01.
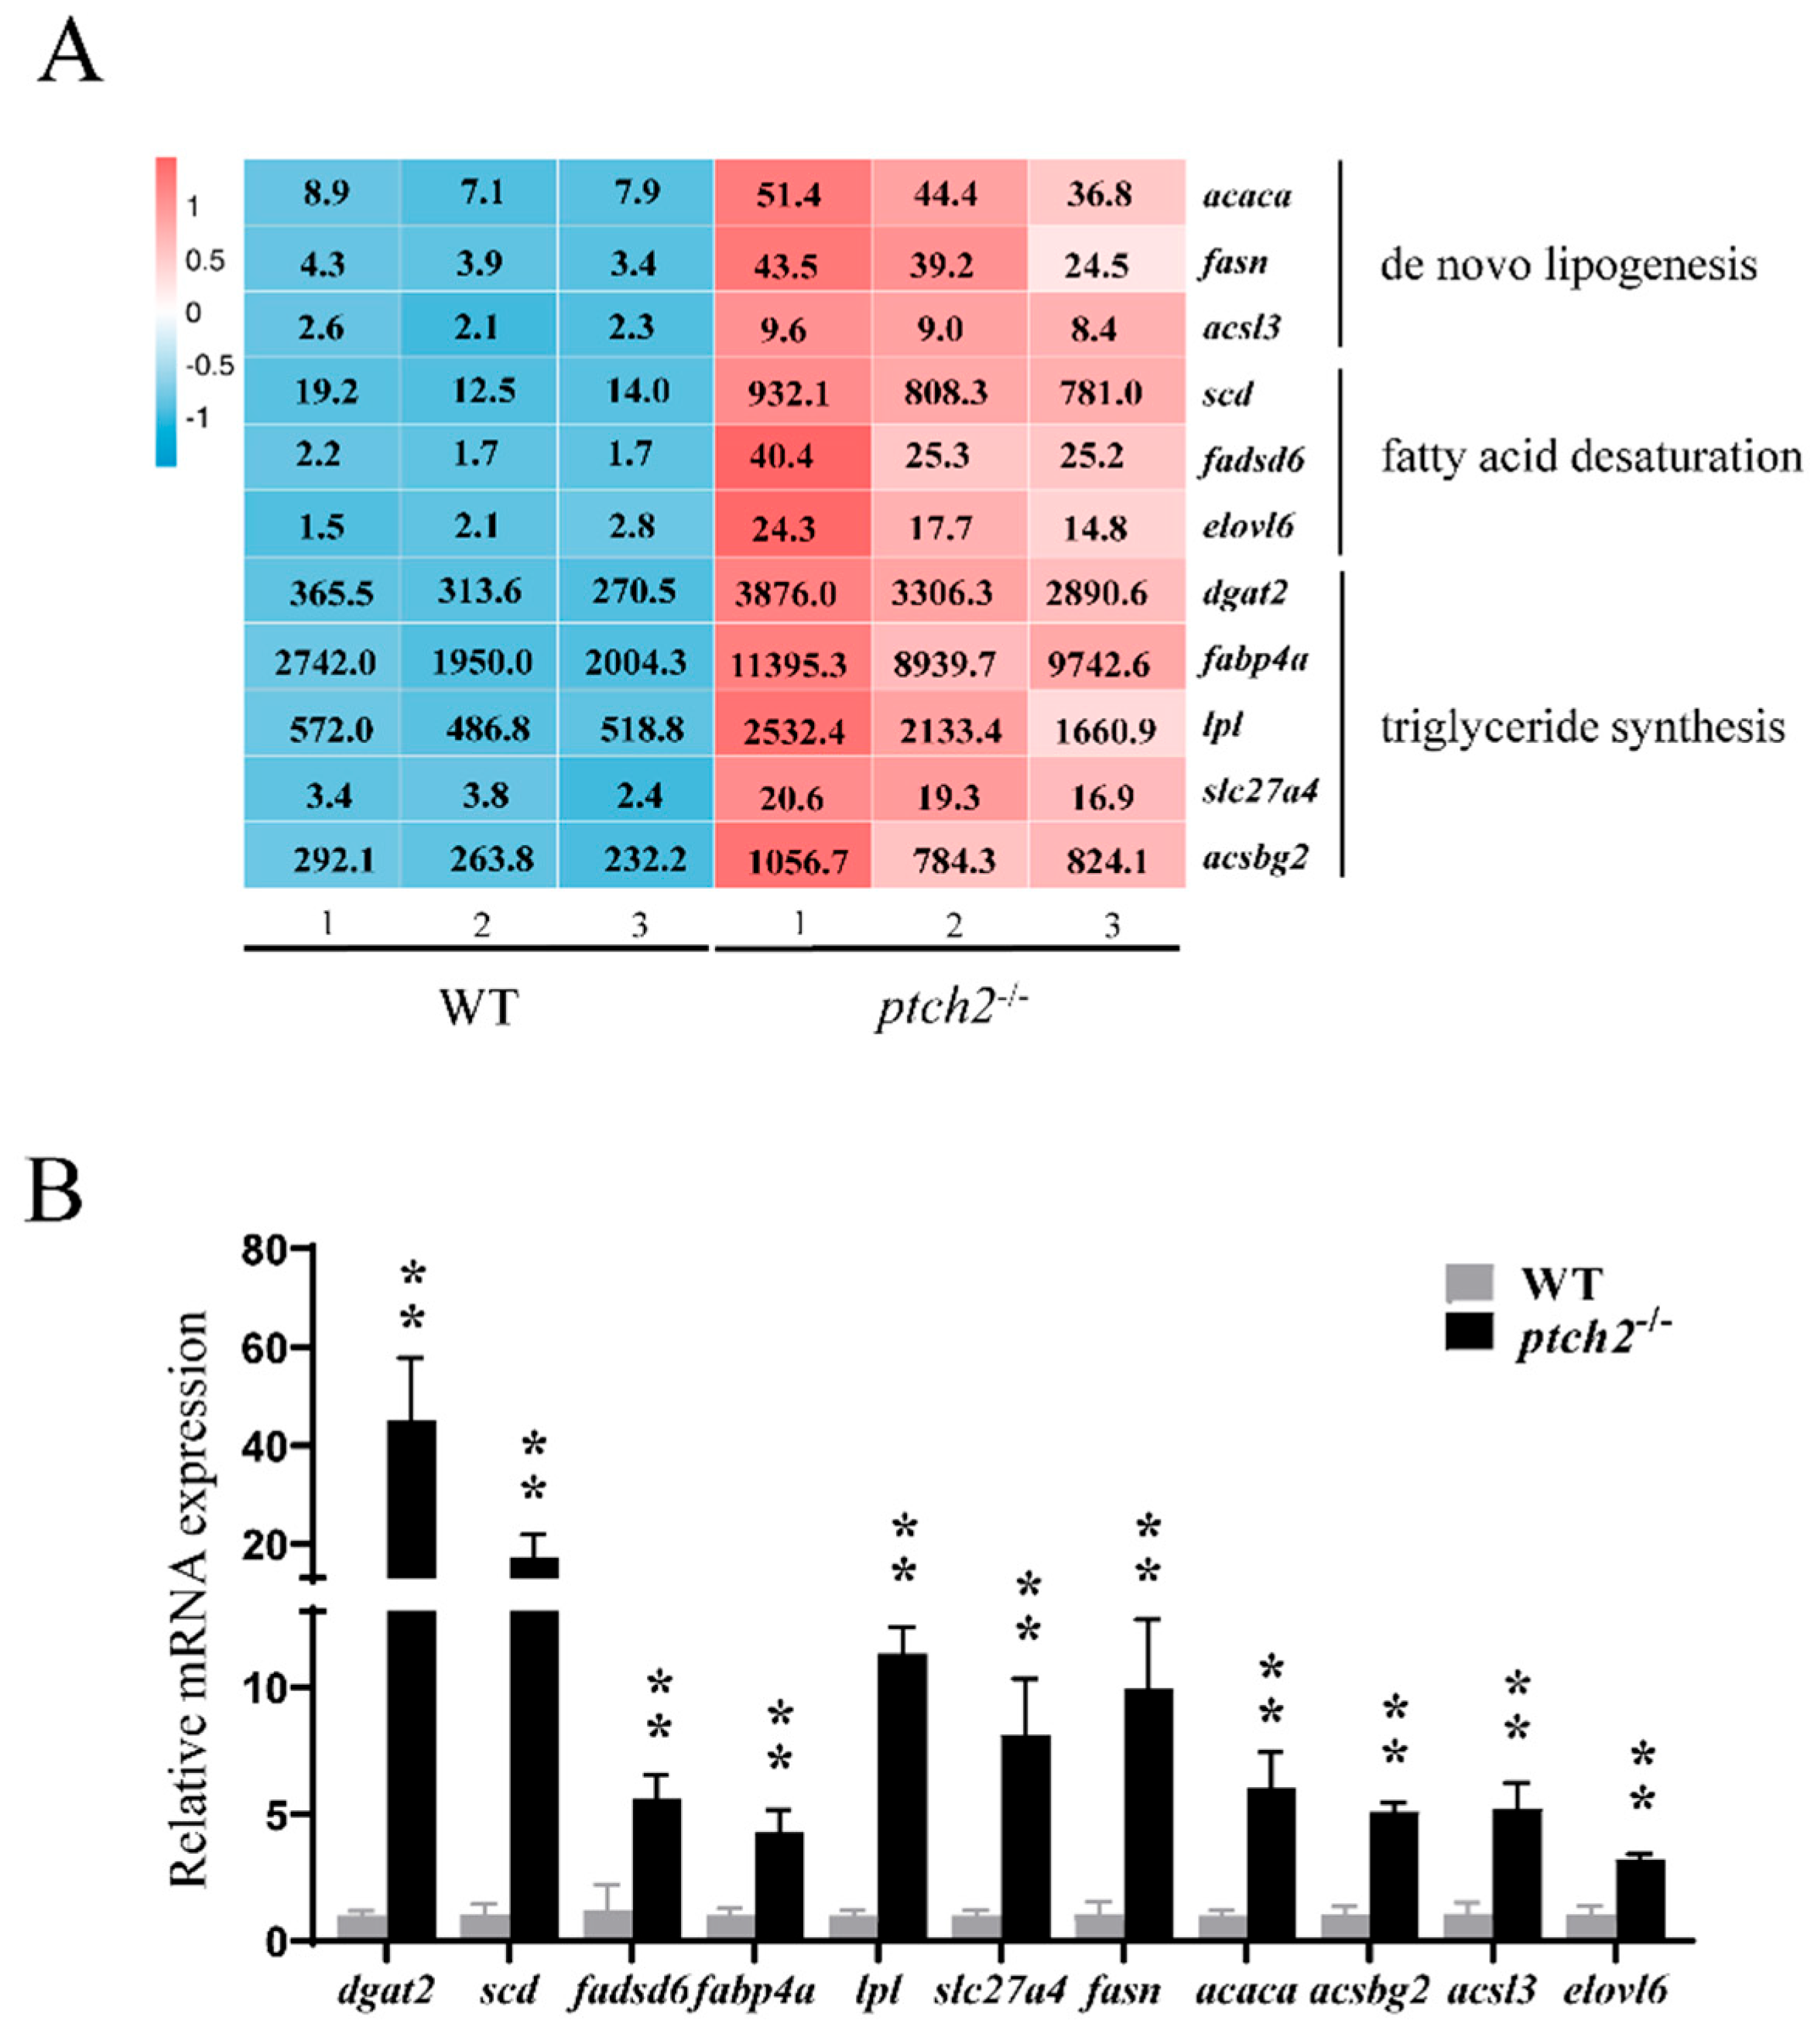
Figure 6.
Serum biochemical parameters of WT and ptch2-/- Nile tilapia at 90dah. (A) Glucose levels. (B) Liver function tests: alanine aminotransferase (ALT), aspartate aminotransferase (AST), alkaline phosphatase (ALP), total protein (TP) and albumin (ALB). (C) Lipase levels. (D) Lipid profile: triglycerides (TG), total cholesterol (TC), high density lipoprotein cholesterol (HDL) and low density lipoprotein cholesterol (LDL). Data are presented as mean ± SD (n = 3). Significant differences between WT and ptch2-/- groups were determined by Student’s t-test (*P < 0.05, **P < 0.01). NS: not significant.
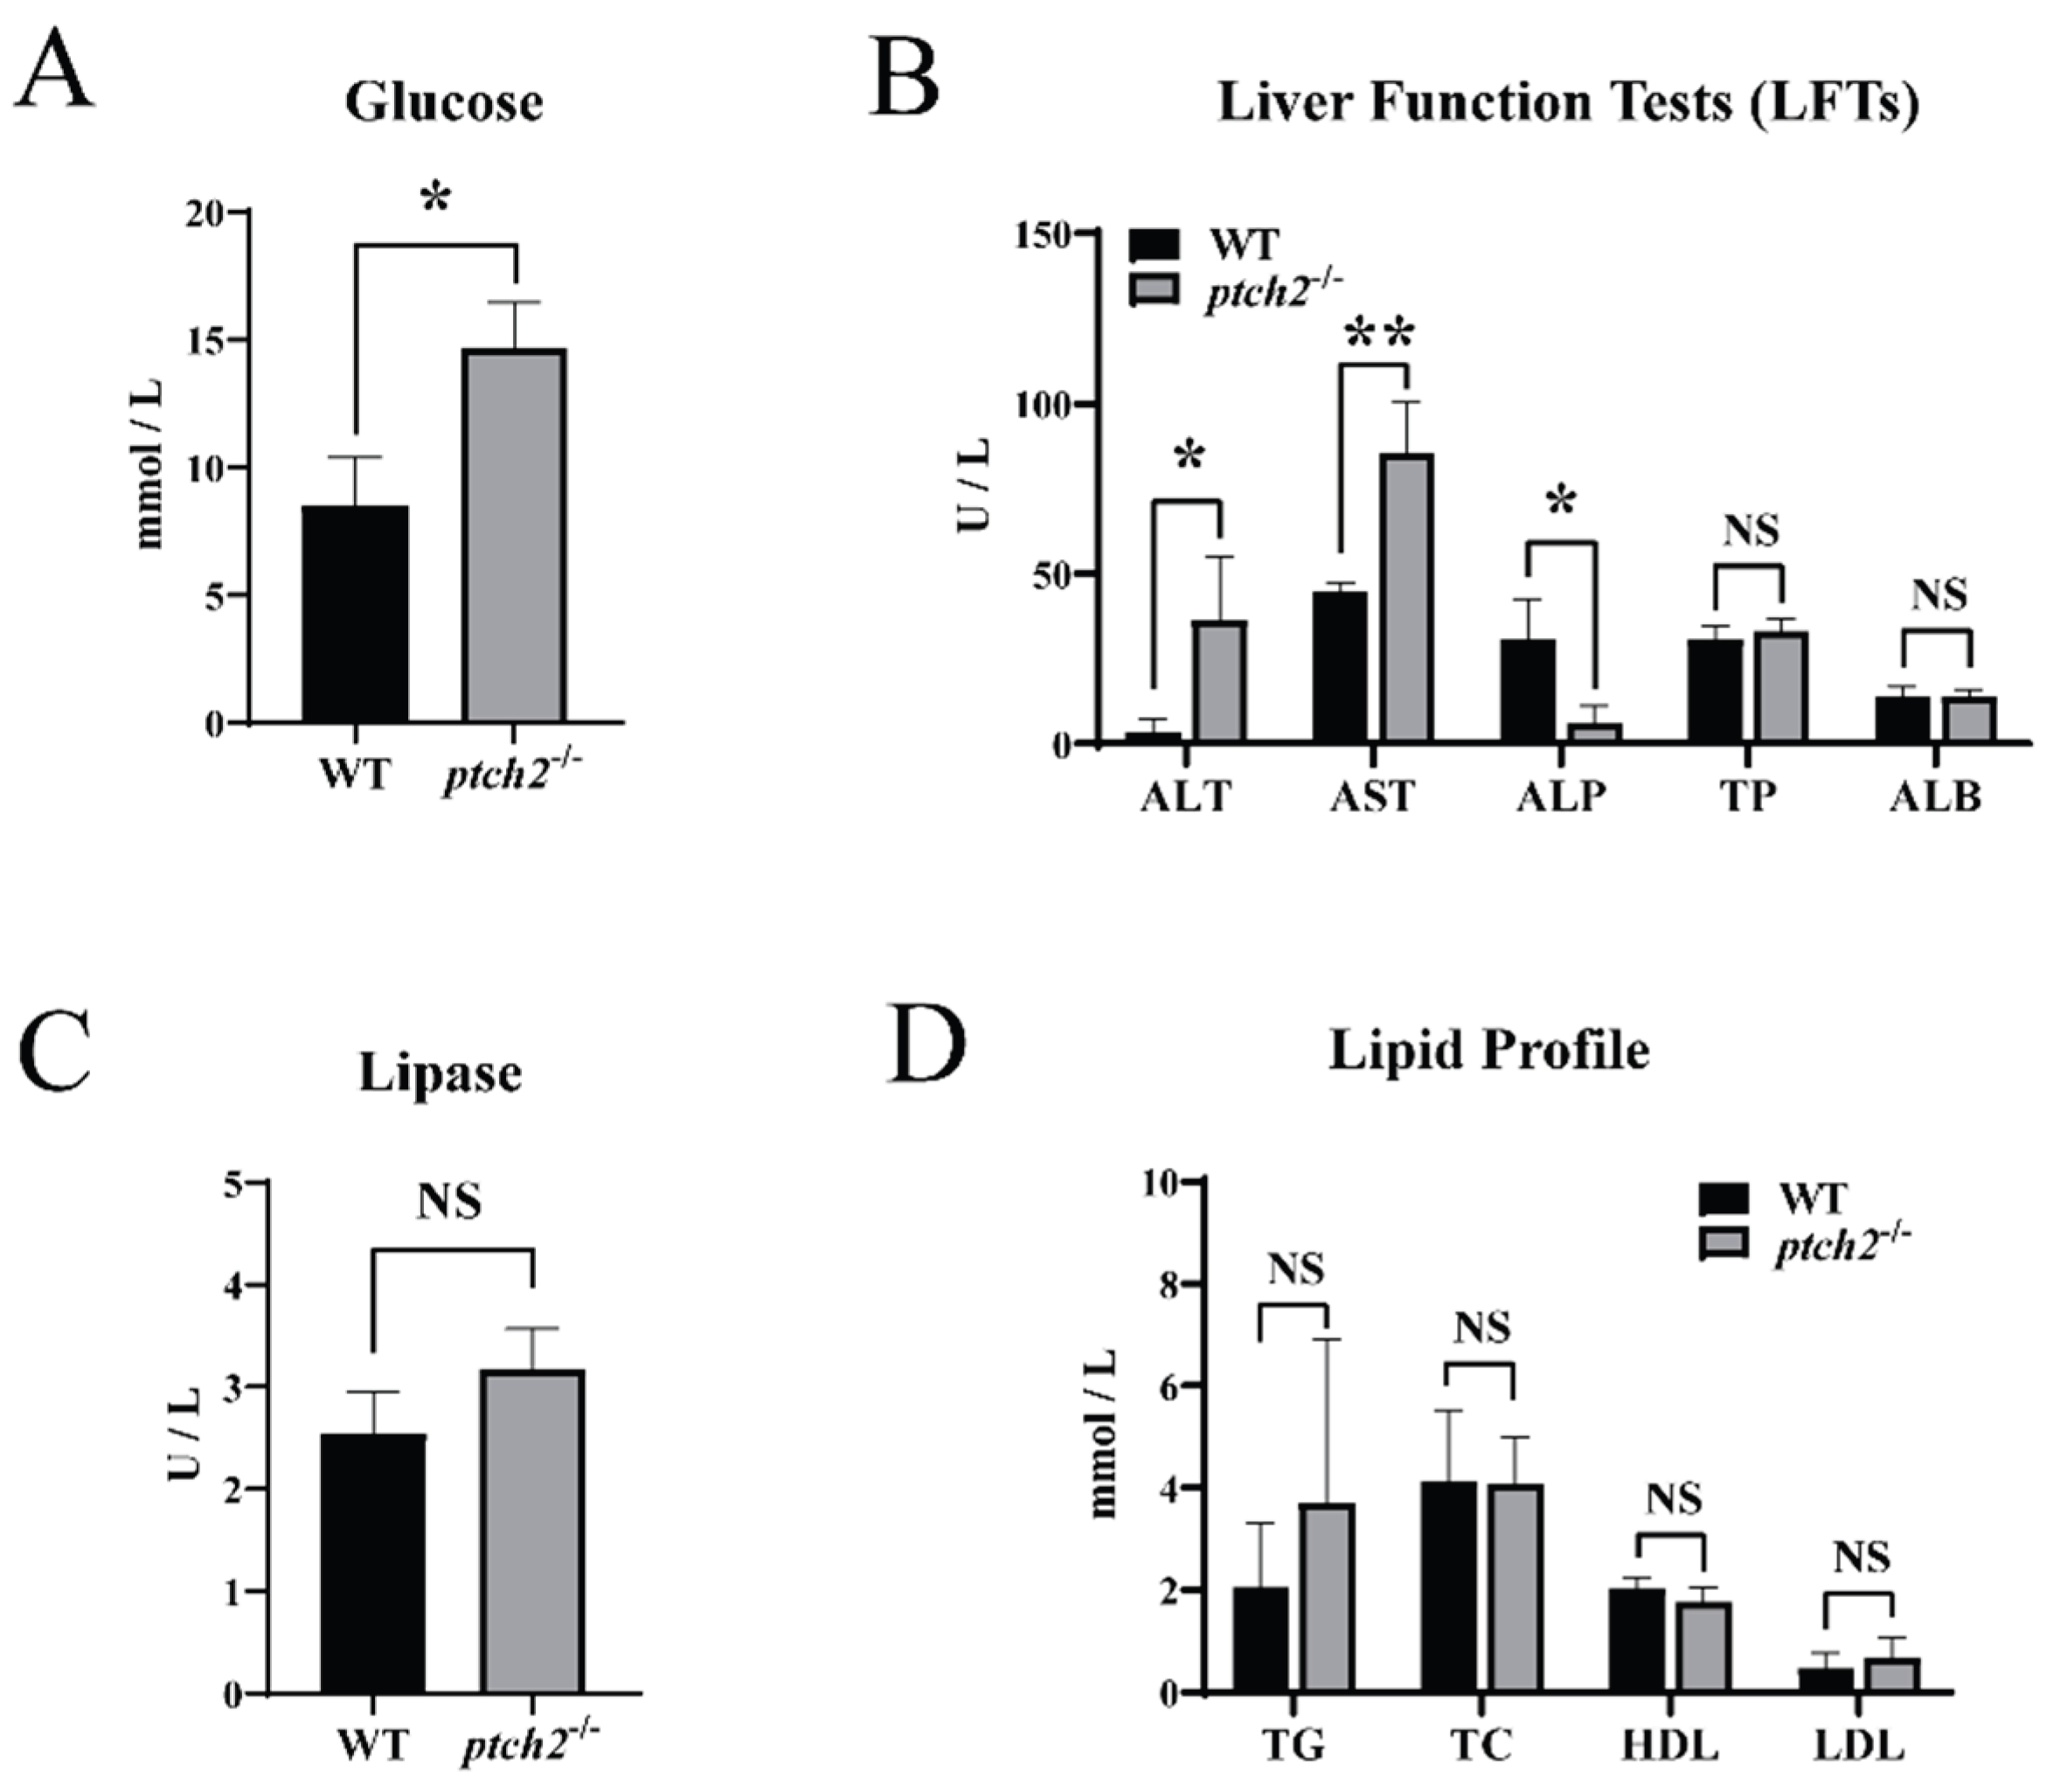

Table 1.
Amino acid sequence identity of Ptch among different species (%).
| Species | Full length |
Domain Ncyto TM (1-12) Ccyto |
|---|---|---|
| Ptch2 (Nile tilapia) | 100 | 100 100 100 |
| Ptch2 (Zebrafish) | 80 | 90 88 51 |
| PTCH2 (Human) | 65 | 56 67 44 |
| Ptch1 (Nile tilapia) | 62 | 67 61 29 |
Ncyto: N-terminal cytoplasmic domain; TM: transmembrane domain; Ccyto: C-terminal cytoplasmic domain.
Disclaimer/Publisher’s Note: The statements, opinions and data contained in all publications are solely those of the individual author(s) and contributor(s) and not of MDPI and/or the editor(s). MDPI and/or the editor(s) disclaim responsibility for any injury to people or property resulting from any ideas, methods, instructions or products referred to in the content. |
© 2025 by the authors. Licensee MDPI, Basel, Switzerland. This article is an open access article distributed under the terms and conditions of the Creative Commons Attribution (CC BY) license (http://creativecommons.org/licenses/by/4.0/).
Copyright: This open access article is published under a Creative Commons CC BY 4.0 license, which permit the free download, distribution, and reuse, provided that the author and preprint are cited in any reuse.


