
Submitted:
28 December 2025
Posted:
29 December 2025
You are already at the latest version
Abstract
This work investigates how internal flow in a steadily fed sessile water droplet on a heated substrate shifts between buoyancy-driven and Marangoni-driven convection. Using COMSOL Multiphysics 6.2, two regimes are simulated: one with only buoyancy forces and one that also includes a temperature dependent surface-tension gradient at the free surface. At substrate temperatures near 30◦C, the droplet develops a single circulation cell typical of buoyancy-controlled flow. As the substrate temperature increases towards 40◦C, strong Marangoni stresses appear, producing multiple counter-rotating vortices and increasing the characteristic velocity by roughly an order of magnitude. This clear transition to Marangoni-dominated transport enhances internal mixing, redistributes heat, and modifies the evaporation pattern at the interface. The results identify the temperature range where Marangoni forces overtake buoyancy and provide quantitative guidance for engineering thermally driven droplet flows in microfluidics, thermal management, and heat-assisted deposition processes.
Keywords:
sessile droplet evaporation
; marangoni effect
; buoyancy-driven flow
; multiphysics simulation
; COMSOL
; flow regime transition
1. Introduction/Literature Review
The evaporation of sessile droplets is a basic interfacial process [1] that appears in many technologies, including microelectronics cooling [2], inkjet printing [3], and advanced surface patterning [4,5]. The performance of these systems depends strongly on how heat and mass are transported inside the droplet [6], where laminar convection can either enhance or limit evaporation [7]. Understanding how buoyancy and thermocapillary (Marangoni) forces compete is therefore important, and numerical modeling is now a standard tool to resolve these coupled mechanisms [8]. This work builds on previous multiphysics models of sessile droplet evaporation [9,10] and connects them to a broader context that includes nanoporous evaporation and microscale heat sinks [33,36].
Recent studies have examined how engineered fluids and surfaces can be used to control heat transfer. For example, Hussain et al. studied nanofluids in solar collectors and showed that nanoparticle suspensions can increase thermal efficiency in solar energy systems [32]. Yesudasan demonstrated that, in hydrophilic nanopores, the critical diameter for continuous evaporation lies between 3 nm and 4 nm, which sets a geometric scale for stable phase change in nanoscale confinements [33]. More recently, Yesudasan analyzed the thermal dynamics of heat pipes with sub-critical nanopores and showed that sub-critical diameters can strongly influence capillary flow and local evaporation balance [34]. Mohammed and Yesudasan used molecular dynamics simulations to examine how water structure and transport properties change inside nanopores [35], and related work on MEMS heat sinks has shown how small-scale channel and fin designs can enhance or limit overall thermo-hydraulic performance [36]. Together, these studies highlight that evaporation and convection are very sensitive to geometry and confinement at micro- and nanoscales.
The foundational physics of internal flow can be understood through a hierarchy of complexity, starting with buoyancy-driven natural convection. Akkuş et al. showed that a steadily fed hemispherical droplet can sustain a single recirculating cell when surface-tension gradients are absent, revealing a simple but limited buoyancy-controlled regime [11,12]. More detailed models add additional physical effects. Barmi and Meinhart [13] and Xu and Luo [14] reported that evaporation can evolve from an early Marangoni-dominated stage to a later capillary-dominated stage [15,16,17], although some models neglect buoyancy in the surrounding vapor [18]. Demirci et al. [19], together with earlier work by Erbil [20] and Ajaev [21], emphasized that thermocapillarity can dominate internal flow when droplets evaporate into their own vapor, but they also highlighted the uncertainty in kinetic parameters such as the mass accommodation coefficient.
At smaller length scales, additional transitions appear. Semenov et al. used simulations to show that pinned droplets can switch between diffusion-limited and kinetic-limited regimes depending on size, and Brutin summarized related phenomena in a comprehensive monograph on droplet wetting and evaporation [22,23]. Integral evaporation metrics have also been studied: Picknett and Bexon [24] and Nguyen and Nguyen [25] derived expressions for droplet lifetime under different evaporation modes, showing a nonlinear dependence on contact angle but assuming purely diffusive, isothermal conditions. More complete coupling between fluid flow and heat transfer was reported by Kang et al. [26], who included evaporative cooling, internal thermocapillarity, and external natural convection. Several recent studies have reported complementary insights into thermal transport and evaporation phenomena in micro- and nanoscale systems using both numerical and molecular approaches [32,33,34,35,36]. Christy et al. examined binary-mixture droplets and found rich flow transitions as composition and evaporation progressed [27]. These studies clarify how convection can both promote evaporation (by mixing cooler liquid with warmer regions) and impede it (by enhancing evaporative cooling at the surface).
Across these works, a consistent picture emerges. Pure buoyancy-driven flow, as in the reference case by Akkuş et al. [11], is rarely realized in practical systems that usually have some degree of Marangoni forcing. More recent experiments and simulations, such as those by Rocha et al. [28], show that solutal Marangoni effects can even dominate over thermal Marangoni effects in some mixtures. Many studies [13,19,26] identify thermocapillarity as a first-order mechanism controlling internal circulation and overall evaporation rates [29]. The dominant physics depends on contact angle, substrate superheat, and ambient composition [30,31,37], and the relative importance of each mechanism can change over time as the droplet shape evolves [13].
Even with this progress, important gaps remain. Flow-regime maps that clearly separate buoyancy-, thermocapillary-, and capillary-dominated regimes are still incomplete [38]. The quantitative contributions of each mechanism to heat and mass transfer are also not fully isolated across parameter space [39]. There is still uncertainty in key parameters such as the surface-tension temperature coefficient, which can significantly change predicted Marangoni strengths [40]. The present COMSOL model is designed to address some of these gaps by starting from a validated buoyancy-only baseline [11] and then adding Marangoni stresses and more detailed evaporation boundary conditions. This framework allows a controlled comparison between the two convective regimes and supports systematic studies of wall temperature and contact angle.
2. Methods and Materials
COMSOL Multiphysics 6.2 is used to model steady-state evaporation from a sessile water droplet on a heated wall in a two-dimensional axisymmetric domain. The axisymmetric formulation allows three-dimensional effects to be represented in a simpler 2D geometry by revolving the solution around the central axis. The computational domain is a hemispherical region subdivided into 18 subdomains, 55 boundaries, and 38 vertices, with each wedge sector spanning . The central region represents the liquid droplet. The geometry is built step by step: a primary circular sector of is created, Boolean operations are applied to subtract the inlet, mirror operations extend the domain, and a final union operation assembles the full axisymmetric configuration.
A small circular inlet with radius mm at the center of the substrate provides a continuous mass supply at a controlled temperature. This inlet is subtracted from the main circle during the geometry construction. The key geometric features are summarized in Figure 1.
The mesh is generated using a free quadrilateral scheme with boundary-layer refinement near the inlet and along the free surface. The final mesh contains 6888 elements, with 6024 triangles in transition regions and 864 quadrilaterals in more regular zones. The boundary layers are refined to capture sharp gradients in velocity and temperature along the curved interface and near the inlet, as illustrated in Figure 2, Figure 3 and Figure 4. A mesh-refinement study with an “extra fine” setting increases the element count to 21,458 triangles and 1440 quadrilaterals. The difference in key output quantities between the finest two meshes remains below 1 %, showing that the chosen resolution is sufficient.
The fluid flow inside the droplet is modeled with the Laminar Flow interface. The governing equations are the stationary, incompressible Navier–Stokes equations with gravity applied in the vertical z-direction. This captures natural convection due to density variations as well as forced convection due to the inlet flow. Heat transfer is modeled with the Heat Transfer in Fluids interface, accounting for both conduction and convection within the liquid. A reference temperature of K is used.
Marangoni stresses at the free surface are introduced through a temperature-dependent surface-tension relation
where is the surface tension at ambient temperature, is the surface-tension temperature coefficient, and the equilibrium contact angle is set to . This relation is applied only at the interface, and COMSOL automatically converts the gradient of into a shear stress along the free surface.
The boundary conditions are chosen to match the physical system, as illustrated in Figure 5. At the inlet, a normal inflow velocity is applied,
with the total mass flow adjusted to balance evaporation. Here, is the liquid density evaluated at the wall temperature. At the free surface, a normal outflow velocity condition is used,
together with the Marangoni shear stress generated by the temperature-dependent surface tension. The substrate is modeled as a no-slip wall with fixed temperature , and the symmetry axis at enforces zero normal velocity and zero normal heat flux.
Thermally, the heated wall is maintained at , while the free surface experiences both convective heat loss and evaporative cooling:
The axis of symmetry is adiabatic. All correlations for , , and are implemented via user-defined variables, and a small regularization parameter is introduced in denominators to avoid numerical singularities.
The liquid is water with temperature-dependent density, viscosity, thermal conductivity, and specific heat defined via interpolation from to . Ambient air properties (density, thermal conductivity, viscosity, and specific heat) are treated as constants. Key derived variables are listed in Table 1, and constants are listed in Table 2.
The solver uses a stationary study with a temperature sweep from to K with 11 equally spaced values. A direct solver with Newton–Raphson iterations, adaptive damping, and solution-based convergence is employed, solving about degrees of freedom. After convergence, the solution is post-processed to compute local evaporative flux, total evaporation rate, and global circulation patterns. These numerical procedures are similar in spirit to those used in earlier droplet-evaporation studies [41,42].
3. Results and Discussion
3.1. Flow-Regime Transition: Buoyancy to Marangoni Dominance
Figure 6 shows the velocity magnitude and streamlines for the buoyancy-only case at (). The flow is driven by density variations: warm fluid near the base rises along the axis, cools near the free surface, and then moves downward along the interface, forming a single toroidal vortex. The peak velocity is on the order of , which is typical of buoyancy-dominated convection in small droplets [41,42].
When Marangoni stresses are added, the flow field changes dramatically, as shown in Figure 7. The interfacial temperature gradient generates a surface-tension gradient that pulls fluid along the surface from the warm apex (where surface tension is lower) to the cooler edge (where surface tension is higher). This surface motion drives a set of counter-rotating vortices inside the droplet. The characteristic velocity rises to , consistent with a Marangoni-dominated regime [43,44]. In this regime, buoyancy still contributes, but the main circulation pattern is set by the interfacial shear.
3.2. Temperature Distribution and Thermal Boundary Layers
The different flow structures lead to different temperature fields. In the buoyancy-only case (Figure 8 and Figure 9), the isotherms are almost horizontal and stacked, which means that conduction is the main heat-transfer mechanism, with convection playing a secondary role. The single vortex slightly distorts the isotherms but does not strongly mix the entire droplet, so temperature gradients remain relatively thick and smooth [41,42].
In the combined buoyancy–Marangoni case, the temperature distribution becomes more complex. As shown in Figure 10 and Figure 11, the isotherms bend strongly towards the free surface. Warm fluid is rapidly pulled along the interface and redistributed, which thins the thermal boundary layer and promotes stronger mixing inside the droplet. This pattern is consistent with previous observations of thermocapillary-driven convection in evaporating droplets [10,28]. The resulting field is far from stratified, and the interior temperature becomes more uniform due to the multiple vortices.
3.3. Evaporative Flux Distribution and Mass Transfer
The local evaporative mass flux depends on both surface temperature and vapor concentration above the droplet. Because Marangoni convection changes the surface temperature distribution, it also modifies the evaporation pattern. Over the studied range to K, the average evaporative mass flux and total axisymmetric mass-loss rate are summarized in Table 3 and Table 4.
Figure 12 compares the average evaporative flux as a function of for the two cases. Both show a gradual increase with wall temperature, but the combined buoyancy–Marangoni case consistently has a higher flux at the same . This indicates that stronger internal circulation refreshes the interface and sustains a larger driving force for evaporation, in line with observations in nanofluid-based collectors [32] and nanopore evaporation studies [33,34].
Figure 13 shows the total evaporative mass rate. The trend is similar: both curves rise with temperature, but the Marangoni-enabled configuration yields substantially higher total evaporation rates. The relative increase is on the order of 40–50 % over the range of temperatures studied. This behavior is analogous to the enhanced heat and mass transfer that has been reported in MEMS heat sinks with optimized microchannel and fin designs [36] and in nanoporous systems that support continuous evaporation [33].
4. Conclusions
This study compares buoyancy-driven and Marangoni-driven convection in a steadily fed sessile water droplet on a heated substrate using a two-dimensional axisymmetric COMSOL model. In the buoyancy-only case, the droplet develops a single toroidal vortex with peak velocities on the order of and a nearly stratified temperature field. When Marangoni stresses are added, the internal flow reorganizes into multiple counter-rotating vortices with velocities on the order of . The temperature field becomes strongly distorted near the free surface, thermal boundary layers thin, and both the average evaporative mass flux and the total evaporation rate increase by roughly 40–50 % over the studied wall-temperature range. These results show that Marangoni stresses can dominate buoyancy even for modest superheats.
The present findings are consistent with broader trends in microscale and nanoscale heat-transfer research. Nanofluid-based solar collectors use enhanced thermal properties of suspensions to improve heat transfer in solar systems [32], while nanopore studies identify critical diameters for continuous evaporation and stable phase change [33,34]. Molecular dynamics simulations of confined water [35] and thermo-hydraulic analyses of MEMS heat sinks [36] also show that small changes in geometry and surface conditions can cause large changes in flow and heat-transfer behavior. In the same spirit, the current droplet model demonstrates that adding realistic Marangoni stresses is essential when predicting evaporation and cooling performance in practical applications such as microfluidic cooling, additive manufacturing, and thermal management of compact electronic devices.
Nomenclature
| Surface tension [N/m] | |
| Surface tension at ambient temperature [N/m] | |
| Surface-tension temperature coefficient [N/(mK)] | |
| T | Temperature [K] |
| Ambient temperature [K] | |
| Substrate wall temperature [K] | |
| Inlet velocity [m/s] | |
| Evaporative mass flux [kg/(s)] | |
| Latent heat of vaporization [J/kg] | |
| Mass-transfer coefficient [m/s] | |
| Natural convection heat-transfer coefficient [W/(K)] | |
| Rayleigh number [–] | |
| Nusselt number [–] | |
| Pr | Prandtl number [–] |
| Lewis number [–] | |
| r | Radius [mm] |
| g | Gravitational acceleration [] |
Subscripts
| in | inlet |
| out | outlet |
| w | wall |
| amb | ambient |
References
- Pan, Z.; Weibel, J. A.; Garimella, S. V. Influence of surface wettability on transport mechanisms governing water droplet evaporation. Langmuir 2014, 30(32), 9726–9730. [Google Scholar] [CrossRef]
- Antonov, D. V.; et al. Heating and evaporation of sessile droplets: Simple and advanced models. Langmuir 2024, 40(5), 2656–2663. [Google Scholar] [CrossRef]
- Dong, S.; et al. Inkjet printing synthesis of sandwiched structured ionic liquid–carbon nanotube–graphene film: Toward disposable electrode for sensitive heavy metal detection in environmental water samples. Ind. Eng. Chem. Res. 2017, 56(7), 1696–1703. [Google Scholar] [CrossRef]
- Deegan, R. D.; et al. Capillary flow as the cause of ring stains from dried liquid drops. Nature 1997, 389, 827–829. [Google Scholar] [CrossRef]
- Sefiane, K. Patterns from drying drops. Adv. Colloid Interface Sci. 2014, 206, 372–381. [Google Scholar] [CrossRef]
- Song, J.; et al. Optimizing coffee ring patterns through enhanced thermal control: Effects of artificial temperature gradients. J. Alloys Compd. 2025, 1039, 183112. [Google Scholar] [CrossRef]
- Marín, Á. G.; Gelderblom, H.; Lohse, D.; Snoeijer, J. H. Rush-hour in evaporating coffee drops. Phys. Fluids 2011, 23, 091111. [Google Scholar] [CrossRef]
- Kumar, M.; Bhardwaj, R. A combined computational and experimental investigation on evaporation of a sessile water droplet on a heated hydrophilic substrate. Int. J. Heat Mass Transfer 2018, 122, 1223–1238. [Google Scholar] [CrossRef]
- Yang, K.; Hong, F.; Cheng, P. A fully coupled numerical simulation of sessile droplet evaporation using arbitrary Lagrangian–Eulerian formulation. Int. J. Heat Mass Transfer 2014, 70, 409–420. [Google Scholar] [CrossRef]
- Kazemi, M. A.; Saber, S.; Elliott, J. A. W.; Nobes, D. S. Marangoni convection in an evaporating water droplet. Int. J. Heat Mass Transfer 2021, 181, 122042. [Google Scholar] [CrossRef]
- Akkus, Y.; Çetin, B.; Dursunkaya, Z. Modeling of evaporation from a sessile constant shape droplet. ASME 2017 15th Int. Conf. Nanochannels, Microchannels, and Minichannels, 2017. [Google Scholar]
- David, S.; Sefiane, K.; Tadrist, L. Experimental investigation of the effect of thermal properties of the substrate in the wetting and evaporation of sessile drops. Colloids Surf. A 2007, 298, 108–114. [Google Scholar] [CrossRef]
- Barmi, M. R.; Meinhart, C. D. Convective flows in evaporating sessile droplets. J. Phys. Chem. B 2014, 118, 2414–2421. [Google Scholar] [CrossRef] [PubMed]
- Xu, X.; Luo, J. Marangoni flow in an evaporating water droplet. Appl. Phys. Lett. 2007, 91, 124102. [Google Scholar] [CrossRef]
- Yu, D. I.; et al. Dynamics of contact line depinning during droplet evaporation based on thermodynamics. Langmuir 2015, 31, 1950–1957. [Google Scholar] [CrossRef]
- Larson, R. G. Transport and deposition patterns in drying sessile droplets. AIChE J. 2014, 60, 1538–1571. [Google Scholar] [CrossRef]
- Kim, D.-O.; et al. Deposition of colloidal drops containing ellipsoidal particles: Competition between capillary and hydrodynamic forces. Langmuir 2016, 32, 11899–11906. [Google Scholar] [CrossRef]
- Aboubakri, A.; et al. Computational and experimental investigations on the evaporation of single and multiple elongated droplets. Chem. Eng. J. Adv. 2022, 10, 100255. [Google Scholar] [CrossRef]
- Demirci, E. O.; Akdag, O.; Akkus, Y. Transport mechanisms governing the evaporation of a sessile droplet in its pure vapor environment. 23rd IEEE ITherm, 2024. [Google Scholar]
- Erbil, H. Y. Evaporation of pure liquid sessile and spherical suspended drops: A review. Adv. Colloid Interface Sci. 2012, 170, 67–86. [Google Scholar] [CrossRef]
- Ajaev, V. S. Spreading of thin volatile liquid droplets on uniformly heated surfaces. J. Fluid Mech. 2005, 528, 279–296. [Google Scholar] [CrossRef]
- Semenov, S.; Starov, V. M.; Rubio, R. G.; Velarde, M. G. Computer simulations of evaporation of pinned sessile droplets: Influence of kinetic effects. Langmuir 2012, 28, 15203–15211. [Google Scholar] [CrossRef]
- Brutin, D. Droplet Wetting and Evaporation; Elsevier, 2015. [Google Scholar]
- Picknett, R. G.; Bexon, R. The evaporation of sessile or pendant drops in still air. J. Colloid Interface Sci. 1977, 61, 336–350. [Google Scholar] [CrossRef]
- Nguyen, T. A. H.; Nguyen, A. V. On the lifetime of evaporating sessile droplets. Langmuir 2012, 28, 1924–1930. [Google Scholar] [CrossRef]
- Kang, F.; Shen, Y.; Cheng, Y.; Li, N. Lifetime prediction of sessile droplet evaporation with coupled fields. Ind. Eng. Chem. Res. 2021, 60, 15782–15792. [Google Scholar] [CrossRef]
- Christy, J. R. E.; Hamamoto, Y.; Sefiane, K. Flow transition within an evaporating binary mixture sessile drop. Phys. Rev. Lett. 2011, 106, 205701. [Google Scholar] [CrossRef]
- Rocha, D.; et al. Evaporating sessile droplets: Solutal Marangoni effects overwhelm thermal Marangoni flow. J. Fluid Mech. 2025, 1013, A39. [Google Scholar] [CrossRef]
- Lim, E.; Hung, Y. M. Thermocapillary flow in evaporating thin liquid films with long-wave evolution model. Int. J. Heat Mass Transfer 2014, 73, 849–858. [Google Scholar] [CrossRef]
- Sefiane, K.; Moffat, J. R.; Matar, O. K.; Craster, R. V. Self-excited hydrothermal waves in evaporating sessile drops. Appl. Phys. Lett. 2008, 93, 074103. [Google Scholar] [CrossRef]
- Colinet, P.; et al. Interfacial turbulence in evaporating liquids: Theory and preliminary results of the ITEL-master 9 sounding rocket experiment. Adv. Space Res. 2003, 32, 119–127. [Google Scholar] [CrossRef]
- Hussain, M. A.; Yesudasan, S.; Chacko, S. Nanofluids for solar thermal collection and energy conversion. Preprints preprint article 2020. [Google Scholar]
- Yesudasan, S. The critical diameter for continuous evaporation is between 3 and 4 nm for hydrophilic nanopores. Langmuir 2022, 38(21), 6550–6560. [Google Scholar] [CrossRef]
- Yesudasan, S. Thermal dynamics of heat pipes with sub-critical nanopores; [physics.flu-dyn]; arXiv, 2024. [Google Scholar]
- Mohammed, M. M.; Yesudasan, S. Molecular dynamics study on the properties of liquid water in confined nanopores: Structural, transport, and thermodynamic insights. Proc. ASEE Northeast Section Conf., 2025; pp. 1–7. [Google Scholar]
- Hotchandani, V.; Mathew, B.; Yesudasan, S.; Chacko, S. Thermo-hydraulic characteristics of novel MEMS heat sink. Microsyst. Technol. 2021, 27(1), 145–157. [Google Scholar] [CrossRef]
- Oron, A.; Davis, S. H.; Bankoff, S. G. Long-scale evolution of thin liquid films. Rev. Mod. Phys. 1997, 69, 931–980. [Google Scholar] [CrossRef]
- Tanner, L. H. The spreading of silicone oil drops on horizontal surfaces. J. Phys. D: Appl. Phys. 1979, 12, 1473–1484. [Google Scholar] [CrossRef]
- Snoeijer, J. H.; Andreotti, B. A microscopic view on contact angle selection. Phys. Fluids 2008, 20, 057101. [Google Scholar] [CrossRef]
- Huh, C.; Scriven, L. E. Hydrodynamic model of steady movement of a solid/liquid/fluid contact line. J. Colloid Interface Sci. 1971, 35, 85–101. [Google Scholar] [CrossRef]
- Hu, H.; Larson, R. G. Evaporation of a sessile droplet on a substrate. J. Phys. Chem. B 2002, 106, 1334–1344. [Google Scholar] [CrossRef]
- Savino, R.; Paterna, D.; Favaloro, N. Buoyancy and Marangoni effects in an evaporating drop. J. Thermophys. Heat Transfer 2002, 16, 562–574. [Google Scholar] [CrossRef]
- Leenaars, A. F. M.; Huethorst, J. A. M.; van Oekel, J. J. Marangoni drying: A new extremely clean drying process. Langmuir 1990, 6, 1701–1703. [Google Scholar] [CrossRef]
- Karpitschka, S.; Liebig, F.; Riegler, H. Marangoni contraction of evaporating sessile droplets of binary mixtures. Langmuir 2017, 33, 4682–4687. [Google Scholar] [CrossRef] [PubMed]
Figure 1.
Axisymmetric geometry used in the droplet-evaporation model. The symmetry axis lies at , with a liquid inlet at and an outer radial boundary at . The curved interface represents the evaporating surface, and the substrate is maintained at .
Figure 1.
Axisymmetric geometry used in the droplet-evaporation model. The symmetry axis lies at , with a liquid inlet at and an outer radial boundary at . The curved interface represents the evaporating surface, and the substrate is maintained at .
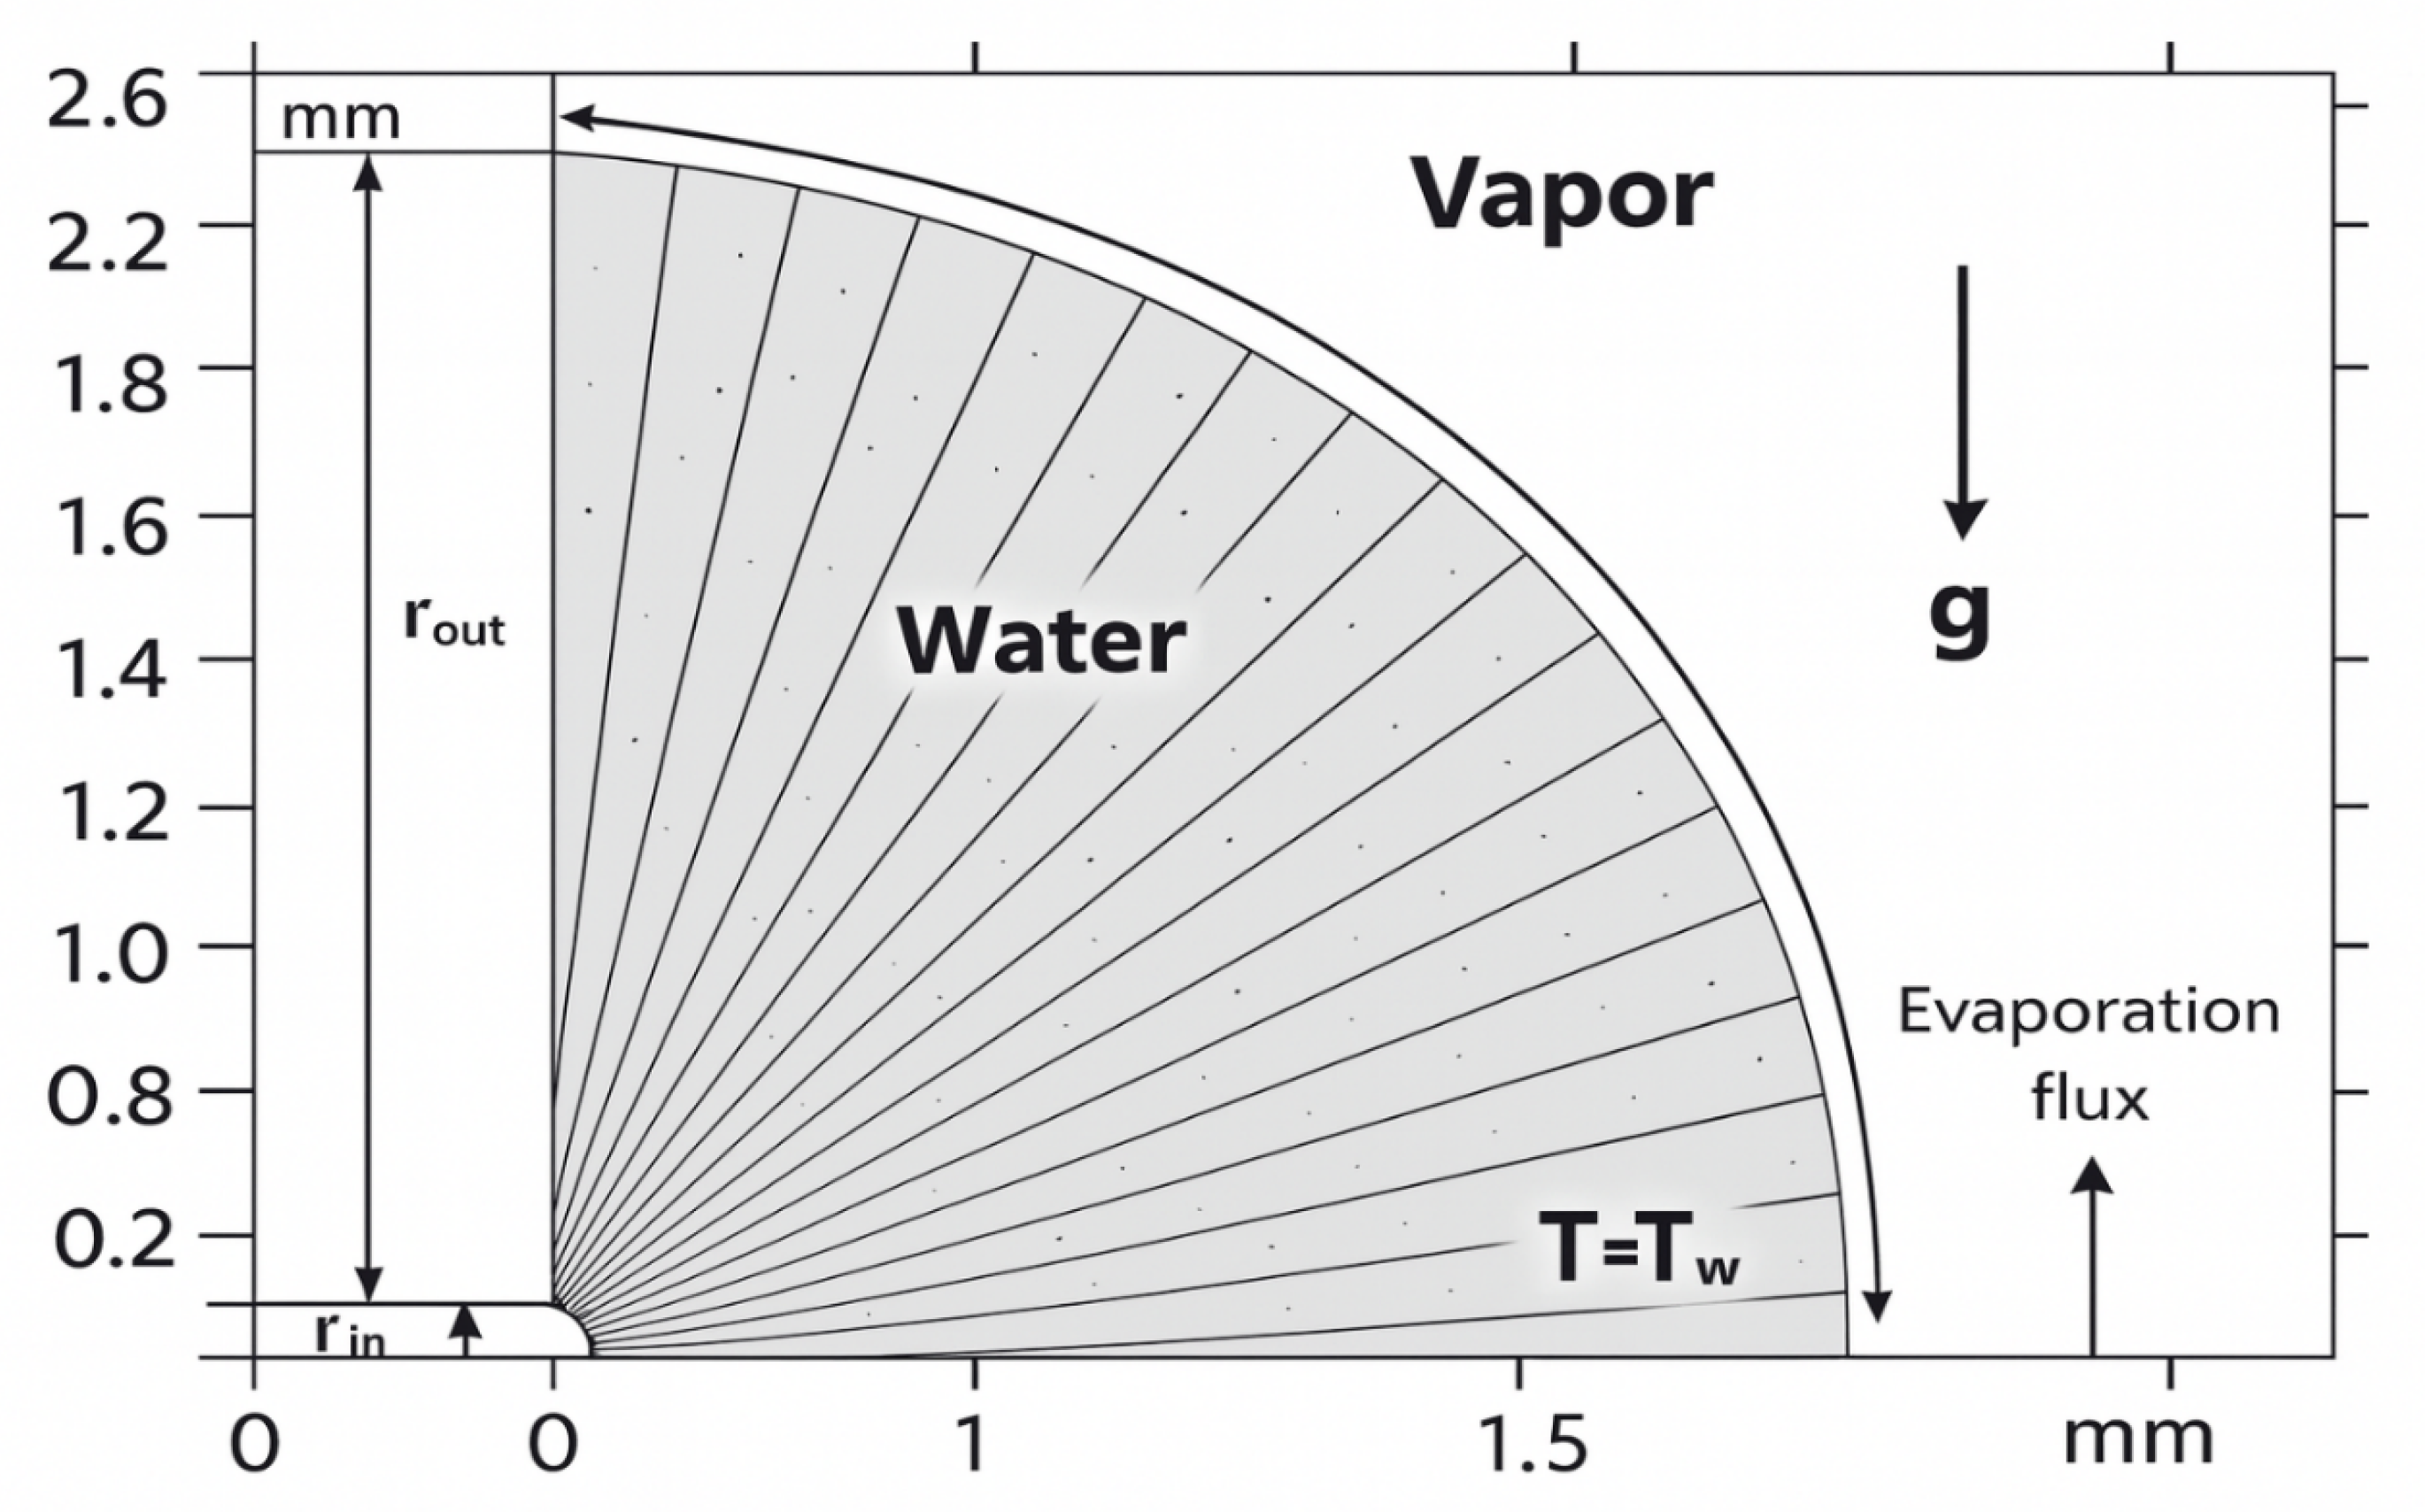
Figure 2.
Boundary-layer mesh near the liquid inlet at the droplet base. The refined elements resolve steep gradients close to the inlet.
Figure 2.
Boundary-layer mesh near the liquid inlet at the droplet base. The refined elements resolve steep gradients close to the inlet.
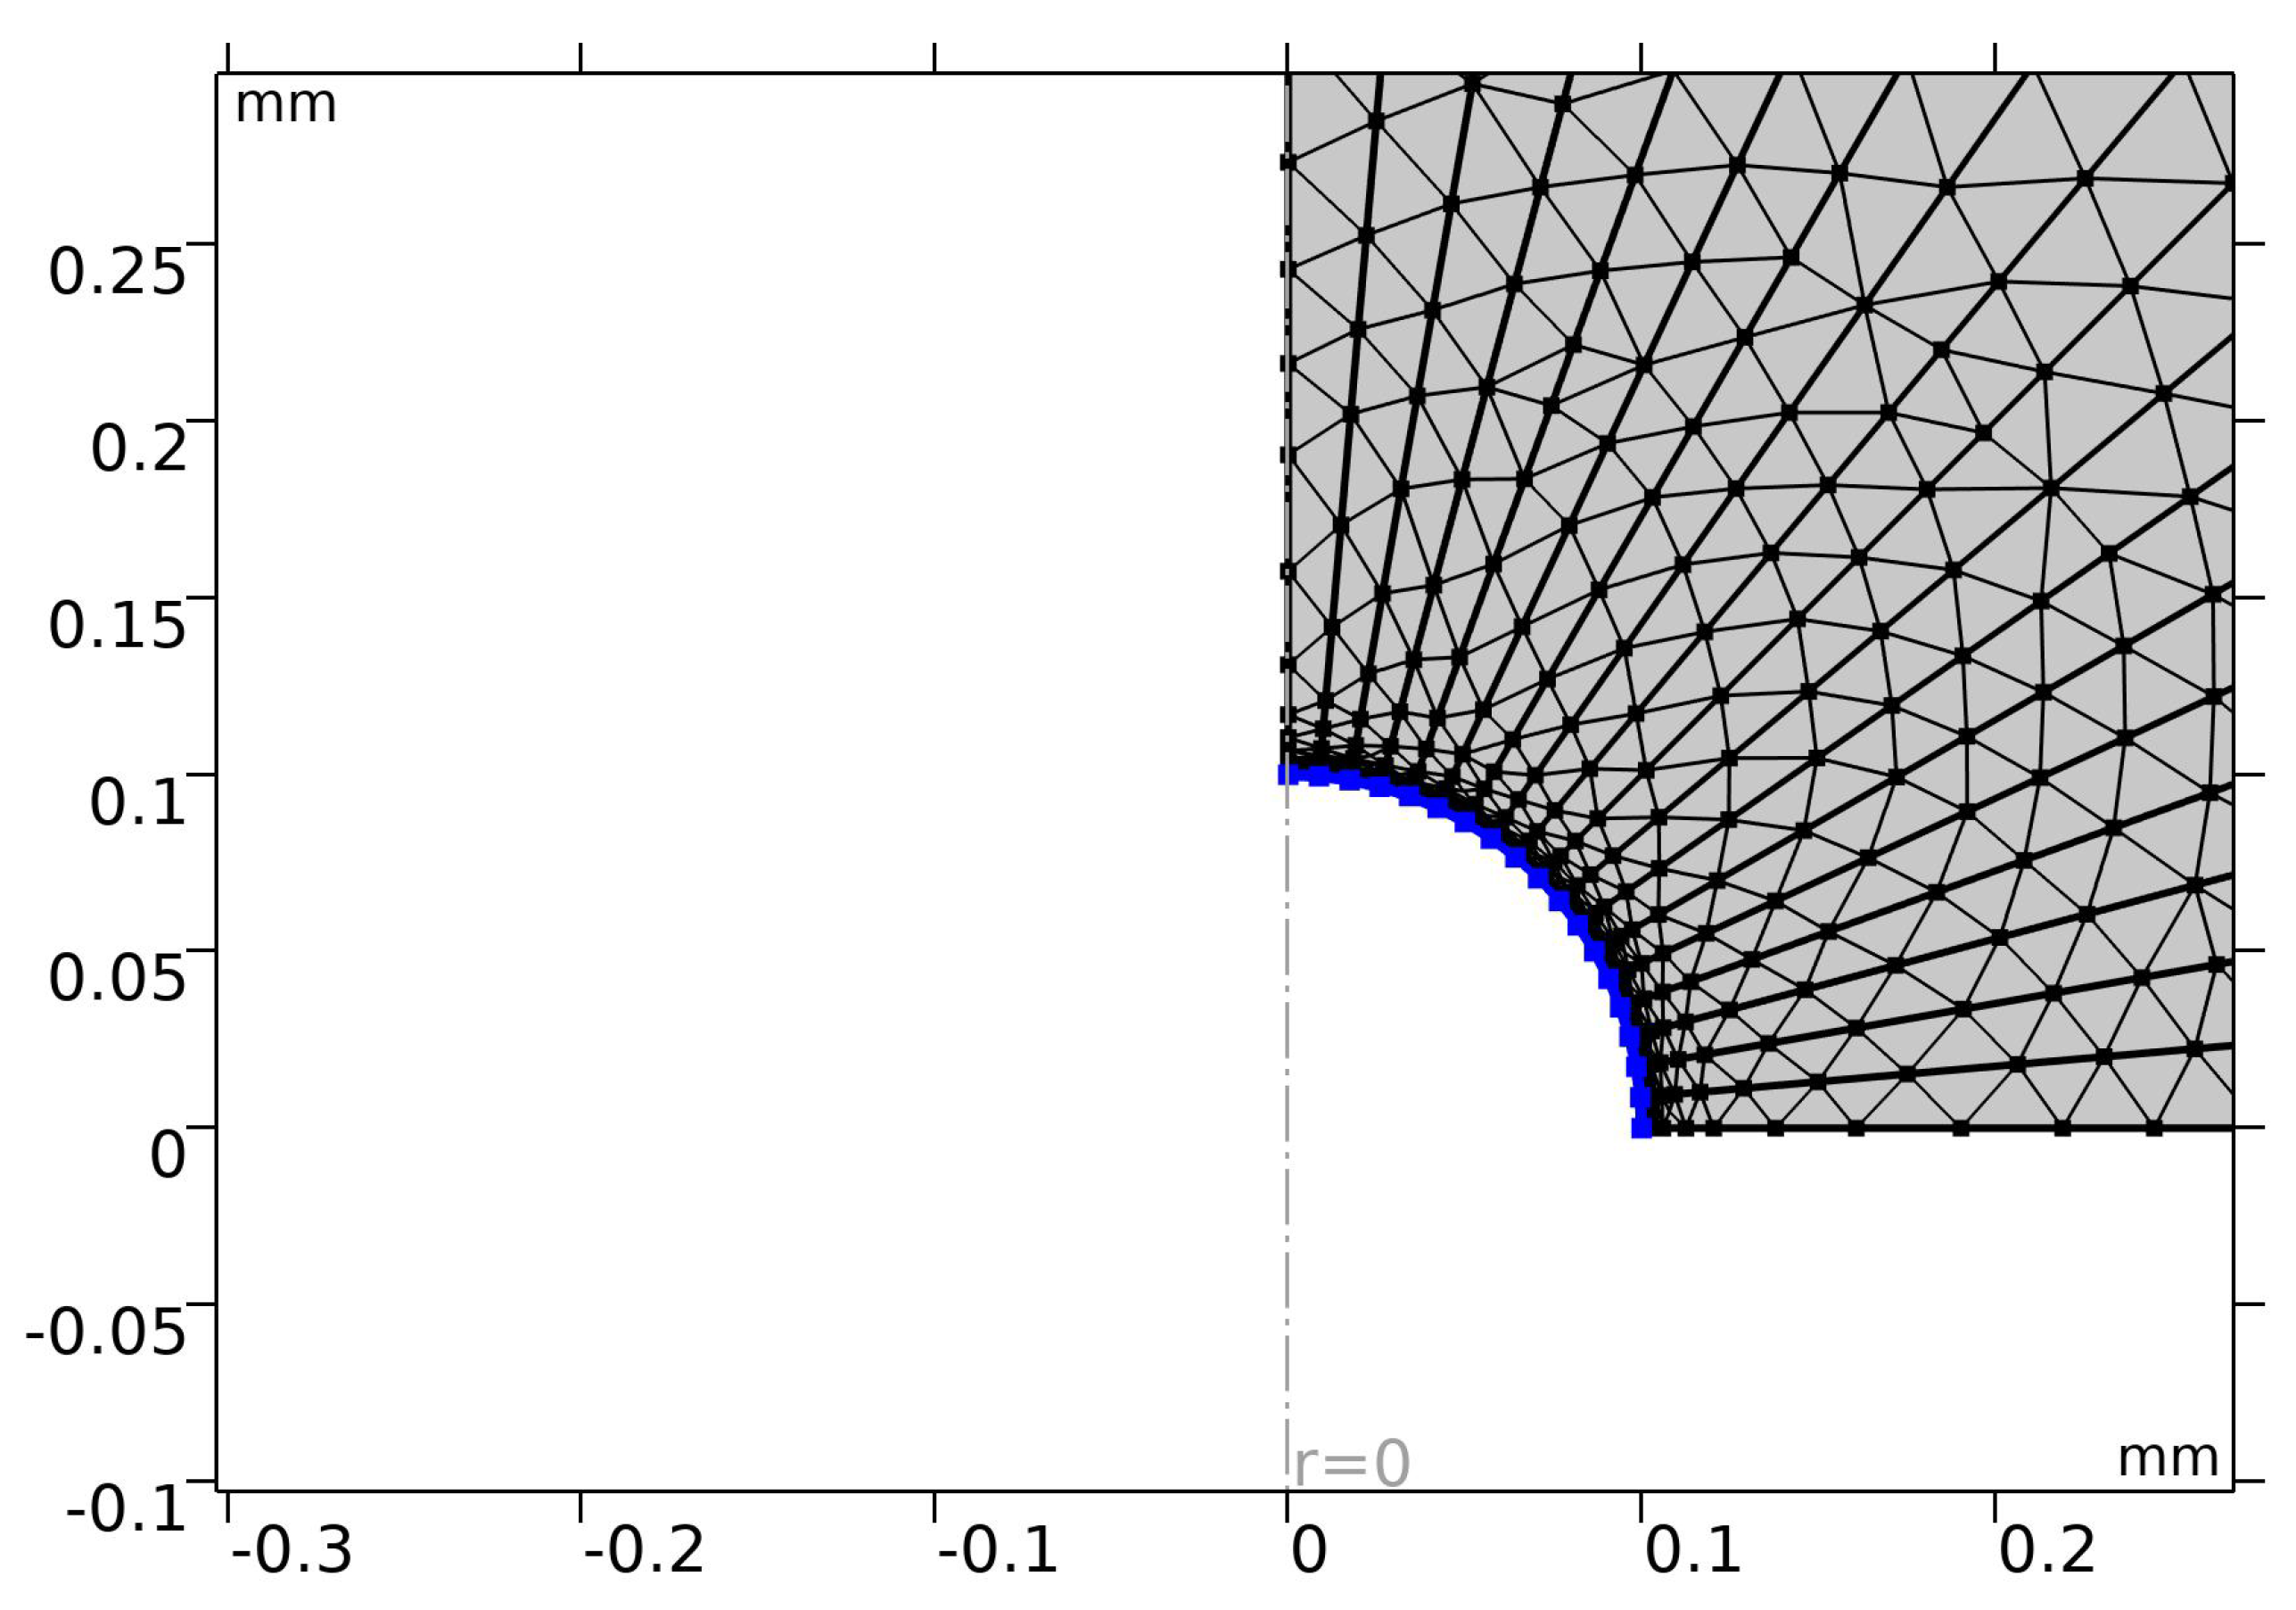
Figure 3.
Boundary-layer mesh along the curved liquid–vapor interface. The fine surface mesh captures strong gradients in temperature and tangential velocity.
Figure 3.
Boundary-layer mesh along the curved liquid–vapor interface. The fine surface mesh captures strong gradients in temperature and tangential velocity.
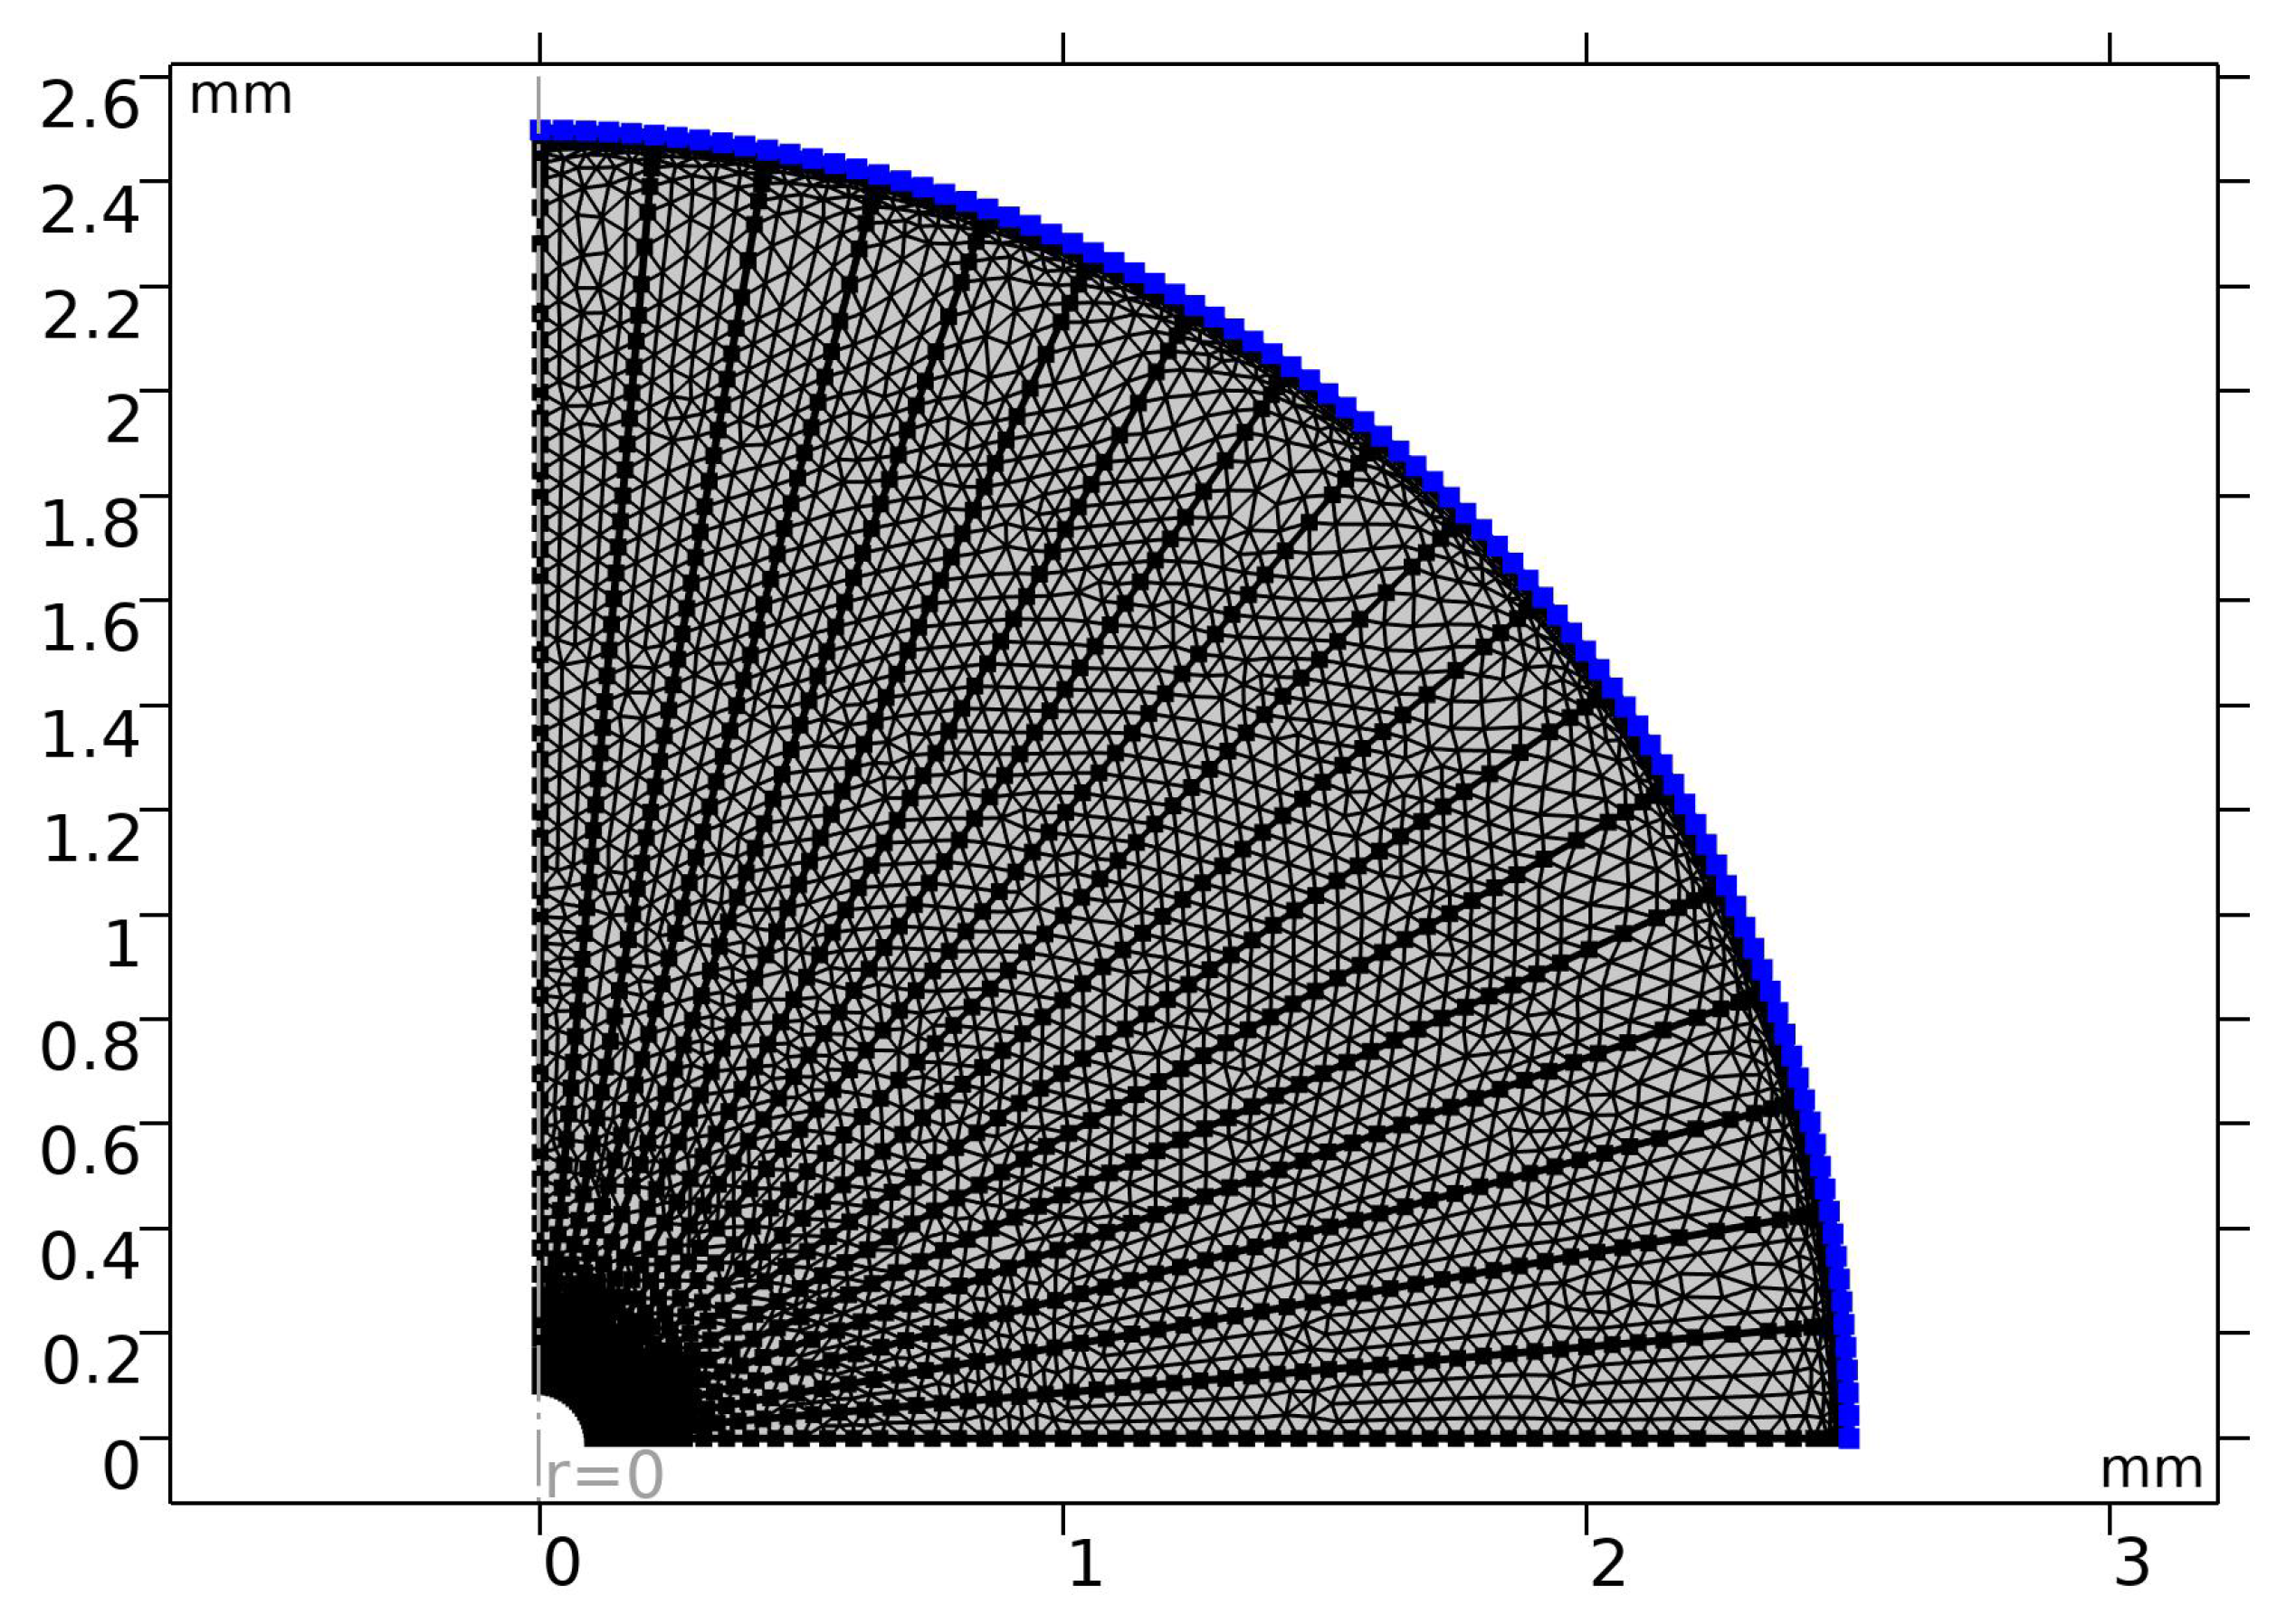
Figure 4.
Complete mesh configuration for the axisymmetric droplet–vapor domain. The mesh density is higher near the interface and the inlet, where gradients are strongest.
Figure 4.
Complete mesh configuration for the axisymmetric droplet–vapor domain. The mesh density is higher near the interface and the inlet, where gradients are strongest.
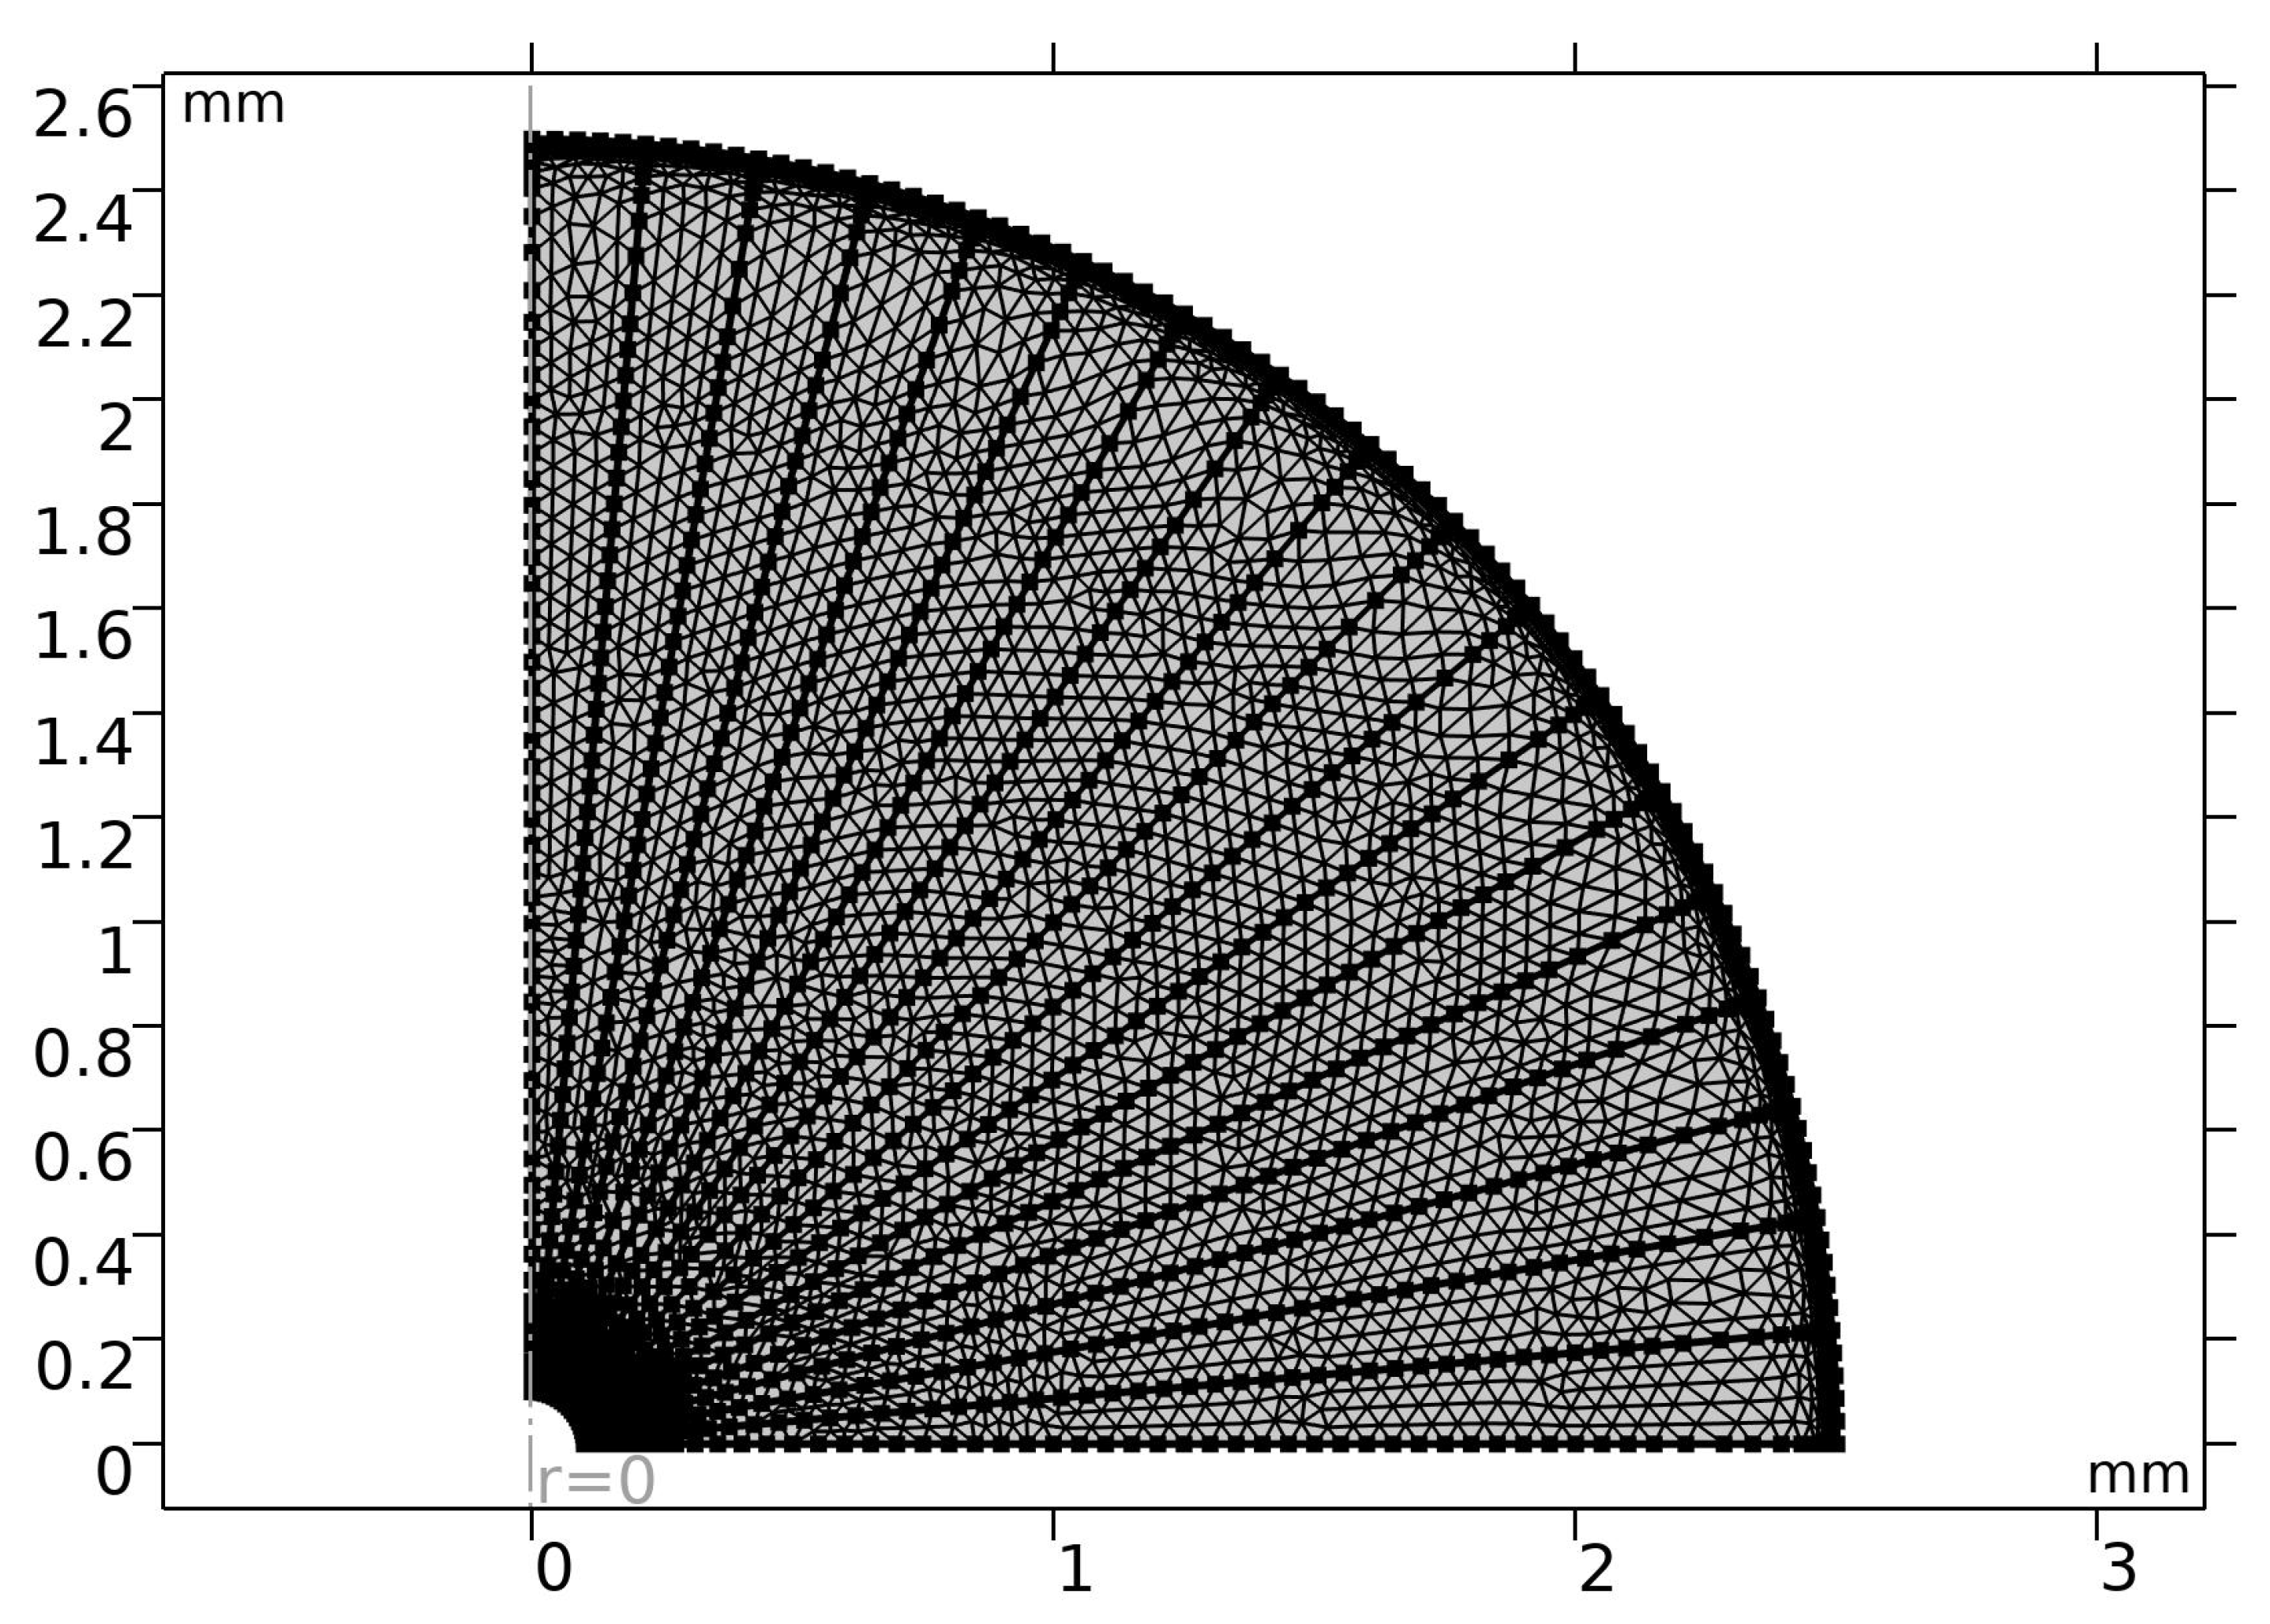
Figure 5.
2D axisymmetric model schematic showing boundary conditions: axis of symmetry (), no-slip heated wall (), and radial inflow at the inlet ().
Figure 5.
2D axisymmetric model schematic showing boundary conditions: axis of symmetry (), no-slip heated wall (), and radial inflow at the inlet ().
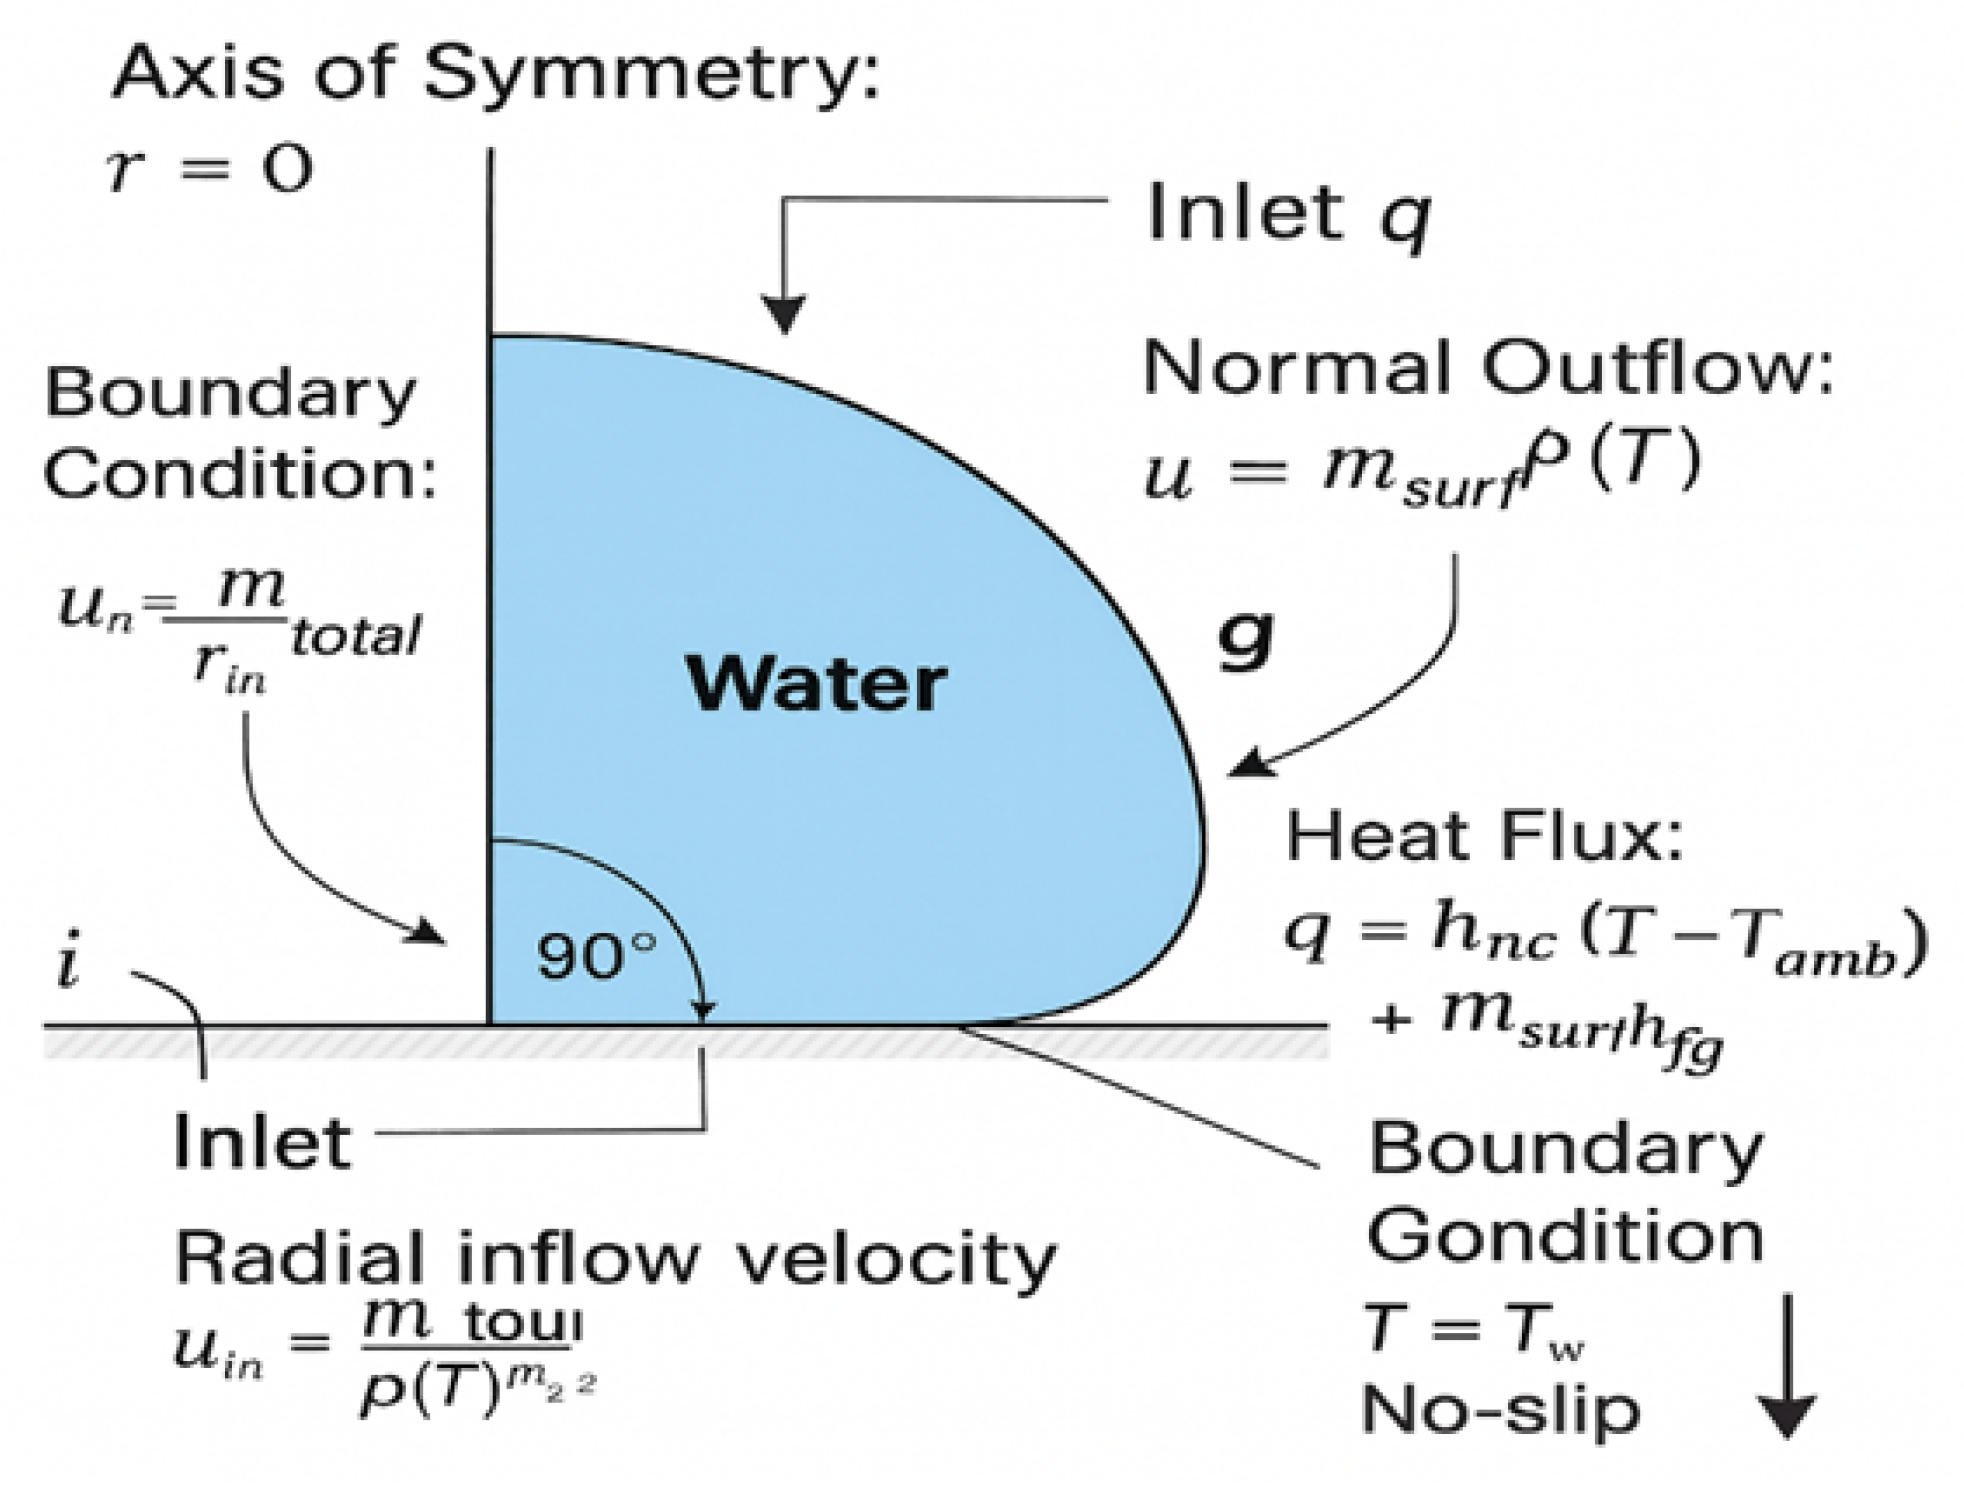
Figure 6.
Velocity magnitude and streamline field for the buoyancy-only case at . A single axisymmetric recirculation cell with peak velocity is observed.
Figure 6.
Velocity magnitude and streamline field for the buoyancy-only case at . A single axisymmetric recirculation cell with peak velocity is observed.
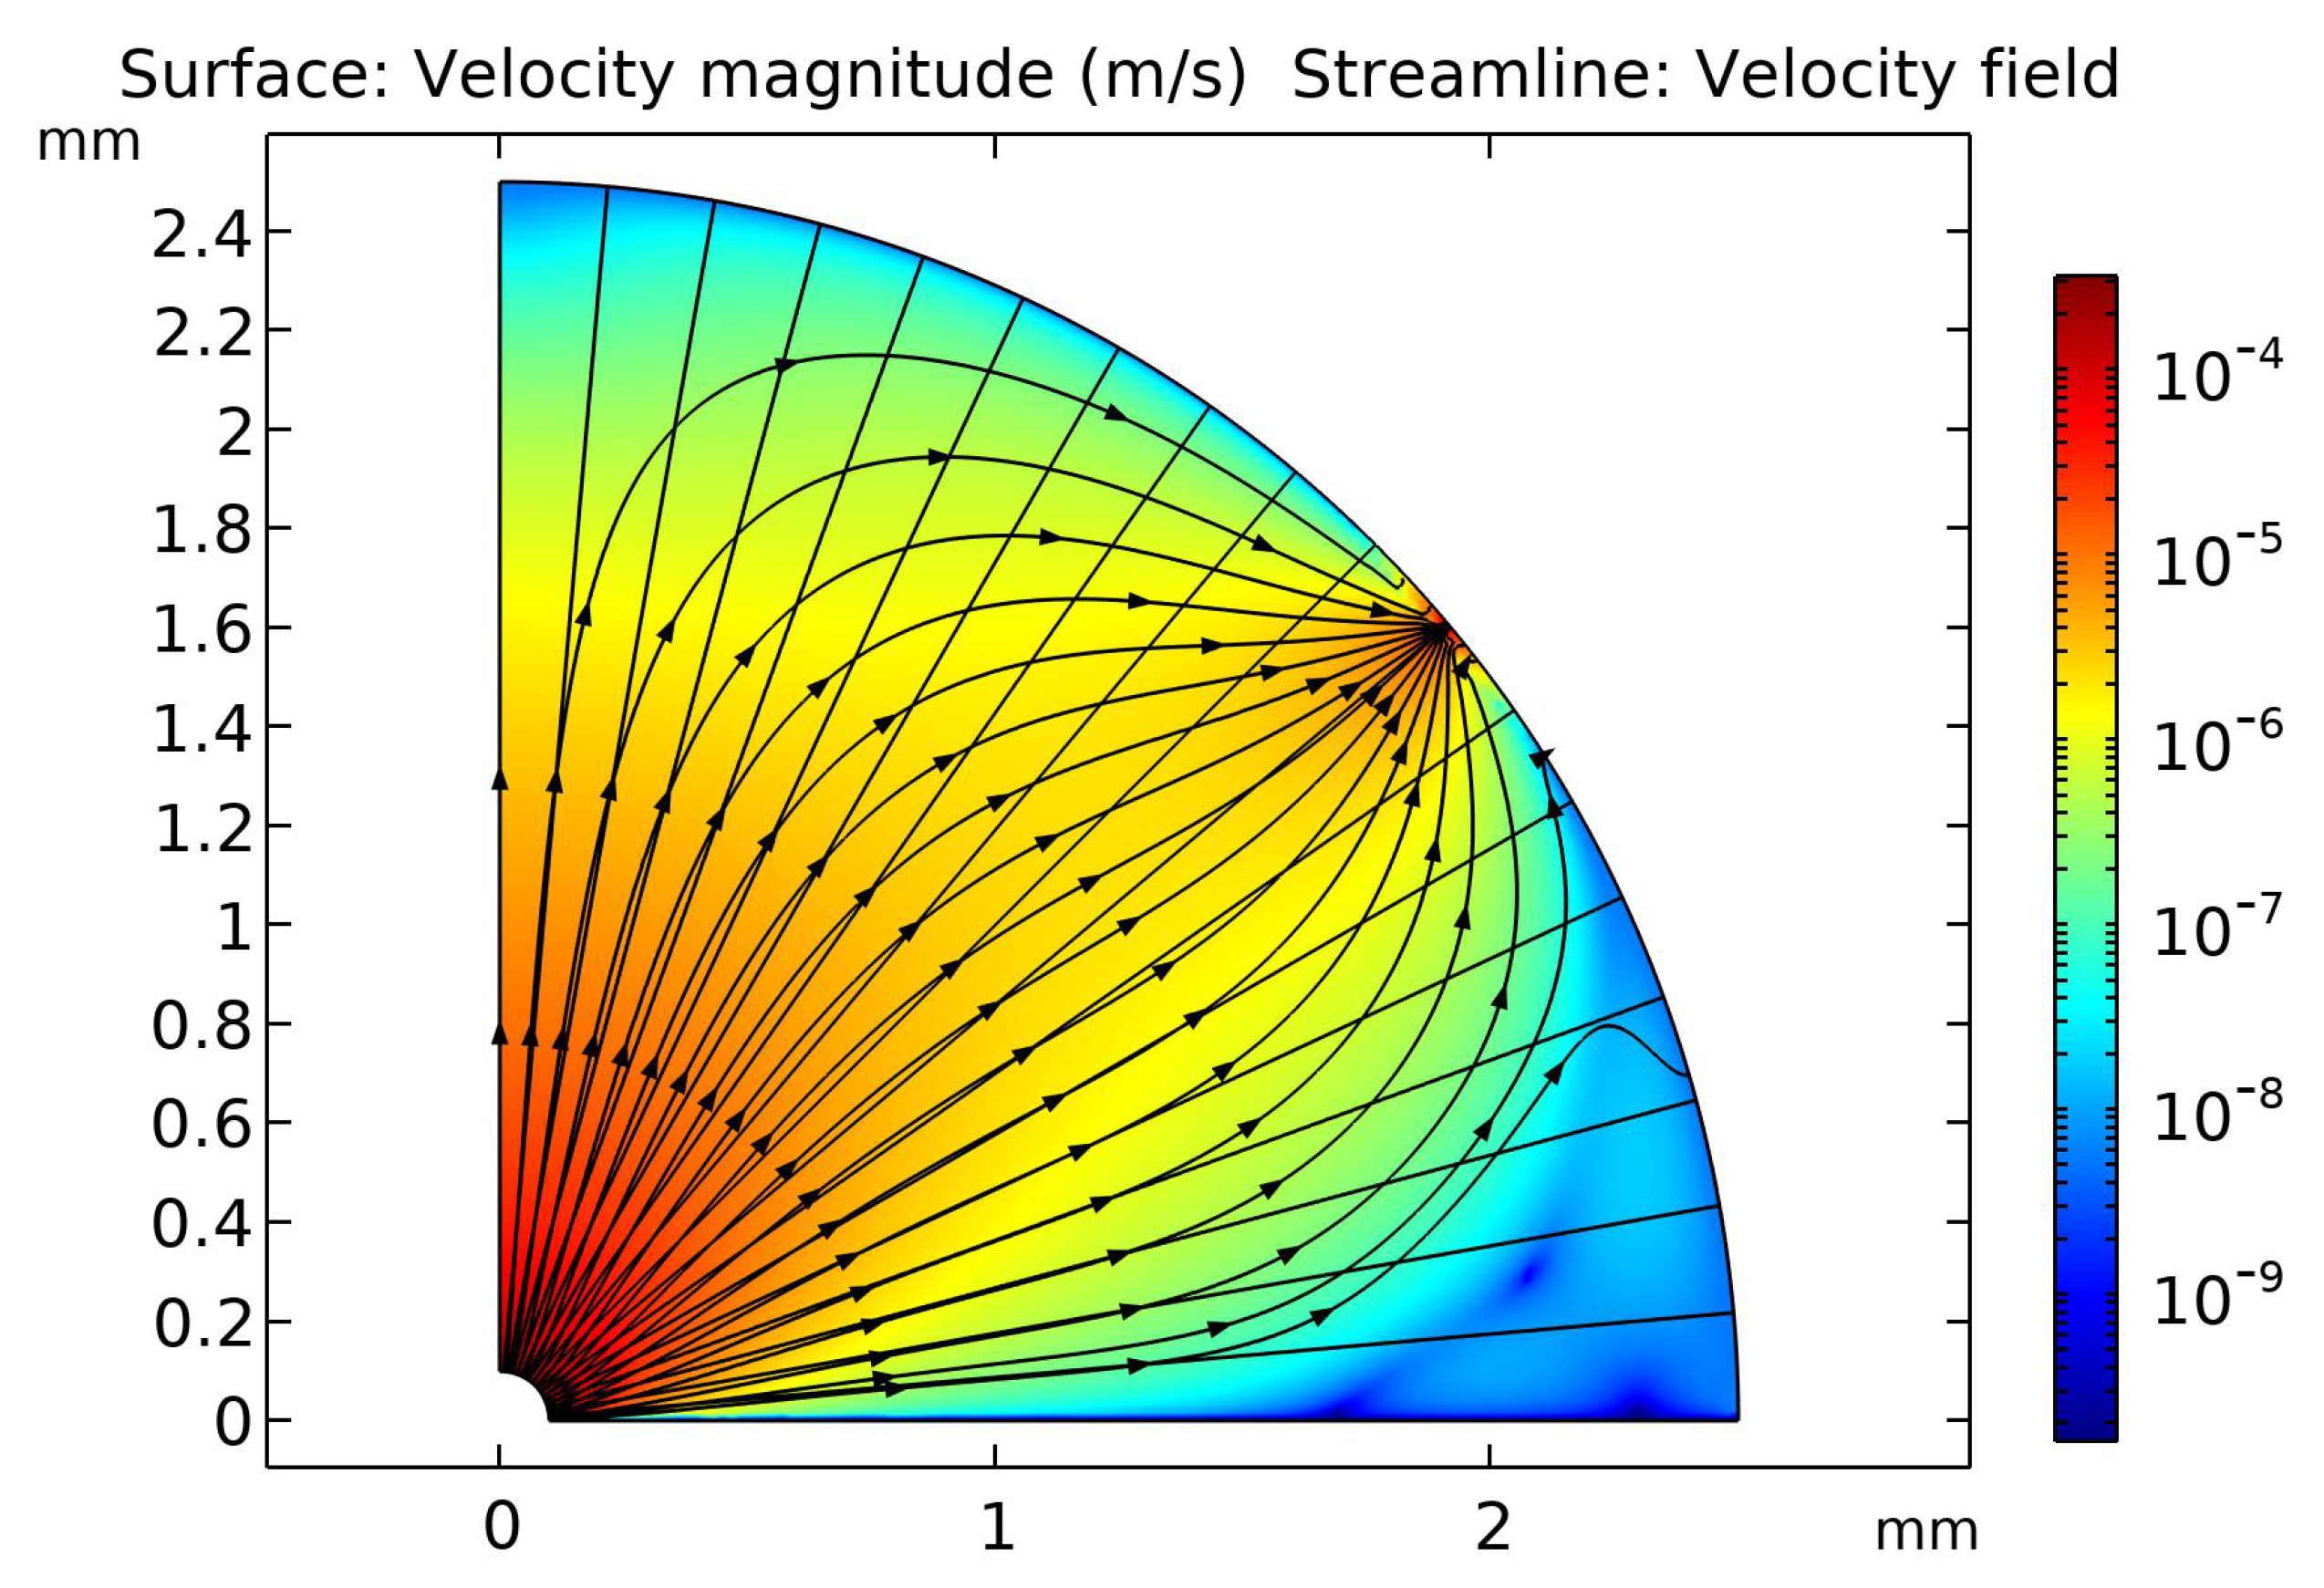
Figure 7.
Velocity magnitude and streamline field for the combined buoyancy–Marangoni case at . A multi-cellular vortex structure with characteristic velocities develops, indicating strong surface-tension-driven convection.
Figure 7.
Velocity magnitude and streamline field for the combined buoyancy–Marangoni case at . A multi-cellular vortex structure with characteristic velocities develops, indicating strong surface-tension-driven convection.
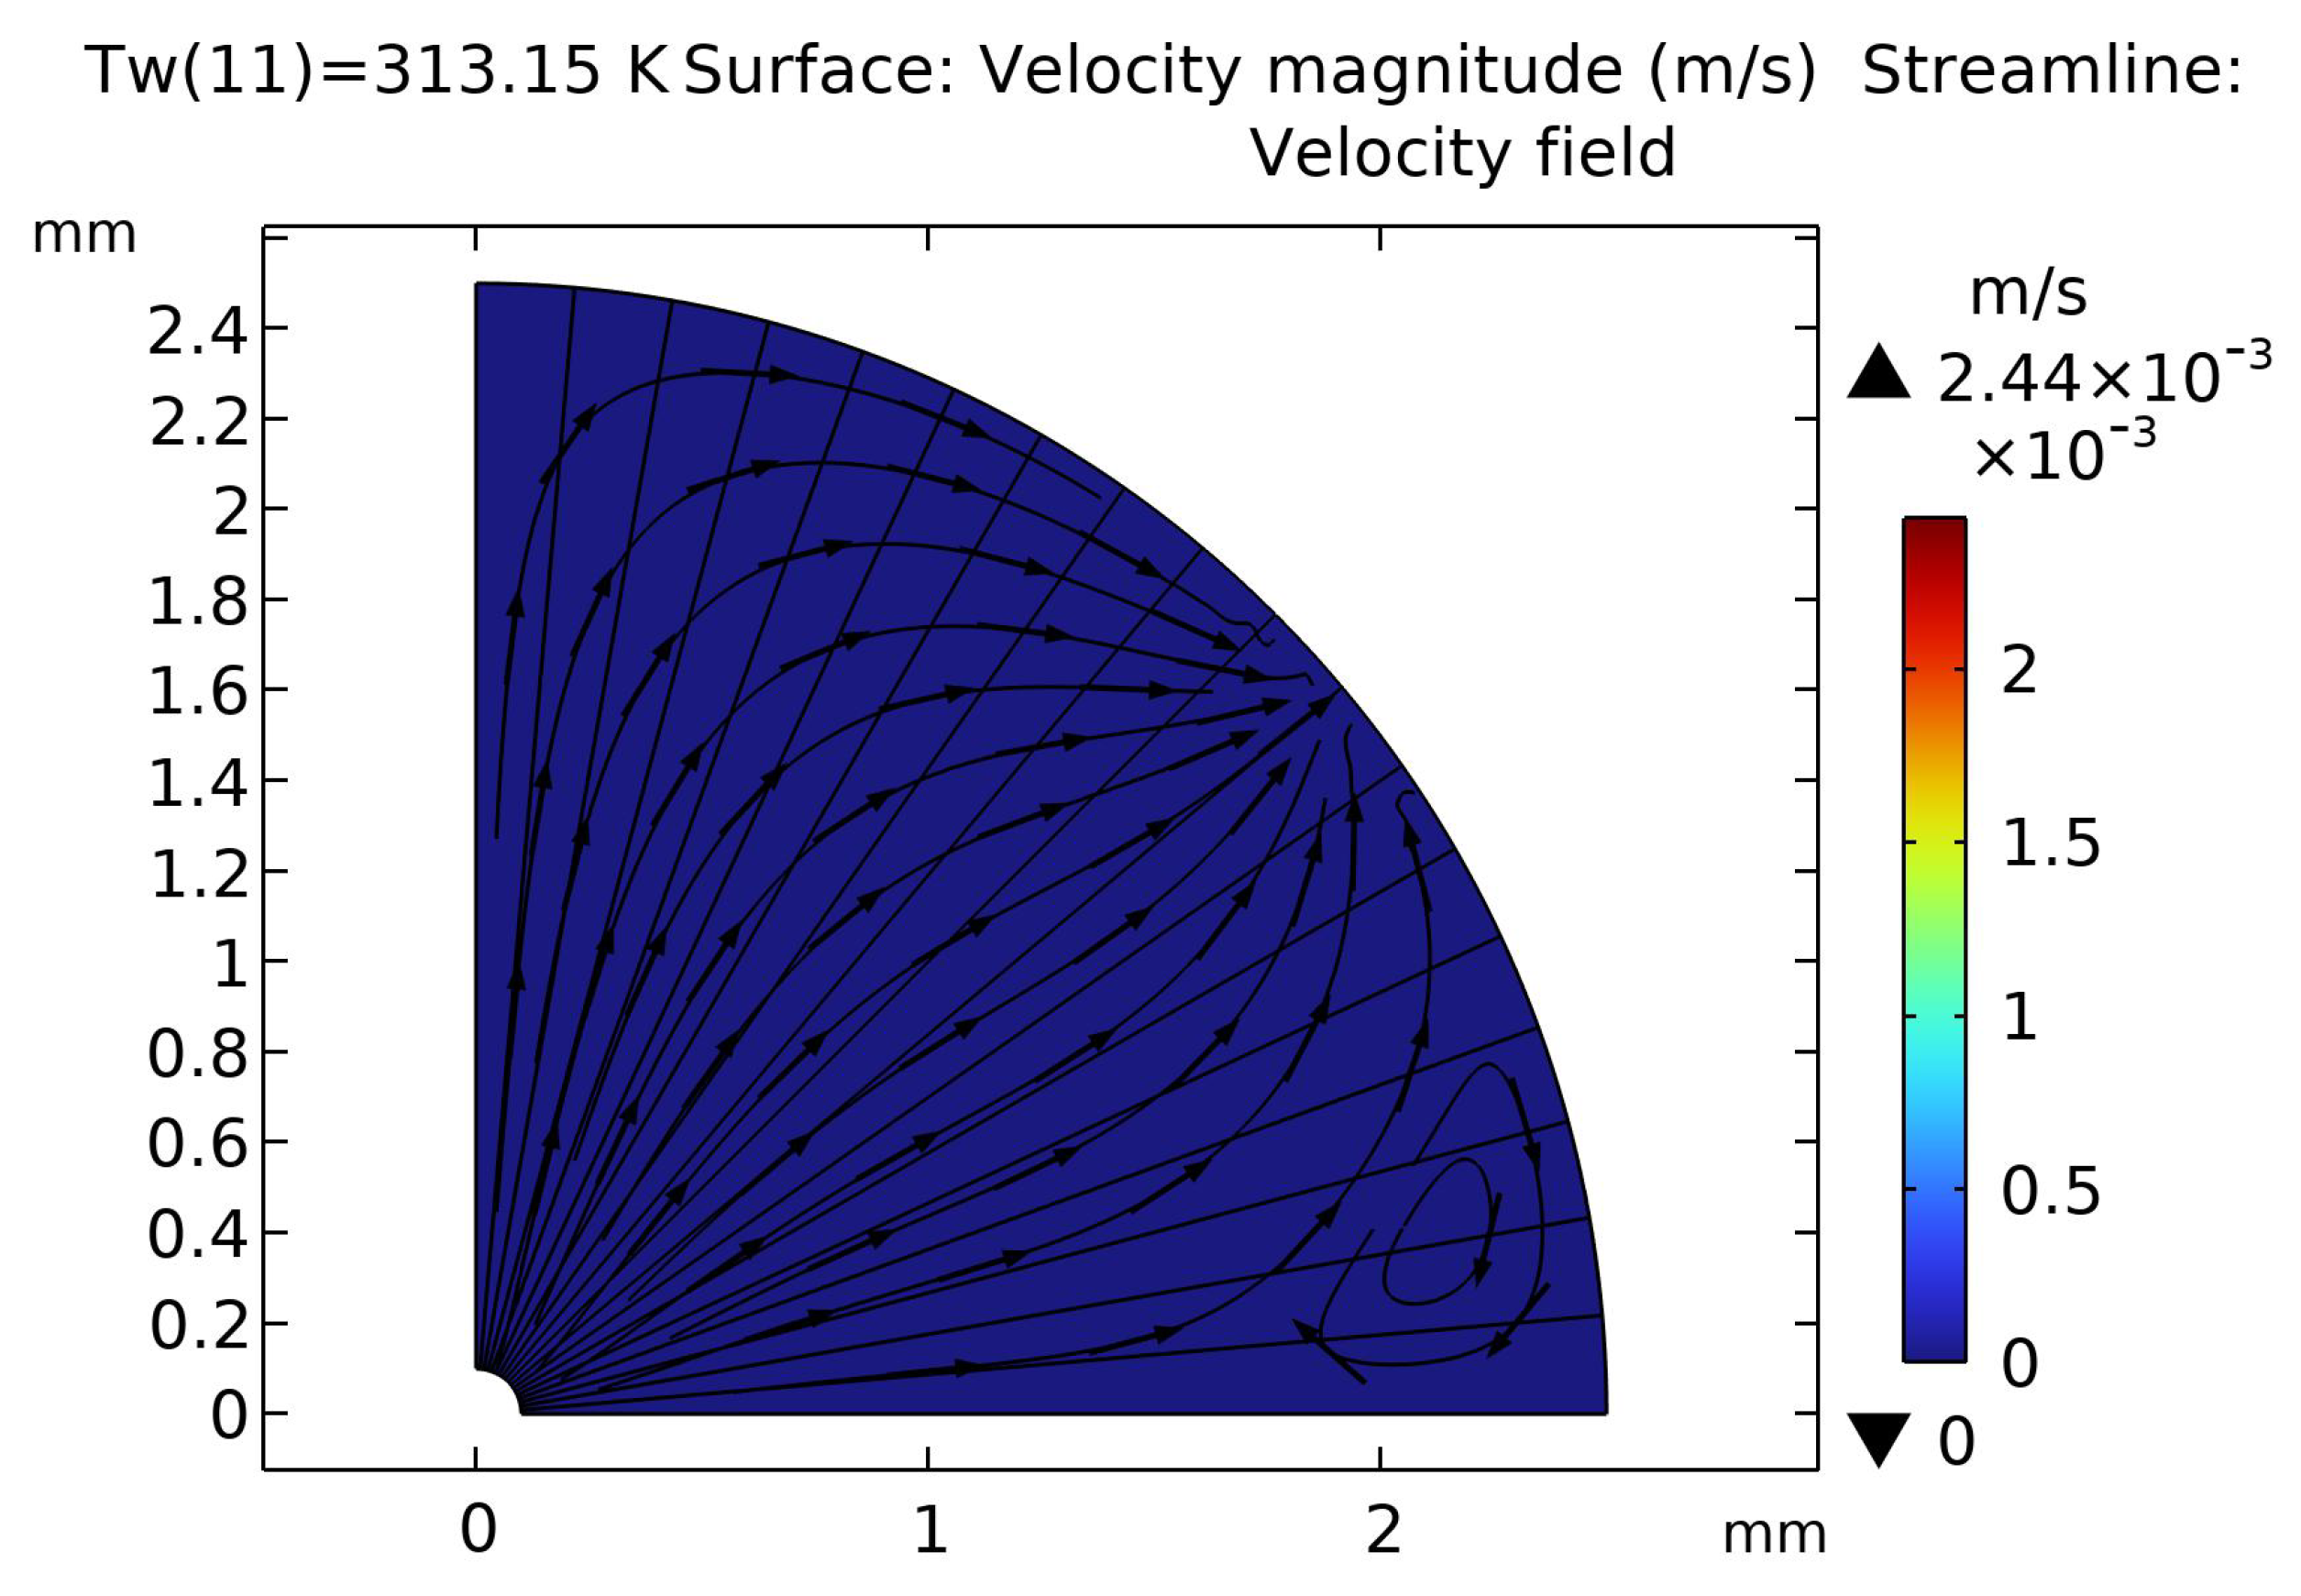
Figure 8.
Temperature distribution for the buoyancy-driven case at . Stratified isotherms indicate a mainly conductive temperature field with weak convection.
Figure 8.
Temperature distribution for the buoyancy-driven case at . Stratified isotherms indicate a mainly conductive temperature field with weak convection.
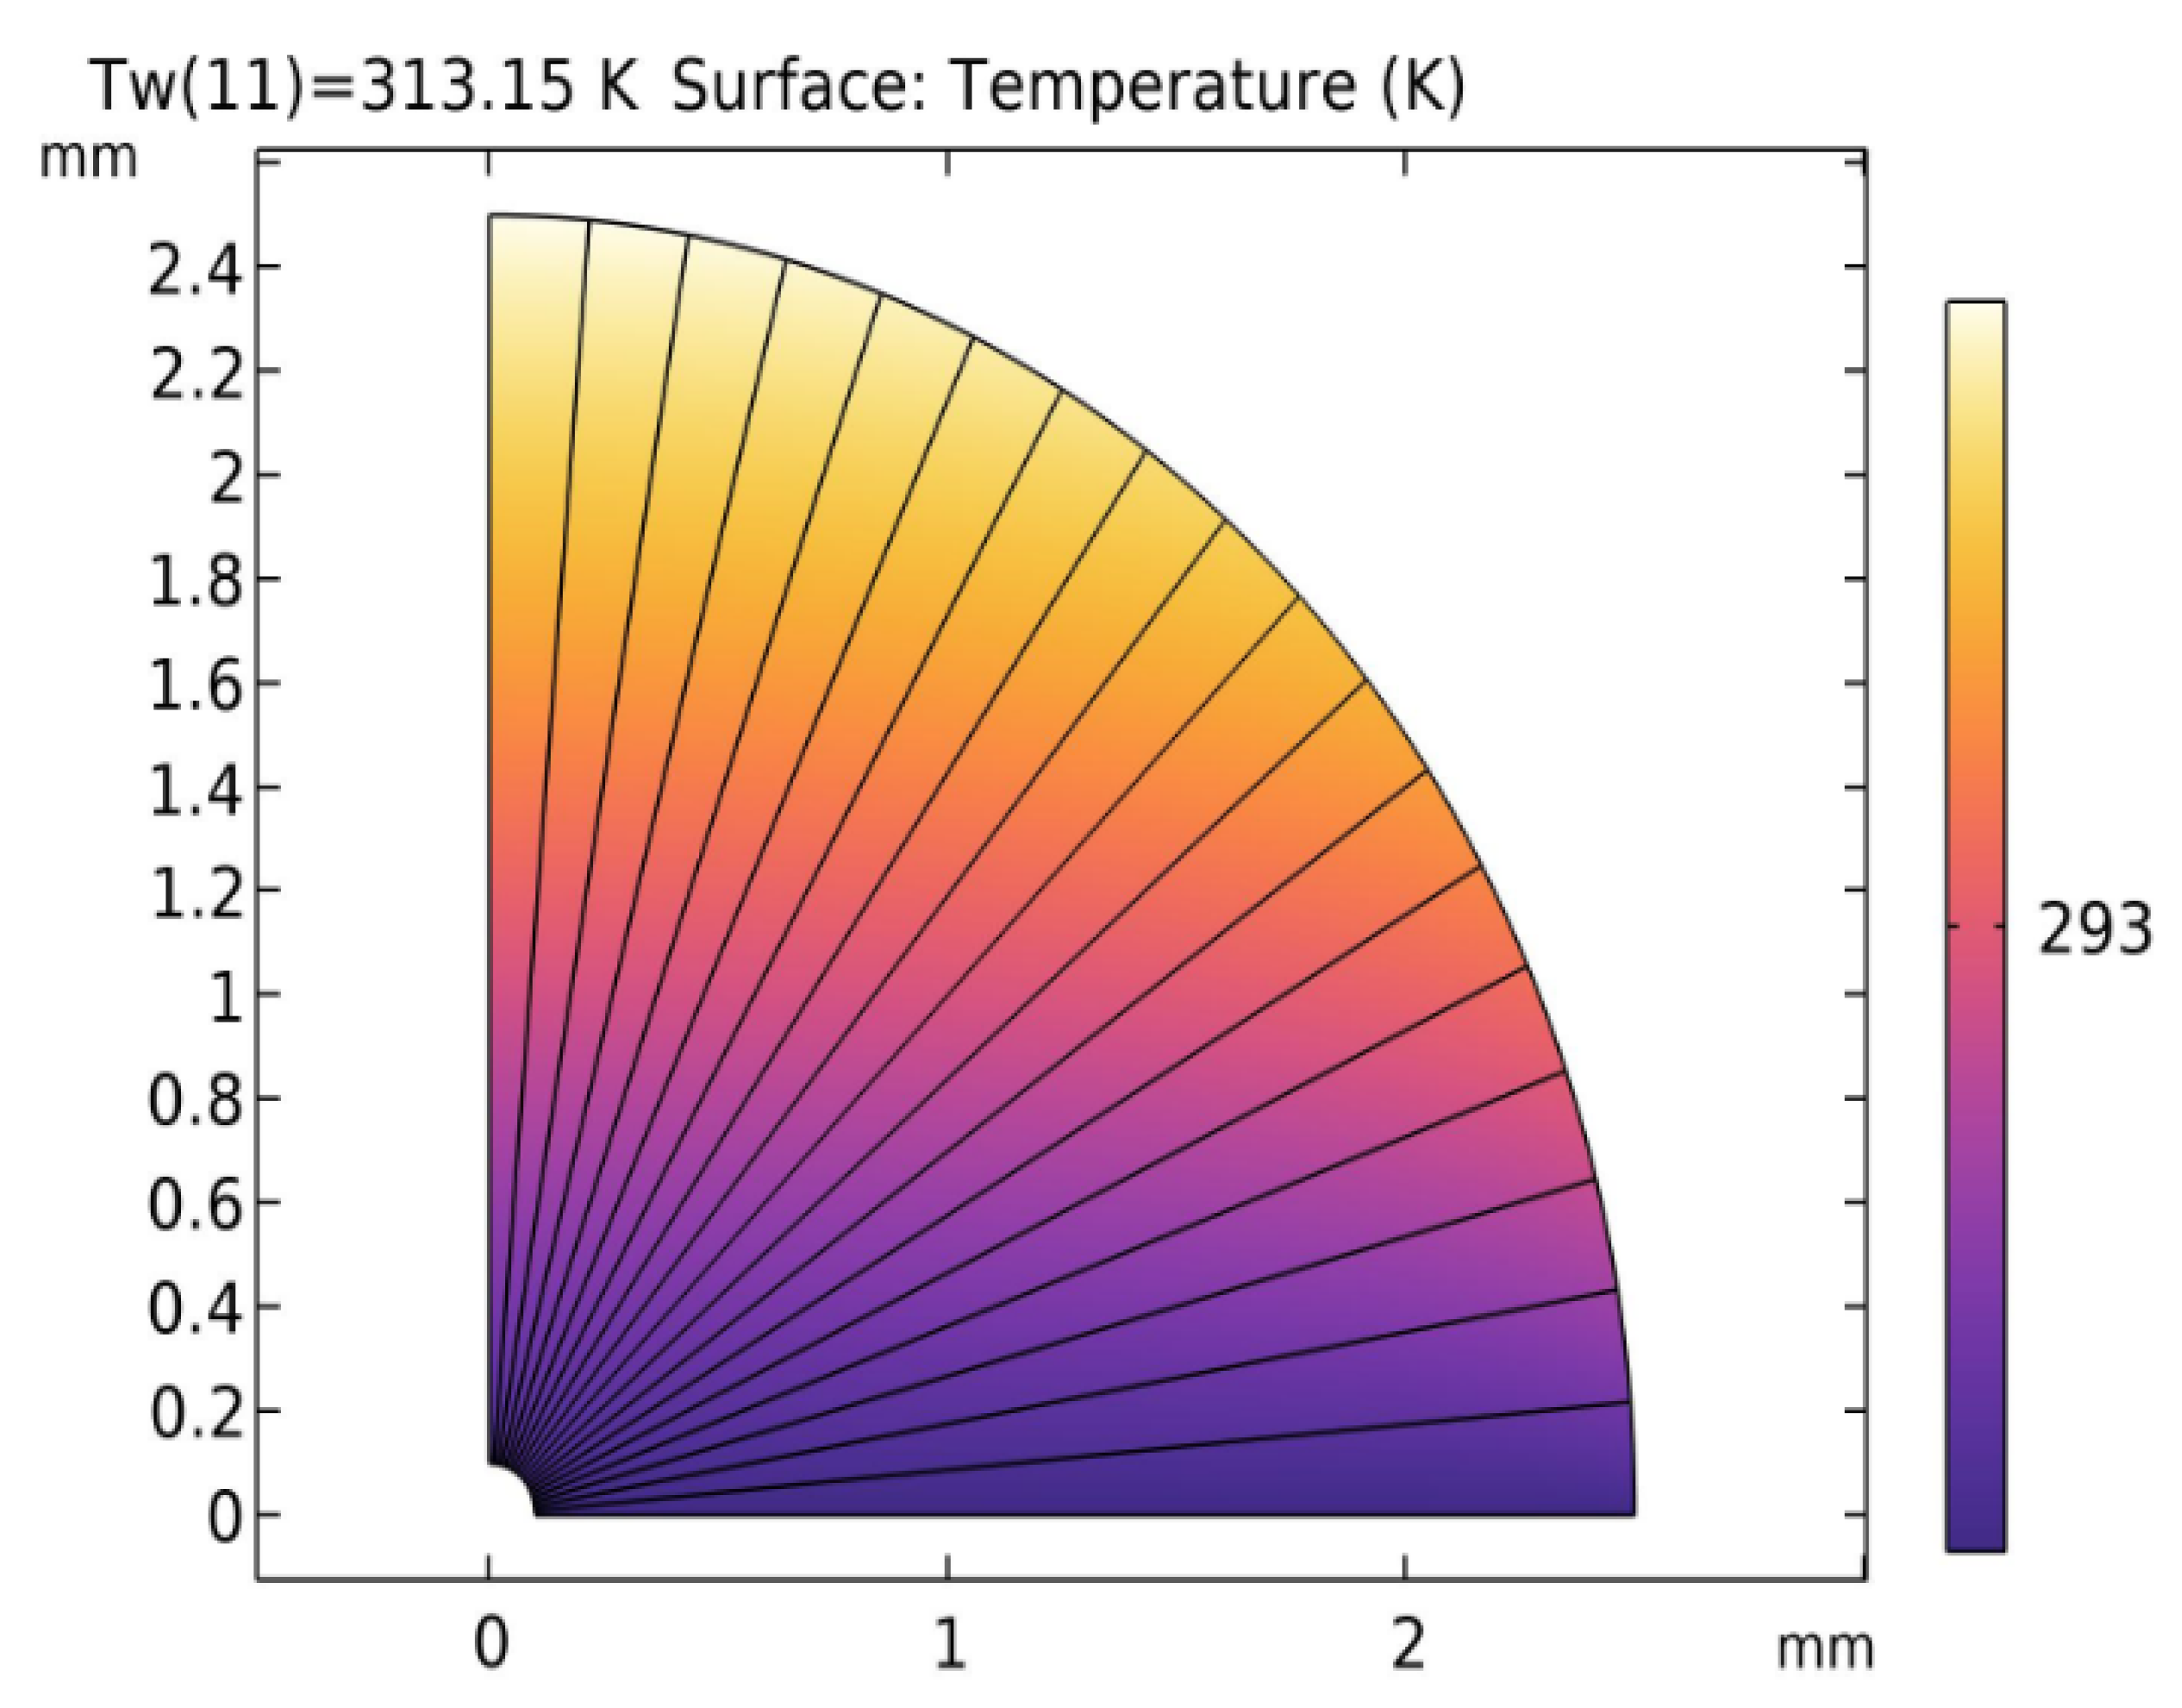
Figure 9.
Velocity-magnitude field for the buoyancy-driven case at . The flow is dominated by a single toroidal vortex with velocities .
Figure 9.
Velocity-magnitude field for the buoyancy-driven case at . The flow is dominated by a single toroidal vortex with velocities .
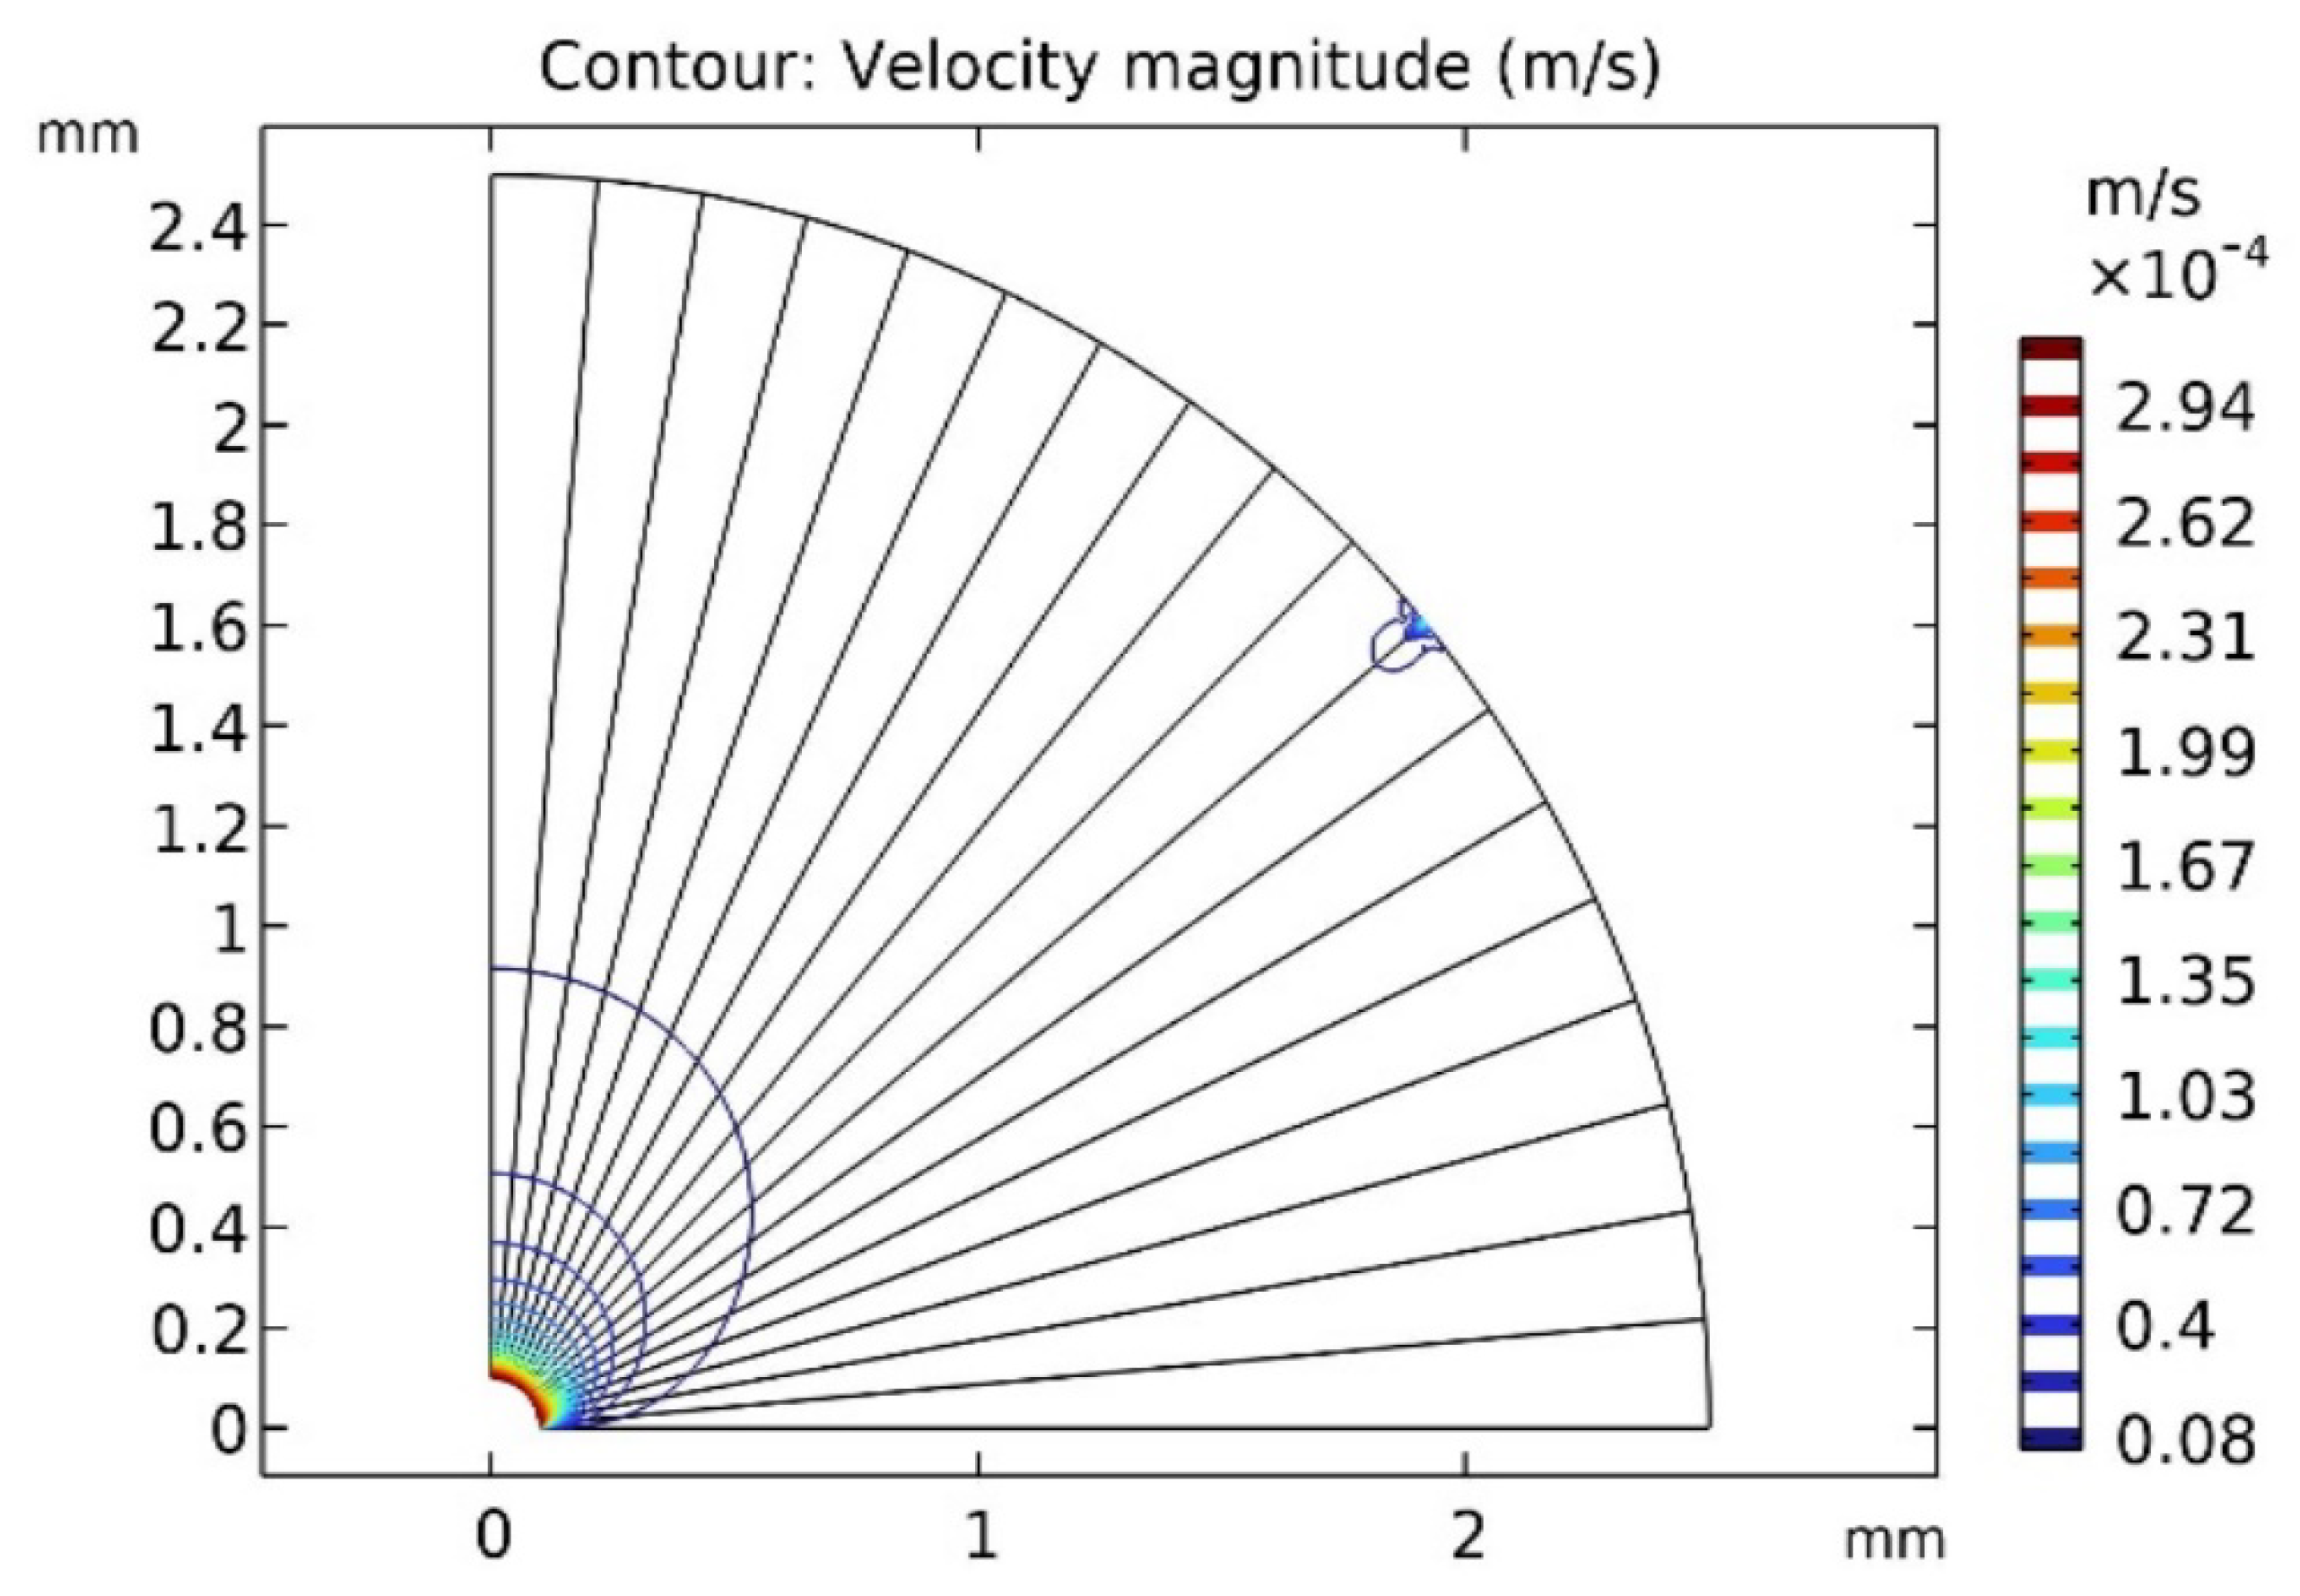
Figure 10.
Temperature distribution for the combined buoyancy–Marangoni case at . Distorted isotherms near the free surface indicate strong interfacial convection.
Figure 10.
Temperature distribution for the combined buoyancy–Marangoni case at . Distorted isotherms near the free surface indicate strong interfacial convection.
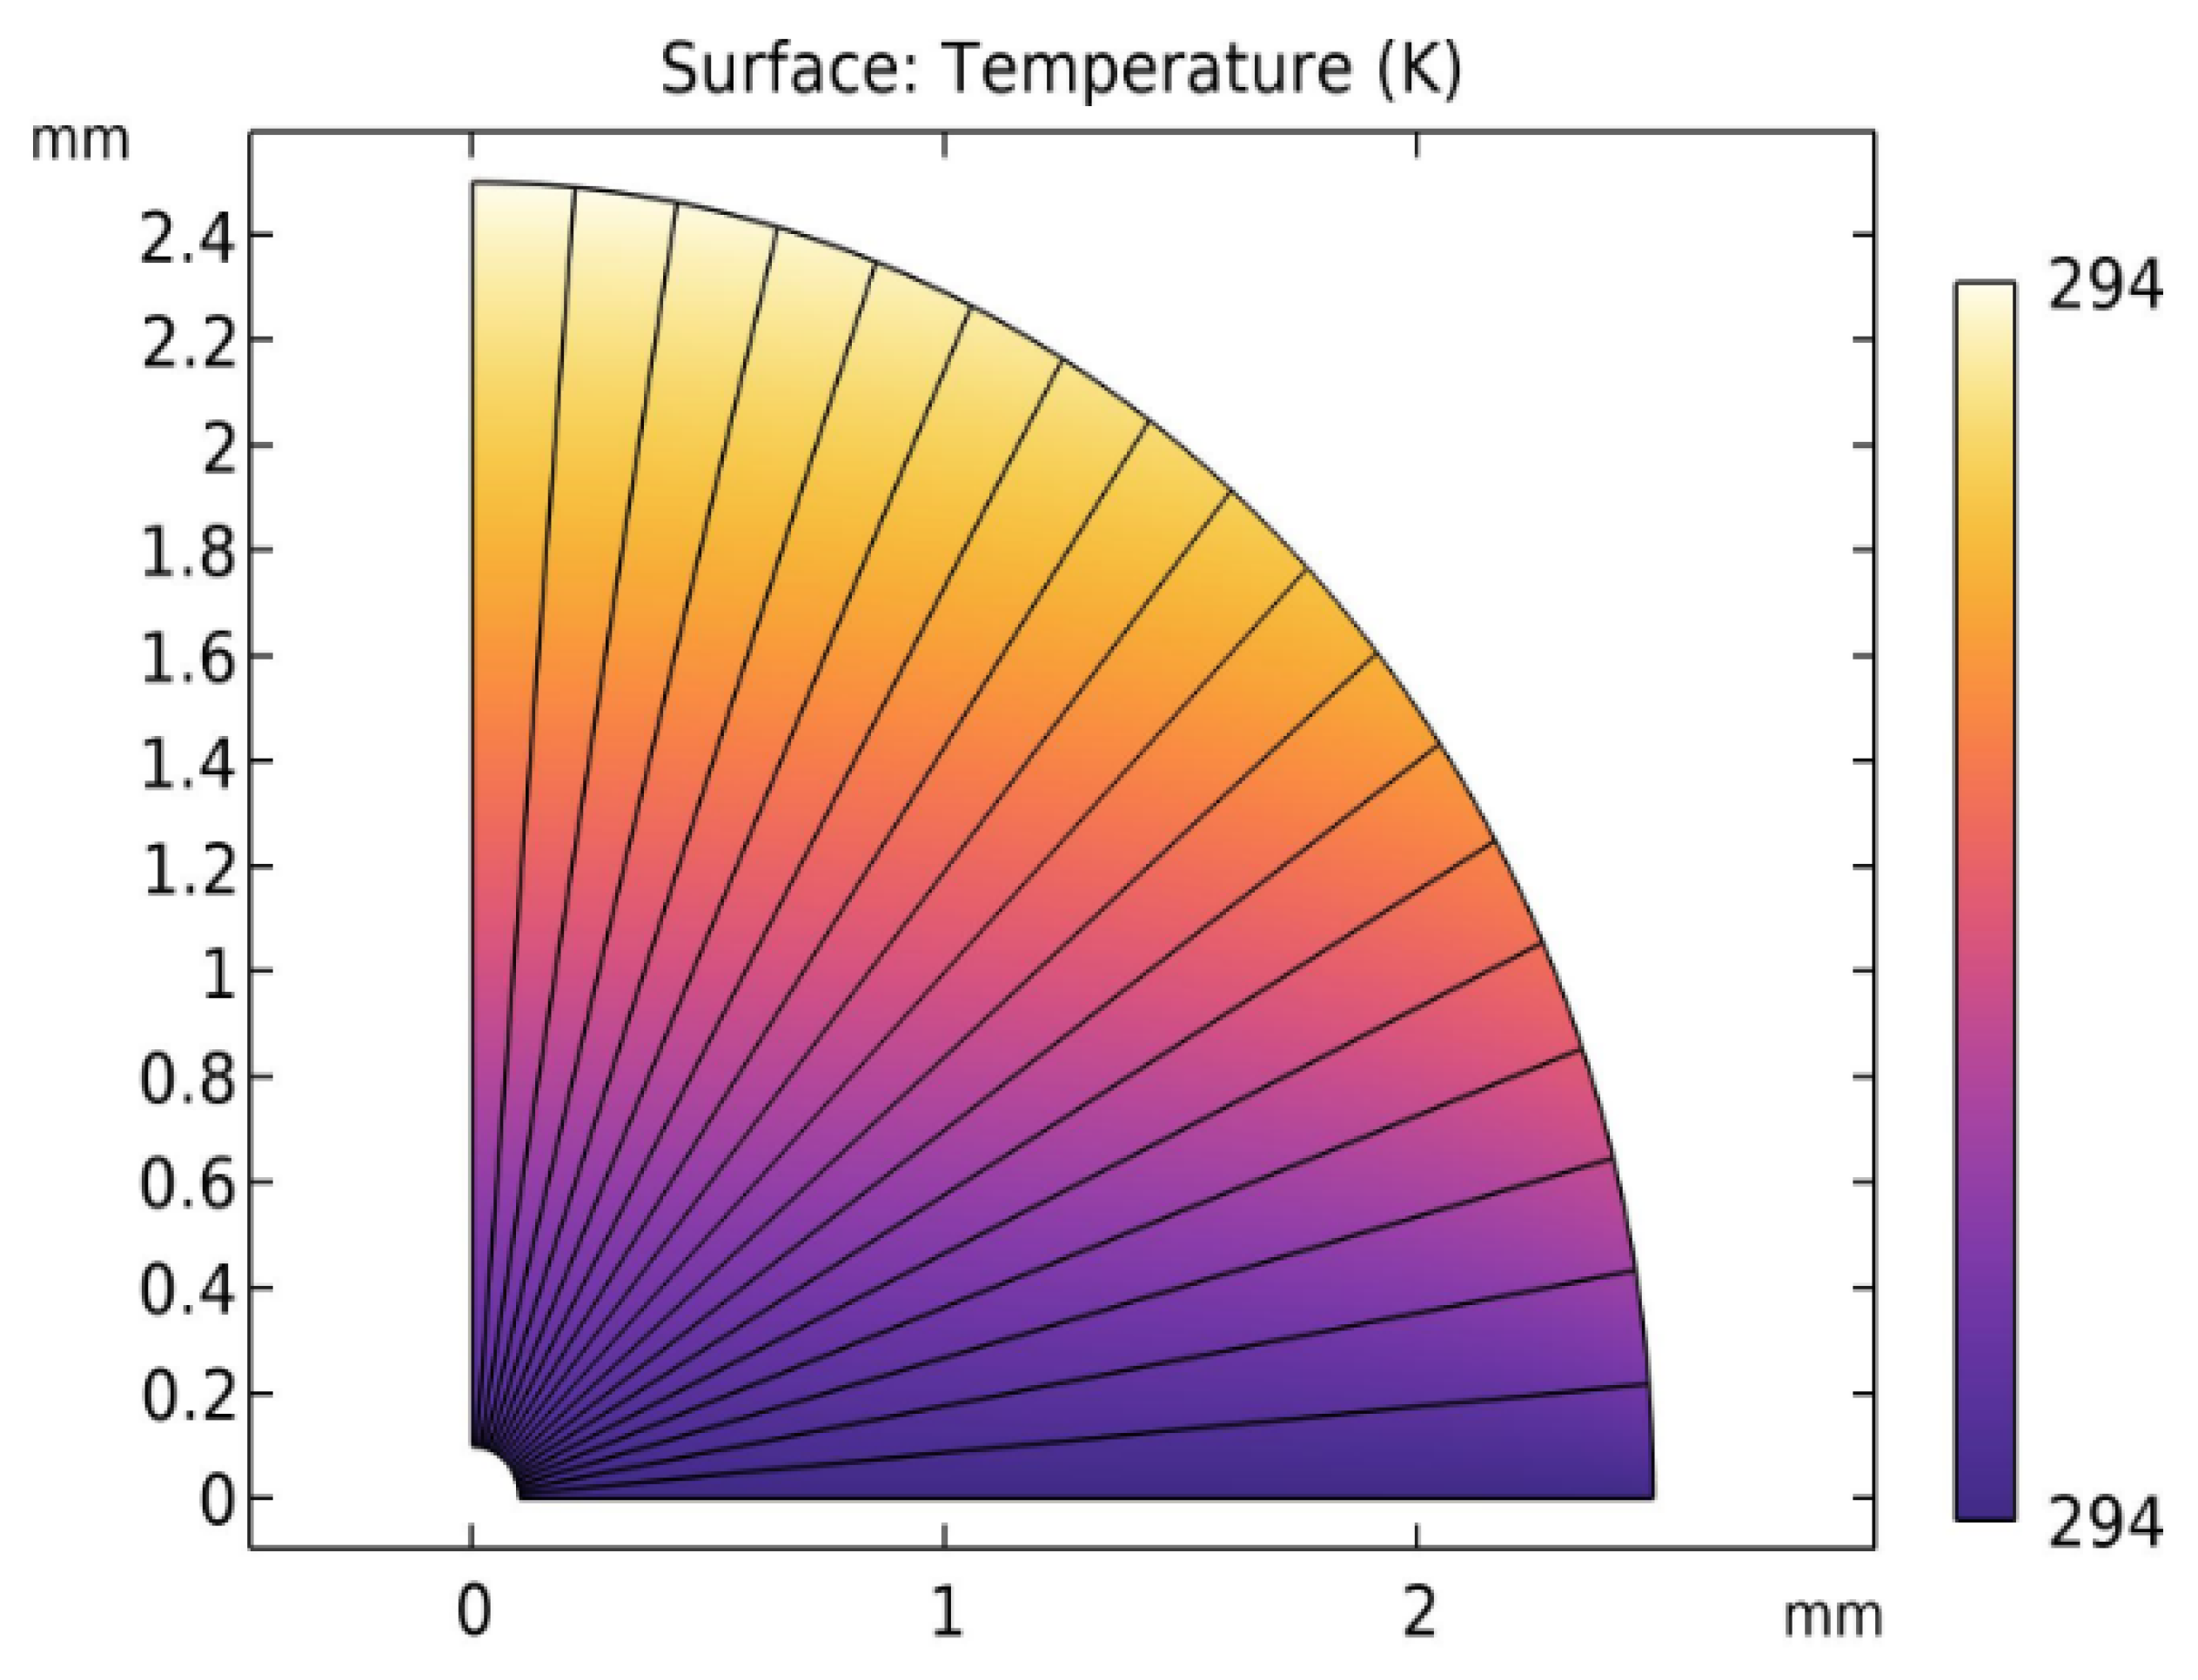
Figure 11.
Velocity-magnitude field for the combined buoyancy–Marangoni case at . Multiple counter-rotating vortices produce much higher velocities than in the buoyancy-only case.
Figure 11.
Velocity-magnitude field for the combined buoyancy–Marangoni case at . Multiple counter-rotating vortices produce much higher velocities than in the buoyancy-only case.
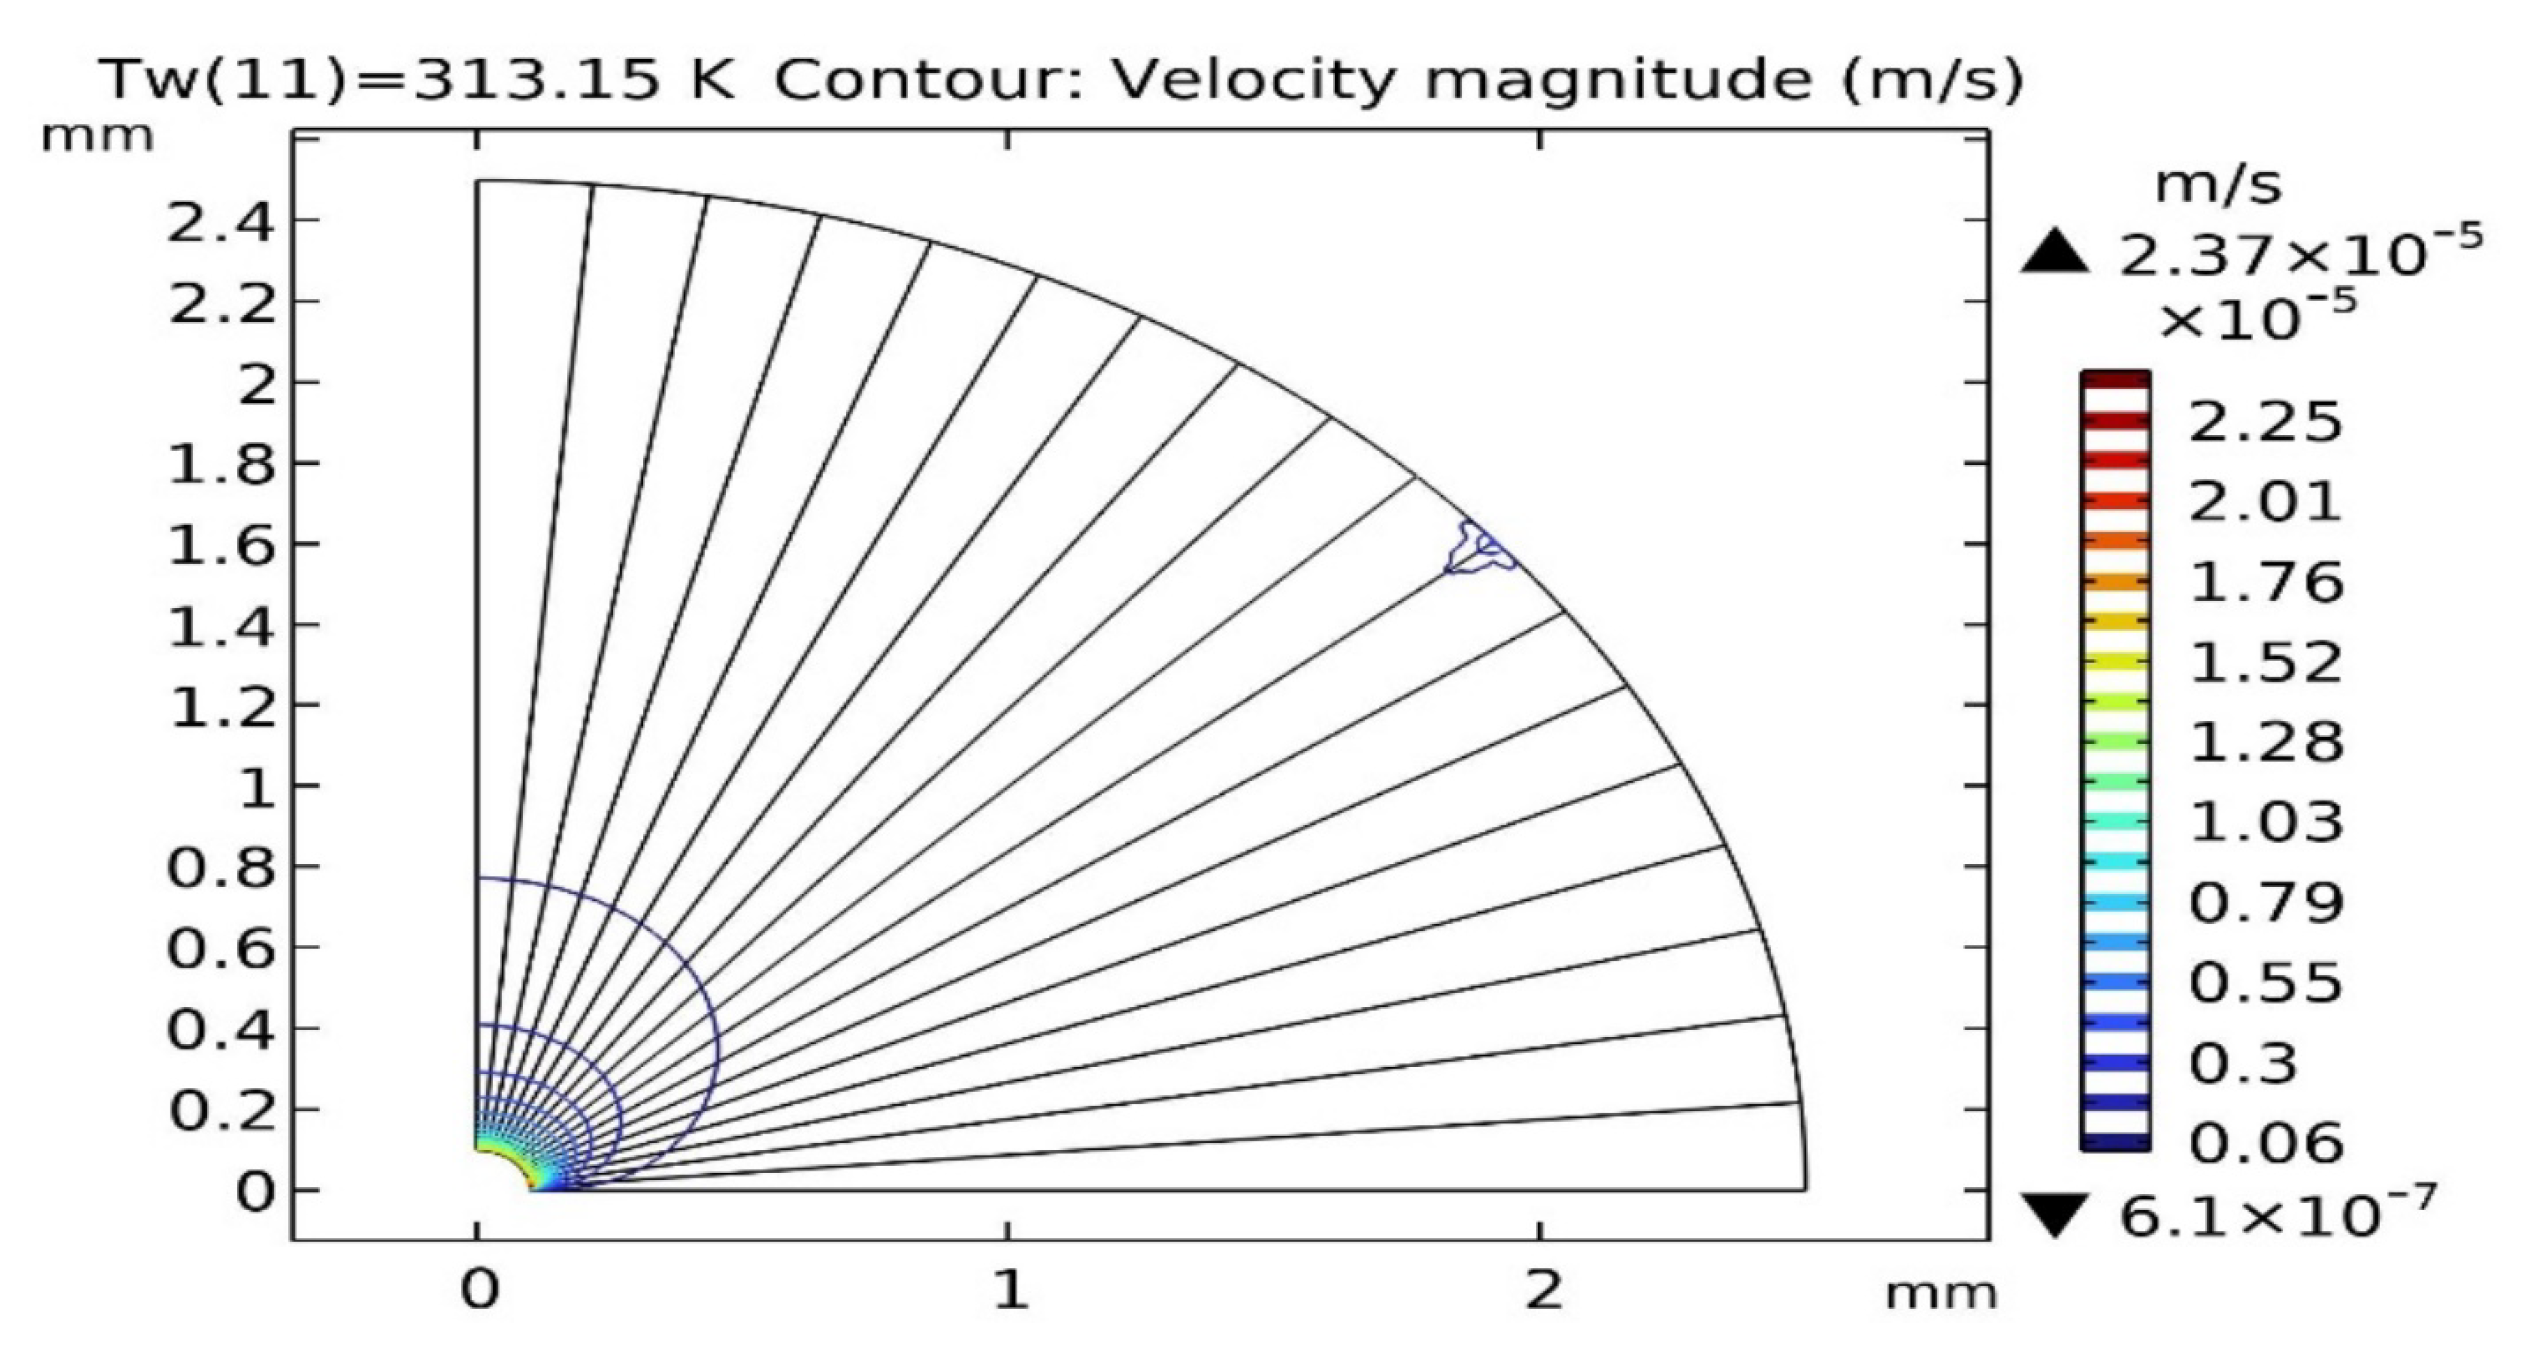
Figure 12.
Evaporative mass flux versus for buoyancy-only and combined buoyancy–Marangoni cases. Marangoni stresses increase the flux at all temperatures in the studied range.
Figure 12.
Evaporative mass flux versus for buoyancy-only and combined buoyancy–Marangoni cases. Marangoni stresses increase the flux at all temperatures in the studied range.
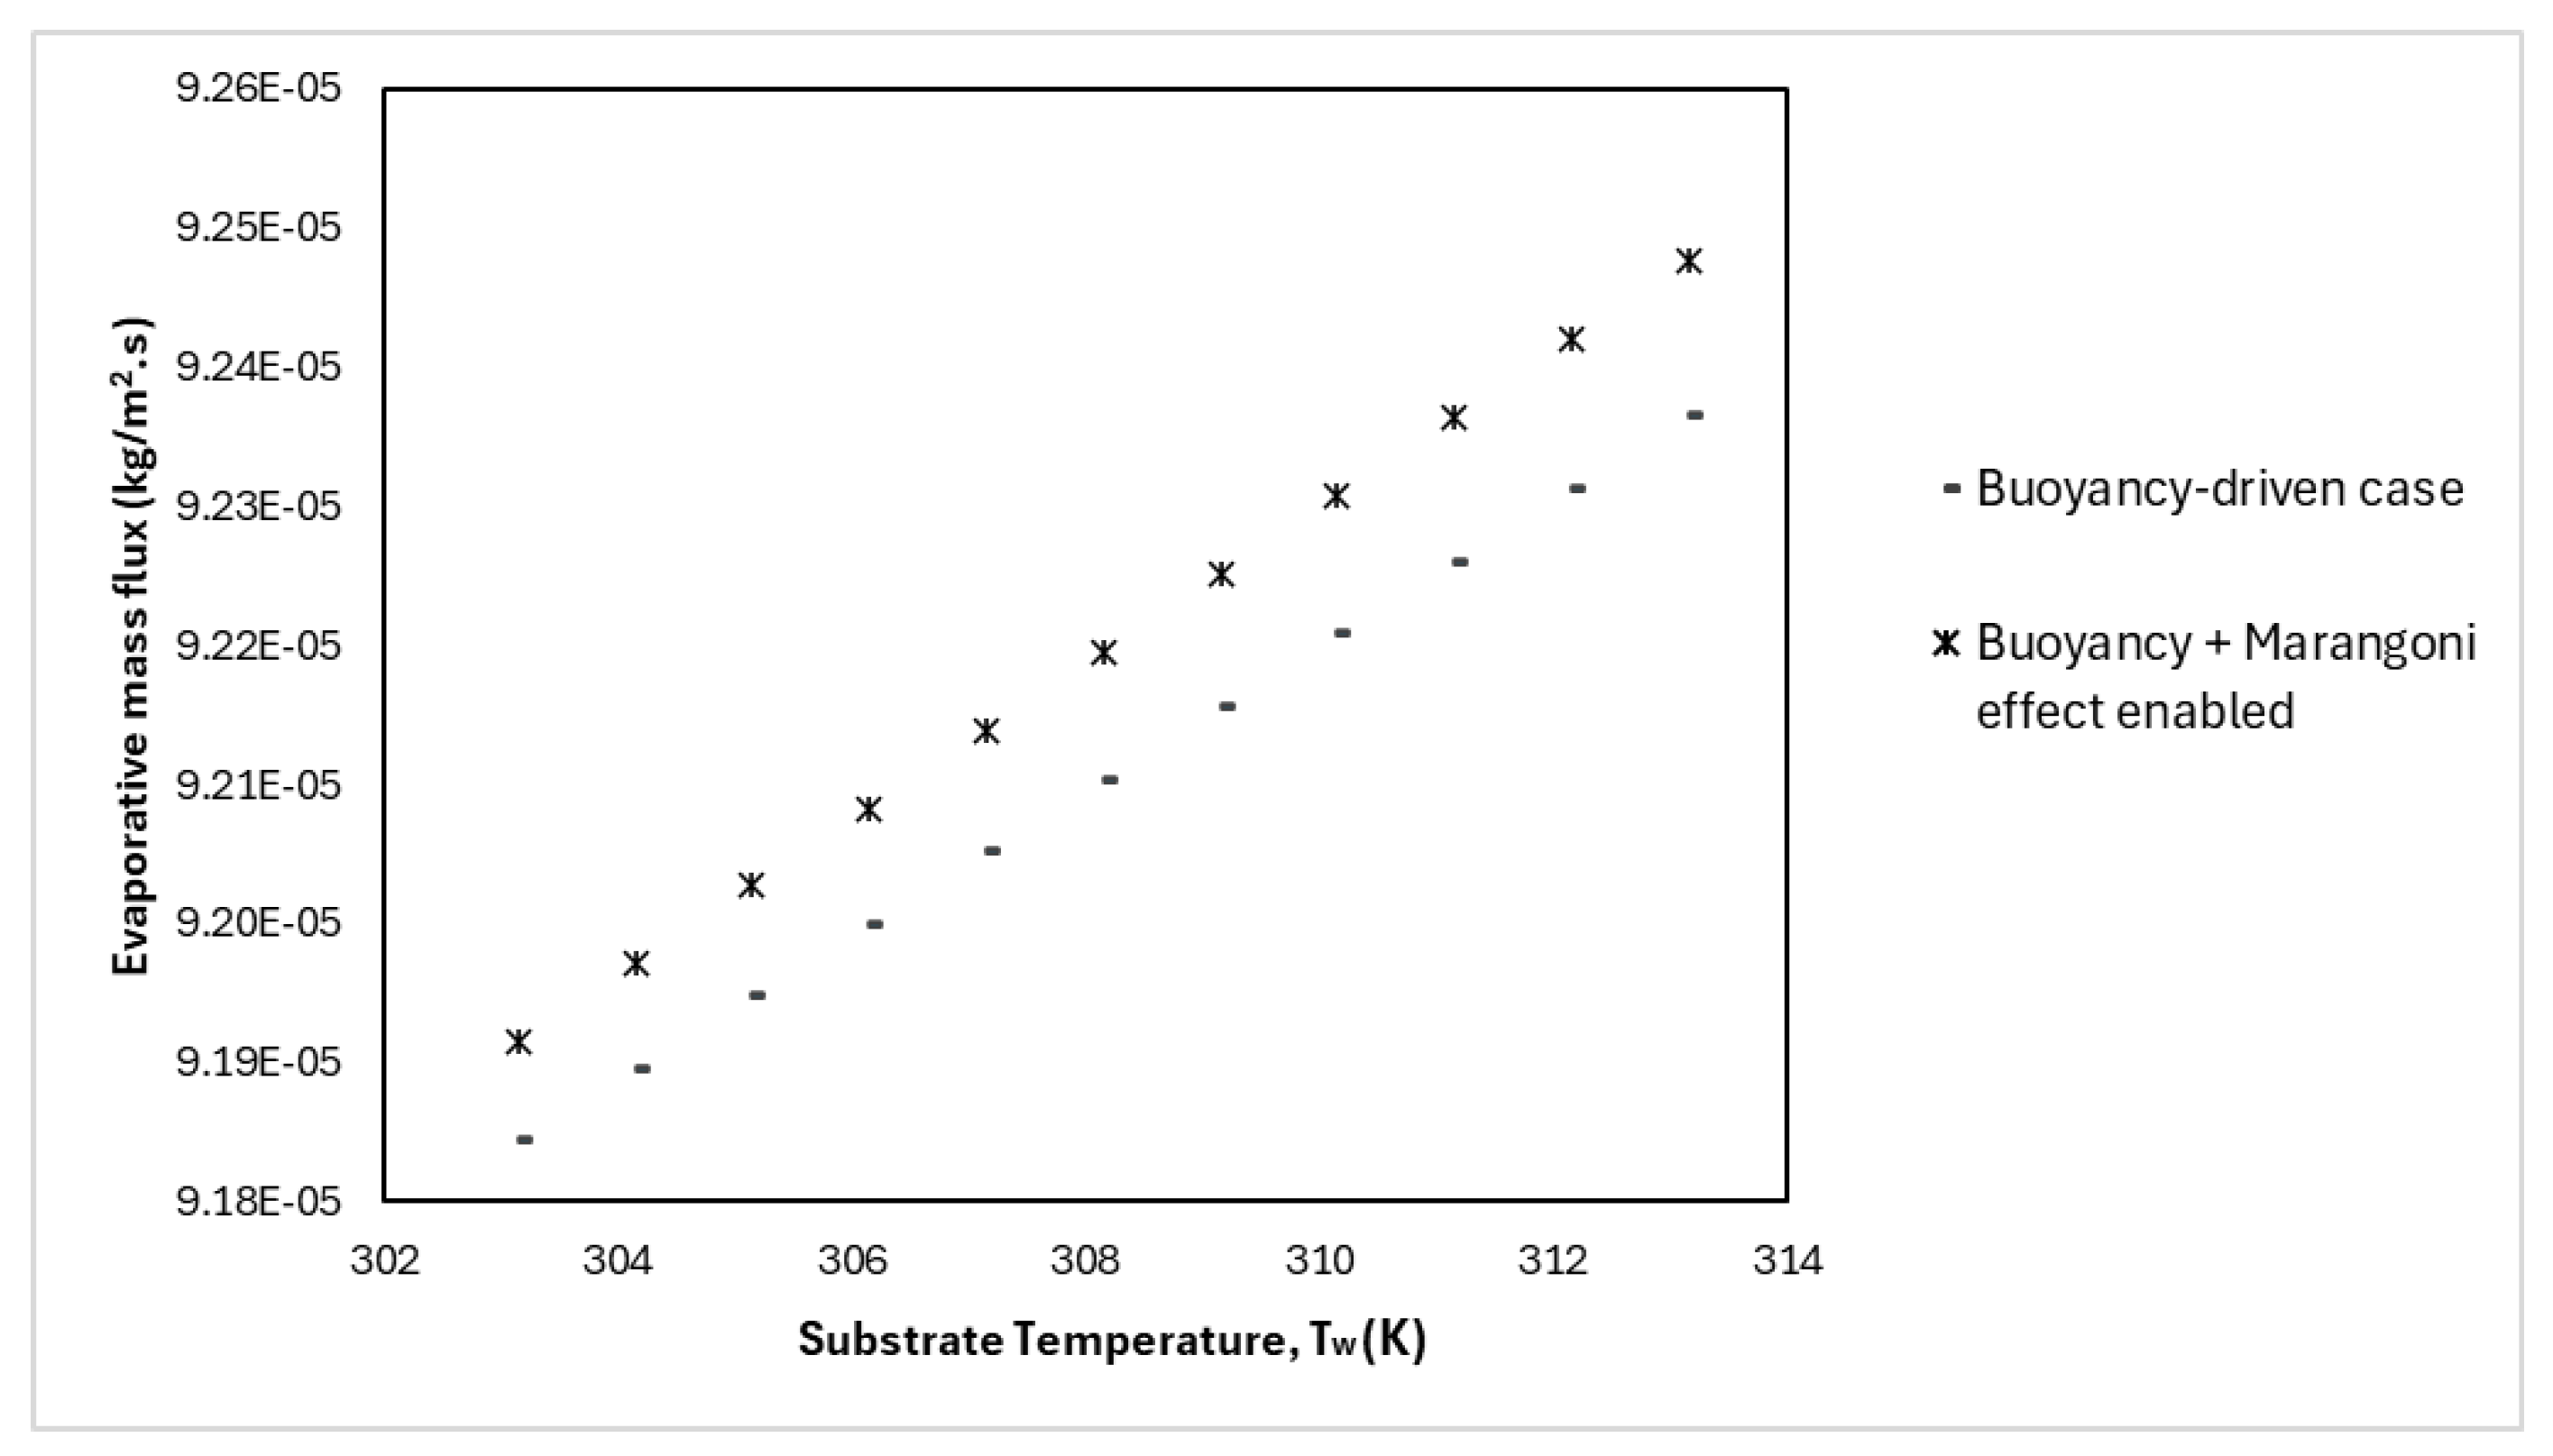
Figure 13.
Total evaporative mass rate versus for buoyancy-only and combined buoyancy–Marangoni cases. The Marangoni-driven case shows significantly higher mass-loss rates.
Figure 13.
Total evaporative mass rate versus for buoyancy-only and combined buoyancy–Marangoni cases. The Marangoni-driven case shows significantly higher mass-loss rates.
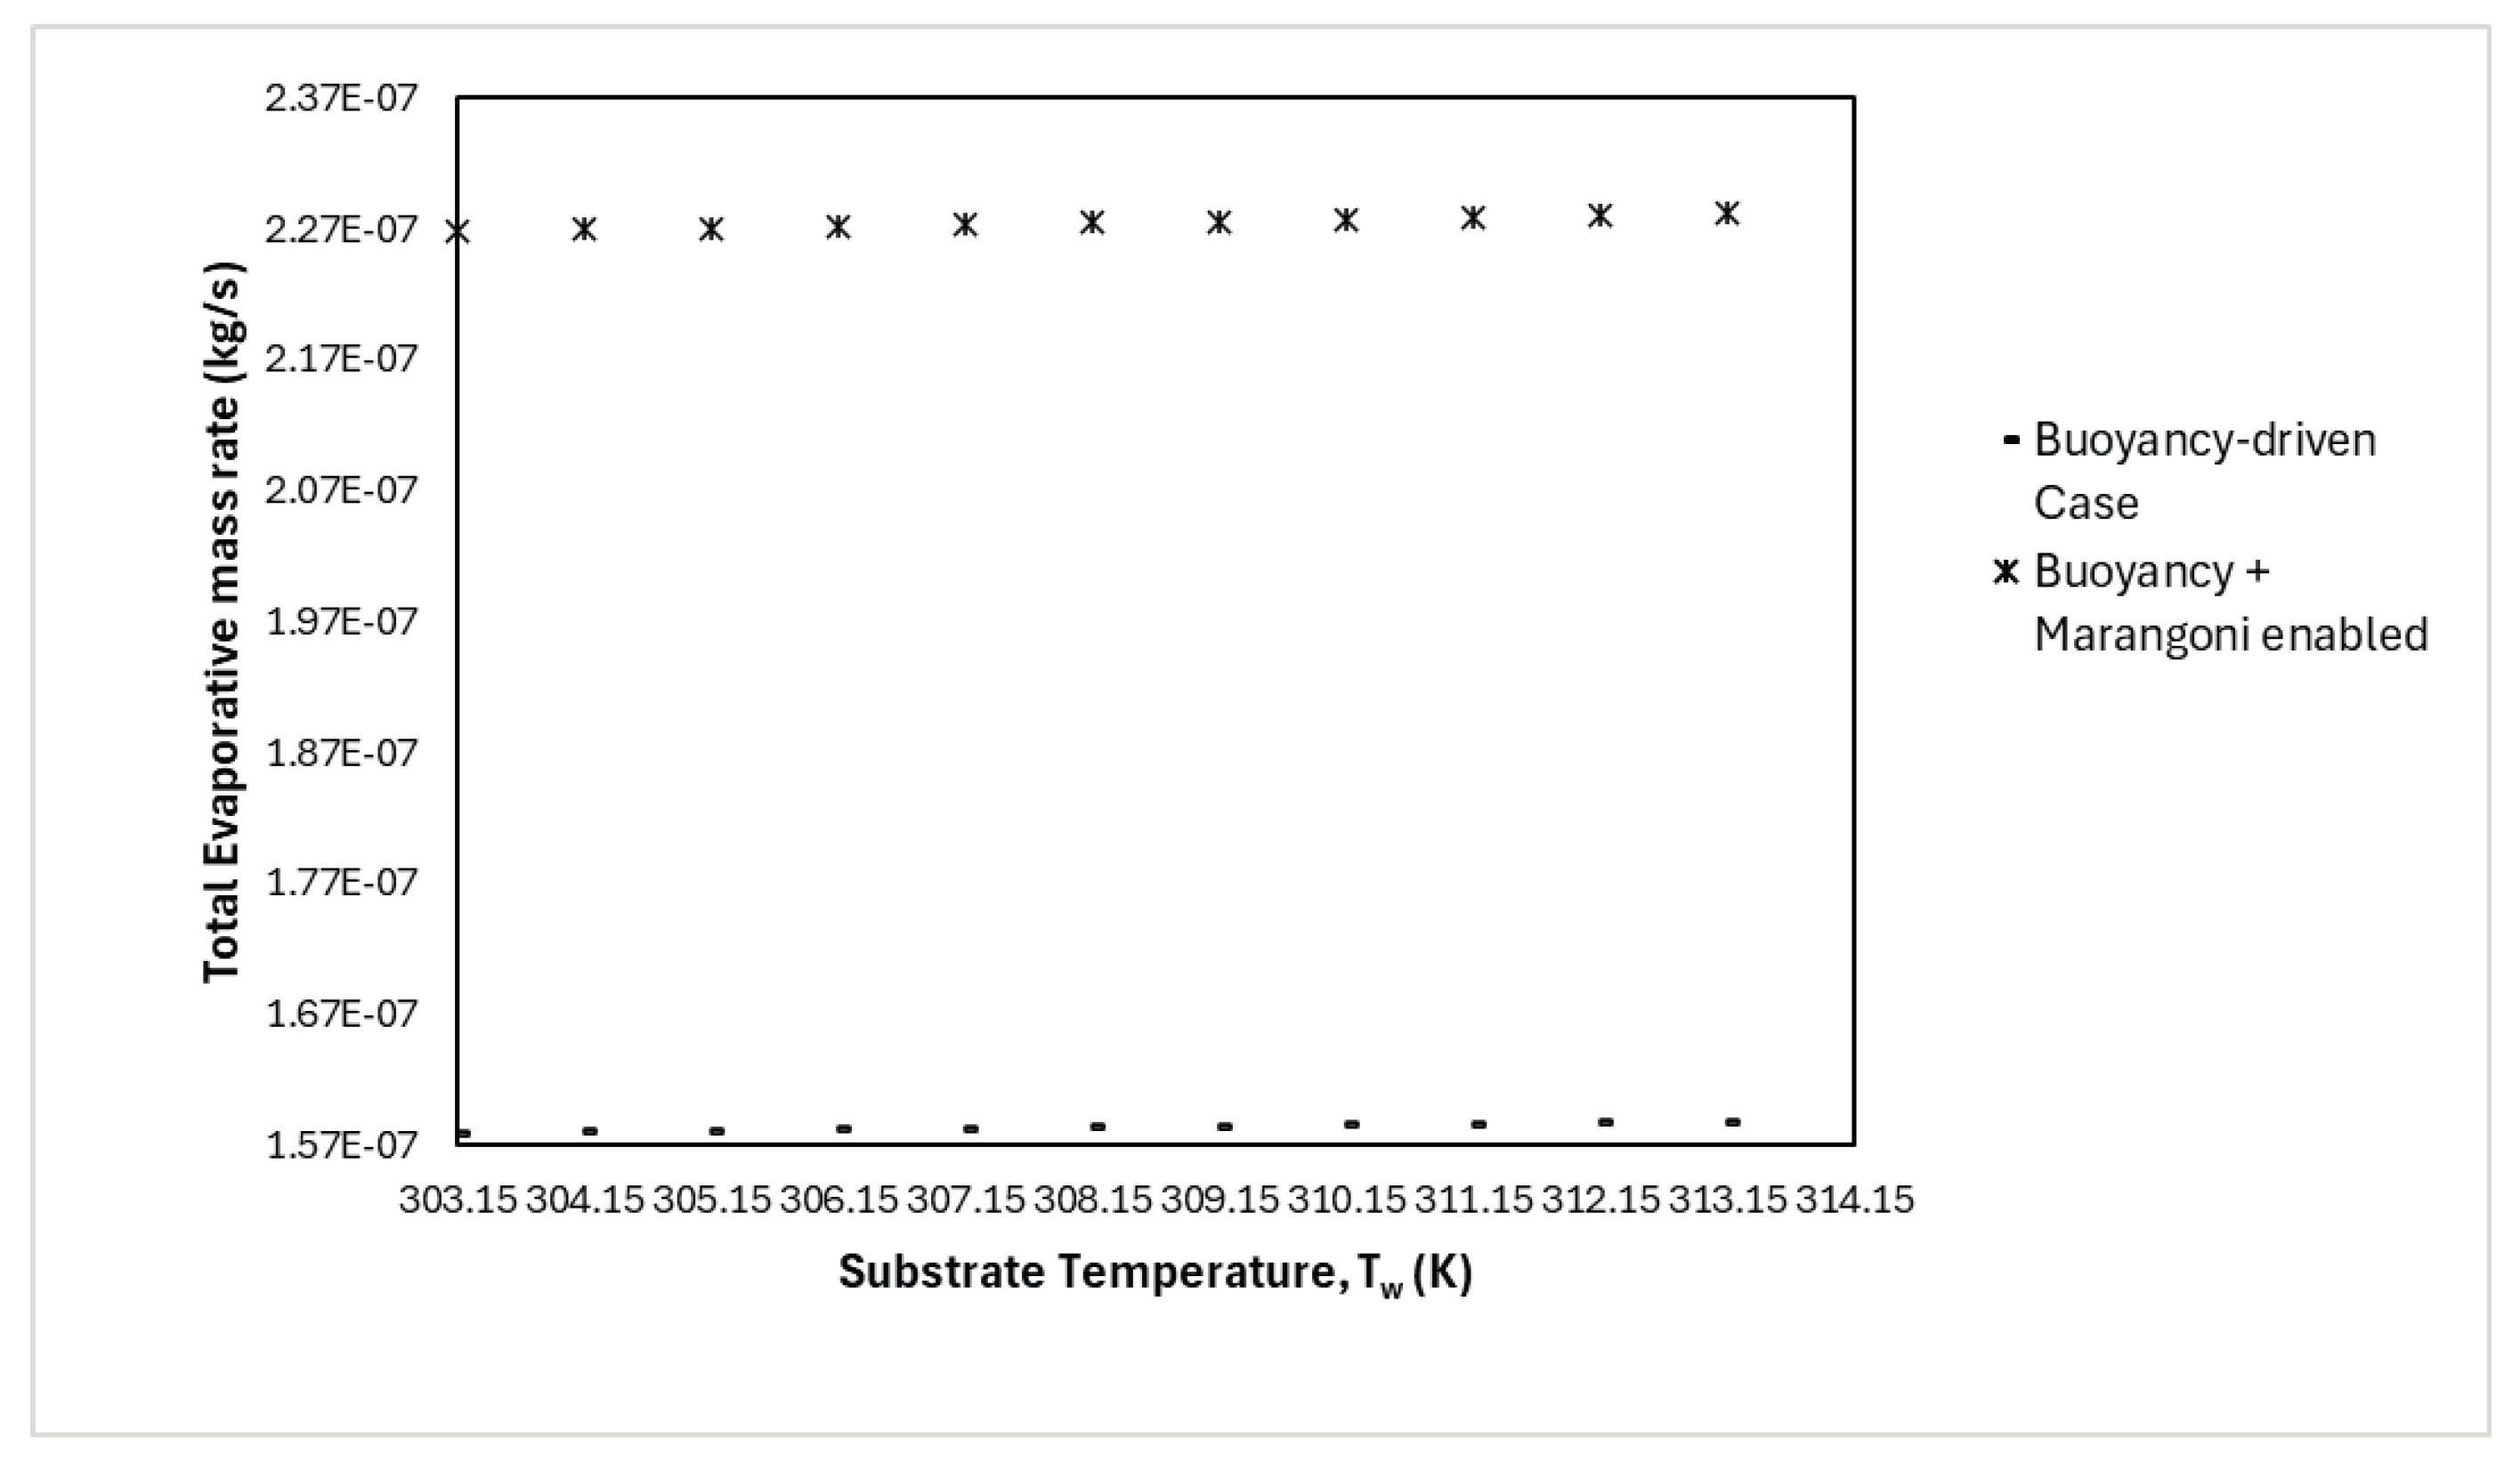

Table 1.
Variables and expressions used to compute evaporative mass flux and convective heat and mass-transfer coefficients.
Table 1.
Variables and expressions used to compute evaporative mass flux and convective heat and mass-transfer coefficients.
| Name | Expression | Description |
|---|---|---|
| Temperature in °C (Antoine) | ||
| Saturation pressure (mmHg→Pa) | ||
| Saturated vapor density | ||
| Pr | Prandtl number of air | |
| Kinematic viscosity | ||
| Thermal diffusivity | ||
| Rayleigh number | ||
| Nusselt number | ||
| Natural convection coefficient | ||
| Mass-transfer coefficient | ||
| Evaporative mass flux | ||
| Total evaporative mass rate |
Table 2.
Constants and material properties defined globally for the droplet-evaporation simulation.
| Name | Value | Description |
|---|---|---|
| 8.07131 | Antoine coefficient | |
| 233.426 | Antoine coefficient | |
| Thermal expansivity | ||
| 1005 J/(kg · K) | Air heat capacity | |
| Regularization constant | ||
| g | m/s2 | Gravity |
| Surface-tension coefficient | ||
| W/(m · K) | Air thermal conductivity | |
| 1 | Lewis number | |
| Air viscosity | ||
| m | Inlet radius | |
| m | Outer radius of droplet | |
| 0.4 | Relative humidity | |
| kg/m3 | Air density | |
| J/(kg · K) | Water-vapor gas constant | |
| N/m | Surface tension at ambient temperature | |
| K | Ambient temperature |
Table 3.
Evaporation metrics for the buoyancy-driven model at various substrate temperatures, including average surface evaporative mass flux and integrated axisymmetric total evaporative mass rate.
Table 3.
Evaporation metrics for the buoyancy-driven model at various substrate temperatures, including average surface evaporative mass flux and integrated axisymmetric total evaporative mass rate.
| (K) | (s) | ( kg/s) |
|---|---|---|
| 303.15 | 9.1844 | 1.5790 |
| 304.15 | 9.1896 | 1.5799 |
| 305.15 | 9.1948 | 1.5808 |
| 306.15 | 9.2000 | 1.5817 |
| 307.15 | 9.2052 | 1.5826 |
| 308.15 | 9.2104 | 1.5835 |
| 309.15 | 9.2156 | 1.5844 |
| 310.15 | 9.2209 | 1.5853 |
| 311.15 | 9.2261 | 1.5862 |
| 312.15 | 9.2313 | 1.5871 |
| 313.15 | 9.2365 | 1.5880 |
Table 4.
Evaporation metrics for the combined buoyancy–Marangoni model across the examined substrate temperatures, including average surface evaporative mass flux and axisymmetric total evaporative mass rate.
Table 4.
Evaporation metrics for the combined buoyancy–Marangoni model across the examined substrate temperatures, including average surface evaporative mass flux and axisymmetric total evaporative mass rate.
| (K) | (s) | ( kg/s) |
|---|---|---|
| 303.15 | 9.1915 | 2.2679 |
| 304.15 | 9.1971 | 2.2693 |
| 305.15 | 9.2027 | 2.2706 |
| 306.15 | 9.2083 | 2.2720 |
| 307.15 | 9.2139 | 2.2734 |
| 308.15 | 9.2195 | 2.2748 |
| 309.15 | 9.2251 | 2.2762 |
| 310.15 | 9.2308 | 2.2776 |
| 311.15 | 9.2364 | 2.2790 |
| 312.15 | 9.2420 | 2.2804 |
| 313.15 | 9.2476 | 2.2818 |
Disclaimer/Publisher’s Note: The statements, opinions and data contained in all publications are solely those of the individual author(s) and contributor(s) and not of MDPI and/or the editor(s). MDPI and/or the editor(s) disclaim responsibility for any injury to people or property resulting from any ideas, methods, instructions or products referred to in the content. |
© 2025 by the authors. Licensee MDPI, Basel, Switzerland. This article is an open access article distributed under the terms and conditions of the Creative Commons Attribution (CC BY) license (http://creativecommons.org/licenses/by/4.0/).
Copyright: This open access article is published under a Creative Commons CC BY 4.0 license, which permit the free download, distribution, and reuse, provided that the author and preprint are cited in any reuse.


