Submitted:
26 December 2025
Posted:
29 December 2025
You are already at the latest version
Abstract
The patch-clamp technique is the gold standard in cellular electrophysiology, employing several configurations. The cell-attached (C-A) mode use to record single-channel currents, while the whole-cell (W-C) mode measures macroscopic currents (the sum of many channels). Switching from the C-A to the W-C configuration on the same cell cause a dramatic increase in current amplitude and the abolition of action currents (ACs). In excitable cells, the presence of ACs, which correspond to action potentials, can interfere with C-A single-channel recordings. To address this, a high-K+ solution is typically applied to the bath to suppress the ACs. The inwardly rectifying K+ (Kir), ATP-sensitive K+ (KATP) and large-conductance Ca2+-activated K+ (BKCa) channels are crucial members of the K+ channel family that facilitate the efflux of K+ ions, driven by the K+ electrochemical gradient. These channels are primarily distinguished by their rectification properties and gating kinetics. For instance, KATP channels exhibit a bursting kinetic pattern with inward rectifying property, while BKCa channels display strong outward rectification. Mitoxantrone, which belongs to a class of drugs called anthracenediones, can suppress the activity of Kir channels in differentiated RAW 264.7 cells, with no change in single-channel conductance. The respiratory stimulator GAL-021 acts as a BKCa channel inhibitor, and it suppresses channel activity and shifts the activation curve to the right, suggesting a voltage-dependent blockade that stabilizes the channel in a closed state. GAL-021 does not change the single-channel conductance, indicating it is a gating modifier rather than an open-pore blocker. The functional roles of ion channels are fundamentally important. Correspondingly, the field is transitioning to artificial intelligence for automated single-cell patch clamp experiments, though brain slice recordings still require manual techniques.
Keywords:
patch‐clamp technique
; whole‐cell configuration
; cell‐attached configuration
; action current
; ion‐channel activity
; mitoxantrone
; GAL‐021
; brain slice patch clamp recording
1. Introduction
The patch-clamp technique is widely regarded as the gold standard in electrophysiology, thank for its unmatched ability to deliver high-resolution insights into the electrical activity of cells and their ion channels. Its versatility lies in the various experimental configurations, which enable researchers to precisely manipulate and control the conditions on both sides of the cell membrane (Hamill et al., 1981; Neuroverse Podcast, 2025). The commonly used patch-clamp configurations are cell-attached (C-A), inside-out, outside-out, and whole-cell (W-C) modes (Hamill et al., 1981; Wilson et al., 2011). Of these, the cell-attached (C-A) and whole-cell (W-C) modes are the two most frequently used. Figure 1 is a schematic cartoon that briefly illustrates the main differences between the two configurations. However, their operation often involves specific challenges, such as the direction of ionic flow across the membrane and the associated rectification properties. Rectification in the dynamics of ion channels refers to the fact that ions move more easily in one direction than in the other, which a property similar to that of semiconductors. This article aims to present essential information and clear key concepts commonly encountered during operation, serving as a useful reference.
2. Ionic Currents Evoked by Ramp or Rectangular Pulse Recorded Under Cell-Attached (C-A) and Whole-Cell (W-C) Voltage-Clamp Configurations
As illustrated in Figure 2A, during these measurements, INS-1 pancreatic -cells were maintained in standard Tyrode’s solution, and recordings were obtained using pipettes filled with a K+-rich internal solution. INS-1 pancreatic -cells are a rat insulinoma-derived cell line widely used as a model to study pancreatic cell physiology, glucose metabolism, and insulin secretion (Kusunoki et al., 2025; Parker et al., 2025). In the C-A configuration, after achieving a gigaohm seal, ramp pulses of 1 sec duration evoked only relatively small ionic currents. Notably, a repetitive inward current was observed during the upsloping phase of the ramp, with a threshold potential near –22 mV. The amplitude of this inward current (shown in blue) gradually diminished and broadened as the membrane depolarized.
Upon transition to the W-C configuration following patch rupture, the ramp-evoked currents (shown in red) increased dramatically—approximately 20-fold compared to C-A recordings. In the same cells, membrane resistance between –40 and +40 mV decreased sharply from 2.21±0.03 to 0.089±0.01 G (n = 12, P < 0.05). Interestingly, the trains of action currents (ACs) evident in C-A mode were abolished under W-C conditions, leaving only a small inward current around 0 mV. Furthermore, both inwardly rectifying K+ currents of modest amplitude and prominent outwardly rectifying K+ currents were detected in response to the ramp protocol.
To better characterize the biophysical properties of ionic currents in INS-1 cells, command voltage was switched to a rectangular pulse protocol. As shown in Figure 2B, under the C-A mode, when the cell was held at –50 mV and depolarized to +50 mV for 1 sec, a small outward current (blue trace) was observed together with a train of inward currents (red arrowhead, labeled b). These inward currents exhibited spike-frequency adaptation and are referred to as ACs, corresponding to the generation of action potentials (APs) (O’Neill and Tung, 1991; Haug et al., 2004; Mason et al., 2005; Wu et al., 2009; Alcami et al., 2012). Spike-frequency adaptation in excitable cells refers to the gradual reduction in firing rate during sustained constant current injection, caused by intrinsic ionic mechanisms that limit excitability over time. Notably, once the patch membrane was ruptured, the current amplitude was increased substantially. Transitioning from C-A to W-C mode resulted in a marked reduction in membrane resistance during depolarization from –50 to +50 mV, decreasing from 3.48±0.09 to 0.35±0.02 G (n = 12, P < 0.05). In the same cells, both a transient voltage-gated Na+ current, characterized by rapid activation and inactivation (red arrowhead a), and a delayed-rectifier K+ current with slow inactivation were simultaneously recorded. However, while the ACs were observable in the C-A configuration, they were no longer discernible upon transition to the W-C mode. Overall, under these experimental conditions, approximately 70% of INS-1 cells exhibited repetitive AC firing.
3. Measurement of Resting Membrane Potential Under C-A Mode
Determining the resting membrane potential can be difficult to some extent in the C-A mode. Figure 3 provides a suitable example for illustration. When using C-A single-channel recordings to measure inwardly rectifying K+ (Kir) channels, if the bath solution is normal Tyrode’s solution (containing ~5.4 mM K+) and the recording pipette is filled with a K+-rich solution (~140 mM), the reversal potential—that is, the potential at which single-channel current neither flows inward nor outward—becomes positive as a function of voltage (Figure 3B). This occurs because the patch potential is the sum of the resting potential and the pipette potential, while voltage is defined as the potential relative to the bath (Clark et al., 1990; Wu et al., 1998; Lee et al., 2015). In contrast, under the W-C configuration, the resting membrane potential of the cell is approximately –70 mV (Figure 2).
Figure 3A shows Kir-channel activity recorded from RAW 264.7 osteoclast precursors, which is sensitive to suppression by mitoxantrone. An osteoclast is a large, multinucleated cell responsible for breaking down bone tissue through a process called bone resorption. Mitoxantrone (Novantrone®, 1,4-dihydroxy-5,8-bis [2-(2-hydroxyethylamino)ethylamino]anthracene-9,10-dione), a synthetic anthracenedione chemotherapeutic agent used in cancer treatment and multiple sclerosis (Dalla-Costa and Comi, 2025), has been observed to suppress Kir channels (Wang et al., 2012). Notably, the channel activity was observed in the C-A mode, when outward currents were recorded at a potential of +50 mV relative to the bath (pipette potential), which, from the perspective of the cell membrane, actually represent inward K+ current. This voltage (i.e., patch potential) corresponds to approximately 120 mV relative to the resting membrane potential (50 plus 70 mV). Of note, this form of single-channel current exhibited a relatively long mean open time, making it readily distinguishable from other ion channels present in the same cells (Clark et al., 1990; Wang et al., 2012; Tsai et al., 2013).
Figure 3B illustrates the current-voltage (I-V) relationships of Kir channels in lipopolysaccharide-differentiated RAW 264.7 cells, both in the absence and presence of mitoxantrone. Mitoxantrone treatment did not significantly alter the single-channel conductance, as reflected by the unchanged linear slope of the I-V curve. Importantly, the recorded currents are negative, which correspond to inward currents from the cellular perspective—indicating that K+ ions move from the extracellular space into the cytoplasm, driven by their electrochemical gradient (Wang et al., 2012; Tsai et al., 2013).
The Kir2.x subfamily has been identified as the predominant inward rectifier expressed in differentiated RAW 264.7 cells (Tsai et al., 2013). However, it remains unclear whether mitoxantrone-induced inhibition of Kir channels represents an intrinsic property of neurons or glial cells, including microglia (Clark et al., 1990; Tsai et al., 2013; So et al., 2014). This mechanism is of particular interest, as modulation of Kir-channel activity may hold therapeutic potential in multiple sclerosis (Wu et al., 2015; Dalla-Costa and Comi, 2025). Multiple sclerosis is a chronic autoimmune demyelinating disorder in which the immune system attacks the central nervous system, leading to damage of the protective myelin sheath surrounding axons and subsequent impairment of neuronal signaling (Montague et al., 2025).
4. Differences Between ATP-Sensitive K+ (KATP) Channels and Large-Conductance Ca2+-Activated K+ (BKCa) Channels in the C-A Configuration
When using the C-A single-channel recordings, the holding potential displayed on the instrument (i.e., patch amplifier) is negative, but for the cell being examined, it is actually positive. Therefore, what appears as a downward deflection representing inward current on the recording is, in fact, an upward deflection representing outward current from the cell’s perspective, as demonstrated in Figure 4. Because of this discrepancy, some early studies appeared to mistakenly report KATP channel activity when they were actually observing the activity of BKCa channels.
The large-conductance Ca2+-activated K+ channels—also known as BK, BKCa, or maxi-K channels—are a unique type of channel. They open in response to membrane depolarization and elevated intracellular Ca2+, permitting large outward-rectifying K+ currents to flow (Wu et al., 2006, 2009, 2021, 2025; Lee et al., 2015; Lu et al., 2020). The single-channel conductance of BKCa channels in symmetrical K+ solution (~140 mM) is 150-250 pS. However, when the bath solution contains low K+ (i.e., normal Tyrode’s solution), their conductance can be around 100-150 pS, a value which is close to that of KATP channel.
The ATP-sensitive K+ channels (KATP channels) are K+ channels that link the cell’s metabolic state to its electrical activity. They close when intracellular ATP levels are high and open ATP levels fall, helping regulate processes, such as hormonal release (i.e., insulin release), vascular tome, and protection during metabolic stress (Wu et al., 2000, 2007).
Both of these channels exhibit mean open times on the order of a few milliseconds, whereas classical Kir channels (such as Kir2.1), as described above in RAW 264.7 cells, typically remain open for several hundred milliseconds (Figure 3), making them much easier to distinguish. It is thus important to note that KATP channels display bursting kinetics characterized by a mean intraburst open time of ~1 msec, whereas BKCa channels typically lack this behavior (Wu et al., 2000, 2021; Hibino et al., 2010). In addition, rectification properties provide an important means of distinguishing between the two: KATP channels display mild inward rectification, while BKCa channels exhibit strong outward rectification (Hibino et al., 2010; Liu et al., 2019; Lu et al., 2020; Wu et al., 2025). Figure 4 illustrates a schematic representation of KATP channel activity.
5. Interference of Single-Channel Activity by Action Currents (ACs) in C-A Current Recordings
When using C-A single-channel recordings, if the bath solution is normal Tyrode’s solution (containing ~5.4 mM K+), the recording electrode is filled with K+-rich solution, and the holding potential is very negative (e.g., below -80 mV), corresponding to a voltage of about more than +10 mV relative to the bath, the appearance of inward currents observed from the pipette’s perspective may indicate the presence of BKCa-channel currents. However, such currents could also be action currents (ACs), if the cell is electrically excitable. In this situation, the single-channel current traces are easily disturbed and distorted (Fenwick et al., 1982; Aschroft et al., 1987; O’Neill and Tung, 1991; He et al., 1998; Lieste et al., 1998; Fricker et al., 1999; Tyzio et al., 2003; Axmacher and Miles, 2004; Haug et al., 2004; Wu et al., 2009; Alcami et al., 2012; Liu et al., 2019). Consequently, analyzing the single-channel kinetics of BKCa channels (such as mean open time or mean closed time) becomes severely compromised due to contamination by the activity of ACs. To avoid interference from ACs, a good approach is to replace the bath solution with a high-K+ solution (about 140 mM). This shifts the reversal potential for K+ ions close to 0 mV, thereby suppressing AC occurrence through excessive depolarization of the cells. However, prolonged exposure to high-K+ solution may greatly reduce cellular activity.
When using C-A single-channel recordings in electrically excitable cells, ACs often appear (which correspond to the action potentials [APs] observed in W-C current-clamp recordings) (O’Neill and Tung, 1991; Haug et al., 2004; Mason et al., 2005; Wu et al., 2009; Wilson et al., 2011; Alcami et al., 2012; Liu et al., 2019). Typically, their deflections in the same direction as those of BKCa channels, although their directions are biphasic to some extent. Moreover, the duration of ACs is relatively short, whereas the duration of BKCa channel openings can vary, sometimes brief and sometimes prolonged. However, when the activity of BKCa channels is relatively low, their opening duration is also short, making them indistinguishable from ACs.
In W-C recordings, when using the voltage-clamp configuration combined with variable voltage-clamp protocols enables the observation of many distinct types of macroscopic ionic currents. In contrast, switching to the current-clamp configuration with the holding current set to 0 pA allows measurement of the cell’s the resting membrane potential. Furthermore, in electrically excitable cells, appropriate current injection can elicit action potentials (APs), and spontaneous APs may occasionally be observed, depending on the cell types (Wu et al., 2009; Wilson et al., 2011; Lee et al., 2015; Liu et al., 2019). Sustained AP firing can also occur when a constant holding current is applied, thereby depolarizing the membrane potential.
In the early days, commonly used microelectrode amplifiers such as the Axoclamp-2B (Molecular Devices, San Jose, CA) made switching from single-electrode voltage-clamp mode to current-clamp mode rather cumbersome and difficult to operate. In contrast, many modern patch amplifiers—such as Axopatch 1D, Axopatch 200B (Molecular Devices), EPC-7 (HEKA Elektronik, Lambrecht, Germany), or RK-400 (Bio-Logic, Claix, France)—allow much easier switching between voltage-clamp and current-clamp modes (Wu et al., 2009, 2021; Wilson et al., 2011; Lee et al., 2015; Liu et al., 2019; Wang et al., 2025).
In C-A voltage-clamp recordings, single-channel events are often detectable. However, action currents (ACs) which correspond to action potentials (APs) in current-clamp recordings may also be recorded simultaneously (Lieste et al., 1998; Fricker et al., 1999; Perkins, 2006; Wu et al., 2009; Alcami et al., 2012; Hallerman et al., 2012; Lee et al., 2015; Lo et al., 2015; Liu et al., 2019). Moreover, a shift from C-A voltage-clamp to current-clamp recording mode often results in observable changes in membrane potential (Wang et al., 2025). Yet, under this circumstance, due to differences in the position of the holding current, the true resting membrane potential cannot be accurately measured, particular when the bath solution contains low K+ (approximately 5.4 mM K+). In addition, under C-A current-clamp mode, spontaneous APs can easily be confused with subthreshold depolarizations or synaptic potentials accompanied by spiking firing. Subthreshold oscillations refer to rhythmic fluctuations in a neuron’s membrane potential that occur below the threshold required to trigger an AP (Fricker et al., 1999; Mahon et al., 2003; Axmacher and Miles, 2004; Wu et al., 2009; Liu et al., 2019; Huang et al., 2024; Wang et al., 2025).
6. Modification of BKCa-Channel Activity by GAL-021 in GH3 Cells
In this study, we further demonstrated that inhibitory effect of GAL-021 on the channel opening of BKCa channels. The compound GAL-021 (also known as ENA-001, 6-(methoxy(methyl)amino)-N²,N⁴-di-propyl-1,3,5-triazine-2,4-diamine) is a small-molecule drug developed as a novel breathing control modulator and a respiratory stimulant. As demonstrated in Figure 5, under high-K+ conditions, the activities of these channels can be readily observed in an excised inside-out patch. When the detached patch was exposed to GAL-021, the activity of channel openings was progressively reduced (McLeod et al., 2014; Lu et al., 2020; Hung et al., 2021; Zhao et al., 2025). The open-state probability of the channel measured at the level of +60 mV under control condition (no GAL-021) was found to b1 0.182±0.012 (n = 8). The addition of GAL-21 (10 M) to the bath medium decreased the channel activity to 0.022±0.002 (n=8, P < 0.01). However, there was no significant difference in the amplitude of the unitary outward current between the absence and presence of GAL-021. It is clear that the presence of GAL-021 can decrease the opening probability of BKCa channels in these cells, but not that of KATP channels (Wu et al., 2021; Zhao et al., 2025).
The study also investigated the effect of GAL-021 on the single-channel conductance of BKCa channels using the voltage-clamp technique on inside-out patches. This method allowed for the construction of single-channel amplitude versus membrane potential (I-V) relationships by applying voltage ramp pulses from 0 to +120 mV for 1 sec over 1 sec. Figure 6A depicts the single-channel amplitude versus membrane potential (I-V) relationships of BKCa channels with or without the addition of GAL-021 (3 M). The single-channel conductance of BKCa channels achieved from the linear I-V relationship in control (no GAL-021) was 165±7 pS (n = 11) with a reversal potential of 0±1 mV (n = 11). The value was not found to differ significantly from that (164±6 pS; n = 11, P > 0.05) measured in the presence of GAL-021 (3 M). Therefore, GAL-021 produced no significant change in the single-channel conductance of BKCa channels, but it suppressed the channel activity in these cells, along with a prolongation in mean closed time of the channel (Lu et al., 2020). The results suggest a mechanism where GAL-021 stabilizes the channel in a non-conducting (closed) state without physically blocking the open pore.
Figure 6B illustrates the activation curve of BKCa channels taken from the absence or presence of GAL-021 (3 M). To determine the effect of GAL-021 on the activation curve of BKCa channels, the upsloping ramp pulses from +20 to +120 mV with a duration of 1 sec were designed and creased from pCLAMP 10.7, and they were then applied to the membrane patch through digital-to-analog conversion. During the single-channel current recordings, the linear ramp pulses were delivered from +20 to +120 mV for 1 sec. The activation curve obtained during ramp pulses were calculated by averaging the current traces from 20 voltage ramps, then normalizing each mean current value to the corresponding single-channel amplitude at that potential, after correcting for the leakage component. The plot of the relative open probability as a function of membrane potential applied were thereafter constructed and then fitted with a modified Boltzmann function. In control, V1/2 = +66.8±2.3 mV and q = 4.3±0.2 e (n = 7), whereas in the presence of GAL-021 (3 M), V1/2 = +79.3±2.6 mV and q = 4.1±0.2 e (n = 7). Consequently, the presence of GAL-021 (3 M) caused a 45% decrease in the maximal open probability of BKCa channels. However, there was no significant effects on the gating charge of the curve occurring during exposure to GAL-021. This study led us to indicate that GAL-021 could suppress the activity of these BKCa channels in a voltage-dependent fashion in GH3 cells (Lu et al., 2020). GAL-021 may possess a distinctive structural property that enables functional interaction with the a-subunit of the BKCa (KCNMA1) channel, thereby reducing the amplitude of whole-cell Ca2+-activated K+ currents (Lu et al., 2020; Hung et al., 2021).
7. Brain Slice Patch-Clamp Recordings
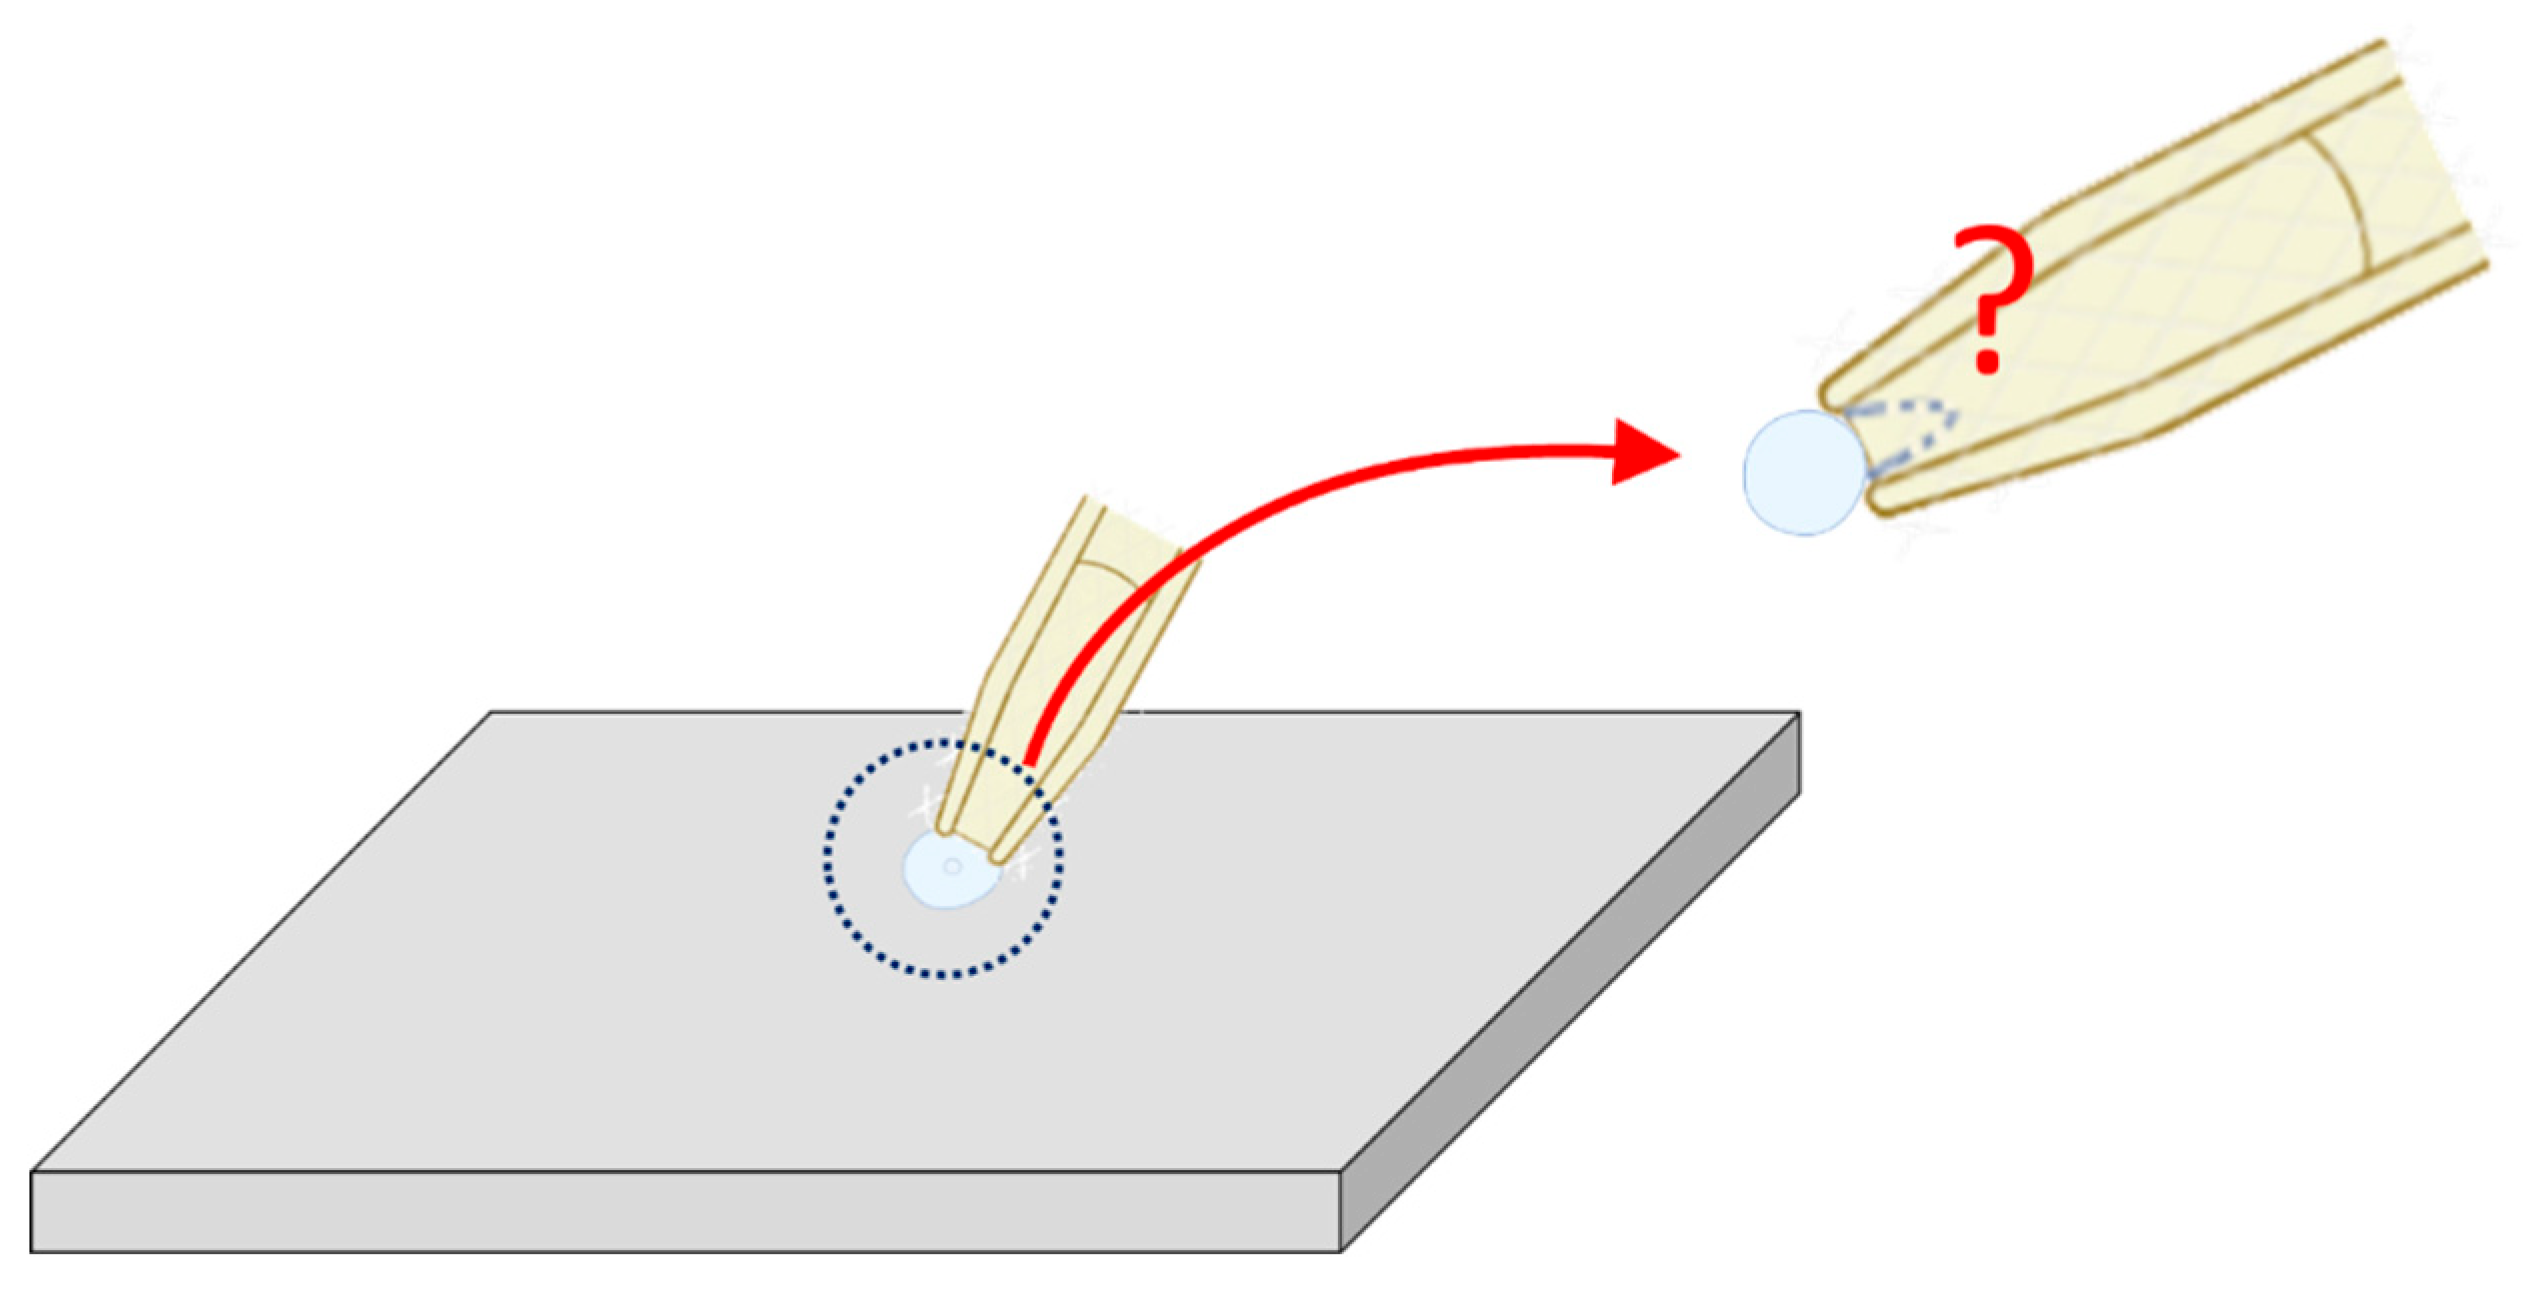
A brain slice is a thin section of brain tissue, usually prepared with a vibratome, that is kept alive in artificial cerebrospinal fluid. Researchers use brain slices because they preserve much of the brain’s local circuitry while allowing direct experimental access (Huang et al., 2007; Alcami et al., 2012; Bak et al., 2024). Brain slice patch-clamp recording is a commonly used electrophysiological method. However, because the patch electrode has a relatively large tip diameter, only sufficiently large neurons can be recorded appropriately. In addition, since the cell membrane is very fragile, it is often difficult during the procedure to distinguish whether the recording configuration in W-C mode or C-A mode, as demonstrated in Figure 7. When the electrode tip is too small (e.g., less than 1 m), the membrane may reseal after membrane rupture in W-C mode, thereby reverting a C-A configuration. Furthermore, interference from excitatory or inhibitory synaptic currents adds to the complexity (Fricker et al., 1999; Mahon et al., 2003; Tyzio et al., 2003; Axmacher and Miles, 2004; Mason et al., 2005; Huang et al., 2007; Wilson et al., 2011; Alcami et al., 2012; Lee et al., 2015; Bak et al., 2024; Wang et al., 2025). As a result, interpretation of the recordings becomes more challenging, and the reproducibility of experimental outcomes is greatly affected (Fricker et al., 1999; Mason et al., 2005; Huang et al., 2007; Wilson et al., 2011; Liu et al., 2019; Fernandez-Chiappe and Muraro, 2022; Bak et al., 2024). Therefore, in experiments such as brain slice patch clamping, the size of the cell is an important factor for the operator to consider when selecting cells for electrophysiological measurements (Figure 7).
8. Conclusions
In earlier electrophysiological experiments, amplifiers were typically connected to oscilloscopes to observe the dynamic changes in voltage and current. Subsequently, through a data acquisition board, analog-to-digital conversion was performed to transform analog signals into digital form, allowing effective storage on personal computers (Robinson and Giles, 1986; Wu et al., 2009; Wilson et al., 2011). Nowadays, digital-to-analog conversion capability has also been incorporated, enabling various digitized voltage profiles—such as specific ramp voltage shapes or realistic action potential waveforms—to be reconverted into analog signals. These analog signals are subsequently employed to precisely regulate the patch amplifier and, in turn, the electrical environment of the cells, as described from the pCLAMPTM 11 software suite or the HEKA system (https://www.heka.com/). Moreover, while strip chart recorders were once used to print experimental results, personal computers are now employed for analysis and output.
As a result, these developments have made it difficult for senior electrophysiologists to update or replace their instruments or devices in line with advances in technology and artificial intelligence. Meanwhile, younger scholars tend to focus more on computer operation, often neglecting the practical skills and techniques of patch-clamp recording. Additionally, automated patch-clamp system (such as QPatch®; Sophion Bioscience; Ballerup, Denmark, and the Port-a-Patch® system; Nanion Technologies GmbH; Munich, Germany), as well as HEKA’s manual patch-clamp amplifier (HEKA Technologies GmbH), has led to significant breakthroughs in the study of various voltage-gated and ligand-gated ion currents. Although automated patch clamp systems efficiently replace manual methods for isolated cells, brain slice patch-clamp recordings remain a manual technique. Effective robotic platforms used for complex tissue slices awaits further technological developments (Perkins, 2006; Huang et al., 2007; Liu et al., 2019; Fernandez-Chiappe and Muraro, 2022; Bak et al., 2024; Qiu et al., 2025). For example, artificial intelligence (AI)-driven image recognition can identify suitable cells for recordings under the microscope. Machine learning algorithms can guide micropipette positioning with high precision, reducing human error. It is hoped that AI can help determine when to transition from C-A to W-C mode by analyzing resistance and capacitance changes automatically in the near future.
Author Contributions
Writing—review & editing, Supervision, Validation, Investigation, Data curation, Conception— S.-N.W., Conceptualization, Data curation, Investigation—Y.-J.W., Investigation, Data curation, Funding acquisition, Project administration—V.R. All authors have read and agreed to the published version of the manuscript.
Funding
This work was supported in part by the National Science and Technology Council (NSTC-112-2923-B-006-0016-028), Taiwan; An Nan Hospital, Taiwan (ANHRF112-43 and ANHRF112-44). This research was also funded by the Lithuania-Latvia-Taiwan collaborative project. All conclusions, recommendations, and expressed opinions within this work are based on the authors’ independent research. They do not reflect the official policies or views of the funding organizations or institutions that supported this research.
Data Availability Statement
No new data were created or analyzed in this study. Data sharing is not applicable to this article.
Conflicts of Interest
The author declares no conflicts of interest.
Abbreviations
AC, action current; AP, action potential; BKCa channel, large-conductance Ca2+-activated K+ channel; C-A, cell-attached; I-V, current versus voltage; Kir channel, inwardly rectifying K+ channel; KATP channel, ATP-sensitive K+ channel; W-C, whole-cell.
References
- Alcami, P; Franconville, R; Llano, I; Marty, A. Measuring the firing rate of high-resistance neurons with cell-attached recording. J Neurosci 2012, 32(9), 3118–30. [Google Scholar] [CrossRef]
- Ashcroft, FM; Ashcroft, SJ; Harrison, DE. Effects of 2-ketoisocaproate on insulin release and single potassium channel activity in dispersed rat pancreatic beta-cells. J Physiol 1987, 385, 517–29. [Google Scholar] [CrossRef] [PubMed]
- Axmacher, N; Miles, R. Intrinsic cellular currents and the temporal precision of EPSP-action potential coupling in CA1 pyramidal cells. J Physiol 2004, 555 Pt 3, 713–25. [Google Scholar] [CrossRef]
- Bak, A; Koch, H; van Loo, KMJ; Schmied, K; Gittel, B; Weber, Y; Ort, J; Schwarz, N; Tauber, SC; Wuttke, TV; Delev, D. Human organotypic brain slice cultures: a detailed and improved protocol for preparation and long-term maintenance. J Neurosci Methods 2024, 404, 110055. [Google Scholar] [CrossRef]
- Clark, RB; Nakajima, T; Giles, W; Kanai, K; Momose, Y; Szabo, G. Two distinct types of inwardly rectifying K+ channels in bull-frog atrial myocytes. J Physiol 1990, 424, 229–51. [Google Scholar] [CrossRef]
- Dalla Costa, G; Comi, G. Updates on immunosuppressant safety and malignancy risk in patients with multiple sclerosis. Expert Opin Drug Saf 2025, 1–17. [Google Scholar] [CrossRef] [PubMed]
- Fenwick, EM; Marty, A; Neher, E. A patch-clamp study of bovine chromaffin cells and of their sensitivity to acetylcholine. J Physiol 1982, 331, 577–97. [Google Scholar] [CrossRef] [PubMed]
- Fernandez-Chiappe, F; Muraro, NI. Patch-Clamping Fly Brain Neurons. Cold Spring Harb Protoc 2022, 2022(8), Pdb.top107796. [Google Scholar] [CrossRef]
- Fricker, D; Verheugen, JA; Miles, R. Cell-attached measurements of the firing threshold of rat hippocampal neurones. J Physiol 1999, 517 Pt 3)(Pt 3, 791–804. [Google Scholar] [CrossRef]
- Hallermann, S; de Kock, CP; Stuart, GJ; Kole, MH. State and location dependence of action potential metabolic cost in cortical pyramidal neurons. Nat Neurosci 2012, 15(7), 1007–14. [Google Scholar] [CrossRef]
- Hamill, OP; Marty, A; Neher, E; Sakmann, B; Sigworth, FJ. Improved patch-clamp techniques for high-resolution current recording from cells and cell-free membrane patches. Pflugers Arch 1981, 391(2), 85–100. [Google Scholar] [CrossRef] [PubMed]
- Haug, TM; Hafting, T; Sand, O. Inhibition of BK channels contributes to the second phase of the response to TRH in clonal rat anterior pituitary cells. Acta Physiol Scand 2004, 180(4), 347–57. [Google Scholar] [CrossRef]
- He, LP; Mears, D; Atwater, I; Kitasato, H. Glucagon induces suppression of ATP-sensitive K+ channel activity through a Ca2+/calmodulin-dependent pathway in mouse pancreatic beta-cells. J Membr Biol 1998, 166(3), 237–44. [Google Scholar] [CrossRef]
- Hibino, H; Inanobe, A; Furutani, K; Murakami, S; Findlay, I; Kurachi, Y. Inwardly rectifying potassium channels: their structure, function, and physiological roles. Physiol Rev 2010, 90(1), 291–366. [Google Scholar] [CrossRef]
- Huang, CW; Huang, CC; Cheng, JT; Tsai, JJ; Wu, SN. Glucose and hippocampal neuronal excitability: role of ATP-sensitive potassium channels. J Neurosci Res 2007, 85(7), 1468–77. [Google Scholar] [CrossRef]
- Huang, HY; Huang, YB; Wu, CL; Wu, SN. Modulatory impact of tefluthrin, telmisartan, and KB-R7943 on voltage-gated Na+ currents. Biophysica 2024, 4(4), 488–506. [Google Scholar] [CrossRef]
- Hung, TY; Huang, HI; Wu, SN; Huang, CW. Depressive effectiveness of vigabatrin (γ-vinyl-GABA), an antiepileptic drug, in intermediate-conductance calcium-activated potassium channels in human glioma cells. BMC Pharmacol Toxicol 2021, 22(1), 6. [Google Scholar] [CrossRef] [PubMed]
- Kusunoki, M; Hirota, K; Shoji, T; Uba, T; Matsuo, Y; Hayashi, M. Dexmedetomidine suppresses glucose-stimulated insulin secretion in pancreatic β-cells. FEBS Open Bio 2025, 15(4), 634–646. [Google Scholar] [CrossRef]
- Lee, DS; Chen, JH; Lundy, DJ; Liu, CH; Hwang, SM; Pabon, L; Shieh, RC; Chen, CC; Wu, SN; Yan, YT; Lee, ST; Chiang, PM; Chien, S; Murry, CE; Hsieh, PC. Defined MicroRNAs Induce Aspects of Maturation in Mouse and Human Embryonic-Stem-Cell-Derived Cardiomyocytes. Cell Rep 2015, 12(12), 1960–7. [Google Scholar] [CrossRef]
- Lieste, JR; Koopman, WJ; Reynen, VC; Scheenen, WJ; Jenks, BG; Roubos, EW. Action currents generate stepwise intracellular Ca2+ patterns in a neuroendocrine cell. J Biol Chem 1998, 273(40), 25686–94. [Google Scholar] [CrossRef]
- Liu, YW; Fang, YH; Su, CT; Hwang, SM; Liu, PY; Wu, SN. The biochemical and electrophysiological profiles of amniotic fluid-derived stem cells following Wnt signaling modulation cardiac differentiation. Cell Death Discov 2019, 5, 59. [Google Scholar] [CrossRef]
- Lu, TL; Gao, ZH; Li, SW; Wu, SN. High Efficacy by GAL-021: A Known Intravenous Peripheral Chemoreceptor Modulator that Suppresses BKCa-Channel Activity and Inhibits IK(M) or Ih. Biomolecules 2020, 10(2), 188. [Google Scholar] [CrossRef]
- Lo, YC; Tseng, YT; Liu, CM; Wu, BN; Wu, SN. Actions of KMUP-1, a xanthine and piperazine derivative, on voltage-gated Na+ and Ca2+ -activated K+ currents in GH3 pituitary tumour cells. Br J Pharmacol 2015, 172(21), 5110–22. [Google Scholar] [CrossRef]
- Mahon, S; Casassus, G; Mulle, C; Charpier, S. Spike-dependent intrinsic plasticity increases firing probability in rat striatal neurons in vivo. J Physiol 2003, 550 Pt 3, 947–59. [Google Scholar] [CrossRef] [PubMed]
- Mason, MJ; Simpson, AK; Mahaut-Smith, MP; Robinson, HP. The interpretation of current-clamp recordings in the cell-attached patch-clamp configuration. Biophys J 2005, 88(1), 739–50. [Google Scholar] [CrossRef]
- McLeod, JF; Leempoels, JM; Peng, SX; Dax, SL; Myers, LJ; Golder, FJ. GAL-021, a new intravenous BKCa-channel blocker, is well tolerated and stimulates ventilation in healthy volunteers. Br J Anaesth 2014, 113(5), 875–83. [Google Scholar] [CrossRef] [PubMed]
- Montague, T; Drummond, J; Ng, K; Parratt, J. Advancements in multiple sclerosis. Intern Med J 2025, 55(6), 895–904. [Google Scholar] [CrossRef]
- Podcast, Neuroverse. The patch-clamp technique explained [Audio podcast episode]. Neuroverse Podcast. Neuroverse Media. 10 October 2025. Available online: http://neuroversepod.com.
- O'Neill, RJ; Tung, L. Cell-attached patch clamp study of the electropermeabilization of amphibian cardiac cells. Biophys J 1991, 59(5), 1028–39. [Google Scholar] [CrossRef]
- Parker, M; Yadavalli, NS; Peranidze, K; Boland, E; Reukov, V; Minko, S. Insulin-producing INS-1 cell cultures on biomimetic 3D scaffolds. J Mater Chem B 2025, 13(38), 12134–12145. [Google Scholar] [CrossRef] [PubMed]
- Perkins, KL. Cell-attached voltage-clamp and current-clamp recording and stimulation techniques in brain slices. J Neurosci Methods 2006, 154(1-2), 1–18. [Google Scholar] [CrossRef]
- Qiu, J; Zhao, Q; Li, R; Liu, Y; Ma, B; Zhao, X. Robotic Fast Patch Clamp in Brain Slices Based on Stepwise Micropipette Navigation and Gigaseal Formation Control. Sensors 2025, 25(4), 1128. [Google Scholar] [CrossRef]
- Robinson, K; Giles, W. A data acquisition, display and plotting program for the IBM PC. Comput Methods Programs Biomed 1986, 23(3), 319–27. [Google Scholar] [CrossRef]
- So, EC; Lo, YC; Chen, LT; Kao, CA; Wu, SN. High effectiveness of triptolide, an active diterpenoid triepoxide, in suppressing Kir-channel currents from human glioma cells. Eur J Pharmacol 2014, 738, 332–41. [Google Scholar] [CrossRef]
- Tsai, KL; Chang, HF; Wu, SN. The inhibition of inwardly rectifying K+ channels by memantine in macrophages and microglial cells. Cell Physiol Biochem 2013, 31(6), 938–51. [Google Scholar] [CrossRef]
- Tyzio, R; Ivanov, A; Bernard, C; Holmes, GL; Ben-Ari, Y; Khazipov, R. Membrane potential of CA3 hippocampal pyramidal cells during postnatal development. J Neurophysiol 2003, 90(5), 2964–72. [Google Scholar] [CrossRef]
- Wang, CL; Tsai, ML; Wu, SN. Evidence for mitoxantrone-induced block of inwardly rectifying K+ channels expressed in the osteoclast precursor RAW 264.7 cells differentiated with lipopolysaccharide. Cell Physiol Biochem 2012, 30(3), 687–701. [Google Scholar] [CrossRef]
- Wang, YJ; Chen, YH; Hwang, E; Yeh, CJ; Liu, YX; Chen, HH; Wu, SN. Functional Expression of NMDA Receptors in SH-SY5Y Neuroblastoma Cells Following Long-Term RA/BDNF-Induced Differentiation. NeuroSci 2025, 6(2), 47. [Google Scholar] [CrossRef] [PubMed]
- Wilson, JR; Clark, RB; Banderali, U; Giles, WR. Measurement of the membrane potential in small cells using patch clamp methods. Channels (Austin) 2011, 5(6), 530–7. [Google Scholar] [CrossRef] [PubMed]
- Wu, AZ; Ohn, TL; Shei, RJ; Wu, HF; Chen, YC; Lee, HC; Dai, DF; Wu, SN. Permissive Modulation of Sphingosine-1-Phosphate-Enhanced Intracellular Calcium on BKCa Channel of Chromaffin Cells. Int J Mol Sci. 2021, 22(4), 2175. [Google Scholar] [CrossRef] [PubMed]
- Wu, SN; Huang, YM; Kao, CA; Chen, BS; Lo, YC. Investigations on contribution of glial inwardly-rectifying K+ current to membrane potential and ion flux: an experimental and theoretical study. Kaohsiung J Med Sci 2015, 31(1), 9–17. [Google Scholar] [CrossRef]
- Wu, SN; Li, HF; Chiang, HT. Characterization of ATP-sensitive potassium channels functionally expressed in pituitary GH3 cells. J Membr Biol 2000, 178(3), 205–14. [Google Scholar] [CrossRef]
- Wu, SN; Liu, SI; Hwang, TL. Activation of muscarinic K+ channels by extracellular ATP and UTP in rat atrial myocytes. J Cardiovasc Pharmacol 1998, 31(2), 203–11. [Google Scholar] [CrossRef]
- Wu, SN; Wu, AZ; Lin, MW. Pharmacological roles of the large-conductance calcium-activated potassium channel. Curr Top Med Chem 2006, 6(10), 1025–30. [Google Scholar] [CrossRef]
- Wu, SN; Wu, AZ; Sung, RJ. Identification of two types of ATP-sensitive K+ channels in rat ventricular myocytes. Life Sci 2007, 80(4), 378–87. [Google Scholar] [CrossRef]
- Wu, SN; Wu, YH; Chen, BS; Lo, YC; Liu, YC. Underlying mechanism of actions of tefluthrin, a pyrethroid insecticide, on voltage-gated ion currents and on action currents in pituitary tumor (GH3) cells and GnRH-secreting (GT1-7) neurons. Toxicology 2009, 258(1), 70–7. [Google Scholar] [CrossRef] [PubMed]
- Wu, SN; Wang, YJ; Gao, ZH; Liutkevičienė, R; Rovite, V. Recent Advances in Ionic Mechanisms in Pituitary Cells: Implications for Electrophysiological and Electropharmacological Research. J Clin Med 2025, 14(9), 3117. [Google Scholar] [CrossRef] [PubMed]
- Zhao, HB; Liu, LM; Lu, X; Quinonez, AT; Roberts, RA; Zhai, TY; Liang, C. Prevention and treatment of noise-induced hearing loss and cochlear synapse degeneration by potassium channel blockers in vivo. Hear Res 2025, 464, 109319. [Google Scholar] [CrossRef] [PubMed]
Figure 1.
Schematic graph showing cell-attached (C-A, upper) and whole-cell (W-C, lower) modes used in the patch-clamp recordings. In the upper panel, the internal invagination (indicated in dotted green circle) within the glass pipette illustrates the typical scenario in C-A mode. To increase the resistance of the gigaseal, the experimenter applies gentle negative pressure when the pipette contacts the cell membrane, thereby drawing the membrane tightly against the electrode tip. As a result, the membrane often extends into the pipette, forming a deep U-shaped morphology. Under this condition, ionic currents across the surface membrane patch can be readily observed at high gigaseal resistance (> 1 G). When additional suction is applied, the membrane ruptures (the membrane capacitance suddenly increases), while the rim of the electrode remains highly sealed to the membrane, thereby establishing the W-C mode (lower panel), which allows examination of ligand-gated or voltage-gated ion currents. On the right side of each panel is a simplified amplifier (Amp.) circuit diagram, which can amplify high-resolution signals and digitize them through analog-to-digital conversion. The light blue circles in both the upper and lower panels denote the targeted cell under examination. Using either voltage-clamp or current-clamp techniques, recordings can be appropriately made in both C-A and W-C recording configurations.
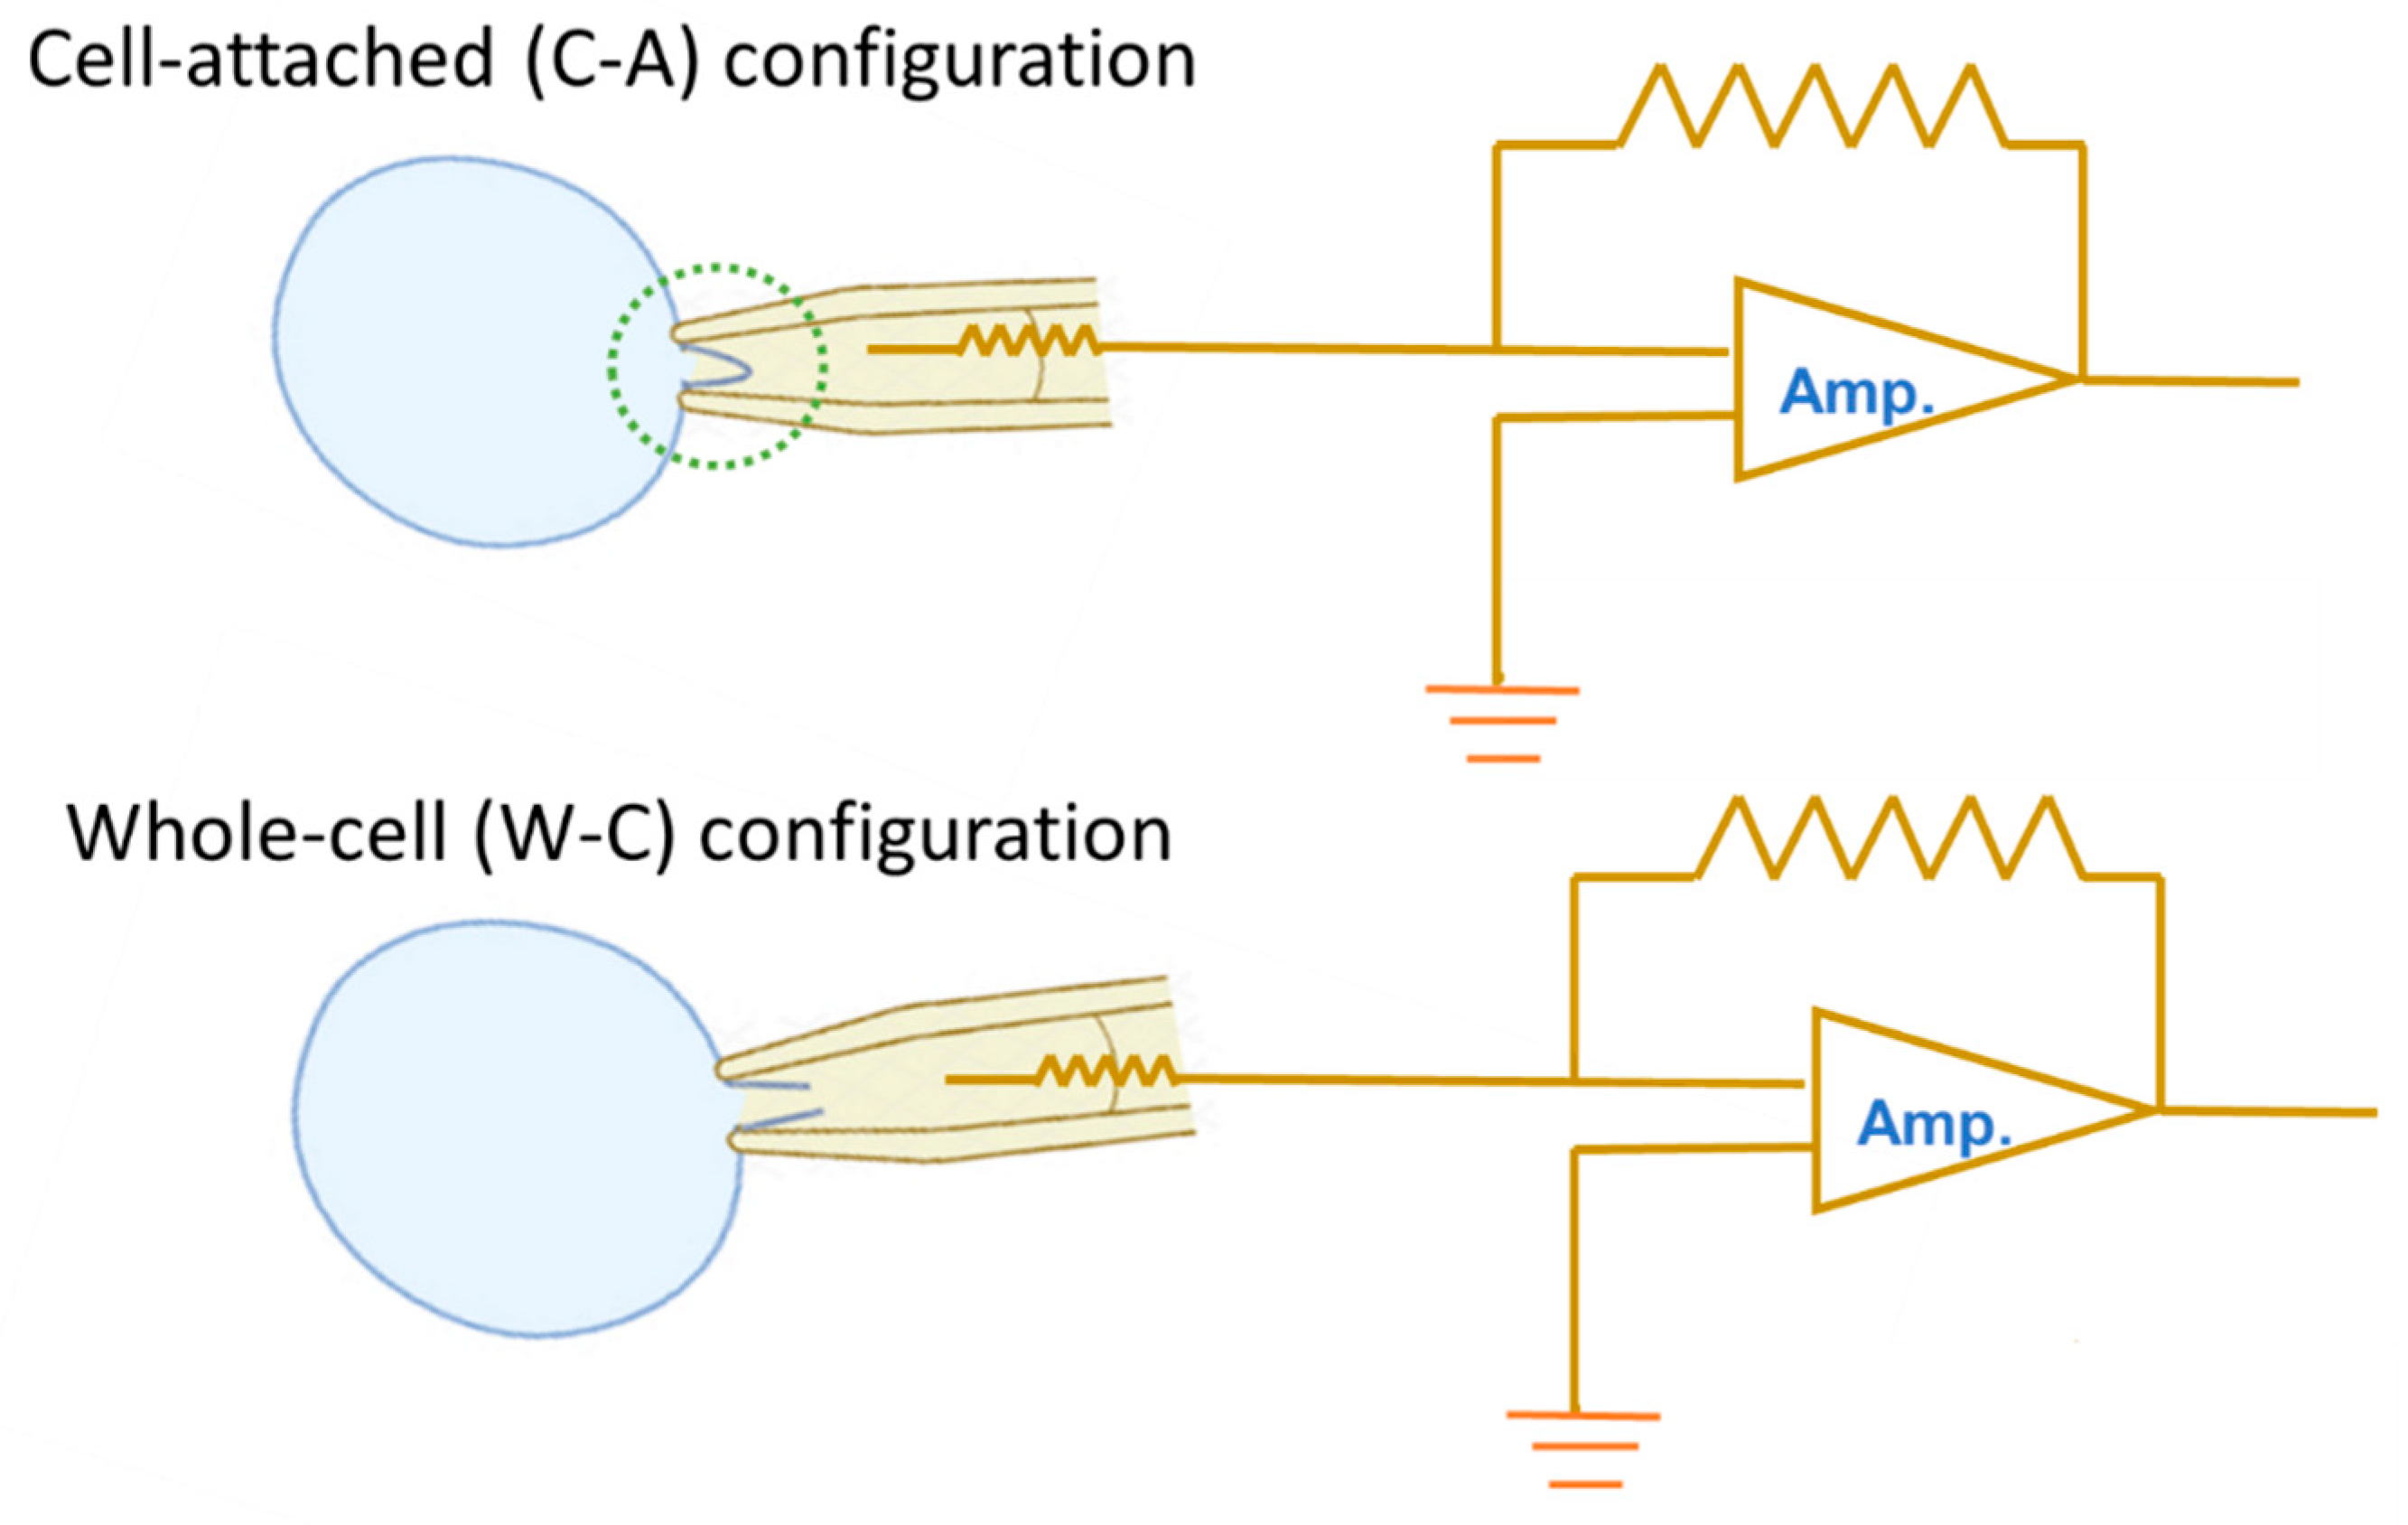
Figure 2.
Changes in ionic currents in response to ramp or rectangular pulse in INS-1 pancreatic -cells. In these experiments, cells were immersed in normal Tyrode’s solution containing 1.8 mM CaCl2, and the recording electrode was filled with a K+-containing solution. Both cell-attached (C-A) and whole-cell (W-C) current recordings were made in the same cell. Labeled C-A and W-C in (A) and (B) indicate representative current traces measured under C-A and W-C voltage-clamp configuration, respectively. Inset in (A) and (B) shows the voltage protocol applied. In (A), the right lower inset indicates an expanded record shown in dashed box, which is an amplified view of the action currents (ACs). In (B), red arrowhead labeled “a” is current trace for voltage-gated Na+ current (INa) under W-C mode, while arrowhead labeled “b” is the appearance of ACs under C-A mode. The downward deflections shown in right lower inset of (A) indicate the appearance of the appearance of action currents (ACs).
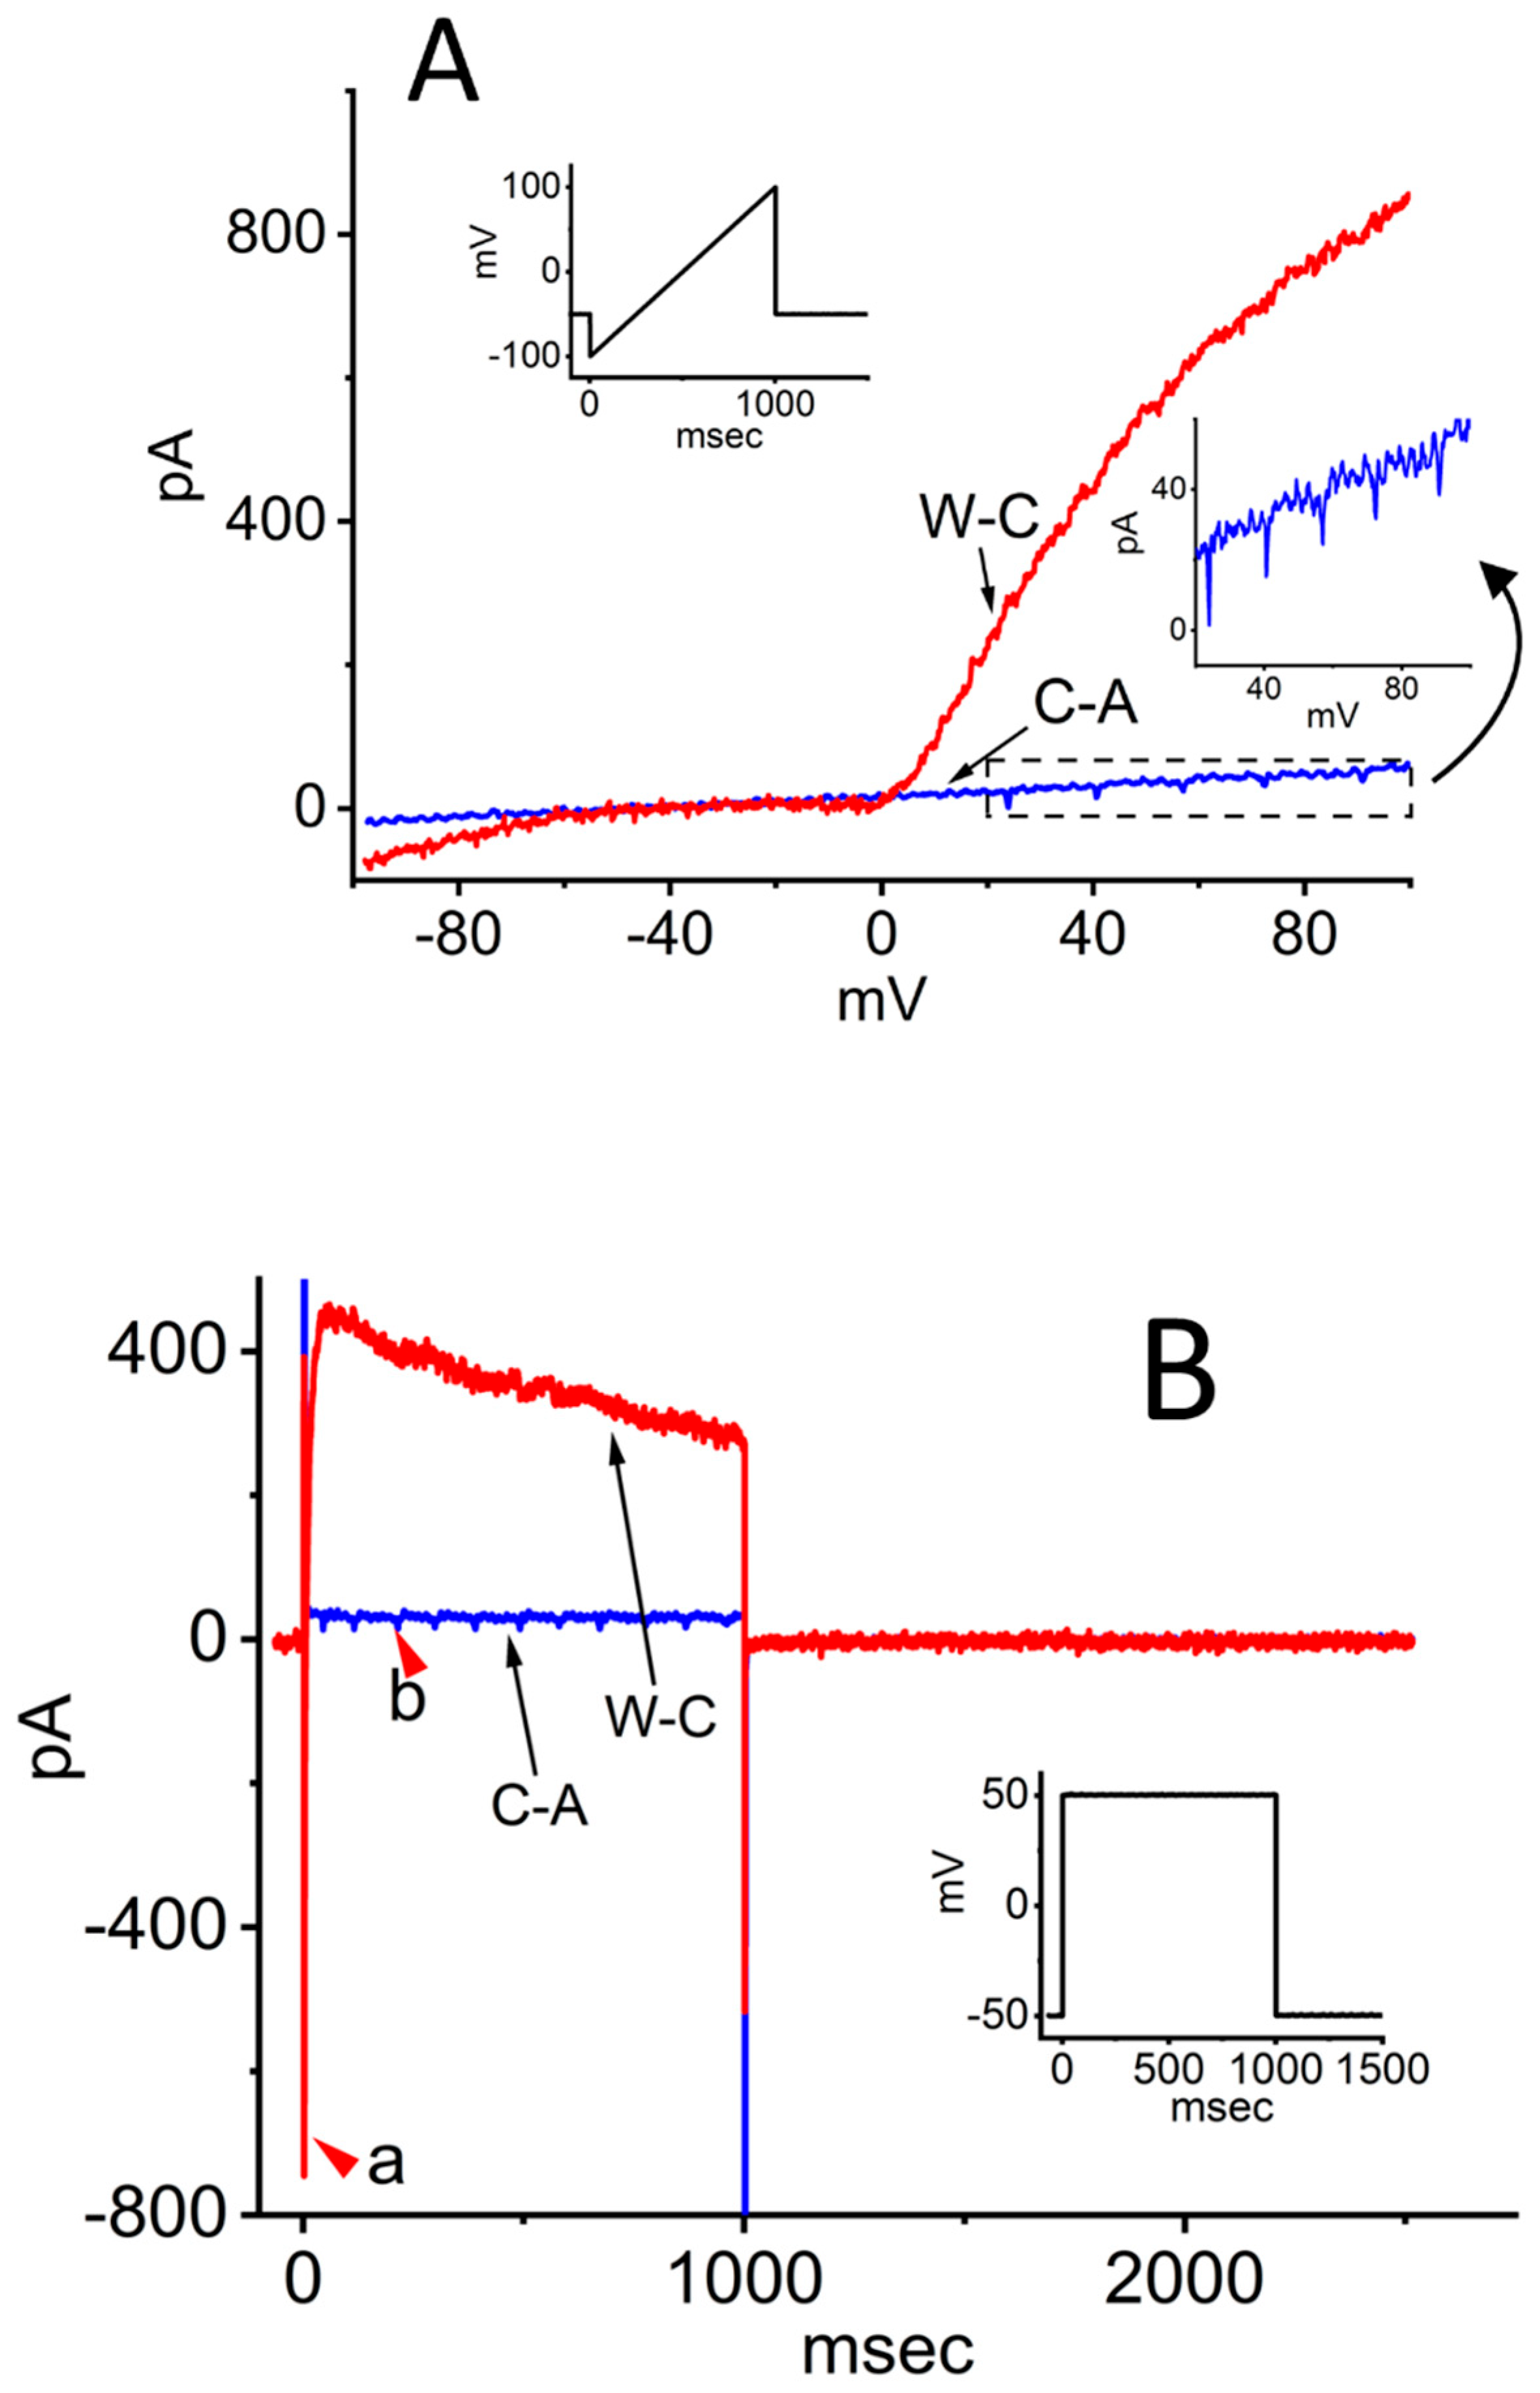
Figure 3.
Inhibitory effect of mitoxantrone on the activity of inwardly rectifying K+ (Kir) channels in lipopolysaccharide-treated RAW 264.7 osteoclast precursor cells. The experiments were conducted in cells bathed in normal Tyrode’s solution containing 1.8 mM CaCl2. Cell-attached (C-A) configuration was made and the recording pipette with filled with or without mitoxantrone (10 M). The attached cell was held at −50 mV relative to the bath (that is, the amplifier’s holding potential was set to +50 mV [pipette potential], corresponding to the membrane potential of approximately −120 mV relative to the resting membrane potential; patch potential = +120 mV). (A) Original current traces obtained in the absence (left panel) and presence (right panel) of 10 M mitoxantrone. Channel opening produces an upward deflection in the current when recorded from the pipette electrode; however, if referenced to the patch membrane itself, channel openings would be displayed as downward deflections (i.e., negative values). Notably, based on the single-channel current histogram, the amplitude of single-channel current did not differ between the absence and presence of mitoxantrone. (B) Averaged current-voltage (I-V) relationships of single Kir channel currents obtained in the control (black open squares) and during exposure to 10 M mitoxantrone (black filled squares). Single-channel amplitude (displayed as a negative value from the cell’s perspective) was plotted as a function of the potential (i.e., voltage). The voltage is relative to the bath. For example, when voltage at the x-axis is 0 or +20 mV relative to the bath, the amplifier panel will be set at 0 or −20 mV (pipette potential), respectively, yielding the potential relative to the resting membrane potential would be −70 or −50 mV, respectively, or the patch potential would be +70 or +50 mV, respectively. Therefore, Kir-channel openings appear as upward deflections when viewed from the perspective of the recording pipette. The reversal potential, marked by the green dashed line, occurs when the currents reverse direction at approximately +70 mV. Notably, no modification in single-channel conductance was demonstrated during exposure to mitoxantrone in these cells. This figure is adapted from Wang et al. (2012) and published under the terms and conditions of the Creative Commons Attribution (CC BY) license.
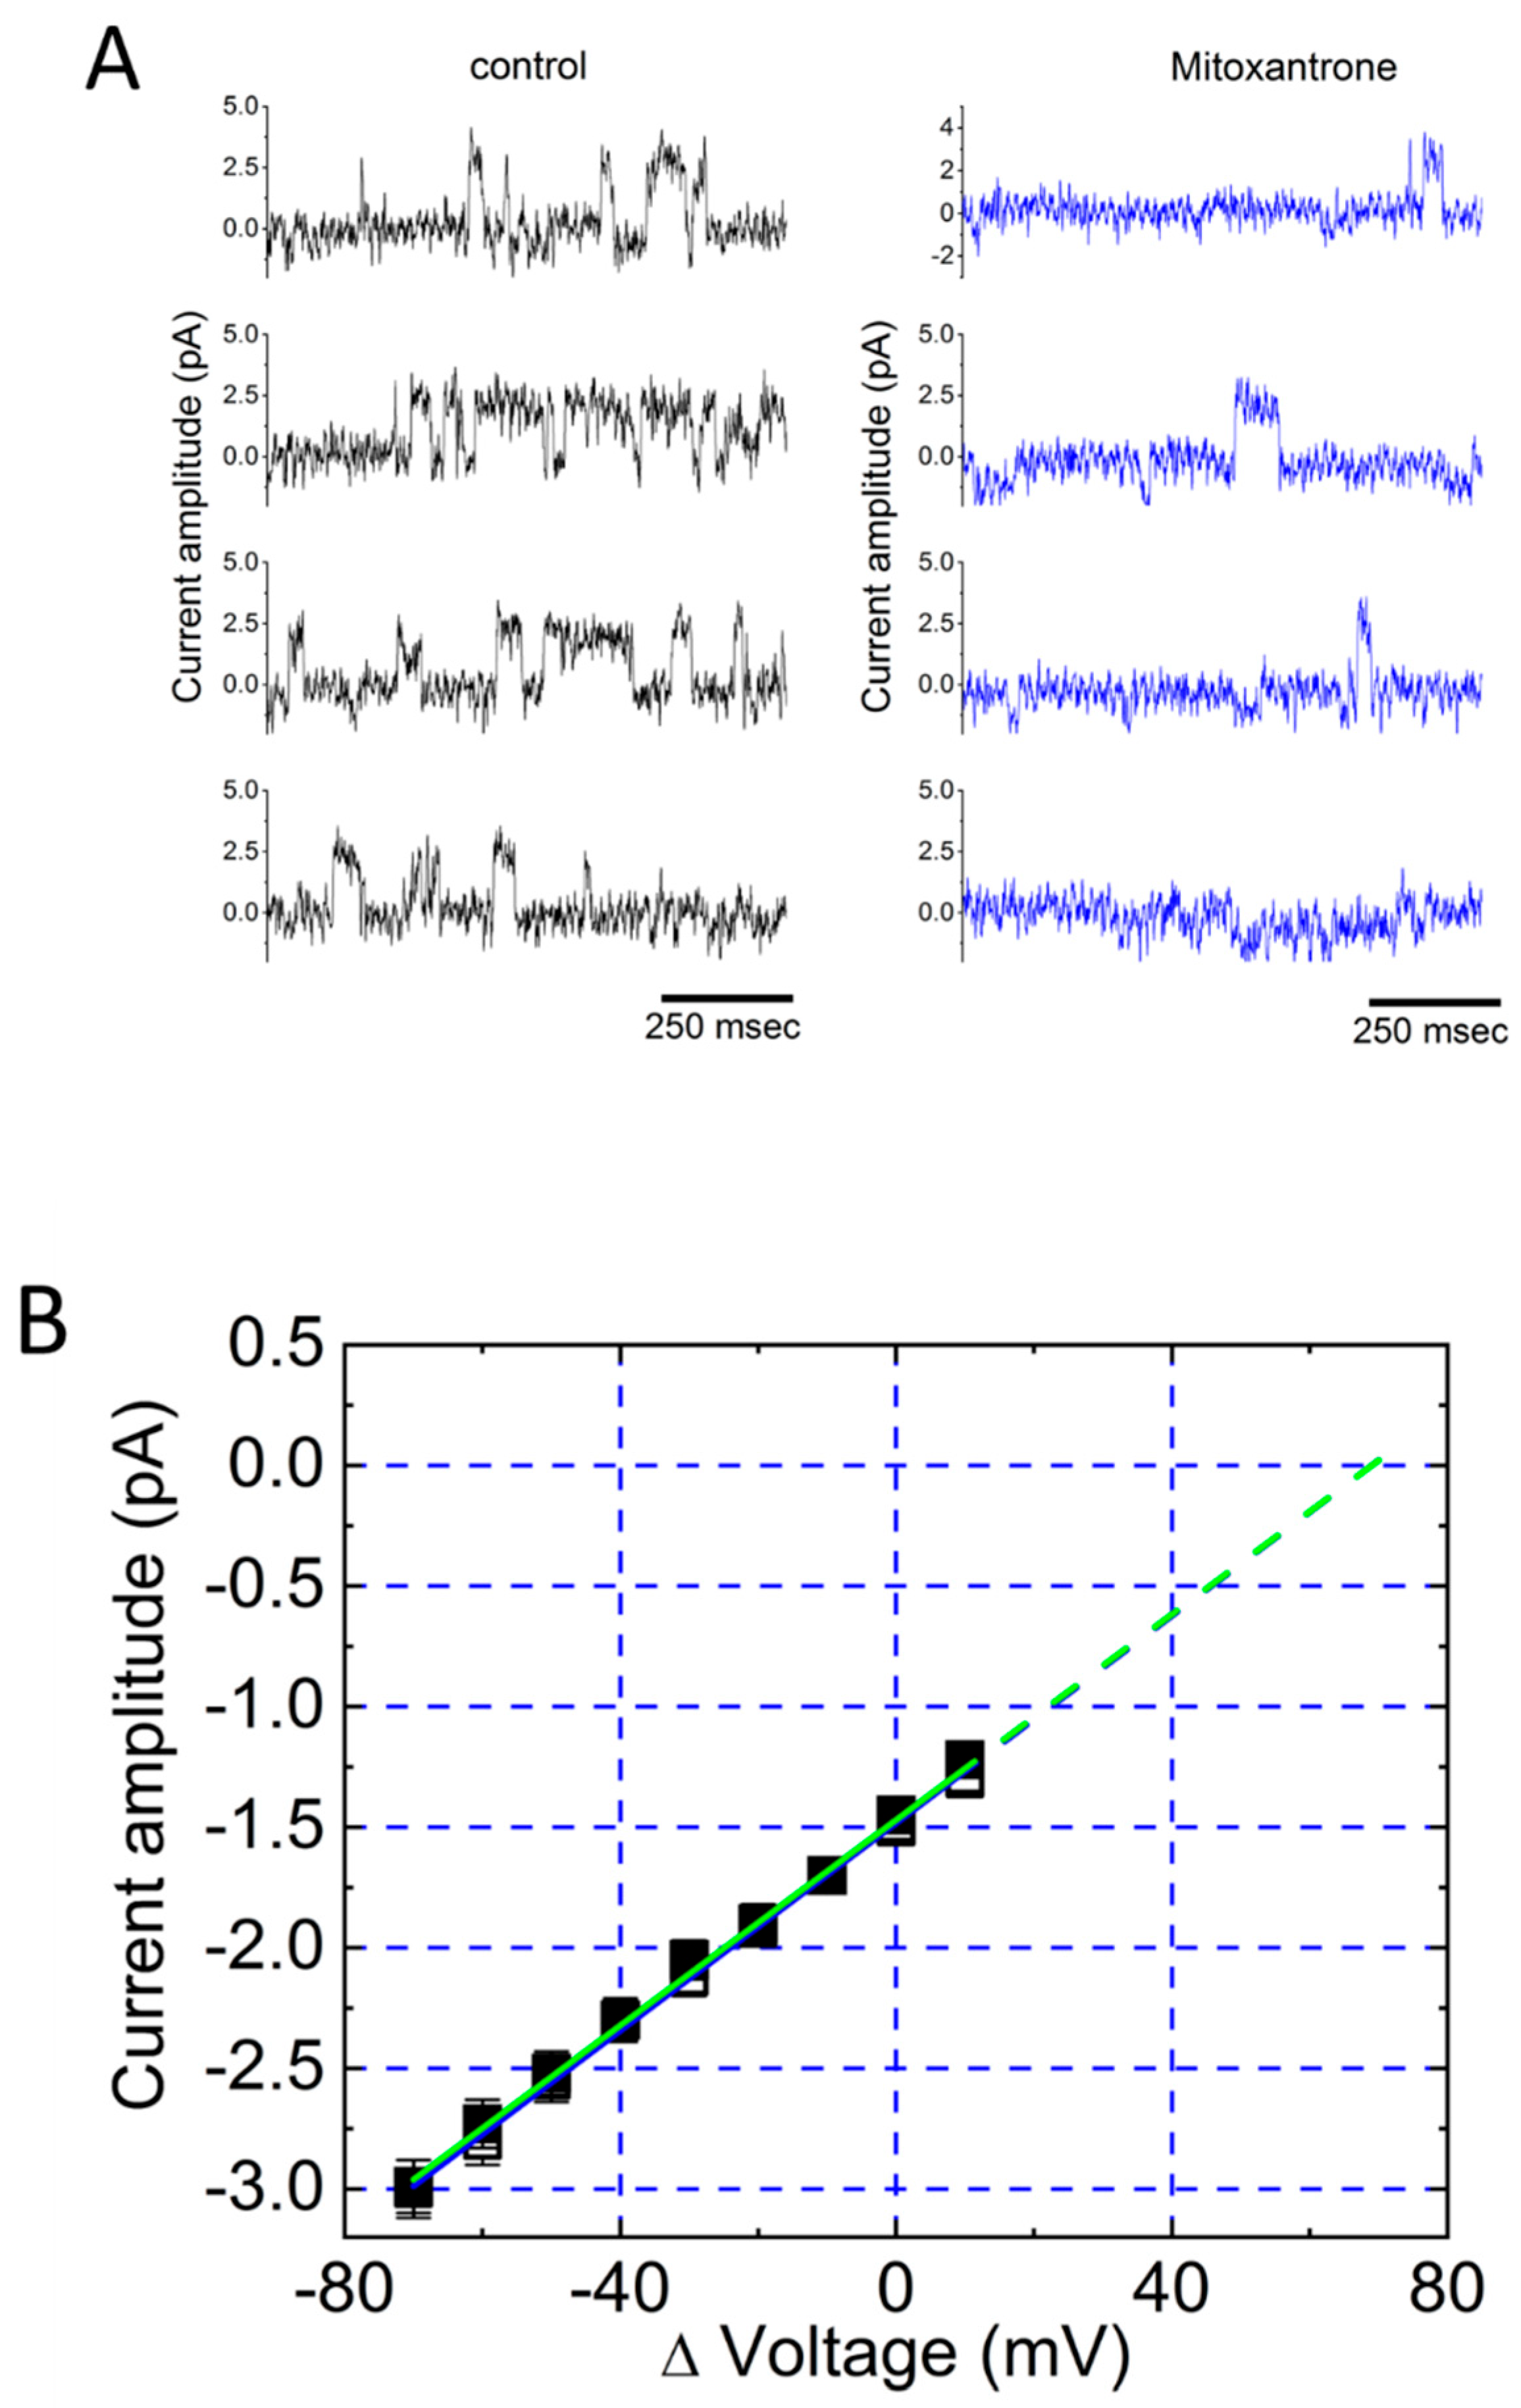
Figure 4.
Schematic representation of KATP channel activity recorded in C-A configuration. The cell was bathed in standard Tyrode’s solution (~5.4 mM K+), while the recording pipette contained a K+-rich internal solution (~140 mM K+). The potential was held at −50 mV relative to the bath, corresponding to a driving force of −120 mV from the resting membrane potential (~+70 mV). Under these conditions, K+ ions flow into the cell through KATP channel, driven by K+ electrochemical gradient, thereby generating an inward K+ current from the cell’s perspective (illustrated by the red curved arrow). However, due to the established convention where current is defined relative to the recording pipette, single-channel openings observed on patch-clamp amplifier appear as random, upward deflections on the online trace (as illustrated on the right). These upward movements represent an outward current. The small noisy current superimposed on the single-channel trace has been removed, after the data were idealized using the QUB package (http://qub.mandelics.com/, accessed on 26 December 2025). The vertical and horizontal bars at the rightmost part indicate the calibration scales for current amplitude and time, respectively; the open arrowhead marks the zero-current level.
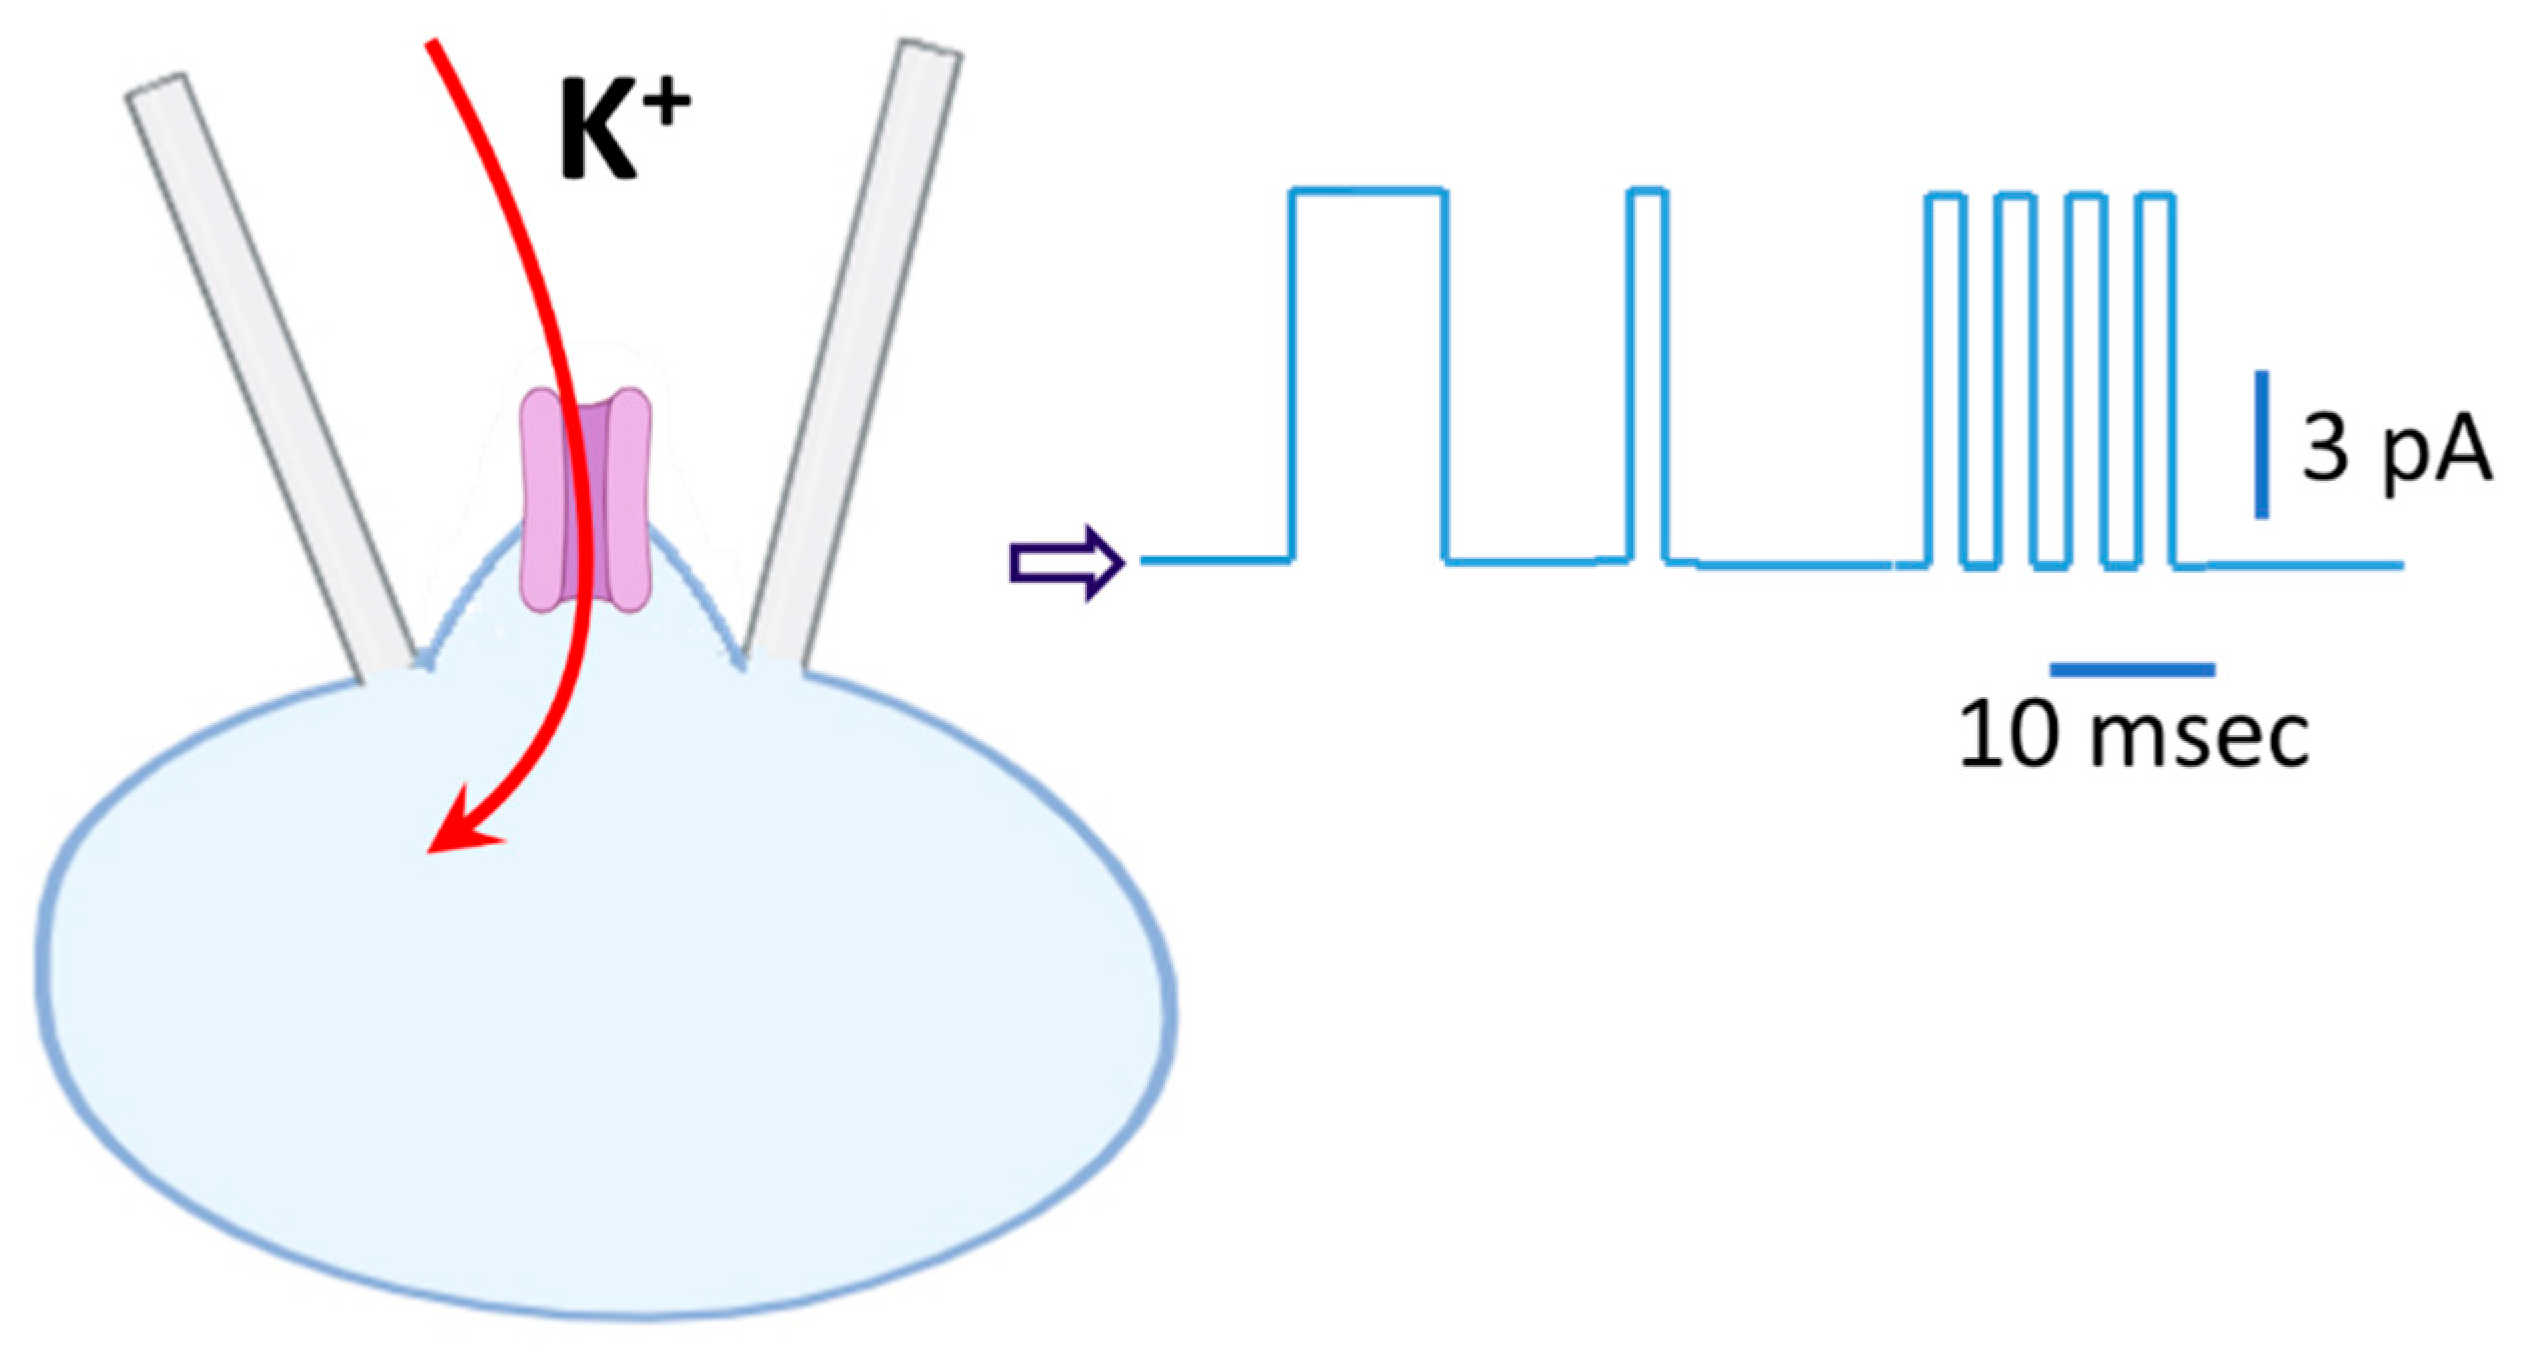
Figure 5.
Suppressive effect of GAL-021 on the activity of large-conductance Ca2+-activated (BKCa) channels in pituitary GH3 cells. In these experiments, cells were bathed in high K+ solution containing 0.1 M Ca2+, inside-out current recordings were performed, and channel activity was measured at the level of +60 mV (−60 mV from the electrode’s perspective). In the uppermost part of the figure, the upper portion displays representative current trace, while the lower portion shows the probability of channel openings. Horizontal bar indicates the addition of 10 M GAL-021 (GAL) into the bath. The left (control, no GAL-021) or right (during the exposure to GAL-021) current traces in the lowest part corresponds to the expanded records from red dashed boxes in the upper part. For the cell’s perspective, channel-opening event is denoted as an upward deflection (i.e., outward current). Of note, there is a progressive decrease in the channel open probability during exposure to GAL-21 (10 M). This figure is adapted from Lu et al. (2020) and published under the terms and conditions of the Creative Commons Attribution (CC BY) license.
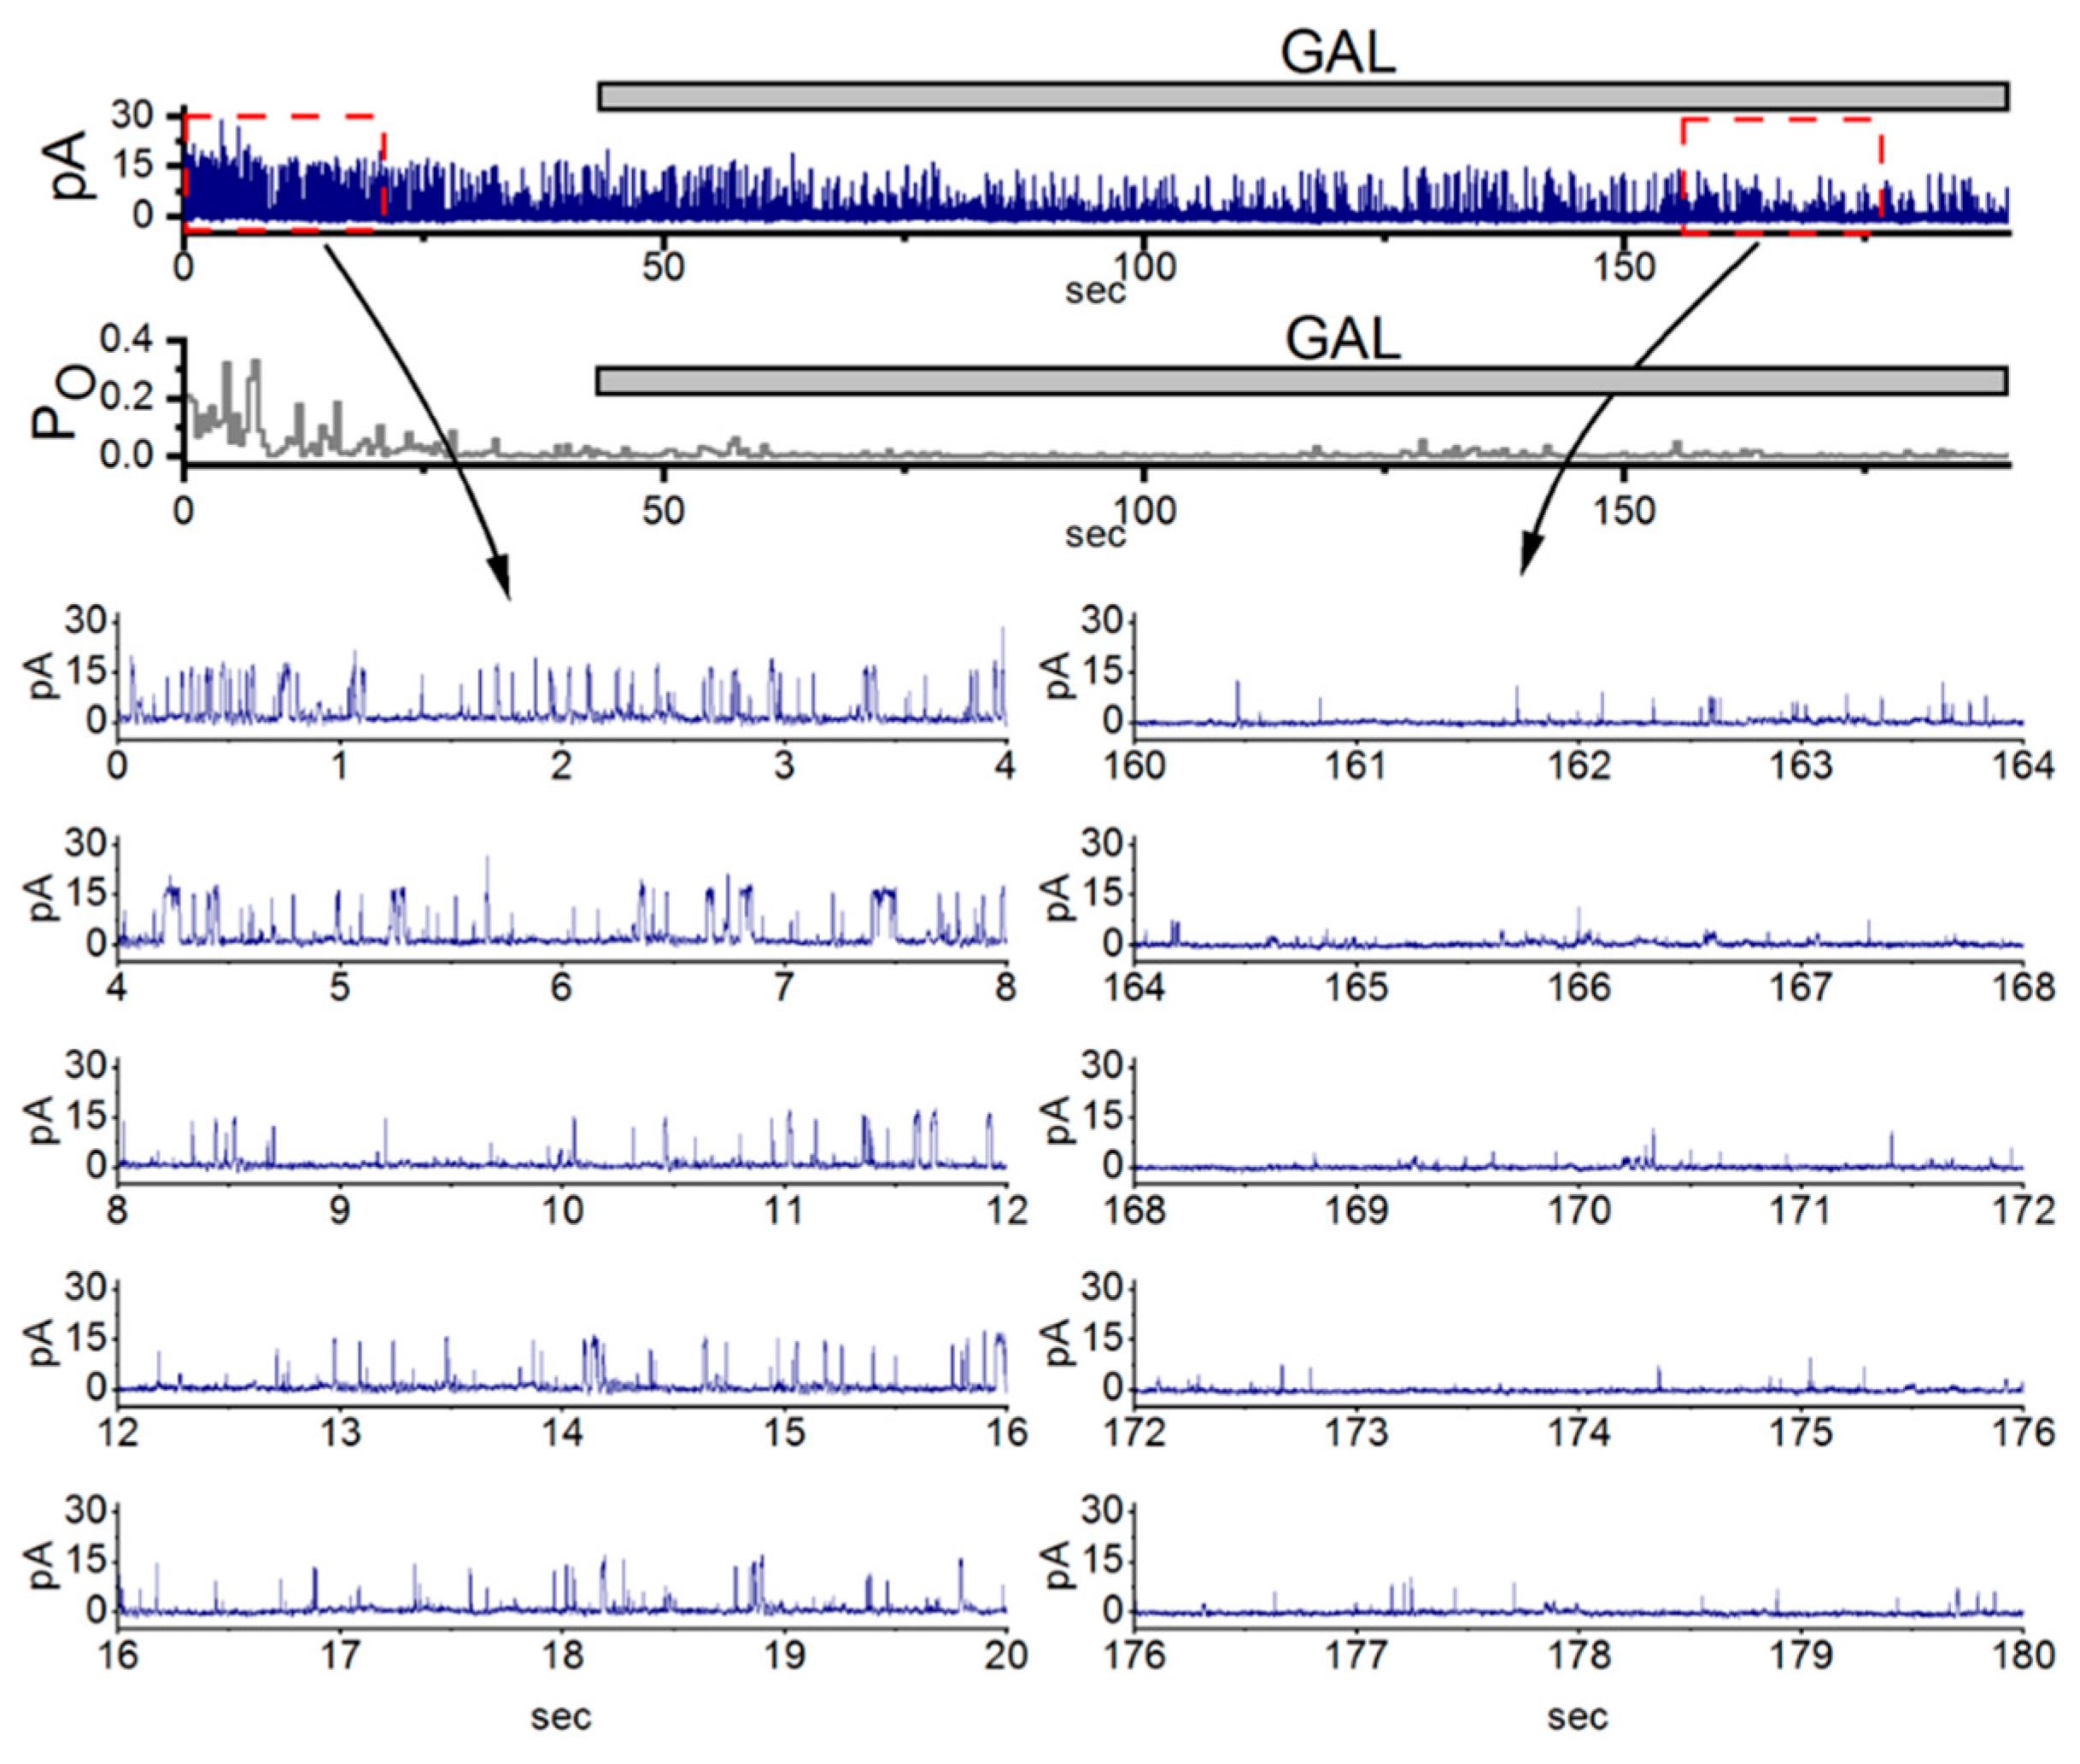
Figure 6.
Voltage-dependent effect of GAL-021 (GAL) on the activity of BKCa channels identified from GH3 cells. The experiments were conducted with symmetrical K+ concentration, and the electrode was filled with K+-rich internal solution. Under inside-out current recordings, the potential was maintained at +60 mV (from the cell’s perspective) and bath medium contained 0.1 M Ca2+. (A) Failure of GAL-021 to modifying the single-channel conductance of BKCa channels. The voltage ramp pulses from 0 to +120 mV with a duration of 1 sec were used to measure single-channel conductance taken with or without GAL-21 addition. The gray straight dashed line with a reversal potential of 0 mV represents the I-V relations of the channel in the absence (upper, blue) or presence (lower, red) of 3 M GAL-021. (B) Effect of GAL-021 on the sigmoidal activation kinetics of BKCa channels. The currents illustrated were activated by applying the upsloping ramp pulses from +20 to +120 mV with a duration of 1 sec. The gray smooth lines represent Boltzmann fits of the data, yielding a V1/2 of +66.8 mV under the control condition (no GAL-021) and +79.3 mV when the detached patch was exposed to 3 M GAL-021. This figure is adapted from Lu et al. (2020) and published under the terms and conditions of the Creative Commons Attribution (CC BY) license.
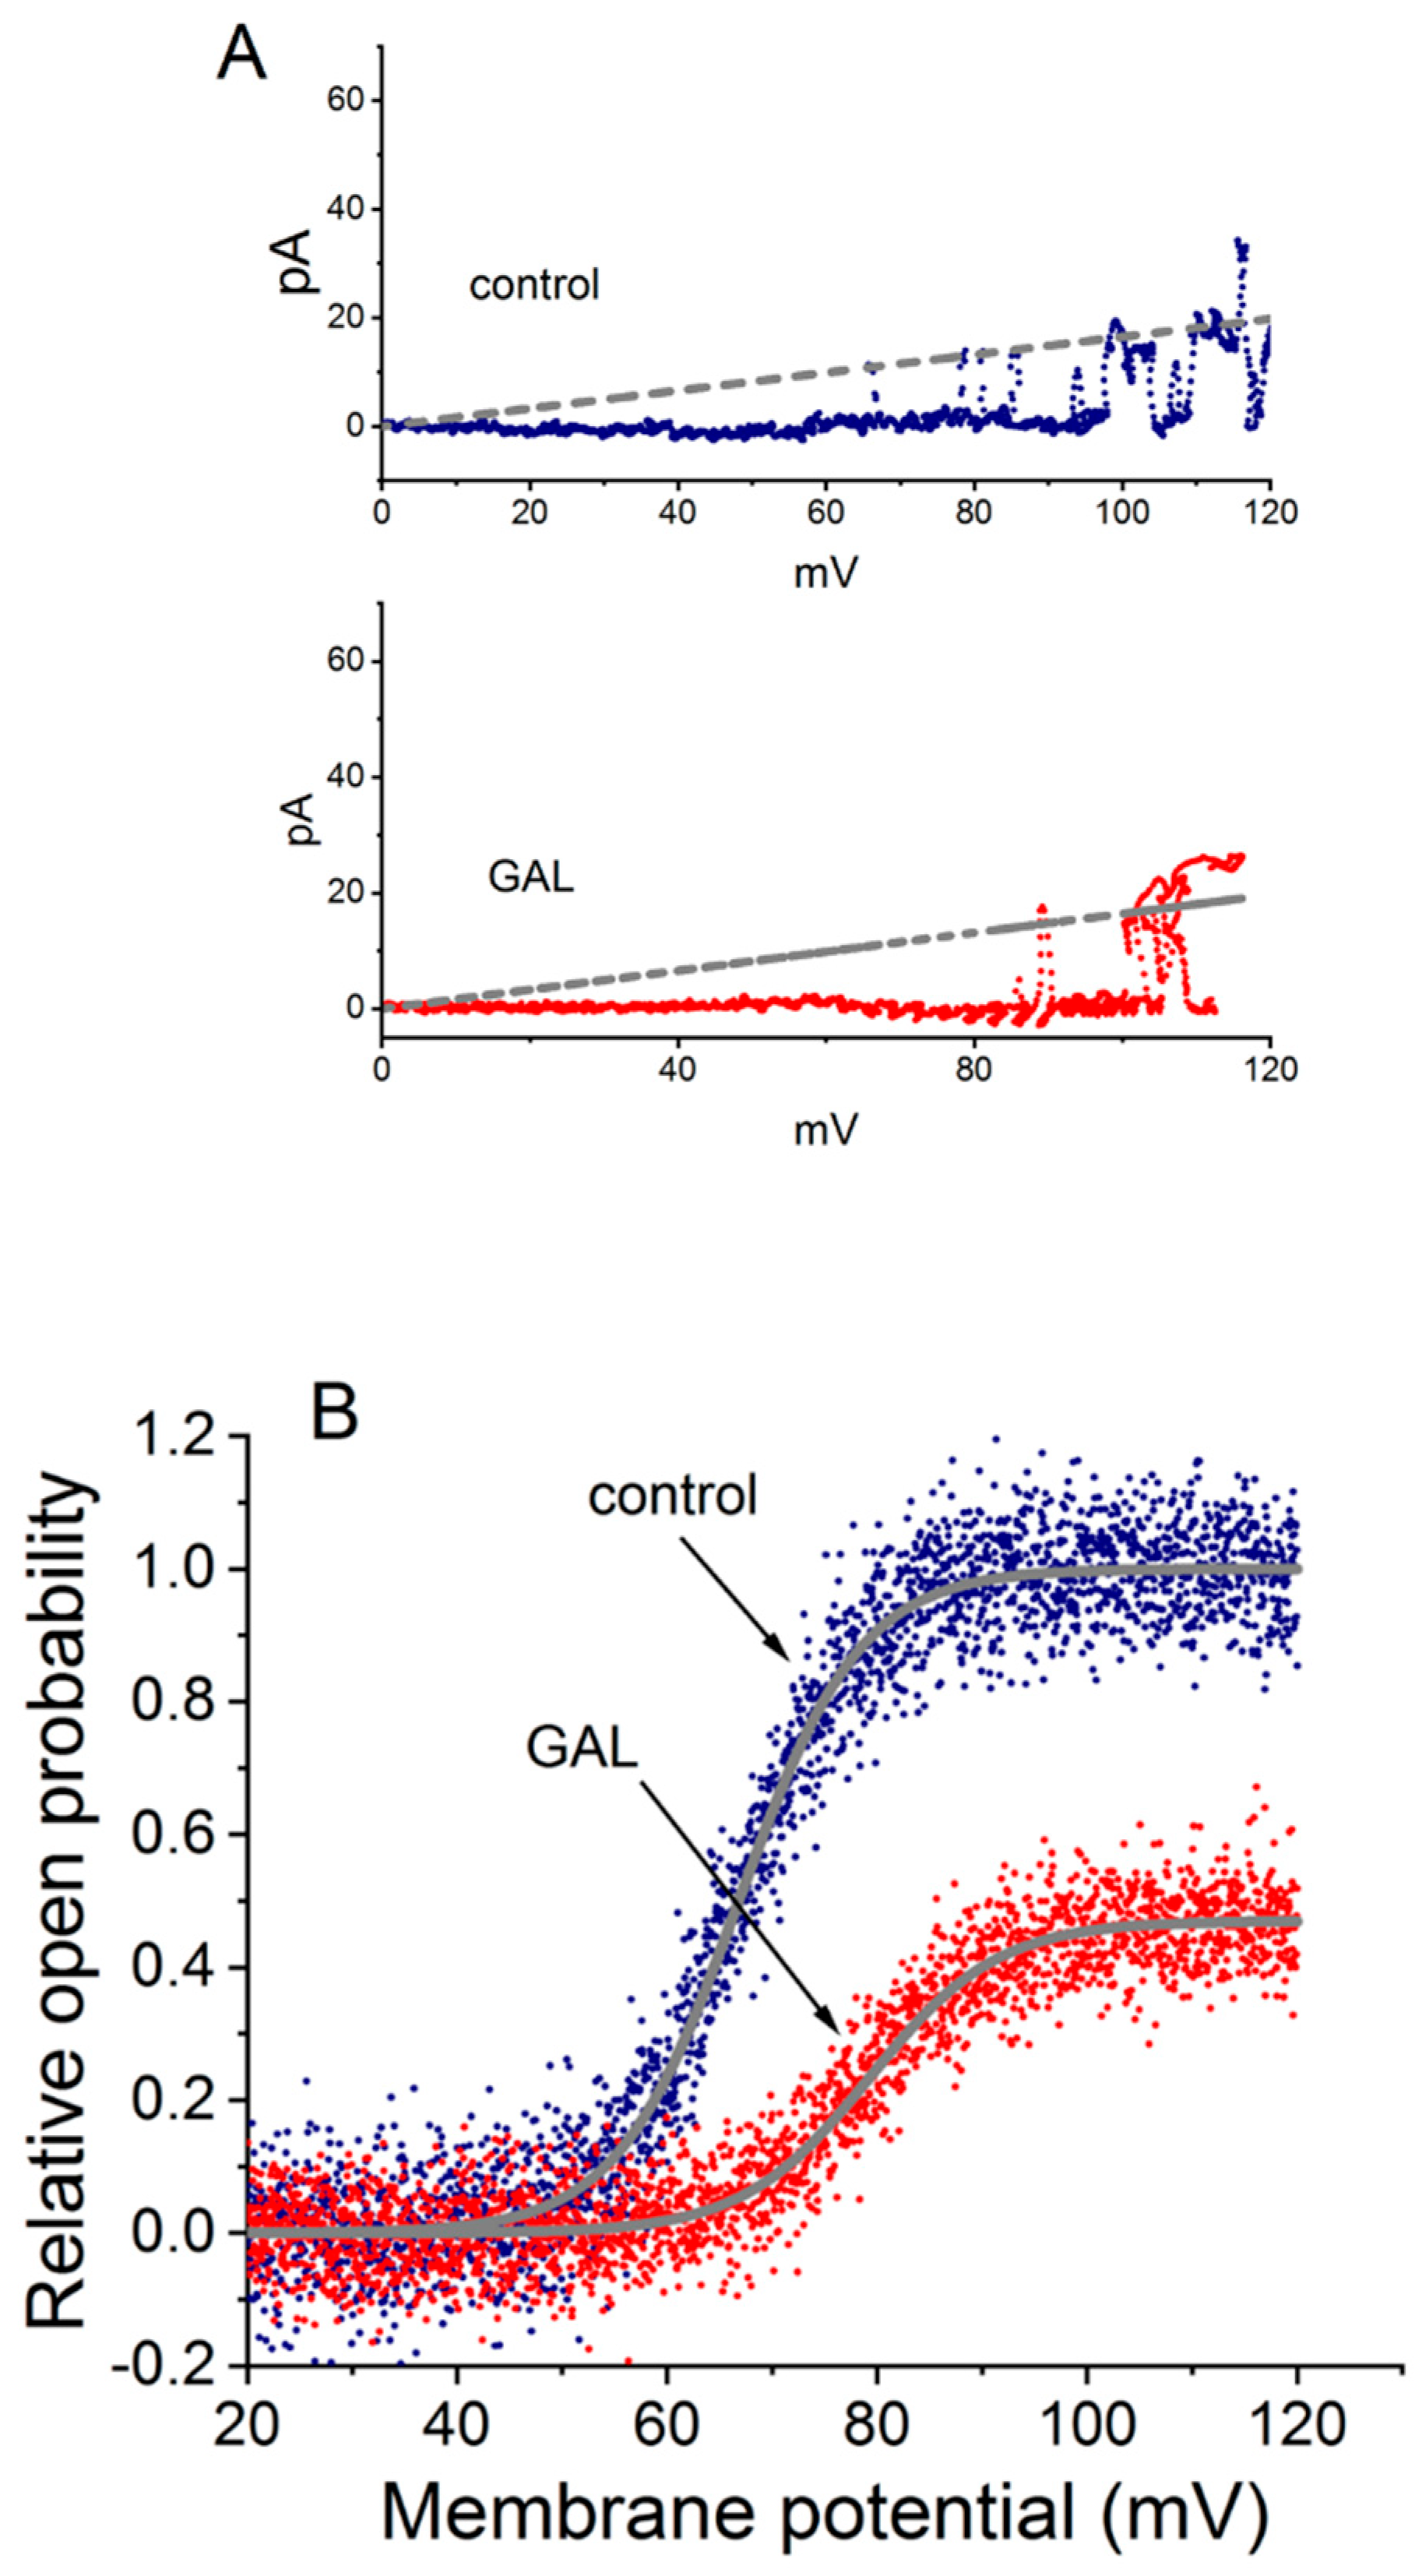
Figure 7.
Cartoon representation of brain slice patch-clamping. This diagram briefly illustrates a challenge encountered during patch clamping on a small neuron (usually < 1 m in diameter) within a brain slice. It is often difficult to distinguish between the the C-A and W-C configuration if the change in membrane capacitance is negligible upon breaking the patch membrane. The experimenter often needs to determine this configuration judiciously. The gray flat, thin, and slender parallelepiped is used as a simplified representation of the brain slice for patch clamp experiments. The cell depicted on this brain slice is smaller in size compared with those in Figure 1. The top-right panel provides an enlarged view of the central dotted circle, highlighted by red curved arrow. The red question mark indicates the difficulty in determining whether the patch membrane is intact or ruptured (with the ruptured state indicated by a dashed curve line).
Disclaimer/Publisher’s Note: The statements, opinions and data contained in all publications are solely those of the individual author(s) and contributor(s) and not of MDPI and/or the editor(s). MDPI and/or the editor(s) disclaim responsibility for any injury to people or property resulting from any ideas, methods, instructions or products referred to in the content. |
© 2025 by the authors. Licensee MDPI, Basel, Switzerland. This article is an open access article distributed under the terms and conditions of the Creative Commons Attribution (CC BY) license (http://creativecommons.org/licenses/by/4.0/).
Copyright: This open access article is published under a Creative Commons CC BY 4.0 license, which permit the free download, distribution, and reuse, provided that the author and preprint are cited in any reuse.


