Submitted:
26 December 2025
Posted:
26 December 2025
You are already at the latest version
Abstract
We propose a reproducible data-science workflow to diagnose partner–sector dependencies in the Kyrgyz Republic’s goods trade (2019–2024). HS-based flows are mapped into macro-sectors and transformed into partner indicators (turnover, net trade, import coverage, and role labels). Visual diagnostics and tables reveal a structural duality: (i) a China-centered import-deficit pole in manufactured goods and (ii) a narrow gold-driven export-surplus pole concentrated in the United Kingdom and Switzerland. We interpret the latter as surplus donors (donors of foreign-exchange inflows via trade) that partially offset the deficit pole. The pipeline is designed for repeatable monitoring of concentration risk and partner dependence.
Keywords:
Kyrgyz Republic
; trade balance
; HS codes
; import coverage
; export concentration
; partner roles
; data science
; K-Means
; mirror statistics
1. Introduction
Small open economies are especially exposed to external trade shocks because imports and exports directly affect growth, fiscal and external balances [1,2].
Recent literature and policy reports emphasize that supply-chain re-routing and sanctions-related adjustments can materially change trade geography and recorded partner shares [3,4].
Export concentration in a single commodity increases vulnerability by tying foreign-exchange earnings to a narrow channel [8,9].
Official external-sector publications for the Kyrgyz Republic also point to high import concentration from non-EAEU suppliers, with China as a dominant source [5,6].
However, headline totals do not explain which partner–sector links generate the deficit and which links generate the surplus [7].
Research question. Which partner–sector relationships form the Kyrgyz Republic’s two-pole trade structure in 2019–2024, and how concentrated is the “surplus donor” channel relative to the “deficit engine”?
What is new in this paper. We combine (1) a deterministic HS-to-sector mapping, (2) interpretable diagnostics (net trade, import coverage, market share), and (3) a role-based partner labeling (Export Driver / Import Dependency / Mixed Trade) to produce a compact, reproducible duality profile.
Contributions.
- A transparent HS-chapter aggregation into macro-sectors enabling consistent partner comparisons.
- A partner-role diagnostic that makes “deficit engines” and “surplus donors” visible in one figure set.
- Evidence that the surplus side is narrowly concentrated in gold exports to the UK and Switzerland, while the deficit side is dominated by China-linked manufactured imports.
2. Related Work (Short)
3. Data and Methods
3.1. Data Acquisition (KaggleHub) and Validation Sources
The base dataset was imported programmatically via kagglehub:
path = kagglehub.dataset_download("aitenir/kyrgyz-republic-export-and-import-2019-2024")
The dataset contains partner-country trade by year with fields: country_name, product_code, product_name, import_som, import_dol, export_som, export_dol, year.
We interpret product_code as an HS-chapter-style identifier and build macro-sectors through a deterministic chapter-range mapping (Section 3.2).
3.2. Feature Engineering and Sector Mapping
We add the following derived columns:
- Sector: macro-sector label based on product_code ranges (HS chapter groups).
- Turnover: .
- Net_Trade: .
- Market_Share: partner-sector turnover share in total turnover.
-
Trade_Role: categorical role based on export share in turnover:
- -
- Export Driver if ,
- -
- Import Dependency if ,
- -
- Mixed Trade otherwise.
This mapping enables interpretable partner comparisons and makes donor/engine asymmetry measurable.
3.3. Normalization and ML-Ready Pipeline (Optional Layer)
4. Results: Visual Evidence of Structural Duality
4.1. How to Read the Figures (Visual Legend)
- Color shows net trade sign: red/orange = deficit (), blue = surplus ().
- Size shows weight: larger shapes/bubbles = larger turnover.
- Efficiency Matrix diagonal: above means (profit zone), below means (cost zone).
- Sunburst roles: Import Dependency (deficit-dominant), Export Driver (surplus-dominant), Mixed Trade (balanced).
4.2. Duality Map (Four Coordinated Plots)
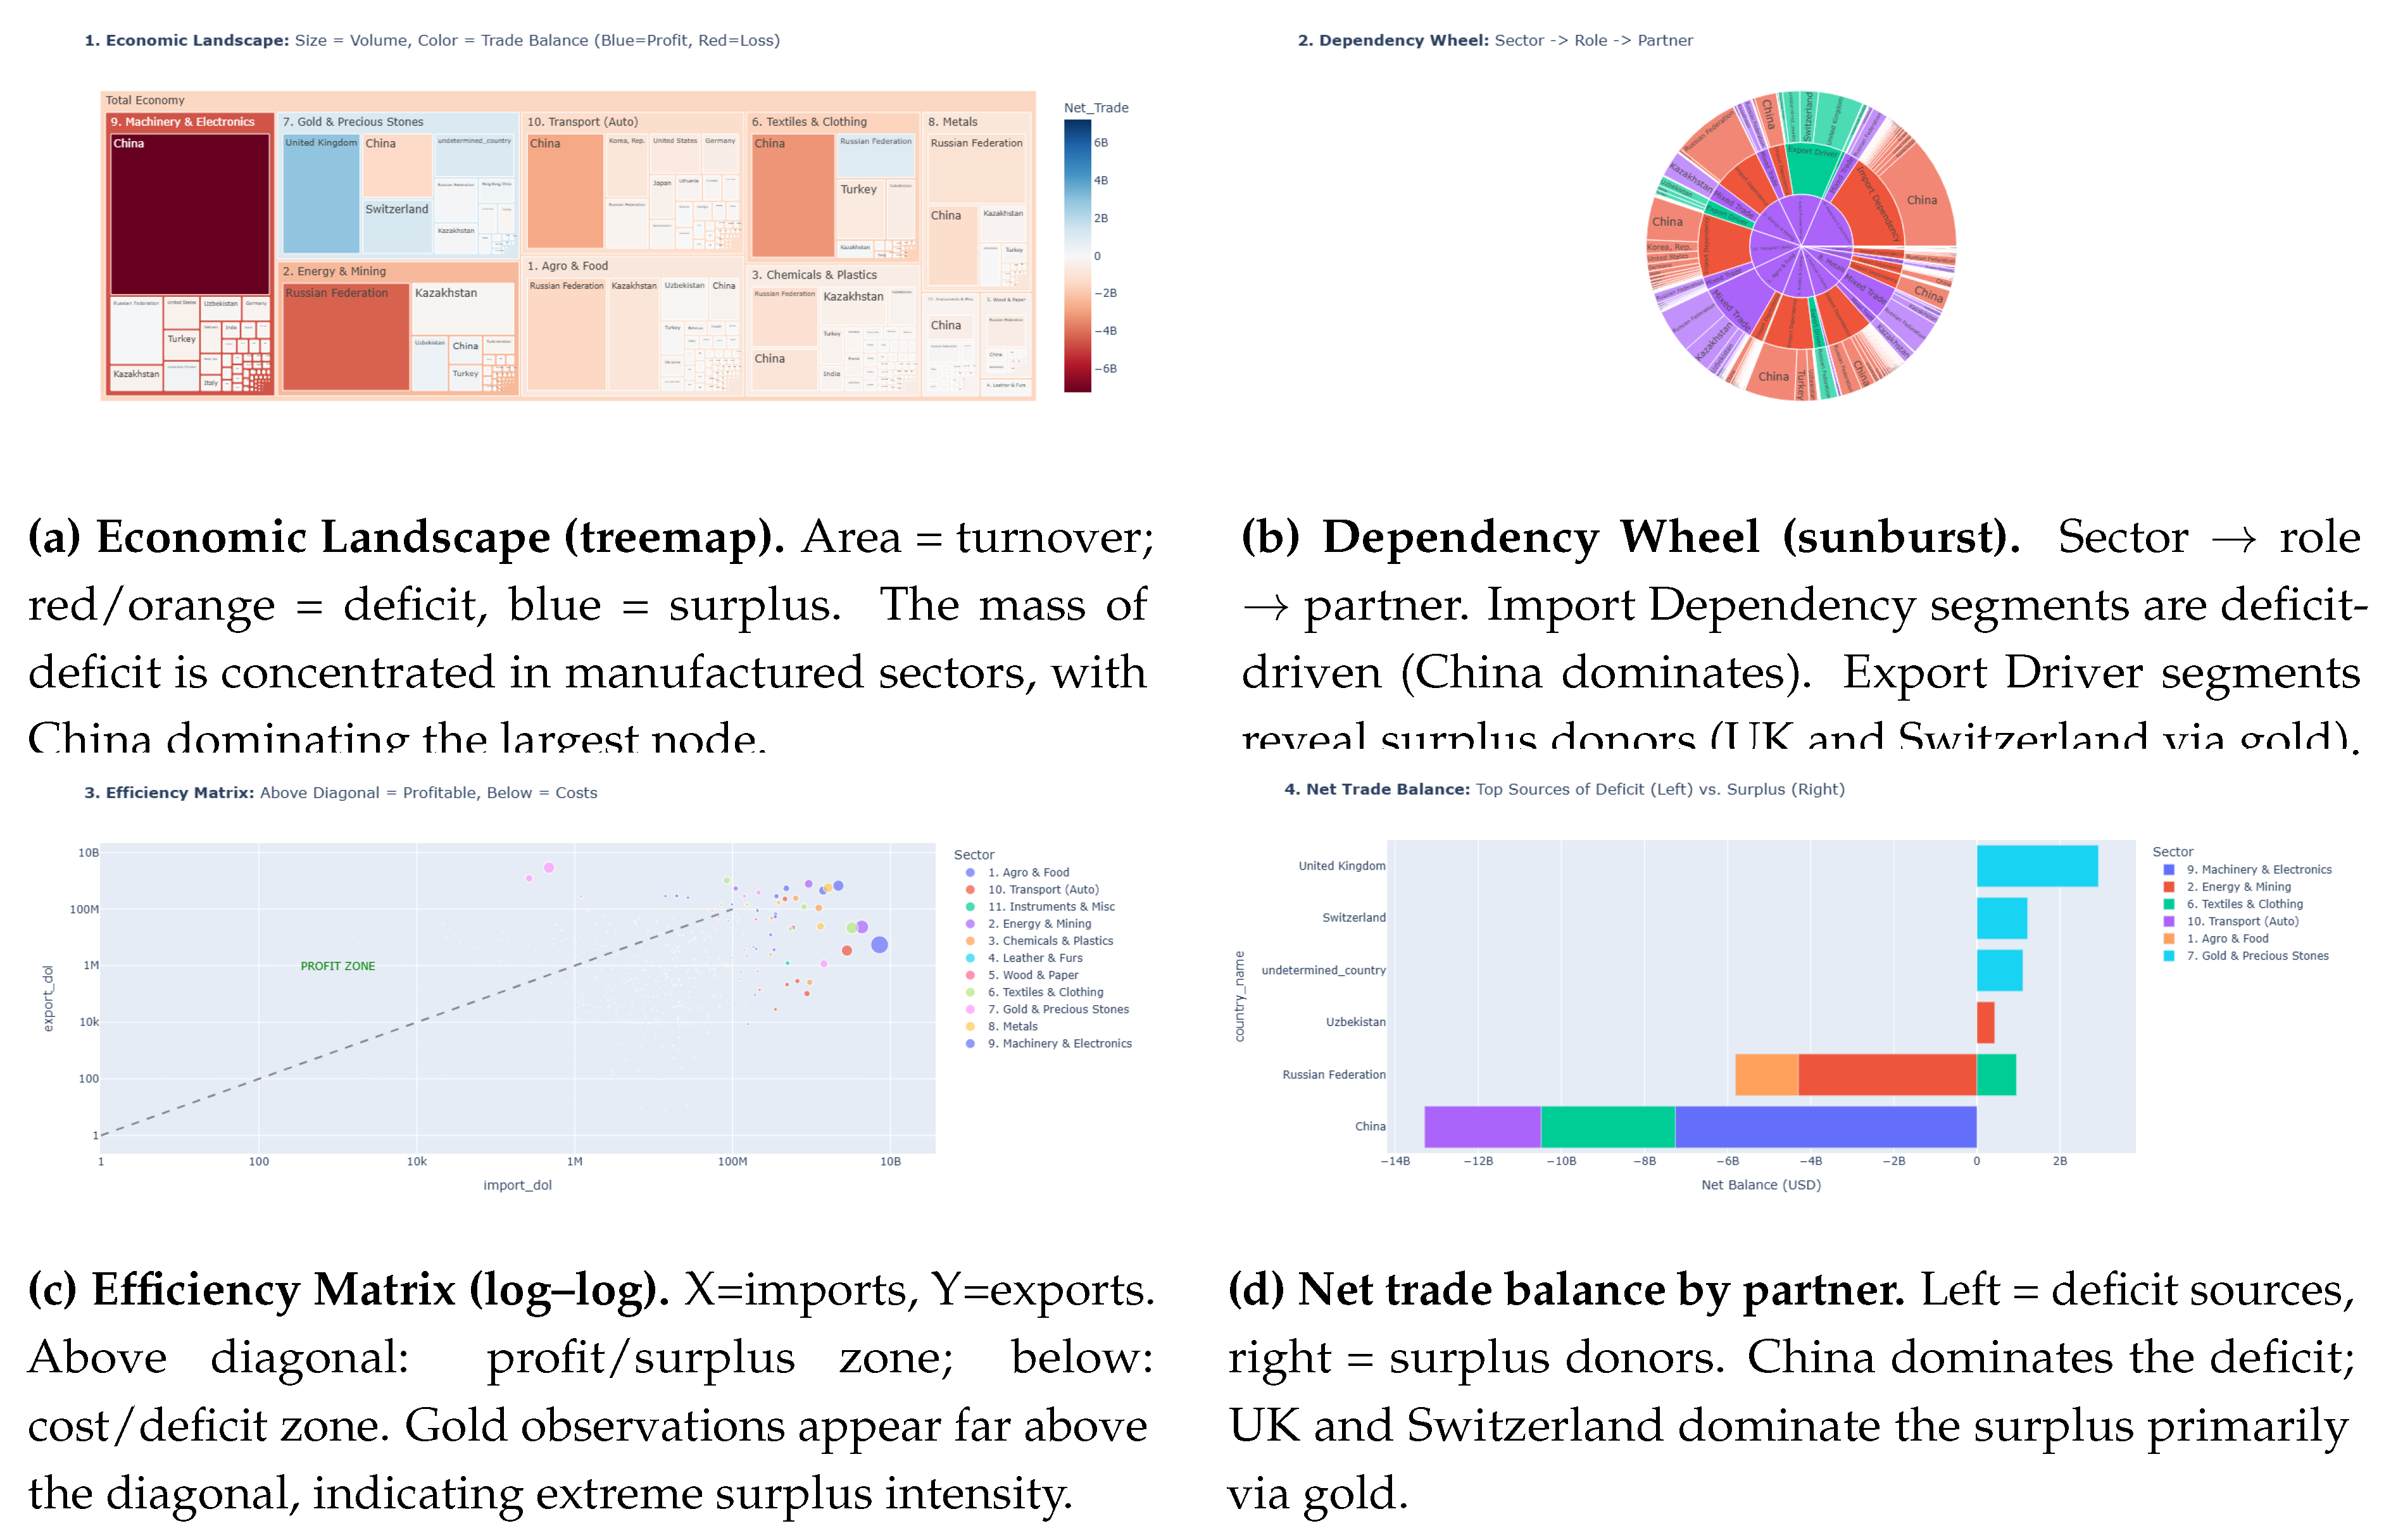
The next four plots provide coordinated evidence: (a) where deficit mass sits (treemap), (b) how roles split by sector and partner (sunburst), (c) which observations lie above vs below the diagonal (efficiency), and (d) which partners donate surplus vs generate deficit (net balance ranking).
Figure 1.
Two poles in close-up. Deficit is dominated by China-linked manufactured imports; surplus is dominated by UK/Switzerland via gold exports.
Figure 1.
Two poles in close-up. Deficit is dominated by China-linked manufactured imports; surplus is dominated by UK/Switzerland via gold exports.
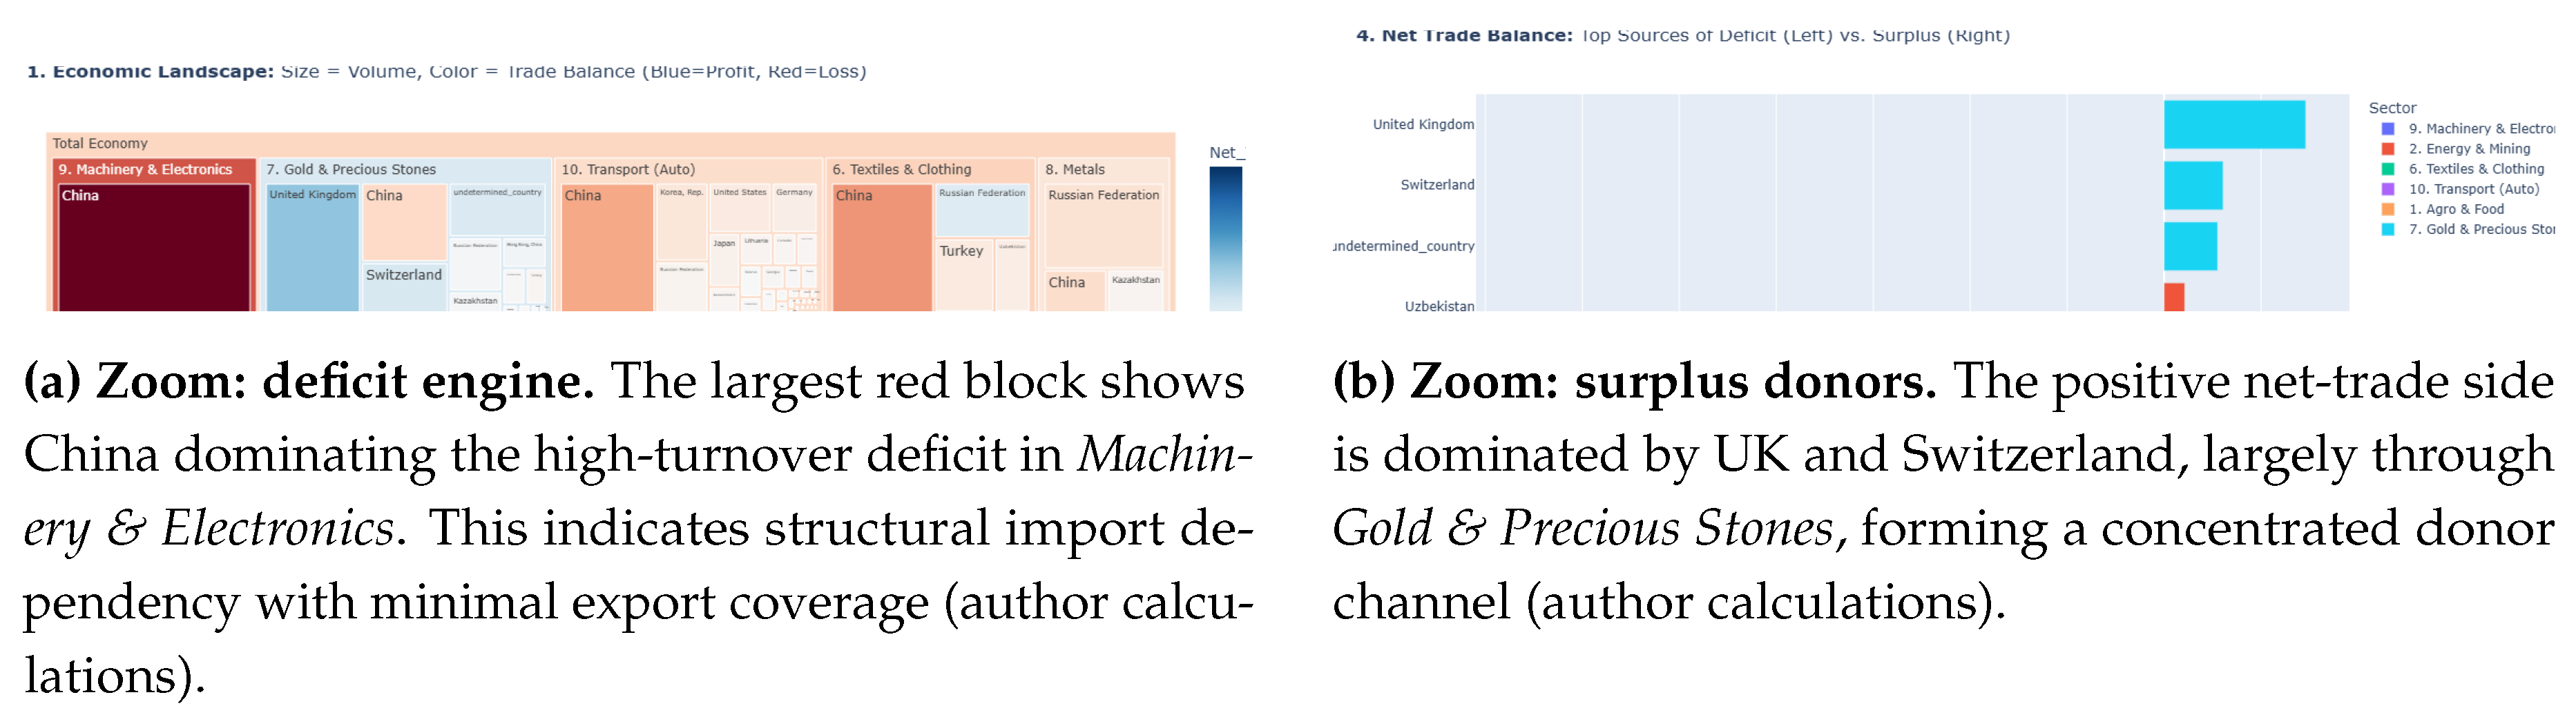
Figure 2.
Structural duality in Kyrgyz trade (2019–2024), Part II. Efficiency geometry and partner contributions to deficit/surplus.
Figure 2.
Structural duality in Kyrgyz trade (2019–2024), Part II. Efficiency geometry and partner contributions to deficit/surplus.
4.3. Partner Categories: Turnover vs Net Balance
Figure 3 shows that the aggregate trade balance is shaped by a few outliers. Turnover (log scale) measures partner importance, while the vertical axis shows whether the partner behaves as a deficit source or a surplus donor.
4.4. Main Empirical Message (One Idea)
Across all views, one pattern is stable: the Kyrgyz Republic’s surplus side is concentrated in Gold & Precious Stones exports, and the largest positive net trade is generated by the United Kingdom and Switzerland. In parallel, the deficit side is concentrated in manufactured imports dominated by China. This is the operational definition of structural duality: one concentrated surplus-donor channel partially offsets one concentrated deficit engine.
5. Quantitative Evidence from Top-5 and CSV Tables
5.1. Extremes: Top Profit Zone vs Top Cost Zone (2019–2024 Aggregate)
Table 1 isolates the most extreme partner–sector links. UK and Switzerland in Gold & Precious Stones have coverage ratios in the thousands, while the largest deficits are dominated by China in manufactured sectors (author calculations).
5.2. CSV Time-Series Excerpt: Donors vs DEFICIT Engines
Table 2 summarizes donor links (gold to UK/Switzerland) and the largest deficit engines (manufactured imports dominated by China).
6. Limitations (Short)
7. Conclusion (Strong and Compact)
This paper shows that Kyrgyz goods trade in 2019–2024 is best described as a two-pole system.
1) Deficit engine (China-centered manufactures). The largest and most persistent deficits are concentrated in China-linked manufactured imports, especially Machinery & Electronics and Transport (Auto). These high-turnover links exhibit near-zero import coverage, meaning exports do not scale with the import requirement.
2) Surplus donors (UK and Switzerland via gold). The surplus side is disproportionately generated by Gold & Precious Stones exports, with the United Kingdom and Switzerland dominating positive net trade. Coverage ratios above 4,000–6,000× indicate that these partners act as surplus donors—they provide a concentrated foreign-exchange inflow channel that partially offsets the deficit engine.
3) Method value for monitoring. The main methodological contribution is a lightweight, reproducible pipeline (HS-to-sector mapping + partner-role labeling + coverage diagnostics) that can be rerun on new monthly/annual data. This enables routine monitoring of: (i) whether the donor channel becomes less concentrated (more partners/sectors generating surplus), and (ii) whether coverage improves in the largest deficit sectors.
References
- International Monetary Fund. Kyrgyz Republic: 2023 Article IV Consultation—Staff Report. 2024. Available online: https://www.imf.org/en/Publications/CR.
- International Monetary Fund. Kyrgyz Republic: 2025 Article IV Consultation—Press Release; and Staff Report. 2025. Available online: https://www.imf.org/en/Publications/CR.
- World Bank. Kyrgyz Republic Economic Update. 2024. Available online: https://documents.worldbank.org/.
- EBRD. Transition Report 2024–25: Kyrgyz Republic. 2024. Available online: https://www.ebrd.com/.
- National Bank of the Kyrgyz Republic. Balance of Payments of the Kyrgyz Republic. 2024. Available online: https://www.nbkr.kg/.
- National Statistical Committee of the Kyrgyz Republic (2019–2024). External trade statistics and open data portal. Available online: https://stat.gov.kg/en/.
- WITS / UN Comtrade. Kyrgyz Republic trade snapshot. Available online: https://wits.worldbank.org/countrysnapshot/en/KGZ.
- Cadot, O.; Carrère, C.; Strauss-Kahn, V. Export diversification: what’s behind the hump? Review of Economics and Statistics 2011, 93(2), 590–605. [Google Scholar] [CrossRef]
- Imbs, J.; Wacziarg, R. Stages of diversification. American Economic Review 2003, 93(1), 63–86. [Google Scholar] [CrossRef]
- Yeo, I.-K.; Johnson, R. A. A new family of power transformations to improve normality or symmetry. Biometrika 2000, 87(4), 954–959. [Google Scholar] [CrossRef]
- scikit-learn documentation (PowerTransformer). Available online: https://scikit-learn.org/stable/modules/generated/sklearn.preprocessing.PowerTransformer.html.
- scikit-learn documentation (KMeans). Available online: https://scikit-learn.org/stable/modules/generated/sklearn.cluster.KMeans.html.
- Pedregosa, F.; et al. Scikit-learn: Machine Learning in Python. Journal of Machine Learning Research 2011, 12, 2825–2830. [Google Scholar]
- UN ESCAP. Estimating illicit financial flows from trade misinvoicing: evidence and methods for Central Asia. 2022. Available online: https://repository.unescap.org/.
Figure 3.
Trade matrix (partner turnover vs net balance). China is an extreme deficit outlier with very high turnover. Only a few partners appear above zero as surplus donors, consistent with a narrow surplus base. Bubble size reflects product count / diversification proxy.
Figure 3.
Trade matrix (partner turnover vs net balance). China is an extreme deficit outlier with very high turnover. Only a few partners appear above zero as surplus donors, consistent with a narrow surplus base. Bubble size reflects product count / diversification proxy.
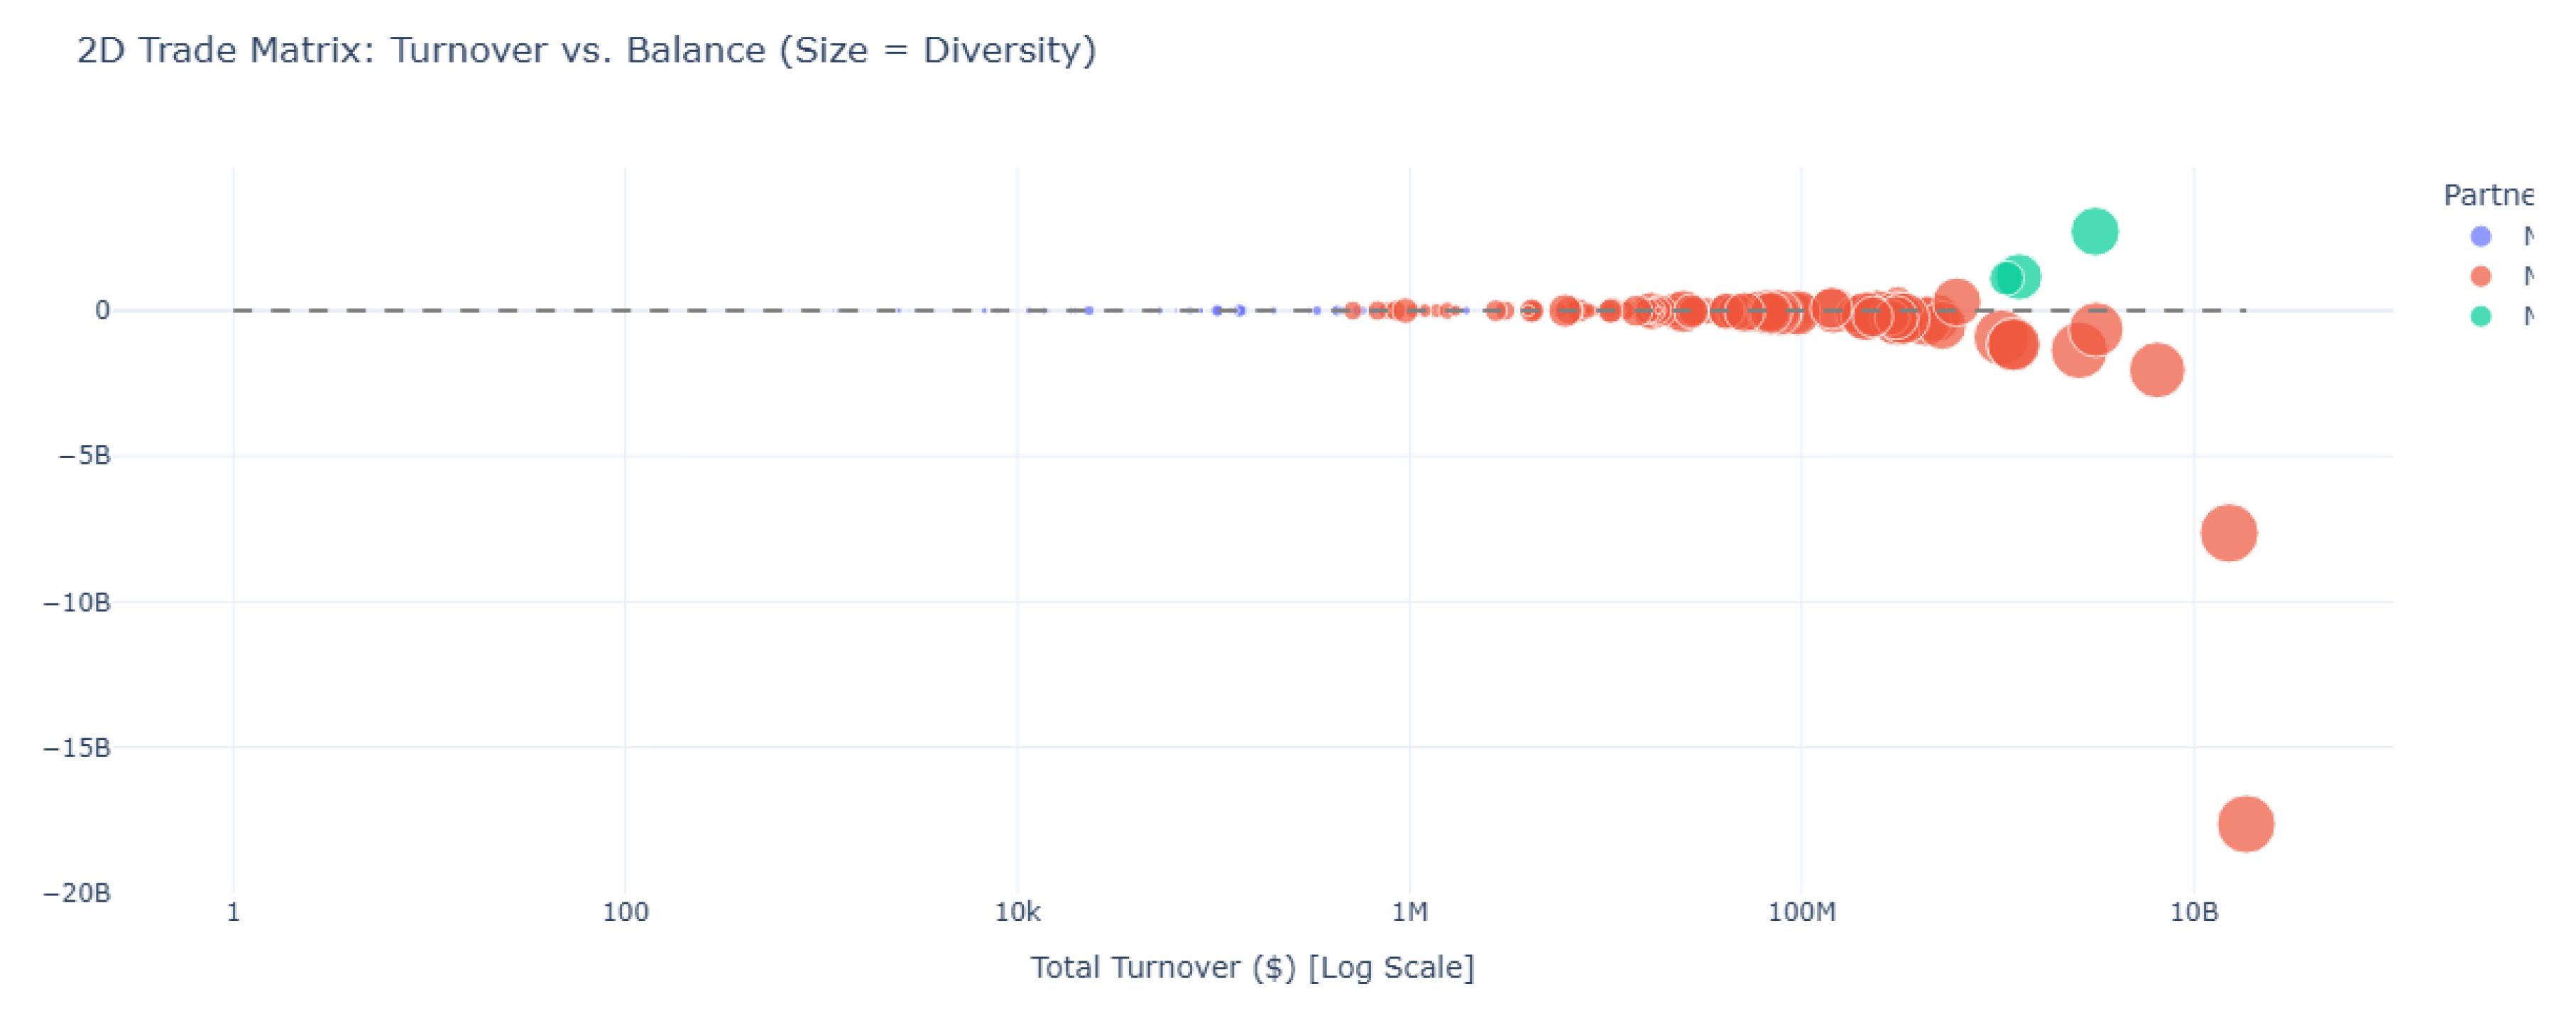

Table 1.
Top-5 “Profit Zone” and Top-5 “Cost Zone” partner–sector observations (2019–2024 aggregate, author calculations).
Table 1.
Top-5 “Profit Zone” and Top-5 “Cost Zone” partner–sector observations (2019–2024 aggregate, author calculations).
| Group | Partner (Sector) | Net trade (USD) | Exports (USD) | Imports (USD) | Coverage | Turnover (USD) |
|---|---|---|---|---|---|---|
| Profit | United Kingdom (Gold & Precious Stones) | +2,922,572,650 | 2,923,045,238 | 472,588 | 6185.2× | 2,923,517,826 |
| Profit | Switzerland (Gold & Precious Stones) | +1,218,287,252 | 1,218,551,695 | 264,443 | 4608.0× | 1,218,816,138 |
| Profit | undetermined_country (Gold & Precious Stones) | +1,105,146,438 | 1,105,146,438 | 0 | ∞ | 1,105,146,438 |
| Profit | Russian Federation (Textiles & Clothing) | +948,595,595 | 1,032,858,668 | 84,263,073 | 12.3× | 1,117,121,741 |
| Profit | Uzbekistan (Energy & Mining) | +426,155,621 | 535,678,229 | 109,522,608 | 4.9× | 645,200,837 |
| Cost | China (Machinery & Electronics) | -7,258,143,375 | 5,511,950 | 7,263,655,325 | 0.1% | 7,269,167,275 |
| Cost | Russian Federation (Energy & Mining) | -4,301,778,003 | 23,363,231 | 4,325,141,234 | 0.5% | 4,348,504,465 |
| Cost | China (Textiles & Clothing) | -3,229,372,757 | 21,628,011 | 3,251,000,768 | 0.7% | 3,272,628,779 |
| Cost | China (Transport (Auto)) | -2,804,629,618 | 3,434,566 | 2,808,064,184 | 0.1% | 2,811,498,750 |
| Cost | Russian Federation (Agro & Food) | -1,511,405,945 | 673,986,764 | 2,185,392,709 | 30.8% | 2,859,379,473 |
Table 2.
Selected partner–sector net trade time series (USD), 2019–2024 (excerpt from CSV, author calculations).
Table 2.
Selected partner–sector net trade time series (USD), 2019–2024 (excerpt from CSV, author calculations).
| Sector | Partner | 2019 | 2020 | 2021 | 2022 | 2023 | 2024 | Total |
|---|---|---|---|---|---|---|---|---|
| Gold & Prec. Stones | United Kingdom | 832,082,542 | 986,746,270 | 233,489,193 | -137,826 | -99,974 | 870,492,445 | 2,922,572,650 |
| Gold & Prec. Stones | Switzerland | 3,907,365 | 7,280,552 | 54,114,659 | -41,585 | 1,088,164,388 | 64,861,873 | 1,218,287,252 |
| Gold & Prec. Stones | China | -278,303,360 | -62,293,081 | -151,837,035 | -552,327,489 | -277,925,859 | -107,272,674 | -1,429,959,498 |
| Machinery & Elec. | China | -493,593,102 | -256,162,925 | -387,724,673 | -1,075,778,885 | -2,412,656,525 | -2,632,227,265 | -7,258,143,375 |
| Transport (Auto) | China | -63,411,219 | -25,182,175 | -66,787,615 | -141,548,887 | -1,445,615,941 | -1,062,083,781 | -2,804,629,618 |
| Textiles & Clothing | China | -417,802,608 | -161,429,951 | -541,653,273 | -1,230,751,250 | -521,076,009 | -356,659,666 | -3,229,372,757 |
Disclaimer/Publisher’s Note: The statements, opinions and data contained in all publications are solely those of the individual author(s) and contributor(s) and not of MDPI and/or the editor(s). MDPI and/or the editor(s) disclaim responsibility for any injury to people or property resulting from any ideas, methods, instructions or products referred to in the content. |
© 2025 by the authors. Licensee MDPI, Basel, Switzerland. This article is an open access article distributed under the terms and conditions of the Creative Commons Attribution (CC BY) license (http://creativecommons.org/licenses/by/4.0/).
Copyright: This open access article is published under a Creative Commons CC BY 4.0 license, which permit the free download, distribution, and reuse, provided that the author and preprint are cited in any reuse.


