
Submitted:
25 December 2025
Posted:
26 December 2025
You are already at the latest version
Abstract
TiO2 improves its photocatalytic properties when combined with other oxides, such as ZrO2. Unfortunately, this material does not exhibit a spectral response in the visible range, but this can be improved by adding WO3. Here, the effect of the amount of WO3 and the treatment temperature on TiO2-ZrO2-WO3 materials applied in the solar photocatalytic oxidation of sildenafil was evaluated. The materials were synthesized using sol-gel method and were characterized by N2, XRD, UV-Vis RDS, SEM, PL, and XPS. Photocatalytic activity was determined by degradation and mineralization of sildenafil. The most active photocatalysts were selected for stability testing and to determine the oxidizing species that dominate the reaction mechanism. The optimal amount of WO3 that improves solar photocatalytic activity at both treatment temperatures was found to be 1% with a reaction mechanism based on OH· and h+. WO3 reduces electron-hole pair recombination. At 500 °C, the crystallinity of the anatase phase is improved, while at 800 °C, the transformation to rutile is suppressed at low WO₃ concentrations. XPS observed the reduction of Ti4+ to Ti3+ and W6+ to W5+ in TiO2-ZrO2-WO3 materials, which were found to be photoactive under sunlight with potential for use in industrial-scale reaction systems.
Keywords:
TiO2-ZrO2-WO3
; sildenafil
; sunlight
; photocatalytic oxidation
; ZrTiO4
1. Introduction
The issue of pharmaceutical compound-induced environmental pollution has emerged as a significant environmental concern in recent years. The identification of a more efficient method for the treatment and elimination of these pollutants prior to their release into wastewater has proven to be a challenging endeavor. Consequently, there are a variety of methods available for the treatment of pharmaceutical wastewater, which can be categorized into the following: biological, physical, chemical, photochemical, and combined methods [1]. Recent studies have demonstrated that there are in excess of 600 pharmaceutical substances that have the capacity to cause significant pollution of the aquatic environment [2]. Among these pollutants is sildenafil citrate, the active ingredient in the pharmaceutical product Viagra®, whose patent expired in 2019, thus allowing the production of low-cost generic drugs in several countries by different pharmaceutical companies. The drug has been demonstrated to enhance penile blood flow during sexual stimulation in patients with and without erectile dysfunction. Consequently, there has been a significant increase in global consumption of the substance [3]. When ingested, the drug is excreted as metabolites in urine and faeces, which increases the likelihood of these substances being found in wastewater. There, they can undergo natural hydrolysis, biodegradation and solar photo-oxidation. The latter process generates photochemical reactions capable of forming products that are significantly more persistent and toxic than the original compound, with serious consequences for the aquatic environment [4]. In 2018, concentrations of sildenafil and two of its urinary metabolites (desmethyl- and desethylsildenafil) were detected in wastewater within the European Union at a concentration of approximately 60 ngL-1 [5]. Furthermore, the products resulting from chemical transformation of sildenafil and its human N-desmethylated metabolite have been identified under simulated sunlight using ultra-performance liquid chromatography-electrospray ionization-quadrupole time-of-flight-mass spectrometry (UPLC-ESI-QToF-MS), liquid chromatography -atmospheric pressure chemical ionization-triple quadrupole mass spectrometry (LC-APCI-QqQ-MS) and hydrogen/deuterium exchange [6]. The initial reports pertaining to the degradation of this molecule have been associated with advanced oxidation processes, including the utilization of ozone and ozone in conjunction with UV light, employing a surface response methodology [7]. In addition, there is evidence of ultrasonically driven catalytic piezoelectric degradation with 3D spherical mesoporous Fe2O3 [8] and MoS2/NaBi(MoO4)2 [9] materials. In a recent study, the photocatalytic efficiency of TiO₂ for degrading sildenafil and its toxic derivatives in water with different oxidants, including peroxymonosulphate (PMS), persulphate (PS) and hydrogen peroxide (H2O2), using simulated sunlight, was analyzed [10].
With regard to the photocatalytic properties of TiO2, it has been demonstrated that the incorporation of binary oxides, such as ZrO2, WO3, ZnO, SnO2, SiO2, CeO2, PdO, CuO, and Fe2O3, can enhance the efficiency of photocatalysis [11]. Previous studies have demonstrated that binary oxides, such as TiO2-ZrO2, when sensitized with dyes, exhibit an efficient spectral response under sunlight. However, the presence of the dye is a prerequisite for effective photoactivity with visible light [12]. Nevertheless, ternary oxides based on TiO2-ZrO2-Fe2O3 with photocatalytic applications for drug removal have been proposed, but the activity of this type of material is restricted to the use of UV light [13]. The selection of an appropriate third inorganic oxide for the TiO2-ZrO2 system is pivotal for this solid to demonstrate photoactivity under visible light. It has been established that the incorporation of CeO2 accomplishes this objective by enhancing thermal stability and photocatalytic activity [14]. Moreover, the extant evidence indicates an augmentation in photocatalytic activity under visible light in both pure TiO₂ [15] and TiO₂-SiO₂ [16] when WO₃ is utilized. This is attributable to the formation of heterojunctions, which are responsible for enhancing the performance of the photocatalytic process. On the other hand, it has been documented that the TiO2-ZrO2 system, when subjected to heat treatment at temperatures approximating 700 °C, results in the formation of the orthorhombic phase of zirconium titanate (ZrTiO4) [17]. This phase, when combined with other metal oxides, has been observed to significantly enhance photocatalytic activity, expediting charge separation, surface defects, and spectral response in the visible region [18,19]. The present study proposes the identification of the optimal amount of WO3 for the TiO2-ZrO2 system, in addition to the analysis of the effect of this oxide on photocatalytic properties. This analysis is conducted through physicochemical characterizations and evaluation tests, with the objective of utilizing it as a heterogeneous photocatalyst under simulated sunlight in the degradation of pharmaceutical contaminants (sildenafil) in an aqueous medium, considering two treatment temperatures. In order to ascertain the presence of the anatase crystalline phase in TiO2, a temperature of 500 °C is required. Furthermore, in order to investigate the effect on the formation of the orthorhombic crystalline phase of ZrTiO4 and the synergy it can produce with other crystalline phases in the proposed material, a temperature of 800 °C also is required.
2. Results and Discussion
2.1. TGA-DSC Results
Samples TZW5 and TZW10 were characterized by simultaneous thermogravimetric analysis and differential scanning calorimetry (TGA-DSC) prior to the final stage of heat treatment. This was done in order to identify mass loss and endothermic and exothermic changes in the catalysts, as well as their thermal stability at different temperatures, as shown in Figure 1. The thermograms exhibited a working temperature range of 25 to 1000 °C. Thermogravimetric analysis (TGA) of the TZW5 catalyst exhibited a mass loss of 16%, while the TZW10 sample demonstrated a mass deficit of 15%. This mass loss is primarily attributable to the presence of moisture and the decomposition of solvents within the catalyst during the analytical process.
For both samples, it can be observed that above 100 °C, the differential scanning calorimetry (DSC) curve showed an endothermic peak representing the loss of physisorbed water in the materials. Subsequently, with the increase in temperature, an exothermic peak can be observed between 250 and 500 °C, corresponding to pyrolysis generated by the decomposition of organic matter from the metal precursors and solvents used in the synthesis, as well as by hydroxyl radicals [20]. It is evident that from 600 °C onwards, thermal stability is observed in both cases. However, at 750 °C, a slight exothermic band is observed, indicating a structural change attributed to the formation of the orthorhombic phase of zirconium titanate (ZrTiO4). This phase has been reported to form in the TiO2-ZrO2 system above 700 °C when the TiO2 proportion is greater than 50% [21].
2.2. X-Ray Difracction
Figure 2 shows the crystallographic patterns corresponding to the samples treated at 500 °C. It can be observed that TiO₂ only exhibits the crystalline structure corresponding to the anatase phase (A) at 2θ: 25.35° (101), 38.12° (112), 48.30° (200), 53.97° (105), 55.27° (211), 62.89° (204), 68.91° (116), 70.49° (220), 75.03° (215) with JCPDS card No. 21-1272 [22]. For ZrO2, the main signals identified correspond to the tetragonal crystalline phase (t-Z) at 2θ: 30.2° (101), 35.2° (110), 50.6° (112), 60.2° (211), 74.70° (220), with JCPDS card No. 80-0965. A slight signal is observed at 28.2° on the 2θ scale, which is attributed to the monoclinic phase (m-Z) [23]. In the case of the TiO2-ZrO2 sample, the characteristics of an almost amorphous material are observed, with only a few signals from the anatase crystalline phase of TiO2 being distinguishable. This phenomenon can be attributed primarily to the elevated proportion of TiO2 in comparison to ZrO2 [24], as there are reports describing the formation of completely amorphous materials when the ratio of these materials is 1:1 [25]. It is evident that the insertion of ZrO2 into TiO2 causes a shift of the 101 plane signal to the left at an angle of 25.35° on the 2θ scale, indicating an increase in interplanar spacing caused by the expansion of the crystal lattice. This effect is also evident when different percentages of WO3 are incorporated into TiO2-ZrO2. The increase in WO3 content has been shown to cause TiO2-ZrO2 to exhibit a slight increase in the crystallinity of the most abundant crystalline phase [26,27].
In relation to the materials subjected to treatment at 800 °C, Figure 3 presents the diffractograms that describe these samples. In section a), the presence of TiO2 is indicated by signals corresponding to the rutile crystalline phase (R) at 2θ: 27.36° (110), 35.96° (101), 41.23° (111), 43.96° (210), 54.30 (211), 56.59° (200), 63.87° (310), 68.95° (301). JCPDS card No. 21-1276. However, the signal at 25.35° (101) of the anatase phase is slightly visible, suggesting that the synthesis method has a partial inhibitory effect on the thermal transformation of the anatase phase to rutile, as previously reported by the research group [28]. The incorporation of ZrO2 results in the formation of the orthorhombic crystal structure of ZrTiO4 (T), as evidenced by the JCPDS file No. 34-0415 at 2θ: 30.42° (111), 32.60° (020), 41.91° (121), 50.90° (022), 53.50° (031) [29]. It is evident that the incorporation of ZrO2 also inhibits the partial transformation of the anatase phase to rutile, which occurs at temperatures above 750 °C [30], thereby generating a synergy between the anatase, rutile and orthorhombic phases
When WO3 is added at low concentrations, the signals from the anatase and orthorhombic crystalline phases are clearly visible, whilst the rutile phase is barely perceptible. However, it is notable that the signals from these three crystalline phases increase considerably up to 3% WO3. However, when the concentration is elevated to 5%, there is a concomitant decrease in the signals corresponding to the anatase and orthorhombic phases, accompanied by an increase in the rutile phase. In section b), it is evident that in materials with high WO3 concentrations, the signals belonging to anatase become almost imperceptible, while the signals for the rutile (R) and orthorhombic (T) phases are present. Furthermore, the formation of the brookite (B) crystalline phase of TiO₂ is evident from 7% onwards, which was identified with JCPDS card no. 29-1360 at 25.3° (120) and 25.7° (111) on the 2θ scale, and increases its crystallinity as the highest amount of WO3 is reached. On the other hand, in these two materials, the presence of the hexagonal (JCPDS card no. 33-1387) and monoclinic (JCPDS card no. 43-1035) crystalline phases corresponding to WO3 were slightly identified, generating photocatalytic solids with up to 6 different crystalline phases. The main effect of WO3 in the TiO2-ZrO2 system at 800 °C is to prevent the transformation of the anatase phase to rutile at low concentrations. However, when WO3 exceeds 5%, this phase transformation allows for very low crystallinity in anatase and the appearance of the brookite crystalline phase, which increases with the amount of WO3 [31,32].
As illustrated in Table 1, the average crystal size was determined by employing Scherrer’s equation for the planes of the anatase, rutile, and orthorhombic crystalline phases. At 500 °C, the addition of ZrO2 to TiO2 has been shown to reduce the average crystal size. This is due to the larger size of Zr4+ ions (0.72Å) compared to Ti4+ ions (0.61Å). This results in a distortion of the lattice, which consequently inhibits nucleation, hinders crystal growth and limits its size [33]. Upon the addition of WO3 to the TiO2-ZrO2 system, a slight increase in the average crystal size is observed in samples TZW1, TZW3, and TZW5. The values obtained for this study are closely spaced, with minimal variation, with TZW3 exhibiting the highest value. However, increasing the WO3 content to 7% significantly improves the crystallinity of the anatase phase. Conversely, when the WO3 content is higher (10%), the average crystal size decreases. At an elevated temperature of 800 °C, the anatase phase of TiO2-ZrO2 exhibits an average particle size of 20.15 nm, while the orthorhombic phase demonstrates an average particle size of 8.50 nm. The incorporation of 1% WO3 has been demonstrated to enhance the crystallinity of both crystalline phases, as evidenced by an increase in their average crystal size. However, at 3% WO3, the formation of the rutile phase (53.16 nm) is promoted, and the anatase and orthorhombic phases continue to grow. In the case of the TZW5 material, an increase in the anatase and rutile crystalline phases is observed, whilst the orthorhombic phase decreases. As WO3 continues to be added to the TZW7 sample, the anatase phase disappears and the average crystal size value increases for the rutile and orthorhombic phases. Conversely, the opposite occurs in the TZW10 material.
2.3. N2 Physisorption
As depicted in Figure 4 a), the adsorption-desorption isotherm of N₂ for pure TiO₂ treated at 500 °C exhibits a type IV isotherm according to the IUPAC classification with a monomolecular adsorption area at low relative pressures (P/Po), characteristic of mesoporous materials, with a final saturation plateau of variable length. Furthermore, it is accompanied by a barely perceptible hysteresis loop that could be designated as type H1, with a pore geometry that is analogous to that of an ink bottle, where the width of the neck size distribution is commensurate with the pore width of the material. When ZrO2 is added to TiO2, a type IV(a) isotherm is maintained, but with a greater amount of adsorbed volume of the adsorbate. However, the hysteresis loop for this material is classified as ‘H5’, which is associated with open and partially blocked mesoporous structures [34]. The incorporation of WO3 into the TiO2-ZrO2 system has been shown to result in the maintenance of a type IV(a) isotherm in all materials. For samples TZW1, TZW3, and TZW5, the amount of adsorbed volume is similar. However, when the amount of WO3 is increased to 7%, this volume is significantly reduced. Conversely, when the maximum WO3 content is added, the volume increases again. It has been demonstrated that these materials (TZW) now exhibit an H1-type hysteresis loop, as seen in pure TiO2. In this analysis, the effect of WO3 on the TiO2-ZrO2 system is investigated in materials treated at 500 °C. The results demonstrate that WO3 readjusts the geometry of open or partially blocked mesopores to a pore geometry similar to that of an ink bottle.
The adsorption-desorption isotherms of N2 for materials subjected to treatment at 800 °C are displayed in section b) of Figure 4. In this instance, TiO2 manifests a type IV(a) isotherm and a type H1 hysteresis loop, accompanied by a substantial value of volume adsorbed by the adsorbate. The insertion of ZrO₂ into TiO₂ results in a significant reduction in the adsorbed volume of the adsorbate. This phenomenon can be attributed to the emergence of the orthorhombic phase (ZrTiO₄), which contributes to the material’s crystallinity. Additionally, the observation of a type IV(a) isotherm and a type H₂(b) hysteresis loop is indicative of slit-shaped mesopores, which are known to form non-rigid aggregates of laminar particles [35,36]. The incorporation of WO3 into the TiO2-ZrO2 system has been shown to result in an inverse proportionality between the adsorbed volume of adsorbate and the amount of WO3 added. This phenomenon has been identified as the primary effect of WO3 on the TiO2-ZrO2 system.
As illustrated in Table 2, the structural parameters (i.e. specific area, pore diameter and pore volume) and the percentage distribution of the oxides that constitute the catalysts prepared at 500 and 800 °C are presented in this study. It is evident that the pore diameter distribution remains within the range of 2 to 50 nm, which is indicative of mesoporous materials.
For materials subjected to heat treatment at 500 °C, Table 2, TiO2 exhibits a specific surface area of 54 m2/g, a pore diameter of 8.20 nm, and a pore volume of 0.162 cm3/g. The insertion of ZrO₂ into titania results in a fourfold increase in the specific surface area, a phenomenon attributable to the synthesis method, which promotes the formation of a more porous and dispersed structure for ZrO₂. This phenomenon is also related to the average crystal size in the anatase phase, as reported in Table 1, where smaller crystals are formed. Zr4+ has a larger ionic radius than Ti4+, which inhibits the crystalline growth of the anatase phase, resulting in the appearance of the tetragonal zirconia crystalline phase. This is shown to increase the specific surface area of TiO2. The reduction in pore diameter for the TiO2-ZrO2 material is attributable to factors such as pore blockage, partial pore collapse, and the appearance of the tetragonal zirconia crystalline phase. This process has been shown to result in the migration of pores from smaller to larger sizes, thereby increasing the total volume of the pores [25]. Upon the addition of WO3, a substantial decrease in the specific area is observed; for the TZW1 catalyst, the value is reduced to less than half of its original level. As the proportion of WO3 increases until 3%, there is an observable increase in the specific area. No trend is observed in the pore diameter and volume for TZW materials, as these values increase and decrease alternately. In general terms, the effect of WO3 generates a notable decrease in the specific area, which increases up to 3% and decreases up to 10%. In relation to the materials subjected to treatment at 800 °C, TiO2 now exhibits a specific surface area of 5 m2/g, a pore diameter of 35.07 nm, and a pore volume of 0.175 cm3/g. The modification of titania with ZrO₂ has been shown to result in an increase in the specific surface area (28 m²/g) and a concomitant reduction in diameter (35.07 nm) and pore volume (0.175 cm³/g). In the context of TZW materials, an increase in WO3 content has been observed to result in a concomitant decrease in the specific surface area. The addition of WO3 in amounts up to 3% results in a decrease and subsequent increase in the diameter of the pores, depending on the quantity of WO3 employed. This phenomenon can be attributed to the process of pore collapse and subsequent enlargement [36]. With regard to pore volume, a notable decrease is observed due to the presence of WO3. The effect of WO3 on TiO2-ZrO2 is to reduce the specific surface area and significantly decrease the pore volume.
2.4. UV-Vis Diffuse Reflectance Spectroscopy
The absorption spectra obtained by UV-Vis spectroscopy with diffuse reflectance for materials treated at 500 °C are shown in section a) of Figure 5. For TiO2, an absorption band is observed at approximately 380 nm in the UV region. This absorption is indicative of the anatase phase [38]. The absorption in the UV region of the Ti-O interaction between 250 and 370 nm corresponds to the charge transfer from the O 2p orbital of oxygen to Ti 3d of titanium, i.e., a t1g to 2t2g transition according to ligand field theory [39]. The presence of ZrO2 in titania generates a shift to the left (blue shift) with an absorption edge of ~360 nm, which generates greater electronic transitions [40]. This phenomenon can be attributed to the reduction in the average particle size reported for this material, which is similar when TiO2 is doped with rare earths [30]. However, the incorporation of WO3 in TiO2-ZrO2 generates a shift to the right (a red shift) without reaching the absorption generated by pure TiO2. The absorption bands for TZW materials exhibit analogous behaviour. This shift is attributed to the presence of WO3, which introduces new energy levels in the vicinity of the conduction band of TiO2-ZrO2. In this region, the 5d orbitals of W6+ interact with the 3d orbitals of Ti4+ and possibly with the 4d orbitals of Zr4+, thereby reducing the energy required for photogenerated electron transfer. This interaction can act as a hole electron collector, thereby reducing the probability of charge recombination [41].
The band gap energies (Eg) for materials calcined at 500 °C are displayed in section b of Figure 5. TiO₂ has a value of 3.22 eV when the anatase phase is 100%, a fact which has been widely reported. The incorporation of ZrO₂ results in the replacement of Ti4+ by Zr4+, thereby altering the electronic structure of titania and modifying the density of electronic states at the periphery of the conduction and valence bands. This enables an increase in the minimum level of the conduction band. Furthermore, ZrO₂ has been demonstrated to enhance the electronic defects in pure TiO₂ that manifest as vacancies, thereby suppressing them [25]. This results in an increase in the band gap to 3.40 eV. The presence of WO3 in the TiO2-ZrO2 system has been demonstrated to reduce the band gap value in TZW materials, whose values are in the range of 3.33-3.38 eV. This phenomenon can be attributed to the emergence of novel energy levels within the band gap of the titanium dioxide-zirconium dioxide (TiO2-ZrO2) composite, thereby enabling electronic transitions with reduced energy requirements. Furthermore, the elevated charge of W6+ relative to Ti4+ and Zr4+ gives rise to the formation of surface oxygen vacancies, thereby promoting charge separation and electron transport, resulting in a shift of the absorption band towards the visible [42,43].
As illustrated in Section (c) of Figure 5, the absorption spectra for materials calcined at 800 °C are presented. The band generated by TiO2 and TiO2-ZrO2 absorbs at wavelengths around 380 nm; the TZW1 sample behaves in the same way, but close to 390 nm there is a slight shift towards red. However, when the amount of WO3 is increased to 3%, the absorption shifts towards the blue spectrum before 390 nm and, beyond this wavelength, exhibits characteristics similar to those of TZW1. The addition of WO3 at concentrations of 5%, 7%, and 10% results in a significant shift of the absorption bands towards the red spectrum. In this analysis, the effect generated by the presence of WO3 indicates that at lower amounts, optical absorption similar to that of TiO2 and TiO2-ZrO2 is observed, while at higher amounts, absorption shifts towards the visible range.
The Eg values for materials calcined at 800 °C are displayed in Figure 5 d). In this instance, the value of TiO₂ is found to be 3.22 eV, which increases when ZrO₂ is added (3.27 eV). When the smallest amount of WO3 is added, there is a slight reduction in Eg (3.25 eV), which tends to increase when 3% WO3 is added. In materials with a higher WO3 dose (5, 7, and 10%), the Eg value is significantly reduced. This is caused by the increase in the signal corresponding to the 110 plane (2θ: 27.36°) of the rutile phase. There are reports describing how the phase transition from anatase to rutile due to the increase in temperature generates a shift in absorption towards the visible, which reduces the band gap value [44]. Furthermore, this reduction is influenced by the formation of the brookite (TiO2) and orthorhombic (ZrTiO4) crystalline phases [45]. The presence of different crystalline phases in TZW materials gives rise to variations in the average particle size of each phase. This, in turn, generates oxygen vacancies and structural defects, which also influence the reduction of the band gap [46].
2.5. Scanning Electron Microscope (SEM)/Energy Dispersive X-Ray Analysis (EDS)
Figure 6 presents a visual representation of the surface morphology of the catalysts: TiO2, TZW5 calcined at 500 °C, TZW5 calcined at 800 °C, and the elemental mapping of the aforementioned samples was conducted. In addition, the EDS spectrum describing the elemental composition was obtained. In section (a), the presence of amorphous aggregates with evidence of apparent porosity can be observed, which is characteristic of the anatase phase of TiO₂ [47]. It has been reported that modifying TiO₂ with ZrO₂ generates spheroidal and uniform particles; in this case, for the TZW5 material treated at 500 °C, the formation of these spheroidal aggregates can be seen, as demonstrated in section (b)[48]. However, it has been demonstrated that when the treatment temperature is elevated to 800 °C, the spheroidal aggregates undergo collapse, resulting in the formation of a limited number of polycrystalline aggregates. The present study provides evidence that supports the hypothesis of the formation and growth of polycrystalline aggregates in TiO₂ when treated at temperatures in excess of 600 °C [45] (c). In this instance, the presence of WO3 has been demonstrated to impede the formation of multiple polycrystalline aggregates. This assertion can be substantiated by the XRD spectrum for the material, which exhibits diminished intensity in the signals attributed to the crystalline phases present. The effect of ZrO2 and WO3 on titanium is such that the morphology is defined in larger spheroidal aggregates when the samples are treated at 500 °C, and when the temperature is increased to 800 °C, these aggregates begin to take on a partially polycrystalline appearance.
Subsection (d) illustrates the elemental mapping of the TZW5 sample subjected to a temperature of 500 °C. This section demonstrates the presence and uniform distribution of the elements Ti, Zr, and W within the material. The distribution of these elements aligns with the established distribution during the synthesis process, thereby substantiating the efficacy of the employed preparation method. As delineated in Section (e), the TZW5 catalyst was subjected to calcination at an elevated temperature of 800 °C. In a similar manner, evidence of good dispersion is apparent for Ti, Zr and W. For this particular sample, the formation of multiple W agglomerates is observable. These can be attributed to the elevated treatment temperature, which subsequently leads to the formation of the orthorhombic crystal structure of ZrTiO4. This is the predominant effect resulting from the increase in temperature within the TZW5 samples. Subsection c) presents the elemental distribution for the TZW5500 and TZW5800 samples, as conducted by EDS. It is evident that the ratio of elements in the materials is closely aligned with the calculated values from the theoretical synthesis, suggesting that the synthesis method is efficient.
2.6. Photoluminescence Spectroscopy
Photoluminescence analysis was performed on representative catalysts only, as illustrated in Figure 7. For materials subjected to treatment at 500 °C, the analysis focused on TiO2 and TiO2-ZrO2 samples, encompassing catalysts with varying levels of WO3, specifically TZW1500 and TZW10500, which exhibited the lowest and highest amounts of WO3, respectively. With regard to materials calcined at 800 °C, only the catalysts with the lowest and highest amounts of WO3 (TZW1800 and TZW10800) were the subject of study. TiO2 and TiO2-ZrO2 materials were discarded due to their known low photoactivity under visible light. This study facilitates comprehension of migration, transfer and recombination of charges in photocatalysts and semiconductors. Furthermore, it enables the evaluation of the separation of charges between the analyzed materials [49]. The photoluminescence (PL) spectra of the anatase phase of TiO₂ are attributed to three primary mechanisms: oxygen vacancies, self-trapped excited electron-hole pairs, and defects in specific states. The majority of these particular states are consistent with Ti4+ ions associated with oxygen vacancies [50].
The emission of bands centred at approximately 490 nm, as reported for TiO₂, corresponds to the high recombination of photoinduced charge carriers [51]. For both TiO₂ and TiO₂-ZrO₂, the bands exhibited comparable intensity, a phenomenon potentially attributable to the elevated TiO₂ content (75%). For TiO₂-ZrO₂ samples with 1 and 10% WO₃ treated at 500 °C, it is observed that the sample with the lower WO₃ content has a less intense band. The reduction in band intensity indicates a lower recombination rate of photogenerated charge carriers [52]. WO3 has been reported to act as an e-/h+ scavenger, which favours the separation of these charge carriers, thereby inhibiting recombination. Furthermore, it introduces new energy levels that function as traps to promote separation [53]. In the case of the TZW10 material, the band increases due to the higher WO3 content, which generates intermediate energy levels related to oxygen vacancies associated with the W5+/W6+ states. These states can act as a radioactive recombination centre [54]. Treatment of the TZW materials (1 and 10%) at 800 °C resulted in lower excitation band intensities compared to all other materials, with TZW1800 exhibiting the least intense response. This reduction can also be attributed to the presence of oxygen vacancies, caused by ZrTiO4 [55] and by the presence of Ti3+ [56]. Conversely, the incorporation of WO3 has been shown to facilitate the migration of oxygen vacancies and charge transfer at the TiO2-WO3 interfaces.
2.7. X-Ray Photoelectron Spectroscopy (XPS)
The surface chemical state of the catalysts proposed in this research was investigated using X-ray photoelectron spectroscopy (XPS). As illustrated in Figure 8, the XPS spectra of the samples with the lowest (TZW1) and highest (TZW10) WO3 content treated at 500 °C are presented. The analysis of the oxygen 1s orbital for sample TZW1 (a) reveals the presence of three bands. The energies observed were 529.37 eV, 529.9 eV and 531.4 eV, respectively. The initial process is associated with oxygen in the form of oxide (O2-) [57]. The band corresponding to 529.9 eV has been identified as indicative of a Ti-O-Ti interaction on the surface. It can be posited that, given the absence of a narrow, asymmetrical band, the chemical environment is deemed to be non-uniform, a consequence of the presence of ZrO2 and WO3. The band located at 531.4 eV has been shown to describe the interaction of oxygen in the form of hydroxyl groups absorbed on metal oxides, which generate oxygen defects (vacancies) in the surface lattice of titania [58].
Increases in the amount of WO3 in the TiO2-ZrO2 system have been shown to affect the O 1s orbital in terms of both intensity and distribution of its three bands (e). The data associated with relative abundances can be found in Table 3, which describes the relative abundances in materials with WO3 (TZW1500, TZW10500, TZW1800, and TZW10800). It is evident from the data presented that the oxygen level, expressed as a percentage of oxide, has increased from 44.08% to 51.40%. With regard to the relative abundance referring to the surface Ti-O-Ti interaction, this is reduced from 22.27 to 14.52. Given the absence of a uniform chemical environment, it can be deduced that the increase in WO3 substantially distorts the lattice oxygen in the titania. The presence of oxygen, evidenced by the elevated levels of surface OH groups, exhibits modest augmentation, attributable to the increased quantity of WO3. As illustrated in sections (b) and (f), the XPS spectra for the Ti 2p orbital of samples TZW1 and TZW10 are presented. Furthermore, the presence of Ti 2p1/2 and Ti 2p3/2 is observed with bands associated with 464.04 and 458.2 eV, which represent the Ti4+ oxidation state of the anatase phase [59]. The relative abundance of this oxidation state remains constant, irrespective of the increase in WO3. As demonstrated in sections (c) and (g), the spectra of the Zr 3d orbital exhibit a doublet of peaks in the 3d5/2 and 3d3/2 components, positioned at 182.1 and 184.5 eV, respectively. These peaks are associated with the tetragonal zirconium (t-ZrO2) phase [60]. In sections (d) and (h), the deconvolution of the spectra with interactions of the 4f orbital of W with the 3p orbital of Ti is described. The Ti 3p3/2 band at 36.7 eV and the Ti 3p1/2 band at 37.5 eV refer to Ti4+, while the W 4f7/2 band at 35.8 eV and the W 4f5/2 band at 37.9 eV are associated with W6+ [61]. The relative abundance of the W6+ oxidation state does not evolve with the increase in WO3 content at this treatment temperature.
Subparagraphs (c) and (h) illustrate the XPS spectra of the 3d orbital of Zr, which demonstrate stability and delineate the Zr4+ species at 100% in both samples. Furthermore, it is revealed that the increase in WO3 content does not affect the chemical environment of ZrO2. In sections (d) and (g), the spectra demonstrating interactions between the 4f orbital of W and the 3p orbital of Ti4+ can be observed, exhibiting a shift from 37.5 to 38.2 (Ti 3p1/2) and the band from 36.9 to eV (Ti 3p3/2) maintaining its position as the amount of WO3 is increased. This phenomenon can be attributed to the formation of the brookite, rutile, and orthorhombic crystalline phases, which are precipitated by the elevated treatment temperature of the materials. This increase also induces the formation of the W5+ species, whose bands can be seen at 36.2 eV (W 4f5/2) and 34.8 eV (W 4f7/2), respectively. These bands do not shift when the amount of WO3 is increased, but the relative abundance of this species increases (4.86 to 11.53%). The bands associated with W6+ are observed at 38.1 eV (W 4f5/2) and 36.0 eV (W 4f7/2), respectively, showing a shift to lower energies when the WO3 content increases. This phenomenon can be interpreted as a favourable change in the chemical environment, indicative of enhanced interaction with Ti and Zr. Furthermore, an increase in the relative abundance of the W6+ species has been observed with an increase in the WO3 content of the materials, which is attributed to the growth of the W5+ species.
The deconvoluted XPS spectra for samples TZW1 and TZW10 treated at 800 °C are shown in Figure 9. Items (a) and (e) delineate the 1s orbital of oxygen. As demonstrated in Table 5, the abundances associated with O2-, the Ti-O-Ti bond, and the surface OH groups exhibit a similar trend in relation to the increase in WO3 in the materials analyzed in Figure 7. Item (b) demonstrates the formation of the Ti3+ oxidation state in the 2p orbital of Ti exclusively in sample TZW1. The bands associated with Ti4+ are located at 458.8 eV (Ti 2p3/2) and 464.6 eV (Ti 2p1/2), while those associated with Ti3+ are at 457.38 eV (Ti 2p3/2) and 463.2 eV (Ti 2p1/2) [62]. Furthermore, two bands can be observed at 460.3 eV (2p3/2) and 465.6 eV (2p1/2) (Tiδ+), which are in close proximity to the characteristic values of Ti4+ in TiO2. These bands are related to a transition state from Ti0+ to Ti4+. The elevated treatment temperature suggests the possibility of a modified chemical environment, which can be associated with the formation of ZrTiO4, as evidenced by XRD or with mixed phases between Zr/W and an electronic polarization effect resulting from the interaction with W6+ and Zr4+ [63]. The relative abundances associated with Ti3+ the sample demonstrate that as the amount of WO3 increases, the Ti3+ species disappears and the intensity of the Tiδ+ bands increases, which coincides with the growth of the average crystal size for the orthorhombic phase of ZrTiO4. The effect of WO3 at low concentrations is to generate surface species of Ti3+, which correlate with oxygen vacancies [64]. Conversely, at high concentrations the signals associated with Ti3+ disappear and the presence of the Tiδ+ species, associated with the formation of ZrTiO4, increases.
2.8. Photocatalytic Test
The photodegradation, percentage mineralization, and rate constant (k) obtained in the photocatalytic evaluation of sildenafil under simulated sunlight using the materials synthesized and treated at 500 °C and 800 °C in this work are shown in Figure 10. Section (a) describes the activity of the materials treated at 500 °C. In this instance, the significant impact of the catalysts can be discerned, as photolysis remains constant with minimal degradation during the reaction time. For TiO2, k is approximately 0.0066 min-1, with a degradation level of around 75% (ln (C0/C = 1.36 ± 0.05). However, when ZrO2 is added to titania, degradation is reduced to 64% (ln (C0/C = 1.04 ± 1.04) with k = 0.0051 min-1, because the former oxide inhibits the formation of the anatase crystalline phase, shifts its absorption band towards the UV region and increases the PL emission band, which is attributed to an rise in the recombination centres of the e-/h+ pairs [65]. However, when WO3 is incorporated at a concentration of 1%, the best photocatalytic activity among all photocatalysts is observed, with a degradation of 98% (ln (C0/C = 4.40 ± 0.04) and a k = 0.2035 min-1. This coincides with other studies that mention that the best photocatalytic behaviour under visible light of WO3 in titania is achieved at doses between 0.5 and 3% [66,67]. Moreover, it has been demonstrated that low doses of WO3 in ternary oxides facilitate the separation of charge carriers and reduce the recombination of charge carriers, which consequently results in an enhancement in photocatalytic activity [68]. However, increasing the WO3 dose has been shown to reduce degradation, as this oxide acts as a recombination centre for photogenerated charge carriers [52]. At this treatment temperature, the presence of the anatase crystalline phase in TZW materials also contributes to an increase in photocatalytic activity [69]. The mineralization of sildenafil using materials prepared at 500 °C is demonstrated in section (b). As with the degradation process, photolysis reveals only minimal mineralization. TiO2 has been demonstrated to generate 68% ± 2.08 mineralization, which is equal to and higher than that of some samples with WO3. In this instance, the TiO2-ZrO2 material demonstrates the lowest mineralization levels in comparison to all other materials (52% ± 1.53). This finding suggests that the absence of crystallinity in the material under scrutiny exerts a direct influence on the process of mineralization. The most significant percentage of mineralization was obtained with sample TZW1 (83% ± 2.08). As the amount of WO3 increases, there is a concomitant decrease in mineralization, which can be attributed to degradation. Up to 7%, there is a slight increase, which can be attributed to the appearance of the brookite phase and its synergy with the rutile and orthorhombic phases. Conversely, at the point of maximum WO3 concentration, mineralization undergoes a subsequent decline.
The photocatalytic activity of materials calcined at 800 °C is demonstrated in section (c). In this instance, TiO2 demonstrates the lowest activity with k = 0.0006 min-1 due to the presence of the rutile crystalline phase, which is non-active under visible irradiation [83]. It has been demonstrated that the incorporation of ZrO₂ enhances activity by up to 44% (ln (C0/C = 0.56 ± 0.01) with k = 0.003 min-1. This enhancement is attributed to the inhibition that exists in the thermal transformation from the anatase phase to rutile, thereby demonstrating a synergy between the anatase, rutile and orthorhombic phases. This process also results in low crystallinity in the material, which increases the specific area. It is evident that the insertion of WO3 at the lowest dose results in the optimal photocatalytic performance with a degradation of 96% ( ln (C0/C = 3.25 ± 0.07) and a k = 0.0171 min-1, a phenomenon that is analogous to the behaviour observed in materials subjected to 500 °C treatment. It can thus be posited that the synergy between the anatase, rutile and orthorhombic phases of the TZW1800 catalyst is a predominant factor in its photocatalytic activity. The electronic interaction between the aforementioned crystalline phases generates new oxidation states in TiO2 (Ti3+ and Tiδ+) and WO3 (W5+). In this context, Ti3+ is closely related to the formation of oxygen vacancies that can inhibit electron-hole pair recombination [70], while Tiδ+ is related to a Ti cation with an undefined charge [71]. Furthermore, W5+ can be related to the formation of oxygen vacancies on the surface of WO3. In addition, the TZW1 material exhibits the lowest photoluminescence excitation band, suggesting that it substantially reduces the e-/h+ pair recombination process. The increase in WO3 to 3% and 5%, respectively, decreases the activity (ln (C0/C = 0.0091 min-1 and 0.0028 min-1). However, this reduction becomes more noticeable when the WO3 dose increases to 7%, which is the material with the lowest activity of the TZW series. This behaviour is directly related to an increase in the crystallinity of the rutile phase and the appearance of the brookite phase with lower intensity. However, an increase in the amount of WO3 to 10% results in an enhancement of activity (0.0029 min-1) due to an increase in the intensity of the brookite phase and a reduction of the rutile phase, with the former being photoactive under visible light [72].
As demonstrated in Section (d), the mineralization of sildenafil is evident in materials prepared at an elevated temperature of 800 °C. It is evident that TiO2 exhibits the lowest percentage of mineralization (10% ± 1.16), a finding that aligns with the observations reported during the degradation process. The TiO2-ZrO2 material has been demonstrated to significantly enhance mineralization (42% ± 2.00). Upon incorporation of WO3, it is evident that the TZW1 material exhibits the highest percentage of mineralization (85% ± 1.53), a finding that aligns with the materials subjected to 500 °C treatment. As the WO3 content increases to 7%, there is an observed decrease in mineralization, since this oxide induces recombination centres associated with vacancies generated by the presence of W5+/W6+ states. However, upon observation of the material exhibiting the highest WO3 content, an increase in mineralization was detected. This phenomenon may be attributed to an increase in the relative abundance of the W5+ species.
Section (a) of Figure 11 illustrates four reuse cycles that delineate the percentage degradation of the most active catalysts (TZW1500 and TZW1800) in this study, with the objective of evaluating the stability of these materials. In each cycle, the catalyst was filtered, then washed several times with an aqueous methanol solution and finally dried at 120 °C for 24 hours. The TZW1500 catalyst exhibited a decrease in activity of approximately 6% following the final cycle, with a standard deviation (SD) of ± 2.58 observed between tests. Conversely, for the TZW1800 material, the activity exhibited a decline of up to 5%, accompanied by a SD of ± 2.16. The results obtained demonstrate that photocatalytic activity does not undergo significant changes in several reaction tests. Following the implementation of the reuse cycles, section (b) discloses that the TZW1500 material was subjected to XRD analysis and evaluated in comparison with the conditions that prevailed prior to the reactions. It can be observed that the material does not modify its crystalline structure and, consequently, retains its photocatalytic properties under sunlight. The identification of the primary chemical species involved in the reaction mechanism describing the photocatalytic oxidation of sildenafil using the TZW1500 catalyst was achieved through the execution of photocatalytic tests in the presence of scavengers such as benzoquinone (BQ) to capture the superoxide ion (•O2-), isopropanol (IPA) for hydroxyl radicals (•OH), ethylenediaminetetraacetic acid (EDTA) for holes (h⁺), and potassium dichromate (K₂Cr₂O₇) for electrons (e⁻) [73], as can be seen in section (c). The value of the rate constant decreases significantly in the presence of IPA and EDTA, indicating that •OH and h+ are the main species generated in the photocatalytic process responsible for the oxidation of sildenafil under sunlight.
Following the identification of these species, a reaction mechanism was proposed in Figure 12. In considering the alignment of energy bands between TiO2, ZrO2, and WO3, a mechanism based on a type II heterojunction can be proposed. In this mechanism, photogenerated electrons migrate from the semiconductor with a higher conduction band (CB) level to the one with a lower CB level, while holes move from the material with a lower valence band (VB) level to the one with a higher VB level. In this configuration, simulated solar irradiation is responsible for the stimulation of electron and hole generation, primarily in WO3 within the visible light range and subsequently in TiO2 within the UV range. ZrO2 functions as a charge mediator. It is evident that, due to the occurrence of heterostructured coupling, there is an efficient separation of e- and h+. Subsequently, the electrons can be transferred from the CB of the TiO₂ to the CB of the WO₃, thereby promoting the reduction of the oxygen present in the medium to form •O₂⁻. The oxidizing species has the capacity to interact with the H+ available in the reaction, thereby generating HO2•. The combination of this with itself produces H2O2 and O2. The former reacts with the photogenerated e- to produce •OH and OH- [74]. In consideration of the aforementioned circumstances, the rationale behind the diminished significance of the capture of •O2- in scavenger tests can be elucidated. With regard to the photogenerated h+, these migrate from the VB of WO3 to the VB of TiO2, accumulating in the VB of ZrO2 to react with the adsorbed water, releasing •OH and H+. Concurrently, the h+ also react with the OH-, produced by the e-, to form •OH once more [75]. On the other hand, recent research describes the formation of intermediates and by-products generated in the degradation and thermal decomposition of sildenafil. The process commences with the release of water, carbon dioxide, and itaconic anhydride, which are the by-products of the citrate counterion decomposition. At temperatures of 303 °C, benzene, ethanol, 1-methylpiperazine, isocyanic acid, methylamine, CO2, and SO2 were identified [76], providing insight into the types of intermediates that sildenafil can generate in an aqueous medium when heated by sunlight. It has been documented that the degradation and mineralization of sildenafil occurs as a result of ozonation in combination with UV radiation (O3/UV), resulting in the formation of piperazine, sulfonamide, and the aforementioned products, as evidenced by the thermal decomposition of the molecule [7]. Moreover, other studies have indicated that the photolysis of sildenafil with visible light leads to the facile decomposition of the piperazine ring, resulting in the partial degradation of the aliphatic heterocyclic fraction to form sulfonic acid, which is reported as a pivotal intermediate [6]. Therefore, in the mechanism proposed in this research, it can be inferred that solar photocatalytic oxidation using the TZW1500 catalyst mainly generates hydroxyl radicals and holes. These interact with each other to mineralize sildenafil, producing reaction intermediates and by-products such as CO2, H2O, NO3-, SO42-, and NH4+. These are generated by oxidation.
3. Materials and Methods
3.1. Photocatalyst Synthesis
The phocatalysts were synthesized using the sol-gel method. In an Erlenmeyer flask, the metal precursors of TiO2 (titanium (IV) butoxide, Ti [O(CH2)3CH3]4; 97% Aldrich) and ZrO2 (zirconium butoxide, Zr [O(CH2)3CH3]4; 80% Aldrich) were utilized in a 1:1 solution of n-butanol and sec-butanol (99.9%, Baker) in an Erlenmeyer flask, which was subjected to constant stirring for a duration of one hour. The established ratio of TiO2-ZrO2 was 75:25, in order to ensure the formation of the anatase phase during the process of heat treatment, thus avoiding the formation of an amorphous material. In the case of materials containing WO3, the requisite amount of sodium tungstate dihydrate (NaWO4∙ 2H2O, 99% Meyer) was introduced during this step to achieve 1, 3, 5, 7, 10% by weight of WO3. Subsequently, ultra-pure water (18 MΩ) from a Purelab option Q7BP purifier was added by means of slow dripping. The following ratios were utilized to obtain porous materials: alkoxide/butanol:secbutanol=1/8 by volume and alkoxide/water=1/16 by volume. The system was sealed at ambient temperature and subjected to agitation for a 24-hour period. Subsequently, the solvents were physically separated by placing this solution in an oven at 120 °C for 48 hours. The resultant solids were then subjected to a heat treatment process at temperatures of 500 and 800 °C for 12 hours, with a heating ramp of 2 °C/min. Finally, a total of 12 photocatalysts were obtained, of which 6 were thermally stabilized at 500 °C and 6 catalysts were treated at 800 °C.
3.2. Characterization of Catalysts
Thermogravimetric analysis (TGA) and differential scanning calorimetry (DSC) were performed simultaneously using a LABSYS EVO STA analyzer. (Setaram Instrumentation, LABSYS EVO STA, Caluire-et-Cuire, France). This analysis recorded the evolution of mass loss or gain (decomposition, dehydration, solvent loss, etc.) of a photocatalyst sample as a function of temperature. Furthermore, it has been demonstrated to furnish information pertaining to the thermal effects occasioned by enthalpy changes (i.e. melting, crystallization, polymorphic transformations, etc.). The working conditions were as follows: The experiment was conducted using argon gas at a flow rate of 20 psi and a heating rate of 10 °C/min where temperature was increased from room temperature to 1000 °C, using a platinum crucible. The identification of crystalline phases, the determination of phase transitions, average crystal sizes (using Debye-Scherrer Equation) and crystallization phenomena were carried out by X-ray diffraction for powders. The equipment employed in this study was a Bruker D8 Advance powder diffractometer model D2 Phaser, equipped with a Cu tube, with radiation corresponding to the CuKα transition with a wavelength of 1.5418 Å from 20° to 80° on the 2θ scale, at a step of 0.02° and with a step time of 1 second, with the fast Lynx Eye 1D mode detector and automated sample holder for six samples. The characterization of textural properties, such as specific surface area (Sg), was conducted using the BET (Brunauer, Emmet, & Teller) method, while pore volume (Vp) and pore diameter distribution (DP) were determined using the BJH method. These analyses were performed using a pore analyzer (Micromeritics, TriStar II, Norcross, Georgia, USA). In order to perform the analysis, the photocatalysts were subjected to outgassing at a temperature of 350 degrees. The diffuse reflectance spectra of the photocatalysts were obtained using a spectrophotometer equipped with an integrating sphere (SHIMADZU, UV-2600, Kioto, Japan), with BaSO4 used as a reference. The UV-Vis absorption spectra obtained were utilized to estimate the band-gap energy (Eg) according to the Tauc’s equation considering allowed direct transitions (n = 1/2) by plotting (αhν)2 vs Energy [77]. The images referring to the morphology and semi-quantitative elemental analysis of the catalysts analyzed were obtained using a scanning electron microscope, (JEOL, JSM-6010LA, Tokio, Japan), coupled with an energy-dispersive X-ray spectroscopy detector (EDS). The photoluminescence (FL) emission spectra were measured at room temperature in a spectrofluorometer (Agilent, Cary Eclipse, California, USA) equipped with a 450 W xenon lamp at an excitation wavelength of 365 nm. The XPS spectra of the selected catalysts were obtained using a SPECS spectrometer with a PHOIBOS 150 WAL hemispherical energy analyzer with angular resolution (<0.5 degrees), equipped with an XR 50 X-Ray Al-ray and μ-FOCUS 500 X-Ray monochromator sources (Al excitation line). The C 1s binding energy (284.8 eV) was utilized as a reference point. The binding energies (BE) and intensities for chemical quantification were determined after subtraction of a Shirley-type background from the photoemission spectra, with XPS Peak 4.1 software utilized for this purpose.
3.3. Photocatalytic Test
Sildenafil citrate was isolated through a liquid-solid extraction method. A quantity of 1000 mg of sildenafil tablets, which had been finely crushed, were placed in a flask and mixed with a solution of methanol and water at a ratio of 1:3. Subsequently, the container was sealed and subjected to constant agitation for a period of one hour. In the subsequent stage of the process, the aqueous solution was separated and isolated in order to facilitate the gradual evaporation of the water and methanol components. This process was continued until the formation of crystalline solids, which were then purified to yield a melting point of approximately 180 °C. This temperature is close to that reported in the technical data sheets for this compound. From these crystals, a 30 mgL-1 solution was prepared as a model contaminant molecule in the photocatalytic evaluation of the catalysts.
The photocatalytic tests were conducted using a solar simulator (Atlas, SUNTEST CPS+, Illinois, USA), which is equipped with an air-cooled 1.5 kW xenon arc lamp with an irradiance range of 250–765 W/m² (300–800 nm). The experiment was conducted in a 300 mL borosilicate batch reactor, which was equipped with a cooling system set at 25 °C to ensure the maintenance of constant temperature. An aqueous solution of sildenafil with a concentration of 30 mgL-1 and 0.5 gL-1 of photocatalyst was introduced into the reactor. This was subjected to constant agitation for a period of 30 minutes in conditions of darkness, with the objective of achieving adsorption-desorption equilibrium. Subsequently, the photocatalytic reactions were initiated by activating the lamp for a duration of 180 minutes, with reaction samples collected at 30 minute intervals. These samples were then treated with a Millipore Nylon filter (MillexR-GN, 25 mm, Millipore Nylon, Cork, Ireland) with a pore size of 0.2 µm. Sildenafil degradation was determined using UV-Vis spectrophotometer (Shimadzu, UV-1700, Kyoto, Japan) following the reduction of the maximum absorbance band for sildenafil (292 nm). The rate constants associated with each catalyst were established using a pseudo-order 1 kinetic model. The percentage of mineralization was obtained from data generated by a total organic carbon analyzer (Shimadzu, TOC-LCSH/CPH, Kyoto, Japan) with an experimental error of ± 0.05 mg/L. In the context of both photocatalytic tests, the experiments were conducted in triplicate to ensure the reliability of the results.
The catalysts that demonstrated the greatest activity in terms of degradation and mineralization at the two distinct temperatures were selected for four consecutive reuse tests. The objective of this study was to analyze the stability of these materials in the reaction. This was complemented by an XRD analysis to verify structural changes before and after the reuse cycles. In order to define the photogenerated reactive species that dominate the photocatalytic reaction, the rate constant was determined using scavengers at a concentration of 10 mgL-1, with the aim of establishing a schematic proposal describing the mechanism of photocatalytic oxidation of sildenafil using the best catalyst proposed in this work. This test was also conducted three times.
4. Conclusions
Utilizing the sol-gel method, photocatalysts comprising TiO₂, ZrO₂ and WO₃ were synthesized and found to be active under sunlight. These photocatalysts were then employed in the photocatalytic oxidation of sildenafil. The optimal amount of 1% WO3 was identified as the key factor in enhancing the photocatalytic activity of the TiO2-ZrO2 composite, irrespective of the heat treatment temperature (500 or 800 °C). At 500 °C, WO3 increased the crystallinity of the anatase phase, while at 800 °C, low doses inhibited the transformation of the anatase phase to rutile, and high doses favoured the formation of the rutile and brookite phases and caused the anatase phase to disappear. In relation to textural properties, the presence of WO3 at 500 °C has been demonstrated to affect a readjustment of the geometry of open or partially blocked mesopores to a pore geometry analogous to that of an ink bottle. The specific area has been observed to decrease in inverse proportion to the increase in WO3 content when the photocatalysts are calcined at 800 °C. The morphology of the materials subjected to 500 °C treatment manifests as spherical aggregates; however, as the temperature is elevated, these aggregates transition to a polycrystalline configuration. The TZW1500 and TZW1800 photocatalysts demonstrated the lowest capacity for recombining photogenerated e-/h+ pairs in relation to their treatment temperature. XPS at 500 °C was utilized to ascertain the oxidation states Ti4+, Zr4+ and W6+ in the catalysts. However, as the temperature is increased, the oxidation states remain constant, with the appearance of Ti3+ and W5+ ions. The former disappears as the amount of WO3 increases, and the latter increases. The enhanced efficiency of the TZW1500 photocatalyst in terms of degradation and mineralization can be attributed primarily to the reduced average particle size of the anatase crystalline phase. The effectiveness of the TZW1800 photocatalyst is based on a synergy between the anatase, rutile and orthorhombic crystalline phases of TiO2 and ZrTiO4, accompanied by oxygen vacancies generated by the presence of the Ti3+ ion. The two materials primarily generate hydroxyl radicals and holes, which are the species that most significantly contribute to the reaction mechanism for the oxidation of sildenafil, which possibly obeys a type II heterojunction considering an alignment between the energy bands of TiO2, ZrO2 and WO3. It is evident that these photocatalysts exhibit notable stability following numerous reuse cycles, thus indicating their potential for implementation in continuous systems and industrial-scale photocatalytic wastewater treatment applications.
Author Contributions
Conceptualization, J.C.A.P. and J.G.T.T.; formal analysis, J.H.S., J.C.E., A.C.G., A.C.U., A.A.S.P., I.V.R. and J.C.A.P.; investigation, J.H.S. and J.C.E.; methodology, J.C.A.P., J.G.T.T. and G.E.C.P.; project administration, J.C.A.P., Z.G.Q. and J.G.T.T.; resources, J.C.A.P., J.G.T.T., I.V.R., A.C.G., A.C.U. and A.A.S.P.; software, A.A.S.P. and G.E.C.P.; supervision, J.C.A.P. and J.G.T.T.; validation, J.H.S., J.C.E., A.C.G., A.C.U., A.A.S.P., G.E.C.P. and J.C.A.P.; visualization, J.H.S., J.C.E., J.C.A.P. and J.G.T.T.; writing—original draft, J.C.A.P. and J.G.T.T.; writing—review and editing, J.C.A.P., J.G.T.T. and Z.G.Q.
Funding
This research received no external funding.
Data Availability Statement
Data are contained within the article.
Acknowledgments
We would like to express our gratitude to the National Council for Humanities, Sciences and Technologies for the master’s scholarship awarded to student Jhatziry Hernández Sierra during the development of this research. We would also like to thank Dr. Rosendo Lopez Gonzales and Dr. Mayra Alvarez Lemus of the Nanotechnology Laboratory, Academic Division of Engineering and Architecture, Juarez Autonomous University of Tabasco for their assistance with the TGA-DSC analysis. The same goes to Dr. David Salvador Garcia Zaleta for his collaboration in the XRD analysis and UV-Vis. spectroscopy of solids.
Conflicts of Interest
The authors declare no conflicts of interest.
References
- Vinayagam, V.; Shrima, M.; Kumaresan, R.; Narayanan, M.; Sillanpää, M.; Viet N Vo, D.; Kushwaha, O.S.; Jenis, P.; Potdar, P.; Gadiya, S. Sustainable Adsorbents for the Removal of Pharmaceuticals from Wastewater: A Review. Chemosphere 2022, 300, 134597. [Google Scholar] [CrossRef]
- Küster, A.; Adler, N. Pharmaceuticals in the Environment: Scientific Evidence of Risks and Its Regulation. Philos. Trans. R. Soc. B Biol. Sci. 2014, 369, 20130587. [Google Scholar] [CrossRef] [PubMed]
- Shao, X.-T.; Zhang, P.-Y.; Liu, S.-Y.; Lin, J.-G.; Tan, D.-Q.; Wang, D.-G. Assessment of Correlations between Sildenafil Use and Comorbidities and Lifestyle Factors Using Wastewater-Based Epidemiology. Water Res. 2022, 218, 118446. [Google Scholar] [CrossRef]
- Herbert, L.P.; Becker-Krail, D.B.; Cory, W.C. Persistent Phototransformation Products of Vardenafil (Levitra®) and Sildenafil (Viagra®). Chemosphere 2015, 134, 557–562. [Google Scholar] [CrossRef]
- Causanilles, A.; Rojas Cantillano, D.; Emke, E.; Bade, R.; Baz-Lomba, J.A.; Castiglioni, S.; Castrignanò, E.; Gracia-Lor, E.; Hernández, F.; Kasprzyk-Hordern, B.; et al. Comparison of Phosphodiesterase Type V Inhibitors Use in Eight European Cities through Analysis of Urban Wastewater. Environ. Int. 2018, 115, 279–284. [Google Scholar] [CrossRef]
- Eichhorn, P.; Pérez, S.; Aceña, J.; Gardinali, P.; Abad, J.L.; Barceló, D. Identification of Phototransformation Products of Sildenafil (Viagra) and Its N-demethylated Human Metabolite under Simulated Sunlight. J. Mass Spectrom. 2012, 47, 701–711. [Google Scholar] [CrossRef]
- Abrile, M.G.; Ciucio, M.M.; Demarchi, L.M.; Bono, V.M.; Fiasconaro, M.L.; Lovato, M.E. Degradation and Mineralization of the Emerging Pharmaceutical Pollutant Sildenafil by Ozone and UV Radiation Using Response Surface Methodology. Environ. Sci. Pollut. Res. 2021, 28, 23868–23886. [Google Scholar] [CrossRef]
- Jia, Z.; Zeng, Q.; Zhang, X.; Feng, W. Enhanced Ultrasound-Assisted Pore-Adjustable Spherical Imma-Fe3O4 Catalytic-Activated Piezoelectric Fenton Reaction for PDE-5i Degradation. J. Environ. Chem. Eng. 2023, 11, 109419. [Google Scholar] [CrossRef]
- Zeng, Q.; Jia, Z.; Liu, X.; Cheng, J. A Novel 1T-2H MoS2/NaBi(MoO4)2 Alternating-Phase Piezoelectric Composites for High-Efficient Ultrasound-Drived Piezoelectric Catalytic Removal of Sildenafil. Process Saf. Environ. Prot. 2023, 179, 314–328. [Google Scholar] [CrossRef]
- Zizzamia, A.R.; Tesoro, C.; Bianco, G.; Bufo, S.A.; Ciriello, R.; Brienza, M.; Scrano, L.; Lelario, F. Efficient Photooxidation Processes for the Removal of Sildenafil from Aqueous Environments: A Comparative Study. Case Stud. Chem. Environ. Eng. 2024, 9, 100708. [Google Scholar] [CrossRef]
- Hashimoto, K.; Irie, H.; Fujishima, A. TiO2 Photocatalysis: A Historical Overview and Future Prospects. Jpn. J. Appl. Phys. 2005, 44, 8269. [Google Scholar] [CrossRef]
- Kitiyanan, A.; Ngamsinlapasathian, S.; Pavasupree, S.; Yoshikawa, S. The Preparation and Characterization of Nanostructured TiO2–ZrO2 Mixed Oxide Electrode for Efficient Dye-Sensitized Solar Cells. J. Solid State Chem. 2005, 178, 1044–1048. [Google Scholar] [CrossRef]
- Zare, M.H.; Mehrabani-Zeinabad, A. Photocatalytic Activity of ZrO2/TiO2/Fe3O4 Ternary Nanocomposite for the Degradation of Naproxen: Characterization and Optimization Using Response Surface Methodology. Sci. Rep. 2022, 12, 10388. [Google Scholar] [CrossRef]
- Li, M.; Zhang, S.; Lv, L.; Wang, M.; Zhang, W.; Pan, B. A Thermally Stable Mesoporous ZrO2–CeO2–TiO2 Visible Light Photocatalyst. Chem. Eng. J. 2013, 229, 118–125. [Google Scholar] [CrossRef]
- Zhang, Y.; Liu, D.-L.; Xiong, B.-Y.; Li, J.-L.; Li, Y.-T.; Zhou, Y.-L.; Yang, A.-S.; Zhang, Q.-P. Constructing WO3/TiO2 Heterojunction with Solvothermal-Sintering for Enhanced Photocatalytic Activity under Visible Light Irradiation. Solid State Sci. 2022, 131, 106963. [Google Scholar] [CrossRef]
- Cai, Z.; Hao, X.; Sun, X.; Du, P.; Liu, W.; Fu, J. Highly Active WO3@anatase-SiO2 Aerogel for Solar-Light-Driven Phenanthrene Degradation: Mechanism Insight and Toxicity Assessment. Water Res. 2019, 162, 369–382. [Google Scholar] [CrossRef]
- Navio, J.A.; Colón, G.; Herrmann, J.M. Photoconductive and Photocatalytic Properties of ZrTiO4. Comparison with the Parent Oxides TiO2 and ZrO2. J. Photochem. Photobiol. Chem. 1997, 108, 179–185. [Google Scholar] [CrossRef]
- Ning, Q.; Zhang, L.; Liu, C.; Li, X.; Xu, C.; Hou, X. Boosting Photogenerated Carriers for Organic Pollutant Degradation via In-Situ Constructing Atom-to-Atom TiO2/ZrTiO4 Heterointerface. Ceramics International 2021, 47, 33298–33308. [Google Scholar] [CrossRef]
- Fazaeli, R.; Aliyan, H.; Nezamzadeh-Ejhieh, A.; Richeson, D. Investigation of the Synergistic Photocatalytic Activity of a Ternary ZrTiO4/TiO2/Mn3O4 (ZTM) Nanocomposite in a Typical Water Treatment Process. Surfaces and Interfaces 2024, 52, 104877. [Google Scholar] [CrossRef]
- Dhachanamoorthi, N.; Oviya, K.; Sugumaran, S.; Suresh, P.; Parthibavarman, M.; Jeshaa Dharshini, K.; Aishwarya, M. Effective Move of Polypyrrole/TiO2 Hybrid Nanocomposites on Removal of Methylene Blue Dye by Photocatalytic Activity. Chem. Phys. Impact 2024, 9, 100723. [Google Scholar] [CrossRef]
- Reddy, B.M.; Khan, A. Recent Advances on TiO2 -ZrO2 Mixed Oxides as Catalysts and Catalyst Supports. Catal. Rev. 2005, 47, 257–296. [Google Scholar] [CrossRef]
- Limón-Rocha, I.; Marizcal-Barba, A.; Guzmán-González, C.A.; Anaya-Esparza, L.M.; Ghotekar, S.; González-Vargas, O.A.; Pérez-Larios, A. Co, Cu, Fe, and Ni Deposited over TiO2 and Their Photocatalytic Activity in the Degradation of 2,4-Dichlorophenol and 2,4-Dichlorophenoxyacetic Acid. inorganics 2022, 10, 157. [Google Scholar] [CrossRef]
- Veerachamy, S.; Rajagopal, S. Microstructural Analysis of Terbium Doped Zirconia and Its Biological Studies. Condens. Matter 2022, 7, 20. [Google Scholar] [CrossRef]
- Manrı́quez, M.E.; López, T.; Gómez, R.; Navarrete, J. Preparation of TiO2–ZrO2 Mixed Oxides with Controlled Acid–Basic Properties. J. Mol. Catal. Chem. 2004, 220, 229–237. [Google Scholar] [CrossRef]
- Silahua-Pavón, A.A.; Espinosa-González, C.G.; Ortiz-Chi, F.; Pacheco-Sosa, J.G.; Pérez-Vidal, H.; Arévalo-Pérez, J.C.; Godavarthi, S.; Torres-Torres, J.G. Production of 5-HMF from Glucose Using TiO2-ZrO2 Catalysts: Effect of the Sol-Gel Synthesis Additive. Catal. Commun. 2019, 129, 105723. [Google Scholar] [CrossRef]
- Mayoufi, A.; Faouzi Nsib, M.; Houas, A. Doping Level Effect on Visible-Light Irradiation W-Doped TiO2–Anatase Photocatalysts for Congo Red Photodegradation. Comptes Rendus Chim. 2014, 17, 818–823. [Google Scholar] [CrossRef]
- Kim, D.-S.; Yang, J.-H.; Balaji, S.; Cho, H.-J.; Kim, M.-K.; Kang, D.-U.; Djaoued, Y.; Kwon, Y.-U. Hydrothermal Synthesis of Anatase Nanocrystals with Lattice and Surface Doping Tungsten Species. CrystEngComm 2009, 11, 1621. [Google Scholar] [CrossRef]
- De La Cruz, D.; Arévalo, J.C.; Torres, G.; Margulis, R.G.B.; Ornelas, C.; Aguilar-Elguézabal, A. TiO2 Doped with Sm3+ by Sol–Gel: Synthesis, Characterization and Photocatalytic Activity of Diuron under Solar Light. Catal. Today 2011, 166, 152–158. [Google Scholar] [CrossRef]
- George, A.; Solomon, S.; Thomas, J.K.; John, A. Characterizations and Electrical Properties of ZrTiO4 Ceramic. Mater. Res. Bull. 2012, 47, 3141–3147. [Google Scholar] [CrossRef]
- Arévalo-Pérez, J.C.; Cruz-Romero, D.D.L.; Cordero-García, A.; Lobato-García, C.E.; Aguilar-Elguezabal, A.; Torres-Torres, J.G. Photodegradation of 17 α-Methyltestosterone Using TiO2 -Gd3+ and TiO2-Sm3+ Photocatalysts and Simulated Solar Radiation as an Activation Source. Chemosphere 2020, 249, 126497. [Google Scholar] [CrossRef] [PubMed]
- Palliyaguru, L.; Kulathunga, U.S.; Jayarathna, L.I.; Jayaweera, C.D.; Jayaweera, P.M. A Simple and Novel Synthetic Route to Prepare Anatase TiO2 Nanopowders from Natural Ilmenite via the H3PO4/NH3 Process. Int. J. Miner. Metall. Mater. 2020, 27, 846–855. [Google Scholar] [CrossRef]
- Zhang, J.; Yang, Q.; Matsushita, T.; Sun, S.; Tatsuoka, H. Growth of Brookite TiO2 Nanorods by Thermal Oxidation of Ti Metal in Air. J. Mater. Sci. Mater. Electron. 2024, 35, 1520. [Google Scholar] [CrossRef]
- Badli, N.A.; Ali, R.; Wan Abu Bakar, W.A.; Yuliati, L. Role of Heterojunction ZrTiO4/ZrTi2O6/TiO2 Photocatalyst towards the Degradation of Paraquat Dichloride and Optimization Study by Box–Behnken Design. Arab. J. Chem. 2017, 10, 935–943. [Google Scholar] [CrossRef]
- Thommes, M.; Kaneko, K.; Neimark, A.V.; Olivier, J.P.; Rodriguez-Reinoso, F.; Rouquerol, J.; Sing, K.S.W. Physisorption of Gases, with Special Reference to the Evaluation of Surface Area and Pore Size Distribution (IUPAC Technical Report). Pure Appl. Chem. 2015, 87, 1051–1069. [Google Scholar] [CrossRef]
- He, F.; Chen, G.; Yu, Y.; Hao, S.; Zhou, Y.; Zheng, Y. Facile Approach to Synthesize G-PAN/g-C3N4 Composites with Enhanced Photocatalytic H2 Evolution Activity. ACS Appl. Mater. Interfaces 2014, 6, 7171–7179. [Google Scholar] [CrossRef]
- Wang, H.; He, W.; Dong, X.; Jiang, G.; Zhang, Y.; Sun, Y.; Dong, F. In Situ DRIFT Investigation on the Photocatalytic NO Oxidation Mechanism with Thermally Exfoliated Porous G-C3 N4 Nanosheets. RSC Adv. 2017, 7, 19280–19287. [Google Scholar] [CrossRef]
- Zhang, W.; Zhu, Y.; Xu, H.; Gaborieau, M.; Huang, J.; Jiang, Y. Glucose Conversion to 5-Hydroxymethylfurfural on Zirconia: Tuning Surface Sites by Calcination Temperatures. SISydney Catal Symp. 2020, 351, 133–140. [Google Scholar] [CrossRef]
- Ahmadi, M.; Alavi, S.M.; Larimi, A. UV–Vis Light Responsive Bi2WO6 Nanosheet/TiO2 Nanobelt Heterojunction Photo-Catalyst for CO2 Reduction. Catal. Commun. 2023, 179, 106681. [Google Scholar] [CrossRef]
- Shen, H.; Ie, I.-R.; Yuan, C.-S.; Hung, C.-H.; Chen, W.-H. Removal of Elemental Mercury by TiO2 doped with WO3 and V2O5 for Their Photo- and Thermo-Catalytic Removal Mechanisms. Environ. Sci. Pollut. Res. 2016, 23, 5839–5852. [Google Scholar] [CrossRef]
- Tian, J.; Shao, Q.; Zhao, J.; Pan, D.; Dong, M.; Jia, C.; Ding, T.; Wu, T.; Guo, Z. Microwave Solvothermal Carboxymethyl Chitosan Templated Synthesis of TiO2/ZrO2 Composites toward Enhanced Photocatalytic Degradation of Rhodamine B. J. Colloid Interface Sci. 2019, 541, 18–29. [Google Scholar] [CrossRef]
- Gutiérrez-Alejandre, A.; Ramírez, J.; Val, I.J.; Peñuelas-Galaz, M.; Sánchez-Neri, P.; Torres-Mancera, P. Activity of NiW Catalysts Supported on TiO2-Al2O3 Mixed Oxides: Effect of Ti Incorporation Method on the HDS of 4,6-DMDBT. Sel. Contrib. XIX Ibero Am. Catal. Symp. 2005, 107–108, 879–884. [Google Scholar] [CrossRef]
- Gerosa, M.; Bottani, C.E.; Caramella, L.; Onida, G.; Di Valentin, C.; Pacchioni, G. Defect Calculations in Semiconductors through a Dielectric-Dependent Hybrid DFT Functional: The Case of Oxygen Vacancies in Metal Oxides. J. Chem. Phys. 2015, 143. [Google Scholar] [CrossRef] [PubMed]
- Giuffrida, F.; Calcagno, L.; Pezzotti Escobar, G.; Zimbone, M. Photocatalytic Efficiency of TiO2/Fe2O3 and TiO2/WO3 Nanocomposites. Crystals 2023, 13, 372. [Google Scholar] [CrossRef]
- Choi, H.; Kang, M. Hydrogen Production from Methanol/Water Decomposition in a Liquid Photosystem Using the Anatase Structure of Cu Loaded TiO2. Int. J. Hydrog. Energy 2007, 32, 3841–3848. [Google Scholar] [CrossRef]
- Oanh, L.M.; Do, D.B.; Hung, N.M.; Thang, D.V.; Phuong, D.T.; Ha, D.T.; Van Minh, N. Formation of Crystal Structure of Zirconium Titanate ZrTiO4 Powders Prepared by Sol–Gel Method. J. Electron. Mater. 2016, 45, 2553–2558. [Google Scholar] [CrossRef]
- Guerrero-Araque, D.; Ramírez-Ortega, D.; Acevedo-Peña, P.; Zanella, R.; Gómez, R. Photocatalytic Degradation of 2,4-Dichlorophenol on ZrO2–TiO2: Influence of Crystal Size, Surface Area, and Energetic States. J. Mater. Sci. Mater. Electron. 2020, 31, 3332–3341. [Google Scholar] [CrossRef]
- Saraswati, T.E.; Nandika, A.O.; Andhika, I.F.; Patiha; Purnawan, C.; Wahyuningsih, S.; Rahardjo, S.B. Fabrication of TiO2 /Carbon Photocatalyst Using Submerged DC Arc Discharged in Ethanol/Acetic Acid Medium. IOP Conf. Ser. Mater. Sci. Eng. 2017, 202, 012058. [Google Scholar] [CrossRef]
- Kambur, A.; Pozan, G.S.; Boz, I. Preparation, Characterization and Photocatalytic Activity of TiO2–ZrO2 Binary Oxide Nanoparticles. Appl. Catal. B Environ. 2012, 115–116, 149–158. [Google Scholar] [CrossRef]
- Singupilla, S.S.; Tirukkovalluri, S.R.; Gorli, D.; Nayak, S.R.; Raffiunnisa; Jikamo, S.C.; Kadiyala, N.R.; Genji, J. Aloe Vera Gel-Mediated Sol-Gel Synthesis of Ce-Ni Co-Doped TiO2 Nanomaterials for Efficient Visible-Light-Driven Binary Dye Degradation and Antimicrobial Applications. J. Sol-Gel Sci. Technol. 2025, 115, 509–535. [Google Scholar] [CrossRef]
- Nabi, G.; Raza, W.; Tahir, M.B. Green Synthesis of TiO2 Nanoparticle Using Cinnamon Powder Extract and the Study of Optical Properties. J. Inorg. Organomet. Polym. Mater. 2020, 30, 1425–1429. [Google Scholar] [CrossRef]
- Lim, S.P.; Pandikumar, A.; Lim, H.N.; Ramaraj, R.; Huang, N.M. Boosting Photovoltaic Performance of Dye-Sensitized Solar Cells Using Silver Nanoparticle-Decorated N,S-Co-Doped-TiO2 Photoanode. Sci. Rep. 2015, 5, 11922. [Google Scholar] [CrossRef]
- Rebeca Sofiya Joice, M.; Dev, P.R.; Iyyappan, E.; Manovah David, T.; Thangavel, N.; Neppolian, B.; Wilson, P. Construction of Novel Step-Scheme TiO2-WO3 Nanostructured Heterojunction towards Morphology-Driven Enhancement of Photocatalytic Hydrogen Evolution. JCIS Open 2025, 18, 100136. [Google Scholar] [CrossRef]
- Aldirham, S.H.; Helal, A.; Shkir, M.; Sayed, M.A.; Ali, A.M. Enhancement Study of the Photoactivity of TiO2 Photocatalysts during the Increase of the WO3 Ratio in the Presence of Ag Metal. Catalysts 2024, 14, 633. [Google Scholar] [CrossRef]
- Lee, W.; Lai, C.; Hamid, S. One-Step Formation of WO3-Loaded TiO2 Nanotubes Composite Film for High Photocatalytic Performance. Materials 2015, 8, 2139–2153. [Google Scholar] [CrossRef]
- Gu, A.; Pan, G.-H.; Wu, H.; Zhang, L.; Zhang, L.; Wu, H.; Zhang, J. Microstructure and Photoluminescence of ZrTiO4:Eu3+ Phosphors: Host-Sensitized Energy Transfer and Optical Thermometry. Chemosensors 2022, 10, 527. [Google Scholar] [CrossRef]
- Wang, B.B.; Zhong, X.X.; Zhu, J.; Wang, Y.; Zhang, Y.; Cvelbar, U.; Ostrikov, K. Single-Step Synthesis of TiO2/WO3−x Hybrid Nanomaterials in Ethanoic Acid: Structure and Photoluminescence Properties. Appl. Surf. Sci. 2021, 562, 150180. [Google Scholar] [CrossRef]
- Pérez, T.A.T.; Gerónimo, E.S.; Torres, J.G.T.; Del Angel Montes, G.A.; Vázquez, I.R.; García, A.C.; Uribe, A.C.; Pavon, A.A.S.; Pérez, J.C.A. Photocatalytic Oxidation of Pesticides with TiO2-CeO2 Thin Films Using Sunlight. Catalysts 2025, 15, 46. [Google Scholar] [CrossRef]
- Yang, Y.; Zhang, Y.; Gao, X.; Yang, Z.; Wang, H.; Zhang, X. Performance and Mechanism of In Situ Prepared NF@CoMnNi-LDH Composites to Activate PMS for Degradation of Enrofloxacin in Water. Water 2024, 17, 24. [Google Scholar] [CrossRef]
- Zhu, L.; Lu, Q.; Lv, L.; Wang, Y.; Hu, Y.; Deng, Z.; Lou, Z.; Hou, Y.; Teng, F. Ligand-Free Rutile and Anatase TiO2 Nanocrystals as Electron Extraction Layers for High Performance Inverted Polymer Solar Cells. RSC Adv. 2017, 7, 20084–20092. [Google Scholar] [CrossRef]
- Vera-Iturriaga, J.; Hernández-Pichardo, M.L.; Montoya De La Fuente, J.A.; Del Angel, P.; Gomora-Herrera, D.; Palacios-González, E.; Lartundo, L.; Moreno-Ruíz, L.A. Hydroisomerization of N-Hexane over Pt/WOx-ZrO2-TiO2 Catalysts. Catal. Today 2021, 360, 12–19. [Google Scholar] [CrossRef]
- Zhao, T.; Zhao, B.; Niu, Y.; Liang, Y.; Liu, L.; Dong, J.; Tang, M.; Li, X. Hydrogenation of Naphthalene to Decalin Catalyzed by Pt Supported on WO3 of Different Crystallinity at Low Temperature. J. Fuel Chem. Technol. 2021, 49, 1181–1189. [Google Scholar] [CrossRef]
- Xie, W.; Li, R.; Xu, Q. Enhanced Photocatalytic Activity of Se-Doped TiO2 under Visible Light Irradiation. Sci. Rep. 2018, 8, 8752. [Google Scholar] [CrossRef]
- Baithy, M.; Mukherjee, D.; Rangaswamy, A.; Reddy, B.M. Structure–Activity Relationships of WOx-Promoted TiO2–ZrO2 Solid Acid Catalyst for Acetalization and Ketalization of Glycerol towards Biofuel Additives. Catal. Lett. 2022, 152, 1428–1440. [Google Scholar] [CrossRef]
- Gao, L.; Gan, W.; Qiu, Z.; Zhan, X.; Qiang, T.; Li, J. Preparation of Heterostructured WO3/TiO2 Catalysts from Wood Fibers and Its Versatile Photodegradation Abilities. Sci. Rep. 2017, 7, 1102. [Google Scholar] [CrossRef]
- Wang, X.; Patel, R.L.; Liang, X. Significant Improvement in TiO2 Photocatalytic Activity through Controllable ZrO2 Deposition. RSC Adv. 2018, 8, 25829–25834. [Google Scholar] [CrossRef] [PubMed]
- Yanyan, L.; Kurniawan, T.A.; Ying, Z.; Albadarin, A.B.; Walker, G. Enhanced Photocatalytic Degradation of Acetaminophen from Wastewater Using WO3/TiO2/SiO2 Composite under UV–VIS Irradiation. J. Mol. Liq. 2017, 243, 761–770. [Google Scholar] [CrossRef]
- Chau, J.H.F.; Lee, K.M.; Pang, Y.L.; Abdullah, B.; Juan, J.C.; Leo, B.F.; Lai, C.W. Photodegradation Assessment of RB5 Dye by Utilizing WO3/TiO2 Nanocomposite: A Cytotoxicity Study. Environ. Sci. Pollut. Res. 2022, 29, 22372–22390. [Google Scholar] [CrossRef]
- Chau, J.H.F.; Lai, C.W.; Leo, B.F.; Juan, J.C.; Johan, M.R. Advanced Photocatalytic Degradation of Acetaminophen Using Cu2O/WO3/TiO2 Ternary Composite under Solar Irradiation. Catal. Commun. 2022, 163, 106396. [Google Scholar] [CrossRef]
- Vaiano, V.; Sacco, O.; Matarangolo, M. Photocatalytic Degradation of Paracetamol under UV Irradiation Using TiO2-Graphite Composites. Graph. Mater. Photoelectrocatalysis 2018, 315, 230–236. [Google Scholar] [CrossRef]
- Kuang, J.; Xing, Z.; Yin, J.; Li, Z.; Tan, S.; Li, M.; Jiang, J.; Zhu, Q.; Zhou, W. Ti3+ Self-Doped Rutile/Anatase/TiO2(B) Mixed-Crystal Tri-Phase Heterojunctions as Effective Visible-Light-Driven Photocatalysts. Arab. J. Chem. 2020, 13, 2568–2578. [Google Scholar] [CrossRef]
- Córdova-Pérez, G.E.; Cortez-Elizalde, J.; Silahua-Pavón, A.A.; Cervantes-Uribe, A.; Arévalo-Pérez, J.C.; Cordero-Garcia, A.; De Los Monteros, A.E.E.; Espinosa-González, C.G.; Godavarthi, S.; Ortiz-Chi, F.; et al. γ-Valerolactone Production from Levulinic Acid Hydrogenation Using Ni Supported Nanoparticles: Influence of Tungsten Loading and pH of Synthesis. Nanomaterials 2022, 12. [Google Scholar] [CrossRef]
- Boppella, R.; Basak, P.; Manorama, S.V. Viable Method for the Synthesis of Biphasic TiO2 Nanocrystals with Tunable Phase Composition and Enabled Visible-Light Photocatalytic Performance. ACS Appl. Mater. Interfaces 2012, 4, 1239–1246. [Google Scholar] [CrossRef]
- Reguero-Márquez, G.A.; Lunagómez-Rocha, M.A.; Cervantes-Uribe, A.; del Angel, G.; Rangel, I.; Torres-Torres, J.G.; González, F.; Godavarthi, S.; Arevalo-Perez, J.C.; Espinosa de los Monteros, A.E.; et al. Photodegradation of 2,4-D (Dichlorophenoxyacetic Acid) with Rh/TiO2; Comparative Study with Other Noble Metals (Ru, Pt, and Au). RSC Adv 2022, 12, 25711–25721. [Google Scholar] [CrossRef]
- Kumari, V.; Sharma, A.; Kumar, N.; Sillanpää, M.; Makgwane, P.R.; Ahmaruzzaman, Md.; Hosseini-Bandegharaei, A.; Rani, M.; Chinnamuthu, P. TiO2-CeO2 Assisted Heterostructures for Photocatalytic Mitigation of Environmental Pollutants: A Comprehensive Study on Band Gap Engineering and Mechanistic Aspects. Inorg. Chem. Commun. 2023, 151, 110564. [Google Scholar] [CrossRef]
- Ramesh, N.; Lai, C.W.; Johan, M.R.B.; Mousavi, S.M.; Badruddin, I.A.; Kumar, A.; Sharma, G.; Gapsari, F. Progress in Photocatalytic Degradation of Industrial Organic Dye by Utilising the Silver Doped Titanium Dioxide Nanocomposite. Heliyon 2024, 10, e40998. [Google Scholar] [CrossRef] [PubMed]
- Nascimento, F.V.B.; Ferreira, A.P.G.; Alarcon, R.T.; Cavalheiro, É.T.G. Studies on the Thermal Behavior of Sildenafil Citrate. J. Pharm. Biomed. Anal. Open 2024, 3, 100028. [Google Scholar] [CrossRef]
- Kumar Patnaik, R.; Divya, N. A Brief Review on the Synthesis of TiO2 Thin Films and Its Application in Dye Degradation. Adv. Chem. Eng. Sci. ACES 2023, 72, 2749–2756. [Google Scholar] [CrossRef]
Figure 1.
TGA/DSC curves for fresh samples of (a) TZW3 and (b) TZW5.
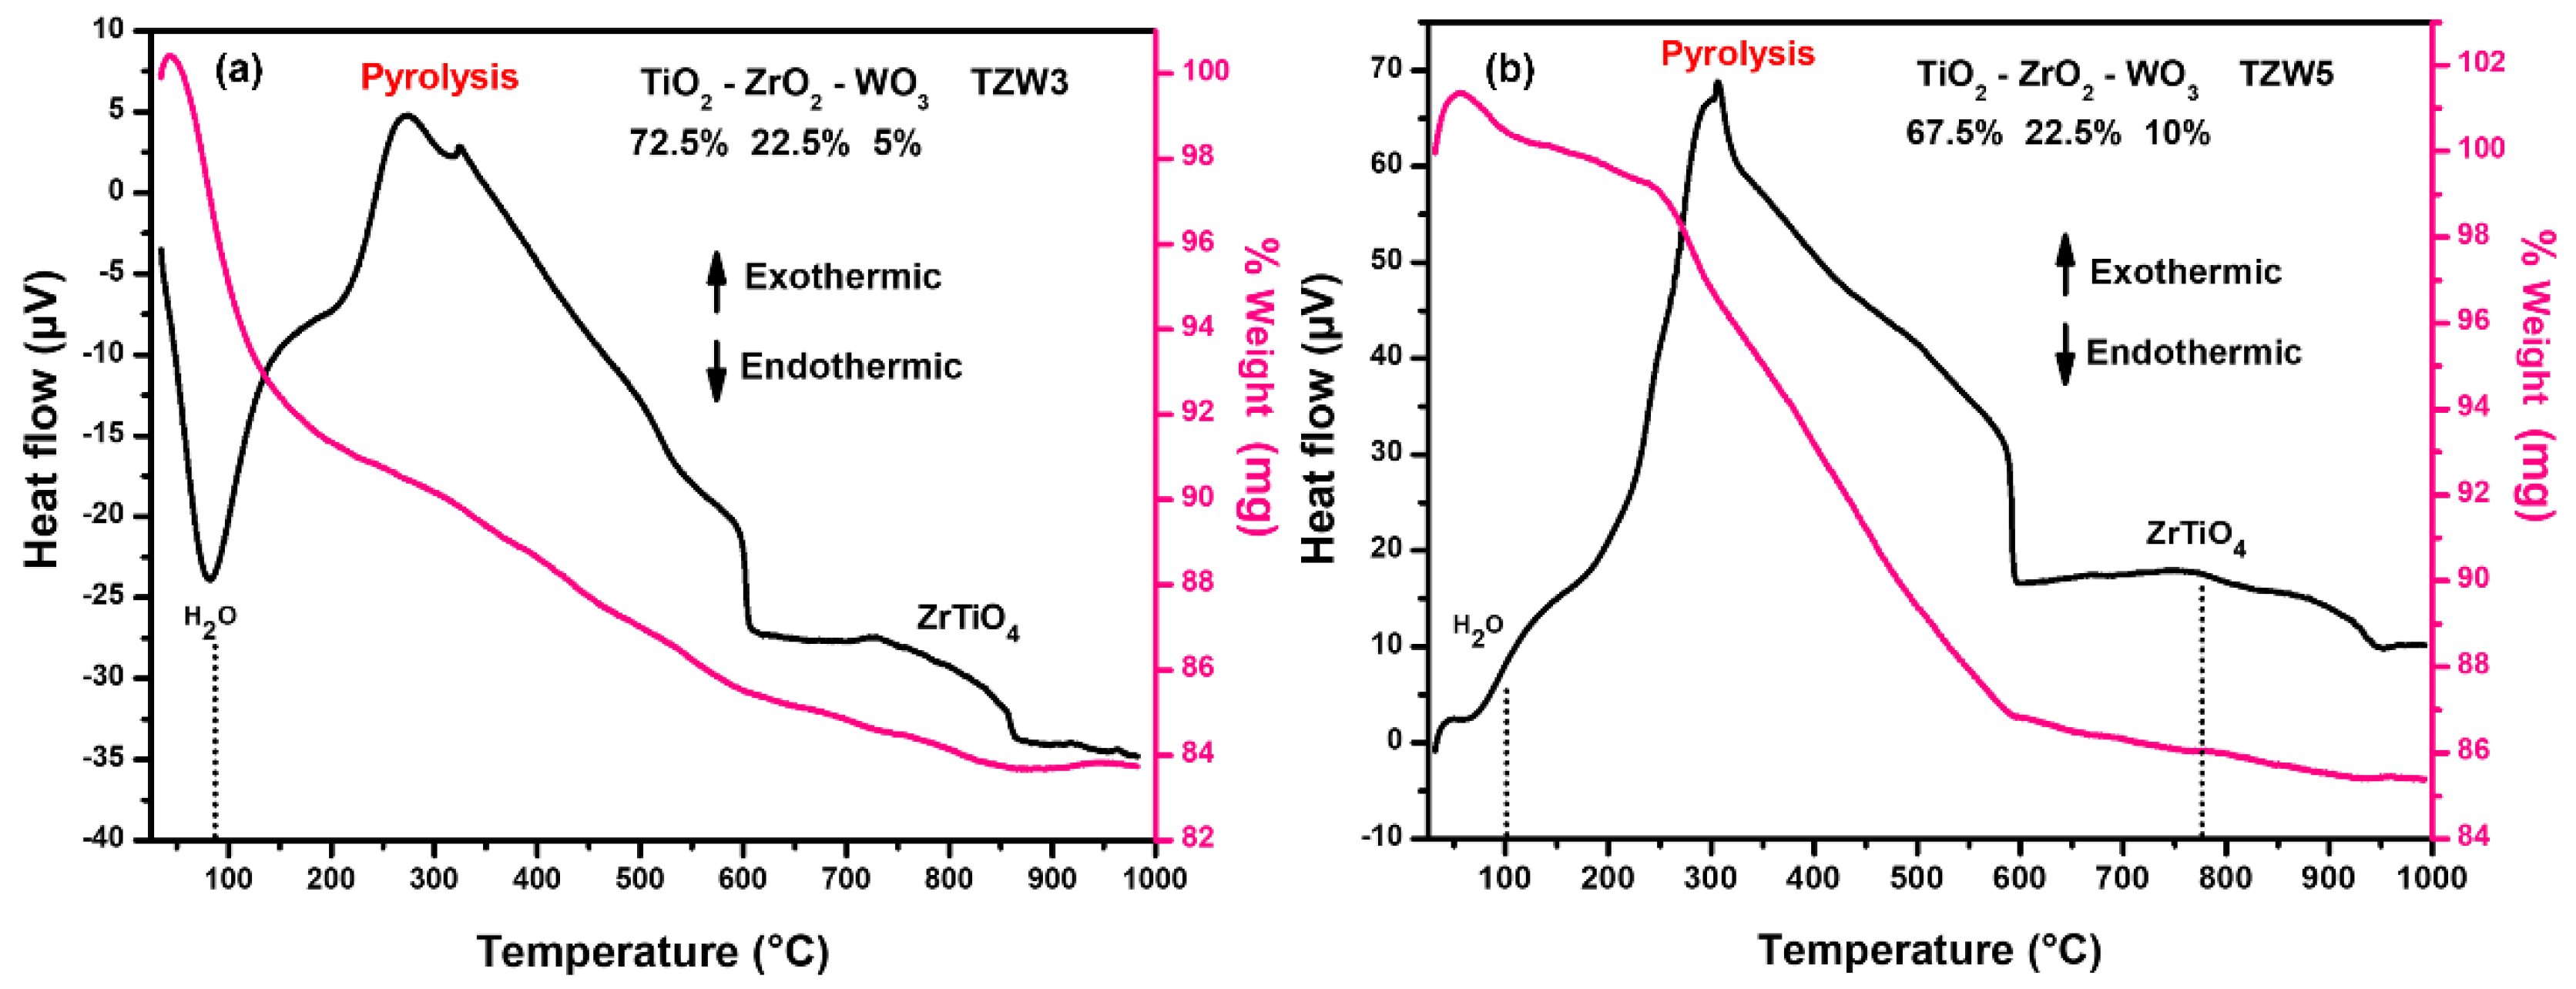
Figure 2.
X-ray diffraction patterns of TiO₂, ZrO₂, TiO₂-ZrO₂, and TiO₂-ZrO₂ with different amounts of WO₃ (heat-treatment temperature = 500 °C).
Figure 2.
X-ray diffraction patterns of TiO₂, ZrO₂, TiO₂-ZrO₂, and TiO₂-ZrO₂ with different amounts of WO₃ (heat-treatment temperature = 500 °C).
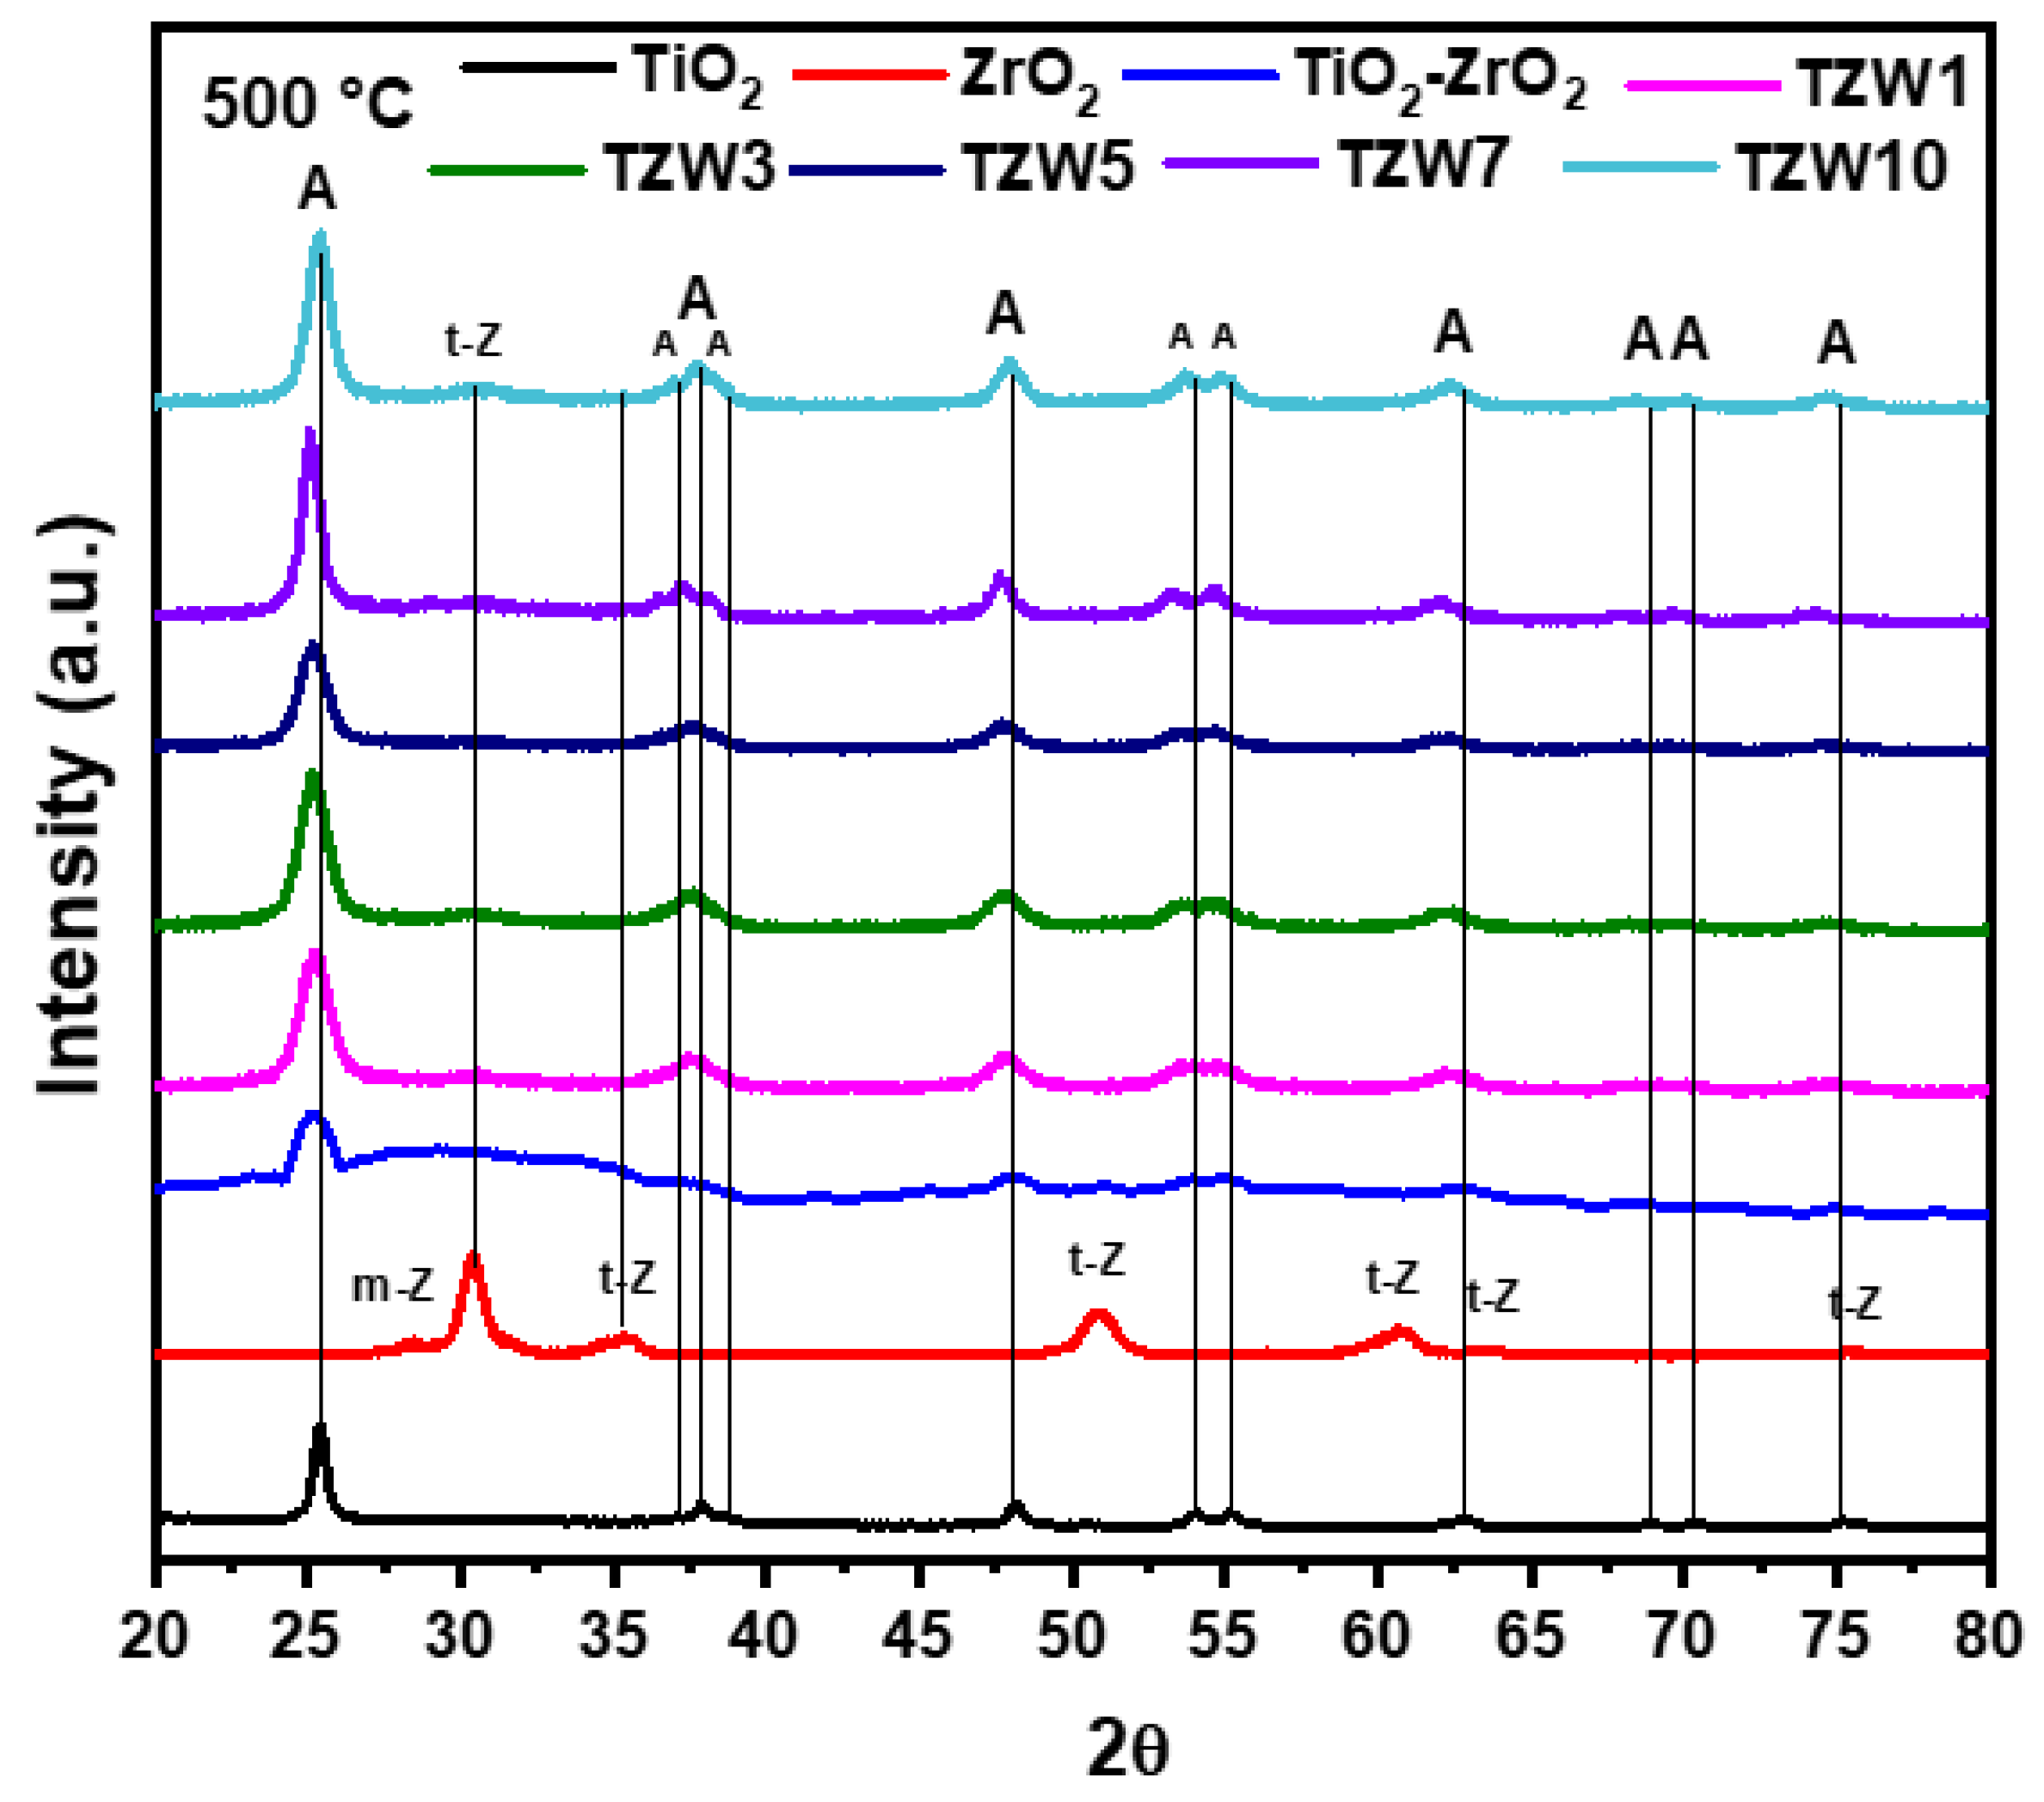
Figure 3.
X-ray diffraction patterns of (a) TiO₂, ZrO₂, TiO₂-ZrO₂, TZW1, TZW3 and, TZW5. (b) TZW 7 and TZW10 (heat-treatment temperature = 800 °C).
Figure 3.
X-ray diffraction patterns of (a) TiO₂, ZrO₂, TiO₂-ZrO₂, TZW1, TZW3 and, TZW5. (b) TZW 7 and TZW10 (heat-treatment temperature = 800 °C).
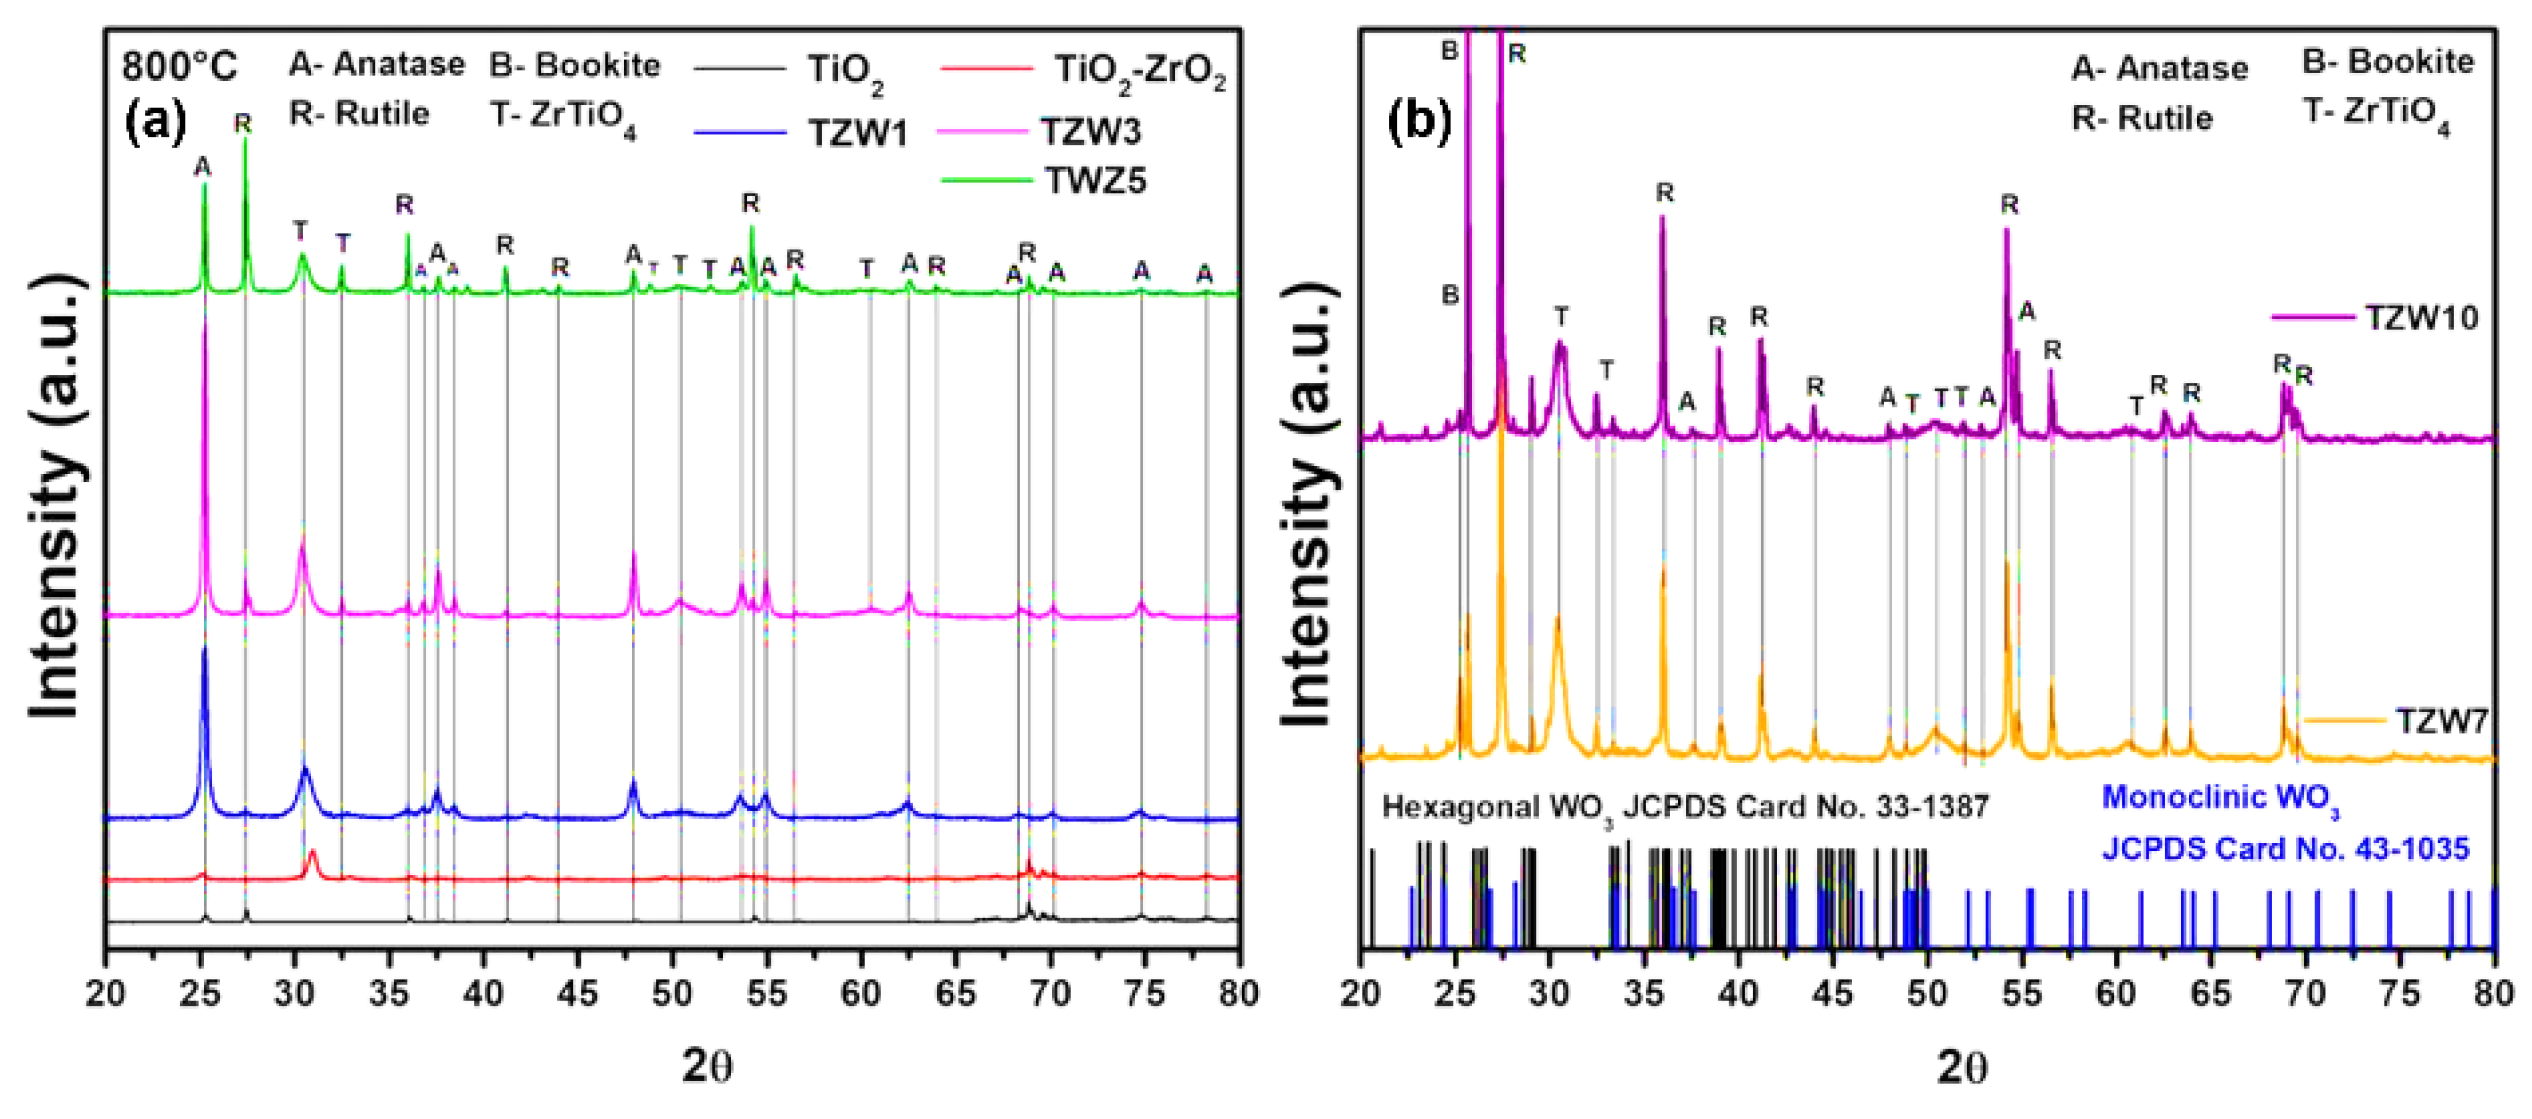
Figure 4.
N2 adsorption-desorption isotherms for materials prepared at 500 (a) and 800 °C (b).
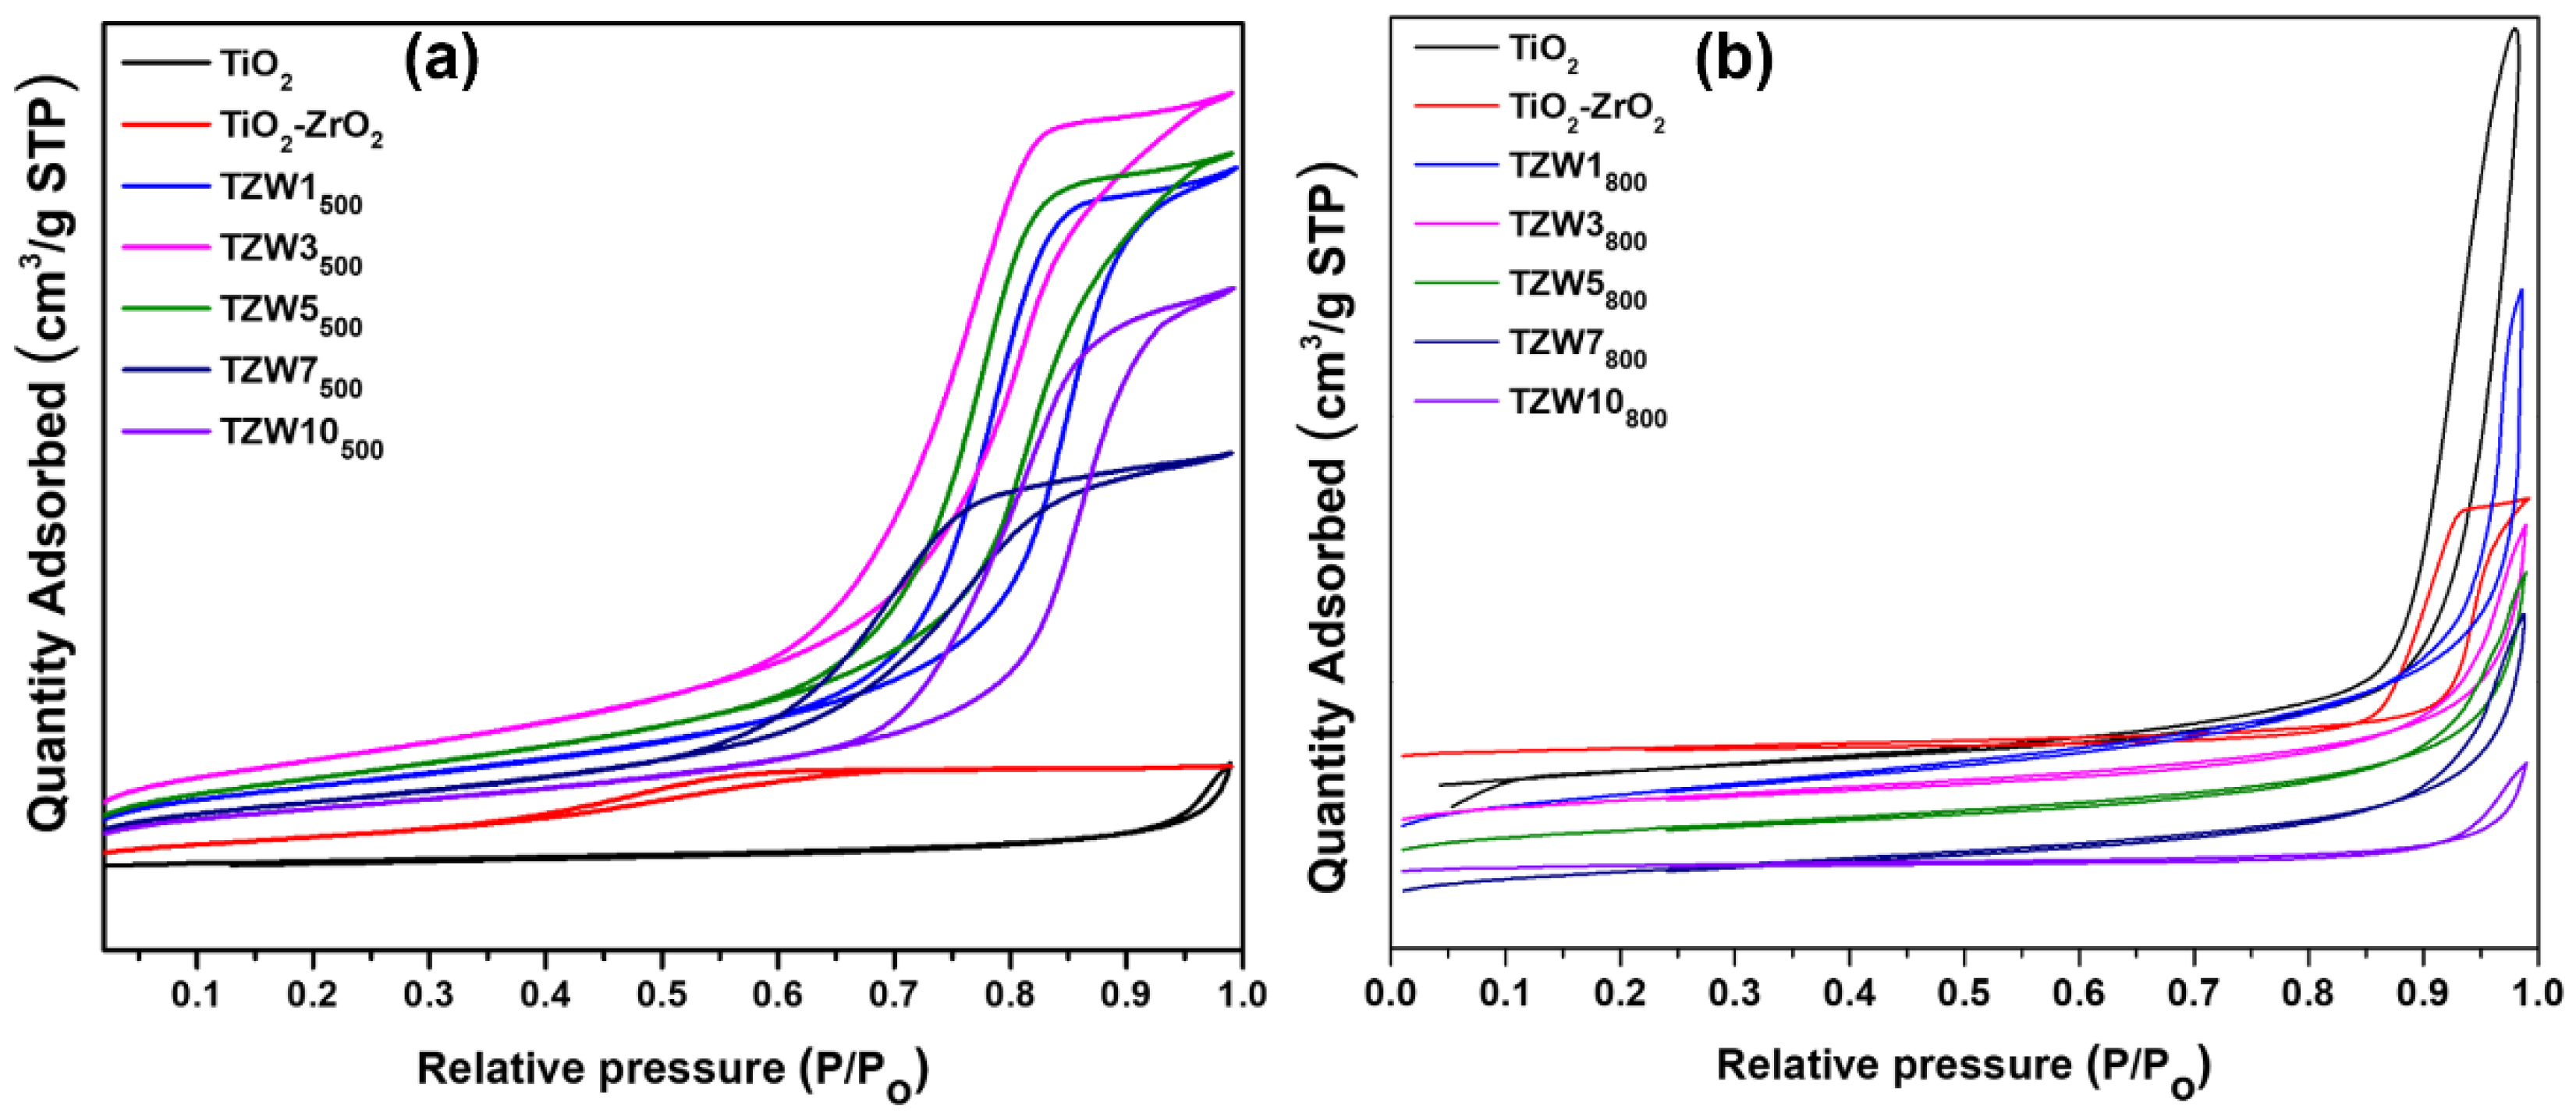
Figure 5.
Diffuse reflectance UV-Vis spectroscopy (DRS) patterns of catalysts treated at 500 and 800 °C, respectively (a,c). Tauc’s plots of catalysts treated at 500 and 800 °C (b,d).
Figure 5.
Diffuse reflectance UV-Vis spectroscopy (DRS) patterns of catalysts treated at 500 and 800 °C, respectively (a,c). Tauc’s plots of catalysts treated at 500 and 800 °C (b,d).
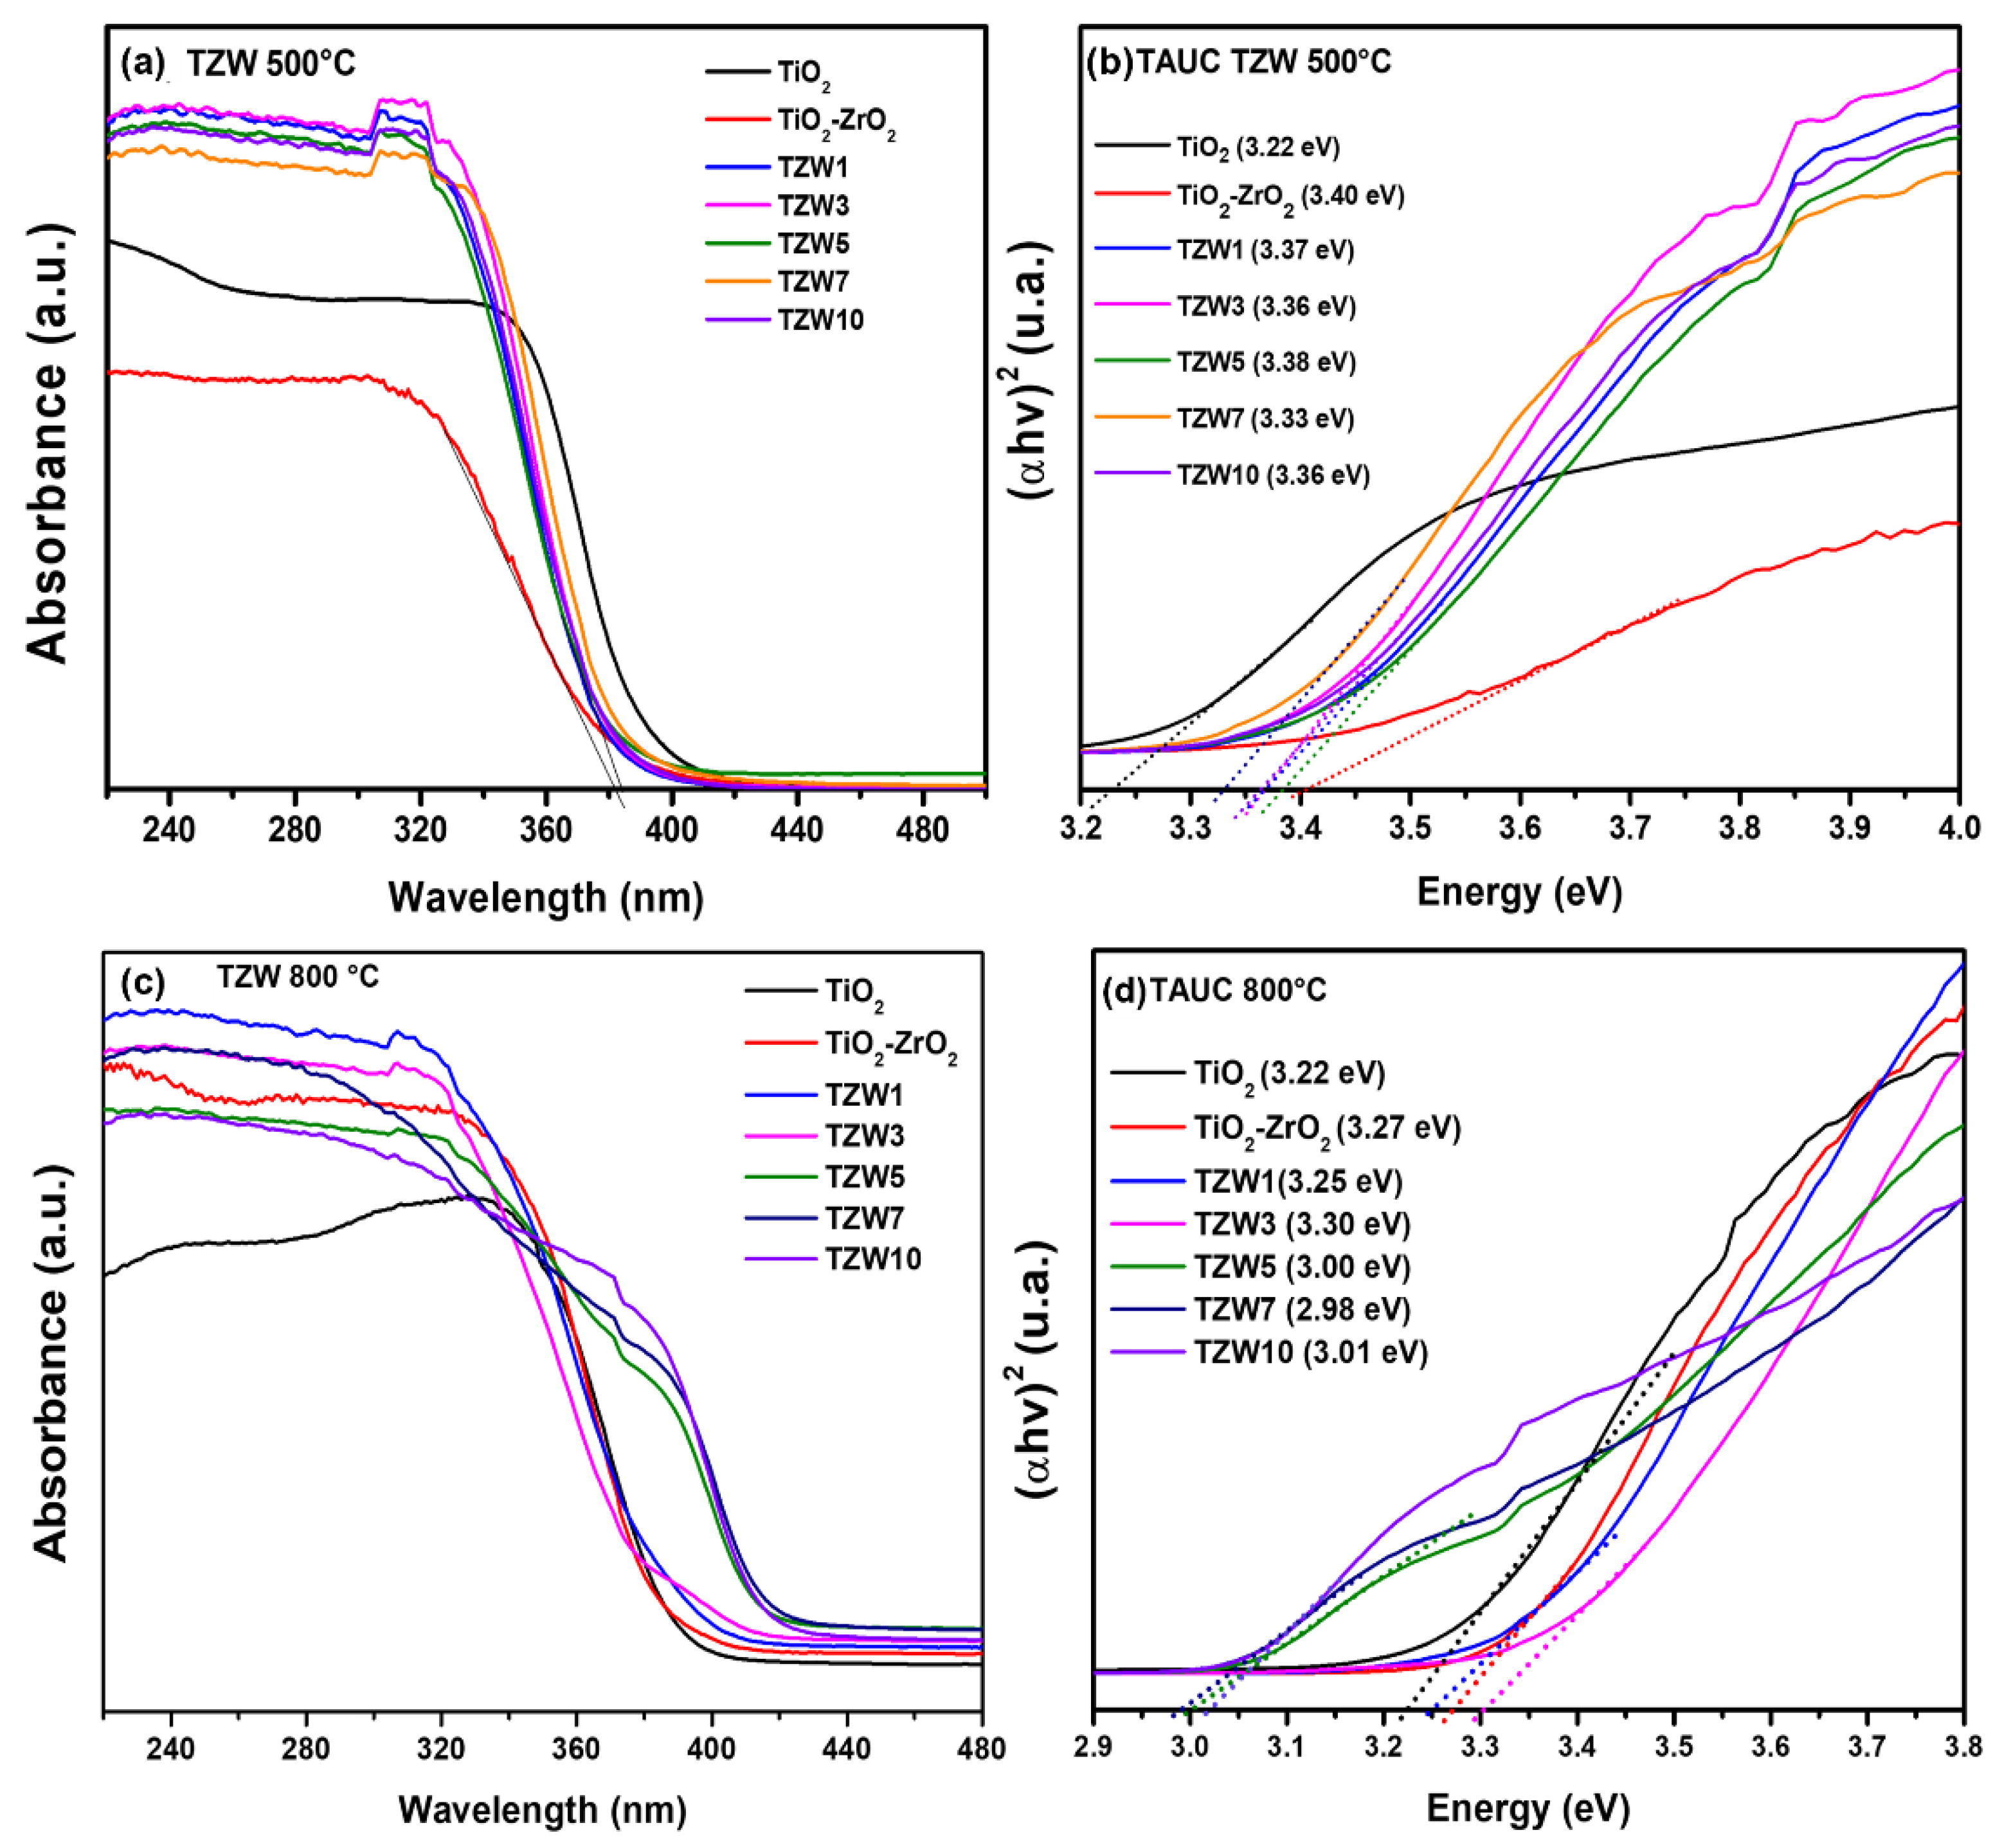
Figure 6.
SEM micrography of TiO2 (a), TZW5 calcined at 500 °C (b), TZW5 calcined at 800 °C (c). Micrographs of the elemental mapping for the TZW5500 and TZW5800 samples (d,e). EDS spectrum and its percentage distribution for the TZW5500 and TZW5800 samples (f).
Figure 6.
SEM micrography of TiO2 (a), TZW5 calcined at 500 °C (b), TZW5 calcined at 800 °C (c). Micrographs of the elemental mapping for the TZW5500 and TZW5800 samples (d,e). EDS spectrum and its percentage distribution for the TZW5500 and TZW5800 samples (f).
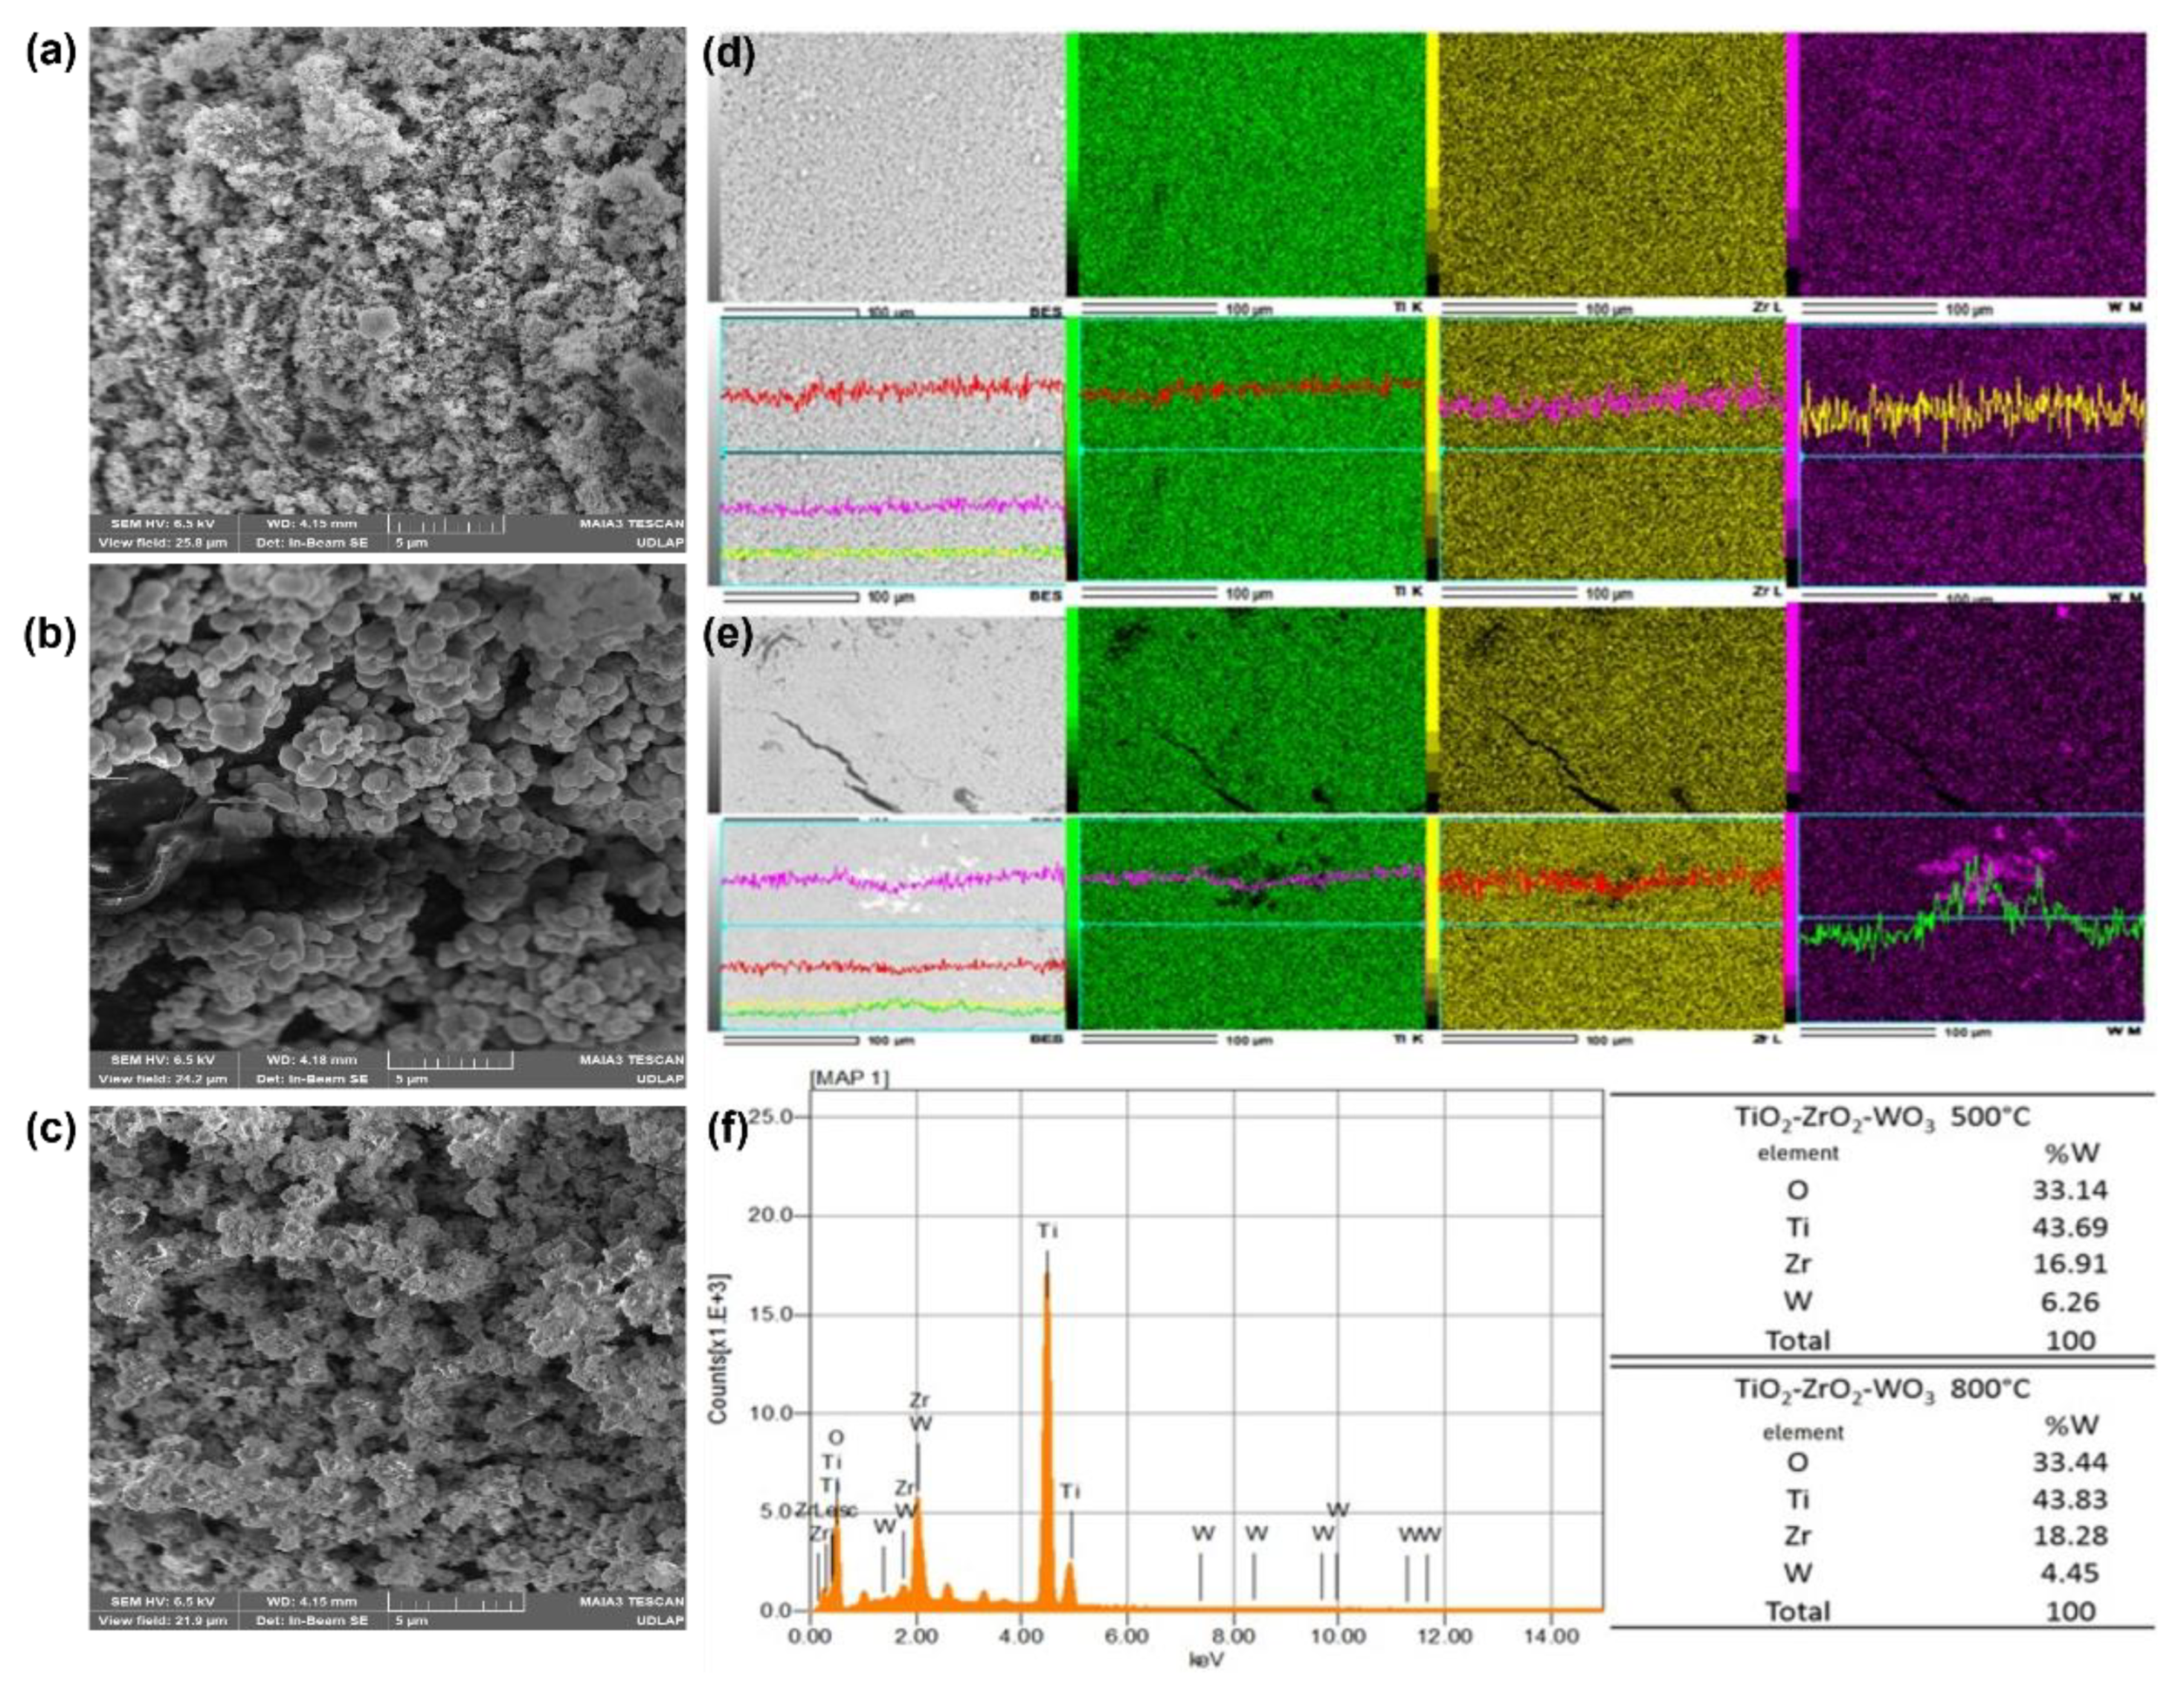
Figure 7.
PL spectra of the samples: TiO2, TiO2-ZrO2, TZW1500, TZW10500, TZW1800 and TZW10800.
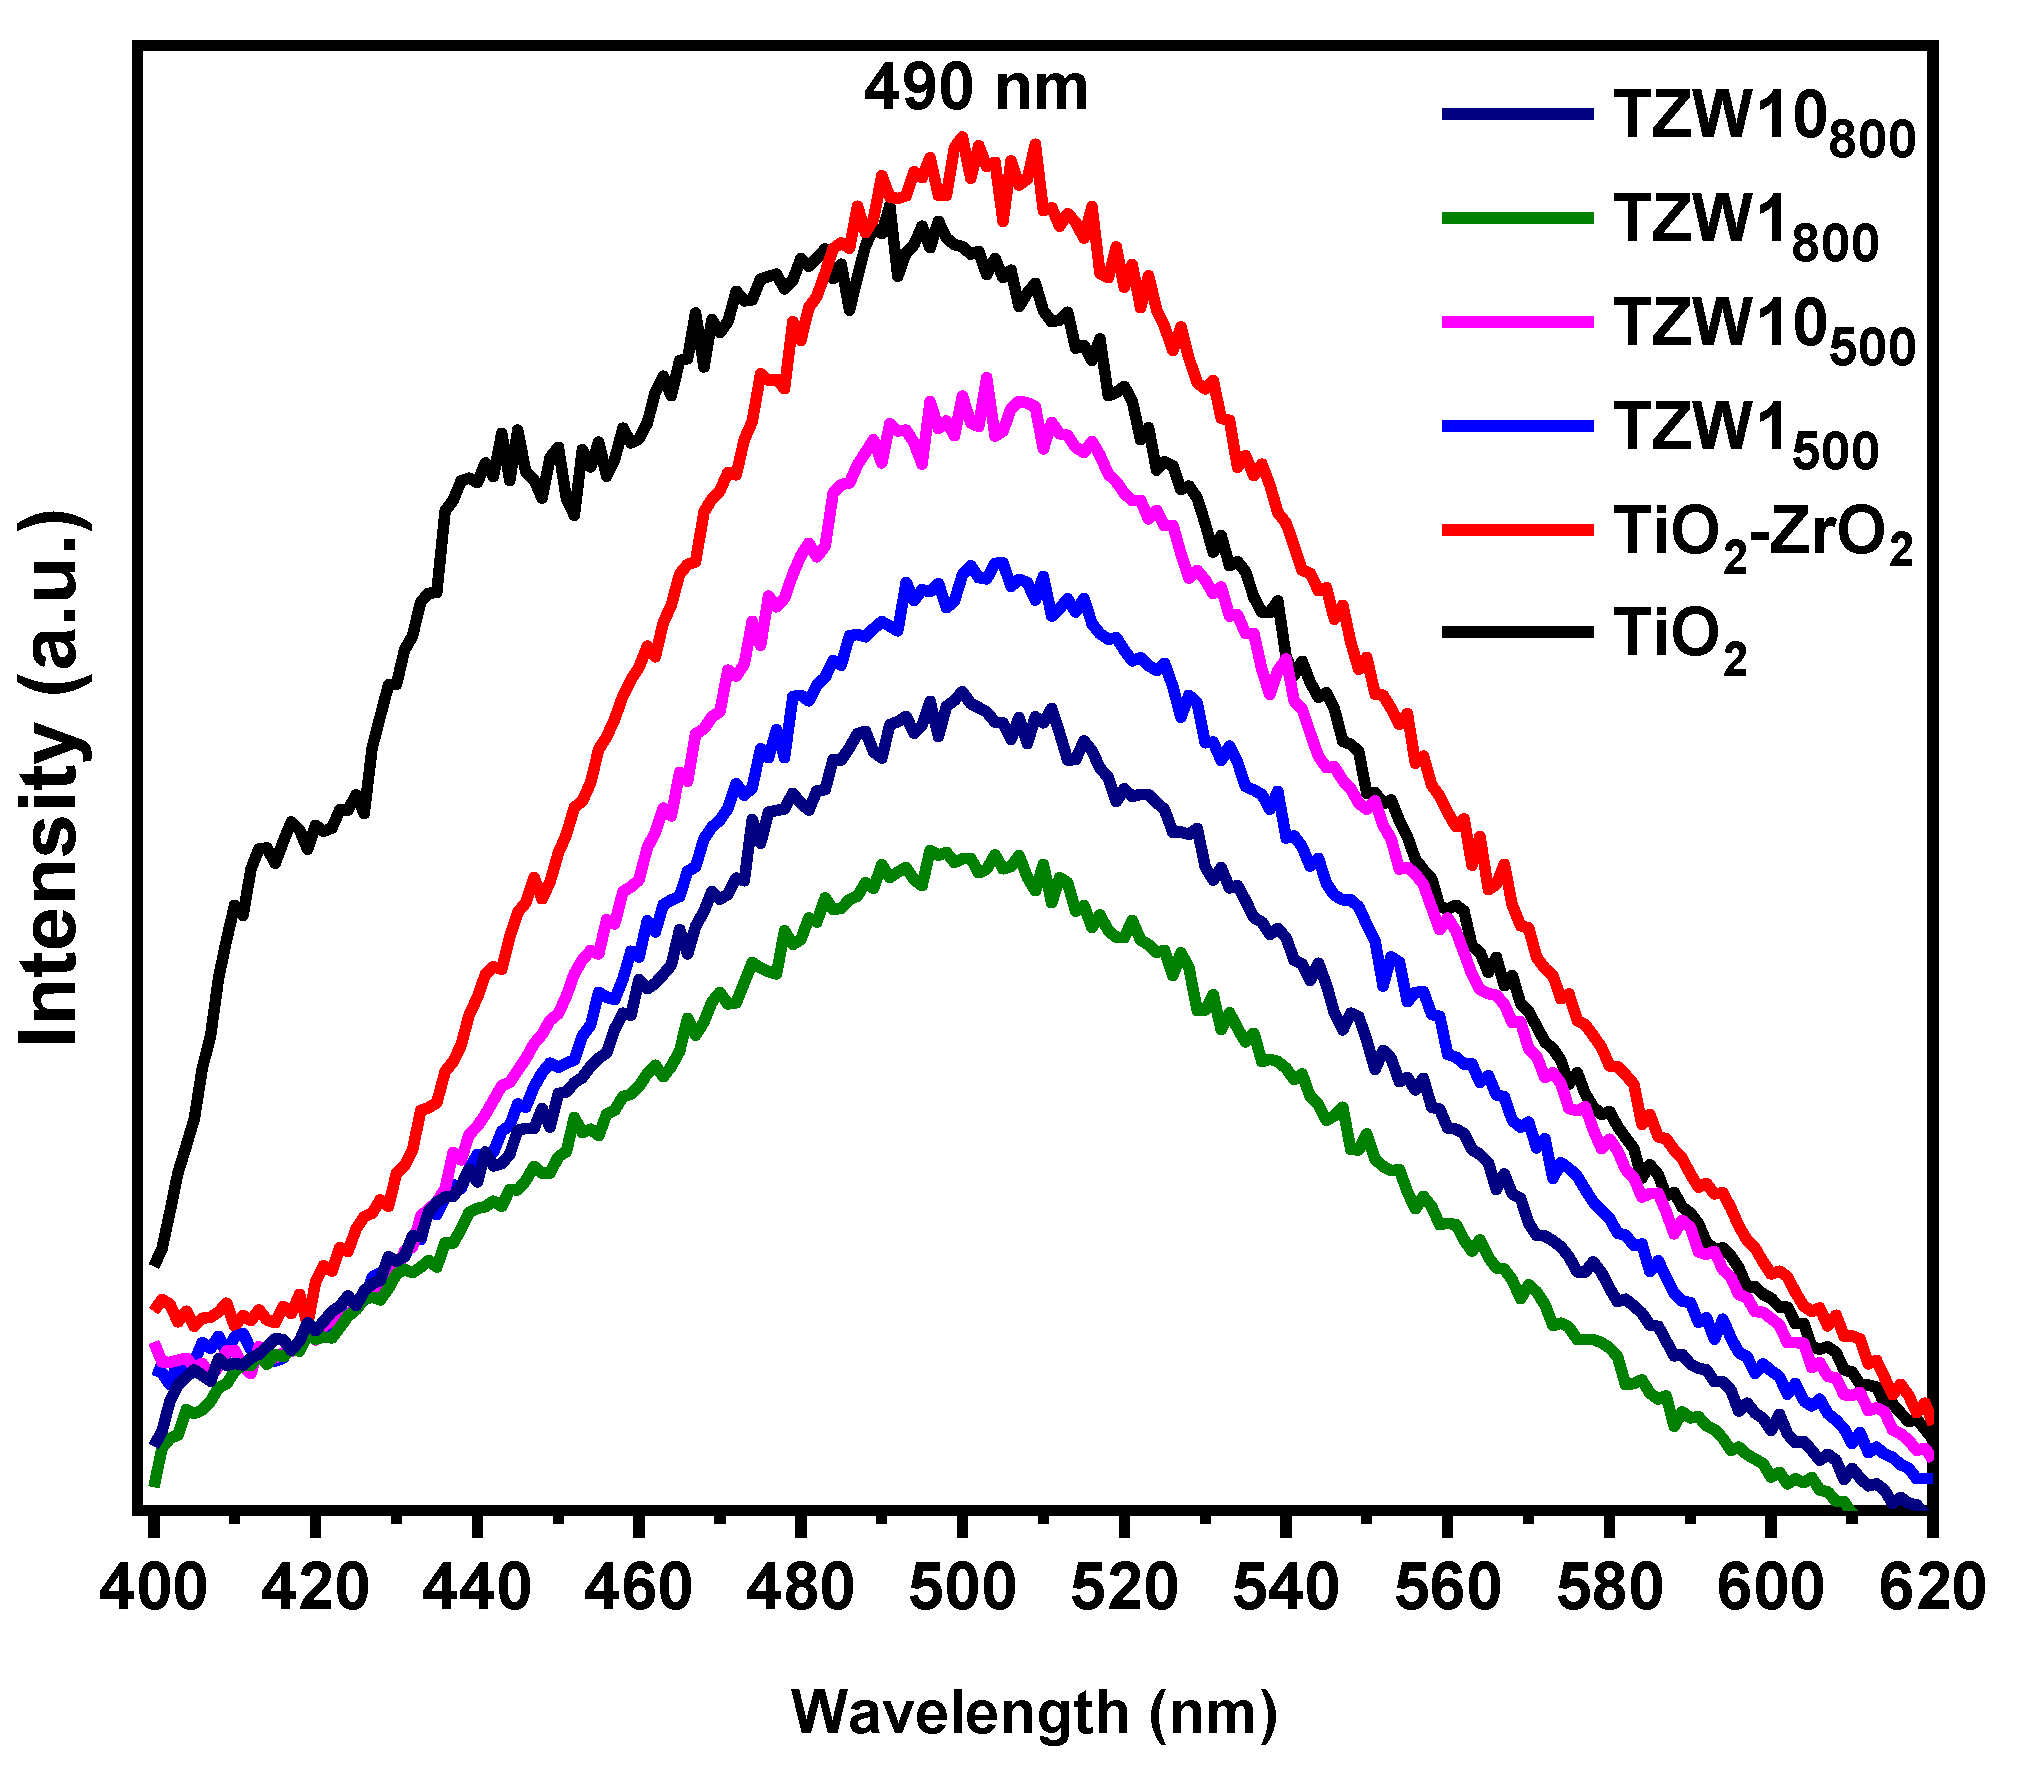
Figure 8.
XPS spectra of TZW1500 and TZW10500 for orbitals: (a, e) O 1s, (b, f) Ti 2p, (c, h) Zr 3d and (d, g) W 4f – Ti 3p.
Figure 8.
XPS spectra of TZW1500 and TZW10500 for orbitals: (a, e) O 1s, (b, f) Ti 2p, (c, h) Zr 3d and (d, g) W 4f – Ti 3p.
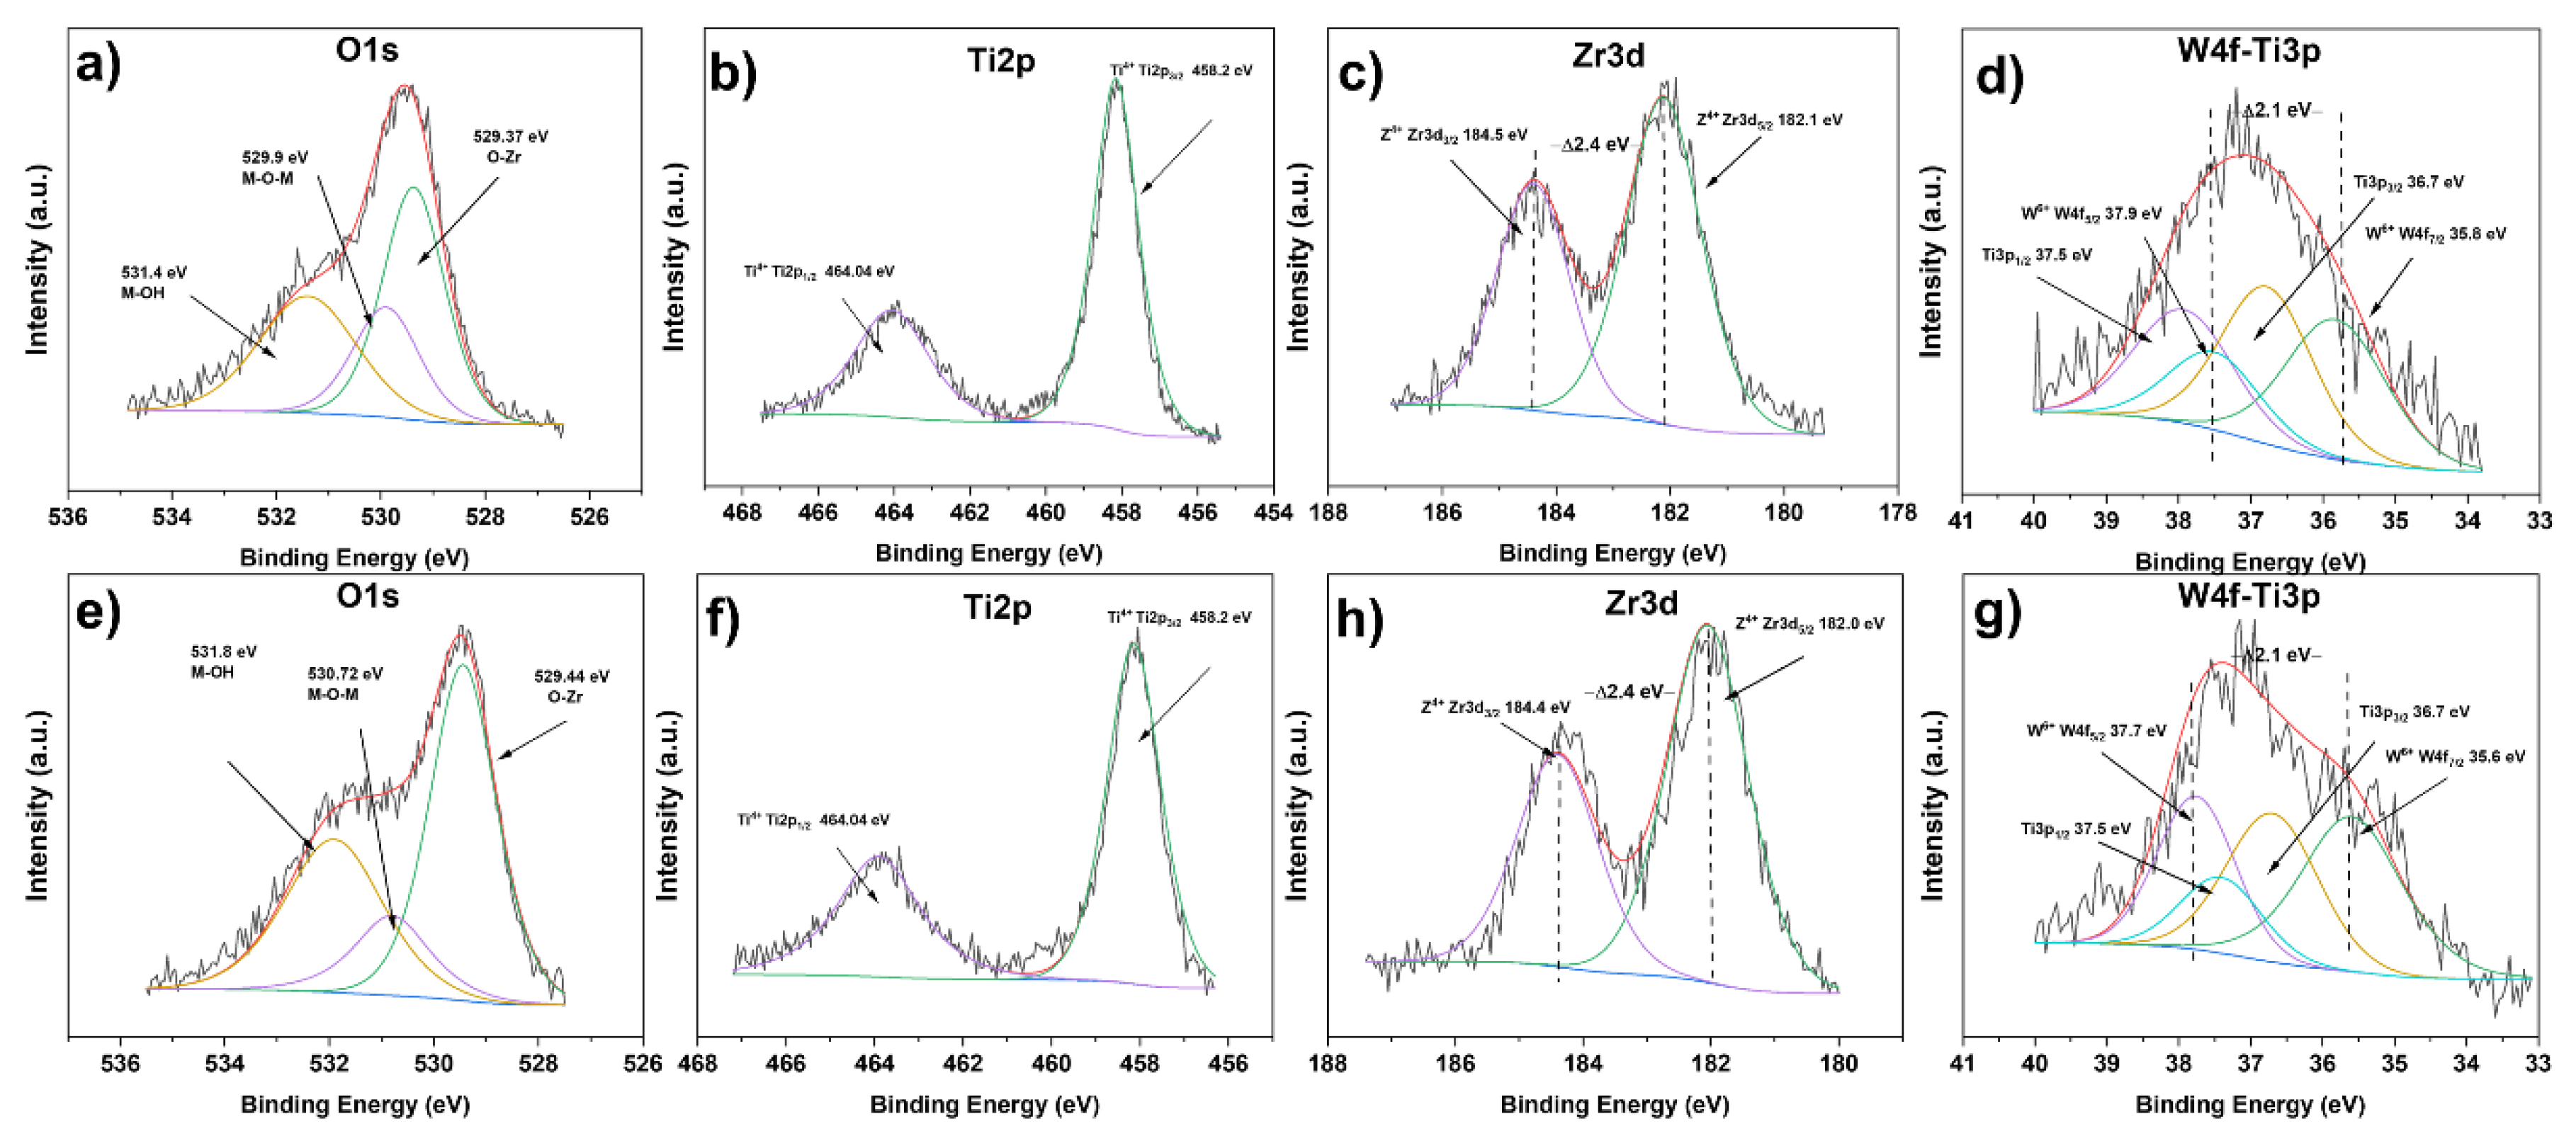
Figure 9.
XPS spectra of TZW1800 and TZW10800 for orbitals: (a, e) O 1s, (b, f) Ti 2p, (c, h) Zr 3d and (d, g) W 4f – Ti 3p.
Figure 9.
XPS spectra of TZW1800 and TZW10800 for orbitals: (a, e) O 1s, (b, f) Ti 2p, (c, h) Zr 3d and (d, g) W 4f – Ti 3p.
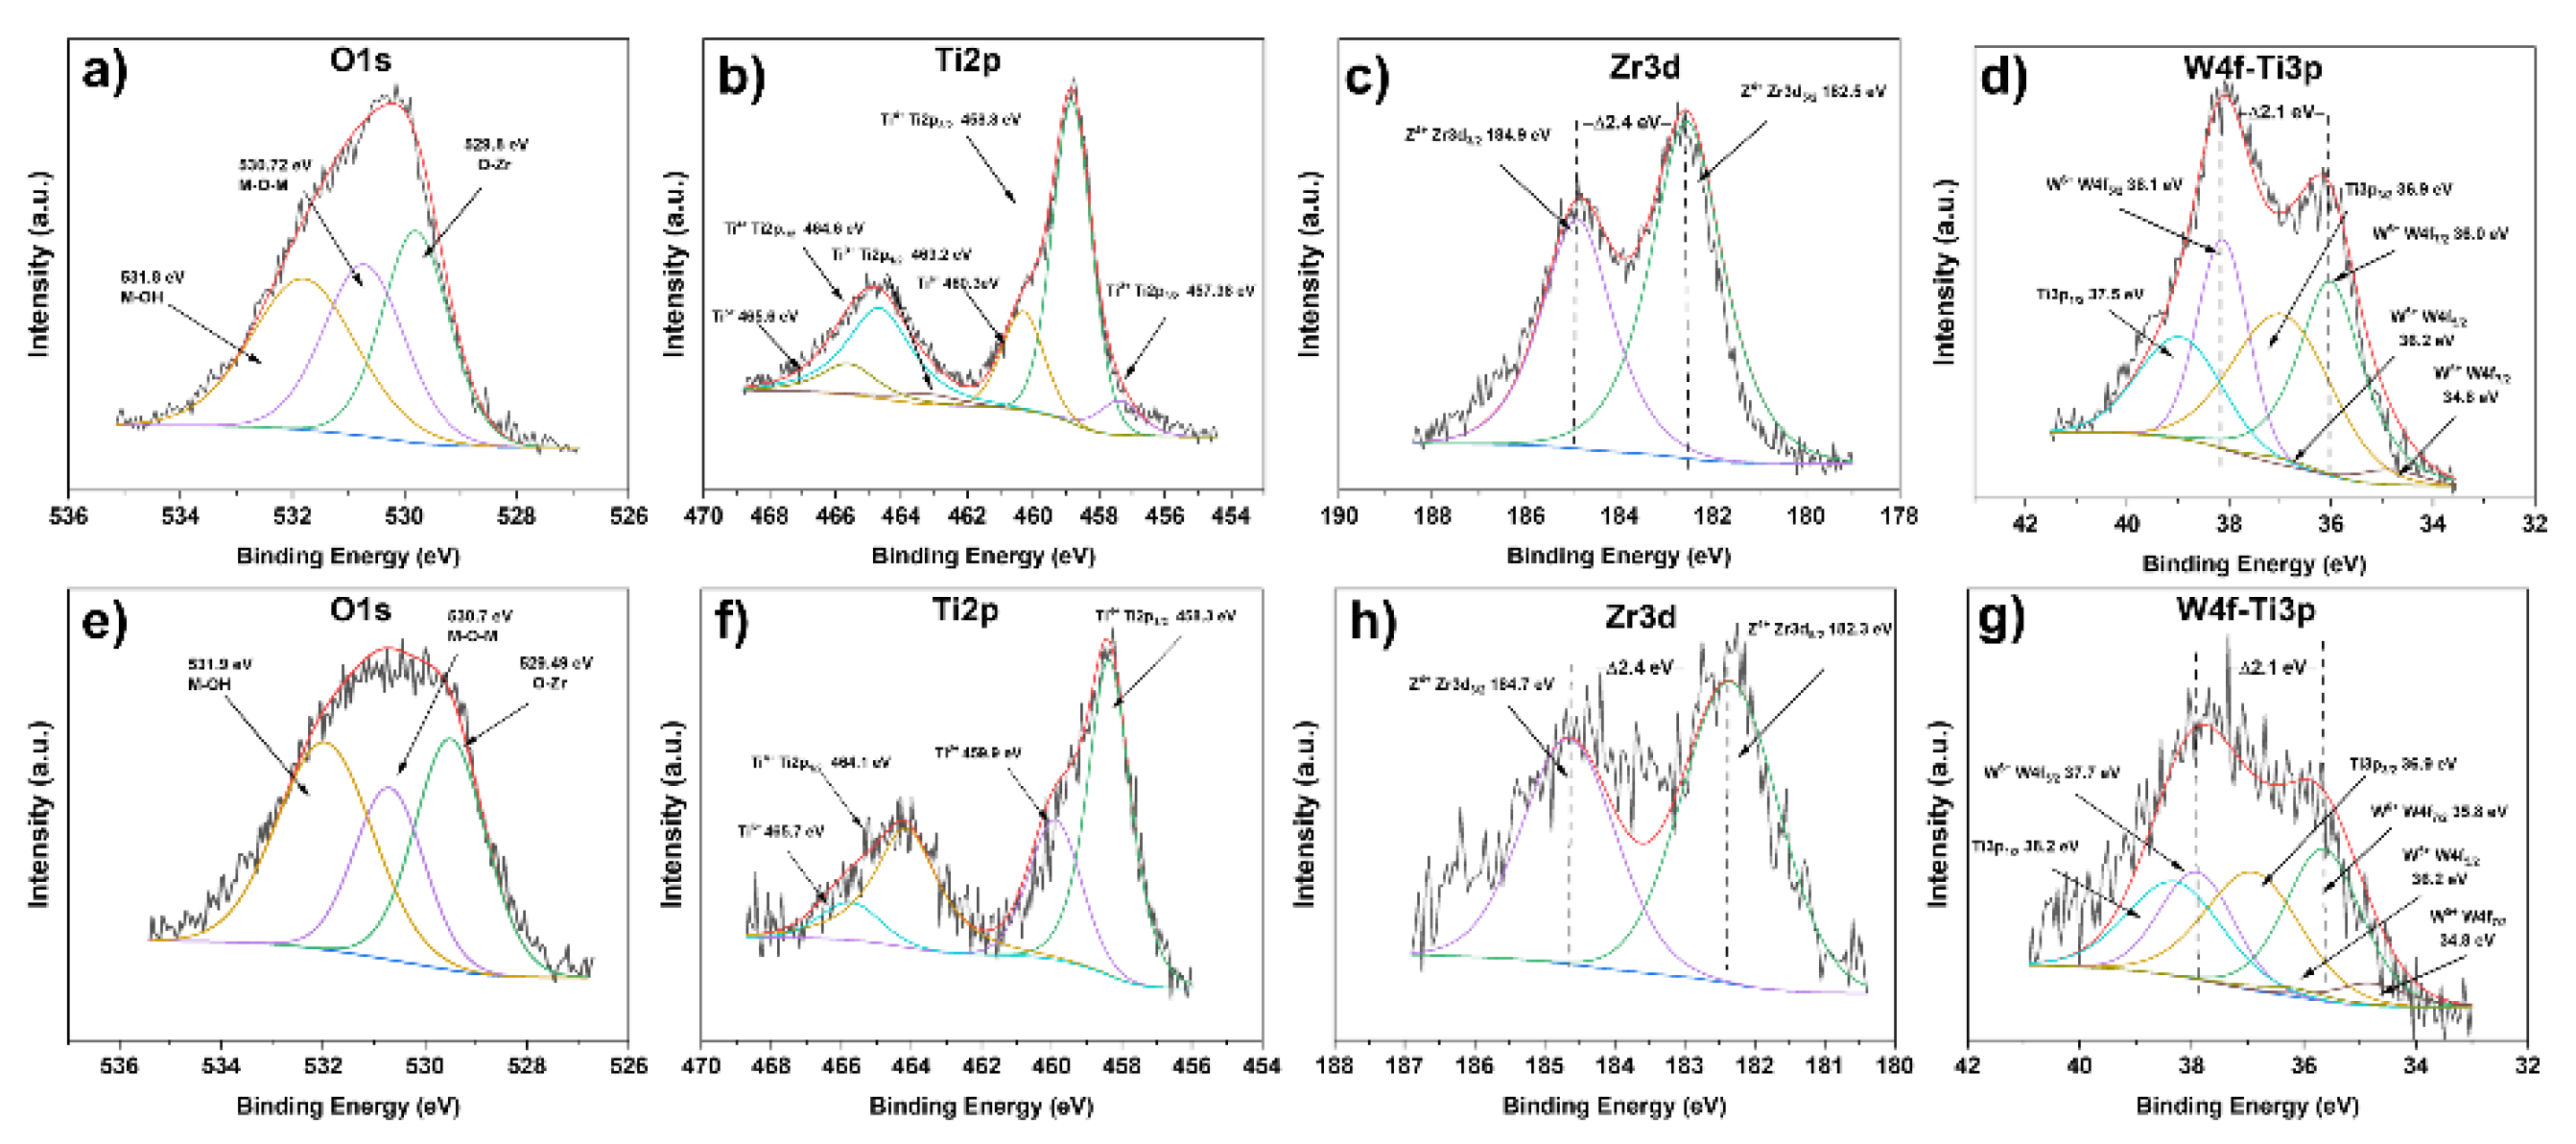
Figure 10.
Kinetic degradation, rate constants and % mineralization obtained in the photocatalytic evaluation of sildenafil under simulated sunlight using catalysts treated at 500 (a,b) and 800 °C (c,d), respectively.
Figure 10.
Kinetic degradation, rate constants and % mineralization obtained in the photocatalytic evaluation of sildenafil under simulated sunlight using catalysts treated at 500 (a,b) and 800 °C (c,d), respectively.
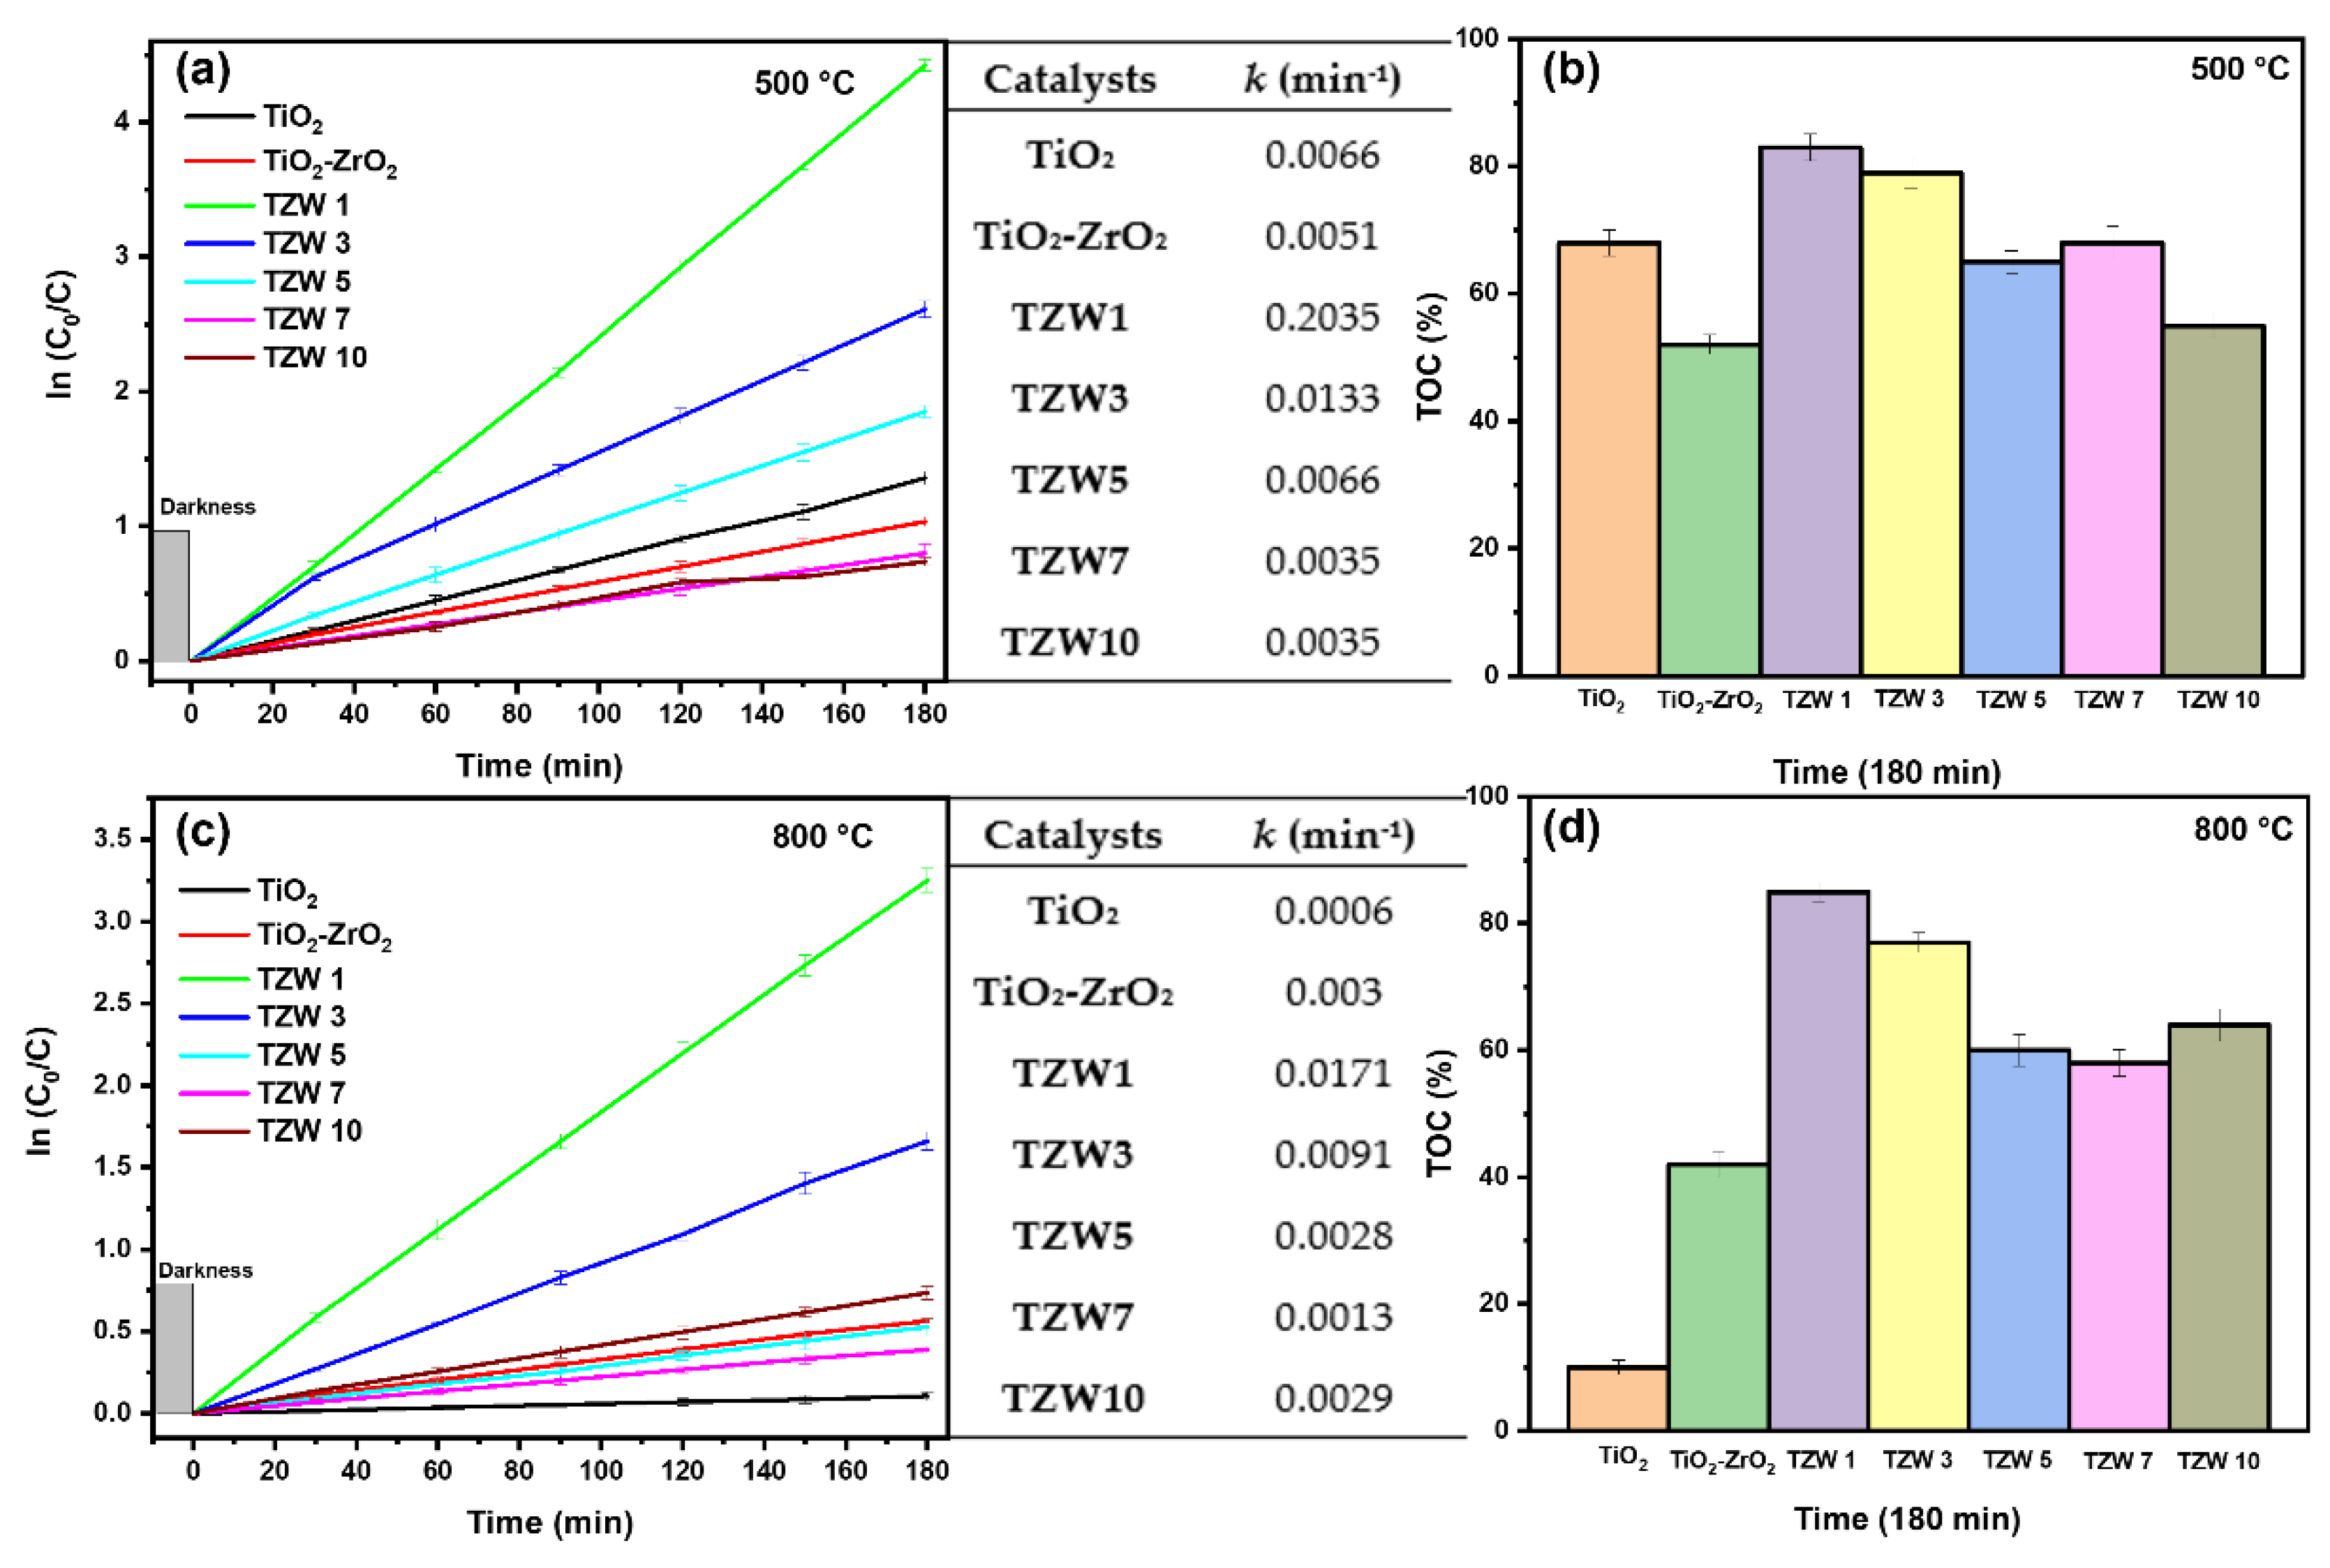
Figure 11.
(a) Cycling runs in photocatalytic degradation of TZW1500 and TZW1800. (b) X-ray diffraction patterns of TZW1500 before and after photocatalytic test. (c) Rate constants for sildenafil degradation using TZW1500 with scavengers.
Figure 11.
(a) Cycling runs in photocatalytic degradation of TZW1500 and TZW1800. (b) X-ray diffraction patterns of TZW1500 before and after photocatalytic test. (c) Rate constants for sildenafil degradation using TZW1500 with scavengers.
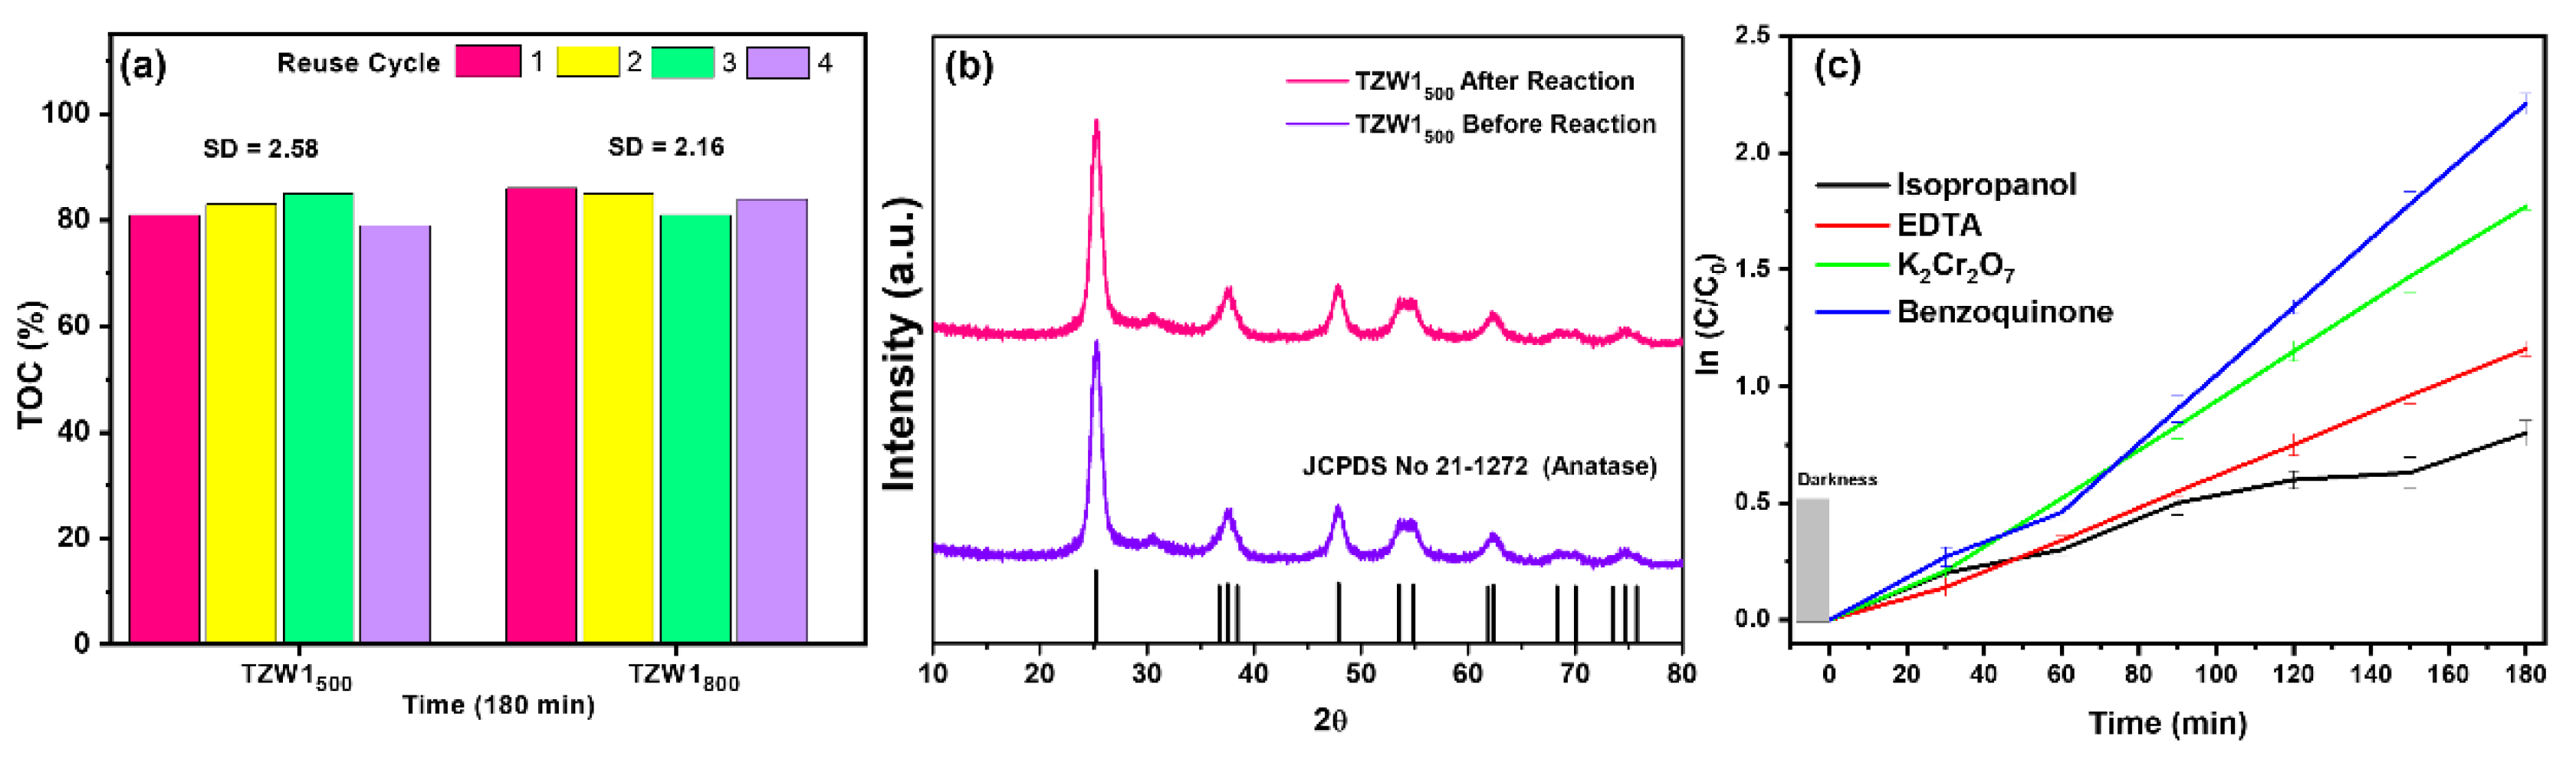
Figure 12.
Schematic representation of the proposed reaction mechanism in TZW1500 under simulated sunlight.
Figure 12.
Schematic representation of the proposed reaction mechanism in TZW1500 under simulated sunlight.
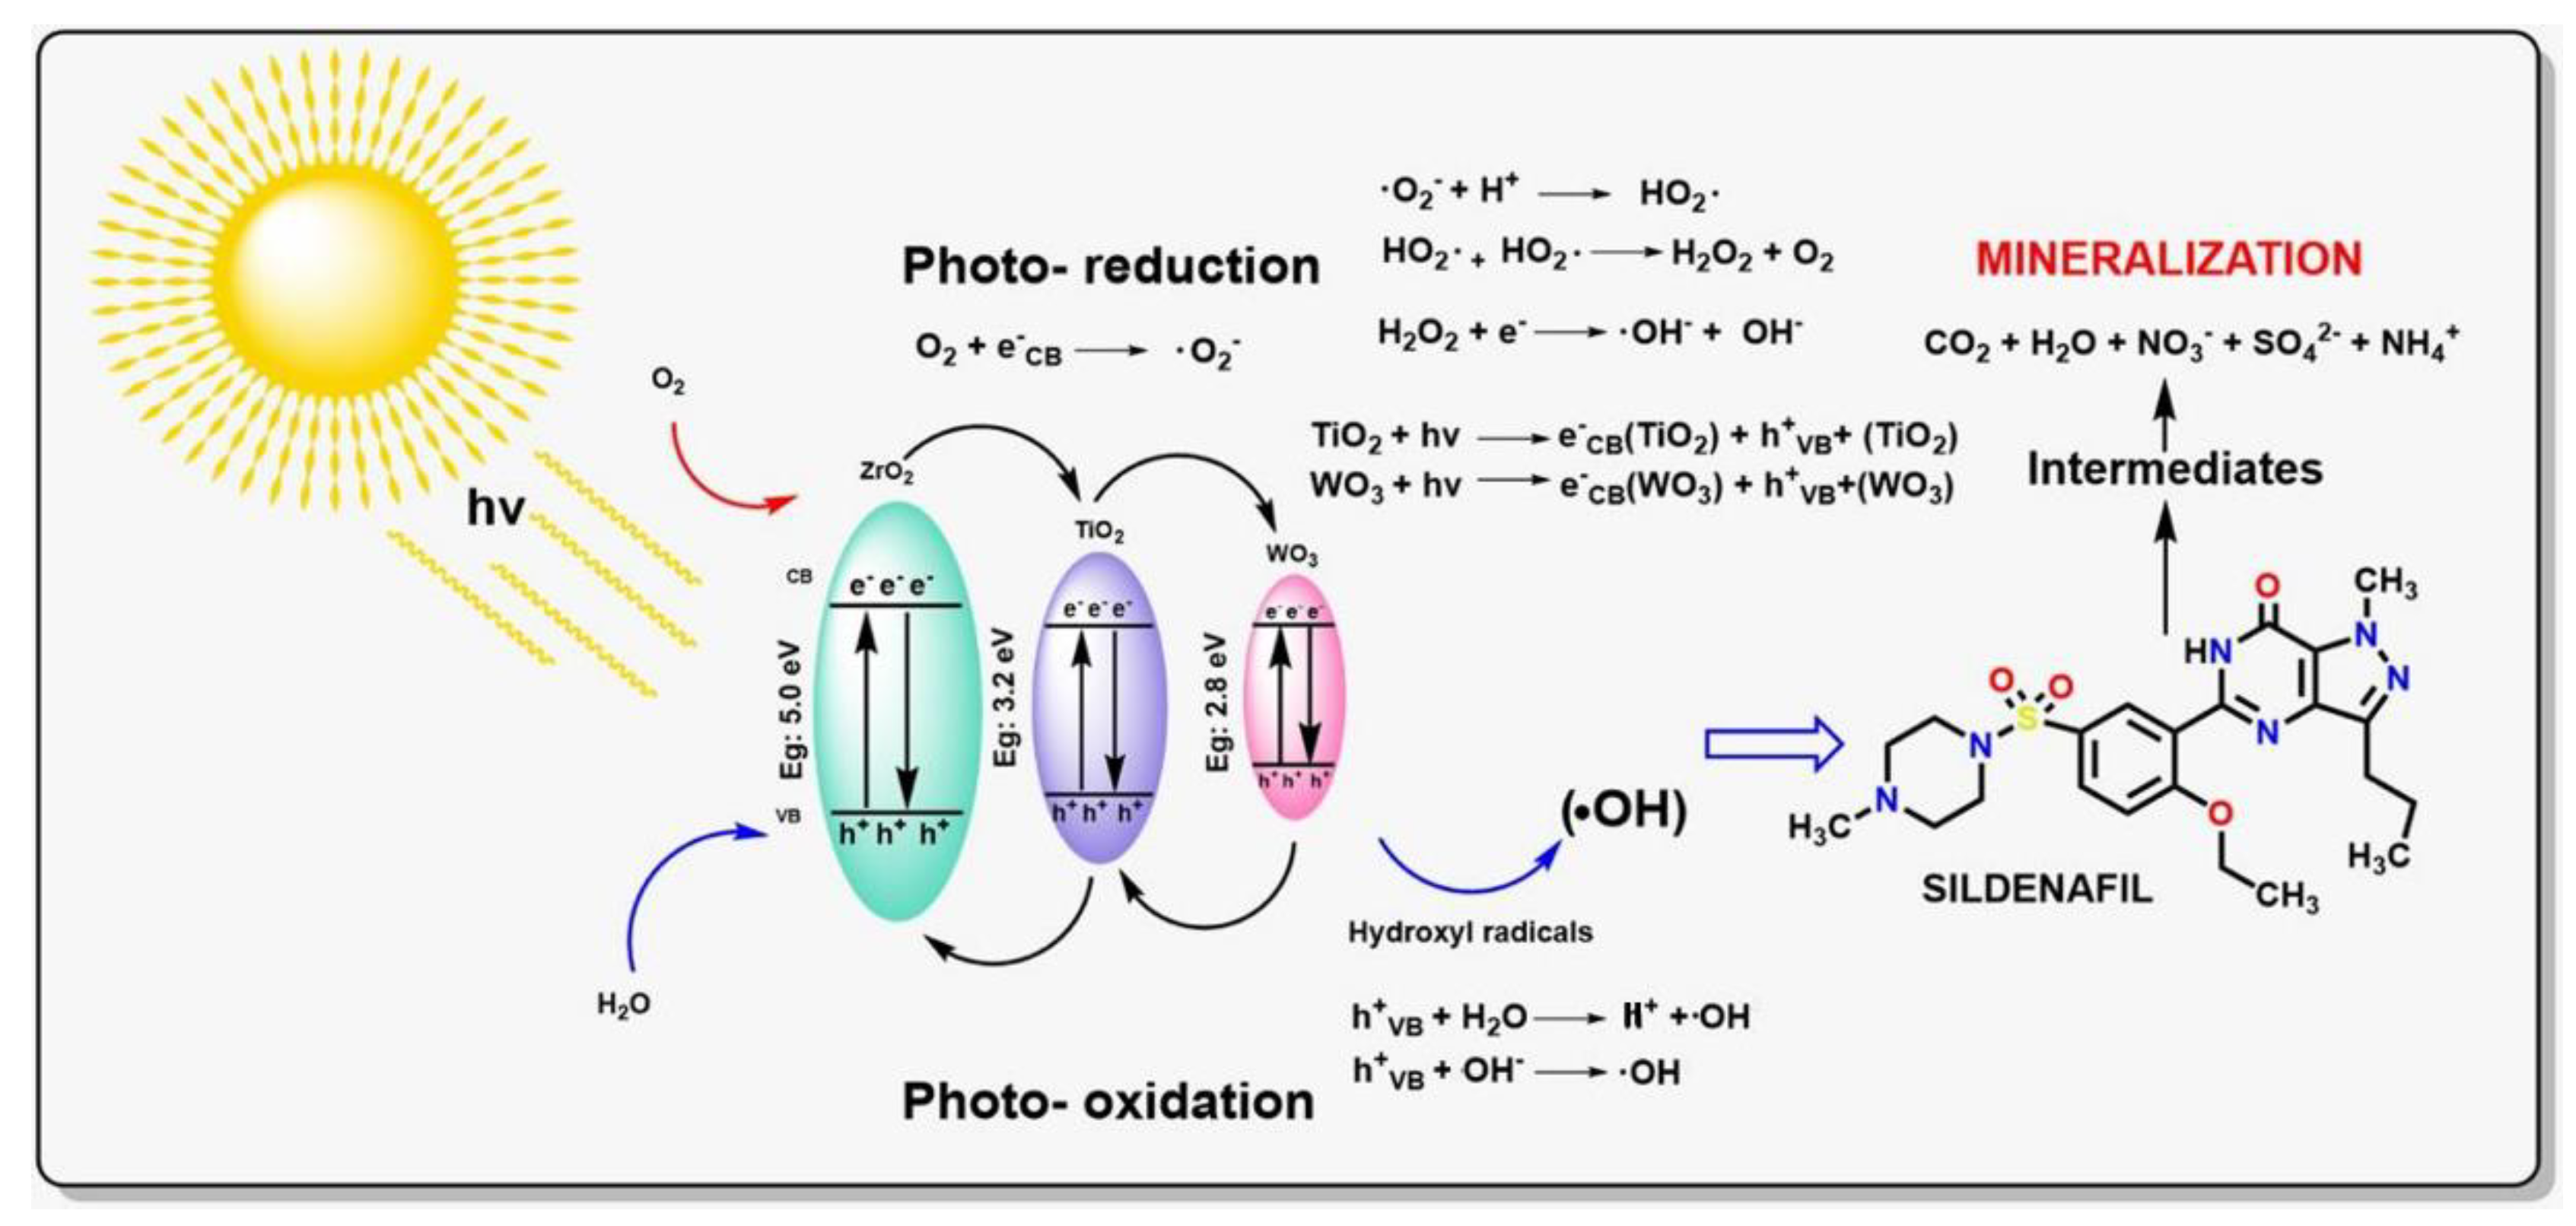

Table 1.
Average crystal size values for materials prepared at 500 and 800 °C.
| Catalyst | Anatase (TiO2) (101) |
Rutile (TiO2) (110) |
Orthorhombic (ZrTiO4) (111) |
|---|---|---|---|
| TiO2 | 14.89 | - | - |
| TiO2-ZrO2 500 | 9.42 | ||
| TZW1500 | 10.20 | - | - |
| TZW3500 | 11.08 | - | - |
| TZW5500 | 10.92 | - | - |
| TZW7500 | 14.84 | - | - |
| TZW10500 | 12.03 | - | - |
| TiO2-ZrO2 800 | 20.15 | 8.50 | |
| TZW1800 | 23.76 | - | 10.01 |
| TZW3800 | 37.80 | 53.16 | 15.93 |
| TZW5800 | 48.3 | 54.69 | 12.64 |
| TZW7800 | - | 64.44 | 16.17 |
| TZW10800 | - | 59.90 | 12.42 |
Table 2.
Specific area values, average pore diameter, pore volume, and percentage distribution of the prepared catalysts.
Table 2.
Specific area values, average pore diameter, pore volume, and percentage distribution of the prepared catalysts.
| Catalysts | Ti-Zr-W (%) |
SBET (m2/g) | Pore diameter Dp (nm) | Pore volume Vp (cm3/g) |
|---|---|---|---|---|
| TiO2 500 | 100-0-0 | 54 | 8.20 | 0.162 |
| TiO2-ZrO2 500 | 75-25-0 | 216 | 3.48 | 0.260 |
| TZW1500 | 74.25-24.75-1 | 104 | 8.78 | 0.340 |
| TZW3500 | 72.75-24.25-3 | 134 | 7.46 | 0.370 |
| TZW5500 | 72.5-22.5-5 | 114 | 8.12 | 0.350 |
| TZW7500 | 69.75-23.25-7 | 87 | 6.22 | 0.200 |
| TZW10500 | 67.5-22.5-10 | 79 | 9.60 | 0.280 |
| TiO2 800 | 100-0-0 | 5 | 35.07 | 0.175 |
| TiO2-ZrO2 800 | 75-25-0 | 28 | 18.85 | 0.153 |
| TZW1800 | 74.25-24.75-1 | 24 | 11.61 | 0.047 |
| TZW3800 | 72.75-24.25-3 | 16 | 10.75 | 0.026 |
| TZW5800 | 72.5-22.5-5 | 15 | 11.20 | 0.027 |
| TZW7800 | 69.75-23.25-7 | 13 | 11.45 | 0.029 |
| TZW10800 | 67.5-22.5-10 | 5 | 22.84 | 0.008 |
Table 3.
Relative abundance of the different chemical species contained in the catalysts of TZW1500, TZW10500, TZW1800 and TZW10800.
Table 3.
Relative abundance of the different chemical species contained in the catalysts of TZW1500, TZW10500, TZW1800 and TZW10800.
| Catalyst | Oxidation States | |||||||
|---|---|---|---|---|---|---|---|---|
| Ti | Zr | W | O | |||||
| Ti3+ | Ti4+ | Zr4+ | W5+ | W6+ | O-M | M-O-M | M-OH | |
| TZW1500 | - | 100 | 100 | - | 100 | 44.08 | 22.27 | 33.66 |
| TWZ10500 | - | 100 | 100 | - | 100 | 51.40 | 14.52 | 34.08 |
| TZW1800 | 27.98 | 72.02 | 100 | 4.86 | 95.14 | 32.25 | 31.56 | 36.19 |
| TWZ10800 | 0 | 100 | 100 | 11.53 | 88.47 | 34.30 | 24.83 | 40.87 |
Disclaimer/Publisher’s Note: The statements, opinions and data contained in all publications are solely those of the individual author(s) and contributor(s) and not of MDPI and/or the editor(s). MDPI and/or the editor(s) disclaim responsibility for any injury to people or property resulting from any ideas, methods, instructions or products referred to in the content. |
© 2025 by the authors. Licensee MDPI, Basel, Switzerland. This article is an open access article distributed under the terms and conditions of the Creative Commons Attribution (CC BY) license (http://creativecommons.org/licenses/by/4.0/).
Copyright: This open access article is published under a Creative Commons CC BY 4.0 license, which permit the free download, distribution, and reuse, provided that the author and preprint are cited in any reuse.


