1. Introduction
People worldwide are living longer, and populations are aging. By 2050, the world’s population of people aged 60 years and older will double (2.1 billion). The number of persons aged 80 years or older is expected to triple from 2020 to 2050, reaching 426 million [
https://www.who.int/news-room/fact-sheets/detail/ageing-and-health]. Older adults are susceptible to chronic medical conditions, sensory impairments, and geriatric syndromes, very often combined into multimorbidity. This will translate into increased health care burden and increased social, societal, and institutional costs. The better we understand all the pathophysiological complexities of aging, the better we will be able to allocate the resources. It has been previously described that aging and female sex are associated with left ventricular hypertrophy [
1,
2,
3]. Age-related thickening and stiffening of the large arteries, due to collagen and calcium deposition and loss of elastic fibers in the medial layer, are known to induce systolic hypertension [
4]. Hypertension, along with obesity, is an additional factor leading to left ventricular hypertrophy [
5]. Left ventricular hypertrophy is an independent risk factor for heart failure, coronary heart disease, stroke, arrhythmias, sudden cardiac death, and cardiovascular morbidity and mortality [
6].
Population aging may also be characterized by an increasing incidence of frailty [
5,
7]. Frailty is characterized by increased vulnerability and reduced resilience to different stressors [
8] and is another independent risk factor of mortality [
8,
9]. Several assessment tools are used to define frailty, with the Fried phenotype scale being the first to be developed and widely used in clinical practice and research [
8,
10,
11,
12]. The phenotypic frailty concept includes age-associated declines in lean body mass, strength, endurance, balance, walking performance, and low activity [
13]. Several papers have documented the relationship between altered cardiac morphology, its function, and frailty [
14,
15,
16]. Nadruz et al. [
16] reported that frailty is independently associated with increased left ventricle mass index. Topriceanu et al. [
15] reported that frailty, defined by the accumulation of health deficits (Frailty Index FI), is associated with myocardial hypertrophy and poorer function. The authors of both papers used patients’ weight to index left ventricular mass. Although Nadruz et al. [
16] used bioimpedance to assess body composition, they failed to find a relation between frailty, obesity, and left ventricular mass.
Despite growing interest in frailty as a significant factor of worsening prognosis in elderly patients, consistent evidence and proven pathophysiological mechanisms explaining this phenomenon are lacking. Furthermore, data on myocardial morphology and function in frail patients are scarce. Therefore, this study aimed to assess the associations among frailty, lean body mass, central arterial stiffness, and cardiac structure and geometry in older people with a normal ejection fraction.
2. Materials and Methods
2.1. Study design and protocol
This is an ancillary analysis of the FRAPICA study (the ClinicalTrials.org NCT03209414) [
17]. This study features an observational cross-sectional design. Therefore, we followed the Strengthening the Reporting of Observational Studies in Epidemiology (STROBE) checklist to report the methods and findings of this study [
18].
2.2. Clinical setting
This study was conducted at the 2nd Department of Cardiology in Zabrze, Medical University of Silesia, Katowice, Poland.
2.3. Participants
The study included 205 patients hospitalized between 2017 and 2025 in the 2nd Dept. of Cardiology. The study cohort comprised patients with normal left ventricular function, selected from the entire FRAPICA population of 843 patients enrolled to date.
2.3.1. Inclusion criteria
The study included participants aged >65 years with informed consent to participate in the project and angiographically confirmed coronary artery disease, in accordance with the FRAPICA trial protocol. Normal left ventricular function, defined as a left ventricular ejection fraction >50%, was another inclusion criterion for this sub-study.
2.3.2. Exclusion criteria
The exclusion criterion was a lack of consent to participate in this observational study. Patients with cardiomyopathies, valvular heart disease, previous cardiac surgery, and left ventricle ejection fraction <50% were also excluded from the analysis.
2.4. Measurements and variables
We assessed frailty using the Fried frailty phenotype score [
8]. We recognized frailty if three or more out of the five following criteria were met:
- Slowness - reduced gait speed at a distance of 5 meters at the usual pace. A patient must repeat three times, and the results are averaged. The results were stratified by gender and height.
- Weakness was assessed with a maximal handgrip strength test. It was performed with the dominant arm. We used an electronic hand dynamometer EH101 (VETEK AB, Sweden). The patient required three repetitions of the procedure, and the maximal value was recorded. The test was positive for frailty if <30 kg for men and <20 kg for women.
- Low physical activity was assessed by the Minnesota Leisure Time Activity questionnaire. The result was positive when calorie expenditure per week was below 270 kcal/week in women and 383 kcal/week in men. We have prepared a Microsoft Excel-based template for rapid questioning and easy calculation of all activities and respective calorie expenditure. We have assessed the physical activity over the past twelve months.
- Exhaustion is self-reported by a patient. The patient has to answer the following questions from CESD-R scale: “How often in the past week did you feel like everything you did was an effort? How often in the past week did you feel like you could not get going?” The possible answers are: often (3 or more days) or not often, depending on whether the feeling is present for 0–2 days. The positive answer was when the patient said “often.”
- The last criterion is weight loss exceeding 10 pounds (approximately 4.5 kg) unintentionally in the past year.
Patients with 1 or 2 criteria were classified as pre-frail. Patients with a score of 0 were classified as robust.
For the analyses, we pooled the patients classified as robust and pre-frail into a non-frail group.
2.4.1. Assessment of fat-free mass
Patients were assessed for fat-free mass using Harpenden’s skinfold caliper and Baty’s body assessment software (Baty International Ltd, UK). Lean body mass was derived from a patient’s height and weight using the three-site Jackson/Pollock algorithm [
19]. The algorithm uses different measurement sites for men and women (male subjects: chest, abdomen, and thigh; female subjects: triceps, suprailiac, and thigh). The patient's height and weight were measured using the SECA 284 measuring station (SECA, Germany). Fat-free mass was presented as an absolute value (kg) and as a percentage of total body mass. We have internally validated this method against the bioimpedance method with SECA mBCA 528 (SECA, Germany) (see Supplementary material)
2.4.2. Echocardiographic assessment
We have recorded two-dimensional 2D images of the left ventricular walls and cavity dimensions at systole and diastole. Left ventricular mass was measured from 2D M-mode images according to Recommendations for Chamber Quantification by the American Society of Echocardiography and the European Association of Cardiovascular Imaging [
20]. Left ventricular hypertrophy was determined if left ventricular mass index LVMI ≥ 115 g/m2 in males (reference range 50–102 g/m2) and ≥ 95 g/m2 in females (reference range 44–88 g/m2) [
20]. Left ventricular remodeling was determined as normal geometry, concentric remodeling, concentric hypertrophy, and eccentric hypertrophy [
20]
2.4.3. Carotid femoral pulse wave velocity for assessment of central arterial stiffness
We have used carotid-femoral pulse wave velocity (cfPWV) to evaluate central arterial stiffness. For these measurements, we used piezoelectric mechanotransducers in carotid and femoral sites (Complior, Alam Medical, France). This methodology is recommended by the European Society of Hypertension [
21]. The right-sided carotid-femoral distance was measured with the Seca mod. 207 height meter (Seca, Germany). Blood pressure was measured in a sitting position, after at least 5 minutes of rest, using a Microlife BP A1 sphygmomanometer, immediately before PWV assessment, in both arms in triplicate. The measurements were averaged separately for the right and left arms, and the higher value was recorded. Arterial stiffness was expressed in meters per second. The integrated software has calculated the central blood pressure from the carotid pulse waveform.
2.5. Statistical analysis
After analyzing the data for normality of distribution and equality of variances using the Shapiro-Wilk test, we applied both parametric and nonparametric statistics to compare non-frail and frail men and women. ANOVA was used for multiple comparisons of normally distributed quantitative data. Any significant differences found in the analysis of variance were further tested with Student’s t-test corrected with the Bonferroni method for multiple comparisons. For non-normally distributed data, we used the Kruskal-Wallis ANOVA, with multiple comparisons based on mean ranks. The Chi-square test with Yates’ correction was used to compare frequency data. Data are presented as means and standard deviations, or as frequency data. Quantitative data presented are unadjusted, unless indicated otherwise in the manuscript. Spearman's correlation was calculated to assess the linearity of echocardiographic variables across degrees of frailty. Analysis of covariance ANCOVA was used to determine the impact of confounding variables (covariates). The variables that differed significantly in comparative analysis were used as covariates in three ANCOVA models. Model 1 was adjusted for age and gender; model 2 additionally included weight; and model 3 additionally included pulmonary diseases. Statistically significant differences between the analyzed variables were assumed at P < 0.05. Statistica v. 13.3, licensed for use by the Medical University of Silesia, was used for all computations.
3. Results
3.1. Patient population
Our study population was substantially biased. Frail patients were older in comparison to their non-frail counterparts. Women comprised the majority of the frail group (26 women out of 37, i.e., 70.3% vs. 63 out of 168 patients, i.e., 37.5%; P < 0.001). The distribution of women’s and men’s morphometric variables (height and weight) was differentiated and affected the mean values of height and weight of non-frail and frail groups (height: 168.6±8.4 vs. 162.4±9.0 cm, P<0.001; weight: 81.6±14.1 vs. 77.4±14.6 kg, NS, in non-frail and frail groups, respectively). Frail men and women had comparable weight and height to their non-frail counterparts. The same distribution held for fat-free mass, expressed both as an absolute value and as a percentage of body weight. Body mass index was comparable across all studied groups and subgroups. Likewise, blood pressure at admission and at frailty assessment, central blood pressure, and carotid-femoral pulse wave velocity were comparable between frail and non-frail men and women. Groups were similar in the distribution of comorbidities, except for chronic obstructive pulmonary disease or asthma, which was more common among frail men (
Table 1).
3.2. Echocardiographic findings
Left ventricle dimensions differed between men and women. The interventricular septum was insignificantly thicker in men (11.4±1.7 vs. 11.1±1.7 mm, NS) and in frail patients (11.7±2.1 vs. 11.2±1.6 mm, NS). The left ventricle end-diastolic diameter was significantly larger in men (52.5±6.9 vs. 47.3±4.8 mm, P<0.001), and insignificantly smaller in frail patients (48.7±5.8 vs. 50.6±6.7 mm, NS). Posterior wall diameter was comparable in men and women (10.9±1.3 vs. 10.8±1.2 mm, NS). However, it was significantly thicker in frail patients (11.2±1.5 vs. 10.7±1.2 mm, P<0.05). Such trends in left ventricular dimensions resulted in higher, though not statistically significant, left ventricular mass and indexed left ventricular mass in frail patients (left ventricular mass: 217.1±71.7 vs. 214.5±60.0 g, NS; left ventricular mass indexed: 116.1±34.2 vs. 110.0±28.6 g, NS in frail and non-frail groups, respectively). The relative wall thickness was significantly higher in women than in men (0.46±0.1 vs. 0.42±0.1, P<0.001) and in frail patients (0.47±0.1 vs. 0.43±0.1, P<0.01). Details are presented in
Table 2.
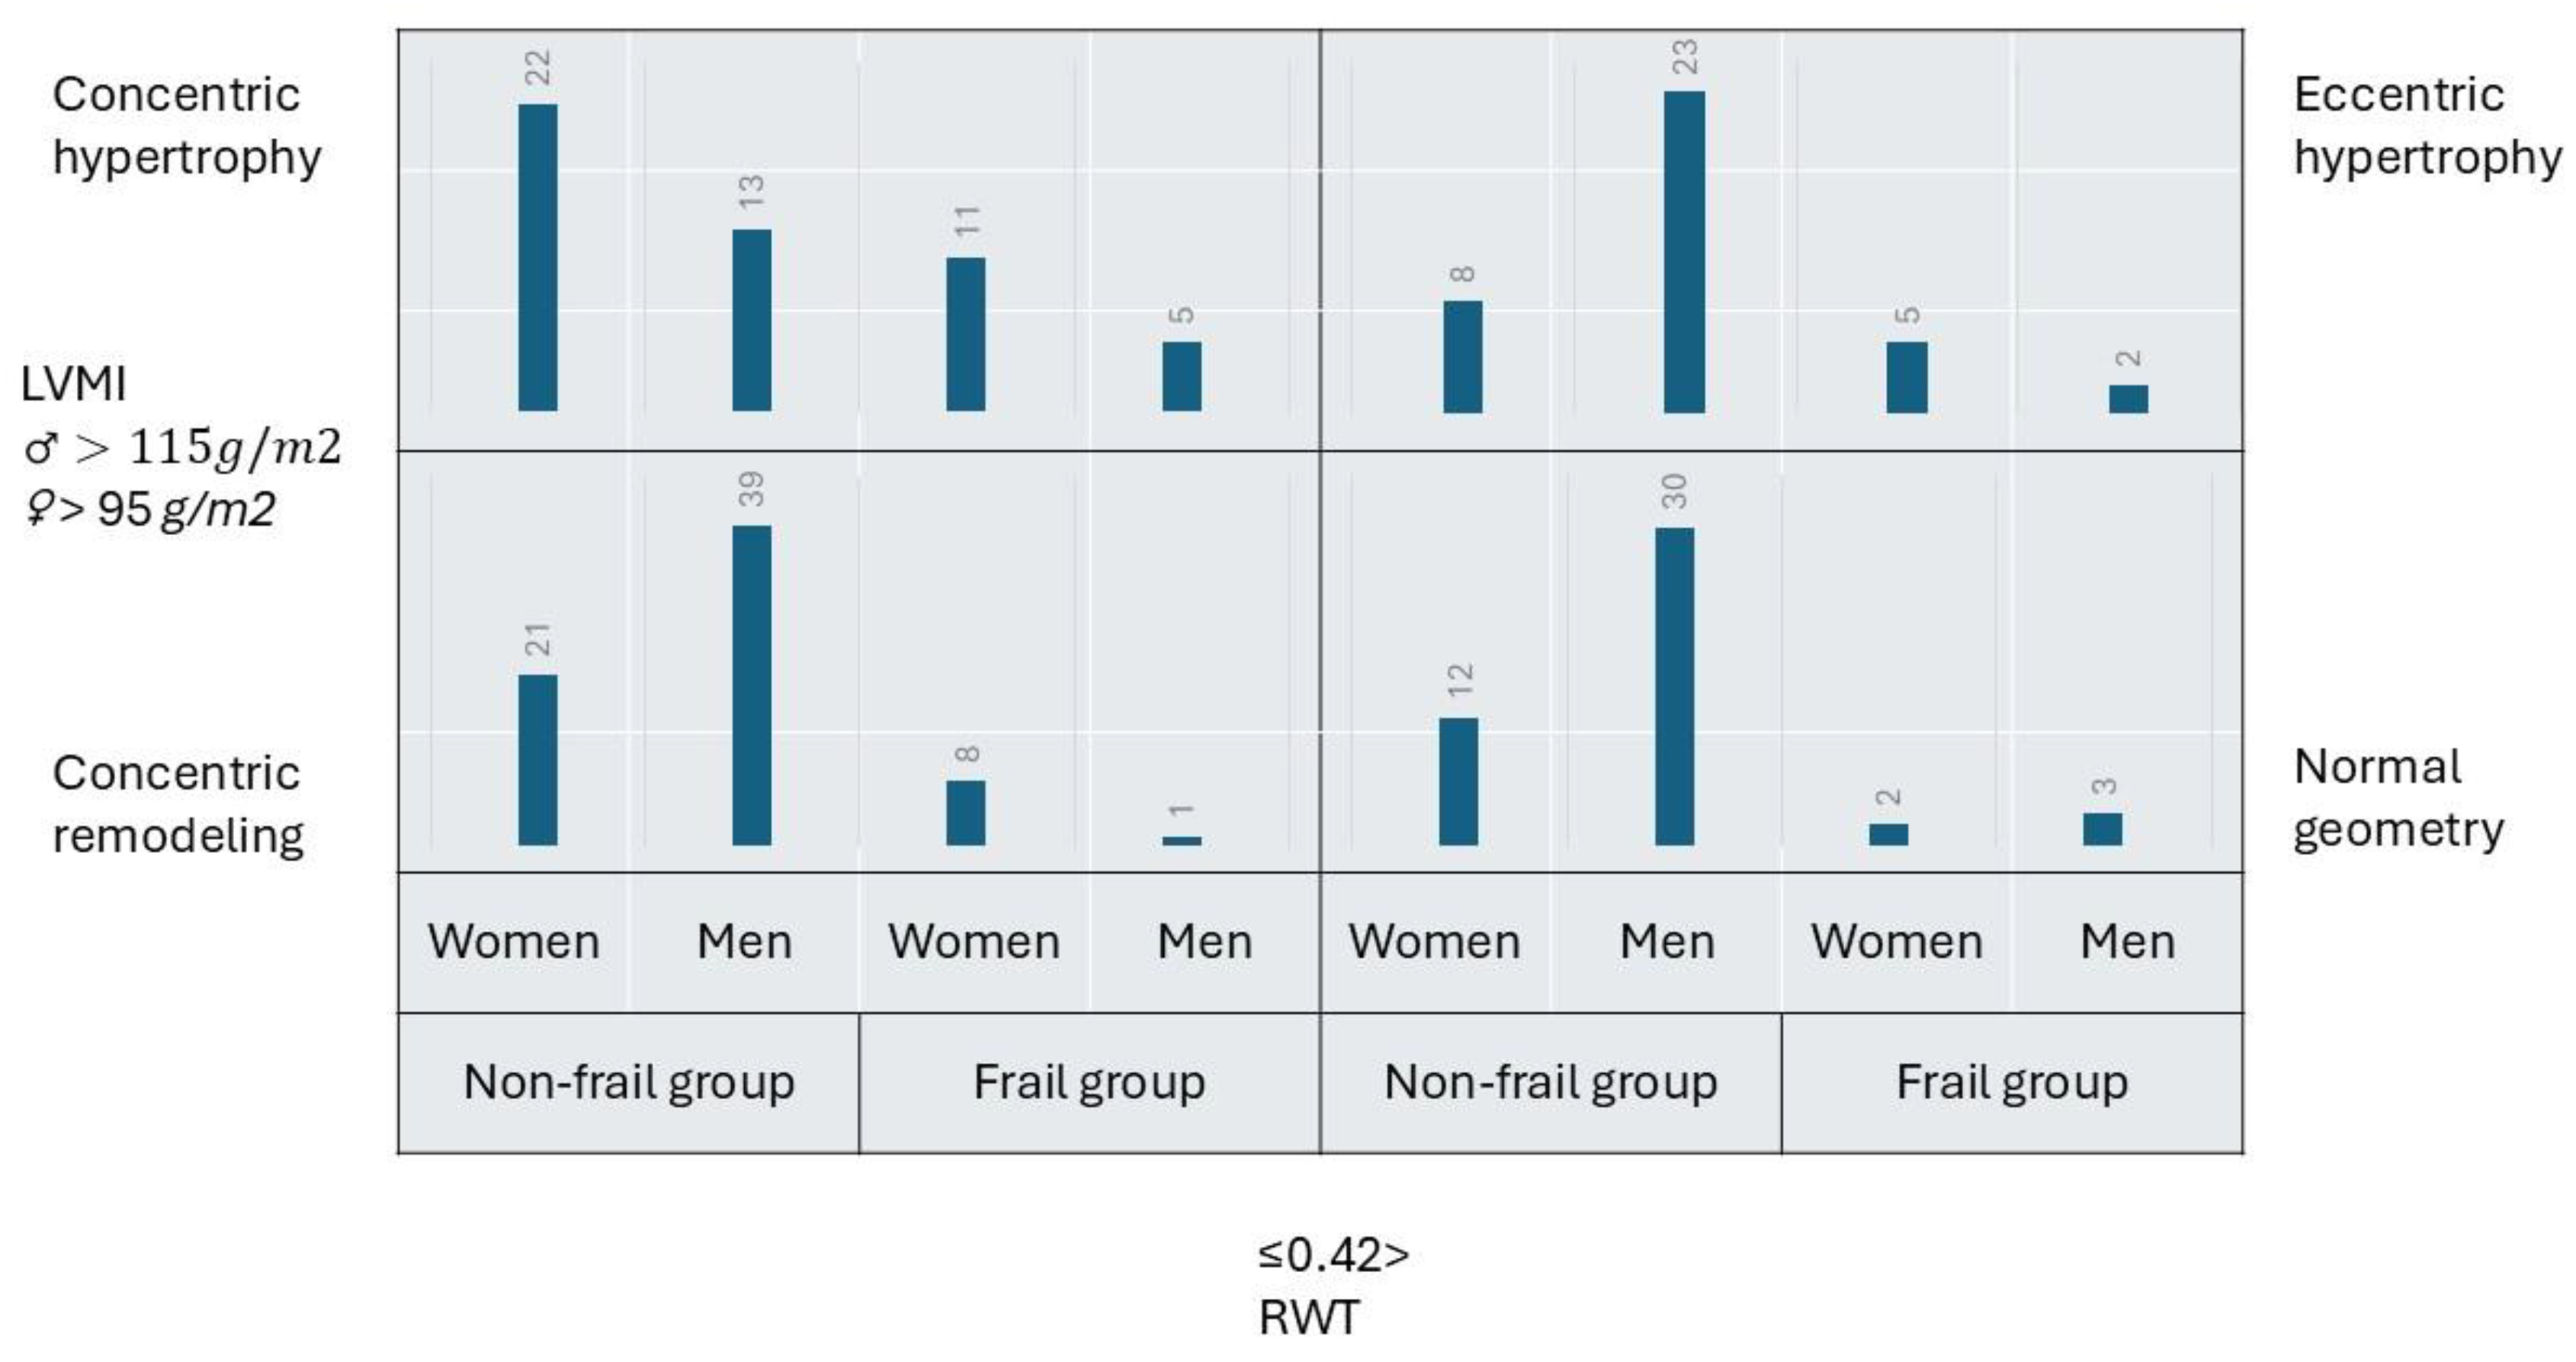
Based on the indexed left ventricular mass and relative wall thickness, five frail patients (13.5%) had normal geometry, nine (24.3%) had concentric remodeling, sixteen (43.3%) had concentric hypertrophy, and seven (18.9%) had eccentric hypertrophy. There is a shift in the proportions of men and women among frail patients with different forms of geometry. Women become two to eight times more numerous than men in eccentric, concentric hypertrophy, and concentric remodeling subgroups. Among non-frail patients, most (35.7%) fit into the concentric remodeling category. The remainder of them were distributed equally among normal geometry, concentric, and eccentric hypertrophy. Women dominated over men in the concentric hypertrophy category. Men comprised the majority of the non-frail population in normal geometry, concentric remodeling, and eccentric hypertrophy categories (
Figure 1).
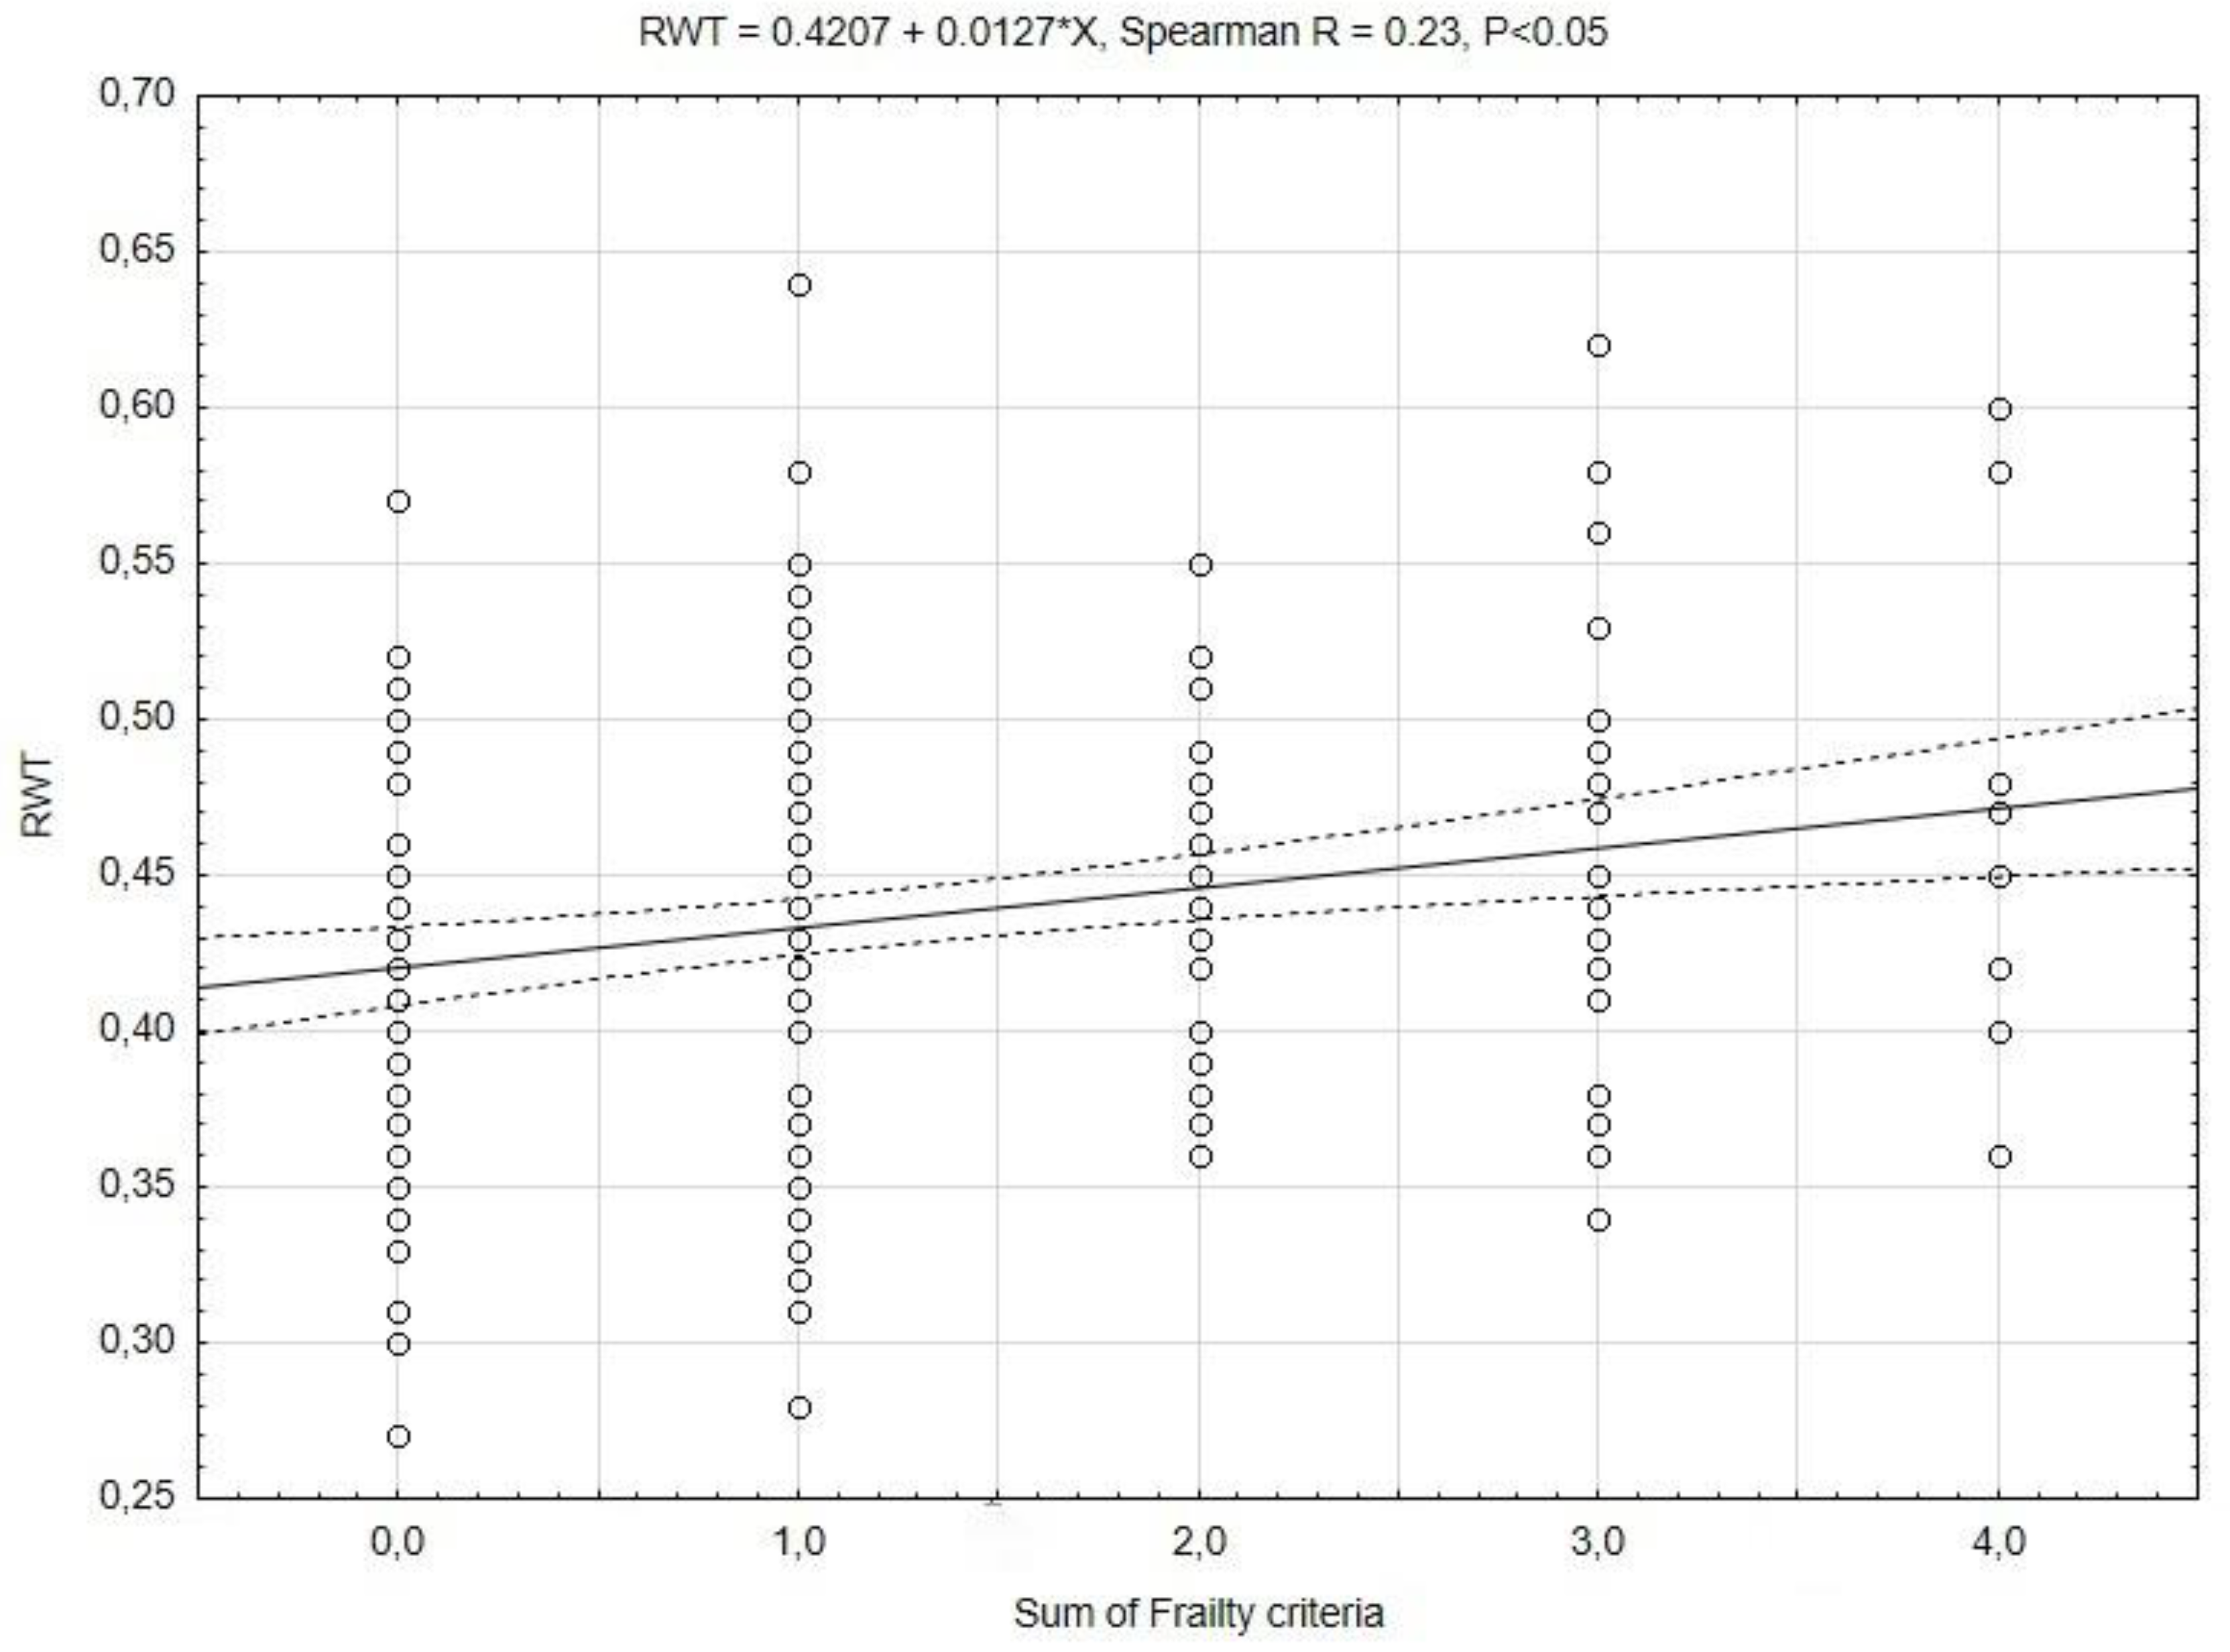
Cardiac remodeling occurs in a linear rather than a binary fashion. To reflect this process, we correlated the left ventricular dimensions, left ventricular mass, and relative wall thickness, as the dependent variables, with the sum of the frailty criteria, as the independent variable (Spearman correlation). The maximal number of frailty criteria observed in our cohort was four. The interventricular septum, posterior wall, left ventricular mass, and indexed left ventricular mass were not correlated. Left ventricle end diastolic diameter was negatively correlated with the sum of frailty criteria (LVEDD = 51.4-0.9* x, Spearman R = -0.17, P<0.05). A positive correlation was observed with relative wall thickness. This correlation is presented in
Figure 2.
3.3. Assessment of covariates
We have chosen the covariates that differed significantly between the non-frail and frail groups. Adjusting left ventricular dimensions for frailty, gender, age, weight, and pulmonary disease has identified patients’ gender and weight as independent covariates. Age was another independent covariate of posterior wall thickness (
Table 3). The three above-mentioned variables were independent covariates for left ventricular mass and left ventricular mass indexed. Frailty and gender were independently related to relative wall thickness.
In a mixed patient population including both men and women, the influence of gender and body weight on specific parameters is evident, especially in a situation when the study cohort is subclassified for frailty. A higher proportion of women is observed in the frail population; therefore, the distribution of body weight will shift downward relative to the non-frail population. Our cohort reflects this observation; moreover, frailty is independently and positively associated with relative wall thickness. To sum up, frailty predisposes women toward concentric remodeling/hypertrophy, with concentric hypertrophy being the dominant type of cardiac remodeling in frail patients.
4. Discussion
Frailty, defined by Linda Fried's phenotype frailty score, in a cohort of hospitalized patients with normal left ventricular function, is independently associated with an adverse cardiac phenotype – one characterized by increased relative wall thickness and concentric remodeling or hypertrophy.
Topriceanu et al. [
15] have utilized the Frailty Index (FI) as a measure of frailty. The frailty index counts health deficit accumulation as the ratio between the number of deficits present and the total number of deficits appraised [
12]. Only one paper compares the Fried criteria and the frailty index [
22]. Both methods assess different health and functional domains. Kappa coefficients for the Fried phenotype with FI-28 and FI-40 were 0.357 and 0.408, respectively, indicating fair agreement between the methods. However, the phenotype frailty scale and FI-28 and FI-40 differed in their predictive ability for mortality [
22]. Although Topriceanu et al. used a different method to assess frailty in patients, their results are consistent with our findings. They have found a positive association between health deficits accumulated over the life course and adverse cardiac remodeling: left ventricular hypertrophy, elevated left ventricular filling pressure, and reduced systolic function. Xi et al. [
23] assessed cardiac echo using a cross-sectional approach in a comparable Chinese population (normal left ventricular function, patients’ ages ranged from 70.5 to 76.4 for robust and frail patients, respectively, and the percentage of males decreased across the robust-to-frail groups). The authors used the phenotype frailty scale and found that frailty is independently associated with higher left ventricular mass index, a higher incidence of left ventricular hypertrophy, diastolic dysfunction, and reduced left ventricular longitudinal strain. Ramonfaur et al. [
24], based on prospective observations of the ARIC study population, reported that among older adults free of heart failure, progression in frailty and in subclinical left ventricular remodeling and diastolic dysfunction are interrelated and possibly bidirectional. Moreover, they reported that greater left ventricular mass and higher left ventricular filling pressure are associated with greater progression in frailty status, whereas transitioning from robust to prefrail or frail is associated with greater concomitant increases in left ventricular mass and filling pressure.
We have focused our research on left ventricular mass and geometry, whereas other papers document impaired left ventricular systolic and diastolic function, left atrial enlargement, or right ventricular involvement [
15,
23,
24]. It seems reasonable that frailty affects the entire heart and its function. Still, none of the papers mentioned above document the exact pathophysiologic mechanism underlying the association between frailty and heart involvement. Previous studies on the molecular mechanism of frailty have shown that frailty is accompanied by upregulation of inflammatory cytokines, especially interleukin-6 and C-reactive protein [
25,
26], a decrease in testosterone level [
27], insulin resistance [
28], and dysregulation of cytokines involved in bone and muscle metabolism, fibrosis, and vascular wall function [
29]. This creates a catabolic milieu in which muscle breakdown exceeds muscle synthesis, leading to a progressive decline in muscle mass and strength (sarcopenia) [
30]. Our early working hypothesis was that cardiac muscle is subject to the same processes as skeletal muscle, and that frail patients who weigh less will have lighter hearts. This is true for younger (18-55 years) patients who were placed on a low-calorie diet for 12 months [
31], resulting in weight loss and approximately a 6-gram reduction in left ventricular mass as assessed by magnetic resonance imaging. We have found a strong positive association between patients' weight and left ventricular mass, but this appears to be influenced by gender, as the association disappears after indexing for body surface area. The authors of the articles mentioned above [
15,
23,
24] failed either to find an association between body weight and left ventricular mass.
Increased left ventricular afterload, as in hypertension-induced pressure overload, is another trigger for left ventricular hypertrophy. We have analyzed blood pressure measured on two occasions (at admission and at frailty assessment), central arterial pressure, and central arterial stiffness, all of which were comparable across all groups. Likewise, the proportion of patients diagnosed with hypertension was similar across the groups. The percentage of hypertension in our cohort ranged from 81 to 92%, which is substantially higher than that reported for the Chinese population (51-53%) by Xi et al. [
23]. We did not include blood pressure, central arterial pressure, central arterial stiffness, or hypertension as covariates because their means and distributions were comparable across groups. Nonetheless, Xi et al. [
23] reported that frailty and hypertension are independently associated with left ventricular hypertrophy.
While it is true that cardiac muscle does not undergo changes similar to skeletal muscle, we emphasize the importance of concentric remodeling. Our frail patients may be described as those with thicker left ventricular walls and smaller left ventricular cavities than their non-frail counterparts, according to results from linear regression analyses of RWT and LVEDD. An extended analysis of the Multi-Ethnic Study of Atherosclerosis (MESA) population supports our findings [
31]. In brief, MESA participants underwent magnetic resonance and computed tomography imaging between 2010 and 2012; subsequently, between 2016 and 2018, they were assessed for frailty and functional capacity. The authors used the modified FRAIL scale, a self-reported questionnaire completed by patients, to stratify them into robust and pooled prefrail/frail subgroups. The authors have found that patients with reduced end-diastolic volume index (EDVI), increased mass volume ratio (MVR), and fibrosis (described as extracellular volume) are at increased risk of becoming frail and physically incapacitated with shorter 6-minute walking test distance covered [
31]. Another ancillary analysis of a MESA population delves deeper into the mechanistic effects of a greater extent of emphysema on CT scanning and pulmonary function on left ventricular end-diastolic volume and reduced left ventricular stroke volume [
32]. We report a slightly higher prevalence of pulmonary diseases in our patients than the MESA investigators. Although frail patients were significantly more likely to have pulmonary diseases in our cohort, including this variable in Model 3 ANCOVA did not affect the final results. It seems reasonable to include the metabolic assessment of the extracellular matrix and the mechanistic concept of “shrinking heart” into future research on frailty.
5. Conclusions
Frailty is independently associated with left ventricular wall thickening and a reduced left ventricular end-diastolic diameter, resulting in concentric remodeling or hypertrophy. This phenomenon is more pronounced in women. This adverse cardiac remodeling may serve as another phenotype feature of frailty according to the phenotype frailty criteria.
Supplementary Materials
The following supporting information can be downloaded at:
www.mdpi.com/xxx/s1, Supplementary material online – comparison of the three-point and bioimpedance methods for body composition assessment
Author Contributions
Conceptualization: S.W., and A.T.; Methodology: S.W., E.W.-H., and A.T.; Software: S.W., E.W.-H., and A.T.; Validation: E.W.-H., and A.T.; Investigation: S.W., E.W.-H., J.C., M.S., M.K., M.J., P.W., I.D., D.S. and J.B.; Writing—original draft preparation: S.W., E.W.-H., J.C., M.S., M.K., M.J., P.W., I.D., D.S., J.B., J.K.S., M.M.M., and A.T.; Writing—review and editing: J.C., M.S., M.K., M.J., P.W., I.D., D.S., J.B., J.K.S., M.M.M., and A.T.; Visualization: S.W., E.W.-H., and A.T.; Supervision: A.T.; Project administration: A.T.; Funding acquisition: A.T. All authors have read and agreed to the published version of the manuscript.
Funding
A.T. has received grants from the Medical University of Silesia: BNW-1-171/K/3/K, PCN-1-236/N/2/K, PCN-1-235/K/2/K, PCN-1-133/K/0/K, and BNW-1-141/K/5/K.
Institutional Review Board Statement
The study was conducted in accordance with the Declaration of Helsinki, and approved by the Bioethics Committee of Medical University of Silesia (decisions No KNW/0022/KB1/39/I/17 issued October 3rd, 2017, and No PCN/CBN/0022/KB1/39/II/17/22 issued February 8th, 2022).
Informed Consent Statement
Informed consent was obtained from all subjects involved in the study.
Data Availability Statement
The datasets used in the current study are available from the corresponding author on reasonable request.
Conflicts of Interest
The authors declare no conflict of interest.
References
- Aurigemma, G.P.; Gaasch, W.H. Gender differences in older patients with pressure-overload hypertrophy of the left ventricle. Cardiology 1995, 86, 310–317. [Google Scholar] [CrossRef]
- Henry, W.L.; Gardin, J.M.; Ware, J.H. Echocardiographic measurements in normal subjects from infancy to old age. Circulation 1980, 62, 1054–1061. [Google Scholar] [CrossRef] [PubMed]
- Tuzcu, E.M.; Golz, S.J.; Lever, H.M.; Salcedo, E.E. Left ventricular hypertrophy in persons age 90 years and older. Am J Cardiol 1989, 63, 237–240. [Google Scholar] [CrossRef]
- Fleg, J.L.; Strait, J. Age-associated changes in cardiovascular structure and function: a fertile milieu for future disease. Heart failure reviews 2012, 17, 545–554. [Google Scholar] [CrossRef]
- Lavie, C.J.; Ventura, H.O.; Messerli, F.H. Left ventricular hypertrophy. Its relationship to obesity and hypertension. Postgraduate medicine 1992, 91(131–132), 135-138, 141-133. [Google Scholar] [CrossRef] [PubMed]
- Artham, S.M.; Lavie, C.J.; Milani, R.V.; Patel, D.A.; Verma, A.; Ventura, H.O. Clinical impact of left ventricular hypertrophy and implications for regression. Prog Cardiovasc Dis 2009, 52, 153–167. [Google Scholar] [CrossRef] [PubMed]
- Buckinx, F.; Rolland, Y.; Reginster, J.Y.; Ricour, C.; Petermans, J.; Bruyere, O. Burden of frailty in the elderly population: perspectives for a public health challenge. Archives of public health = Archives belges de sante publique 2015, 73, 19. [Google Scholar] [CrossRef]
- Fried, L.P.; Tangen, C.M.; Walston, J.; Newman, A.B.; Hirsch, C.; Gottdiener, J.; Seeman, T.; Tracy, R.; Kop, W.J.; Burke, G.; et al. Frailty in older adults: evidence for a phenotype. J Gerontol A Biol Sci Med Sci 2001, 56, M146–M156. [Google Scholar] [CrossRef]
- Tanaka, S.; Kamiya, K.; Hamazaki, N.; Matsuzawa, R.; Nozaki, K.; Maekawa, E.; Noda, C.; Yamaoka-Tojo, M.; Matsunaga, A.; Masuda, T.; et al. Incremental Value of Objective Frailty Assessment to Predict Mortality in Elderly Patients Hospitalized for Heart Failure. Journal of cardiac failure 2018, 24, 723–732. [Google Scholar] [CrossRef]
- Gilbert, T.; Neuburger, J.; Kraindler, J.; Keeble, E.; Smith, P.; Ariti, C.; Arora, S.; Street, A.; Parker, S.; Roberts, H.C.; et al. Development and validation of a Hospital Frailty Risk Score focusing on older people in acute care settings using electronic hospital records: an observational study. The Lancet 2018, 391, 1775–1782. [Google Scholar] [CrossRef]
- Rockwood, K.; Song, X.; MacKnight, C.; Bergman, H.; Hogan, D.B.; McDowell, I.; Mitnitski, A. A global clinical measure of fitness and frailty in elderly people. CMAJ 2005, 173, 489–495. [Google Scholar] [CrossRef] [PubMed]
- Searle, S.D.; Mitnitski, A.; Gahbauer, E.A.; Gill, T.M.; Rockwood, K. A standard procedure for creating a frailty index. BMC Geriatrics 2008, 8, 24. [Google Scholar] [CrossRef] [PubMed]
- Campbell, A.J.; Buchner, D.M. Unstable disability and the fluctuations of frailty. Age Ageing 1997, 26, 315–318. [Google Scholar] [CrossRef]
- Gharacholou, S.M.; Tashiro, T.; Cha, S.S.; Scott, C.G.; Takahashi, P.Y.; Pellikka, P.A. Echocardiographic indices associated with frailty in. Am J Cardiol 2015, 116, 1591–1595. [Google Scholar] [CrossRef]
- Topriceanu, C.C.; Moon, J.C.; Hardy, R.; Chaturvedi, N.; Hughes, A.D.; Captur, G. Longitudinal birth cohort study finds that life-course frailty associates with later-life heart size and function. Sci Rep 2021, 11, 6272. [Google Scholar] [CrossRef] [PubMed]
- Nadruz, W., Jr.; Kitzman, D.; Windham, B.G.; Kucharska-Newton, A.; Butler, K.; Palta, P.; Griswold, M.E.; Wagenknecht, L.E.; Heiss, G.; Solomon, S.D.; et al. Cardiovascular Dysfunction and Frailty Among Older Adults in the Community: The ARIC Study. J Gerontol A Biol Sci Med Sci 2017, 72, 958–964. [Google Scholar] [CrossRef]
- Woloszyn-Horak, E.; Salamon, R.; Chojnacka, K.; Brzosko, A.; Bieda, L.; Standera, J.; Ploszaj, K.; Stepien, E.; Nowalany-Kozielska, E.; Tomasik, A. Frailty syndrome in daily practice of interventional cardiology ward-rationale and design of the FRAPICA trial: A STROBE-compliant prospective observational study. Medicine (Baltimore) 2020, 99, e18935. [Google Scholar] [CrossRef]
- von Elm, E.; Altman, D.G.; Egger, M.; Pocock, S.J.; Gøtzsche, P.C.; Vandenbroucke, J.P. The Strengthening the Reporting of Observational Studies in Epidemiology (STROBE) statement: guidelines for reporting observational studies. Ann Intern Med 2007, 147, 573–577. [Google Scholar] [CrossRef]
- Jackson, A.S.; Pollock, M.L. Practical Assessment of Body Composition. The Physician and sportsmedicine 1985, 13, 76–90. [Google Scholar] [CrossRef]
- Lang, R.M.; Badano, L.P.; Mor-Avi, V.; Afilalo, J.; Armstrong, A.; Ernande, L.; Flachskampf, F.A.; Foster, E.; Goldstein, S.A.; Kuznetsova, T.; et al. Recommendations for Cardiac Chamber Quantification by Echocardiography in Adults: An Update from the American Society of Echocardiography and the European Association of Cardiovascular Imaging. European Heart Journal - Cardiovascular Imaging 2015, 16, 233–271. [Google Scholar] [CrossRef]
- Mancia, G.; Fagard, R.; Narkiewicz, K.; Redon, J.; Zanchetti, A.; Bohm, M.; Christiaens, T.; Cifkova, R.; De Backer, G.; Dominiczak, A.; et al. 2013 ESH/ESC guidelines for the management of arterial hypertension: the Task Force for the Management of Arterial Hypertension of the European Society of Hypertension (ESH) and of the European Society of Cardiology (ESC). Eur Heart J 2013, 34, 2159–2219. [Google Scholar] [CrossRef] [PubMed]
- Fan, J.N.; Sun, Z.J.; Yu, C.Q.; Guo, Y.; Sun, D.J.Y.; Pei, P.; Du, H.D.; Chen, J.S.; Chen, Z.M.; Lyu, J.; et al. Comparison of Fried phenotype and frailty index and their associations with risk of mortality. Zhonghua Liu Xing Bing Xue Za Zhi 2021, 42, 1179–1187. [Google Scholar] [CrossRef] [PubMed]
- Xi, L.; Xuemei, Z.; Ling, Y.; Changchun, C.; Zhuo, H.; Jinyang, Q.; Xin, W. Correlation between frailty and cardiac structure and function in echocardiography in elderly patients with normal ejection fraction. Aging clinical and experimental research 2023, 35, 775–784. [Google Scholar] [CrossRef]
- Ramonfaur, D.; Skali, H.; Claggett, B.; Windham, B.G.; Palta, P.; Kitzman, D.; Ndumele, C.; Konety, S.; Shah, A.M. Bidirectional Association Between Frailty and Cardiac Structure and Function: The Atherosclerosis Risk in Communities Study. Journal of the American Heart Association 2023, 12, e029458. [Google Scholar] [CrossRef]
- Walston, J.; McBurnie, M.A.; Newman, A.; Tracy, R.P.; Kop, W.J.; Hirsch, C.H.; Gottdiener, J.; Fried, L.P.; Cardiovascular Health, S. Frailty and activation of the inflammation and coagulation systems with and without clinical comorbidities: results from the Cardiovascular Health Study. Archives of internal medicine 2002, 162, 2333–2341. [Google Scholar] [CrossRef]
- Schaap, L.A.; Pluijm, S.M.; Deeg, D.J.; Harris, T.B.; Kritchevsky, S.B.; Newman, A.B.; Colbert, L.H.; Pahor, M.; Rubin, S.M.; Tylavsky, F.A.; et al. Higher inflammatory marker levels in older persons: associations with 5-year change in muscle mass and muscle strength. J Gerontol A Biol Sci Med Sci 2009, 64, 1183–1189. [Google Scholar] [CrossRef]
- Travison, T.G.; Nguyen, A.H.; Naganathan, V.; Stanaway, F.F.; Blyth, F.M.; Cumming, R.G.; Le Couteur, D.G.; Sambrook, P.N.; Handelsman, D.J. Changes in reproductive hormone concentrations predict the prevalence and progression of the frailty syndrome in older men: the concord health and ageing in men project. J Clin Endocrinol Metab 2011, 96, 2464–2474. [Google Scholar] [CrossRef] [PubMed]
- Barzilay, J.I.; Blaum, C.; Moore, T.; Xue, Q.L.; Hirsch, C.H.; Walston, J.D.; Fried, L.P. Insulin resistance and inflammation as precursors of frailty: the Cardiovascular Health Study. Archives of internal medicine 2007, 167, 635–641. [Google Scholar] [CrossRef]
- Korzonek-Szlacheta, I.; Hudzik, B.; Zubelewicz-Szkodzińska, B.; Czuba, Z.P.; Szlacheta, P.; Tomasik, A. The Association between Circulating Cytokines and Body Composition in Frail Patients with Cardiovascular Disease. Nutrients 2024, 16, 1227. [Google Scholar] [CrossRef]
- Boirie, Y. Physiopathological mechanism of sarcopenia. J Nutr Health Aging 2009, 13, 717–723. [Google Scholar] [CrossRef]
- Sesso, J.; Walston, J.; Bandeen-Roche, K.; Wu, C.; Bertoni, A.G.; Shah, S.; Lima, J.A.C.; Ambale-Venkatesh, B. Association of Cardiovascular Fibrosis, Remodeling, and Dysfunction With Frailty, Prefrailty, and Functional Performance: The Multi-Ethnic Study of Atherosclerosis. J Gerontol A Biol Sci Med Sci 2024, 79. [Google Scholar] [CrossRef] [PubMed]
- Barr, R.G.; Bluemke, D.A.; Ahmed, F.S.; Carr, J.J.; Enright, P.L.; Hoffman, E.A.; Jiang, R.; Kawut, S.M.; Kronmal, R.A.; Lima, J.A.C.; et al. Percent Emphysema, Airflow Obstruction, and Impaired Left Ventricular Filling. New England Journal of Medicine 2010, 362, 217–227. [Google Scholar] [CrossRef] [PubMed]
|
Disclaimer/Publisher’s Note: The statements, opinions and data contained in all publications are solely those of the individual author(s) and contributor(s) and not of MDPI and/or the editor(s). MDPI and/or the editor(s) disclaim responsibility for any injury to people or property resulting from any ideas, methods, instructions or products referred to in the content. |
© 2025 by the authors. Licensee MDPI, Basel, Switzerland. This article is an open access article distributed under the terms and conditions of the Creative Commons Attribution (CC BY) license (http://creativecommons.org/licenses/by/4.0/).