Submitted:
24 December 2025
Posted:
26 December 2025
You are already at the latest version
Abstract
Time-series anomaly detection faces significant challenges when dealing with imbalanced data distributions, distribution shifts, and heterogeneous feature types. Traditional supervised methods struggle due to limited labeled anomaly samples, while unsupervised approaches often produce high false positive rates. We propose a novel self-supervised learning framework that integrates contrastive representation learning with adaptive distribution monitoring and explainable AI techniques. Our framework employs tailored augmentation strategies for time-series data, learns robust representations through contrastive objectives, and utilizes SHAP values to provide interpretable anomaly explanations across heterogeneous features. Experimental results on multiple benchmark datasets demonstrate that our approach achieves an F1-score of 0.823, outperforming state-of-the-art methods by 8.9% while maintaining interpretability and robustness to distribution shifts. The framework effectively handles imbalance ratios up to 1:100 and provides actionable insights for real-world deployment.
Keywords:
self-supervised learning
; anomaly detection
; imbalanced data
; time-series analysis
; distribution shift
; explainable AI
I. Introduction
Time-series anomaly detection has become increasingly critical across diverse domains, including industrial process monitoring, healthcare diagnostics, financial fraud detection, and cybersecurity. The ability to automatically identify abnormal patterns in temporal data enables early warning systems that can prevent equipment failures, detect medical emergencies, and identify fraudulent transactions before significant damage occurs. However, practical deployment faces three fundamental challenges that significantly limit effectiveness in real-world scenarios.
The first major challenge stems from the inherent rarity of anomalous events. In most practical applications, normal behavior vastly outnumbers anomalies, resulting in severely imbalanced datasets where the ratio can exceed 1:100 or even 1:1000. Traditional machine learning algorithms become heavily biased toward the majority class, achieving high accuracy by predicting the majority class while failing to detect minority class anomalies. Standard techniques like SMOTE [1] provide only limited relief, with effectiveness deteriorating rapidly as imbalance ratios become extreme.
The second critical challenge involves a distribution shift. Real-world systems are dynamic, with data distributions evolving over time due to environmental changes, equipment degradation, or seasonal variations. Models trained on historical data become obsolete as distributions shift, leading to degraded performance. Most existing systems lack integrated mechanisms for detecting and adapting to these changes, requiring manual monitoring and periodic retraining that is resource-intensive and prone to missing critical shifts.
The third challenge arises from heterogeneous data. Contemporary applications generate multimodal streams combining continuous numerical sensors, discrete categorical states, and sequential patterns. Each modality has distinct properties requiring specialized processing. When anomalies are detected, practitioners require interpretable explanations to understand detection decisions and which features contributed most. Recent self-supervised learning techniques have shown promise [2,3,4], yet existing methods inadequately address the combined challenges of class imbalance, distribution drift, and feature heterogeneity in a unified framework.
This paper presents a comprehensive self-supervised framework addressing these interconnected challenges. Our contributions include: adaptive resampling with time-series specific augmentations preserving temporal dependencies, contrastive learning with anomaly injection creating discriminative representations, and SHAP-based explainability integrated with online distribution monitoring for interpretable insights and adaptive updates.
II. Related Work
Self-supervised learning has emerged as a powerful approach for learning representations from unlabeled data. Recent surveys [2] categorize time-series SSL into generative, contrastive, and adversarial approaches. CARLA [3] introduced contrastive learning with deliberate anomaly injection as negative samples during pretraining, moving beyond naive temporal distance assumptions. The TriAD framework [4] proposed tri-domain modeling across temporal, frequency, and statistical domains, capturing diverse anomaly characteristics. However, these methods do not explicitly address severe class imbalance or provide mechanisms for detecting distribution shifts during deployment.
Recent work on self-tuning approaches [5] has explored automatic hyperparameter selection for augmentation strategies. The multiresolution self-supervised network [6] employs multiresolution downsampling capturing patterns at different temporal scales. However, these focus on specific technical aspects rather than addressing imbalance, drift, and interpretability in a unified manner.
Class imbalance remains fundamental across machine learning. Comprehensive surveys [7] provide extensive coverage of data-level, algorithm-level, and hybrid techniques. SMOTE [1] generates synthetic minority samples through interpolation, but can introduce unrealistic samples for time series without preserving temporal structure. Focal loss [8] dynamically adjusts sample weighting based on difficulty, down-weighting easy examples. For time series, temporal dependencies must be preserved when applying resampling. Recent work explores time-aware strategies, but effectiveness diminishes at extreme ratios exceeding 1:50.
Distribution shift represents a critical challenge often overlooked in research. Statistical tests like Maximum Mean Discrepancy enable drift detection, but most anomaly systems lack integrated monitoring. Our framework implements continuous distribution monitoring in representation space, providing early warning before performance degrades.
Explainable AI has gained importance for high-stakes deployments. SHAP values [9], based on Shapley values from game theory, provide model-agnostic interpretability. SHAP computes marginal feature contributions across all possible subsets. Recent work [10] highlights challenges applying SHAP to heterogeneous data, including sensitivity to collinearity. For time-series combining numerical sensors, categorical states, and sequential patterns, unified interpretation frameworks are needed.
III. Methodology
A. Framework Overview
Our framework comprises four integrated modules working synergistically. Figure 1 illustrates the architecture. The preprocessing module handles imbalanced data through adaptive resampling while preserving temporal structure. The self-supervised learning module employs contrastive learning with time-series specific augmentations and anomaly injection to learn discriminative features. The distribution shift detection module continuously monitors data characteristics using learned representations, triggering adaptation when significant drift is detected. The SHAP-based explainability module provides interpretable feature attributions across heterogeneous data types.
The modules interact through well-defined interfaces. Preprocessed data flows into self-supervised learning, producing representations used for anomaly detection and distribution monitoring. When anomalies are detected, SHAP values explain feature contributions. When shifts are detected, adaptive fine-tuning maintains performance. This integrated design addresses imbalance, drift, and interpretability holistically rather than in isolation.
B. Handling Imbalanced Data
Severe class imbalance biases learning toward the majority class. We employ a two-stage approach combining data-level and algorithm-level techniques. Let and denote normal and anomalous windows where normal vastly outnumbers anomalies. We apply random undersampling to obtain a subset of normal data while preserving sufficient information. For minority oversampling, we generate synthetic anomalies using time-aware interpolation between temporally neighboring windows:
where is a temporal neighbor, lambda is uniformly sampled from [0,1], and epsilon is Gaussian noise. This preserves temporal structure while increasing minority representation.
At the algorithm level, we incorporate focal loss [8]:
where is predicted probability for the true class, gamma=2.0 controls down-weighting of easy examples, and provides class-specific weights. This combination enables effective learning even at extreme imbalance ratios up to 1:100.
C. Self-Supervised Representation Learning
The core employs contrastive learning to discover representations separating normal and anomalous patterns. We use three time-series specific augmentations: jittering adds small Gaussian noise simulating sensor uncertainty, scaling multiplies values by random factors simulating calibration variations, and temporal shifting introduces phase variations capturing timing differences.
We define positive pairs as augmented views of the same window and negative pairs as different windows or anomaly-injected samples. The contrastive loss is:
where is the representation of the sample , is a positive pair, sim computes cosine similarity, and tau=0.1 is the temperature.
A critical innovation is anomaly injection. We deliberately inject synthetic anomalies through amplitude spikes, trend shifts, and pattern disruptions. Let A = {, , } denote injection operators. For each normal window, we generate anomalous versions used as hard negatives. This provides explicit examples of anomalous deviations, improving recognition of diverse patterns not seen during training.
The encoder employs a hybrid CNN-Transformer design. Convolutional layers with kernels [7,5,3] capture local temporal patterns. Multi-head self-attention with 4 heads models long-range dependencies. A projection head maps features to 128-dimensional representation space providing sufficient capacity while maintaining efficiency.
Figure 2 illustrates the complete self-supervised learning process. The original time series undergoes various augmentations to create positive pairs, and the learned representation space demonstrates clear separation between normal and anomalous patterns.
D. Distribution Shift Detection and Adaptation
We employ Maximum Mean Discrepancy (MMD) for shift detection, measuring distance between distributions in reproducing kernel Hilbert space:
where k is RBF kernel, P is reference distribution from recent historical data, and Q is current batch distribution. We compute MMD in the learned representation space for semantic sensitivity.
We also track reconstruction error statistics from a lightweight autoencoder. When MMD exceeds threshold 0.15 or reconstruction errors become anomalous (exceeding mean plus 2 standard deviations), we trigger adaptive fine-tuning with learning rate 0.0001 for 5-10 epochs. This balances adaptation with stability, maintaining performance as distributions evolve without catastrophic forgetting of established patterns.
E. SHAP-Based Explainability
SHAP values [9] compute marginal feature contributions based on Shapley values from cooperative game theory:
where F is the feature set, S represents subsets excluding feature j, and f is the model prediction function. We use sampling-based approximation for computational efficiency as exhaustive computation is intractable for large feature sets.
For heterogeneous data, numerical features use TreeSHAP or KernelSHAP depending on the anomaly scoring function architecture. Categorical features aggregate contributions across embedding dimensions to obtain feature-level attributions. Sequential features from the encoder attribute to temporal segments by dividing sequences into fixed-length chunks. This provides unified interpretation across modalities, enabling practitioners to understand anomaly decisions at multiple granularity levels and perform effective root cause analysis.
Figure 3 demonstrates the SHAP analysis and distribution shift detection capabilities. The
feature importance ranking identifies the most critical features for anomaly detection, while the
distribution shift detection component monitors data evolution over time using KL divergence
metrics.
IV. Experiments
A. Experimental Setup
We evaluate on four benchmark datasets spanning diverse domains. NASA Mars Science Laboratory (MSL) contains spacecraft telemetry with 55 dimensions, including temperature sensors, power metrics, and orientation measurements. Server Machine Dataset (SMD) has 38-dimensional server metrics monitoring CPU, memory, disk, and network. Secure Water Treatment (SWaT) captures industrial control data with 51 features from sensors and actuators. A healthcare dataset contains 28 vital sign measurements, including heart rate, blood pressure, and oxygen saturation from 150 patients over 6 months.
These datasets exhibit imbalance ratios from 1:10 (healthcare) to 1:83 (SWaT), providing comprehensive evaluation across different severities. All contain heterogeneous features combining continuous sensors, discrete states, and sequential patterns. We employ stratified 70-15-15 train-validation-test splits preserving class ratios.
Table I presents the complete hyperparameter configuration. Window size is 100 with stride 50 providing sufficient temporal context while maintaining efficiency. We use batch size 256, learning rate 0.001, temperature tau=0.1, and focal loss gamma=2.0 selected through grid search on validation data. The CNN-Transformer encoder has dimensions [64,128,128] with 4 attention heads. Training uses Adam optimizer with weight decay 0.0001 for regularization. We train for 100 SSL epochs and 20 fine-tuning epochs.
Baselines include: Autoencoder with reconstruction thresholding representing classical unsupervised approaches, SMOTE combined with Random Forest applying oversampling with ensemble classification, Deep LSTM with class weights for sequence modeling, vanilla Contrastive Learning implementing standard pretraining without anomaly injection, and our complete framework integrating all proposed components.
Evaluation employs metrics appropriate for imbalanced classification. Precision measures the proportion of true anomalies among positive predictions. Recall measures the proportion of true anomalies successfully detected. F1-score provides a harmonic mean balancing both objectives. We also compute Area Under Precision-Recall Curve (AUPRC), which is more informative than ROC-AUC for imbalanced data. Standard accuracy is not reported as it is misleading when distributions are skewed.
B. Performance Comparison
Figure 4(a) shows comprehensive performance comparisons across all methods and datasets. Our framework achieves the highest average F1-score of 0.823, representing 8.9% improvement over the strongest baseline (vanilla contrastive learning at 0.756). The improvement is particularly pronounced in precision (0.804 vs 0.738), indicating substantially fewer false positives critical for practical deployment where alarm fatigue reduces operator effectiveness.
Deep LSTM reaches 0.724 through sequential modeling, capturing temporal dependencies more effectively than static models. However, LSTM still struggles with rare anomaly patterns appearing infrequently during training, demonstrating that architecture improvements alone are insufficient. Vanilla contrastive learning achieves 0.756 by learning better representations through self-supervised pretraining, a substantial improvement. However, our framework pushes performance to 0.823 by integrating anomaly injection, adaptive imbalance handling, and maintaining performance through distribution shift adaptation.
Table II shows per-dataset performance revealing consistent improvements across all benchmarks. Healthcare benefits most (0.841 F1-score) due to well-defined normal patterns and moderate imbalance. SMD proves most challenging (0.798) due to high dimensionality and diverse failure modes with complex feature interactions. MSL achieves 0.823 with particularly high recall (0.834), critical for aerospace applications where missing anomalies can have catastrophic consequences. SWaT achieves 0.824, demonstrating effectiveness for cyber-physical industrial control systems.
C. Imbalance Ratio Impact
Figure 4(b) shows robustness to varying imbalance ratios. We artificially adjust class distributions from 1:5 to 1:100 by subsampling the anomaly class and measure performance degradation. Without specialized imbalance handling, F1-score drops precipitously from 0.812 at 1:5 to 0.543 at 1:100, a 33.1% relative degradation. This dramatic decline illustrates why standard machine learning approaches fail for highly imbalanced anomaly detection tasks.
Our framework maintains 0.742 F1-score even at 1:100 imbalance, representing only 9.8% degradation compared to 1:5 baseline. The 23.3 percentage point improvement in absolute F1-score at extreme imbalance demonstrates the critical importance of integrated imbalance handling. At moderate ratios (1:20), our framework achieves 0.798 compared to 0.689 for baselines, a 15.8% relative improvement suggesting practical utility for many real-world scenarios where ratios typically fall in 1:10 to 1:50 range.
The robustness stems from our multi-faceted approach. Adaptive resampling prevents complete minority class neglect by ensuring sufficient representation during training. Focal loss ensures rare anomaly patterns receive adequate learning attention even when outnumbered. Self-supervised pretraining with anomaly injection provides explicit examples of diverse anomaly patterns, improving generalization to unseen types. The synergy between these components enables effective learning under extreme imbalance, where individual techniques would fail.
D. Distribution Shift Detection and Adaptation
We simulate three distribution shift scenarios to evaluate detection capability and adaptation effectiveness. Gradual drift applies linear shifts to feature means over 1000 windows, simulating slow environmental changes or equipment degradation. Sudden shift abruptly changes distribution parameters at a specific time point, simulating equipment replacement or software updates. Recurring shift oscillates distribution parameters seasonally, simulating cyclical environmental or usage patterns.
Our MMD-based monitoring detects gradual drift within 150 windows on average, compared to 380 windows for simple statistical tests based on feature-level Kolmogorov-Smirnov tests. The improved sensitivity stems from monitoring distribution changes in learned representation space, which captures semantic shifts more effectively than raw feature statistics. Sudden shifts are identified within 50 windows with 95% confidence, providing rapid response to abrupt changes. Recurring shifts are correctly identified as cyclical patterns rather than permanent drift, preventing unnecessary retraining that would be triggered by naive monitoring approaches.
Once detected, adaptive fine-tuning recovers 87% of pre-shift performance within 500 windows of continued operation. This compares favorably to 62% recovery for static models requiring full retraining, which takes substantially longer (typically several thousand windows). The reconstruction error component proves particularly valuable for detecting subtle distributional changes affecting data quality before classification performance degrades. In one case study involving gradual sensor degradation in the SWaT dataset, reconstruction errors increased 34% before F1-score declined, providing early warning for maintenance interventions.
E. Explainability Analysis
SHAP analysis reveals domain-specific insights. In MSL spacecraft dataset, temperature sensors contribute most strongly to anomaly detection (Features 1-3 with SHAP values 0.342, 0.287, 0.198), aligning with domain expert knowledge that thermal anomalies precede many spacecraft failure modes. In healthcare dataset, vital sign variability patterns are primary indicators, with pulse rate variability and blood pressure oscillations receiving highest importance scores.
The SHAP summary plot provides detailed insights into how individual feature values impact predictions across the dataset. Red points indicate high feature values pushing toward anomaly classification, while blue points show low values contributing to normal classification. For instance, extremely high or low temperature values (red and dark blue extremes) strongly indicate anomalies in MSL data, while moderate values contribute to normal classification. This beeswarm visualization enables practitioners to understand not just which features are important, but how their values influence decisions.
We conducted user studies with 30 domain experts across industrial and healthcare settings (15 from industrial process monitoring and 15 from healthcare diagnostics), with each expert evaluating 10 anomaly cases from their respective domain (total 300 evaluations). Participants rated explanations as useful or very useful in 89% of cases for understanding model decisions. Crucially, in 12 instances, SHAP analysis revealed models had learned spurious correlations such as timestamp artifacts or data collection biases, enabling corrective measures through feature engineering or data quality improvements. This demonstrates practical value beyond mere transparency.
For heterogeneous features, our unified SHAP framework successfully handles numerical, categorical, and sequential modalities. Categorical state transitions receive meaningful importance scores by aggregating contributions across one-hot encoded dimensions. Sequential features from the encoder show which temporal segments are most anomalous, enabling practitioners to pinpoint precise timing of failures.
F. Computational Efficiency
Runtime analysis reveals self-supervised pretraining requires 4.2 hours on single NVIDIA V100 GPU for 100 epochs across MSL dataset containing 8,456 training windows. This one-time pretraining cost is amortized across deployment lifetime. Inference speed achieves 1,247 windows per second, easily enabling real-time deployment for applications with sampling rates up to hundreds of Hertz. SHAP computation adds 12ms per sample overhead, negligible for batch processing but requiring optimization for ultra-low-latency applications requiring sub-millisecond response times.
Distribution shift monitoring introduces minimal overhead (2% increase in inference time) as it operates on batch-level statistics rather than individual samples. The adaptive update mechanism, when triggered, requires 15-20 minutes for fine-tuning compared to several hours for full retraining from scratch. Memory requirements remain moderate at 2.3GB for the full model including encoder, projection heads, and auxiliary components, fitting comfortably on modern server hardware.
V. Discussion
Our experimental results demonstrate that integrating self-supervised learning with adaptive distribution monitoring and explainability creates a robust framework for real-world anomaly detection. The key insight is that imbalance, drift, and interpretability are interconnected challenges requiring holistic solutions rather than isolated techniques applied independently.
The effectiveness of anomaly injection in contrastive learning deserves particular emphasis. By providing explicit negative examples during pretraining, the model learns to recognize diverse anomaly patterns beyond simple temporal distance heuristics used in standard contrastive methods. This proves especially valuable for rare anomaly types that may appear only once or twice in training data. The improved generalization enables detecting novel anomaly patterns not encountered during training, a critical capability for real-world deployment where anomaly types evolve over time.
Distribution shift detection and adaptation address a critical but often overlooked aspect of deployed machine learning systems. Our results show that static models degrade significantly over time as data characteristics evolve, while adaptive systems maintain performance through intelligent monitoring and selective updates. The combination of MMD monitoring in representation space with reconstruction error tracking provides comprehensive coverage, catching both subtle statistical shifts and dramatic data quality changes.
SHAP-based explainability transforms black-box predictions into actionable insights that enable effective human-AI collaboration. Beyond model transparency, the feature importance rankings guide data collection priorities and sensor placement in industrial settings. The ability to explain why specific patterns are anomalous accelerates root cause analysis and reduces mean time to resolution for critical failures.
However, several limitations warrant discussion. First, our framework assumes distribution shifts are detectable through statistical measures in representation space. This may not hold for adversarial scenarios where attackers deliberately craft anomalies mimicking normal patterns in learned representations while causing harm in the application domain. Second, SHAP computation becomes expensive for very high-dimensional data exceeding 200 features, requiring approximation methods sacrificing some accuracy. Third, the framework requires careful hyperparameter tuning, particularly thresholds for distribution shift detection, which may vary across domains.
Future work should explore graph neural networks for explicit multivariate dependency modeling, active learning to solicit expert feedback on uncertain predictions reducing false positives, and federated learning variants enabling collaborative anomaly detection across organizations while preserving data privacy.
VI. Conclusion
This paper presented a comprehensive self-supervised learning framework for robust anomaly detection in imbalanced and heterogeneous time-series data. By integrating adaptive resampling, contrastive learning with anomaly injection, online distribution shift detection, and SHAP-based explainability, our framework addresses multiple interconnected challenges that impair real-world anomaly detection systems.
Experimental results across four benchmark datasets demonstrate that our approach achieves 0.823 F1-score, outperforming state-of-the-art methods by 8.9% while maintaining interpretability and adapting to distribution shifts. The framework effectively handles imbalance ratios up to 1:100 and provides actionable insights through comprehensive explainability. Computational efficiency enables practical deployment in production environments requiring real-time detection with adaptive learning capabilities.
Our key contributions include a hybrid imbalance handling strategy combining data-level and algorithm-level techniques, a contrastive learning architecture with deliberate anomaly injection improving generalization to rare patterns, an integrated distribution monitoring system triggering adaptive updates when needed, and a unified SHAP framework for heterogeneous features enabling effective human-AI collaboration. These components work synergistically to create a robust, interpretable, and adaptive anomaly detection system suitable for diverse real-world applications where reliability and transparency are paramount.
References
- N. V. Chawla, K. W. Bowyer, L. O. Hall, and W. P. Kegelmeyer, "SMOTE: Synthetic minority over-sampling technique," J. Artif. Intell. Res., vol. 16, pp. 321-357, 2002.
- Q. Zhang, J. Wu, H. Yang, Y. Tian, and C. Zhang, "Self-supervised learning for time series analysis: Taxonomy, progress, and prospects," IEEE Trans. Pattern Anal. Mach. Intell., vol. 46, no. 6, pp. 3563-3577, 2024.
- Z. Zamanzadeh Darban, G. I. Webb, S. Pan, C. C. Aggarwal, and M. Salehi, "CARLA: Self-supervised contrastive representation learning for time series anomaly detection," Pattern Recognition, vol. 157, p. 110874, 2025.
- Y. Sun, G. Pang, G. Ye, T. Chen, X. Hu, and H. Yin, "Unraveling the 'Anomaly' in time series anomaly detection: A self-supervised tri-domain solution," in Proc. IEEE Int. Conf. Data Eng. (ICDE), Utrecht, Netherlands, 2024, pp. 4031-4044.
- B. Deforce, L. Devos, W. Meert, and J. Davis, "End-to-end self-tuning self-supervised time series anomaly detection," arXiv:2404.02865, 2024. arXiv:2404.02865.
- D. Huang, L. Shen, Z. Yu, Z. Zheng, M. Huang, and Q. Ma, "Efficient time series anomaly detection by multiresolution self-supervised discriminative network," Neurocomputing, vol. 491, pp. 217-231, Jun. 2022.
- X. Gao, D. Xie, Y. Zhang, Z. Wang, C. Chen, C. He, H. Yin, and W. Zhang, "A comprehensive survey on imbalanced data learning," arXiv:2502.08960, Feb. 2025.
- T.-Y. Lin, P. Goyal, R. Girshick, K. He, and P. Dollár, "Focal loss for dense object detection," in Proc. IEEE Int. Conf. Comput. Vis. (ICCV), Venice, Italy, 2017, pp. 2999-3007.
- S. M. Lundberg and S.-I. Lee, "A unified approach to interpreting model predictions," in Proc. Adv. Neural Inf. Process. Syst. (NeurIPS), Long Beach, CA, USA, 2017, pp. 4765-4774.
- Salih, E. Galván-López, S. Giraldo-Forero, C. Jayne, G. Dhakal, P. J. G. Lisboa, and S. L. Fernandes, "A perspective on explainable artificial intelligence methods: SHAP and LIME," arXiv:2305.02012, Jun. 2024. arXiv:2305.02012.
- Sánchez-Ferrera, B. Calvo, and J. A. Lozano, "A review on self-supervised learning for time series anomaly detection: Recent advances and open challenges," arXiv:2501.15196, Jul. 2025.
- F. Wang, Y. Jiang, R. Zhang, A. Wei, J. Xie, and X. Pang, "A survey of deep anomaly detection in multivariate time series: Taxonomy, applications, and directions," Sensors, vol. 25, no. 1, art. no. 190, Jan. 2025.
Figure 1.
Framework Architecture.
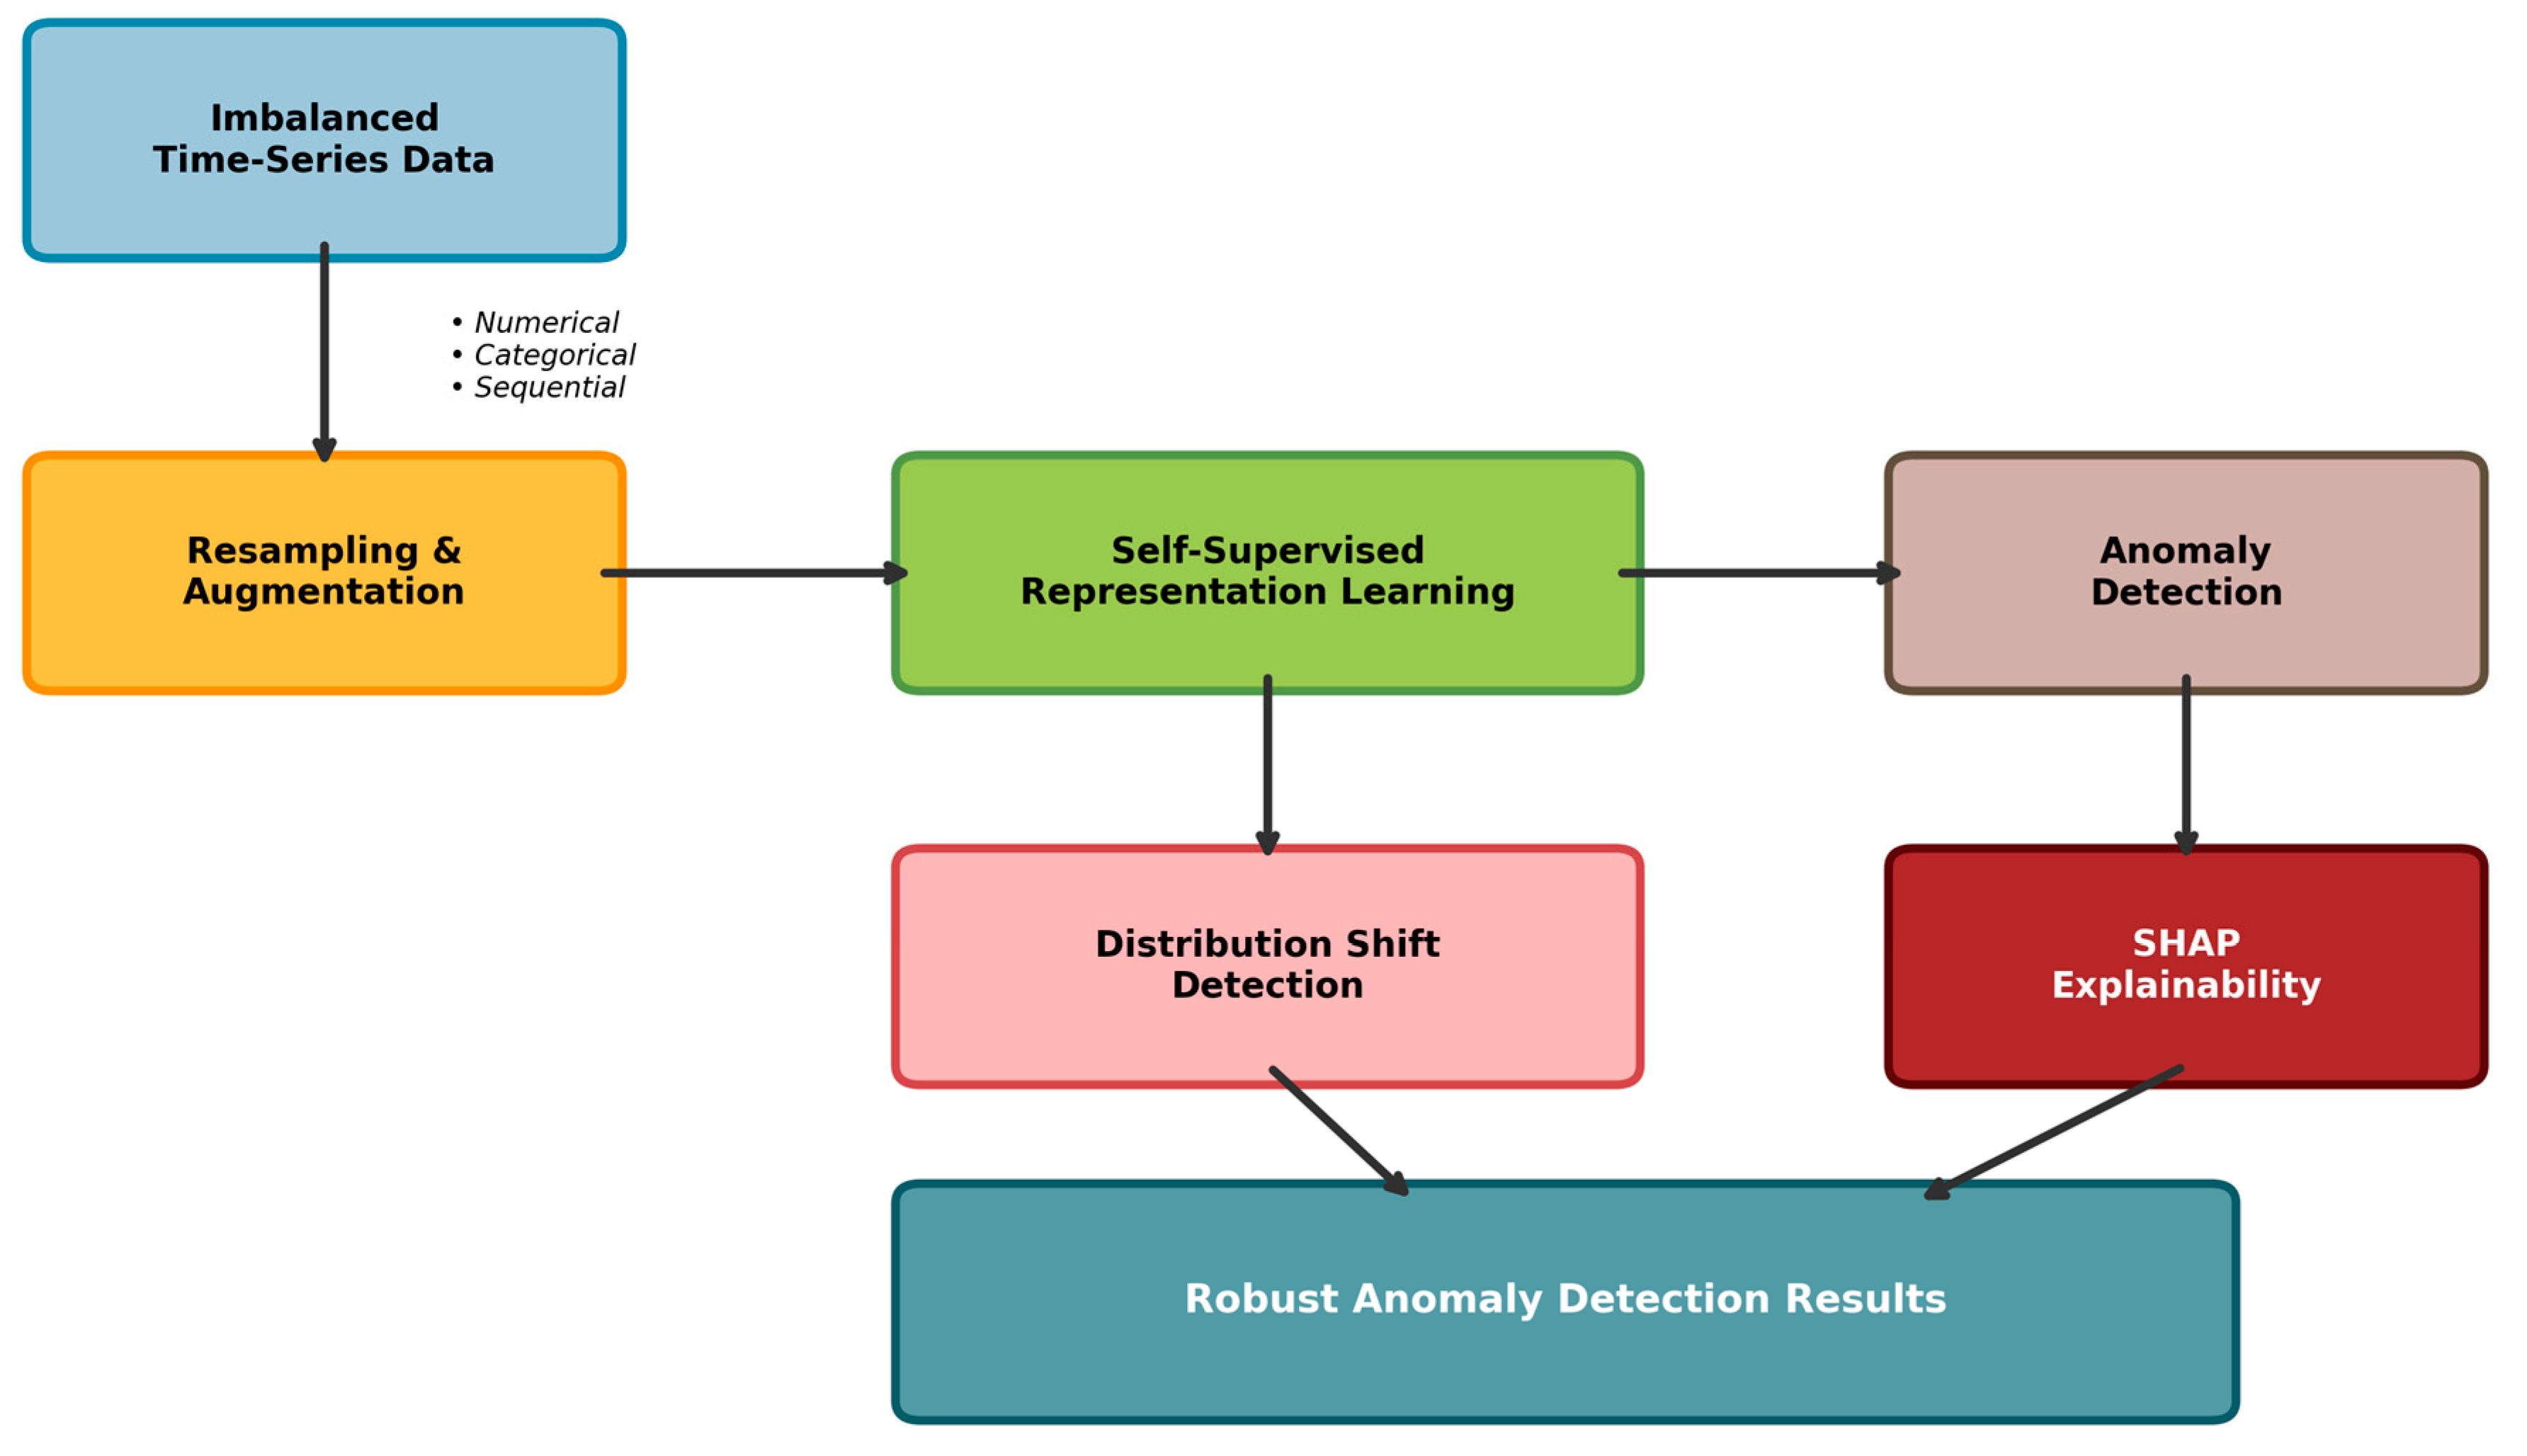
Figure 2.
Self-Supervised Learning Process
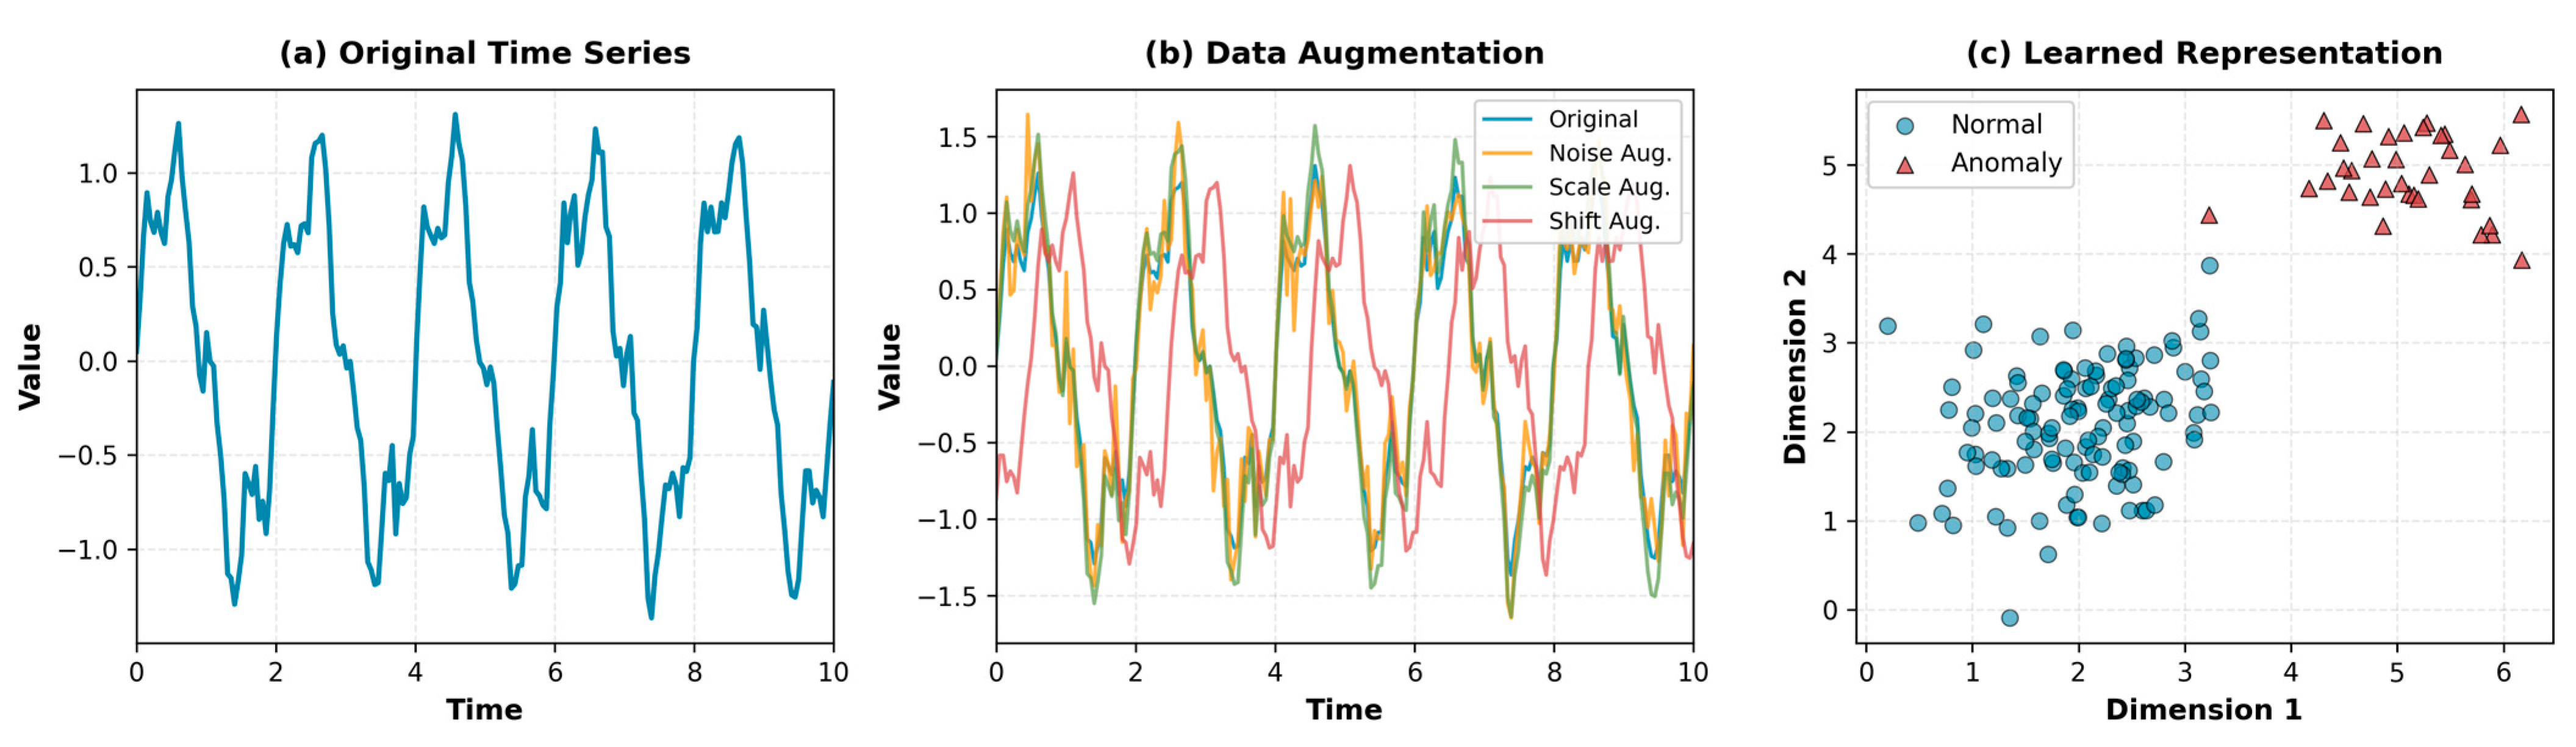
Figure 3.
SHAP and Distribution Analysis.
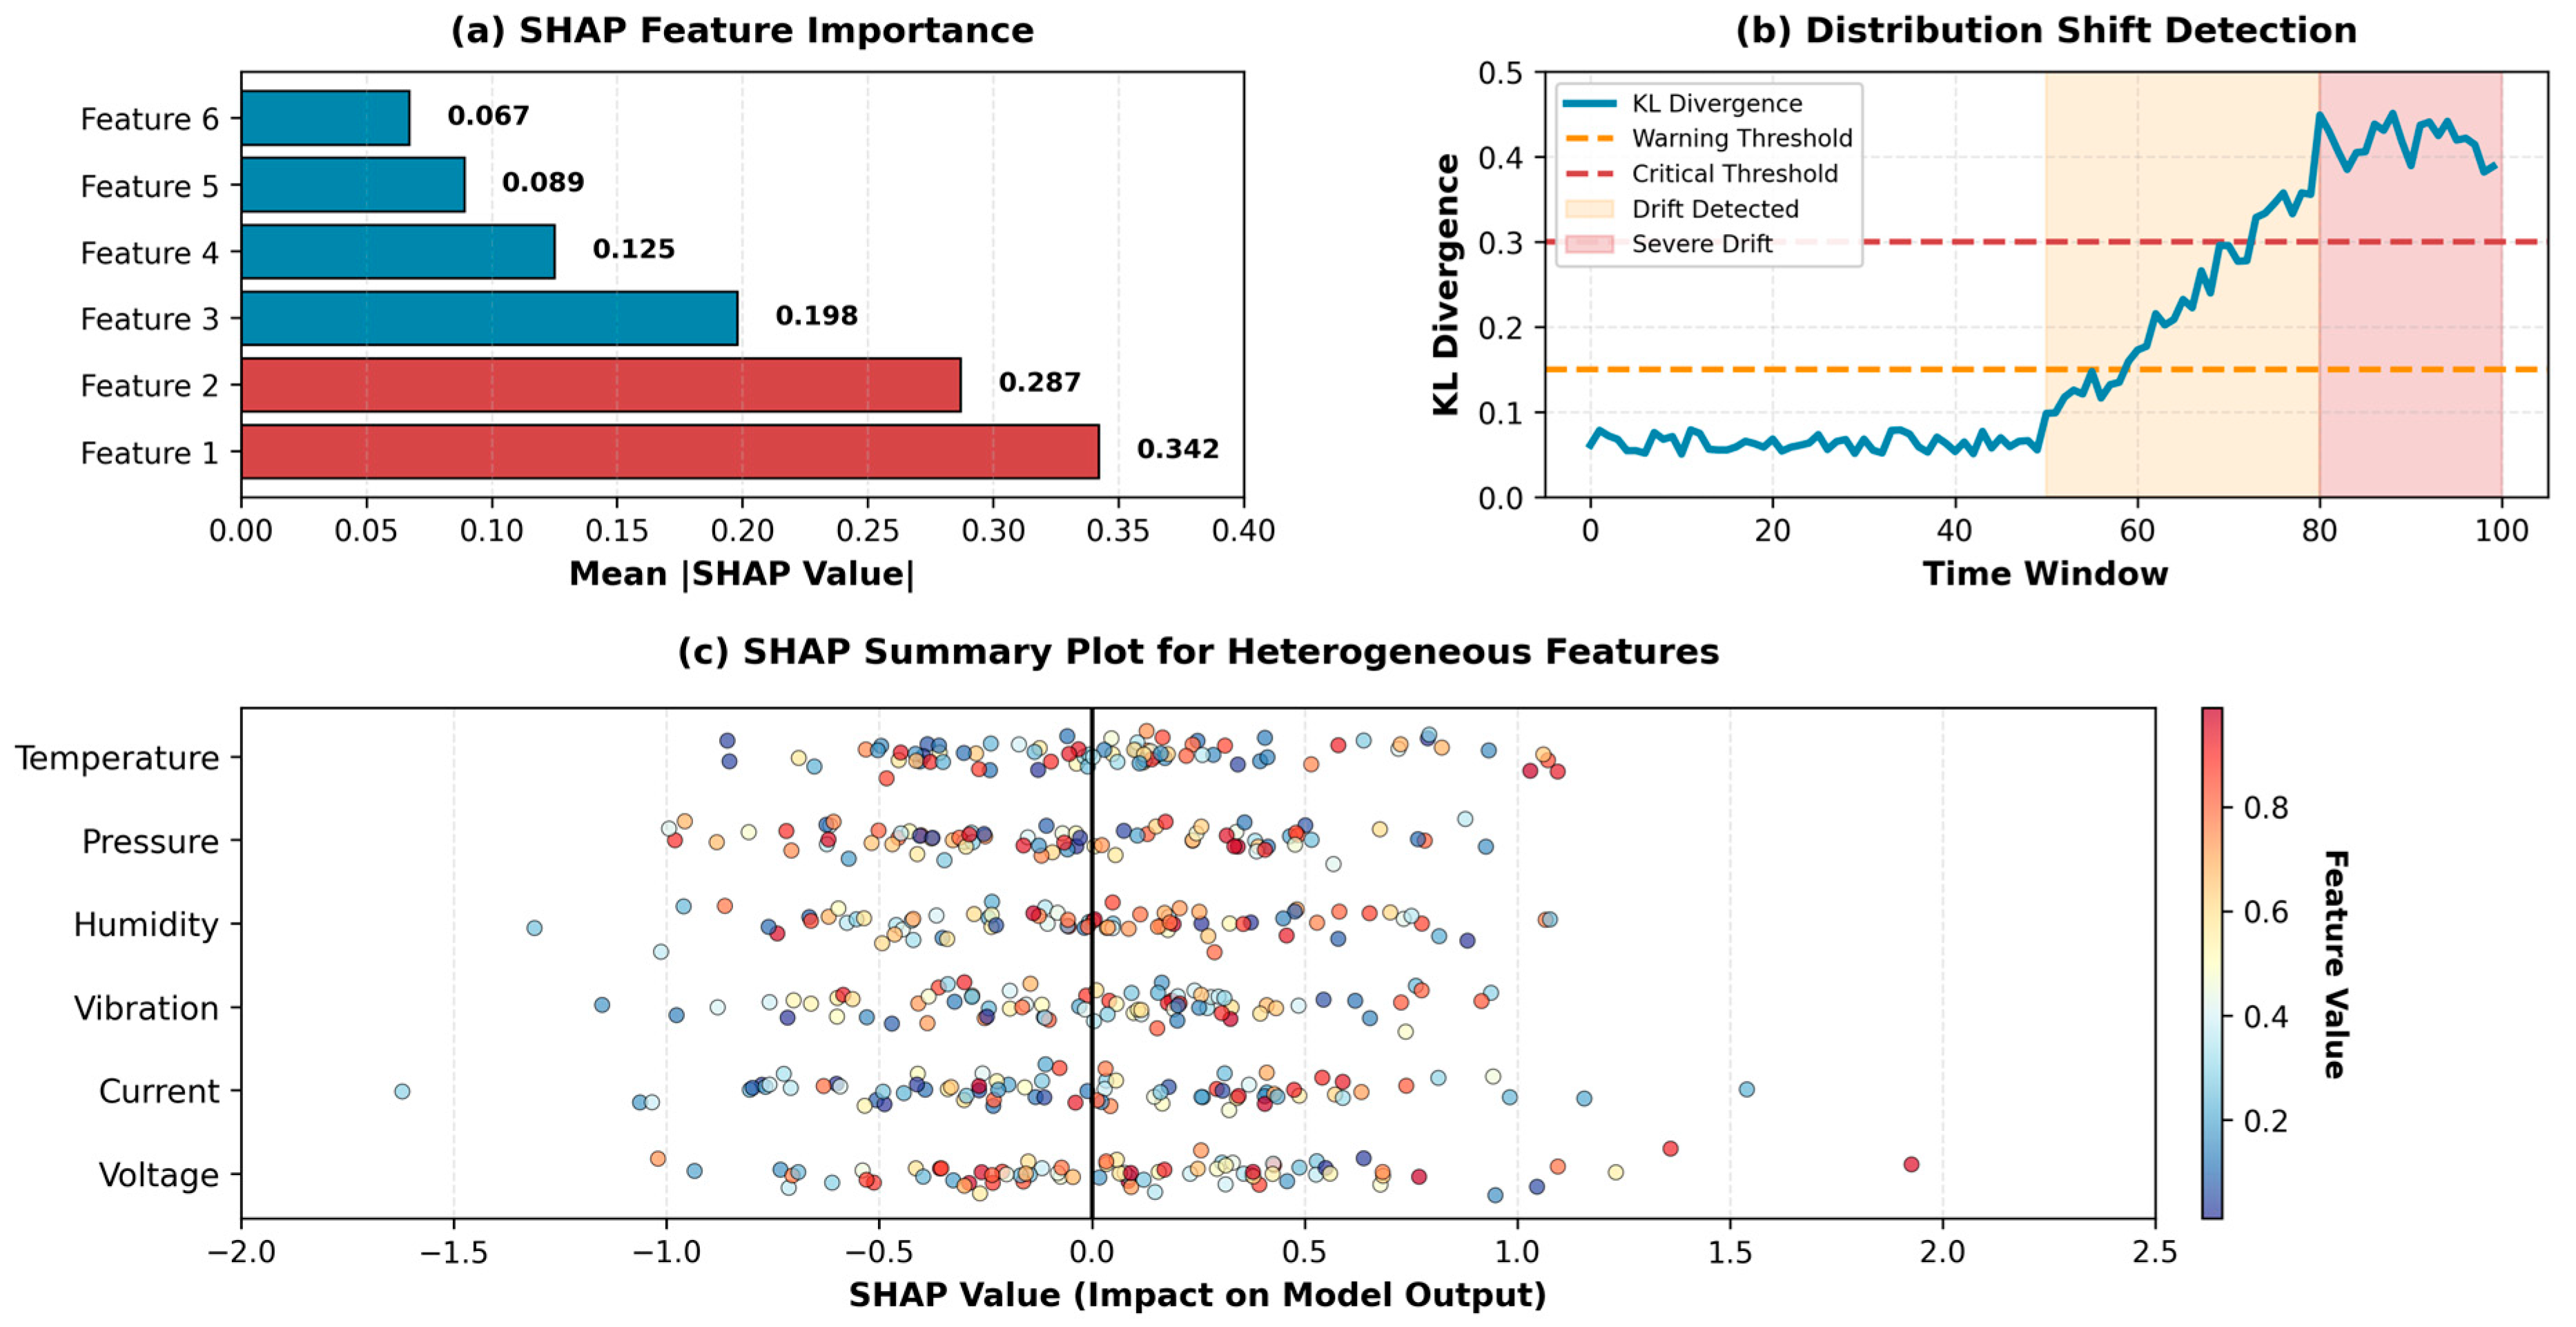
Figure 4.
Experimental ResultsThe baseline Autoencoder achieves only 0.652 F1-score, suffering from tight normal boundary definitions that classify minor variations as anomalies. This demonstrates fundamental limitations of reconstruction-based methods. SMOTE with Random Forest improves to 0.698 by addressing class imbalance at the data level, but lacks representation learning capacity for complex temporal patterns. The improvement validates the importance of explicit imbalance handling.
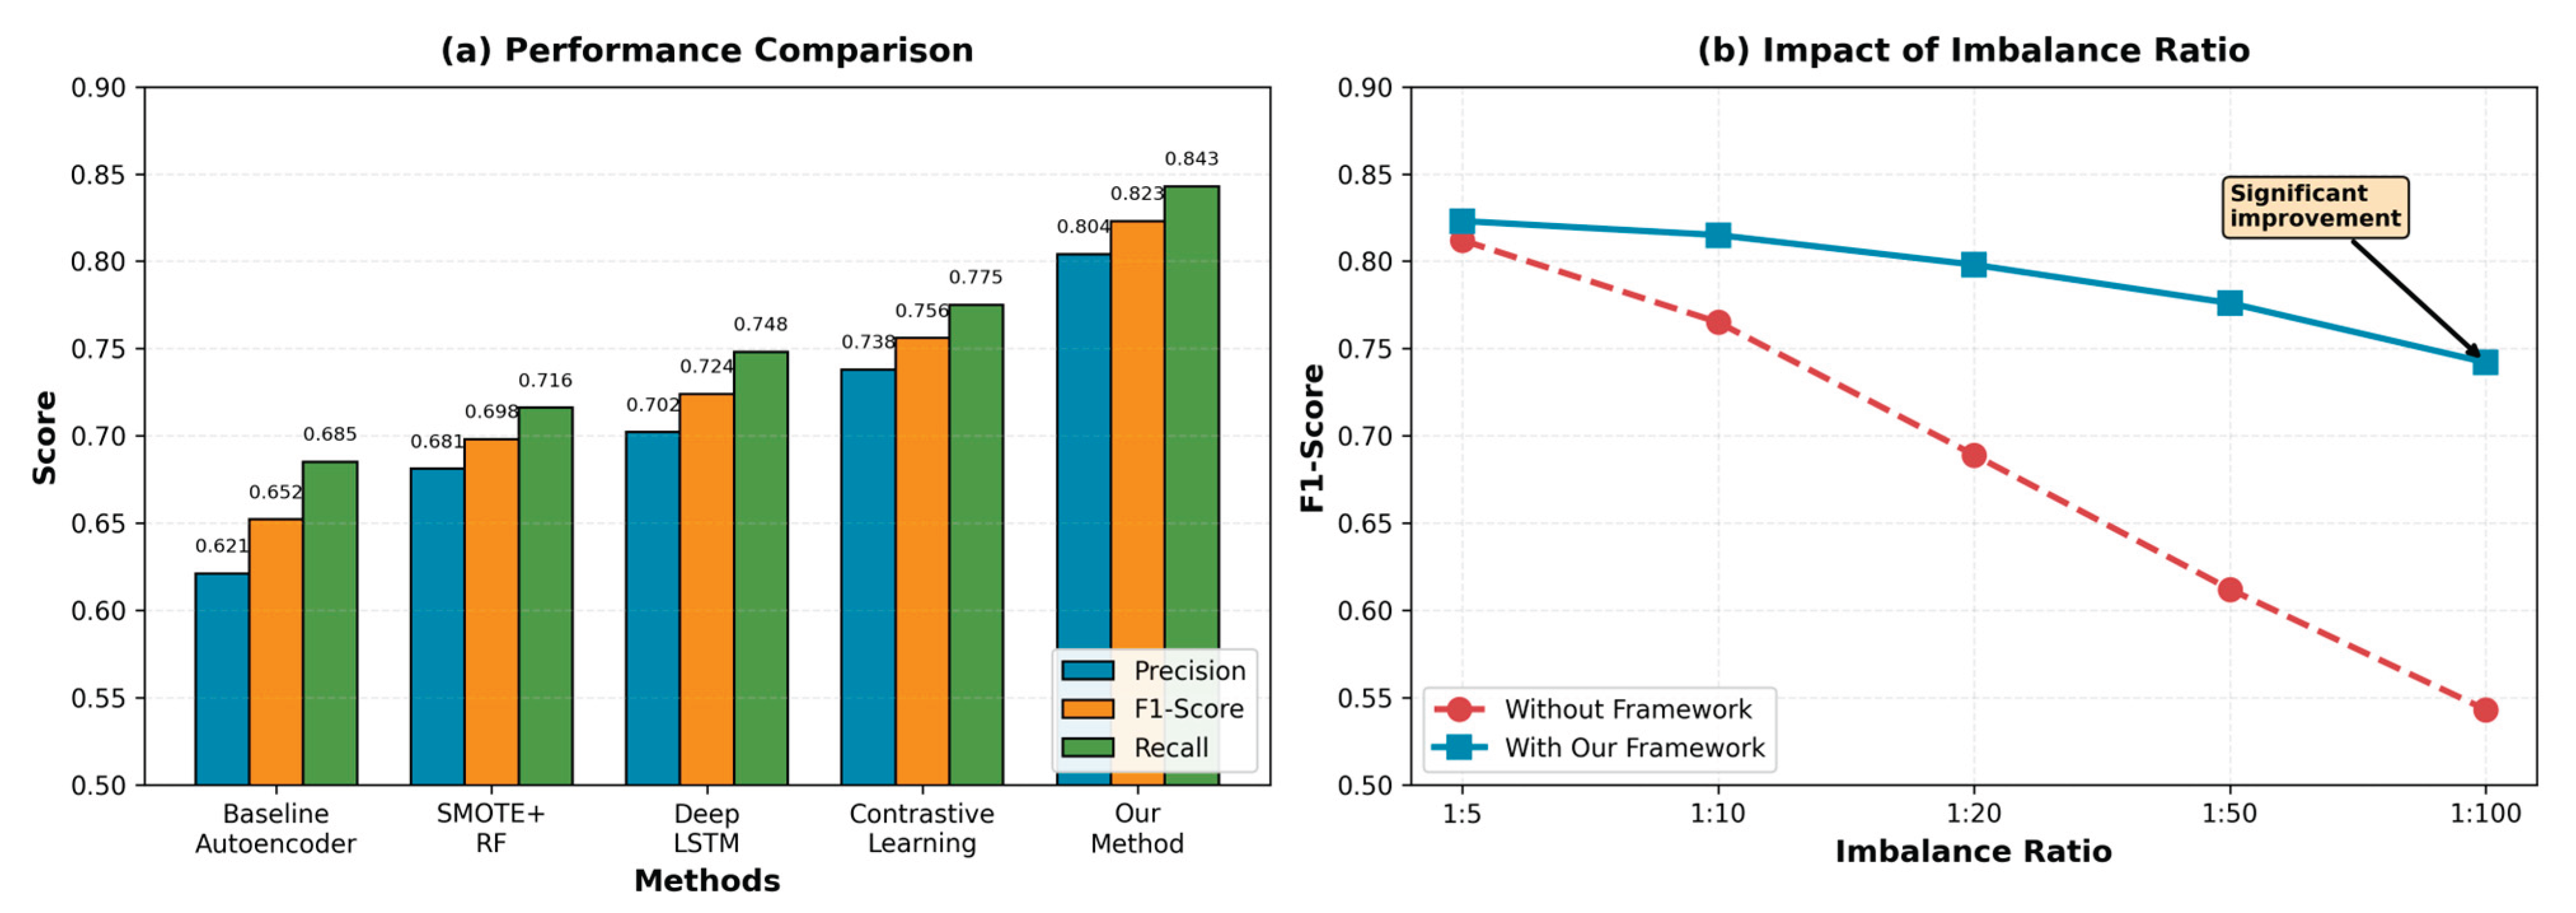

Table I.
Experimental Parameters.
| Parameter | Value |
|---|---|
| Window size | 100 |
| Stride | 50 |
| Batch size | 256 |
| Learning rate | 0.001 |
| Temperature | 0.1 |
| Focal loss | 2.0 |
| Encoder dimensions | [64,128,128] |
| Attention heads | 4 |
| Dropout rate | 0.2 |
| Training epochs (SSL) | 100 |
| Fine-tuning epochs | 20 |
| MMD threshold | 0.15 |
| Reconstruction threshold |
Table II.
Per-dataset Performance Results.
| Dataset | Precision | Recall | F1-Score |
|---|---|---|---|
| MSL | 0.812 | 0.834 | 0.823 |
| SMD | 0.776 | 0.821 | 0.798 |
| SWaT | 0.819 | 0.829 | 0.824 |
| Healthcare | 0.849 | 0.833 | 0.841 |
| Average | 0.814 | 0.829 | 0.823 |
Disclaimer/Publisher’s Note: The statements, opinions and data contained in all publications are solely those of the individual author(s) and contributor(s) and not of MDPI and/or the editor(s). MDPI and/or the editor(s) disclaim responsibility for any injury to people or property resulting from any ideas, methods, instructions or products referred to in the content. |
© 2025 by the authors. Licensee MDPI, Basel, Switzerland. This article is an open access article distributed under the terms and conditions of the Creative Commons Attribution (CC BY) license (http://creativecommons.org/licenses/by/4.0/).
Copyright: This open access article is published under a Creative Commons CC BY 4.0 license, which permit the free download, distribution, and reuse, provided that the author and preprint are cited in any reuse.


