Submitted:
24 July 2025
Posted:
24 July 2025
You are already at the latest version
Abstract
To effectively address the issues of low sensitivity and high time consumption in time series anomaly detection, we propose an anomaly detection method based on cross-modal deep metric learning. A cross-modal deep metric learning feature clustering model is constructed, composed of an input layer, a triplet selection layer, and a loss function computation layer. The squared Euclidean distances between cluster centers are calculated, and a stochastic gradient descent strategy is employed to optimize the model and classify different time series features. The inner product of principal component direction vectors is used as a metric for anomaly measurement. The von Mises–Fisher (vMF) distribution is applied to describe the directional characteristics of time series data, and historical data is used to train and obtain evaluation parameters. By comparing the principal component direction vector of actual time series data with the threshold, anomaly detection is performed. Experimental results demonstrate that the proposed method accurately classifies time series data with different attributes, exhibits high sensitivity to anomalies, and achieves high detection accuracy, fast detection speed, and strong robustness.
Keywords:
cross-modal
; deep metric learning
; time series data
; anomaly detection
; kernel principal component analysis
1. Introduction
Time series data in different environments often encompass a variety of relevant information and attributes, such as network traffic node categories, personal information in social media, and registration time. These can all be considered as attributes of time series data[1,2]. Research on time series data, especially for defining human or object activity patterns, has strong practical significance. Eliminating abnormal data interference has become a crucial challenge[3] , and is also the main focus of this paper.
To address the problem of anomaly detection, literature[4] adopts short-term memory network prediction to estimate the difference between predicted and actual values, and then uses a sliding window to model the distribution of differences. By estimating the probability density of the distribution within each segment, it obtains the probability of data anomalies. However, this method is not suitable for data with strong periodicity changes and lacks generalizability. Literature[5] uses a multi-Gaussian mixture model for binary feature probability density analysis. A sliding time window is used to construct a corrected data set. Within each window, the Grubbs test is used to complete the anomaly detection process. This method requires parameter tuning for the time window, and detection results are easily affected by parameter settings.
Based on the above, in response to the practical needs of time series anomaly detection, this paper proposes a time series anomaly detection method based on cross-modal deep metric learning. A cross-modal deep metric learning model is constructed, which optimizes feature spatial distribution using mean center measures, classifies time series data with different forms, and applies kernel principal component analysis (KPCA) to compute the probability distribution of principal component direction vectors of the data set. By comparing the probability values, the presence of anomalies is assessed. Simulation results show that the proposed method has practical application value.
2. Related Work
Anomaly detection in time series has gained significant traction with the rise of data-driven applications across sectors such as finance, cloud computing, and healthcare. These applications demand robust models capable of handling noisy, high-dimensional, and heterogeneous inputs. Traditional statistical approaches often fall short in terms of adaptability and precision, particularly in complex and dynamic environments. Consequently, research has increasingly focused on deep learning-based techniques that emphasize representation learning and generalization-aware strategies.
Recent studies have introduced contrastive learning methods designed for heterogeneous backend systems, highlighting the importance of feature discrimination when processing unstructured data [6]. This approach enables models to capture semantic similarities and differences without relying on handcrafted features. In related work, federated contrastive learning has been applied to detect behavioral anomalies in distributed environments while preserving data privacy [7]. Complementing these strategies, deep regression techniques have been utilized to forecast transmission time under variable network conditions, facilitating latency-aware anomaly detection [8].
Improving forecasting reliability under non-stationary and cross-domain conditions remains a critical challenge. Meta-learning has been explored to generalize knowledge across diverse workloads [9], while multi-task learning frameworks have enhanced predictive performance in contexts with limited data overlap [10]. These adaptive methods are vital for developing models that perform well not only on seen patterns but also on unforeseen operational scenarios.
The fusion of contrastive, federated, and meta-learning paradigms continues to push the boundaries of anomaly detection. Federated meta-learning techniques have shown success in detecting node-level faults within heterogeneous infrastructures [11]. Similarly, meta-learning frameworks have been proposed to enable elastic resource scaling in cloud-native systems [12]. Advancements in language modeling further contribute to this progress; prompt-based adaptations have been studied for low-resource tasks [13], while structured gradient and low-rank adaptation mechanisms have improved few-shot learning performance [14,15,16].
Natural language processing (NLP) and large language models (LLMs) have also emerged as powerful tools for anomaly characterization. Structural reconfiguration mechanisms have been proposed to support parameter-efficient fine-tuning of LLMs tailored to specific tasks [17]. Attention-based architectures have been used to model microservice access patterns, uncovering latent semantics beneficial for anomaly detection [18]. In addition, context-aware frameworks have been developed to detect hallucinations in LLM outputs [19]. Within the clinical domain, attention-enhanced models have achieved promising results for multi-disease prediction and classification [20,21]. Instruction encoding and gradient coordination strategies have improved multi-task generalization [22], while perception-guided structural designs have enhanced LLM robustness in dynamic environments [23].
Reinforcement learning (RL) continues to play a significant role in resource management and anomaly detection across real-time systems. RL-based approaches have enabled autonomous resource allocation in microservices [24], while multi-agent reinforcement strategies have supported scalable, collaborative optimization [25]. Edge-level applications have integrated deep Q-networks (DQNs) for intelligent scheduling [26], and subspace ensemble sampling guided by RL has been proposed for navigating high-dimensional anomaly boundaries [27].
Structured anomaly detection has also benefited from graph-based methods. Graph attention networks have been applied to detect fraud in financial transactions by capturing relational dependencies [28]. In the context of social data, hybrid BiLSTM-CRF models enriched with social features have improved entity recognition accuracy [29]. Heterogeneous graph learning techniques have been used to discover implicit relationships in corporate networks [30], while hybrid graph-sequential models have demonstrated scalable traffic estimation capabilities [31]. Causal representation learning has further enhanced prediction of financial returns under market volatility [32].
Fine-tuning strategies tailored for LLMs have also been instrumental in low-data, high-variability contexts. Transaction graph integration has supported real-time risk monitoring in financial systems [33], while attention-augmented recurrent networks have improved forecasting under noise and time drift [34]. Gradient coordination and perception-guided structures have improved multi-task modeling and contextual adaptability [35,36]. In addition, structured gradient guidance and low-rank adaptation techniques have bolstered few-shot learning robustness [37,38].
Collaborative and privacy-preserving learning frameworks have also made notable contributions. Federated recommendation systems have been optimized through the integration of user interest modeling and differential privacy [39]. In human-computer interaction, capsule network-based architectures have improved semantic intent modeling [40], while lightweight compression strategies have enabled edge deployment of deep models [41]. Efforts in hybrid sequence modeling and low-rank adaptation have addressed the need for efficient dynamic learning [42,43].
Real-world applications underscore the practical relevance of these advancements. In high-frequency trading scenarios, deep learning pipelines have demonstrated efficacy in capturing microsecond-level anomalies [44]. In regulatory and auditing settings, automated report generation using pretrained language models has shown promise in bridging structured data with textual compliance analysis [45].
Collectively, these advancements provide the foundational insights for this study, which proposes a unified framework incorporating cross-modal deep metric learning, kernel principal component analysis (KPCA), and von Mises–Fisher (vMF) modeling. The objective is to enable robust and generalizable anomaly detection in complex time series settings, where traditional methods often struggle.
3. Time Series Feature Clustering Based on Cross-Modal Deep Metric Learning
Network data often includes multiple types of time series features. To simplify the complexity of time series anomaly detection and enhance detection efficiency and accuracy, a time series feature clustering method based on cross-modal deep metric learning is proposed. The overall model architecture is illustrated in Figure 1.
In the feature space, time series data from different scenarios are more distant from each other, and the probability of confusion is lower. Therefore, the cross-modal deep metric learning model outputs a spatial feature distribution that strengthens the accuracy of feature clustering[46]. The following uses the mean center distance measure to optimize the spatial feature distribution.
Assume is the squared Euclidean distance between the centers of cluster i and cluster j. The calculation is as follows:
where are cluster labels, N is the number of samples, and are the k-th dimension values of the center vectors of clusters i and j.
The loss function for the cross-modal deep metric learning model consists of two parts[47]: the cross-entropy loss and the mean center loss , weighted by coefficients :
Assume the time series sample set contains N samples, defined as:
Here, a is the feature dimension of model output, is the feature vector, and is the corresponding label vector.
The cross-entropy loss and the mean center loss are defined as follows:
where m is the number of training samples per batch. To enhance classification accuracy, the model is optimized via stochastic gradient descent (SGD). The gradients of w.r.t. sample and cluster center are:
where is the indicator function and n denotes the class label.
4. Anomaly Detection of Time Series Data Based on Kernel Principal Component Analysis
After categorizing the features of time series data, the next step is to detect anomalies in different types of time series data. This section proposes an anomaly detection method based on Kernel Principal Component Analysis (KPCA).
Principal Component Analysis (PCA) is a linear feature extraction method that decomposes the covariance matrix of the data[48,49]. By selecting the top M eigenvectors with the largest eigenvalues, it constructs a projection matrix to project the data into a low-dimensional subspace, achieving dimensionality reduction, noise removal, and decorrelation. If the data in the input space is non-linearly distributed, kernel transformation is applied to map the data into a higher-dimensional feature space where it becomes linearly separable. The PCA is then conducted in this space, a process known as Kernel PCA.
Let be one of N samples in the input space. With a non-linear mapping , the input data is projected into the feature space . Thus, are the mapped samples. To perform PCA in this high-dimensional space, we calculate the covariance matrix of the centered feature vectors:
The relationship between the covariance matrix and eigenvectors is:
where , v are the eigenvalues and eigenvectors of , respectively.
Since is symmetric[50], it contains r non-zero orthogonal eigenvectors. Due to high dimensionality, we express v as a linear combination of samples in the feature space:
The kernel matrix is then defined by:
where is the coefficient vector.
To identify anomalies, we compute the directional projection of time series data into the feature space. Selecting the top M eigenvectors, we compute the mean direction of the time series:
where denotes the directional characteristics of the i-th time series.
After the detection model is trained on historical time series, we evaluate whether new data align with historical distributions. Assume two sets of principal direction vectors, and their inner product is computed by:
To normalize the direction vector, we define:
For anomaly scoring, we use the von Mises-Fisher (vMF) distribution[51] to model directional features. The distribution function is:
The normalization constant is:
where is the modified Bessel function of the first kind.
Assume R is the mean length of the principal direction vectors, then the concentration parameter k is:
To detect anomalies, compare the cumulative distribution value under the vMF model with a threshold . If:
then the data is considered anomalous.
5. Simulation Study
5.1. Simulation Setup
To verify the advantages of the proposed anomaly detection method for time series data, we compare it with the sliding window method in[4] and the binary feature method in[5]. Experiments were implemented on a deep learning platform using the TensorFlow framework, with a simulation period of 800ms.
The experiments are divided into two parts: time series classification and anomaly detection. The time series dataset contains 12,463 sequences, of which 6,792 are used for training and 5,671 for testing. Two evaluation metrics were used: Root Mean Square Error (RMSE) and Mean Absolute Error (MAE). RMSE measures the square root of the average squared difference between predicted and actual values; MAE measures the average absolute error.
where and denote the true and predicted values of time series data at time i.
5.2. Time Series Classification Results
As shown in Figure 2, when the training sample size increases from 400 to 3200, the accuracy of the sliding window method improves from 76% to 93%, and the binary feature method improves from 78% to 94%. The proposed method increases from 88% to 96%. The results demonstrate that the proposed method performs better across varying sample sizes.
5.3. Time Series Anomaly Detection Analysis
Table 1 shows that the proposed method consistently achieves lower RMSE and MAE compared to the other two methods, especially under small sample sizes, indicating superior detection robustness.
Figure 3 illustrates the average time consumption for anomaly detection. The proposed method consistently exhibits the lowest detection time compared to others, showcasing both accuracy and efficiency.
6. Conclusion
To address the shortcomings of traditional anomaly detection in time series data, this paper proposes a cross-modal deep metric learning method. By constructing a cross-modal deep metric learning model and combining it with kernel principal component analysis, the method effectively evaluates feature vector anomalies and detects abnormal data.
Experimental results demonstrate that this method not only achieves high classification accuracy across various types of time series data, but also offers efficient anomaly detection and robustness. Future research will explore the impact of kernel function selection on detection performance and further improve the model.
References
- Yang, S. , Wang, Y., Zheng, Z., Lin, K., & Wu, J. (2025). Towards scalable video anomaly retrieval: A synthetic video–text benchmark. arXiv preprint arXiv:2506.01466, arXiv:2506.01466.
- Li, Y. , Yang, Y., Liu, M., Wu, Q., & Zhou, J. (2021). Survey on cross-modal retrieval: From shallow to deep learning. ACM Transactions on Multimedia Computing, Communications, and Applications (TOMM).
- Ahmed, M. , Mahmood, A. N., & Hu, J. (2016). A survey of network anomaly detection techniques. ( 60, 19–31.
- Malhotra, P. , Vig, L., Shroff, G., & Agarwal, P. (2015). Long short term memory networks for anomaly detection in time series. In ESANN (Vol. 23, pp. 89–94).
- Li, Y. , Zheng, Y. , Zhang, H., & Chen, L. (2015). Traffic prediction in a bike-sharing system. In Proceedings of the 23rd SIGSPATIAL International Conference on Advances in Geographic Information Systems (pp. 1–10). ACM. [Google Scholar]
- Cui, W. (2024). Unsupervised Contrastive Learning for Anomaly Detection in Heterogeneous Backend System. Transactions on Computational and Scientific Methods.
- Meng, R. , Wang, H., Sun, Y., Wu, Q., Lian, L., & Zhang, R. (2025). Behavioral Anomaly Detection in Distributed Systems via Federated Contrastive Learning. arXiv preprint arXiv:2506.19246, arXiv:2506.19246.
- Pan, R. (2024). Deep Regression Approach to Predicting Transmission Time Under Dynamic Network Conditions. Journal of Computer Technology and Software.
- Yang, T. (2024). Transferable Load Forecasting and Scheduling via Meta-Learned Task Representations. Journal of Computer Technology and Software.
- Lin, Y. , & Xue, P. (2025). Multi-Task Learning for Macroeconomic Forecasting Based on Cross-Domain Data Fusion. Journal of Computer Technology and Software.
- Fang, Z. (2024). A Deep Learning-Based Predictive Framework for Backend Latency Using AI-Augmented Structured Modeling. Journal of Computer Technology and Software.
- Xu, Z. , Liu, X., Xu, Q., Su, X., Guo, X., & Wang, Y. (2025). Time Series Forecasting with Attention-Augmented Recurrent Networks: A Financial Market Application.
- Zhan, J. (2024). MobileNet Compression and Edge Computing Strategy for Low-Latency Monitoring. Journal of Computer Science and Software Applications.
- Bao, Q. , Wang, J., Gong, H., Zhang, Y., Guo, X., & Feng, H. (2025, March). A Deep Learning Approach to Anomaly Detection in High-Frequency Trading Data. In 2025 4th International Symposium on Computer Applications and Information Technology (ISCAIT) (pp. 287–291). IEEE.
- Zhu, W. (2024). Fast Adaptation Pipeline for LLMs Through Structured Gradient Approximation. Journal of Computer Technology and Software.
- Lyu, S. , Deng, Y., Liu, G., Qi, Z., & Wang, R. (2025). Transferable Modeling Strategies for Low-Resource LLM Tasks: A Prompt and Alignment-Based. arXiv preprint arXiv:2507.00601, arXiv:2507.00601.
- Wei, M. (2024). Federated Meta-Learning for Node-Level Failure Detection in Heterogeneous Distributed Systems. Journal of Computer Technology and Software.
- Tang, T. (2024). A Meta-Learning Framework for Cross-Service Elastic Scaling in Cloud Environments. Journal of Computer Technology and Software.
- Zhang, W. , Xu, Z., Tian, Y., Wu, Y., Wang, M., & Meng, X. (2025). Unified Instruction Encoding and Gradient Coordination for Multi-Task Language Models.
- Zheng, H. , Wang, Y., Pan, R., Liu, G., Zhu, B., & Zhang, H. (2025). Structured Gradient Guidance for Few-Shot Adaptation in Large Language Models. arXiv preprint arXiv:2506.00726, arXiv:2506.00726.
- Zhu, L. , Cui, W., Xing, Y., & Wang, Y. (2024). Collaborative Optimization in Federated Recommendation: Integrating User Interests and Differential Privacy. Journal of Computer Technology and Software.
- Cai, G. , Kai, A., & Guo, F. (2025). Dynamic and Low-Rank Fine-Tuning of Large Language Models for Robust Few-Shot Learning. Transactions on Computational and Scientific Methods.
- Wu, Q. (2024). Task-Aware Structural Reconfiguration for Parameter-Efficient Fine-Tuning of LLMs. Journal of Computer Technology and Software.
- Xu, T. , Deng, X., Meng, X., Yang, H., & Wu, Y. (2025). Clinical NLP with Attention-Based Deep Learning for Multi-Disease Prediction. arXiv preprint arXiv:2507.01437, arXiv:2507.01437.
- Wu, Y. , Qin, Y., Su, X., & Lin, Y. (2025). Transformer-Based Risk Monitoring for Anti-Money Laundering with Transaction Graph Integration.
- Wang, X. (2024). Time-Aware and Multi-Source Feature Fusion for Transformer-Based Medical Text Analysis. Transactions on Computational and Scientific Methods.
- Peng, Y. (2025). Context-Aligned and Evidence-Based Detection of Hallucinations in Large Language Model Outputs. Transactions on Computational and Scientific Methods.
- Guo, F. , Zhu, L., Wang, Y., & Cai, G. (2025). Perception-Guided Structural Framework for Large Language Model Design. Journal of Computer Technology and Software.
- Xu, Z. , Sheng, Y., Bao, Q., Du, X., Guo, X., & Liu, Z. (2025, March). BERT-Based Automatic Audit Report Generation and Compliance Analysis. In 2025 5th International Conference on Artificial Intelligence and Industrial Technology Applications (AIITA) (pp. 1233–1237). IEEE.
- Zou, Y. , Qi, N., Deng, Y., Xue, Z., Gong, M., & Zhang, W. (2025). Autonomous Resource Management in Microservice Systems via Reinforcement Learning. arXiv preprint arXiv:2507.12879, arXiv:2507.12879.
- Fang, B. , & Gao, D. (2025). Collaborative Multi-Agent Reinforcement Learning Approach for Elastic Cloud Resource Scaling. arXiv preprint arXiv:2507.00550, arXiv:2507.00550.
- Liu, J. (2025). Reinforcement Learning-Controlled Subspace Ensemble Sampling for Complex Data Structures.
- He, Q. , Liu, C., Zhan, J., Huang, W., & Hao, R. (2025). State-Aware IoT Scheduling Using Deep Q-Networks and Edge-Based Coordination. arXiv preprint arXiv:2504.15577, arXiv:2504.15577.
- Liu, Z. , & Zhang, Z. (2024). Graph-Based Discovery of Implicit Corporate Relationships Using Heterogeneous Network Learning. Journal of Computer Technology and Software.
- Zhao, Y. , Zhang, W., Cheng, Y., Xu, Z., Tian, Y., & Wei, Z. (2025). Entity Boundary Detection in Social Texts Using BiLSTM-CRF with Integrated Social Features.
- Jiang, N. , Zhu, W., Han, X., Huang, W., & Sun, Y. (2025). Joint Graph Convolution and Sequential Modeling for Scalable Network Traffic Estimation. arXiv preprint arXiv:2505.07674, arXiv:2505.07674.
- Sha, Q. , Tang, T., Du, X., Liu, J., Wang, Y., & Sheng, Y. (2025). Detecting Credit Card Fraud via Heterogeneous Graph Neural Networks with Graph Attention. arXiv preprint arXiv:2504.08183, arXiv:2504.08183.
- Gong, M. (2025). Modeling Microservice Access Patterns with Multi-Head Attention and Service Semantics. Journal of Computer Technology and Software.
- Wang, H. (2024). Causal Discriminative Modeling for Robust Cloud Service Fault Detection. Journal of Computer Technology and Software.
- Wu, Y. , Lin, Y., Xu, T., Meng, X., Liu, H., & Kang, T. (2025). Multi-Scale Feature Integration and Spatial Attention for Accurate Lesion Segmentation.
- Zheng, H. , Ma, Y., Wang, Y., Liu, G., Qi, Z., & Yan, X. (2025). Structuring Low-Rank Adaptation with Semantic Guidance for Model Fine-Tuning.
- Wang, S. , Zhuang, Y., Zhang, R., & Song, Z. (2025). Capsule Network-Based Semantic Intent Modeling for Human-Computer Interaction. arXiv preprint arXiv:2507.00540, arXiv:2507.00540.
- Sheng, Y. (2024). Temporal Dependency Modeling in Loan Default Prediction with Hybrid LSTM-GRU Architecture. Transactions on Computational and Scientific Methods.
- Wang, Y. , Sha, Q., Feng, H., & Bao, Q. (2025). Target-Oriented Causal Representation Learning for Robust Cross-Market Return Prediction. Journal of Computer Science and Software Applications.
- Wang, Y. (2025, March). A Data Balancing and Ensemble Learning Approach for Credit Card Fraud Detection. In 2025 4th International Symposium on Computer Applications and Information Technology (ISCAIT) (pp. 386–390). IEEE.
- Zhang, J. , Zulkernine, M., & Haque, A. (2008). Random-forest-based network intrusion detection systems. IEEE Transactions on Systems, Man, and Cybernetics, Part C (Applications and Reviews).
- Hundman, K. , Constantinou, V. , Laporte, C., Colwell, I., & Soderstrom, T. (2018). Detecting spacecraft anomalies using LSTMs and nonparametric dynamic thresholding. In Proceedings of the 24th ACM SIGKDD International Conference on Knowledge Discovery & Data Mining (pp. 387–395). [Google Scholar]
- Zhang, C. , Song, D. V. ( 33(01), 1409–1416.
- Yuan, Z. , Lu, Y., & Xue, Y. (2017). Anomaly detection and analysis for network traffic using principal component analysis and recurrent neural networks.
- Ahmed, M. , Mahmood, A. N., & Hu, J. (2017). A fast and scalable anomaly detection system for big data. ( 4, 18.
- Zhou, D. , Chen, Y. , & He, H. (2020). Federated anomaly detection: Hierarchical aggregation of unsupervised models in edge computing. In Proceedings of the IEEE International Conference on Data Engineering (ICDE) (pp. 395–406). [Google Scholar]
Figure 1.
verall model architecture
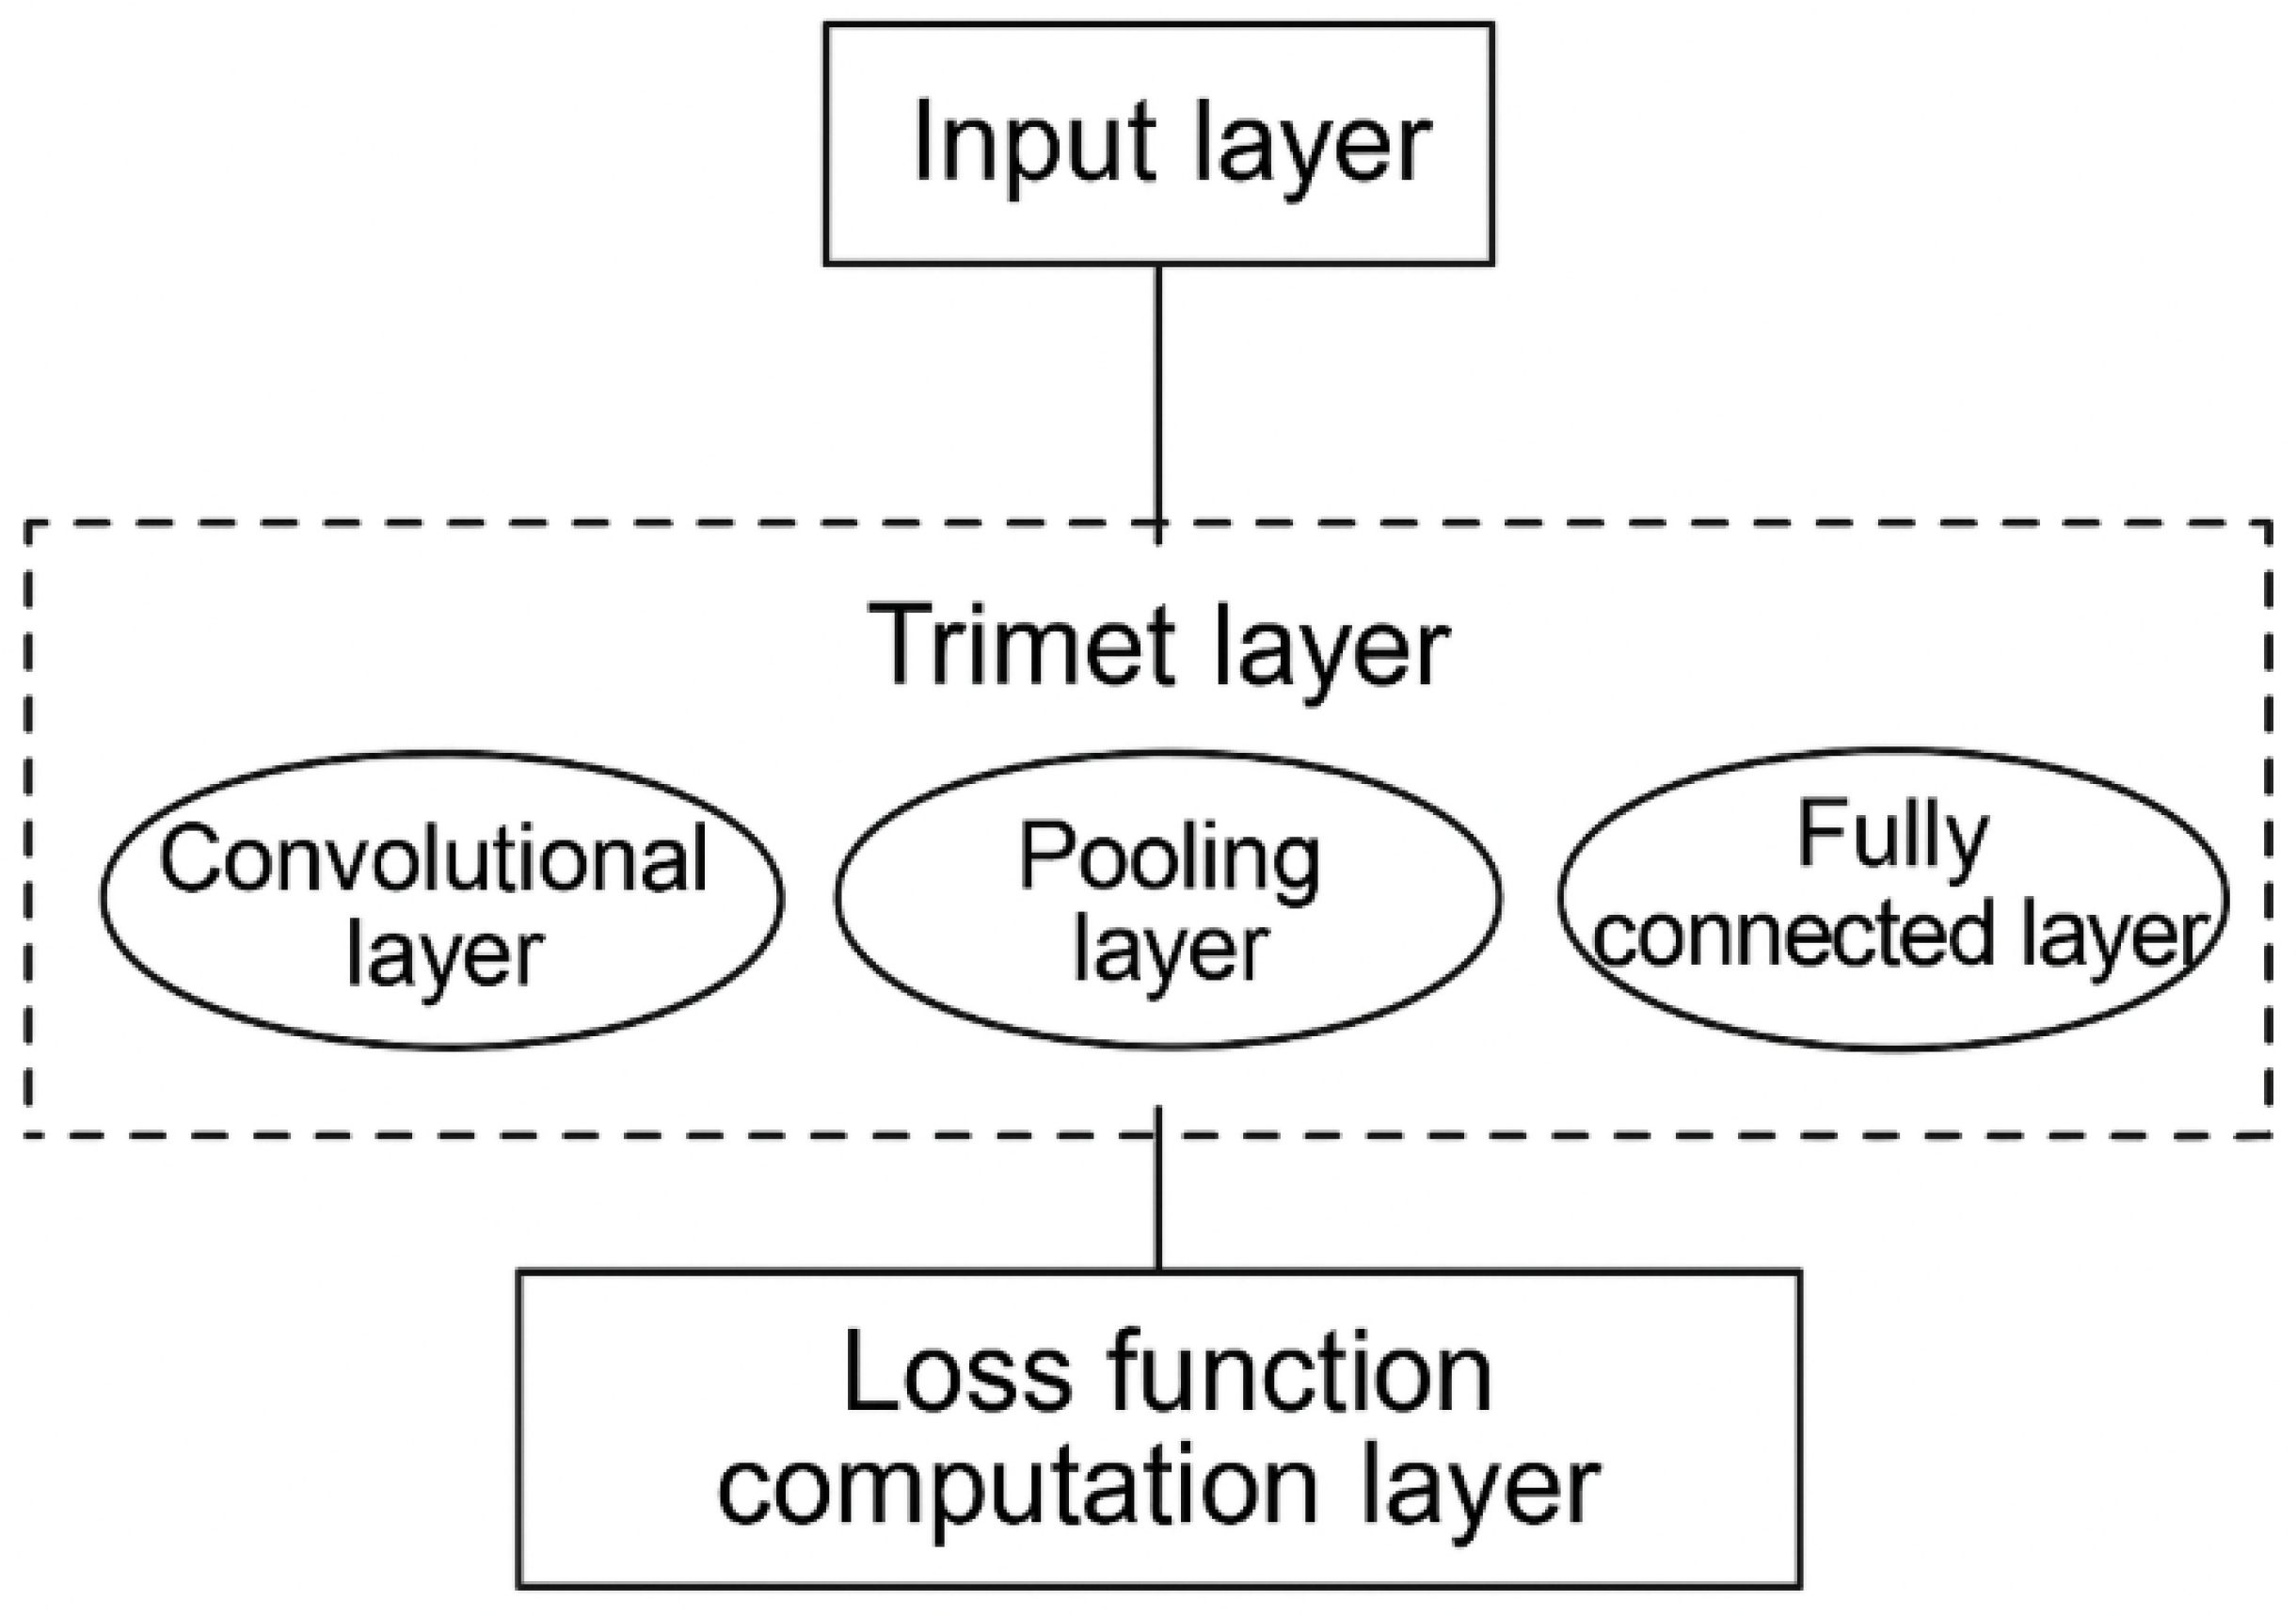
Figure 2.
Comparison of classification accuracy of time series data under three methods
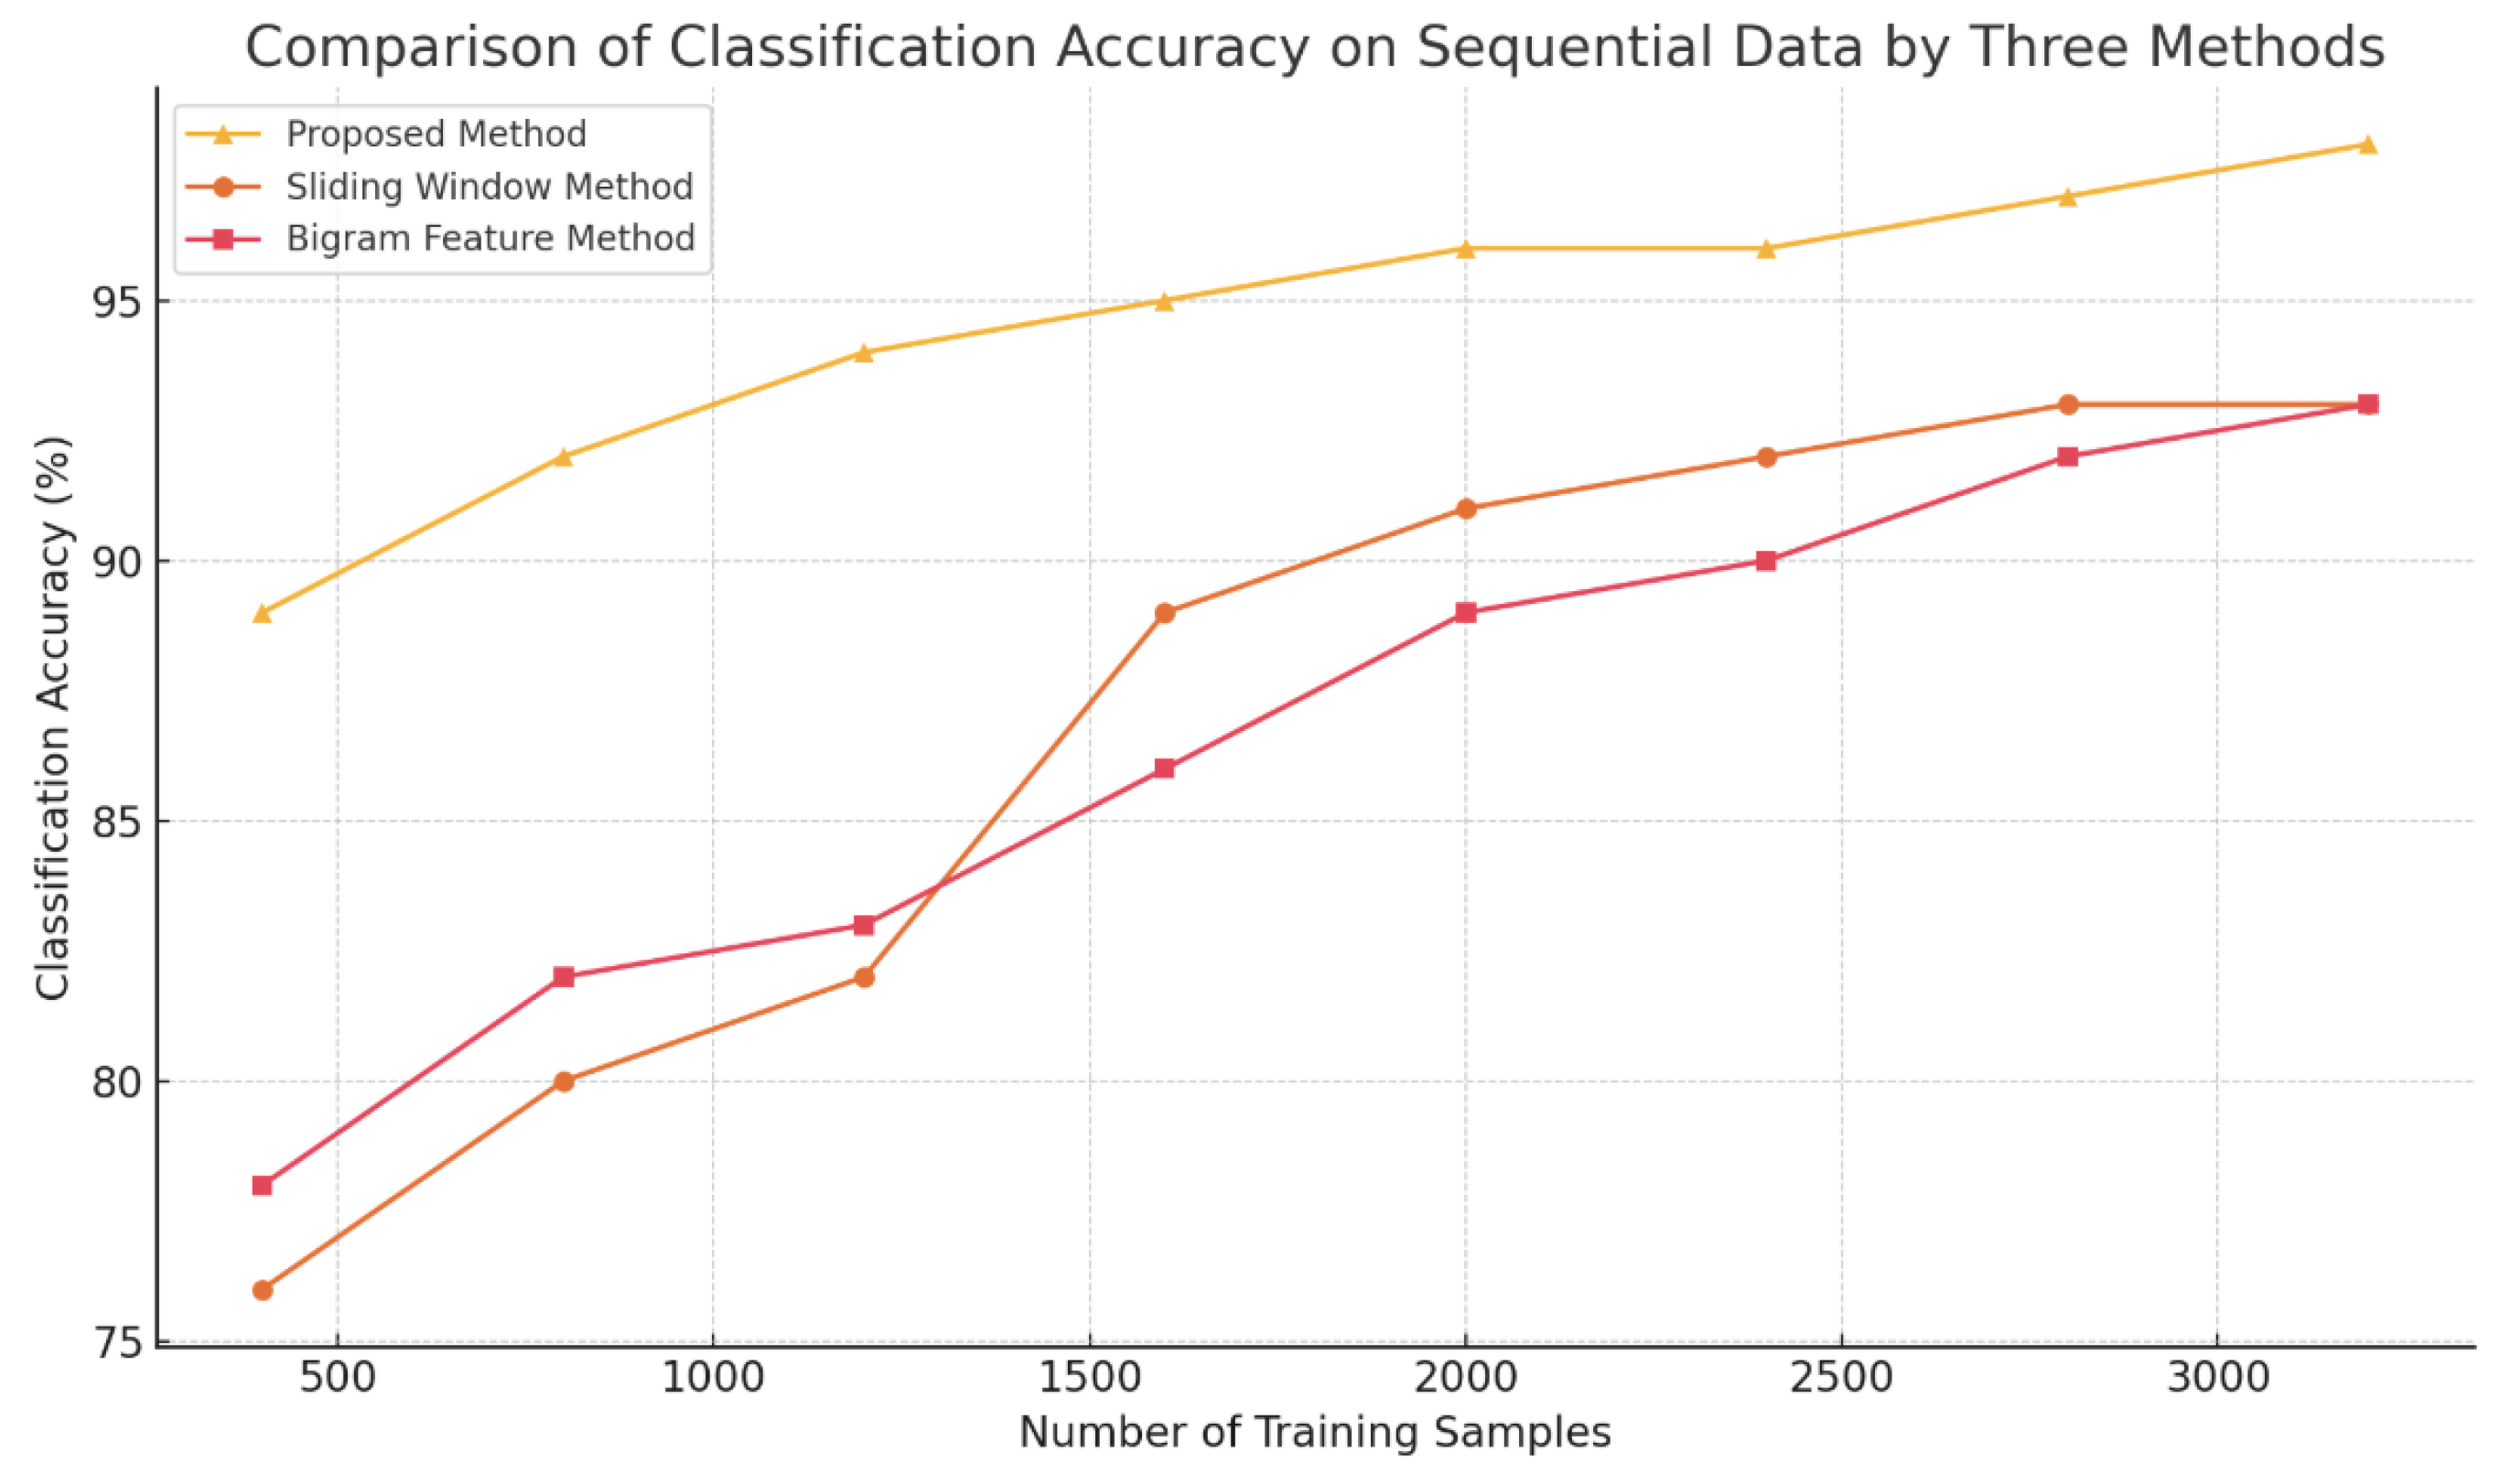
Figure 3.
Comparison of anomaly detection time cost under three methods
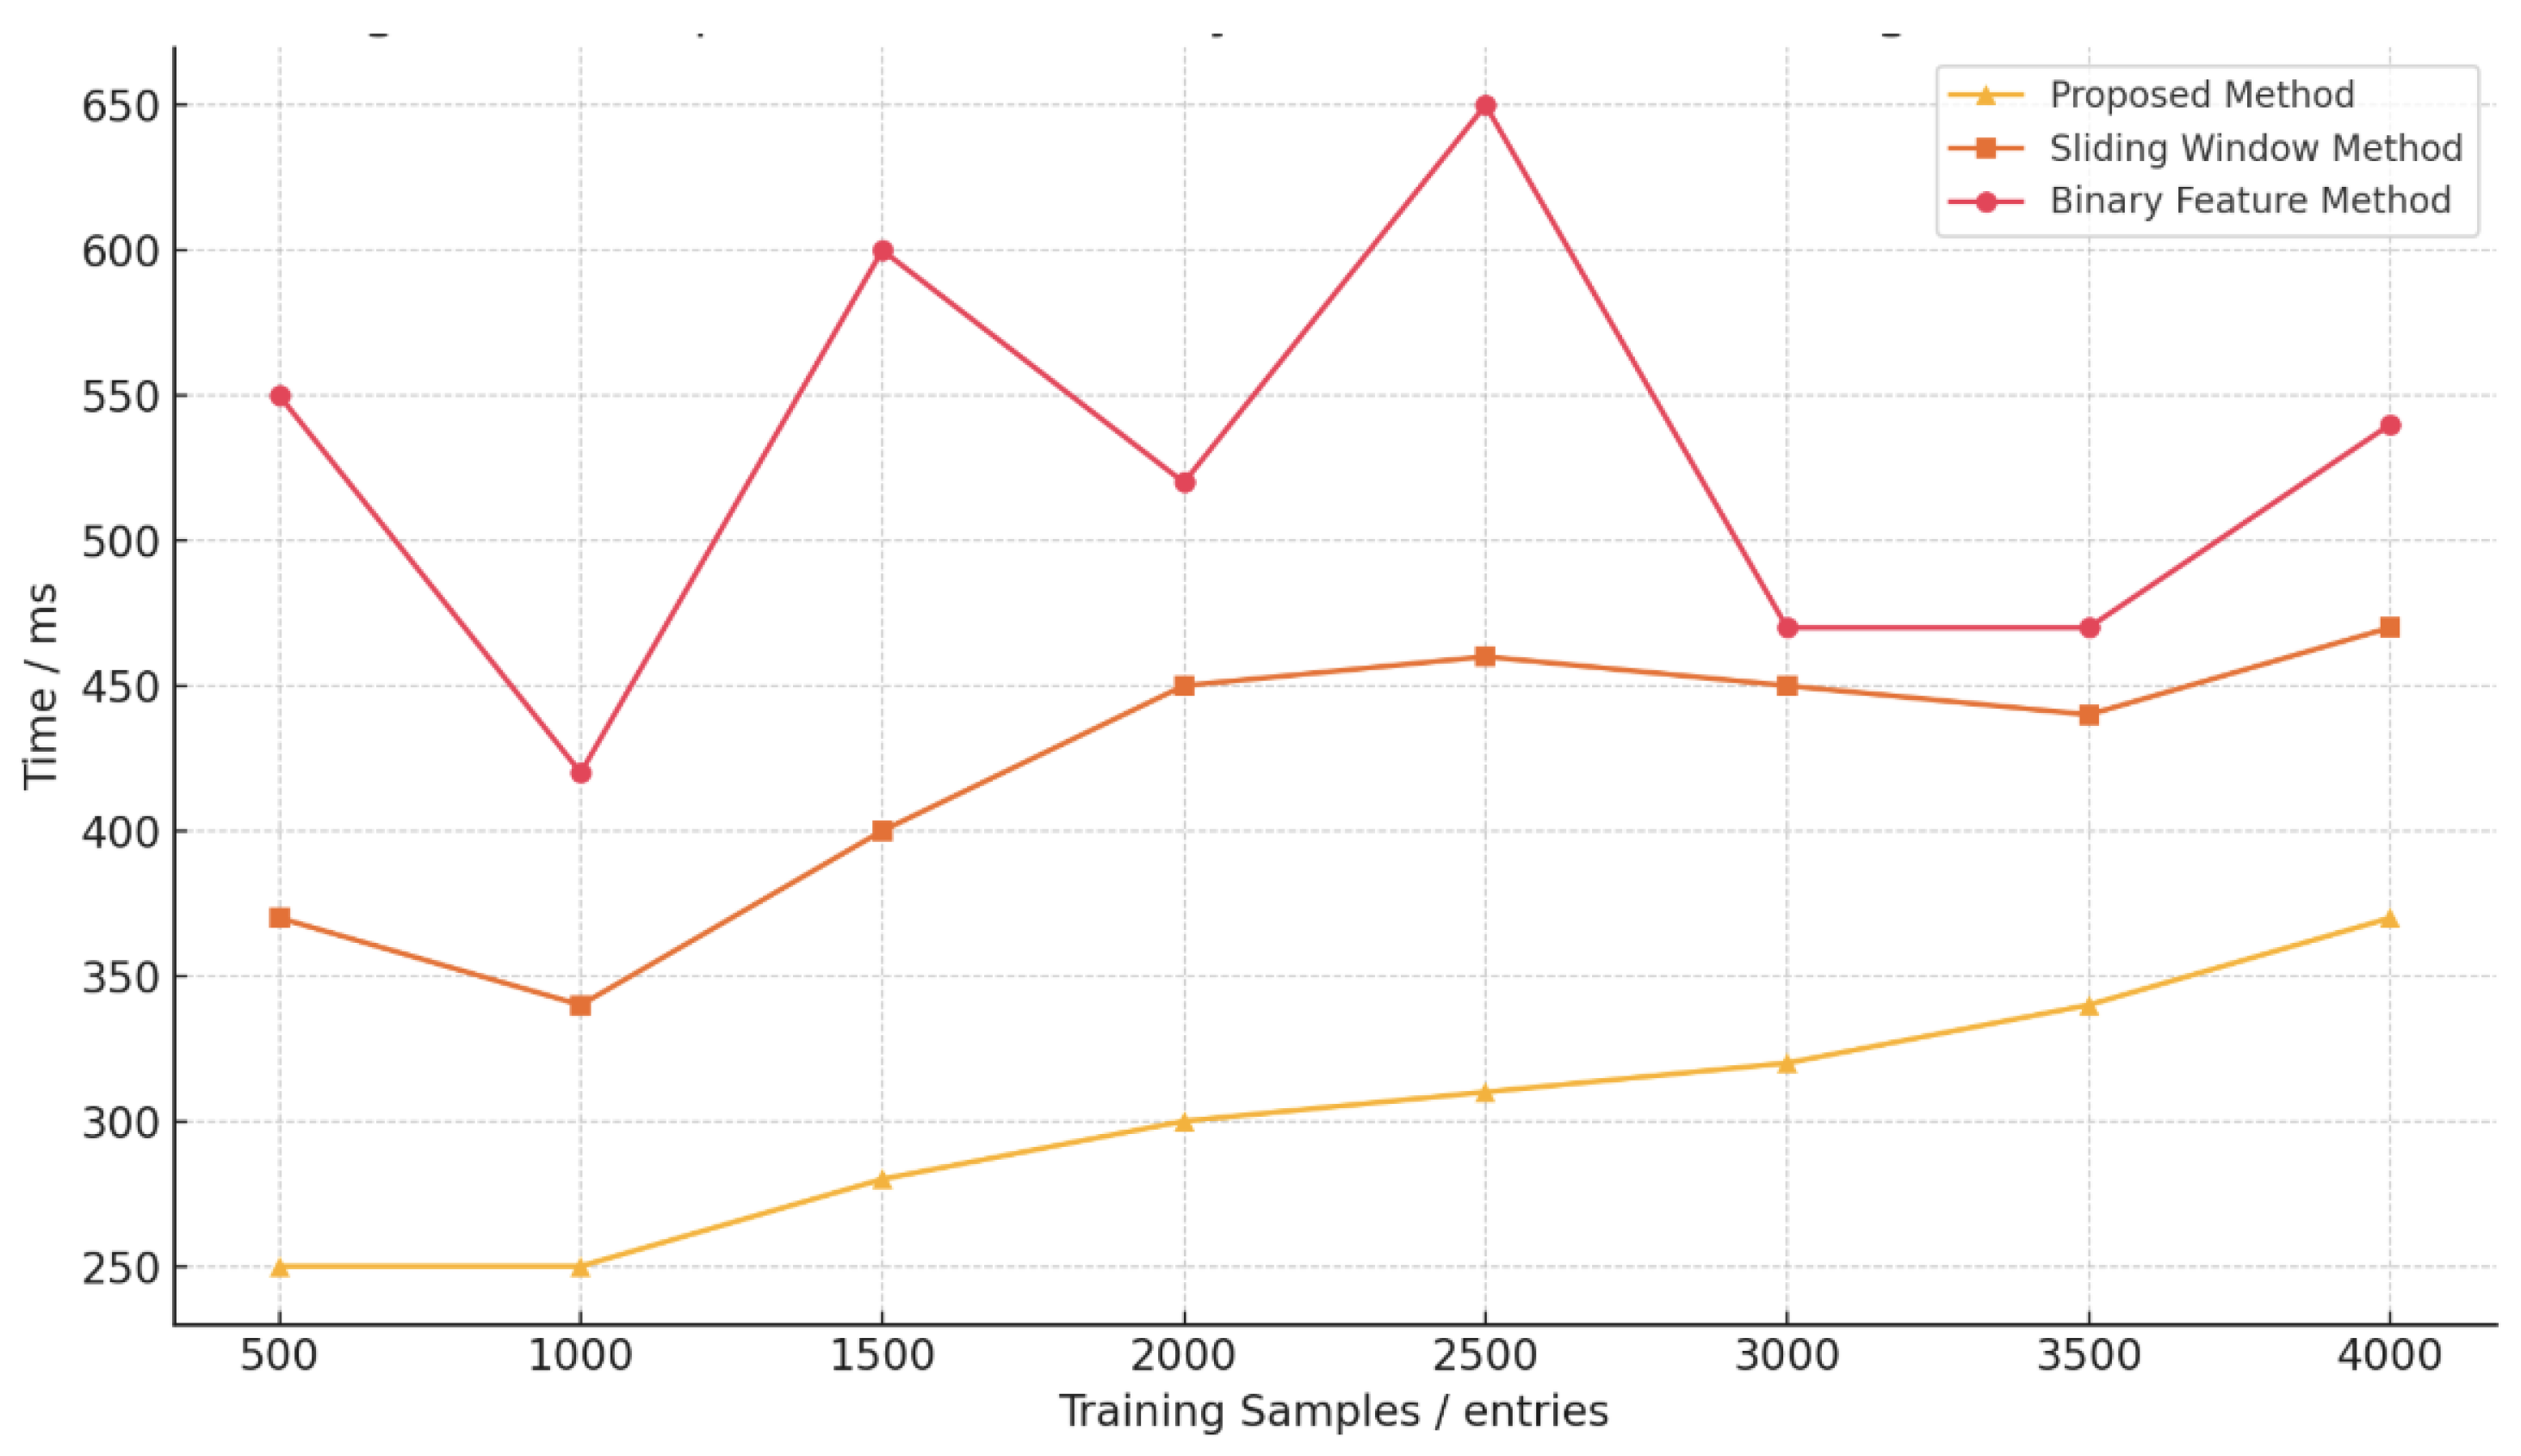

Table 1.
Comparison of anomaly detection errors using three methods (%)
| Training Data | Proposed Method | Sliding Window | Binary Feature | |||
|---|---|---|---|---|---|---|
| (Count) | RMSE | MAE | RMSE | MAE | RMSE | MAE |
| 600 | 24.3 | 41.2 | 36.5 | 48.9 | 38.9 | 50.3 |
| 1200 | 21.4 | 40.6 | 32.1 | 45.3 | 37.7 | 48.6 |
| 1800 | 19.6 | 38.2 | 30.9 | 44.1 | 35.4 | 45.2 |
| 2400 | 17.3 | 36.0 | 28.7 | 41.9 | 34.9 | 44.0 |
| 3000 | 15.8 | 31.2 | 27.0 | 39.6 | 33.1 | 42.8 |
| 3600 | 13.5 | 30.6 | 24.8 | 37.1 | 31.0 | 38.5 |
| 4200 | 10.2 | 29.1 | 19.6 | 35.9 | 27.7 | 36.4 |
| 4800 | 8.6 | 27.9 | 17.6 | 33.3 | 25.4 | 34.0 |
| 5400 | 5.2 | 24.6 | 15.3 | 31.1 | 22.9 | 31.2 |
| 6000 | 1.7 | 21.7 | 14.2 | 27.5 | 19.5 | 28.6 |
Disclaimer/Publisher’s Note: The statements, opinions and data contained in all publications are solely those of the individual author(s) and contributor(s) and not of MDPI and/or the editor(s). MDPI and/or the editor(s) disclaim responsibility for any injury to people or property resulting from any ideas, methods, instructions or products referred to in the content. |
© 2025 by the authors. Licensee MDPI, Basel, Switzerland. This article is an open access article distributed under the terms and conditions of the Creative Commons Attribution (CC BY) license (http://creativecommons.org/licenses/by/4.0/).
Copyright: This open access article is published under a Creative Commons CC BY 4.0 license, which permit the free download, distribution, and reuse, provided that the author and preprint are cited in any reuse.


