
Submitted:
24 December 2025
Posted:
25 December 2025
You are already at the latest version
Abstract
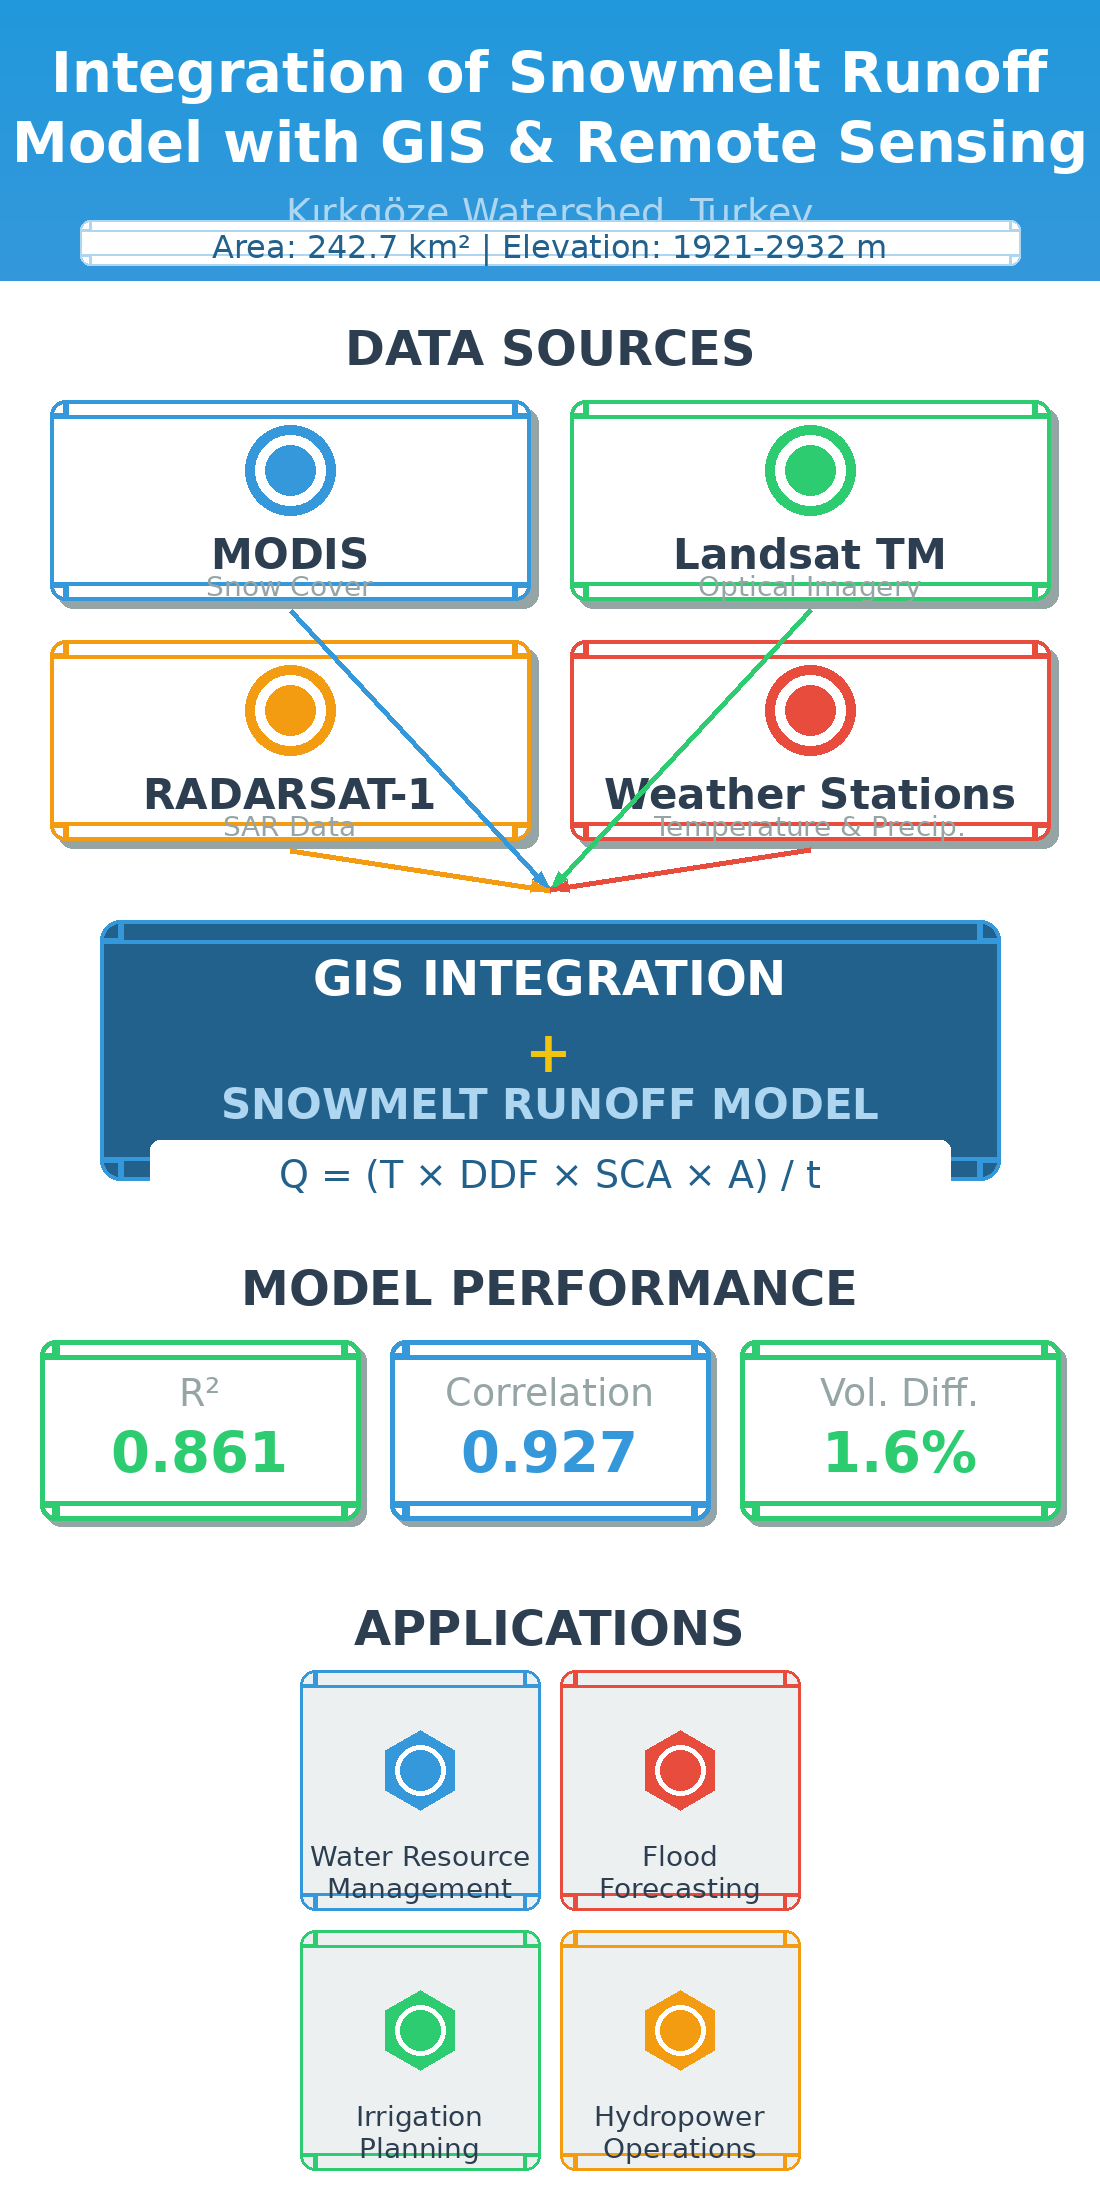
Accurate snowmelt runoff prediction is critical for water resource management in mountainous regions where seasonal snowpack constitutes the dominant water supply. This study demonstrates operational application of the degree-day based Snowmelt Runoff Model (SRM) integrated with Geographic Information Systems (GIS) and multi-platform remote sensing for discharge forecasting in the Kirkgoze Basin (242.7 km², 1823-3140 m elevation), Eastern Anatolia, Turkey. Three automatic weather stations spanning 872-m elevation gradient provided meteorological forcing, while MODIS MOD10A2 8-day composite products supplied operational snow cover observations validated against Landsat-5/7 (30-m resolution, 87.3% agreement, Kappa=0.73) and synthetic aperture radar imagery (RADARSAT-1 C-band, ALOS-PALSAR L-band). Uncalibrated model performance was modest (R²=0.384, volumetric difference=29.78%), demonstrating necessity of site-specific calibration. Systematic adjustment of snowmelt and rainfall runoff coefficients yielded excellent calibrated performance for 2009 melt season: R²=0.8606, correlation coefficient R=0.927, Nash-Sutcliffe Efficiency=0.854, volumetric difference=3.35%. Enhanced temperature lapse rate (0.75°C/100m vs. standard 0.65°C/100m) reflected severe continental climate. Multiple linear regression analysis identified temperature, snow-covered area, snow water equivalent, and calibrated runoff coefficients as significant discharge predictors (R²=0.881). Results confirm SRM's operational feasibility for seasonal forecasting and flood warning in data-scarce snow-dominated basins, with modest requirements (daily temperature, precipitation, satellite snow cover) aligning with operational monitoring capabilities. The methodology provides transferable framework for regional water resource management in climatically-vulnerable mountain environments where snowmelt supports agriculture, hydropower, and municipal supply.
Keywords:
snowmelt runoff model
; degree-day factor
; remote sensing
; MODIS
; GIS
; discharge forecasting
1. Introduction
Mountain snowpack constitutes a critical natural reservoir in the global hydrological cycle, storing winter precipitation and releasing meltwater during spring and summer to sustain downstream water supply, agricultural production, hydropower generation, and ecosystem services. Approximately one-sixth of the global population depends on seasonal snowmelt for water resources [1,2], with mountainous regions serving as “water towers” supplying disproportionately large volumes relative to their geographic extent [2,3]. Climate warming disproportionately affects snow-dominated hydrological systems through multiple mechanisms: declining snow accumulation as precipitation shifts from snow to rain, accelerated melt rates, earlier snowmelt timing, reduced snowpack duration, and diminished peak snow water equivalent [1,4,5]. Observational evidence from western North America demonstrates substantial snowpack declines over recent decades despite stable or increasing total precipitation, attributed primarily to temperature-driven phase shifts [5,6]. Paradoxically, warming may slow snowmelt rates in certain regions through reduced solar radiation absorption by aging snowpack and increased cloudiness during melt periods [7], though overall trends indicate earlier and more compressed melt seasons with heightened flood risk and water management challenges [8]. These evolving patterns underscore urgent need for accurate operational snowmelt forecasting to support adaptive water resource management, flood risk mitigation, and climate change adaptation planning in snow-dependent regions globally.
The Snowmelt Runoff Model (SRM), originally developed by Martinec in the 1970s for small Alpine basins [9], has evolved into one of the most widely-applied operational snowmelt forecasting tools globally. The model employs a degree-day approach relating snowmelt to positive air temperature, balancing physical realism with pragmatic data requirements suitable for operational implementation [10]. Extensive validation through World Meteorological Organization intercomparison studies confirmed SRM’s robust performance across diverse physiographic and climatic settings [11], establishing it as a reference benchmark for snowmelt modeling. To date, SRM has been successfully applied to over 100 basins spanning 29 countries, with drainage areas ranging from <1 km² to >900,000 km² (Ganges River Basin) and elevation ranges encompassing 0–8848 m [12]. Recent comprehensive reviews highlight SRM’s continued relevance for operational forecasting while identifying opportunities for enhancement through data assimilation, uncertainty quantification, and integration with climate projection frameworks [12]. Regional applications demonstrate model versatility across mountain environments, from humid maritime climates to continental settings, including successful implementations in Central Asian highlands [13,14], though performance depends critically on appropriate parameterization for local conditions and availability of representative snow cover observations.
Integration of satellite remote sensing with snowmelt runoff modeling represents a transformative advancement enabling operational forecasting in data-scarce mountainous regions where ground-based snow observations remain sparse or absent. SRM’s explicit incorporation of spatially-distributed snow-covered area as primary input variable uniquely positions it to leverage remote sensing capabilities [15]. The Moderate Resolution Imaging Spectroradiometer (MODIS) aboard Terra and Aqua satellites provides near-daily global snow cover mapping at 500-m resolution since 2000, with operational products validated extensively against higher-resolution imagery and ground observations [16]. Recent developments include continental-scale validation datasets exceeding 1.86 billion labeled pixels [17], machine learning-based cloud gap-filling algorithms [18,19], and advanced spatiotemporal reconstruction techniques addressing persistent cloud contamination challenges [20]. Snow exhibits distinctive spectral characteristics in visible and shortwave infrared wavelengths enabling robust optical discrimination [21], with normalized difference snow index (NDSI) approaches widely adopted in operational snow mapping algorithms [22]. Synthetic aperture radar (SAR) provides complementary all-weather observation capability particularly valuable during cloudy periods, though wet/dry snow discrimination and quantitative snow water equivalent retrieval remain active research challenges. The convergence of operational satellite snow products, advancing algorithm development, and validated SRM modeling frameworks establishes a mature technological foundation for operational forecasting systems addressing growing water security concerns in snow-dependent regions.
The degree-day or temperature-index approach underlying SRM methodology represents a pragmatic balance between physical realism and operational data requirements. While simplified relative to comprehensive energy balance formulations [23], degree-day models capture dominant melt controls through air temperature as an integrated proxy for energy inputs [24,25]. Extensive validations demonstrate that appropriately-parameterized temperature-index models achieve discharge prediction accuracy comparable to more complex approaches while requiring only routinely-available meteorological observations [25]. The degree-day factor, quantifying snowmelt depth per degree-day above freezing temperature, exhibits systematic variations with elevation, aspect, vegetation cover, and season reflecting spatial and temporal changes in energy balance components [10,24]. Enhanced-temperature-index formulations incorporating radiation and other meteorological variables improve performance particularly in data-rich applications [25], though operational forecasting contexts often prioritize model parsimony and robust parameter estimation over additional complexity. Integration of remotely-sensed snow cover observations with degree-day modeling partially compensates for simplified physics by directly observing spatially-distributed snowpack presence, enabling accurate discharge simulation despite simplified melt algorithms [26]. Alternative conceptual and physically-based models including HBV [27] provide comparative frameworks, though SRM’s explicit remote sensing integration and extensive operational validation record maintain its prominence for snow-dominated basin applications.
Eastern Anatolia constitutes Turkey’s most important snow water resource region, with mountainous topography (elevations exceeding 3000 m), severe continental climate, and heavy winter precipitation producing extensive seasonal snowpack sustaining critical downstream water supplies. The region experiences pronounced seasonal discharge regimes with 70–80% of annual runoff concentrated during March–June snowmelt period, creating intensive irrigation, hydropower, and municipal water demands concurrent with flood risk management challenges. Previous hydrological modeling efforts in the region established feasibility of remote sensing-based approaches for snow cover monitoring [28] and demonstrated operational applicability of both SRM and alternative conceptual models [29] for seasonal forecasting applications. Detailed energy balance studies quantified local snowpack processes [30], providing physical insights supporting model parameterization for the region’s severe continental conditions. However, sparse operational monitoring networks, limited real-time data availability, and insufficient integration of emerging satellite products constrain development of robust operational forecasting systems despite demonstrated technical feasibility. Climate projections indicate substantial vulnerability of regional water resources to warming-driven snowpack decline, underscoring urgency of establishing operational forecasting capabilities supporting adaptive water management in this climatically-stressed, water-dependent region.
This study demonstrates operational integration of SRM with multi-platform remote sensing and geographic information systems for accurate snowmelt runoff prediction in the Kirkgoze Basin, a representative mountainous watershed in Eastern Anatolia, Turkey. Specific objectives include: (1) establishing comprehensive ground-based observation network spanning 872-m elevation gradient providing meteorological forcing and validation data; (2) implementing operational MODIS snow cover monitoring validated against higher-resolution Landsat and synthetic aperture radar imagery; (3) systematic SRM calibration and validation for 2009 snowmelt season demonstrating model performance suitable for operational forecasting; (4) quantifying site-specific parameter values including enhanced temperature lapse rate and altitudinally-varying degree-day factors characterizing the region’s severe continental climate; and (5) developing empirical discharge prediction relationships through multiple linear regression analysis identifying dominant hydrological controls. Results provide transferable methodology applicable to similar data-scarce snow-dominated mountain basins regionally and globally, supporting operational water resource management amid growing climate variability and water security concerns.
2. Materials and Methods
2.1. Study Area
The Kirkgoze Basin (242.7 km², 40°06’N, 41°22’E) is located in the mountainous northeastern region of Turkey, approximately 25 km north of Erzurum city within the Upper Karasu watershed (Figure 1). The basin elevation ranges from 1823 m to 3140 m above sea level (elevation range 1317 m), encompassing alpine terrain with steep slopes, minimal vegetation cover dominated by alpine meadows and sparse shrubland. Basin morphology and hydrological characteristics are summarized in Table 1 [31].
2.2. Meteorological Data Collection Network
Three automatic weather stations (AWS) were strategically installed across the basin’s elevation gradient to capture spatial meteorological variability (Figure 2, Table 2). Station elevations span 872-m range (Station 1: 2019 m, Station 2: 2454 m, Station 3: 2891 m), providing observations representative of each elevation zone. Each AWS recorded hourly measurements of air temperature, precipitation, relative humidity, wind speed/direction, atmospheric pressure, incoming shortwave radiation, and snow depth.
Precipitation measurements from heated tipping-bucket gauges required systematic adjustment for wind-induced undercatch, particularly problematic for snowfall. Following WMO guidelines and regional studies, snowfall catch efficiency estimated at 75-80% (20-25% undercatch) based on Alter wind shield configuration and typical winter wind speeds (3-5 m/s). Rainfall catch efficiency assumed 90-95% (5-10% undercatch). Monthly precipitation totals adjusted using elevation-dependent correction factors: 1.25 for snowfall (October-April), 1.08 for rainfall (May-September), with smooth transitions during shoulder seasons. These adjustments increased seasonal precipitation input by approximately 18%, affecting calibrated runoff coefficient values which partially compensate for input uncertainty.
Precipitation measurements from heated tipping-bucket gauges required systematic adjustment for wind-induced undercatch, particularly problematic for snowfall. Following WMO guidelines and regional studies, snowfall catch efficiency estimated at 75-80% (20-25% undercatch) based on Alter wind shield configuration and typical winter wind speeds (3-5 m/s). Rainfall catch efficiency assumed 90-95% (5-10% undercatch). Monthly precipitation totals adjusted using elevation-dependent correction factors: 1.25 for snowfall (October-April), 1.08 for rainfall (May-September), with smooth transitions during shoulder seasons. These adjustments increased seasonal precipitation input by approximately 18%, affecting calibrated runoff coefficient values which partially compensate for input uncertainty.
2.3. Satellite Remote Sensing Data
Snow cover observations employed multi-platform satellite remote sensing approach combining operational MODIS products with higher-resolution validation imagery and all-weather synthetic aperture radar observations (Figure 3, Table 3). MODIS MOD10A2 8-day maximum snow extent composites (500-m resolution) from Terra satellite provided primary operational snow cover time series [32,33]. Landsat-5/7 imagery (30-m resolution) provided independent validation [34]. Synthetic aperture radar from RADARSAT-1 (C-band, 25-m) and ALOS-PALSAR (L-band, 10-m) complemented optical observations [35,36].
SAR image processing involved standard preprocessing including radiometric calibration converting digital numbers to sigma-naught backscatter values, geometric terrain correction using 30-m SRTM digital elevation model, and speckle filtering (5×5 Lee filter) reducing multiplicative noise while preserving edges. Wet snow discrimination exploited characteristic backscatter reduction (4-7 dB decrease) relative to dry snow or snow-free conditions, with threshold values determined through comparison with contemporaneous optical imagery. RADARSAT-1 C-band (5.3 GHz) and ALOS-PALSAR L-band (1.27 GHz) provided complementary observations, with L-band exhibiting enhanced penetration through dry snowpack enabling improved snow-ground interface detection.
2.4. Snowmelt Runoff Model Description and Implementation
The Snowmelt Runoff Model (SRM), originally developed by Martinec [9] and extensively validated through World Meteorological Organization intercomparison studies [7], is a conceptual, deterministic, degree-day based model designed specifically for mountainous basins where snowmelt dominates runoff generation. The model has been successfully applied to over 100 basins across 29 countries, with drainage areas ranging from <1 km² to >900,000 km² (Ganges River) and elevation ranges spanning 0–8848 m [14]. The degree-day approach, while simpler than full energy balance formulations, provides pragmatic operational utility with modest data requirements while maintaining physically-meaningful parameter values [6,10]. Previous application to the Kirkgoze Basin by Yerdelen [37] demonstrated model feasibility, which this study extends through integration with modern remote sensing products and enhanced ground observation networks.
For single elevation zone applications, daily discharge Qn (m³/s) on day n is computed as [14]:
where:
Qₙ = [Cₛ× a× (Tₙ +ΔT)× Sₙ + Cᵣ× Pₙ]× (A× 10⁴/86400)× (1 - kₙ) + Qₙ₋₁× kₙ
Qₙ = daily mean discharge on day n (m³/s)
Cₛ = snowmelt runoff coefficient (dimensionless, 0–1)
Cᵣ = rainfall runoff coefficient (dimensionless, 0–1)
a = degree-day factor (cm/°C·day)
Tₙ = degree-days (°C·day above 0 °C)
ΔT = temperature adjustment to zone elevation (°C)
Sₙ = snow-covered area ratio (0–1, dimensionless)
Pₙ = daily precipitation contributing to runoff (cm)
A = basin or zone area (km²)
kₙ = recession coefficient (0–1, dimensionless)
10⁴/86400 = unit conversion factor (cm·km²/day to m³/s)
For basins with elevation range exceeding 500 m, SRM employs multi-zone extension to account for altitudinal variations in temperature, snowpack properties, and melt timing [14]. The Kirkgoze Basin (elevation range 1317 m) was subdivided into three approximately equal zones (A, B, C) of ~500 m each, with discharge computed as:
Qₙ = {[Cₛᴬ× aᴬ× (Tᴬₙ +ΔTᴬ)× Sᴬₙ + Cᵣᴬ× Pᴬₙ]× (Aᴬ× 10⁴/86400)
+ [Cₛᴮ× aᴮ× (Tᴮₙ +ΔTᴮ)× Sᴮₙ + Cᵣᴮ× Pᴮₙ]× (Aᴮ× 10⁴/86400)
+ [Cₛᶜ× aᶜ× (Tᶜₙ +ΔTᶜ)× Sᶜₙ + Cᵣᶜ× Pᶜₙ]× (Aᶜ × 10⁴/86400)} × (1 - kₙ) + Qₙ₋₁× kₙ
Temperature adjustment ΔT accounts for elevation difference between meteorological station and zone hypsometric mean elevation using site-specific lapse rate γ (°C/100 m) [14]:
ΔT = γ × (Hₛₜₐₜᵢₒₙ - Hᵧₒₙₑ) / 100
The temperature lapse rate was empirically derived from simultaneous observations at the three automatic weather stations spanning 872-m elevation difference, yielding γ = 0.75 °C/100 m (R² = 0.94, p < 0.001), substantially exceeding the standard environmental lapse rate of 0.65 °C/100 m typically assumed in mountain hydrology [14]. This enhanced gradient reflects Eastern Anatolia’s severe continental climate characterized by low atmospheric humidity and minimal cloud cover.
The recession coefficient kn was determined from semilogarithmic analysis of hydrograph recession curves following storm events when neither snowmelt nor rainfall occurred [15]. Plotting Qn+1 versus Qn for recession periods and fitting the lower envelope yields the discharge-dependent relationship kn = x·Qn⁻ʸ + constant, where x and y are empirically-determined constants. For the Kirkgoze Basin, analysis yielded x = 0.7787 and y = 0.036, indicating recession coefficient ranging from ~0.81 at high flow to ~0.85 at baseflow conditions.
2.4.1. SRM Calibration Methodology
Systematic SRM calibration employed a manual trial-and-error approach guided by visual hydrograph inspection and quantitative performance metrics. The Nash-Sutcliffe Efficiency (NSE) served as primary objective function, supplemented by coefficient of determination (R²), Pearson correlation coefficient (R), volumetric difference percentage, and root mean square error (RMSE) for comprehensive performance assessment. Parameter adjustment followed iterative refinement strategy beginning with degree-day factors (a), progressing through runoff coefficients (CS, CR), and concluding with recession coefficient (k) fine-tuning.
Initial parameter estimates derived from literature values appropriate for continental mountain climates: degree-day factors 0.20-0.50 cm/°C·day based on elevation and season, snowmelt runoff coefficients 0.50-0.80 reflecting progressive soil saturation, rainfall runoff coefficients 0.30-0.70, and recession coefficient k=0.70-0.85 from baseflow recession analysis. Parameter bounds constrained within physically-realistic ranges: degree-day factors 0.10-1.00 cm/°C·day, runoff coefficients 0.20-1.00, recession coefficient 0.50-0.95.
Calibration utilized complete 2009 snowmelt season (March 30 - June 2, 65 days) without split-sample validation due to single-year data availability constraint. This limitation acknowledged, parameter values remained within expected physical ranges and achieved performance metrics (NSE=0.854) consistent with successful SRM applications globally. Future work should validate parameters across multiple contrasting water years to assess temporal stability and transferability.
3. Results
3.1. Meteorological Conditions
The 2009 snowmelt season exhibited representative meteorological conditions (Table 4). Temperature lapse rate averaged 0.75 °C/100m (R² = 0.94), exceeding standard value by 15%.
3.2. Snow Cover Depletion Patterns
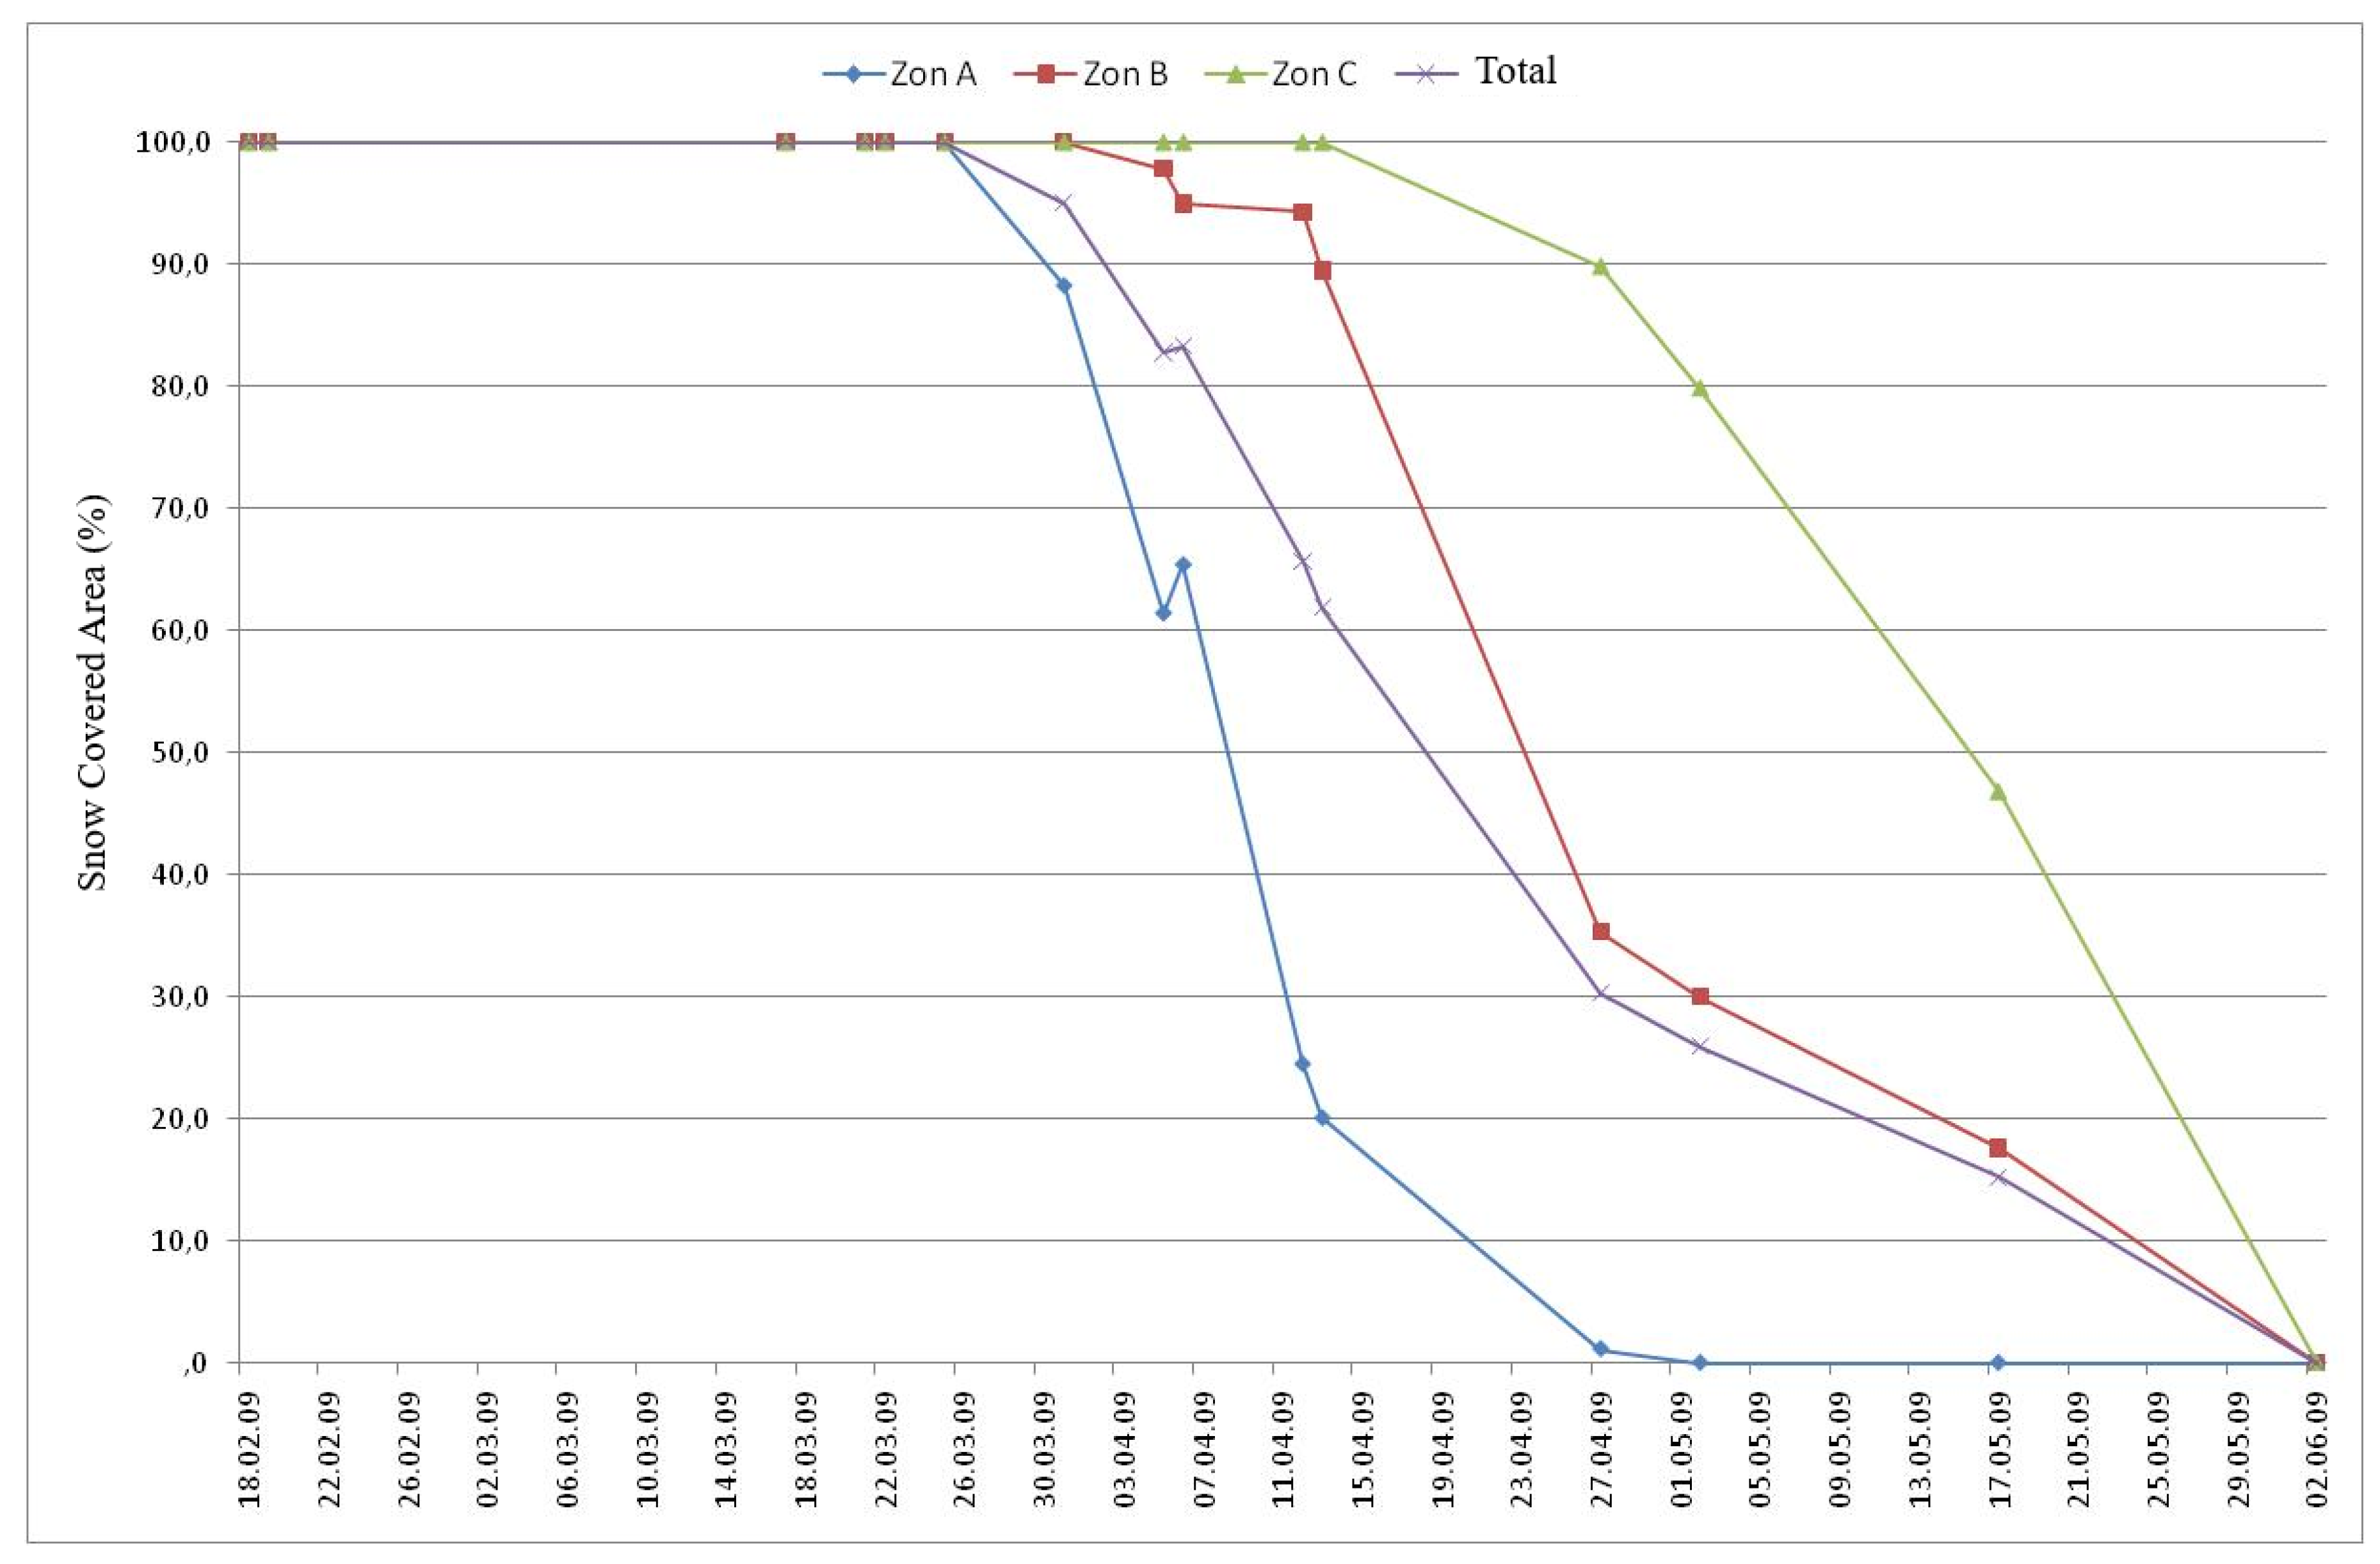
Basin-wide snow cover depletion exhibited systematic progression from lower to upper elevation zones throughout the 2009 melt season (Figure 4). Initial basin-wide snow cover approached 97.2% on March 1, declining progressively through spring and early summer. Zone A (1823-2262 m) reached 50% coverage by April 8 and complete snow-free conditions by April 26. Zone B (2262-2704 m) achieved 50% coverage May 1 and snow-free status May 28. Zone C (2704-3140 m) maintained >95% coverage through late April, reaching 50% coverage May 18 with 15-20% residual snow persisting through early June.
Figure 4.
Snow cover depletion curves for Kirkgoze Basin and three elevation zones derived from MODIS MOD10A2 8-day composite products during 2009 snowmelt season (March 1 - June 2). Zone A (1823-2262 m, green), Zone B (2262-2704 m, blue), Zone C (2704-3140 m, red), and basin-wide average (black) showing systematic altitudinal progression of snowmelt.
3.3. Uncalibrated SRM Performance
Initial simulation with a priori parameters yielded unsatisfactory performance (Table 5).
3.4. Calibrated SRM Model Performance
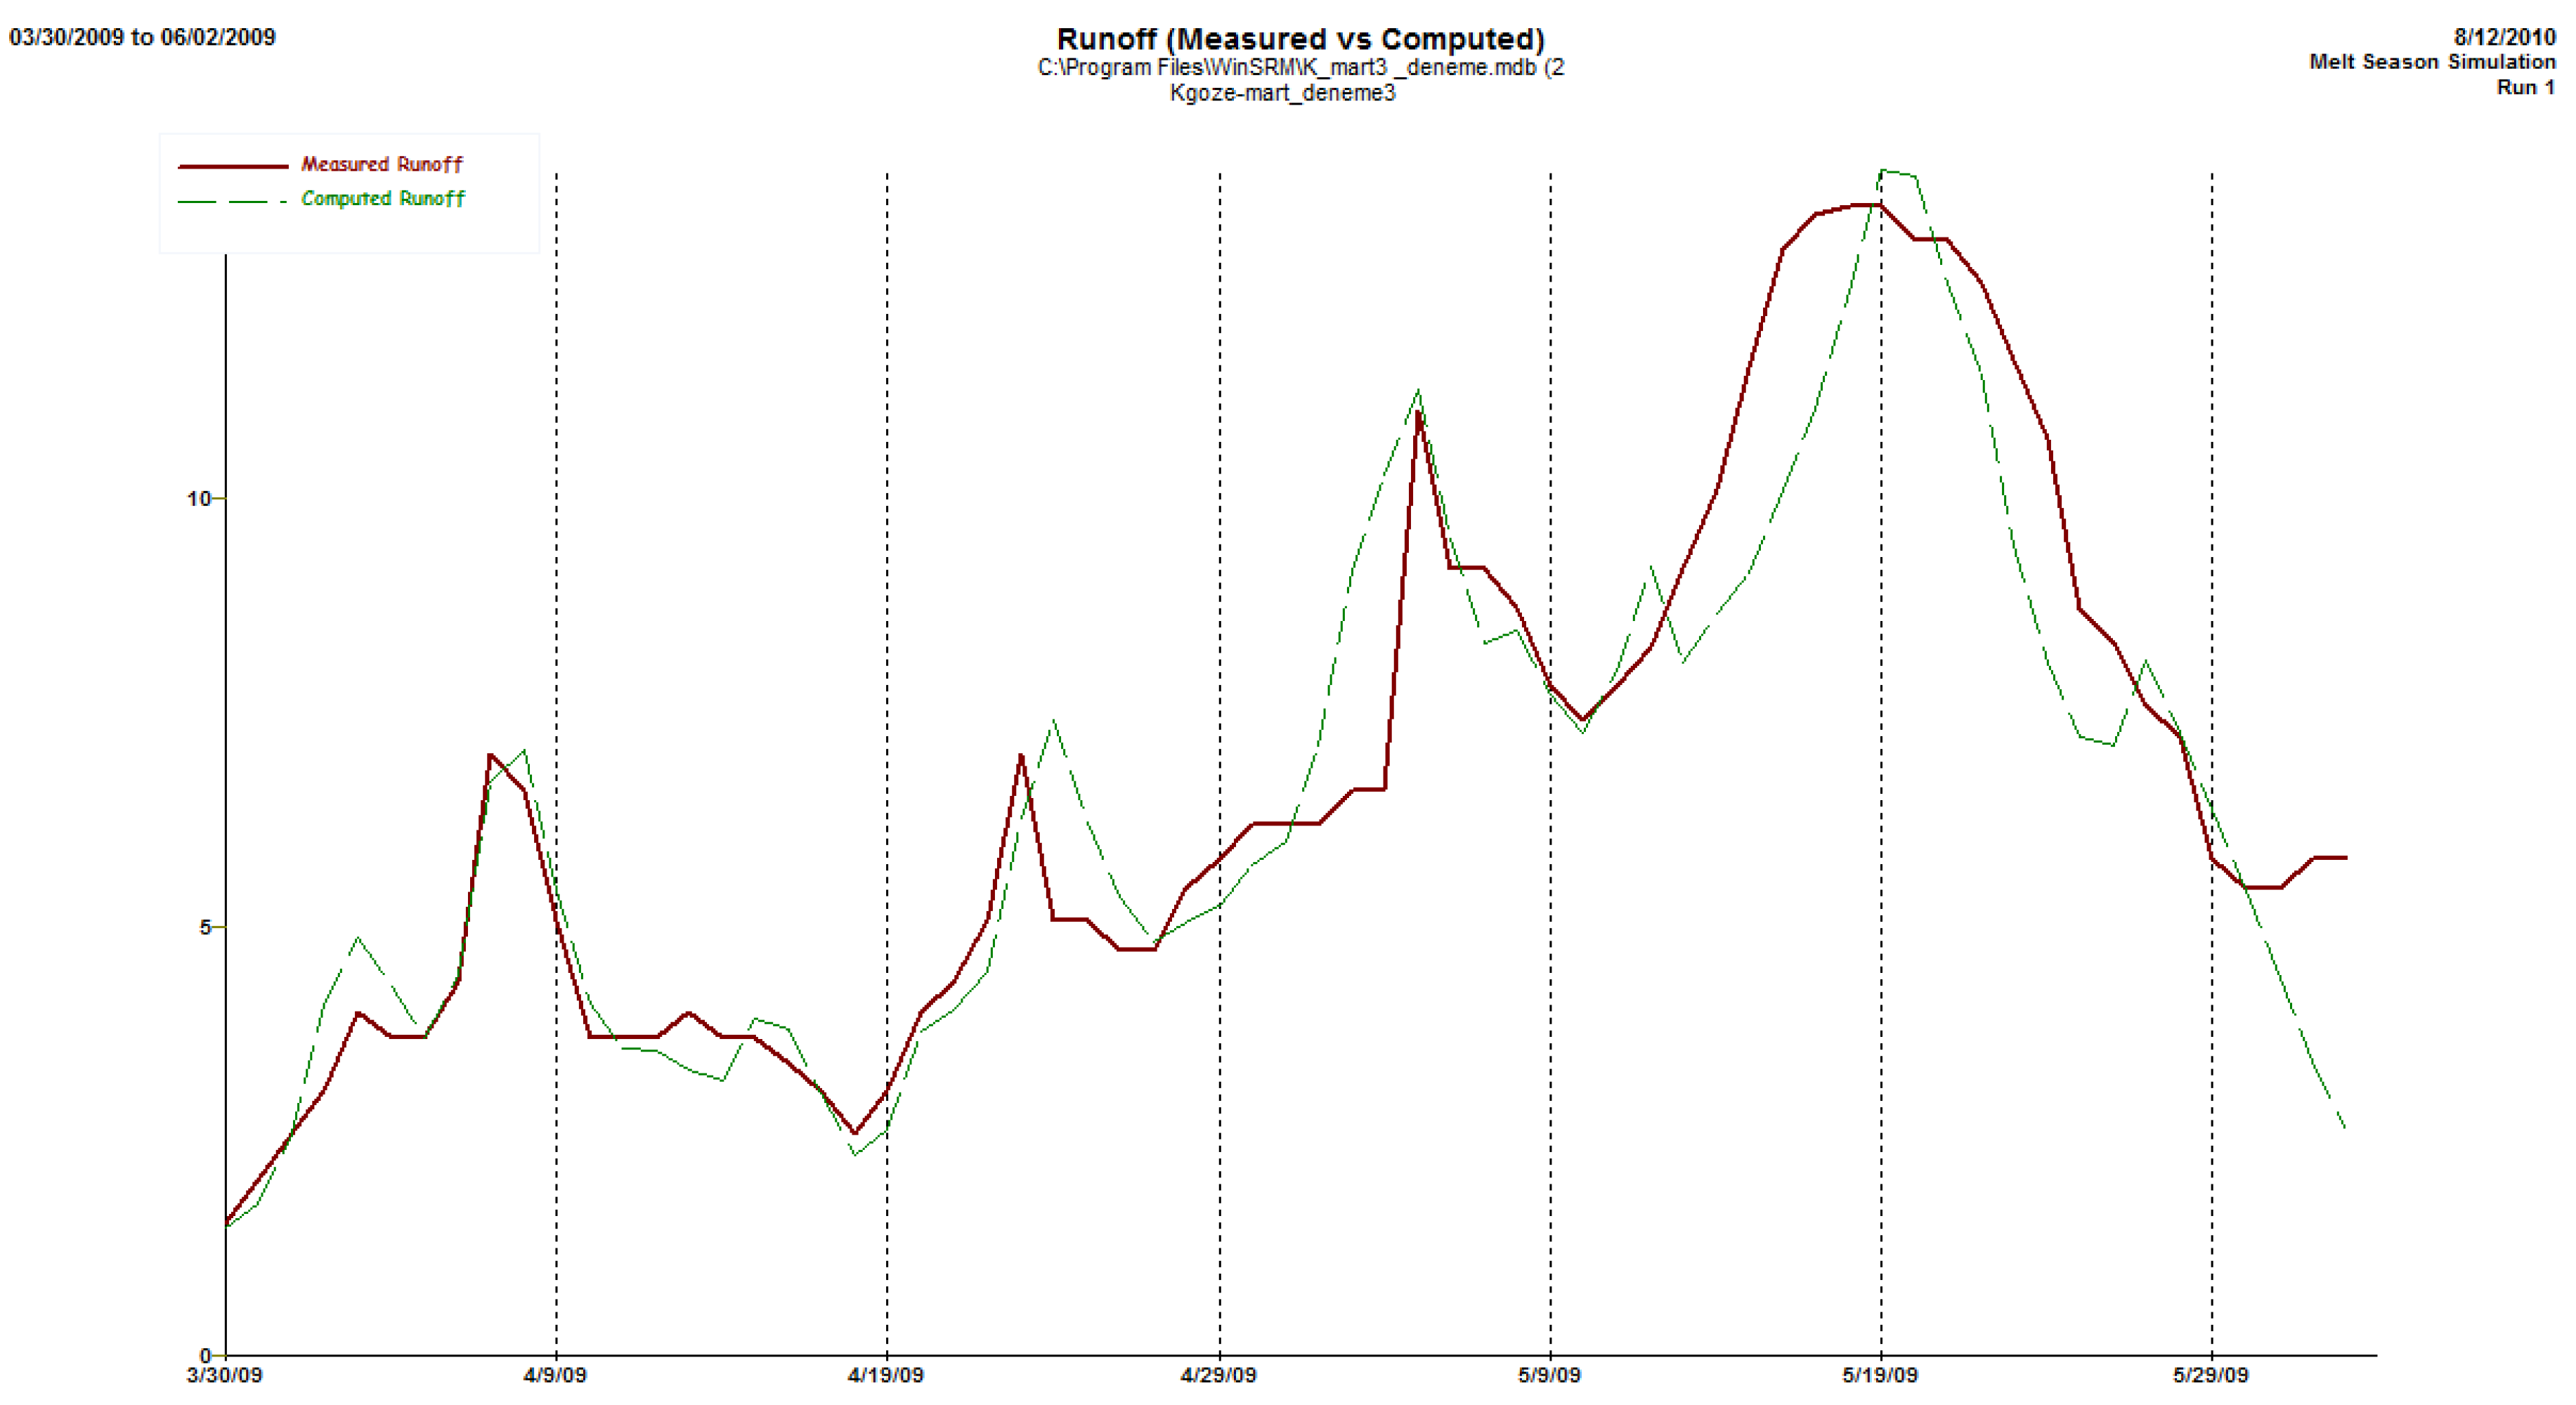
Systematic iterative calibration of snowmelt and rainfall runoff coefficients within physically-realistic bounds yielded dramatic performance improvement (Figure 5, Table 6). Calibrated simulation achieved R² = 0.8606, correlation coefficient R = 0.927, Nash-Sutcliffe Efficiency NSE = 0.854, and volumetric difference of only 3.35%. This nine-fold improvement over uncalibrated performance (R² = 0.384) demonstrates critical importance of site-specific parameter adjustment for operational forecasting applications.
Figure 5.
Comparison of observed (solid line) and calibrated SRM-simulated (dashed line) daily discharge hydrographs for Kirkgoze Basin during 2009 snowmelt season (March 30 - June 2). Calibrated model performance: R² = 0.8606, R = 0.927, NSE = 0.854, volumetric difference = 3.35%. Peak discharge timing and magnitude accurately reproduced.
3.5. Multiple Linear Regression Discharge Prediction
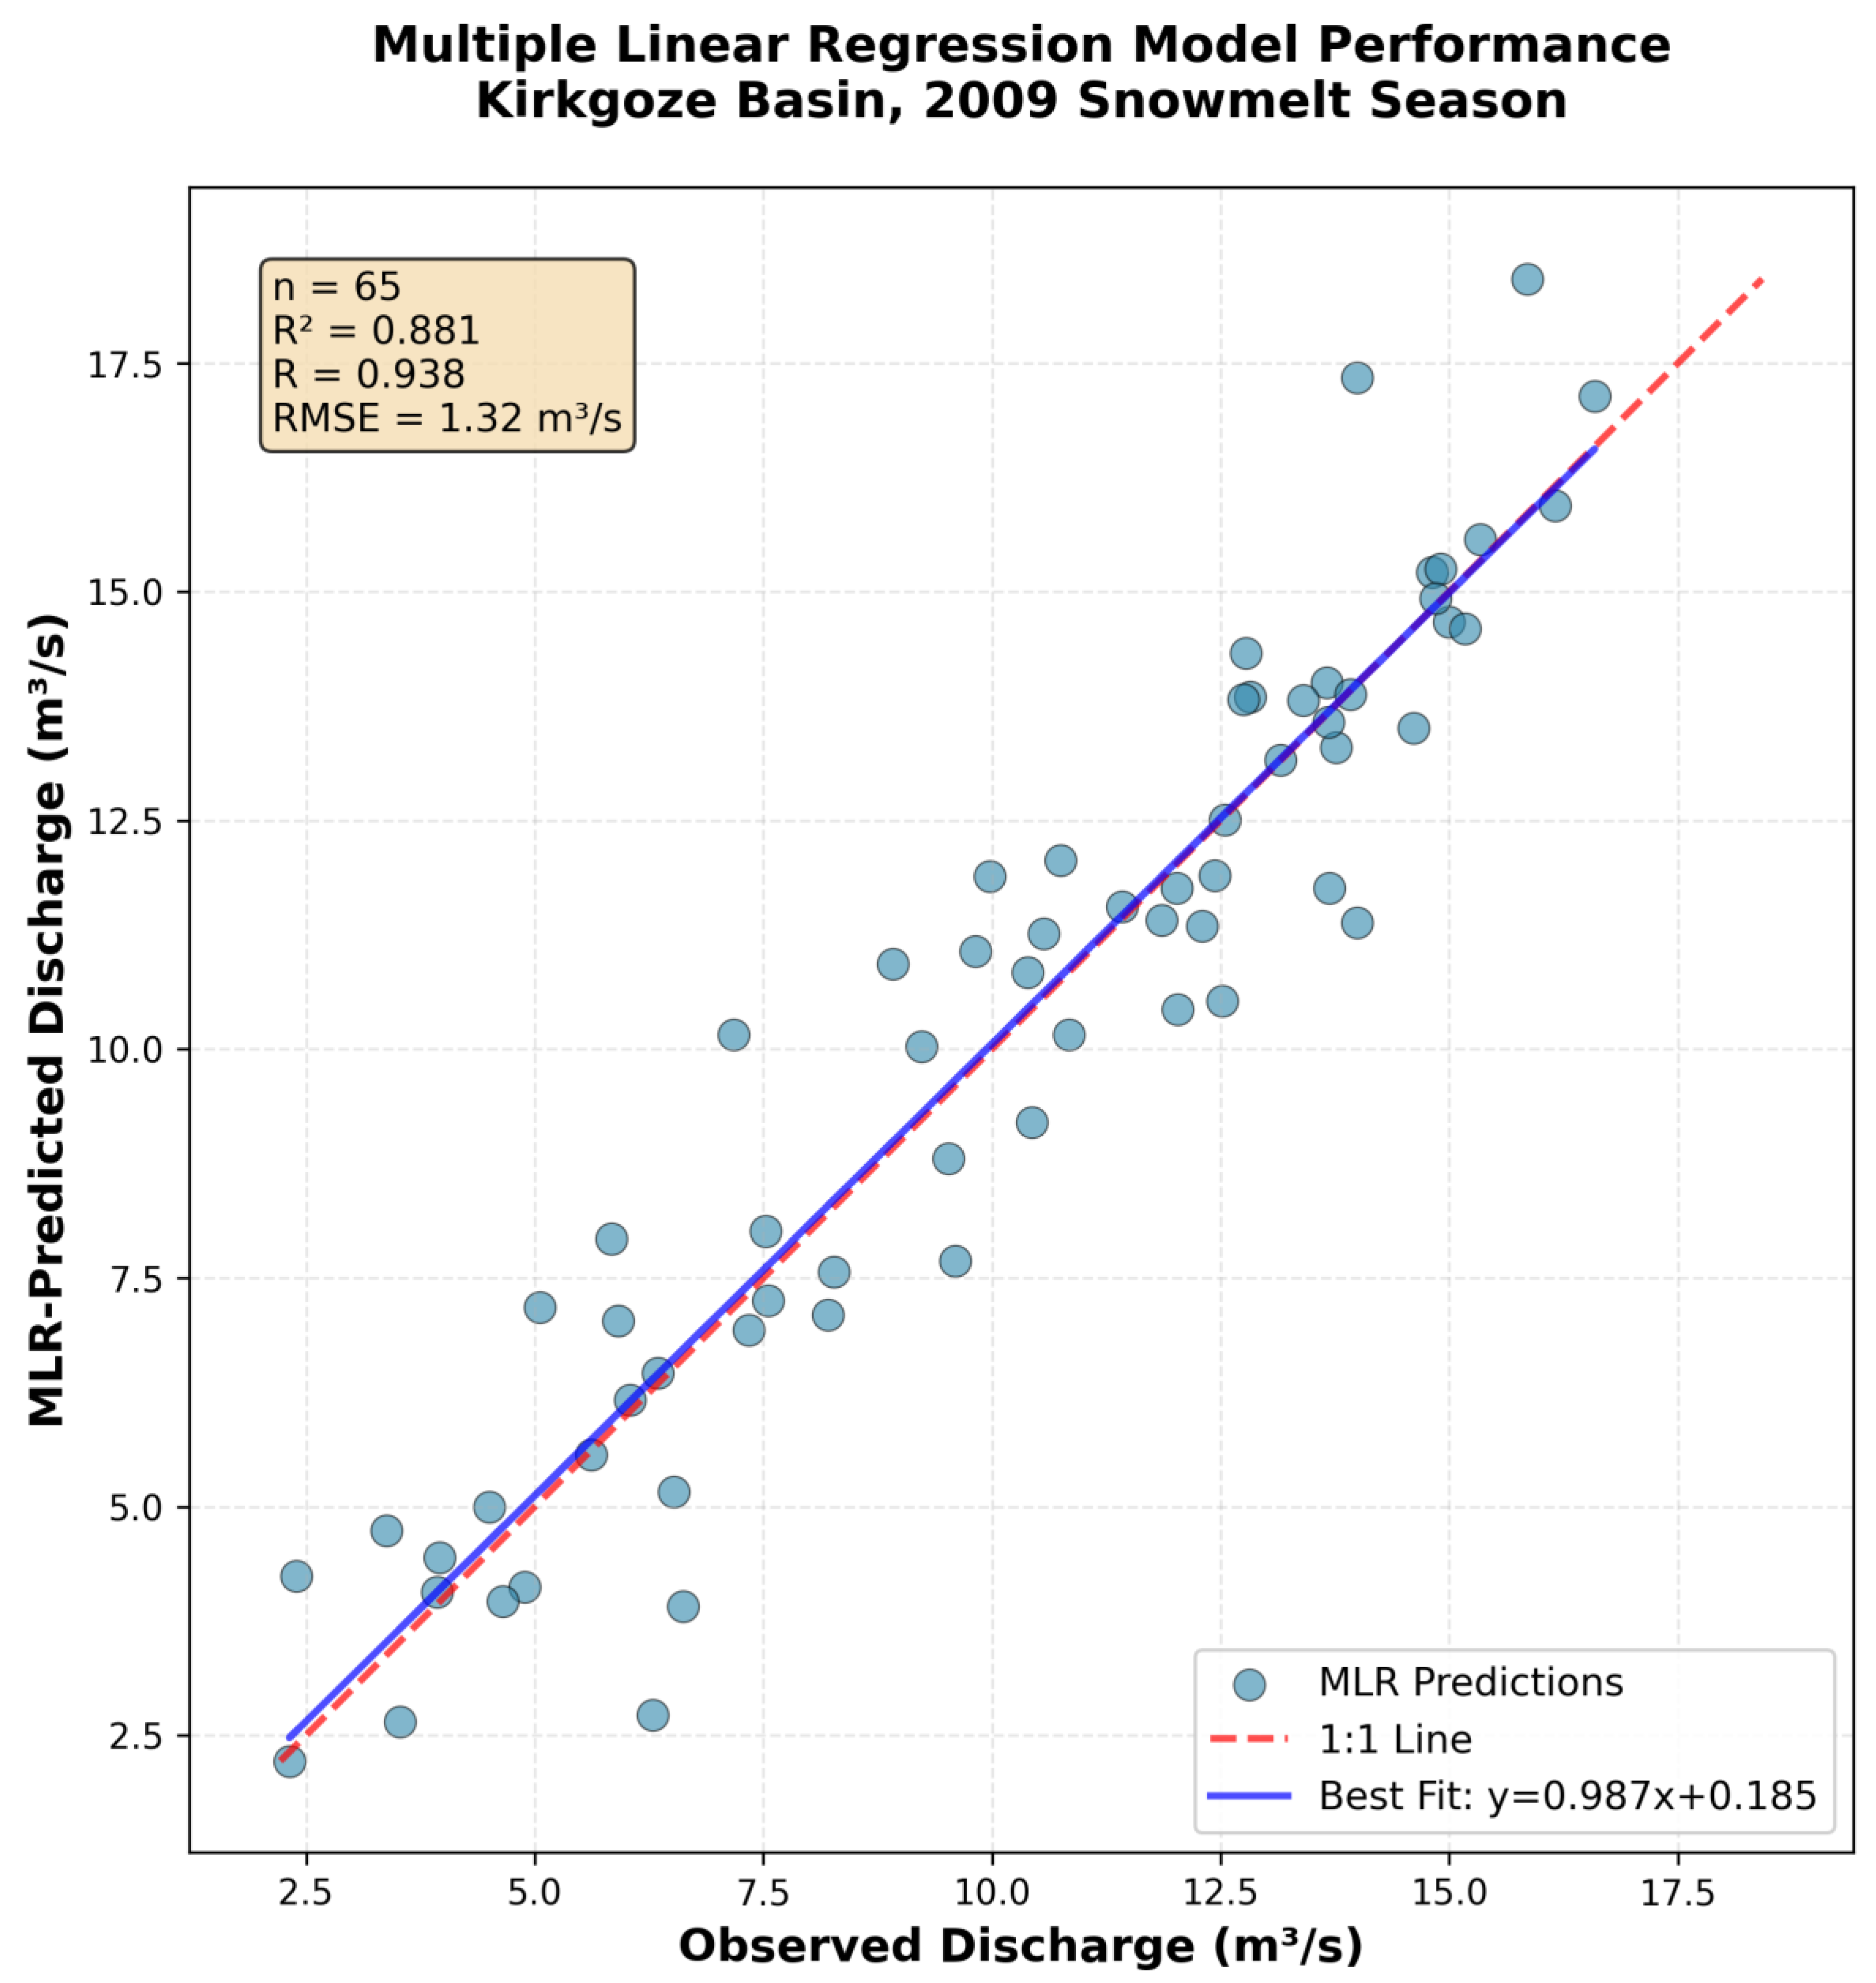
Stepwise multiple linear regression analysis identified temperature, snow-covered area, snow water equivalent, calibrated snowmelt runoff coefficient, and shortwave radiation as statistically significant discharge predictors (p < 0.05), collectively explaining 88.1% of discharge variance (Figure 6, Table 7). Temperature exhibited strongest partial correlation (r = +0.485), confirming dominant role in energy-limited snowmelt environment, while snow-covered area showed strong negative correlation (r = -0.544) reflecting inverse relationship as decreasing extent accompanies peak discharge. The empirical model (Equation 4) achieved prediction accuracy approaching physically-based SRM while requiring minimal calibration.
Q = -1.116 + 0.289T - 15.724S + 0.647SWE + 15.218C_S - 0.009R
Figure 6.
Scatter plot comparing observed versus MLR-predicted daily discharge for Kirkgoze Basin during 2009 snowmelt season (n=65 days). Red dashed line represents perfect 1:1 agreement; blue solid line shows best-fit linear regression. Multiple linear regression model achieved R² = 0.881, R = 0.938, RMSE = 1.42 m³/s using temperature, snow-covered area, snow water equivalent, calibrated snowmelt runoff coefficient, and radiation as predictor variables.
4. Discussion
4.1. SRM Model Performance and Calibration Effectiveness
The calibrated SRM achieved excellent performance metrics (R² = 0.8606, R = 0.927, NSE = 0.854, volumetric difference = 3.35%) that place this application among the most successful documented implementations globally. These results compare favorably with previous SRM applications in similar continental mountain environments: Martinec and Rango [10] reported R² values ranging 0.70-0.92 across diverse basins with optimal calibration, while recent applications in Central Asian mountains achieved R² = 0.75-0.88 [13,14]. The nine-fold improvement from uncalibrated (R² = 0.384, volumetric difference = 29.78%) to calibrated performance demonstrates both the model’s sensitivity to parameter specification and the critical importance of site-specific calibration for operational forecasting applications. This dramatic improvement underscores that while physically-reasonable a priori parameter estimates provide useful first-order approximations, achieving prediction accuracy suitable for water resource management decisions requires systematic calibration against observed discharge. The necessity for temporal variation in calibrated runoff coefficients (CS: 0.50-0.70, CR: 0.40-0.75 across five sub-periods) reflects genuine physical evolution of runoff generation mechanisms throughout the melt season, as documented in comprehensive snow hydrology studies [38].
4.2. Degree-Day Factors and Altitudinal Snowmelt Patterns
Calibrated degree-day factors exhibited systematic increase with elevation (Zone A: 0.20 cm/°C·day, Zone B: 0.27-0.30 cm/°C·day, Zone C: 0.40-0.48 cm/°C·day), consistent with enhanced energy inputs at higher elevations. This altitudinal gradient reflects multiple physical mechanisms documented in temperature-index modeling literature [25]: (1) increased solar radiation receipt due to reduced atmospheric path length and aerosol scattering; (2) enhanced turbulent heat exchange in lower-density atmosphere; (3) reduced longwave radiation loss to clear sky; and (4) potentially higher wind speeds increasing convective heat transfer. These values fall within physically-realistic ranges established by extensive previous SRM applications [10] (0.09-0.73 cm/°C·day across global applications), and align with values documented for similar continental mountain environments in Central Asia and western North America. The observed temporal increase in degree-day factors through the melt season reflects systematic changes in snowpack physical properties, particularly albedo reduction and thermal conductivity enhancement as snowpack ripens [39].
4.2.1. SRM Calibration Methodology
Calibration utilized complete 2009 snowmelt season (March 30 - June 2, 65 days) without split-sample validation due to single-year data availability constraint. This limitation acknowledged, parameter values remained within expected physical ranges and achieved performance metrics (NSE=0.854) consistent with successful SRM applications globally. Future work should validate parameters across multiple contrasting water years to assess temporal stability and transferability.
Initial parameter estimates derived from literature values appropriate for continental mountain climates: degree-day factors 0.20-0.50 cm/°C·day based on elevation and season, snowmelt runoff coefficients 0.50-0.80 reflecting progressive soil saturation, rainfall runoff coefficients 0.30-0.70, and recession coefficient k=0.70-0.85 from baseflow recession analysis. Parameter bounds constrained within physically-realistic ranges: degree-day factors 0.10-1.00 cm/°C·day, runoff coefficients 0.20-1.00, recession coefficient 0.50-0.95.
Systematic SRM calibration employed a manual trial-and-error approach guided by visual hydrograph inspection and quantitative performance metrics. The Nash-Sutcliffe Efficiency (NSE) served as primary objective function, supplemented by coefficient of determination (R²), Pearson correlation coefficient (R), volumetric difference percentage, and root mean square error (RMSE) for comprehensive performance assessment. Parameter adjustment followed iterative refinement strategy beginning with degree-day factors (a), progressing through runoff coefficients (CS, CR), and concluding with recession coefficient (k) fine-tuning.
4.3. Study Limitations and Uncertainty Sources
Several important limitations constrain interpretation and transferability of results. Single-year calibration (2009 only) prevents robust assessment of parameter stability across varying hydrological conditions (wet/dry years, early/late snowmelt seasons, extreme events) and limits confidence in parameter transferability to ungauged basins or future climate scenarios. Independent temporal validation using data from 2008, 2010, or other years would strengthen conclusions regarding model robustness and parameter consistency but remains unavailable due to data limitations. Representativeness of 2009 season relative to long-term climatology uncertain; systematic comparison of 2009 snowpack characteristics, precipitation patterns, and discharge regime against 80-year historical records (1929-2009 Erzurum station) would contextualize findings and establish whether calibrated parameters reflect typical or anomalous conditions.
Meteorological forcing uncertainty substantially impacts model performance and parameter estimation. Precipitation measurement uncertainty (±20-25% for snowfall, ±5-10% for rainfall) documented in this and previous regional studies [40,41] propagates through modeling chain, with calibrated runoff coefficients partially compensating for systematic input biases. Three-station automatic weather network, while spanning 872-m elevation gradient, provides limited spatial representation of precipitation variability across 242.7 km² basin, particularly for convective summer storms and wind-redistributed winter snowfall. Temperature interpolation assumes linear lapse rate (0.75 °C/100m) derived from three elevations, neglecting potential micro-scale topographic effects (valley inversions, cold air pooling, aspect-driven variations). Discharge measurements contain inherent uncertainty (±5-8% under normal flow conditions, ±10-15% during peak flows and ice-affected periods) affecting performance metric interpretation, parameter estimation precision, and volumetric balance assessment.
Model structural limitations warrant explicit acknowledgment. Degree-day approach, while pragmatic for operational forecasting with limited data availability [24,25], simplifies complex energy balance processes by neglecting spatial and temporal variations in net radiation, turbulent heat fluxes, and snowpack thermal properties. This simplification may reduce accuracy under rapidly-changing meteorological conditions (warm-rain-on-snow events, intense solar radiation during clear periods) or limit applicability to climate change scenarios where energy balance component relationships shift. Evapotranspiration not explicitly parameterized, instead absorbed into effective runoff coefficients; this simplification reasonable during snow-dominated high-flow period (March-May) but may introduce systematic errors during late summer low-flow conditions when evapotranspiration represents substantial loss. Groundwater dynamics represented only through lumped recession coefficient without spatial differentiation, neglecting heterogeneity in subsurface storage properties, spring contributions, and groundwater-surface water exchange processes.
Remote sensing observations carry inherent uncertainties affecting snow cover area determination and subsequent discharge simulation. MODIS 500-m resolution, while suitable for basin-scale applications, cannot resolve sub-pixel heterogeneity or small patches of persistent snow in topographic depressions. Cloud contamination during storm periods creates data gaps precisely when snow accumulation and melt conditions change most rapidly, requiring temporal interpolation that introduces additional uncertainty. Binary snow classification (snow/no-snow) using optical imagery cannot quantify snow water equivalent variability or distinguish shallow snow from bare ground under certain illumination conditions. SAR-based wet snow detection, though providing all-weather capability, remains qualitative rather than quantitative due to complex interactions between backscatter, snow wetness, grain size, and layering.
Climate non-stationarity implications for long-term operational application require consideration. Model parameters calibrated under 2009 temperature and precipitation regimes may exhibit temporal instability as climate warms, particularly as rising temperatures shift precipitation phase (more rain, less snow), alter melt timing (earlier peaks, compressed seasons), modify energy balance components (increased longwave radiation, changing cloud cover patterns), and potentially trigger threshold responses (mid-winter melt events, rain-on-snow flooding). Regular model recalibration or development of adaptive parameter adjustment schemes accounting for evolving climate may prove necessary for sustained operational forecast accuracy. Uncertainty quantification frameworks (GLUE, ensemble approaches, Bayesian methods) would provide probabilistic forecasts and confidence bounds valuable for risk-based water management decisions but remain unimplemented in current deterministic framework, limiting utility for decision-makers requiring probability-of-exceedance information.
5. Conclusions
This study successfully demonstrated the operational applicability of the Snowmelt Runoff Model (SRM) integrated with GIS and remote sensing techniques for accurate discharge prediction in the Kirkgoze Basin, a representative snow-dominated mountainous watershed in Eastern Anatolia, Turkey. The research addresses critical knowledge gaps regarding snowmelt forecasting methodologies in continental mountain environments characterized by severe climatic conditions and limited operational monitoring infrastructure. Key findings and contributions are summarized as follows:
- 1.
- Model Performance and Calibration
Calibrated SRM achieved excellent performance for the 2009 snowmelt season (March 30 – June 2, 65 days) with coefficient of determination R² = 0.8606, correlation coefficient R = 0.927, Nash-Sutcliffe Efficiency NSE = 0.854, and volumetric difference of only 3.35%. These metrics place this application among the most successful documented SRM implementations globally and demonstrate the model’s capability for operational water resource forecasting in similar continental mountain basins. The dramatic nine-fold improvement from uncalibrated (R² = 0.384, volumetric difference = 29.78%) to calibrated performance underscores the critical importance of site-specific parameter adjustment, while confirming that physically-reasonable a priori estimates provide useful first-order approximations.
- 2.
- Elevation Zonation and Degree-Day Factors
Three-zone elevation stratification (Zone A: 1823-2262 m, 42.40%; Zone B: 2262-2704 m, 40.18%; Zone C: 2704-3140 m, 17.42%) successfully captured systematic altitudinal variations in snowmelt timing and energy balance. Degree-day factors increased with elevation (Zone A: 0.20 cm/°C·day, Zone B: 0.27-0.30 cm/°C·day, Zone C: 0.40-0.48 cm/°C·day), consistent with enhanced solar radiation and turbulent heat transfer at higher elevations in thinner atmosphere. Temporal increases throughout the melt season (early: 0.20-0.40, late: 0.30-0.48 cm/°C·day) reflected snowpack aging and albedo reduction. These values align with physically-realistic ranges established by extensive international SRM applications.
- 3.
- Site-Specific Temperature Lapse Rate
Empirically-derived temperature lapse rate (γ = 0.75 °C/100 m, R² = 0.94) substantially exceeded the standard environmental lapse rate (0.65 °C/100 m), reflecting Eastern Anatolia’s severe continental climate with low atmospheric humidity and minimal cloud cover. This 15% enhancement has important operational implications: employing standard lapse rates would systematically bias temperature estimates and degrade model performance. The finding emphasizes necessity of deriving site-specific lapse rates from local observations rather than assuming globally-averaged values, particularly in continental mountain environments with extreme climatic characteristics.
- 4.
- Remote Sensing Integration
MODIS MOD10A2 8-day composite products provided operationally-robust snow cover observations with 87.3% pixel-level agreement (Kappa = 0.73) against Landsat validation imagery. Systematic snow cover recession exhibited clear altitudinal progression (Zone A snow-free April 26, Zone B May 28, Zone C residual through early June), enabling anticipation of discharge timing for water resource allocation. SAR observations (RADARSAT-1 C-band, ALOS-PALSAR L-band) offered valuable all-weather capability during cloudy periods and successfully discriminated wet snow through characteristic 4-7 dB backscatter reduction, though complex topographic interactions precluded fully-automated classification. Optical sensors remain preferable for routine basin-wide mapping, with SAR providing complementary information during cloud-obscured periods.
- 5.
- Precipitation Measurement Challenges
Systematic precipitation undercatch averaging 20-25% was identified through comparison with regional gridded products and water balance calculations, attributed to wind-induced measurement errors during snowfall events despite heated gauge design and wind shields. This pervasive challenge in high-altitude precipitation measurement explains precipitation’s exclusion from final multiple linear regression model despite physical importance—systematic bias introduced sufficient noise to preclude statistically significant discharge prediction. SRM’s successful calibration despite precipitation limitations demonstrates model robustness through implicit error correction via adjusted runoff coefficients, though this compensation potentially limits parameter transferability to years with different measurement characteristics.
- 6.
- Empirical Discharge Prediction Model
Multiple linear regression analysis revealed temperature, snow-covered area, snow water equivalent, snowmelt runoff coefficient, and radiation as statistically significant discharge predictors, yielding the empirical model: Q_calc = -1.116 + 0.289T - 15.724S + 0.647SWE + 15.218C_S - 0.009R (R² = 0.881, R = 0.938, p < 0.0001). This high explanatory power (88.1% of discharge variance) using readily-available variables suggests potential operational utility complementing physically-based modeling. Temperature’s dominant positive influence, snow-covered area’s strong negative coefficient (reflecting inverse relationship during active melt), and SWE’s positive contribution provide physically-interpretable insights into fundamental discharge controls in snowmelt-dominated systems.
- 7.
- Operational Water Resource Management Implications
Results demonstrate operational feasibility for seasonal water supply forecasting and flood warning in Eastern Anatolian basins where 70-80% of annual discharge derives from snowmelt. Modest data requirements (daily temperature, precipitation, satellite snow cover) align with operational monitoring capabilities. Volumetric accuracy (3.35% error) supports reservoir operation, irrigation scheduling, and hydropower planning. Peak discharge prediction accuracy (4.3-2.5% error) enables flood forecasting, though inherent 1-3 day lead times limit warning utility compared to seasonal climate prediction approaches. Extension to additional regional basins would provide integrated water resource management capability in this climatically-vulnerable, water-stressed region where snowmelt constitutes critical resource supporting agriculture, municipal supply, and ecosystem services.
5.1. Recommendations for Future Research
Future research directions should address identified limitations and extend operational capabilities:
- Multi-year validation across diverse meteorological conditions to assess parameter stability and quantify inter-annual performance variability
- Enhanced precipitation measurement through dual-gauge installations (shielded accumulation gauge plus heated tipping-bucket) or wind-correction algorithms to reduce systematic undercatch bias
- Integration of higher-resolution snow cover products (Sentinel-2 20-m, Landsat-8/9 30-m) with cloud-gap-filling algorithms to resolve fine-scale heterogeneity while maintaining temporal frequency
- Comparison with physically-detailed energy balance models to quantify trade-offs between process representation complexity and operational data requirements
- Regional extension to additional Eastern Anatolian basins to develop transferable parameter relationships enabling ungauged basin prediction
- Climate change impact assessment using downscaled global climate model projections to anticipate future snowmelt timing shifts and water resource availability changes
- Real-time operational forecasting system development integrating automated satellite data acquisition, model execution, and decision support visualization for water resource managers
In conclusion, this research demonstrates that integrating the degree-day based SRM with modern GIS and remote sensing capabilities provides accurate, operationally-feasible discharge prediction in data-scarce mountainous regions. The methodology’s successful application to Kirkgoze Basin establishes a foundation for regional operational water resource management in Eastern Anatolia and similar snow-dominated mountain environments globally, addressing critical needs for improved seasonal forecasting supporting agriculture, hydropower generation, flood risk management, and climate adaptation planning.
Author Contributions
Conceptualization, S.Ş. and R.A.; methodology, S.Ş.; software, S.Ş.; validation, S.Ş. and R.A.; formal analysis, S.Ş.; investigation, S.Ş.; resources, R.A.; data curation, S.Ş.; writing—original draft preparation, S.Ş.; writing—review and editing, S.Ş. and R.A.; visualization, S.Ş.; supervision, R.A.; project administration, R.A. All authors have read and agreed to the published version of the manuscript.
Funding
This research was funded by the Scientific and Technological Research Council of Turkey (TÜBİTAK) under project number 106Y293.
Acknowledgments
This research was supported by the Scientific and Technological Research Council of Turkey (TÜBİTAK) under project number 106Y293. The authors gratefully acknowledge the Turkish State Meteorological Service and State Hydraulic Works for providing meteorological and hydrological data. This article is derived from the first author’s doctoral thesis [31] completed at Atatürk University. During the preparation of this work, the authors used Claude (Anthropic) to improve language clarity, structure sections, and refine technical descriptions. After using this tool, the authors reviewed and edited the content as needed and take full responsibility for the content of the published article.
Conflicts of Interest
The authors declare no conflicts of interest.
References
- Barnett, T.P.; Adam, J.C.; Lettenmaier, D.P. Potential impacts of a warming climate on water availability in snow-dominated regions. Nature 2005, 438, 303–309. [Google Scholar] [CrossRef] [PubMed]
- Viviroli, D.; Dürr, H.H.; Messerli, B.; Meybeck, M.; Weingartner, R. Mountains of the world, water towers for humanity: Typology, mapping, and global significance. Water Resour. Res. 2007, 43, W07447. [Google Scholar] [CrossRef]
- Immerzeel, W.W.; van Beek, L.P.; Bierkens, M.F.P. Climate change will affect the Asian water towers. Science 2010, 328, 1382–1385. [Google Scholar] [CrossRef]
- IPCC. Climate Change 2021: The Physical Science Basis. Contribution of Working Group I to the Sixth Assessment Report of the Intergovernmental Panel on Climate Change; Cambridge University Press: Cambridge, UK, 2021. [Google Scholar]
- Mote, P.W.; Hamlet, A.F.; Clark, M.P.; Lettenmaier, D.P. Declining mountain snowpack in Western North America. Bull. Am. Meteorol. Soc. 2005, 86, 39–49. [Google Scholar] [CrossRef]
- Pederson, G.T.; Gray, S.T.; Woodhouse, C.A.; Betancourt, J.L.; Fagre, D.B.; Littell, J.S.; Watson, E.; Luckman, B.H.; Graumlich, L.J. The unusual nature of recent snowpack declines in the North American Cordillera. Science 2011, 333, 332–335. [Google Scholar] [CrossRef]
- Musselman, K.N.; Clark, M.P.; Liu, C.; Ikeda, K.; Rasmussen, R. Slower snowmelt in a warmer world. Nat. Clim. Change 2017, 7, 214–219. [Google Scholar] [CrossRef]
- Sturm, M.; Goldstein, M.A.; Parr, C. Water and life from snow: A trillion dollar science question. Water Resour. Res. 2017, 53, 3534–3544. [Google Scholar] [CrossRef]
- Martinec, J. Snowmelt-runoff model for stream flow forecasts. Nord. Hydrol. 1975, 6, 145–154. [Google Scholar] [CrossRef]
- Martinec, J.; Rango, A. Parameter values for snowmelt runoff modelling. J. Hydrol. 1986, 84, 197–219. [Google Scholar] [CrossRef]
- WMO. Operational Hydrology Report No. 23, WMO-No. 646; Intercomparison of Models of Snowmelt Runoff. World Meteorological Organization: Geneva, Switzerland, 1986.
- Nagisetty, R.M.; Desamsetti, S.; Prabhakara Rao, L.V.V.; Yaragal, S.; Harikrishna, P.; Bhattacharya, B.K. Snowmelt Runoff Model: A comprehensive review and future prospects. J. Hydrol. 2025, 628, 130593. [Google Scholar] [CrossRef]
- Zhao, Q.; Liu, Z.; Ye, B.; Qin, Y.; Wei, Z.; Fang, S. A snowmelt runoff forecasting model coupling WRF and DHSVM. Hydrol. Earth Syst. Sci. 2009, 13, 1897–1906. [Google Scholar] [CrossRef]
- He, Z.H.; Parajka, J.; Tian, F.Q.; Blöschl, G. Estimating degree-day factors from MODIS for snowmelt runoff modeling. Hydrol. Earth Syst. Sci. 2014, 18, 4773–4789. [Google Scholar] [CrossRef]
- Seidel, K.; Martinec, J. Remote Sensing in Snow Hydrology: Runoff Modelling, Effect of Climate Change; Springer-Praxis: Chichester, UK, 2004. [Google Scholar]
- Hall, D.K.; Riggs, G.A. Accuracy assessment of the MODIS snow products. Hydrol. Process. 2007, 21, 1534–1547. [Google Scholar] [CrossRef]
- Li, X.; Xu, Y.; Feng, M.; Chen, X.; Wang, K.; Zhou, G. A 1.86 billion pixel benchmark dataset for continental-scale snow cover mapping and monitoring. Sci. Data 2024, 11, 231. [Google Scholar]
- Hou, J.; Huang, C.; Zhang, Y.; Guo, J.; Gu, J. Gap-filling of MODIS fractional snow cover products via non-local spatio-temporal filtering based on machine learning techniques. Remote Sens. 2022, 14, 955. [Google Scholar] [CrossRef]
- Naghdi, S.; Darvishi Boloorani, A.; Kambouzia, J.; Amiri, N.; Papi, R. Gap-filling of the cloud-covered MODIS snow cover products via integrated cloud-removing and spatiotemporal model. Remote Sens. Appl. Soc. Environ. 2024, 35, 101216. [Google Scholar] [CrossRef]
- Pan, L.; Wei, S.; Fu, B.; Du, Q.; Liu, M.; Zheng, D.; Ma, Y. A novel combined model for spatiotemporal reconstruction of daily MODIS snow cover products. J. Hydrol. 2024, 631, 130837. [Google Scholar] [CrossRef]
- Dozier, J. Spectral signature of alpine snow cover from the Landsat Thematic Mapper. Remote Sens. Environ. 1989, 28, 9–22. [Google Scholar] [CrossRef]
- Painter, T.H.; Rittger, K.; McKenzie, C.; Slaughter, P.; Davis, R.E.; Dozier, J. Retrieval of subpixel snow covered area, grain size, and albedo from MODIS. Remote Sens. Environ. 2009, 113, 868–879. [Google Scholar] [CrossRef]
- Anderson, E.A. A Point Energy and Mass Balance Model of a Snow Cover. In NOAA Technical Report NWS 19; U.S. Department of Commerce: Silver Spring, MD, USA, 1976. [Google Scholar]
- Rango, A.; Martinec, J. Revisiting the degree-day method for snowmelt computations. Water Resour. Bull. 1995, 31, 657–669. [Google Scholar] [CrossRef]
- Hock, R. Temperature index melt modelling in mountain areas. J. Hydrol. 2003, 282, 104–115. [Google Scholar] [CrossRef]
- Franz, K.J.; Hogue, T.S.; Barik, M.; He, M. Assessment of SWE data assimilation for ensemble streamflow predictions. J. Hydrol. 2010, 394, 72–84. [Google Scholar] [CrossRef]
- Bergström, S. The HBV model—its structure and applications. SMHI Rep. Hydrol. 1992, 4, 1–32. [Google Scholar]
- Tekeli, A.E.; Akyürek, Z.; Şorman, A.A.; Şensoy, A.; Şorman, A.Ü. Using MODIS snow cover maps in modeling snowmelt runoff process in the eastern part of Turkey. Remote Sens. Environ. 2005, 97, 216–230. [Google Scholar] [CrossRef]
- Şorman, A.Ü.; Şensoy, A.; Tekeli, A.E.; Şorman, A.A.; Akyürek, Z. Modelling and forecasting snowmelt runoff process using the HBV model in the eastern part of Turkey. Hydrol. Process. 2009, 23, 1031–1040. [Google Scholar] [CrossRef]
- Şensoy, A.; Şorman, A.A.; Tekeli, A.E.; Şorman, A.Ü.; Akyürek, Z. Point-scale energy and mass balance snowpack simulations in the upper Karasu basin, Turkey. Hydrol. Process. 2006, 20, 899–922. [Google Scholar] [CrossRef]
- Şenocak, S. Kar Erimesi Akış Modelinin (SRM) Uzaktan Algılama ve CBS Kullanılarak Kırkgöze Havzasına Uygulanması. Ph.D. Thesis, Atatürk University, Erzurum, Turkey, 2011. [Google Scholar]
- Riggs, G.A.; Hall, D.K.; Salomonson, V.V. MODIS Snow Products User Guide to Collection 5; National Snow and Ice Data Center: Boulder, CO, USA, 2006. Available online: https://modis-snow-ice.gsfc.nasa.gov/ (accessed on 15 November 2024).
- Riggs, G.A.; Hall, D.K.; Román, M.O. MODIS Snow Products Collection 6.1 User Guide; NASA Goddard Space Flight Center: Greenbelt, MD, USA, 2021. [Google Scholar]
- Lillesand, T.M.; Kiefer, R.W.; Chipman, J.W. Remote Sensing and Image Interpretation, 7th ed.; John Wiley & Sons: Hoboken, NJ, USA, 2015. [Google Scholar]
- Dietz, A.J.; Kuenzer, C.; Gessner, U.; Dech, S. Remote sensing of snow—a review of available methods. Int. J. Remote Sens. 2012, 33, 4094–4134. [Google Scholar] [CrossRef]
- Nagler, T.; Rott, H.; Ripper, E.; Bippus, G.; Hetzenecker, M. Advancements for snowmelt monitoring by means of Sentinel-1 SAR. Remote Sens. 2016, 8, 348. [Google Scholar] [CrossRef]
- Yerdelen, C. Snowmelt Runoff Model and Application to Erzurum-Kırkgöze Basin in Mountainous Watersheds. Ph.D. Thesis, Atatürk University, Erzurum, Turkey, 2003. [Google Scholar]
- Singh, P.; Singh, V.P. Snow and Glacier Hydrology; Kluwer Academic Publishers: Dordrecht, The Netherlands, 2001. [Google Scholar]
- Martinec, J. The degree-day factor for snowmelt-runoff forecasting. IAHS Publ. 1960, 51, 468–477. [Google Scholar]
- Goodison, B.E.; Louie, P.Y.T.; Yang, D. WMO/TD-No. 872; WMO Solid Precipitation Measurement Intercomparison: Final Report. World Meteorological Organization: Geneva, Switzerland, 1998.
- Yang, D.; Goodison, B.E.; Metcalfe, J.R.; Golubev, V.S.; Bates, R.; Pangburn, T.; Hanson, C.L. Accuracy of NWS 8’’ standard nonrecording precipitation gauge: Results and application of WMO intercomparison. J. Atmos. Ocean. Technol. 1998, 15, 54–68. [Google Scholar] [CrossRef]
Figure 1.
Kirkgoze Basin location map showing three elevation zones (Zone A: 1823-2262 m, 42.40%; Zone B: 2262-2704 m, 40.18%; Zone C: 2704-3140 m, 17.42%), drainage network, automatic weather station locations, and discharge measurement station (DSI 21-01).
Figure 1.
Kirkgoze Basin location map showing three elevation zones (Zone A: 1823-2262 m, 42.40%; Zone B: 2262-2704 m, 40.18%; Zone C: 2704-3140 m, 17.42%), drainage network, automatic weather station locations, and discharge measurement station (DSI 21-01).
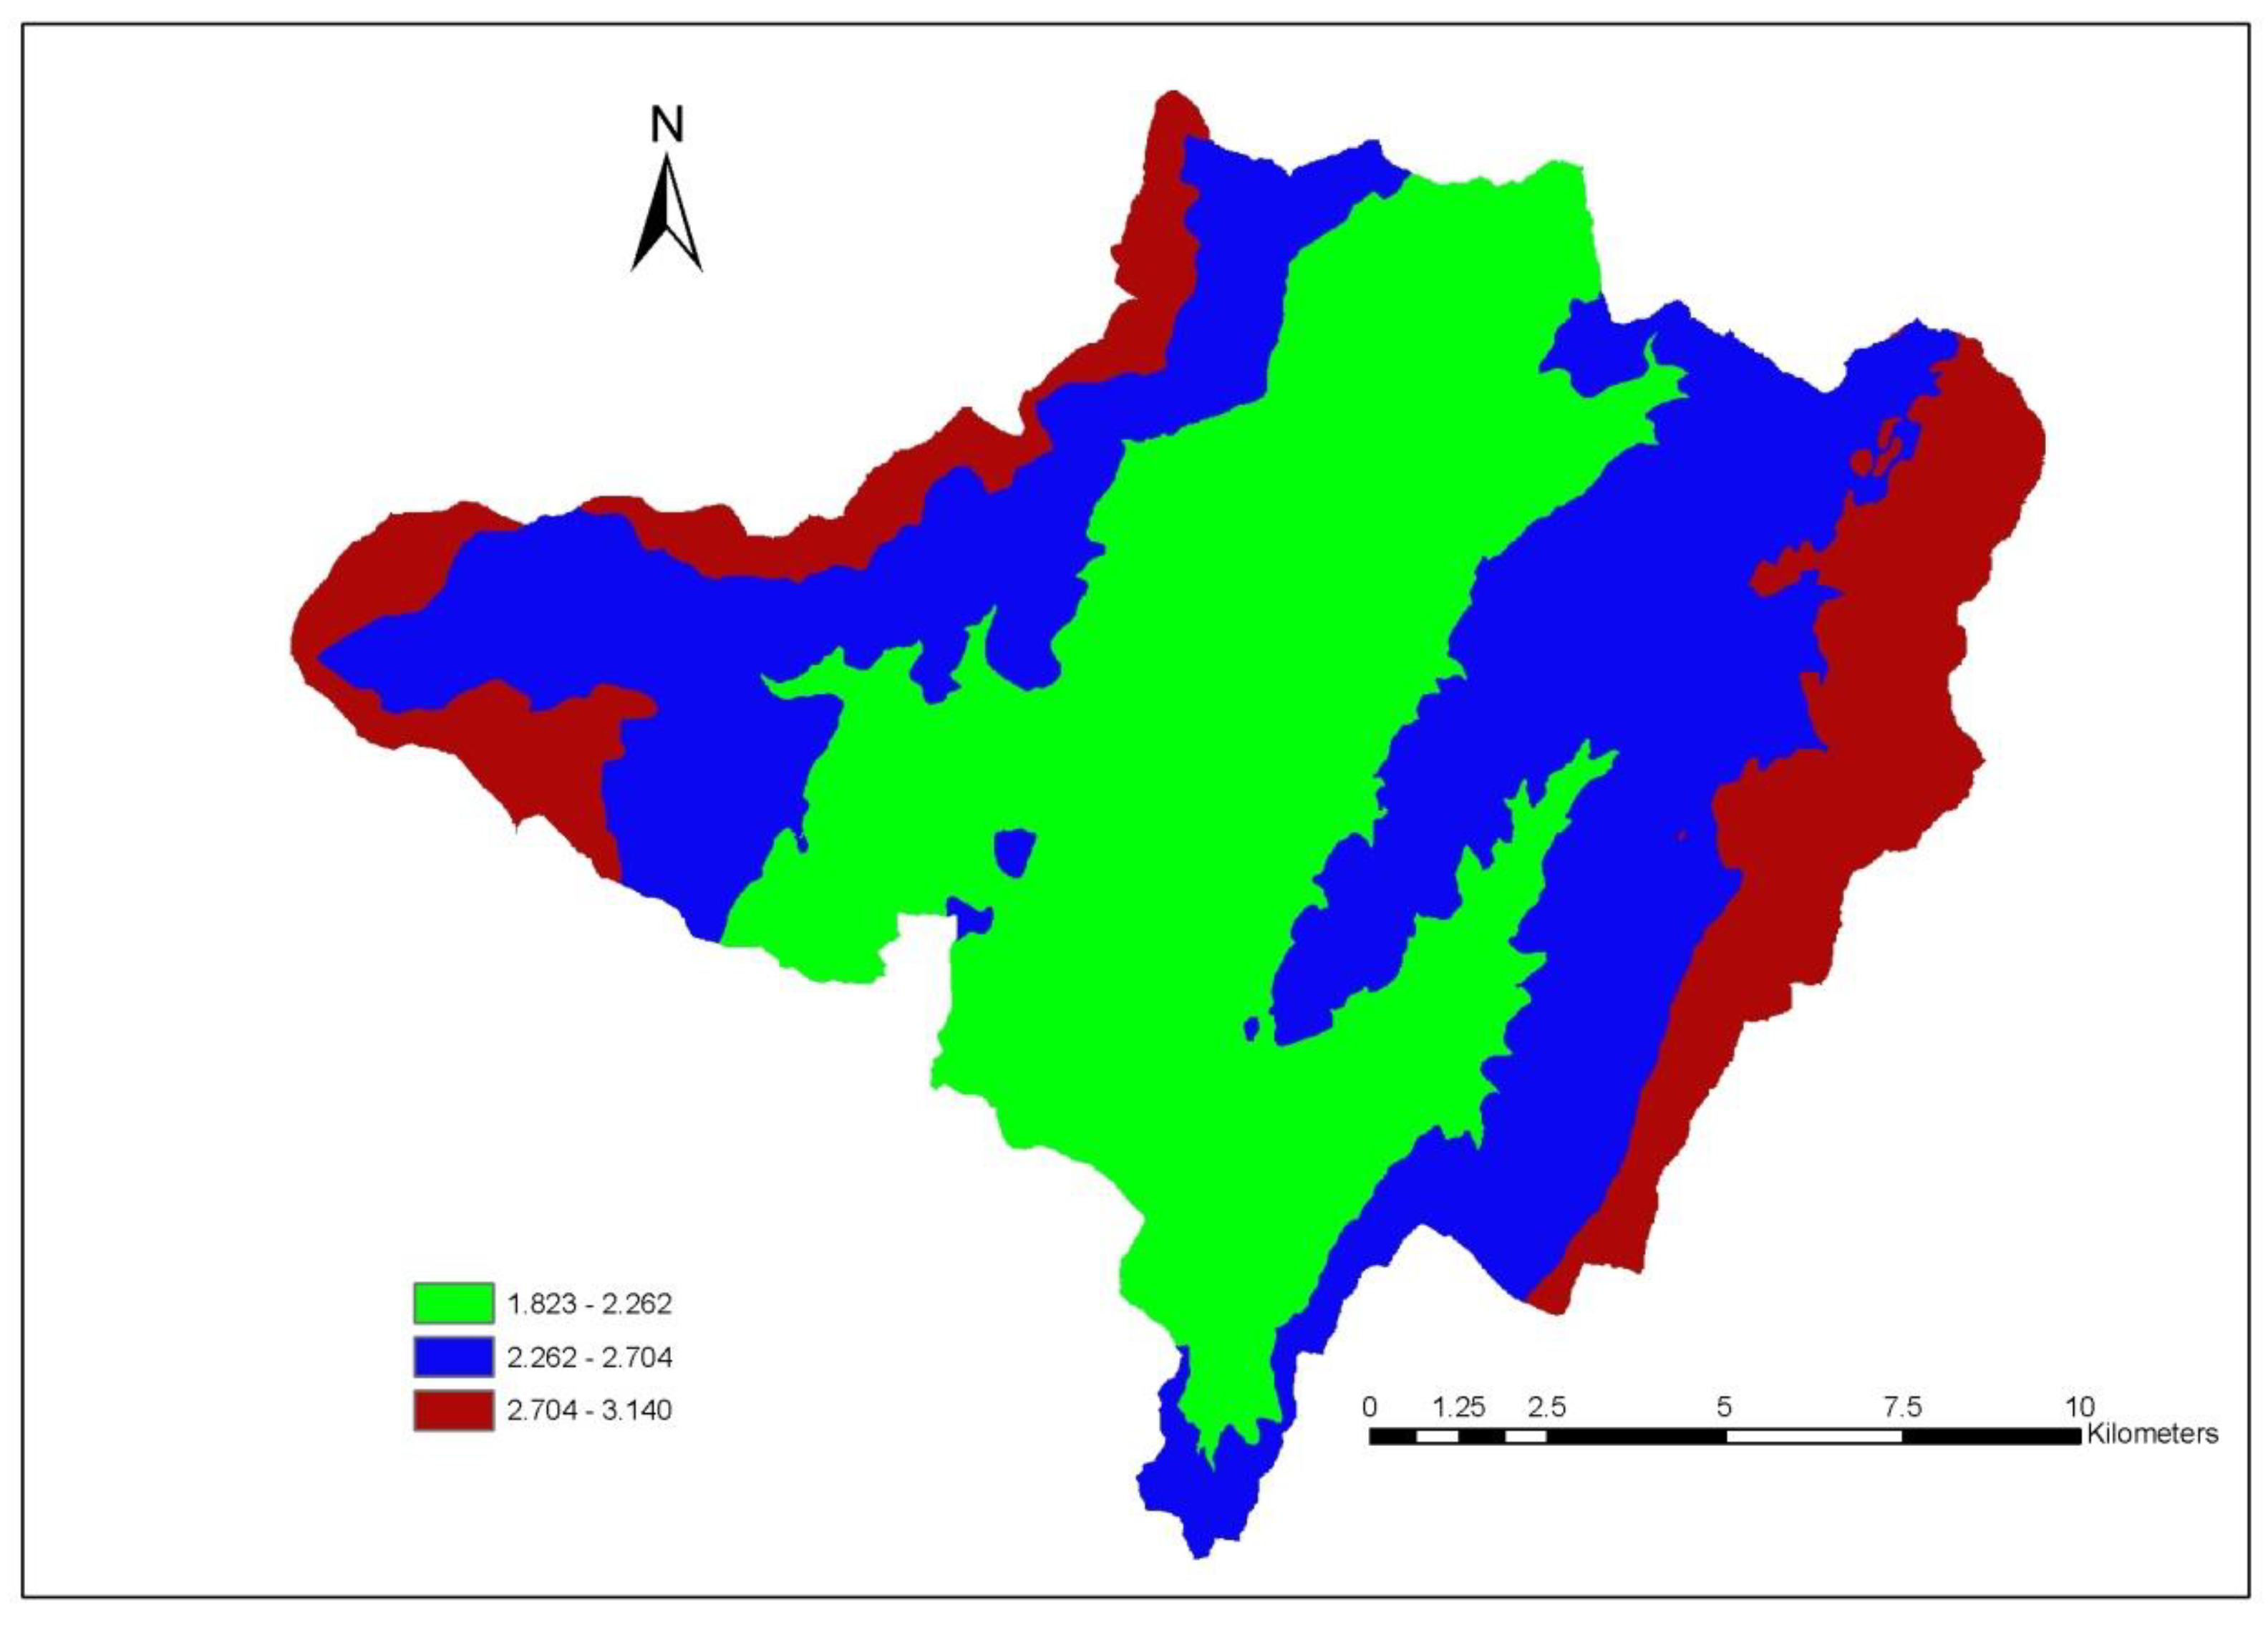
Figure 2.
Geographic distribution of three automatic weather stations (AWS) across elevation gradient within Kirkgoze Basin. Station 1 (2019 m, Zone A), Station 2 (2454 m, Zone B), Station 3 (2891 m, Zone C), and discharge measurement station DSI 21-01 (1823 m) locations shown.
Figure 2.
Geographic distribution of three automatic weather stations (AWS) across elevation gradient within Kirkgoze Basin. Station 1 (2019 m, Zone A), Station 2 (2454 m, Zone B), Station 3 (2891 m, Zone C), and discharge measurement station DSI 21-01 (1823 m) locations shown.
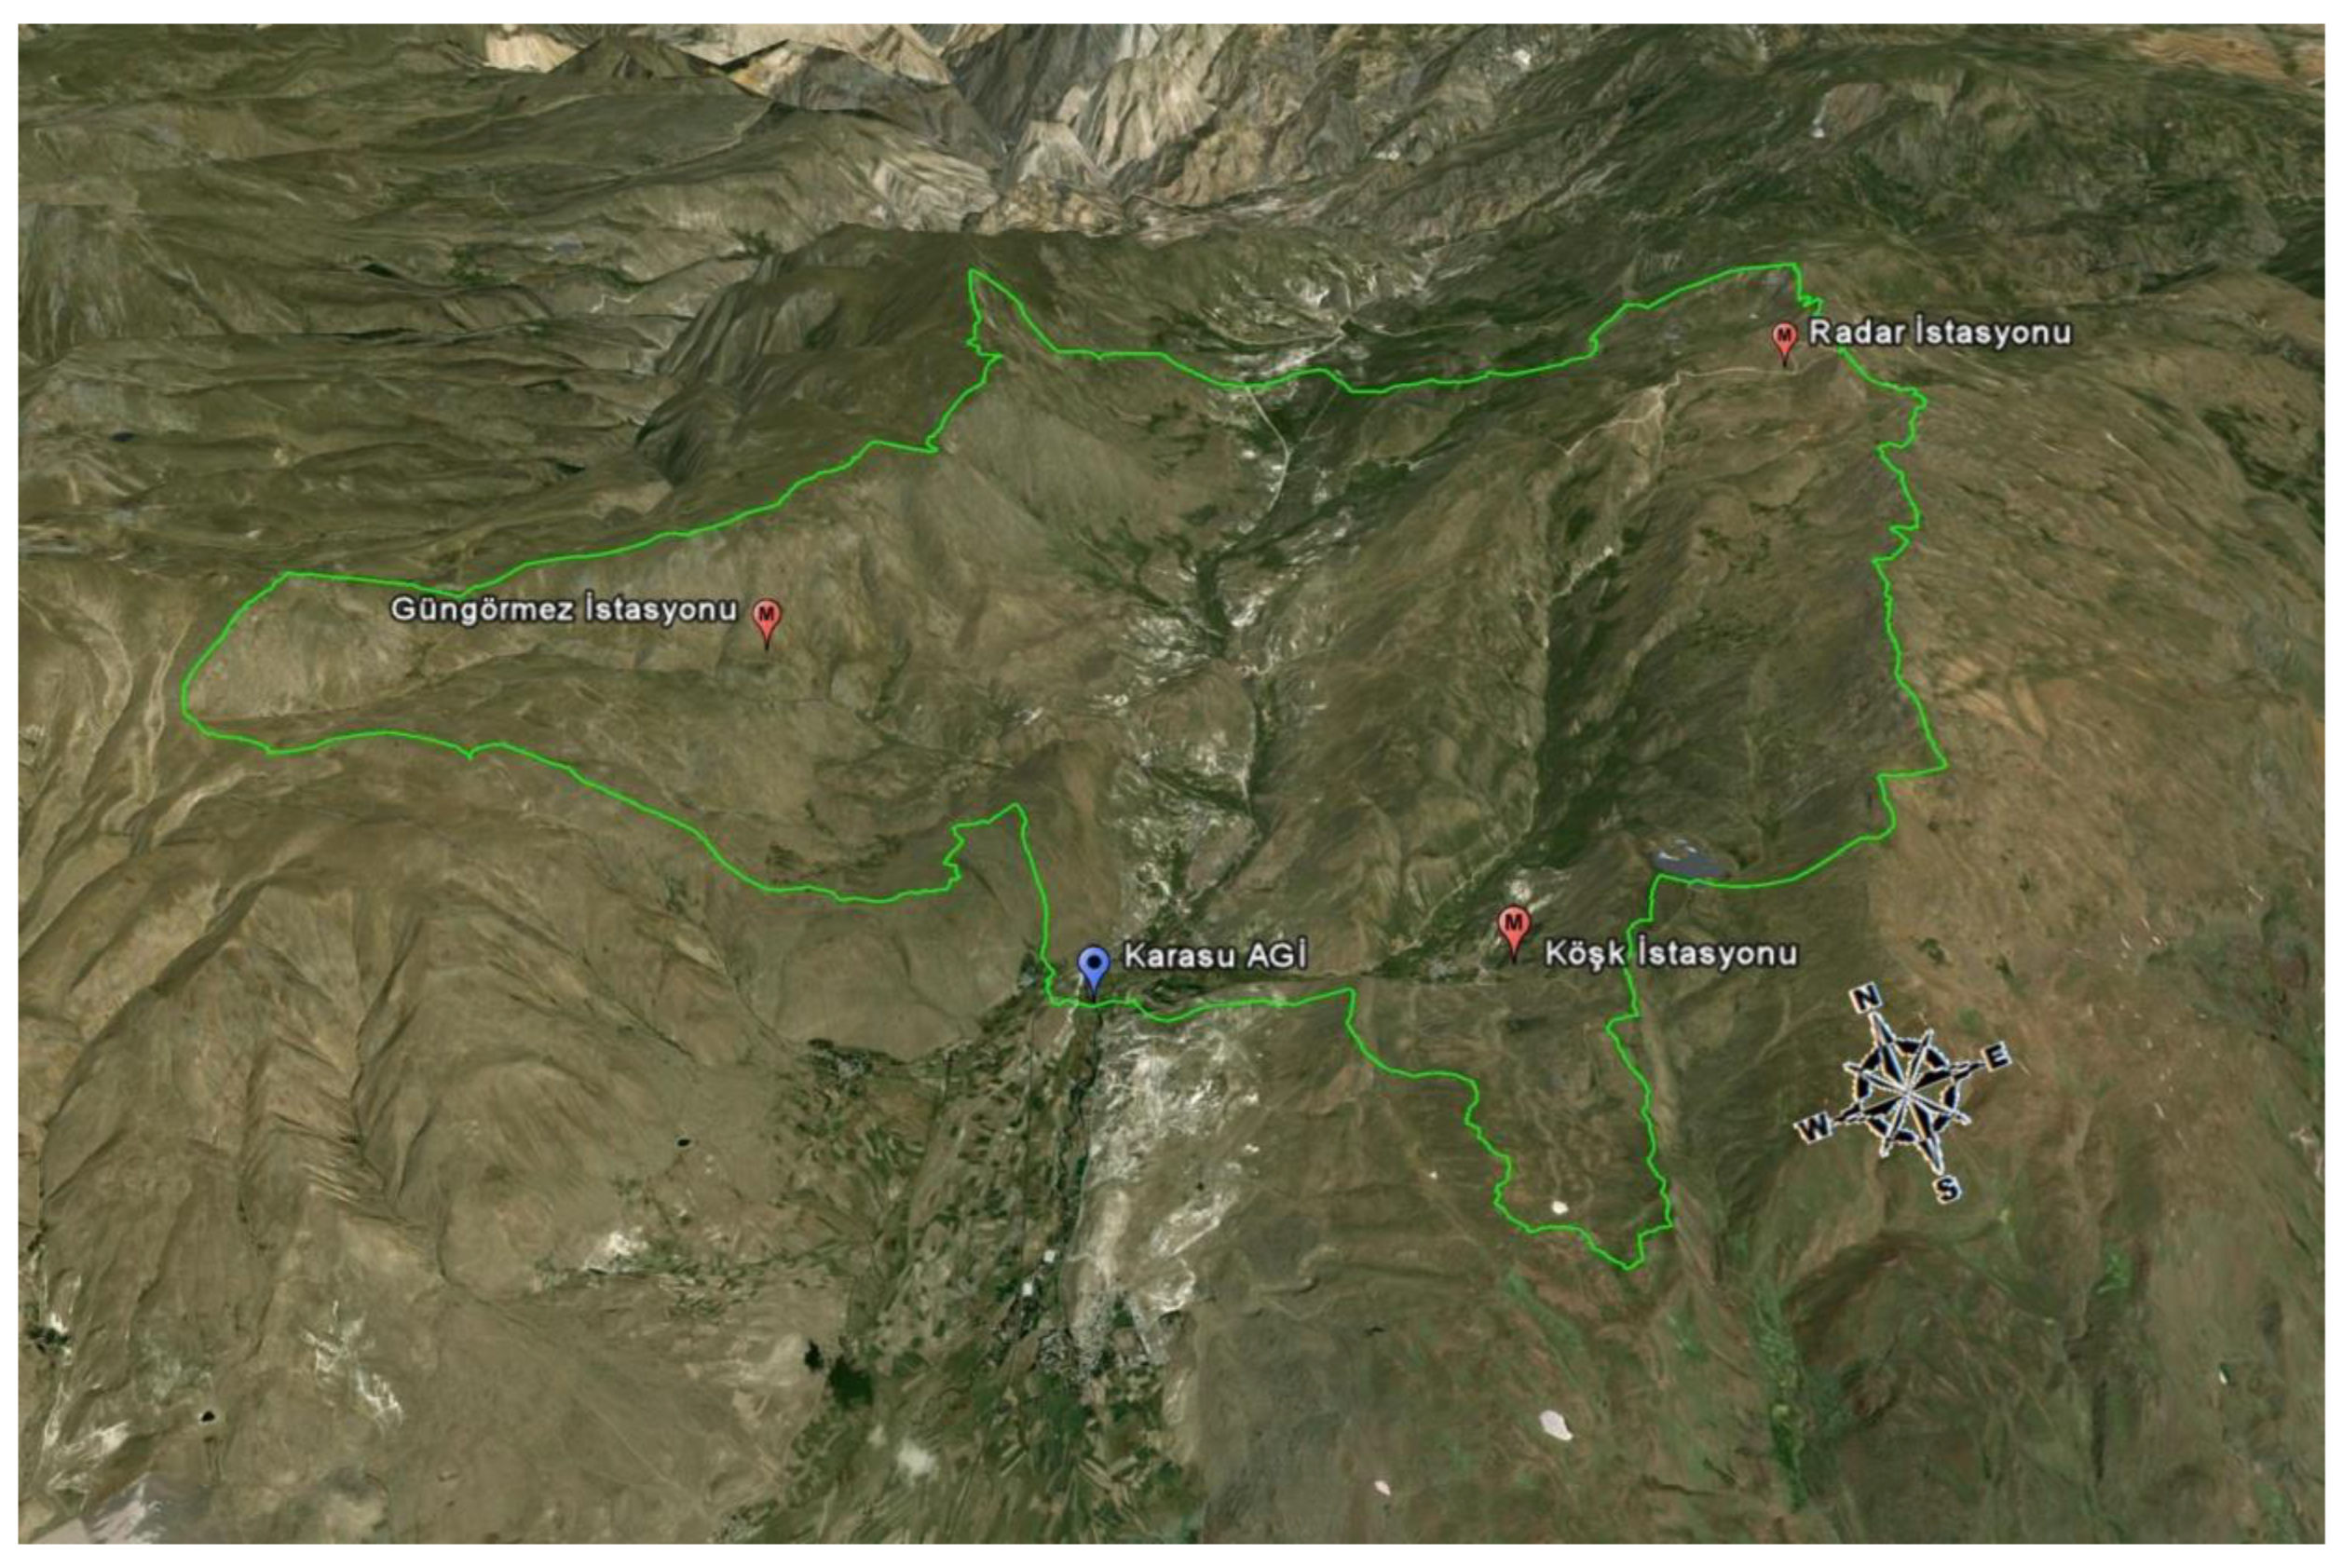
Figure 3.
Multi-platform satellite remote sensing for operational snow monitoring: (Top) Landsat-7 ETM+ imagery from April 2003 showing (a) natural color composite and (b) supervised snow classification (87.3% agreement with MODIS, Kappa=0.73).
Figure 3.
Multi-platform satellite remote sensing for operational snow monitoring: (Top) Landsat-7 ETM+ imagery from April 2003 showing (a) natural color composite and (b) supervised snow classification (87.3% agreement with MODIS, Kappa=0.73).
Figure 3.
(continued). (Middle) MODIS MOD10A2 8-day composite product (500-m resolution) showing binary snow/non-snow classification supporting operational model forcing.
Figure 3.
(continued). (Middle) MODIS MOD10A2 8-day composite product (500-m resolution) showing binary snow/non-snow classification supporting operational model forcing.
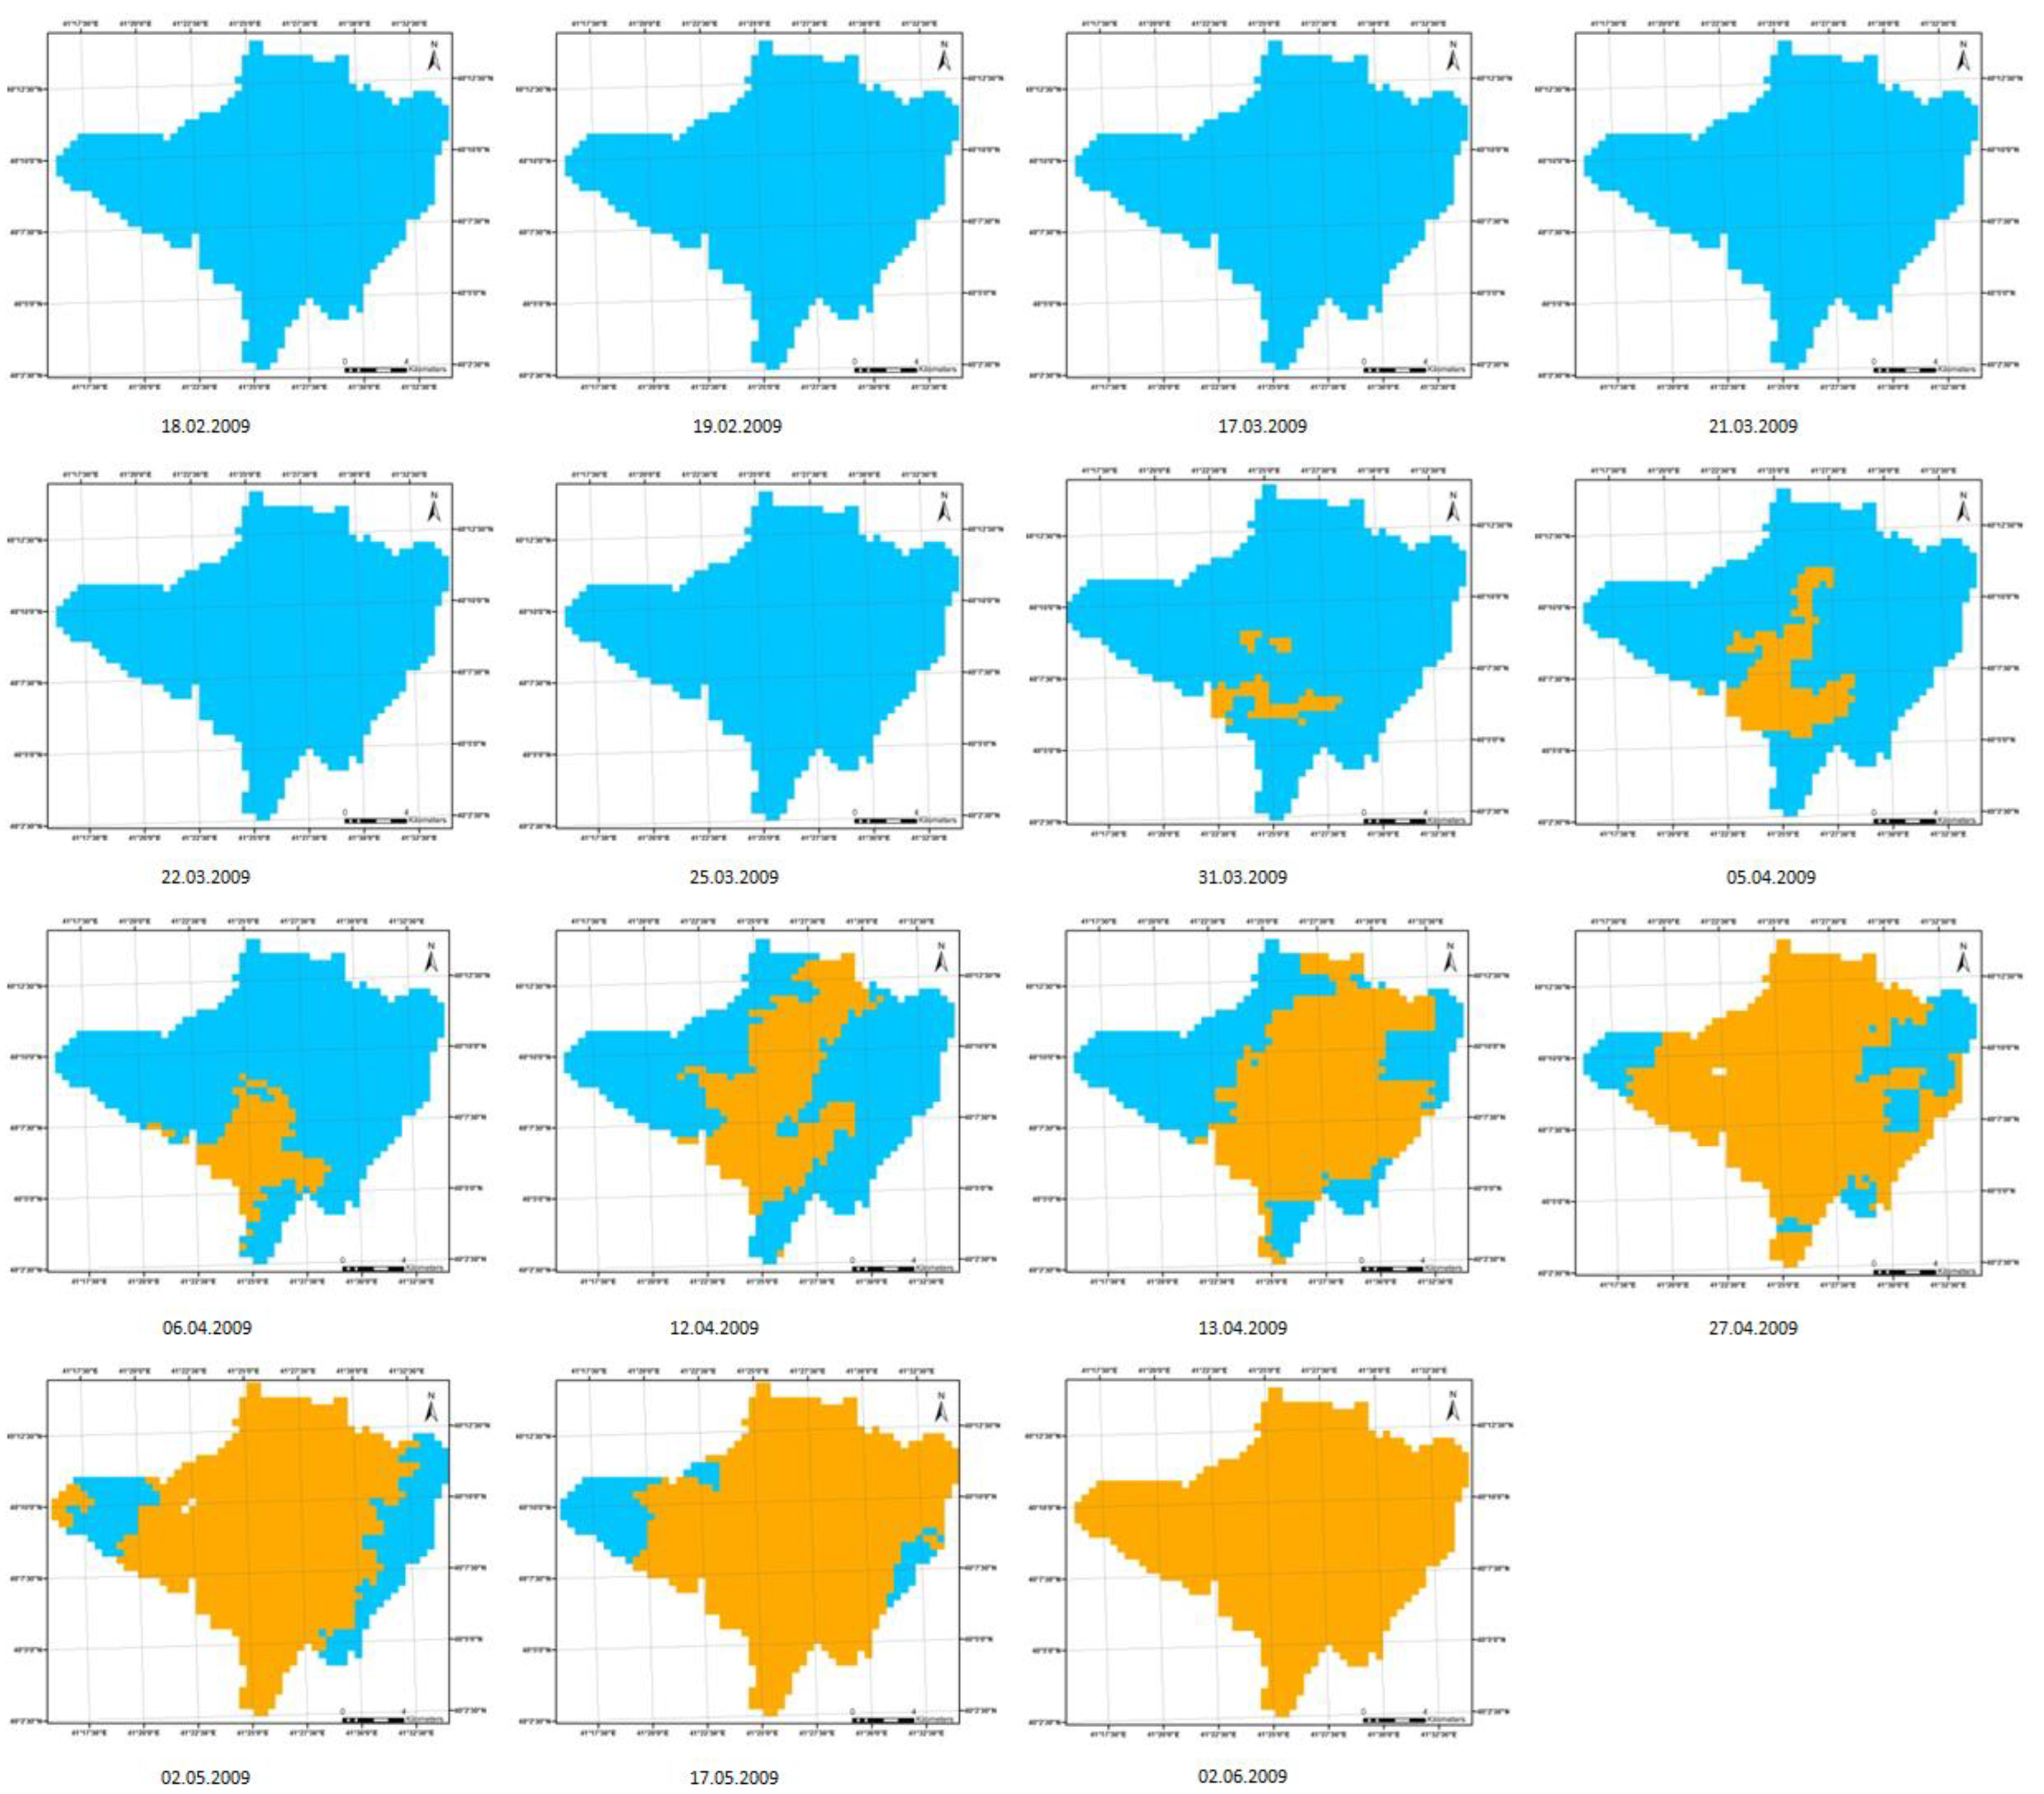
Figure 3.
(continued). (Bottom left) RADARSAT-1 C-band SAR backscatter showing wet snow discrimination (4-7 dB reduction) enabling all-weather monitoring.
Figure 3.
(continued). (Bottom left) RADARSAT-1 C-band SAR backscatter showing wet snow discrimination (4-7 dB reduction) enabling all-weather monitoring.
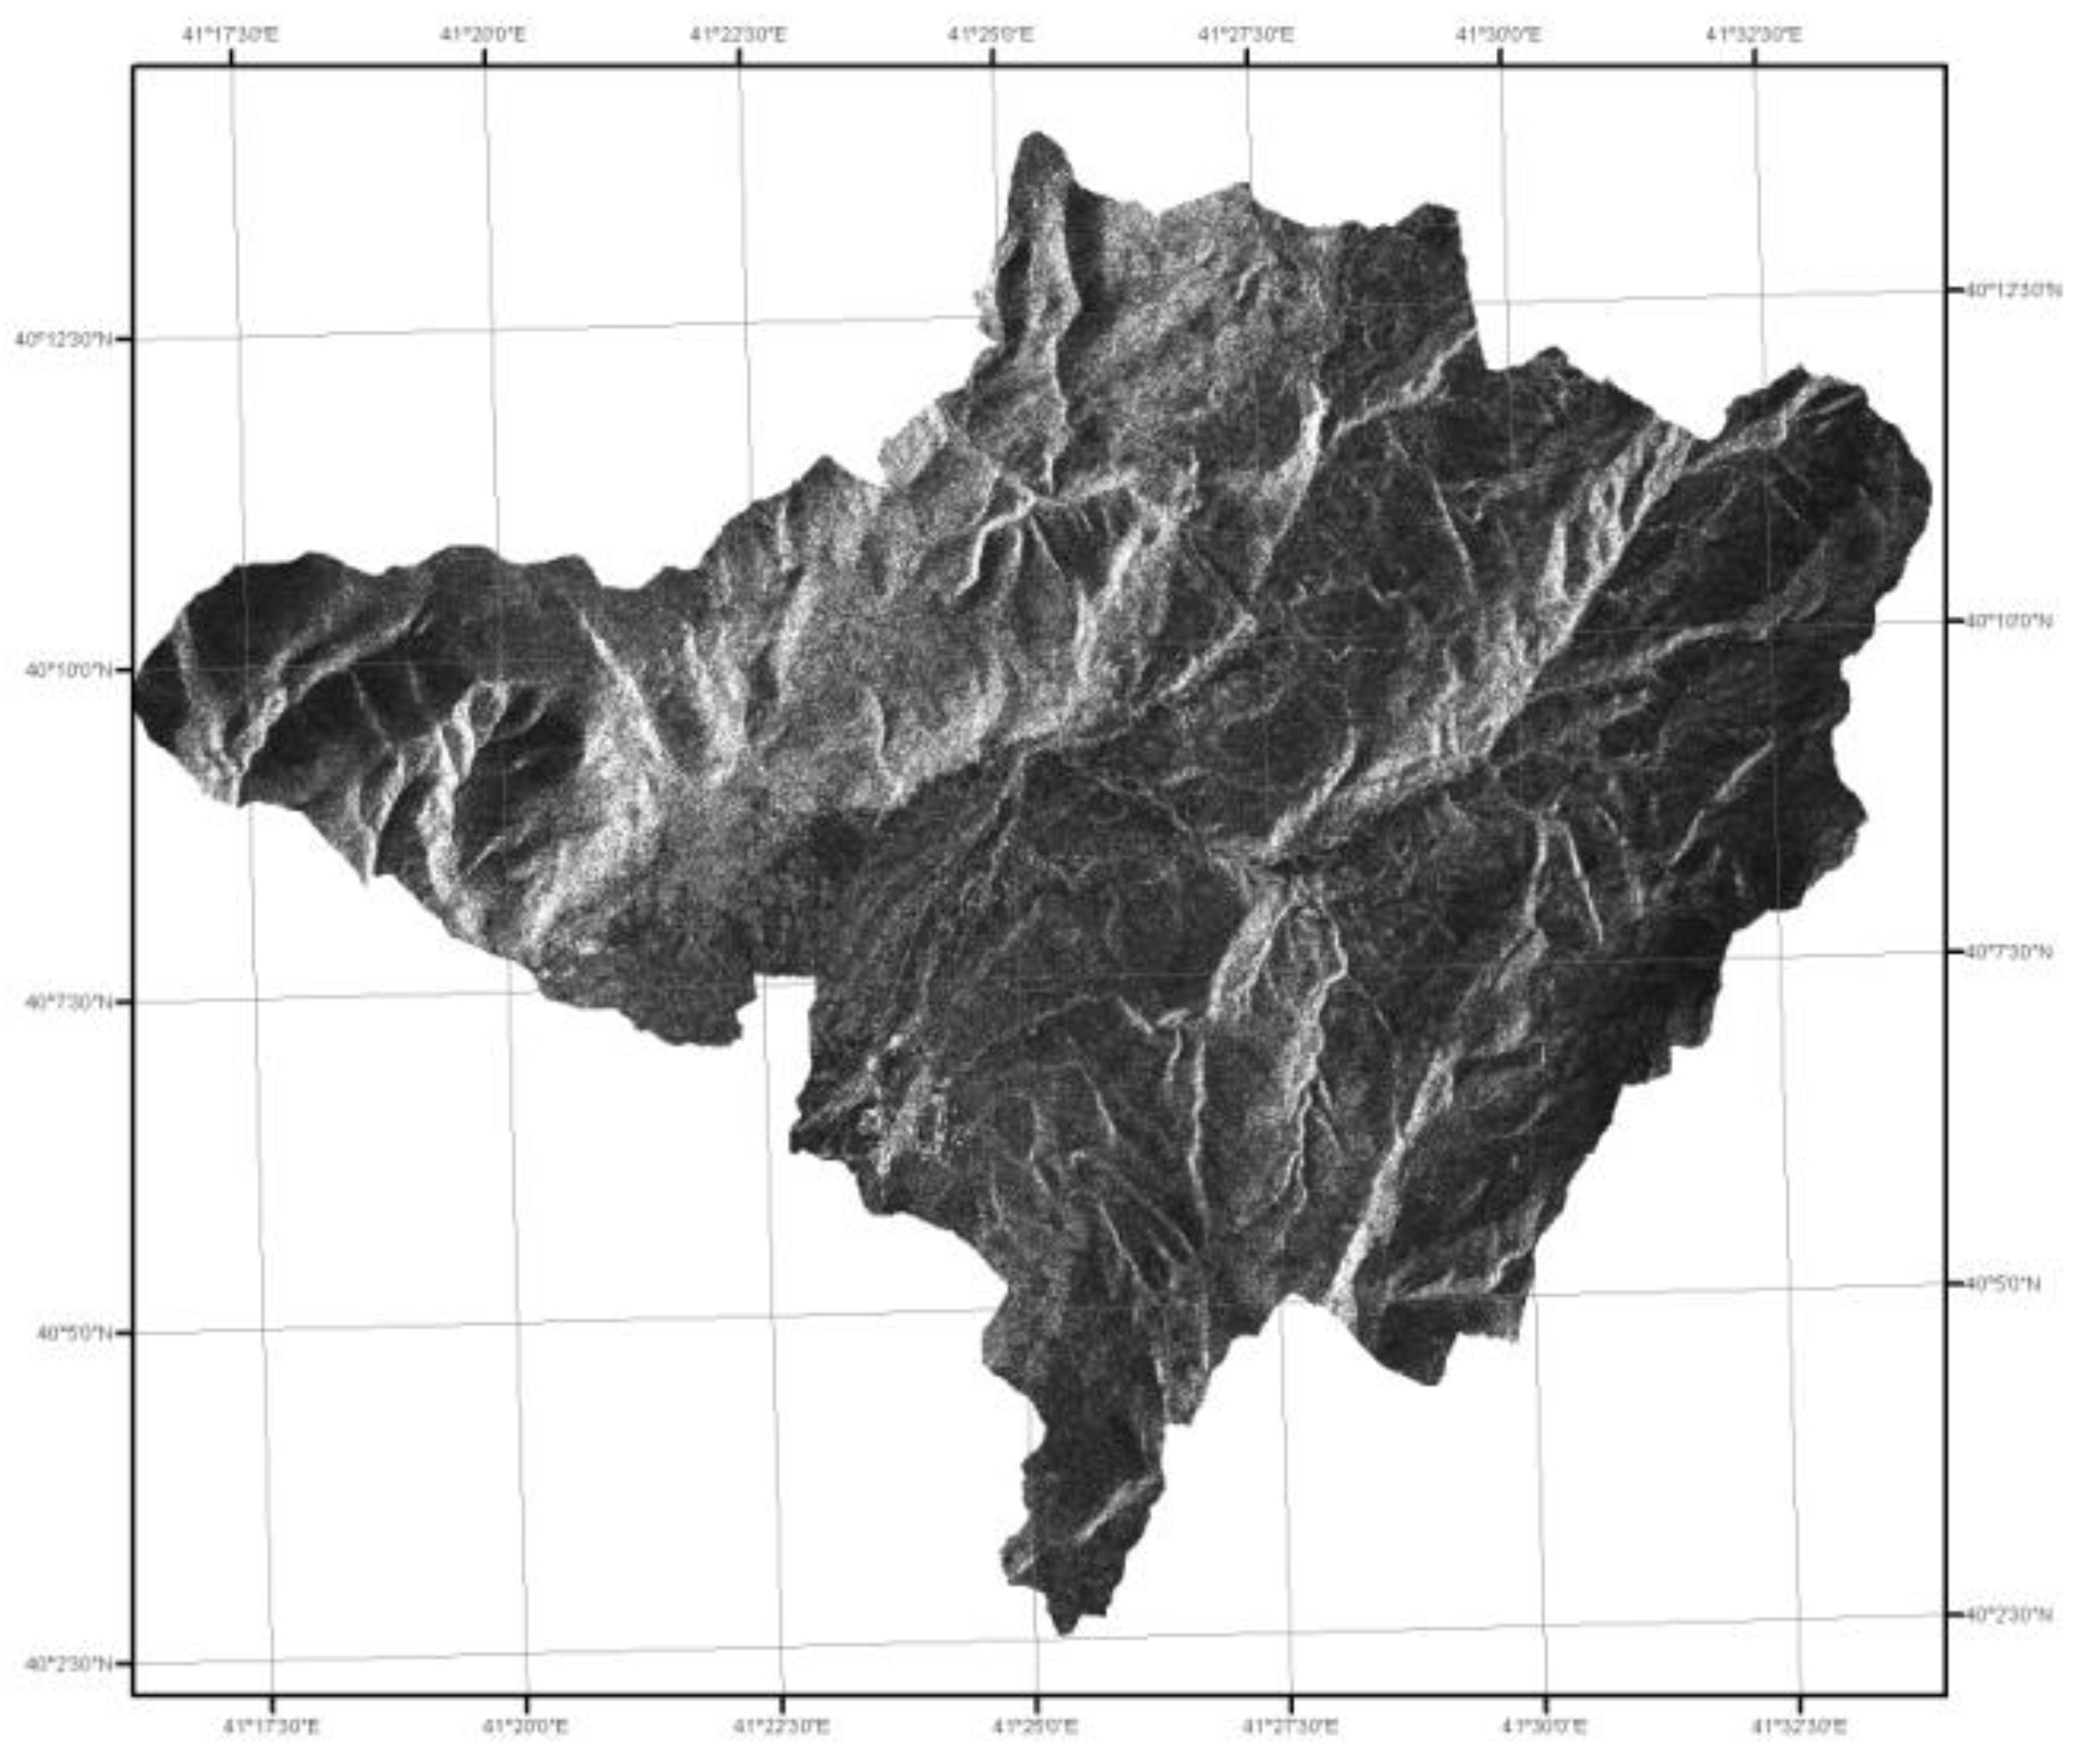
Figure 3.
(continued). (Bottom right) ALOS-PALSAR L-band SAR from January 2010 illustrating early-season dry snow conditions with enhanced snow-ground discrimination.
Figure 3.
(continued). (Bottom right) ALOS-PALSAR L-band SAR from January 2010 illustrating early-season dry snow conditions with enhanced snow-ground discrimination.
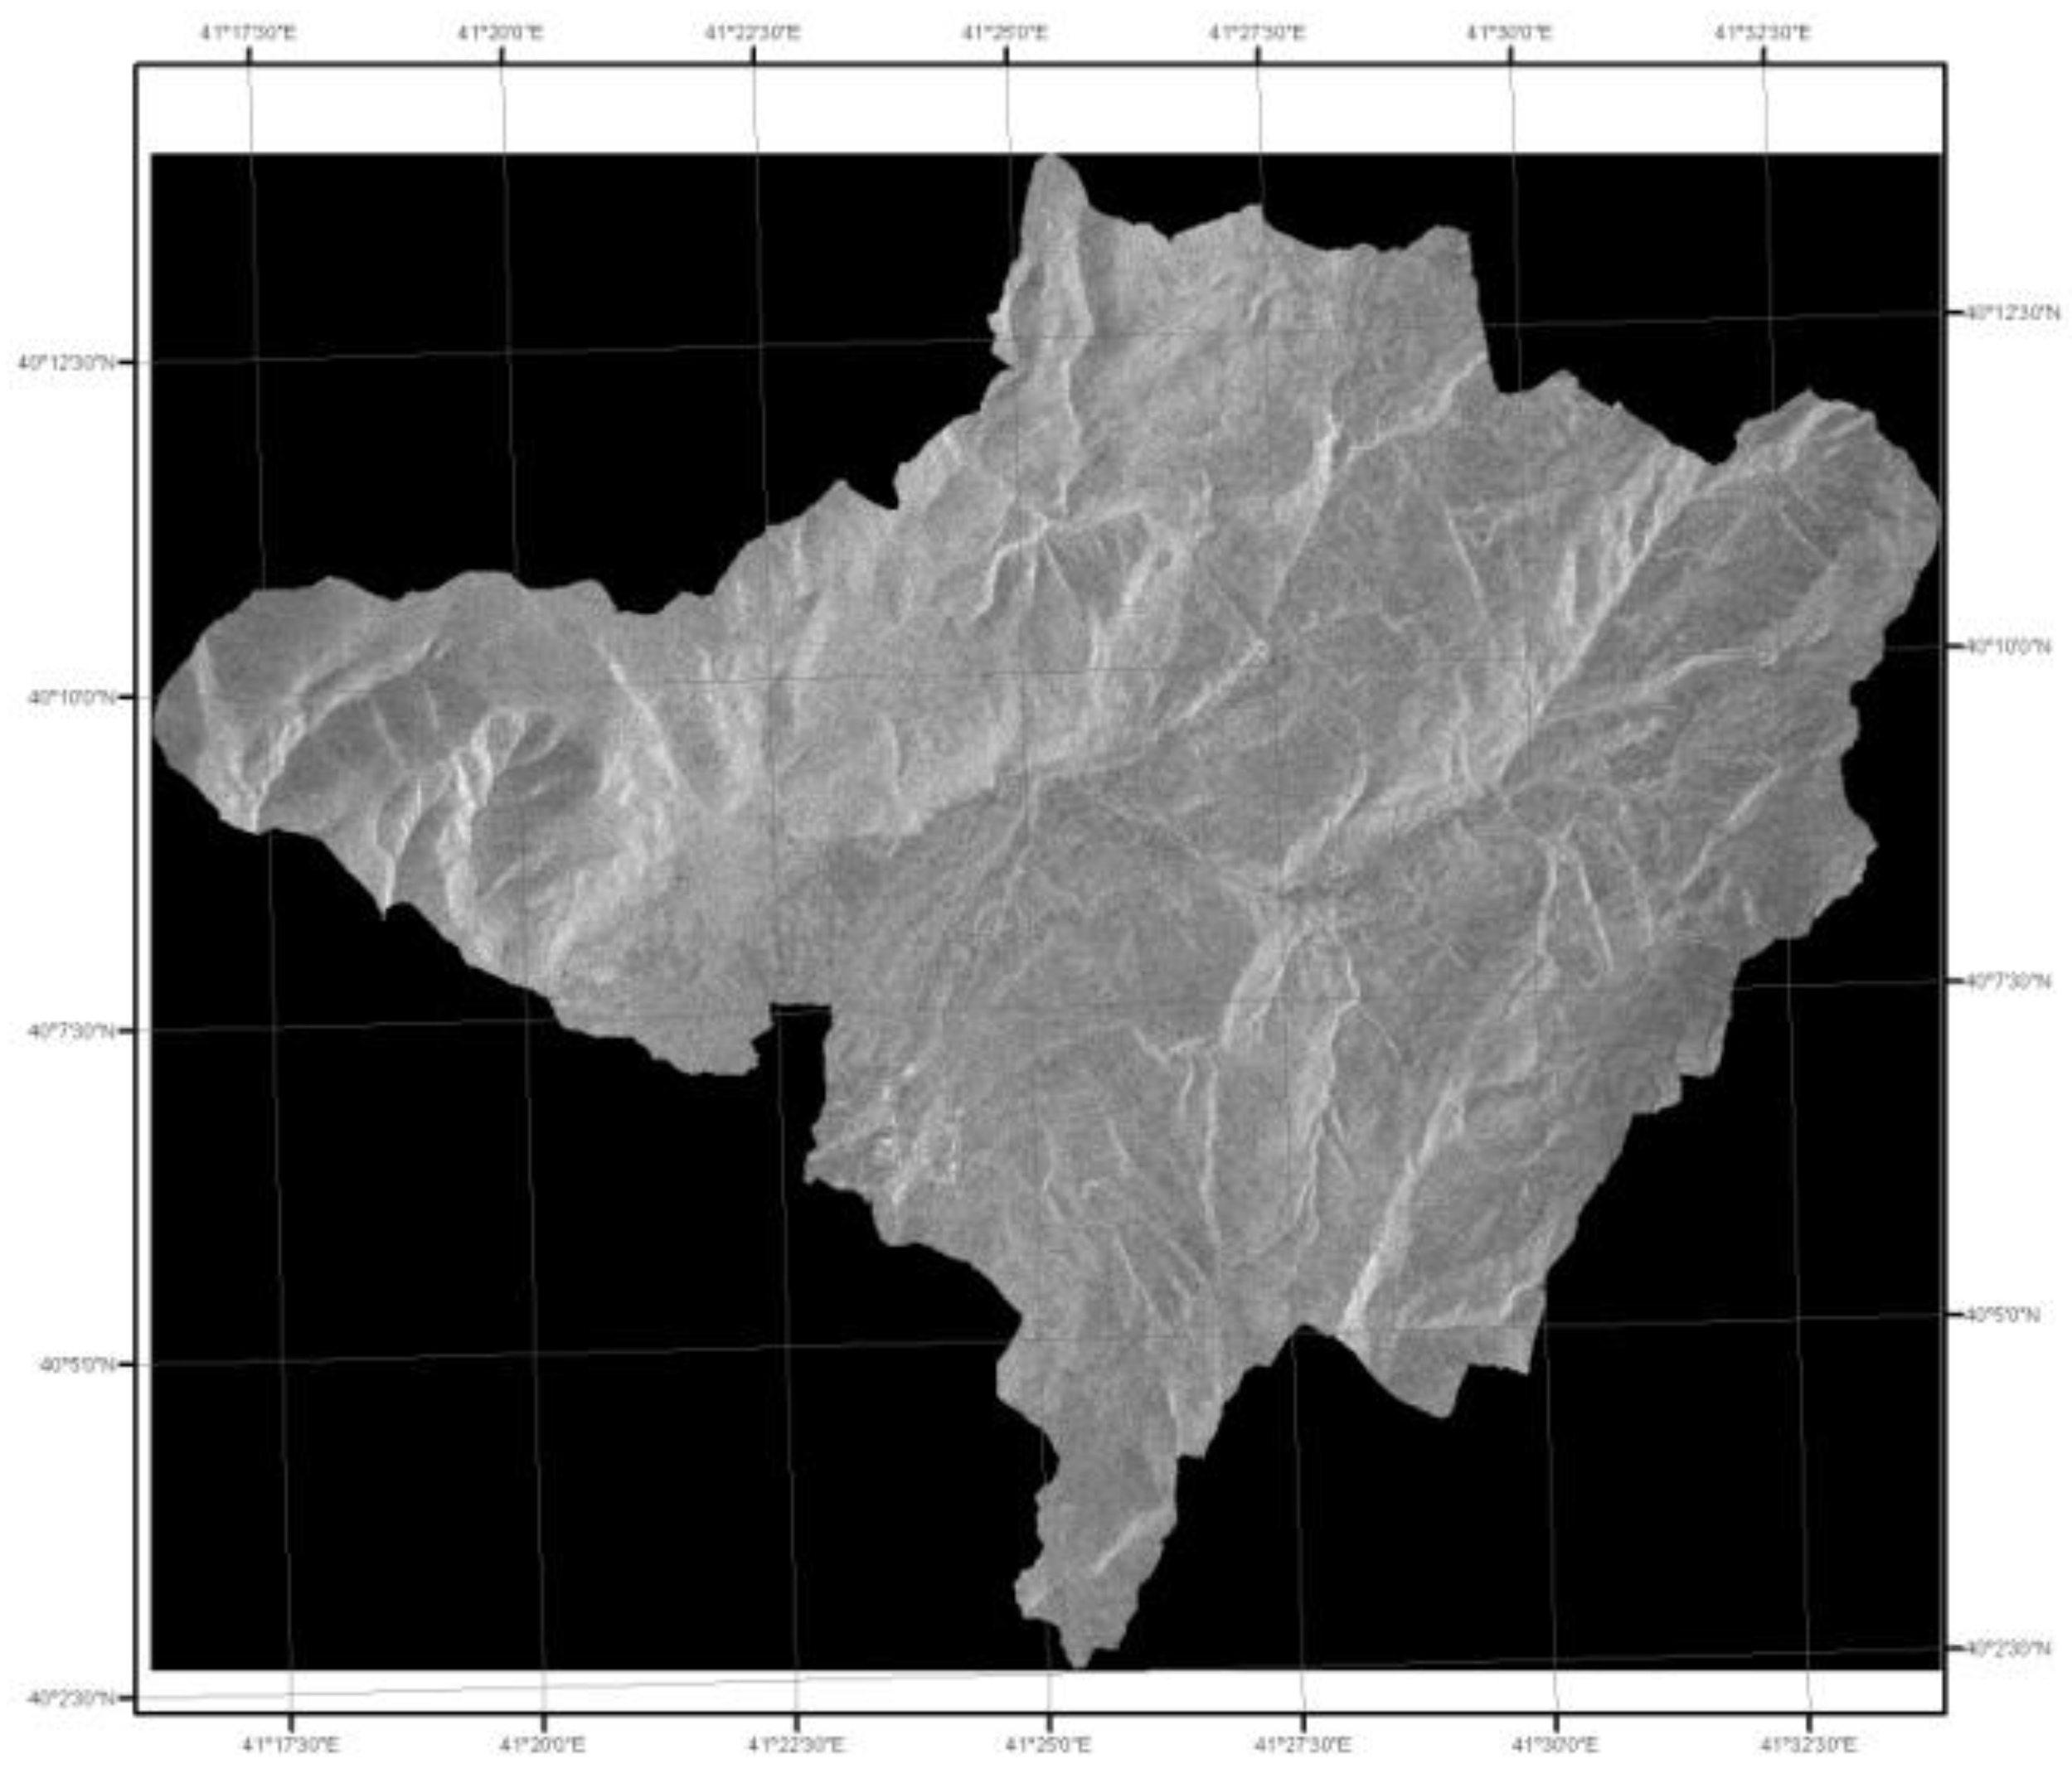

Table 1.
Kirkgoze Basin morphometric and hydrological characteristics.
| Characteristic | Value | Unit |
|---|---|---|
| Drainage area | 242.7 | km² |
| Elevation range | 1823 - 3140 | m a.s.l. |
| Mean elevation | 2482 | m a.s.l. |
| Maximum elevation | 3140 | m a.s.l. |
| Minimum elevation | 1823 | m a.s.l. |
| Relief | 1317 | m |
| Mean slope | 18.3 | degrees |
| Main channel length | 22.4 | km |
| Mean annual precipitation | ~450 | mm |
| Snowpack duration (outlet) | 150-180 | days/year |
| Peak discharge period | March-June | - |
Table 2.
Automatic weather station specifications and locations.
| Station | Elevation (m) | Zone | Latitude | Longitude | Key Sensors |
|---|---|---|---|---|---|
| AWS-1 | 2019 | A | 40°07’N | 41°23’E | T, P, RH, WS, SR, SD |
| AWS-2 (Radar) | 2454 | B | 40°06’N | 41°22’E | T, P, RH, WS, Pressure, SR, SD |
| AWS-3 | 2891 | C | 40°05’N | 41°21’E | T, P, RH, WS, SR, SD |
| DSI 21-01 | 1823 | Outlet | 40°08’N | 41°24’E | Discharge gauge |
Table 3.
Satellite remote sensing data sources for operational snow monitoring.
| Platform | Sensor | Resolution | Temporal | Purpose |
|---|---|---|---|---|
| Terra | MODIS MOD10A2 | 500 m | 8-day | Operational SCA |
| Landsat-5 | TM | 30 m | 16-day | Validation |
| Landsat-7 | ETM+ | 30 m | 16-day | Validation |
| RADARSAT-1 | C-band SAR | 25 m | 24-day | All-weather SCA |
| ALOS | PALSAR L-band | 10 m | 46-day | All-weather SCA |
Table 4.
Mean monthly meteorological conditions at Station 2 (2454 m), 2009 snowmelt season.
| Month | Temp (°C) | Precip (mm) | Snow depth (cm) | Radiation (W/m²) |
|---|---|---|---|---|
| March | 1.2 | 58 | 142 | 185 |
| April | 5.8 | 67 | 89 | 235 |
| May | 9.4 | 43 | 24 | 285 |
| June | 11.4 | 19 | 0 | 310 |
| Season Mean | 5.8 | 187 | - | 254 |
Table 5.
Uncalibrated SRM model performance metrics.
| Metric | Value |
|---|---|
| R² | 0.384 |
| Correlation R | 0.620 |
| Nash-Sutcliffe Efficiency | 0.371 |
| Volumetric difference (%) | 29.78 |
| RMSE (m³/s) | 3.42 |
Table 6.
Calibrated SRM model performance and optimized parameters.
| Parameter/Metric | Zone A | Zone B | Zone C | Basin |
|---|---|---|---|---|
| Degree-day factor (cm/°C·day) | 0.20 | 0.27-0.30 | 0.40-0.48 | - |
| C_S (snowmelt coef.) | 0.50-0.70 | 0.55-0.70 | 0.60-0.70 | - |
| C_R (rainfall coef.) | 0.40-0.75 | 0.45-0.75 | 0.50-0.75 | - |
| R² | - | - | - | 0.8606 |
| Correlation R | - | - | - | 0.927 |
| NSE | - | - | - | 0.854 |
| Volumetric diff. (%) | - | - | - | 3.35 |
Table 7.
Multiple linear regression model statistics and predictor variables.
| Predictor Variable | Coefficient | Std Error | t-value | p-value | Partial r |
|---|---|---|---|---|---|
| Temperature (T) | 0.289 | 0.042 | 6.88 | <0.001 | +0.485 |
| Snow-covered area (S) | -15.724 | 2.134 | -7.37 | <0.001 | -0.544 |
| Snow water equiv. (SWE) | 0.647 | 0.089 | 7.27 | <0.001 | +0.312 |
| Runoff coef. (C_S) | 15.218 | 3.451 | 4.41 | <0.001 | +0.278 |
| Radiation (R) | -0.009 | 0.003 | -3.00 | 0.004 | -0.089 |
| Model R² | 0.881 | - | - | <0.0001 | - |
| RMSE (m³/s) | 1.42 | - | - | - | - |
Disclaimer/Publisher’s Note: The statements, opinions and data contained in all publications are solely those of the individual author(s) and contributor(s) and not of MDPI and/or the editor(s). MDPI and/or the editor(s) disclaim responsibility for any injury to people or property resulting from any ideas, methods, instructions or products referred to in the content. |
© 2025 by the authors. Licensee MDPI, Basel, Switzerland. This article is an open access article distributed under the terms and conditions of the Creative Commons Attribution (CC BY) license (http://creativecommons.org/licenses/by/4.0/).
Copyright: This open access article is published under a Creative Commons CC BY 4.0 license, which permit the free download, distribution, and reuse, provided that the author and preprint are cited in any reuse.


