Submitted:
23 December 2025
Posted:
25 December 2025
You are already at the latest version
Abstract
We propose a conception of the Earth’s lithosphere as a geocosmic system composed of mobile lithospheric plates influenced both by external astronomical factors - such as solar radiation and tidal forces - and by internal planetary processes, including atmospheric and hydrospheric loading and mantle convection. It is shown that the annual periodicity observed in global seismicity has a distinctly astronomical origin, arising from the seasonal modulation of solar radiation between the Northern and Southern Hemispheres. The atmosphere may act as a mediator that transfers this annual signal to the tectonic plates. This new conceptual framework leads to hypotheses regarding a dynamic coupling between the atmosphere and the lithosphere. These hypotheses form the basis for the next stage of a research program aimed at understanding the Earth’s lithosphere as an integrated geocosmic system.
Keywords:
seismicity
; lithospheric plates
; atmosphere
I. Introduction
Theoretical and statistical studies carried out by our group in 1994–2006 yielded a number of important and intriguing results concerning seismicity and the dynamics of lithospheric plates.
1.The relationship between Earth’s seismicity and irregularities in its axial rotation was examined in detail (Gorkavyi et al., 1994, 1995, 1999a). Accelerations or decelerations of Earth’s rotation generate additional stresses in the lithosphere, which can lead to increased seismic activity. The estimated change in rotational energy of even a 30-km-thick layer, caused by variations in the length of day, exceeds by two orders of magnitude the total energy of all earthquakes that occurred over the same time interval (Gorkavyi et al., 1989).
The connection between Earth’s seismicity and its rotation has been considered by many authors (Stoiko, 1952; Kropotkin & Trapeznikov, 1963; Khomutov, 1991, 1993). Our approach differs in that, for the first time, the modulus of the first derivative of the angular velocity was used as the rotational parameter, and the number of earthquakes analyzed was incomparably larger—more than 130,000 events over a 27-year period (1964–1990). The earthquake catalog of the U.S. Geological Survey National Earthquake Information Center (NEIC, 1928–1990) was used as the data source. The study was based on correlation analysis between annual earthquake counts and annual mean values of the angular velocity and the modulus of its derivative.
These investigations led to a robust conclusion that the modulus of the acceleration of Earth’s diurnal rotation is linked to global seismic activity. The correlation is observed across all types of seismically active regions: spreading zones (regions of ocean-floor expansion at mid-ocean ridges where new crust is formed), subduction zones (regions where two lithospheric plates collide and one plate sinks beneath the other), intraplate earthquakes, and others. The correlation coefficient reaches its maximum value (up to Q ≈ 0.8) at depths of 70–125 km, corresponding to earthquakes in the “contact zone” (Gorkavyi et al., 1999a).
2. An analysis of variations in the annual numbers of earthquakes of different magnitudes, carried out for individual regions and for the Earth as a whole, made it possible to identify — against the background of the global component of seismic activity — a lower-amplitude asymmetric component between the Northern and Southern Hemispheres. This component is characterized by an increase in seismic activity in one hemisphere accompanied by a simultaneous decrease in the other, and vice versa (Gorkavyi et al., 1995). The characteristic timescale of these oscillations is 2–3 years. A more detailed analysis (Gorkavyi et al., 1999b) showed that, in contrast to the global component — which is most clearly expressed for strong earthquakes with magnitudes M ≥ 5.5 and appears to be closely related to irregularities in Earth’s diurnal rotation — this asymmetric component is more pronounced for weaker events with M < 5.5. It is controlled by the asymmetry of seismicity between two major, oppositely directed subduction zones. One of these zones lies predominantly in the Southern Hemisphere and extends from the Himalayas to Fiji. The other is located almost entirely in the Northern Hemisphere, stretching from Kamchatka to the Philippines. This phenomenon of North–South asymmetry (negative correlation) reaches its maximum at depths of approximately D ≈ 70–120 km. At depths greater than D > 400 km, it completely disappears and is replaced by a positive correlation.
3. The application of spectral analysis (Fourier transform) to daily earthquake counts of different magnitudes made it possible, with a high degree of statistical confidence, to detect and study in detail the annual periodicity of seismic activity (Gorkavyi et al., 2000, 2002, 2003, 2006). It was shown that a period of P = 1 year is observed only for relatively weak earthquakes with magnitudes M < 5.0. This may indicate that the preparation (energy accumulation) time for such earthquakes is on the order of one year.
The statistical significance of the annual period exhibits two pronounced maxima: for hypocenters at depths D = 1–60 km, where the overwhelming majority of the considered events with magnitudes M = 3.0–4.7 occur (≈64%), and at depths D = 90–140 km, where only about 8.5% of such events take place. The second maximum is particularly noteworthy: approximately at these same depths, the maximum correlation coefficient was found between the annual numbers of strong earthquakes and the annual mean values of the magnitude of Earth’s diurnal rotational acceleration (Gorkavyi et al., 1999a). At these depths, the negative correlation coefficient identified earlier (Gorkavyi et al., 1999b) also reaches its maximum.
The annual period is most clearly expressed at mid-latitudes (ϕ ≈ 38°–61°) in both hemispheres. This holds only for shallow-focus earthquakes (D ≤ 60 km), which constitute the majority of events. For deeper earthquakes, the P = 1 year periodicity is more pronounced at low latitudes.
A north–south asymmetry of the annual period has been identified: oscillations in the Northern and Southern Hemispheres occur almost in antiphase, with the maximum number of earthquakes falling in the local winter–spring season. This north–south asymmetry is observed at all latitudes and for all hypocentral depths. The largest phase difference is found at mid-latitudes, where the maximum number of events occurs during the local spring season.
No dependence of the phase of the annual wave on geographic longitude has been found.
The annual period is also present for individual lithospheric plates and for different types of plate boundaries, and all characteristic properties of this period are preserved. It is most clearly expressed for intraplate earthquakes.
We consider it unlikely that solar tides are the cause of the annual variation in seismicity. If this were the case, a spectral line with a period of 0.5 years and with an amplitude larger than that of the 1-year peak should appear in the power spectra. However, no semiannual-period line is observed in our power spectra.
II. Seismic Activity and the Motion of Lithospheric Plates
It is now generally accepted that tectonic crustal earthquakes are the result of rapid (seismic) failure - slip along a fault - of rocks under the action of accumulated elastic shear deformation. The accumulation of elastic strain within a given volume of rock is caused by differences in the velocities of adjacent blocks of the Earth’s crust. When the accumulated elastic deformation reaches the strength limit of the rocks, a rapid displacement of the elastically deformed parts of the lithospheric blocks occurs, releasing the stored energy. The waves generated by this sudden rebound motion are what we call earthquakes (Eiby, 1982).
The overwhelming majority of earthquakes occur at the boundaries of lithospheric plates. The plates are in constant relative motion, and most tectonic processes involving intense energy exchange operate at plate boundaries. However, even within plates, the principal source of stress is thought to be related to the forces driving plate motion, although many other mechanisms may also contribute to regional stress fields (Seifert, 1991). In this context, year-to-year and intra-annual variations in seismic activity suggest that the accumulation and release of elastic stresses must be driven by variable forces or processes associated with the motion of lithospheric plates.
What factors can control the rate of accumulation of elastic deformation on a tectonic fault over timescales of months to years? Several possibilities can be considered:
- variability in the relative velocities of lithospheric plates;
- changes in friction between plates, for example due to asperities, roughness, or heterogeneities;
- variability in the normal stress between plates (i.e., the degree to which they are pressed together).
It is commonly believed that processes of this kind are governed by internal planetary factors, such as mantle convection. It is difficult to imagine how the thin and rarefied atmosphere could influence the motion of lithospheric plates, which are much thicker and orders of magnitude more massive. Nevertheless, let us consider the processes of atmosphere–lithosphere interaction in greater detail.
III. Seasonal Variations of Atmospheric Angular Momentum as a Likely Cause of the Annual Period in Seismicity
The annual periodicity of atmospheric processes has an obvious astronomical origin, associated with seasonal variations in the amount of solar radiation received by the different hemispheres of the Earth. How, then, can an annual signal originating in the thin gaseous atmosphere be “transmitted” to the massive solid lithosphere? As convincingly demonstrated and quantified by Wahr and Oort (Wahr and Oort, 1984; Oort, 1989), there are two main mechanisms for efficient transfer of angular momentum between the atmosphere and the lithosphere–hydrosphere system: friction and pressure differences across opposite sides of mountain ranges.
The atmosphere rotates together with the Earth as a rigid body and, in addition, moves relative to the Earth’s surface. Therefore, its absolute angular momentum is the sum of two components (the information below is taken from Sidorenkov, 2002):
Here, is the radius vector of the considered elemental volume of the atmosphere, drawn from the center of the Earth; is the Earth’s angular velocity vector; is the wind velocity vector; is the air density; is the total volume of the atmosphere. The first term represents the atmosphere’s rotational angular momentum, which arises because the atmosphere rotates together with the Earth as a rigid body with angular velocity . The second term is called the relative angular momentum of the atmosphere , which characterizes the motion of the air relative to the Earth’s surface, i.e., the wind. Therefore, it is often referred to as the wind angular momentum.
Changes in the absolute angular momentum of the atmosphere arise from variations in its inertia tensor components (due to redistribution of air masses) and fluctuations in the relative angular momentum components (wind fluctuations). In the absence of solar radiation, the atmosphere would be at rest relative to the Earth’s surface but would rotate together with the Earth as a rigid body.
Uneven heating of the atmosphere by solar radiation induces meridional flows and macroturbulent mixing of air. This results in the transfer of angular momentum from low latitudes to mid and high latitudes. At these latitudes, air in its rotation around the axis begins to move ahead of the Earth’s surface, producing westerly winds. Conversely, in low latitudes, angular momentum decreases, the air lags behind the Earth’s rotation, and easterly winds develop.
The projection of this angular momentum () onto the Earth’s rotation axis is called the polar (axial) angular momentum of atmospheric winds. It is determined by the speeds of zonal winds (averaged longitudinally). Since zonal motions dominate in the atmosphere, the magnitude of exceeds the other components by hundreds of times. The larger the value of , the stronger the westerlies and the weaker the easterlies. Because the atmosphere’s moment of inertia relative to the Earth’s rotation axis changes little, the value of to first approximation determines the angular velocity of the atmosphere as a rigid body relative to the Earth’s surface.
When winds arise, frictional forces act to slow them down. The torque of these frictional forces causes a transfer of angular momentum from the Earth to the atmosphere in the easterly wind zones, and a transfer from the atmosphere back to the Earth in the westerly wind zones. The westerly wind zones are located closer to the Earth’s rotation axis than the easterly zones. As a result, for the same wind speed, the torque in the easterly zones is greater than in the westerly zones; that is, more angular momentum flows from the Earth into the atmosphere than returns from the atmosphere to the Earth.
This causes the westerly wind speeds to increase. They continue to accelerate until the inflow and outflow of angular momentum balance in absolute terms. This stationary state is reached only when a certain amount of angular momentum has accumulated in the atmosphere, taken from the Earth.
Seasonal variations in the Earth’s rotation are primarily determined by the seasonal changes in the angular momentum of the zonal atmospheric circulation ( ). When increases, the Earth’s rotation slows down; when decreases, the rotation speeds up. This represents a redistribution of angular momentum between the Earth and the atmosphere, while the total angular momentum of the Earth–atmosphere system remains constant.
Near the Earth’s surface, easterly winds dominate at low latitudes, while westerly winds prevail at middle and high latitudes. The sign change of the zonal winds occurs in the so-called “horse latitudes” (near 30° latitude in both hemispheres), where calm zones are located (Figure 1). This plot shows a striking agreement with Figure 2, which represents a completely different process — seismic activity. In both cases, the maximum effect occurs at middle latitudes (where the largest amplitudes of seasonal variations in near-surface wind speed are also observed), while in the zone of minimal winds (φ ≈ 30°) the annual period in seismicity is absent. A slight increase in the significance of the 1-year period at low latitudes coincides with the zone of easterly winds.
The mean annual values of the angular momentum are 56×1024 kg m² s⁻¹ for the Northern Hemisphere and 88×1024 kg m² s⁻¹ for the Southern Hemisphere. This implies that the mean annual intensity of zonal circulation in the Northern Hemisphere is 36% lower than in the Southern Hemisphere. However, the amplitude of the annual oscillations of in the Northern Hemisphere is 67% greater than in the Southern Hemisphere: 57×1024 versus only 34×1024 kg m² s⁻¹. This discrepancy is due to the significantly greater continentality of the Northern Hemisphere.
The oscillations are in antiphase and largely compensate each other, although the compensation is not complete. As a result, seasonal variations of the atmospheric angular momentum remain. These variations make the main contribution to seasonal changes in the Earth’s rotation rate (Sidorenkov, 2002). Note also that the atmosphere as a whole rotates from west to east faster than the Earth. This phenomenon is known as atmospheric superrotation.
Based on daily values of for 1964–1990, we constructed mean curves (phase diagrams) of the annual variation of the atmospheric angular momentum separately for the Northern and Southern Hemispheres of the Earth (Figure 3). The maximum values of in the Northern Hemisphere occur in January–February, while the minimum occur in July–August. The maximum number of earthquakes with M=3.0–4.7 in the same hemisphere, however, occurs in March–April, and the minimum in October (Figure 3); that is, a lag of seismic activity by 2–3 months is observed. A similar pattern is found for the Southern Hemisphere as well.
The mean power of the energy sources driving atmospheric motions is approximately 2×10¹⁵ W. This amounts to about 2% of the solar energy absorbed by the Earth (Kulikov & Sidorenkov, 1977). Most of the wind energy is concentrated at middle latitudes. At the same time, the mean power (annual average) of all earthquakes is approximately 3×10¹¹ W.
The annual period in seismic activity is observed only for relatively weak earthquakes (M<5.0), and the modulation amplitude (relative to the mean annual number of such earthquakes) is about 15%. An estimate of the mean power (annual average) of this amplitude modulation yields approximately 105 W, which is ten orders of magnitude smaller than the power of the atmospheric process under consideration. Of course, the efficiency of converting atmospheric energy into seismic energy is unknown. Nevertheless, annual variations of cause accelerations and decelerations of the Earth’s axial rotation with the same period, and this requires a power of about 1014–1015 W (Sidorenkov, 2002).
Atmospheric pressure exhibits a very different dependence on geographic latitude. The principal feature of the zonal distribution of near-surface atmospheric pressure is the presence of pronounced subtropical maxima (near 35°N and S), from which pressure decreases both toward the equator and toward the poles. The mean pressure difference between = 35° and the equator is approximately 6–8 hPa. Subtropical latitudes also exhibit the largest amplitude of seasonal variations (about 7 hPa): pressure reaches a maximum in January in the Northern Hemisphere and in July in the Southern Hemisphere (Stekhnovskii, 1962).
The mechanical action of atmospheric winds on the Earth’s crust in the tangential direction is exerted through frictional forces between the air and the underlying surface, as well as through pressure forces acting on surface irregularities of the crust (mountain ranges). In the normal (radial) direction, atmospheric pressure forces act individually only on continental lithospheric plates. The normal atmospheric pressure force on oceanic lithospheric plates is the same everywhere. This results from the “inverse barometer” effect: variations in atmospheric pressure over the ocean are compensated by changes in sea level such that the pressure at the ocean floor remains approximately constant (Sidorenkov, 2002). As a consequence, the effects of frictional forces and the tangential component of atmospheric pressure forces dominate over the effect of the normal component of atmospheric pressure.
Based on a comparison of phenomenological characteristics and energy estimates, we conclude that seasonal variations of the polar atmospheric angular momentum may be responsible for the annual modulation in the occurrence rate of weak earthquakes (M<5.0).
Seasonal variations in the atmosphere - through changes in pressure, the tangential action of winds on land, and their influence on oceanic currents - may induce annual oscillations of lithospheric plates, with the maximum amplitude at high northern and southern latitudes and a minimum near the equator. These seasonal plate displacements should, in turn, produce corresponding seasonal variations in seismicity. Because momentum is transmitted through the oceans and because of the large inertia of lithospheric plates, their displacements are expected to lag behind atmospheric variations, which may explain the observed 2–3-month delay of the annual seismicity cycle relative to atmospheric seasonal cycles.
It is usually assumed that lithospheric plates move uniformly. The measured mean relative plate velocities are approximately 3–4 cm yr⁻¹, although in some regions near the equator (spreading and subduction zones) they may reach up to 10 cm yr⁻¹ (Seifert, 1991). If interannual and intra-annual variations in seismic activity are caused by nonuniform plate motion, the magnitude of this nonuniformity can be estimated. Our estimates show that intra-annual fluctuations of plate velocities amount to ±(0.5–0.6) cm yr⁻¹. These values are in close agreement - in both phase and magnitude - with the recently detected annual variations in relative station displacements obtained from VLBI, GPS measurements, and satellite laser ranging (Titov et al., 2004).
The estimated interannual fluctuations in plate velocities are, in most cases, small and close to zero, but at times may reach ≈1.0–1.5 cm yr⁻¹.
Future work will use the data available at our observatory on the motion of our station - derived from GPS and VLBI coordinate measurements - to determine possible nonuniformities in this motion on both intra-annual and interannual timescales.
Thus, the atmosphere may play a key role in variations of seismic activity. Consequently, the commonly accepted concept of the lithosphere as a system of drifting plates separated by spreading and subduction zones should be supplemented by the key notion of nonuniform plate motion (or interaction), which is closely linked to variations in atmospheric processes.
Let us now consider a model that can qualitatively integrate all the phenomena and regularities discussed above.
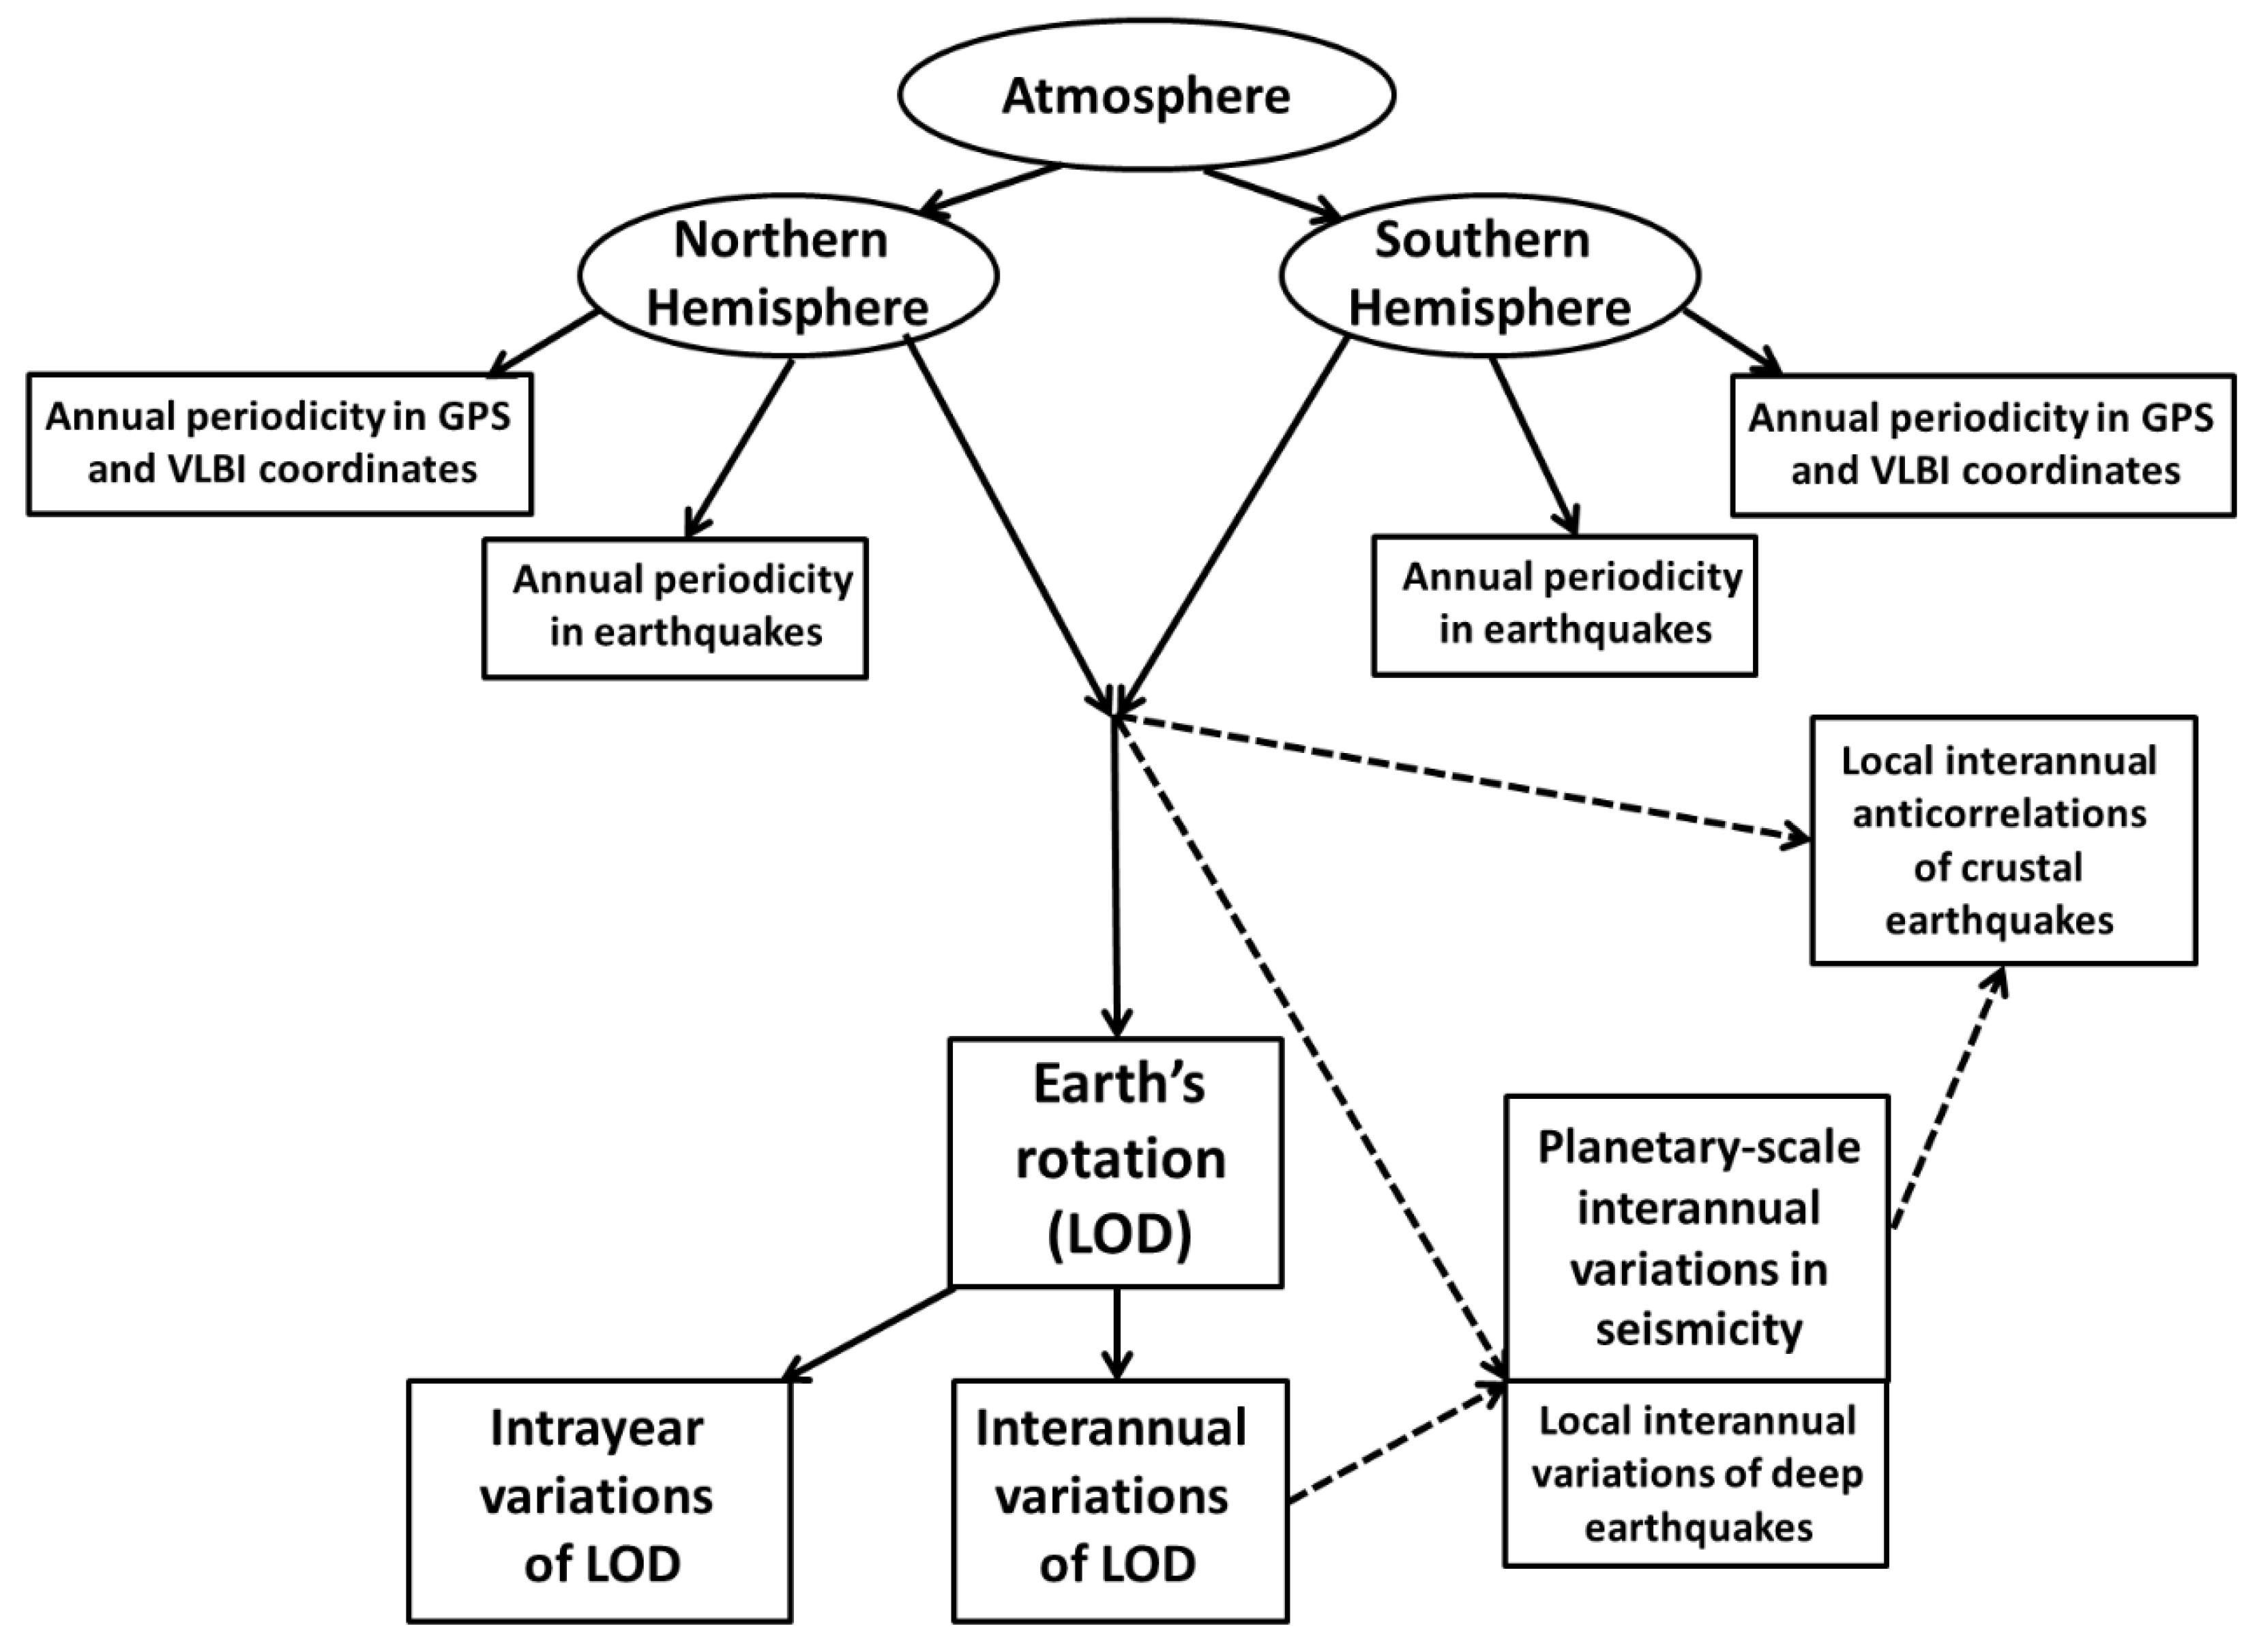
The diagram (Figure 4) illustrates the proposed concept of the relationship between seismic and lithospheric phenomena, as studied by our group, and atmospheric processes. Dashed arrows indicate hypotheses that require further verification.
The diagram illustrates the interrelation of the principal cosmic and planetary factors acting within the Earth’s lithosphere, atmosphere, and hydrosphere. It should be noted that the contribution of solar radiation to the kinetic energy of the atmosphere amounts to approximately 5×10²² J per year (Sidorenkov, 2002), whereas the total energy released in the form of earthquakes is only about 10¹⁹ J per year (Scheidegger, 1987). Thus, the atmosphere possesses sufficient energetic potential to influence the seismic activity of the lithosphere.
We emphasize two key problems, within each of which it is necessary to choose between two alternative hypotheses concerning the dynamic relationships between the atmosphere and the lithosphere that follow from the proposed concept of the Earth’s lithosphere:
- What causes the planetary-scale variability of interplate stresses and the interannual number of earthquakes: is it the direct action of atmospheric angular momentum transmitted through topography and friction, or changes in the angular velocity of Earth’s rotation of a heterogeneous crust that interacts in a complex manner with the mantle?
- What causes the asymmetry of seismic stresses in local regions, such as triple junctions of tectonic faults: the direct action of atmospheric angular momentum on a local area, or the motion of large tectonic plates adjusting to new planetary conditions (changes in the Earth’s diurnal rotation or in the global atmospheric angular momentum)?
The results obtained make it possible to move directly toward the construction of a model of nonuniform lithospheric plate dynamics. Such a model should be built from individual plates, taking into account their topography, the transfer of atmospheric angular momentum to each plate, and its subsequent evolution, while considering the dynamic interaction between plates.
At an initial stage, it may be reasonable to construct not a fully dynamic model but a simpler balance model, which accounts for the distribution of atmospheric angular momentum among individual plates, estimates their rotational moments, and evaluates changes in plate motion under the assumption of their independence. Subsequently, the stresses at plate boundaries should be estimated from the rates of their relative displacements.
References
- Wahr, J. M., & Oort, A. H. (1984). Atmospheric angular momentum variations and the Earth’s rotation. Journal of the Atmospheric Sciences, 41(2), 190-204.
- Gorkavyi, N. N., Minin, V. A., Taidakova, T. A., & Fridman, A. M. (1989). Astronomical Circular, No. 1540, 35–36.
- Gorkavyi, N. N., Trapeznikov, Yu. A., & Fridman, A. M. (1994). Geophysics. Doklady of the Russian Academy of Sciences, 338(4), 525-527.
- Gorkavyi, N. N., Levitskii, L. S., Taidakova, T. A., Trapeznikov, Yu. A., & Fridman, A. M. (1995). Physics of the Solid Earth, Vol. 30, No. 10, 875-883; 884-889.
- Gorkavyi, N. N., Levitskii, L. S., Taidakova, T. A., Trapeznikov, Yu. A., & Fridman, A. M. (1999a). Physics of the Solid Earth, Vol. 35, No. 10, 840-853.
- Gorkavyi, N. N., Levitskii, L. S., Taidakova, T. A., Tatevyan, S. K., Trapeznikov, Yu. A., & Fridman, A. M. (1999b). Physics of the Solid Earth, Vol. 35, No. 11, 906-916.
- Gorkavyi, N. N., Dmitrotsa, A. I., Levitskii, L. S., Stavitskii, Z. L., Taidakova, T. A., Tatevyan, S. K., Trapeznikov, Yu. A., & Fridman, A. M. (2000). Physics of the Solid Earth, Vol. 36, No. 5, 375-383.
- Kropotkin, P. N., & Trapeznikov, Yu. A. (1963). Izvestiya of the Academy of Sciences of the USSR, Geological Series, No. 11, 32–124.
- Kulikov, K. A., & Sidorenkov, N. S. (1977). Planet Earth. Moscow: Nauka, p. 192.
- U.S. Geological Survey, National Earthquake Information Center (1928–1990). Earthquake Data Catalog (VX DAT, 1928–1990).
- Oort, A. H. (1989). Global atmospheric angular momentum variations. Bulletin of the American Meteorological Society, 70(10), 1231.
- Seifert, K. (Ed.). (1991). Structural Geology and Plate Tectonics, Vol. 3. Moscow: Mir.
- Sidorenkov, N. S. (2002). Physics of the Earth’s Rotational Instabilities. Moscow: Nauka / Fizmatlit, p. 384. [CrossRef]
- Stekhnovskii, D. I. (1962). Moscow: Gidrometeoizdat, p. 147.
- Stoyko, N. (1952). Comptes Rendus de l’Académie des Sciences, No. 26, 234.
- Titov, O., Govind, R., & Ogaja, C. (2004). In International VLBI Service for Geodesy and Astrometry: 2003 Annual Report. NASA TP-2004-212254, eds. N. R. Vandenberg & K. D. Baver, p. 163.
- Khomutov, S. Yu. (1991). Preprint No. 13. United Institute of Geology, Geophysics and Mineralogy, Novosibirsk, p. 18.
- Khomutov, S. Yu. (1993). Preprint No. 3. United Institute of Geology, Geophysics and Mineralogy, Novosibirsk, p. 22.
- Scheidegger, A. E. (1987). Principles of Geodynamics. Moscow: Nedra, p. 384. (Original English edition: Springer-Verlag.).
- Eiby, G. A. (1982). Earthquakes. Moscow: Nedra, p. 264. (Original English edition: Elsevier / Chapman & Hall.).
Figure 1.
Latitudinal variation of the mean annual zonal wind speed () and the angular velocity () of atmospheric rotation relative to the Earth’s surface at the 850-hPa level. The figure is taken from Sidorenkov (2002).
Figure 1.
Latitudinal variation of the mean annual zonal wind speed () and the angular velocity () of atmospheric rotation relative to the Earth’s surface at the 850-hPa level. The figure is taken from Sidorenkov (2002).
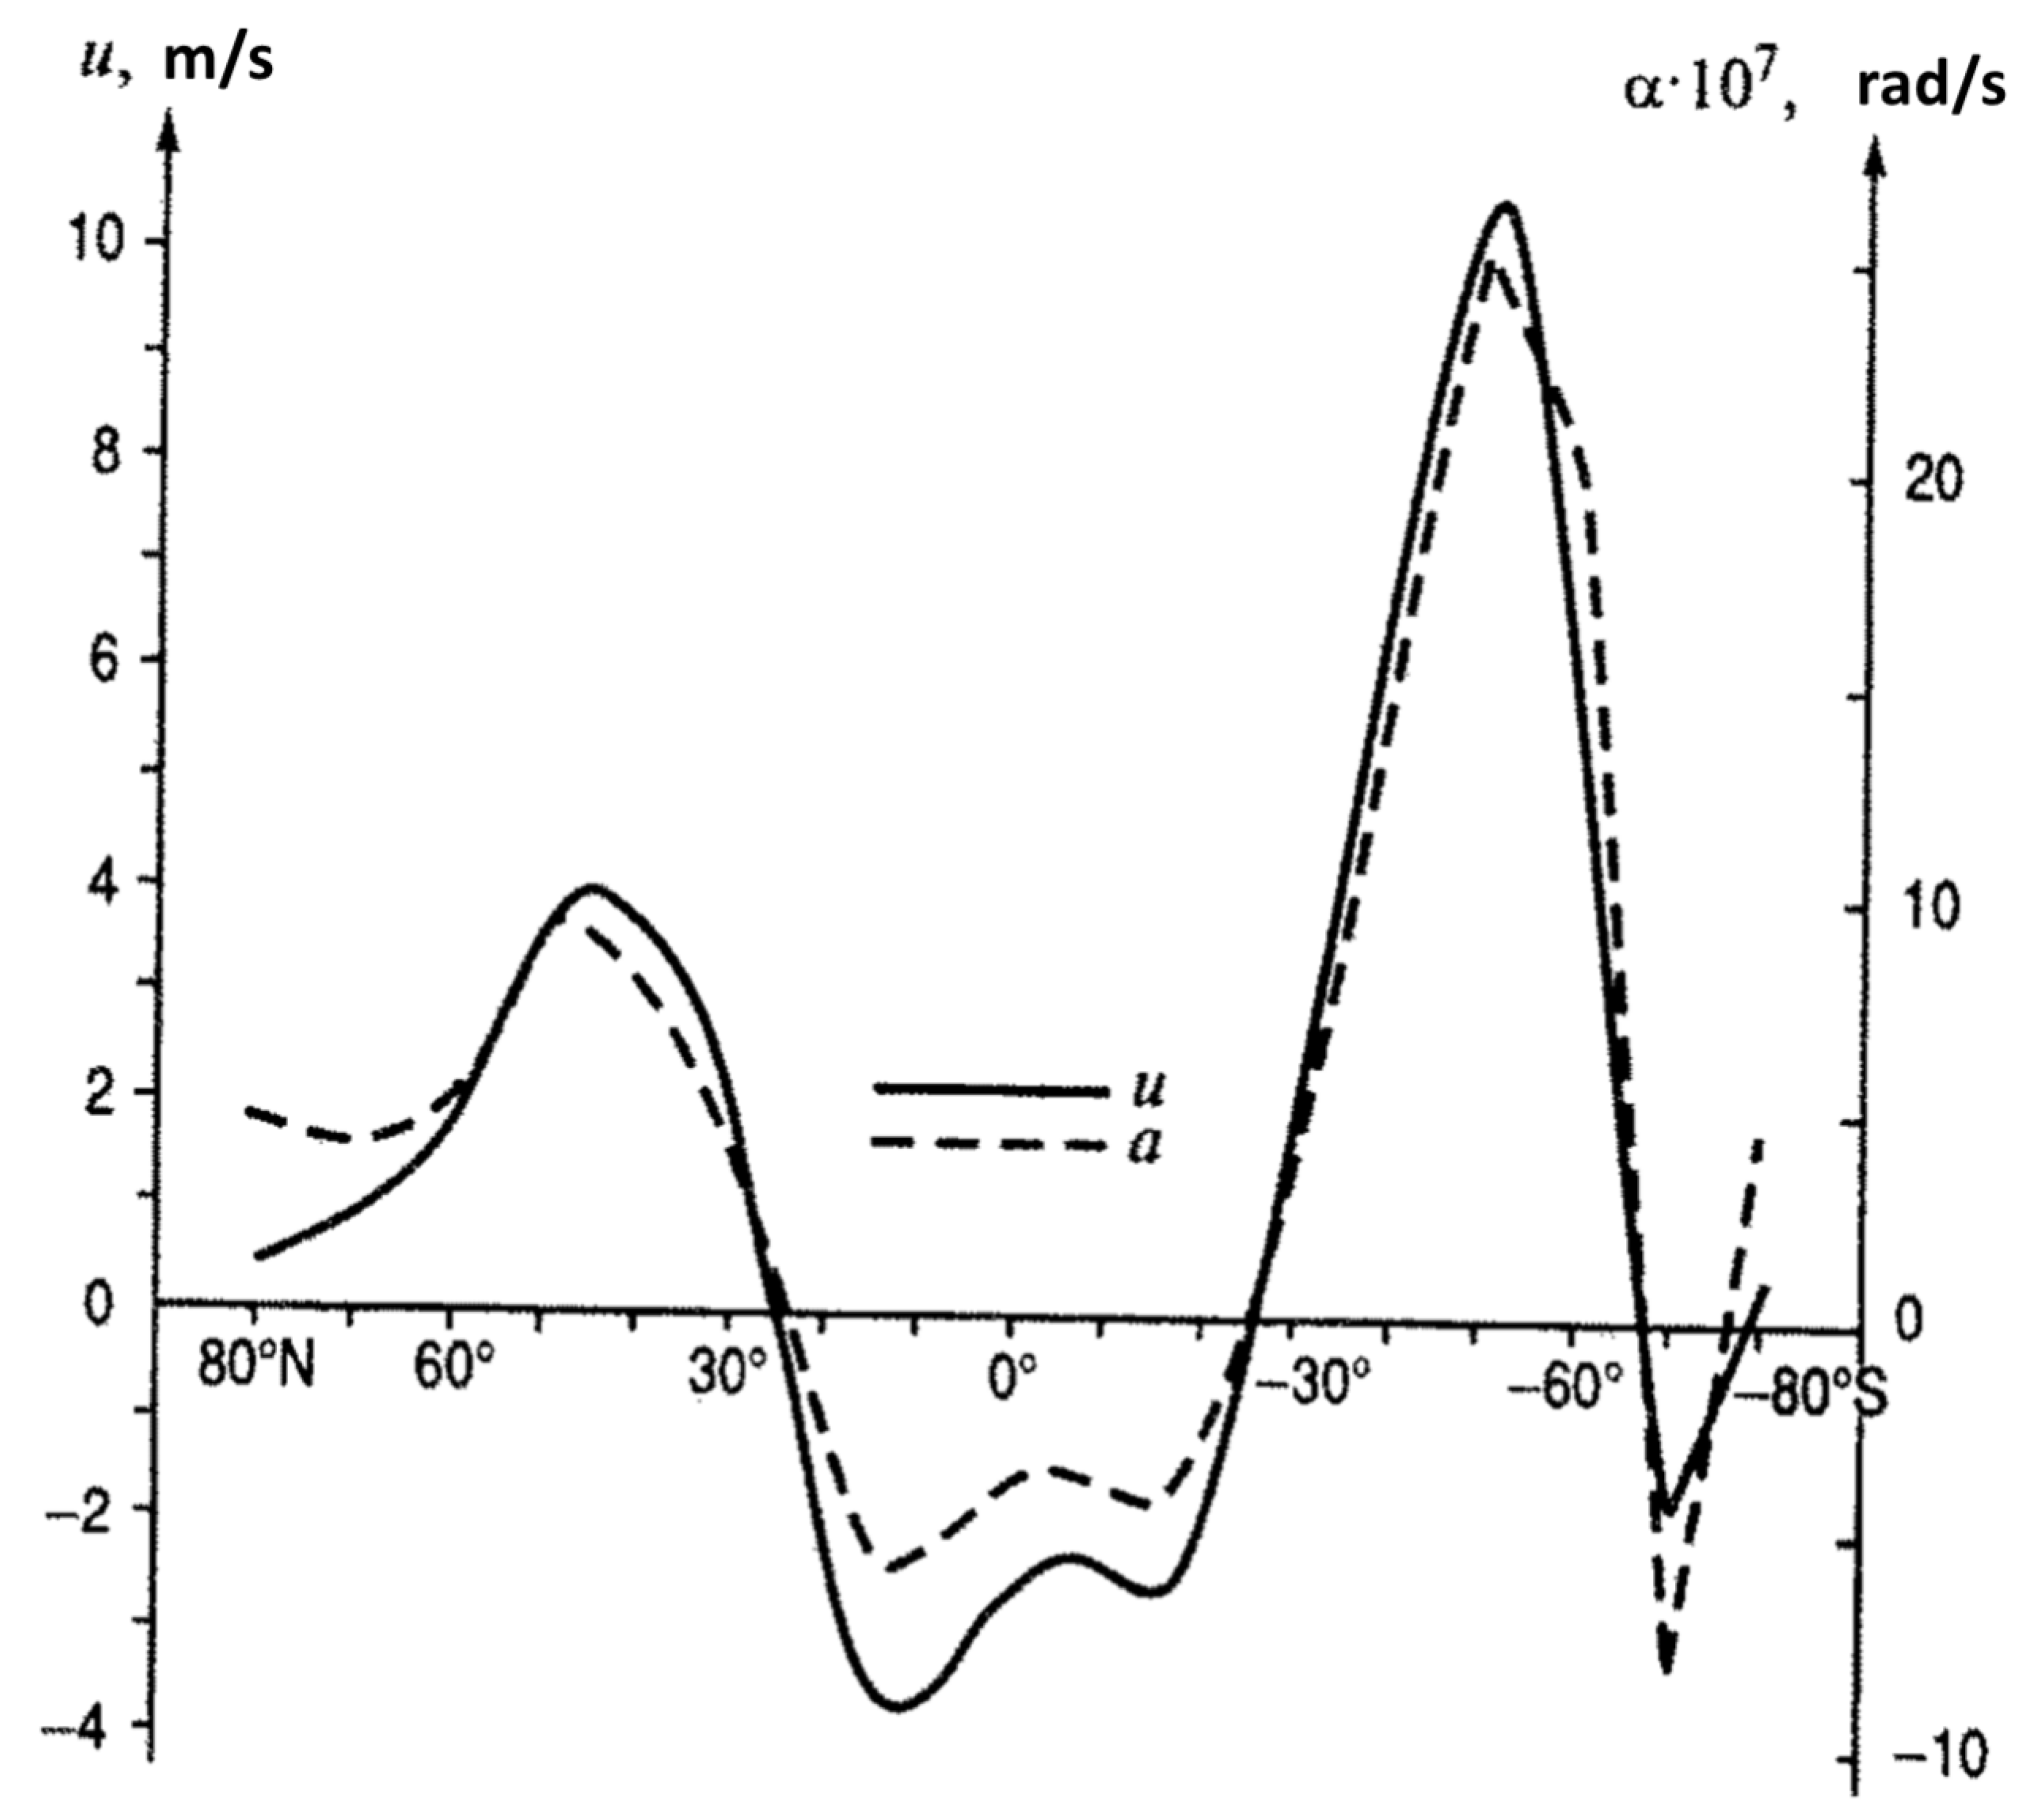
Figure 2.
Statistical significance () of the annual period in seismicity (for earthquakes with magnitudes M=3.0–4.7 and hypocentral depths D≤60 km during 1964–1990) as a function of geographic latitude ().
Figure 2.
Statistical significance () of the annual period in seismicity (for earthquakes with magnitudes M=3.0–4.7 and hypocentral depths D≤60 km during 1964–1990) as a function of geographic latitude ().
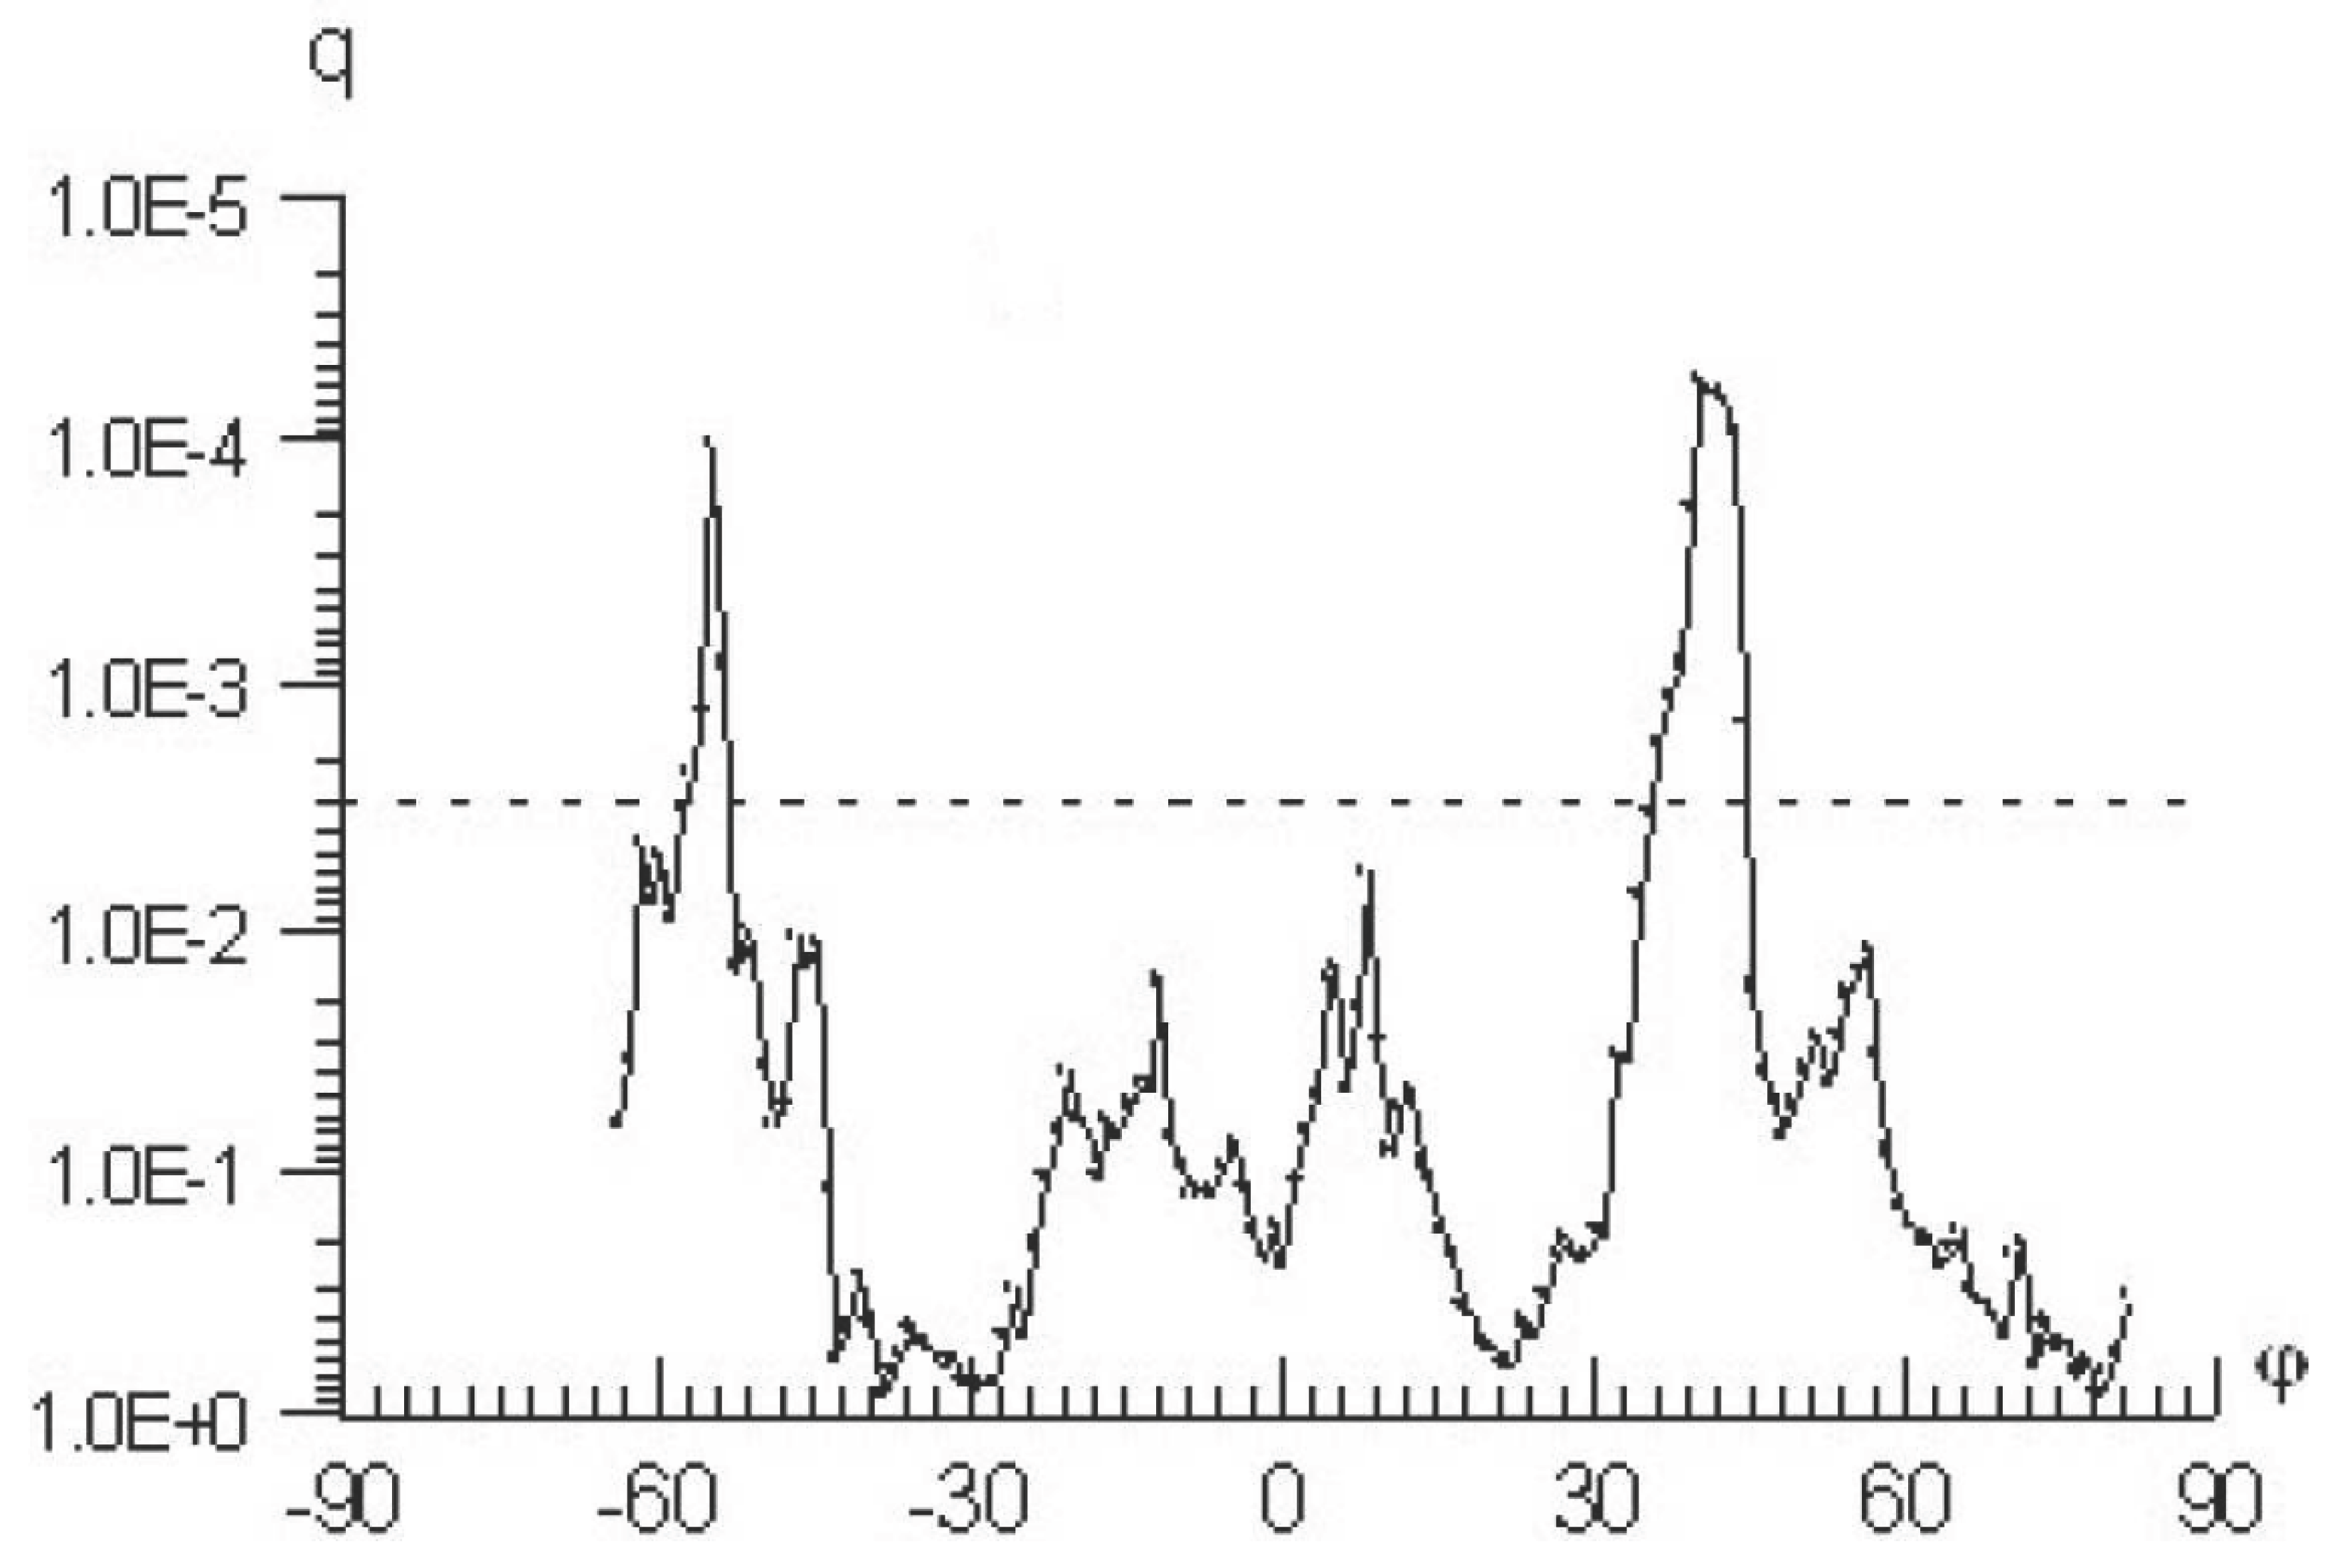
Figure 3.
Mean curves (phase diagrams) of the annual cycle of the atmospheric angular momentum (left) and seismicity (right) for earthquakes with M=3.0–4.7 occurring at middle latitudes (≈38°–61°) during 1964–1990: (a) Northern Hemisphere and (b) Southern Hemisphere. The amplitudes and phases of the harmonic curves were determined from power spectra. Vertical bars indicate root-mean-square errors.
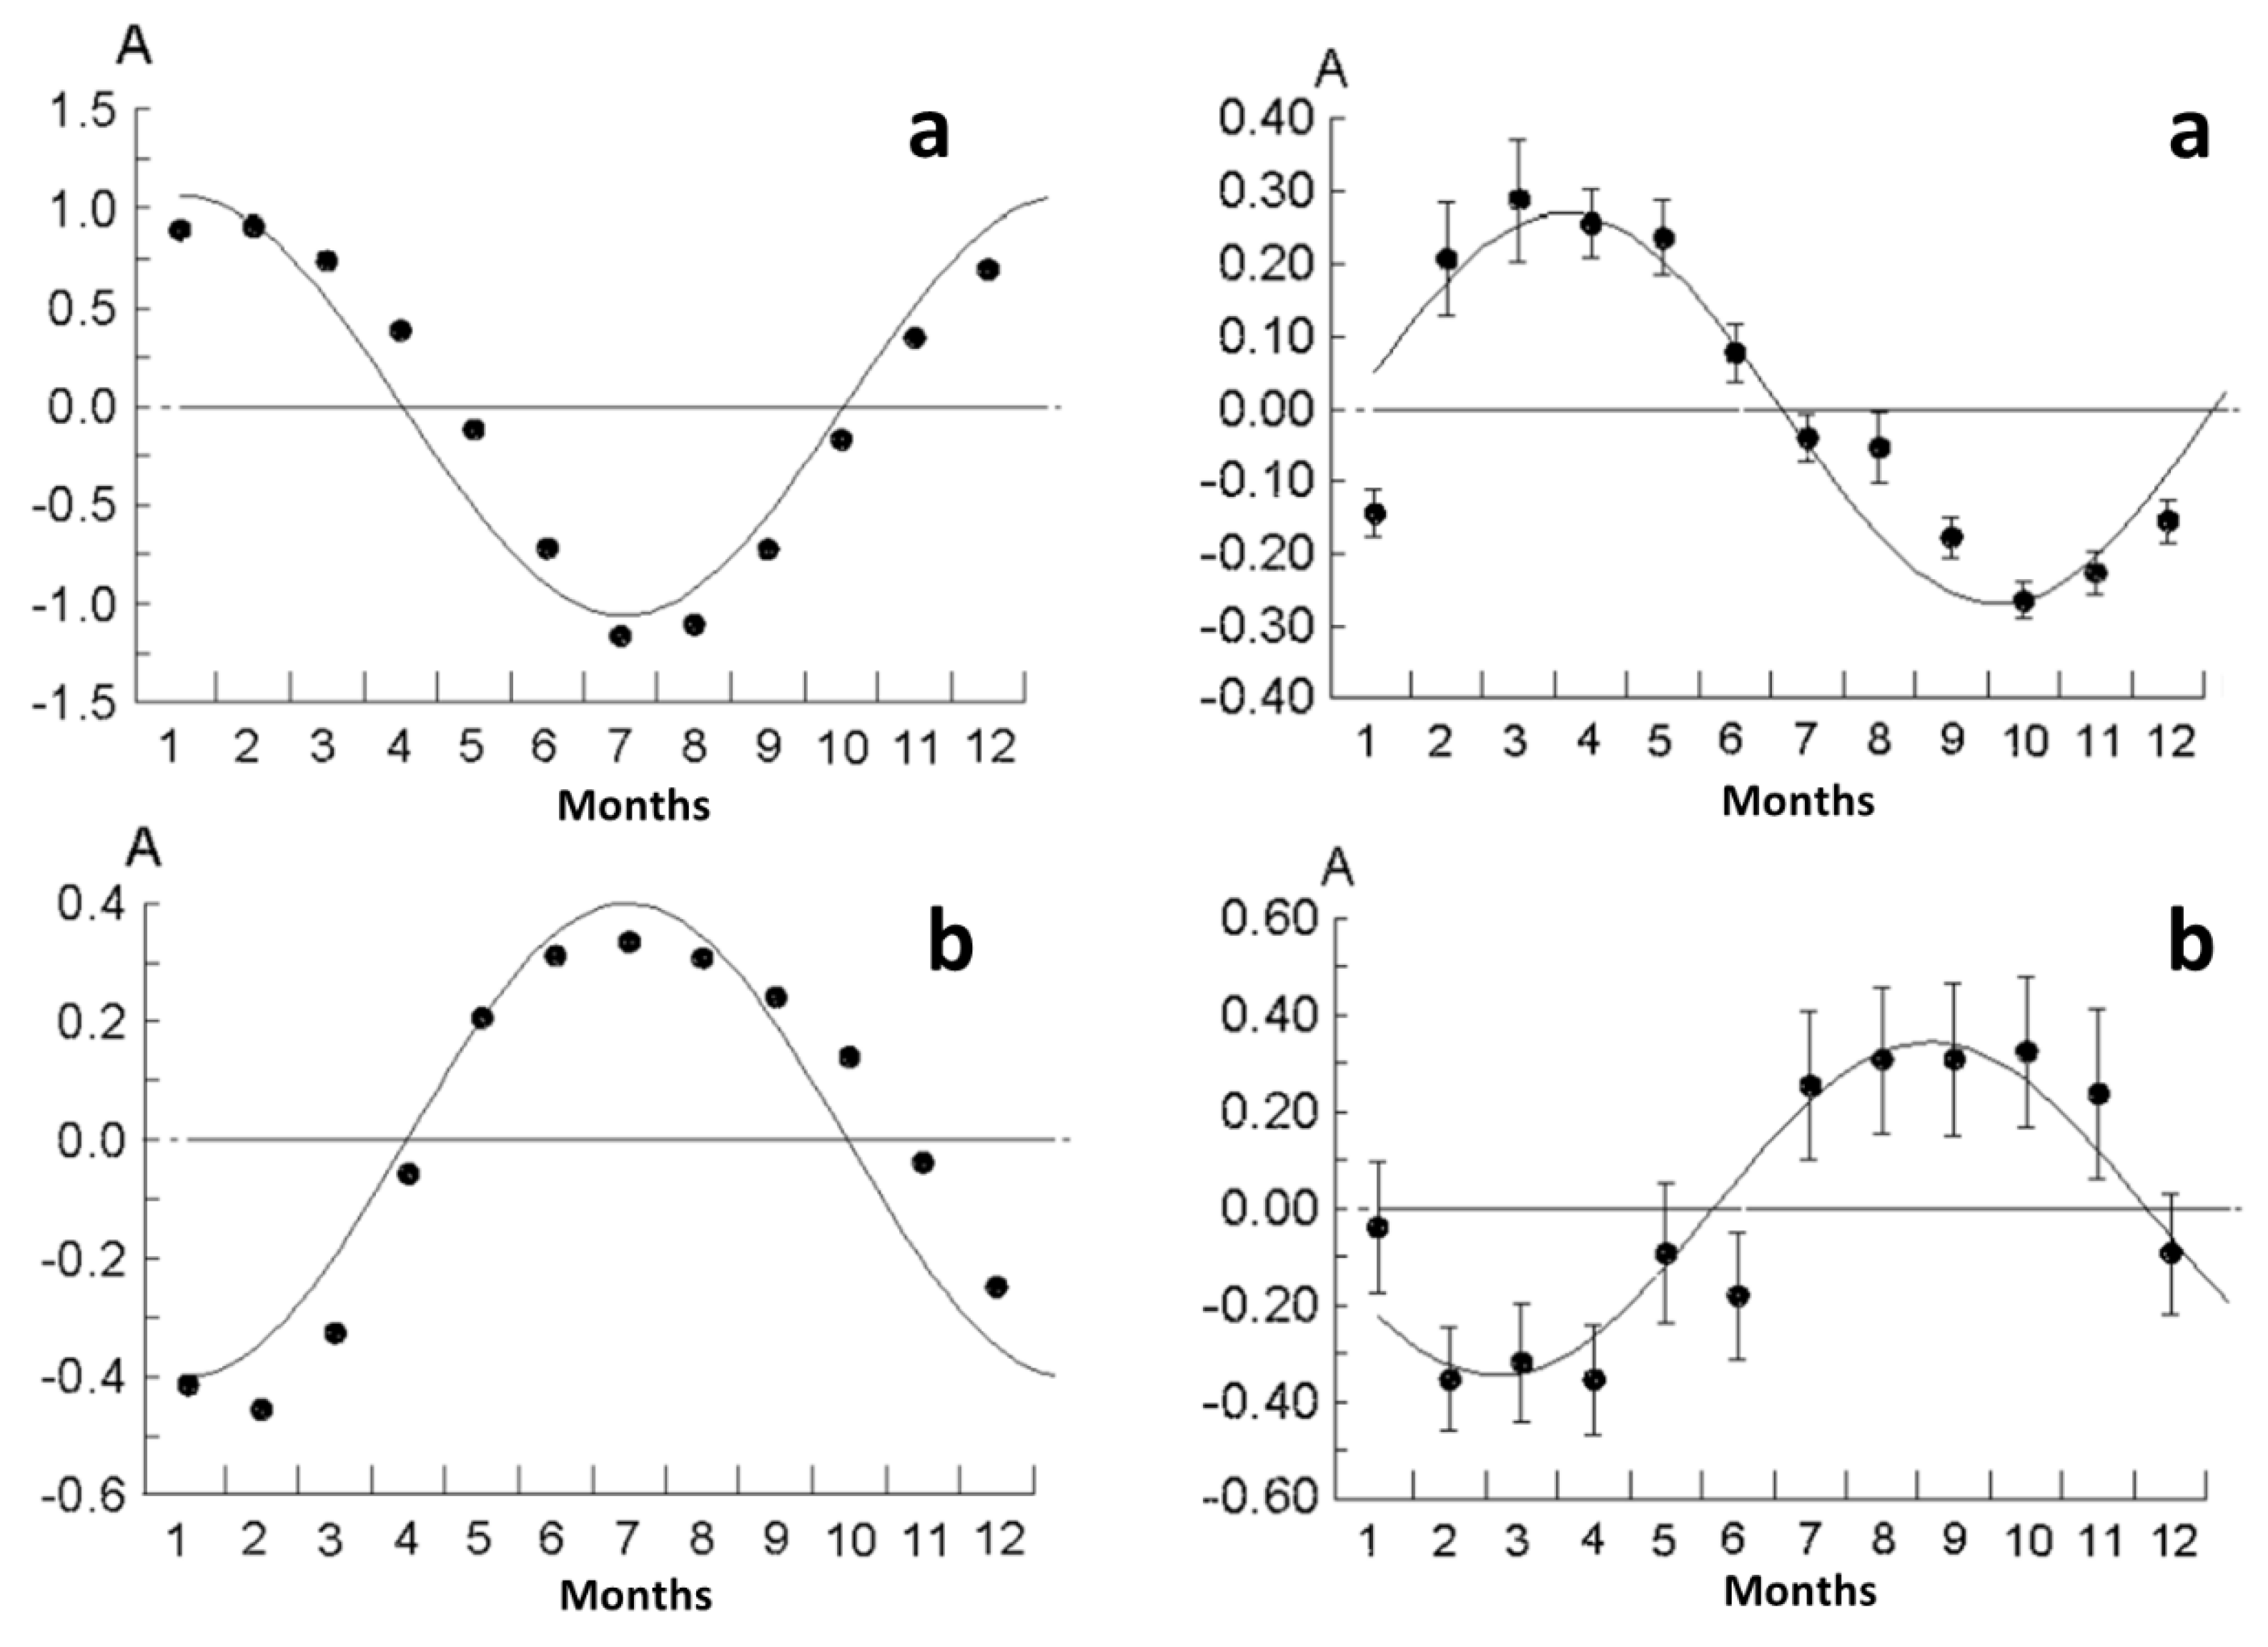
Figure 4.
Diagram illustrating the proposed concept of the interrelation between seismic and lithospheric phenomena.
Figure 4.
Diagram illustrating the proposed concept of the interrelation between seismic and lithospheric phenomena.
Disclaimer/Publisher’s Note: The statements, opinions and data contained in all publications are solely those of the individual author(s) and contributor(s) and not of MDPI and/or the editor(s). MDPI and/or the editor(s) disclaim responsibility for any injury to people or property resulting from any ideas, methods, instructions or products referred to in the content. |
© 2025 by the authors. Licensee MDPI, Basel, Switzerland. This article is an open access article distributed under the terms and conditions of the Creative Commons Attribution (CC BY) license (http://creativecommons.org/licenses/by/4.0/).
Copyright: This open access article is published under a Creative Commons CC BY 4.0 license, which permit the free download, distribution, and reuse, provided that the author and preprint are cited in any reuse.


