Submitted:
21 January 2026
Posted:
22 January 2026
You are already at the latest version
Abstract
Deep neural networks have become the dominant approach to wearable human activity recognition (HAR), yet their opacity creates practical barriers: clinicians cannot verify that predictions align with physiological knowledge, and engineers lack principled guidance on which sensors to retain when cost and power constraints demand simplification. Existing explainable AI (XAI) methods for HAR typically rely on a single attribution technique, risking method-specific biases, and report importance at granularities individual channels or entire body locations that do not map cleanly onto hardware design choices. This paper introduces a multi-method XAI framework that addresses these gaps by systematically combining counterfactual sensor-group ablation, Integrated Gradients (IG), and Shapley Value Sampling around a common deep learning backbone. We evaluate the framework on a Time-Distributed LSTM trained on the MHEALTH dataset, which records twelve activities via eight sensor groups (accelerometers, gyroscopes, magnetometers, and ECG) at the chest, ankle, and wrist; the model achieves 98.2% accuracy and macro-F1 of 0.98. Four coordinated experiments probe model behaviour at global, sensor-group, and per-class levels. Counterfactual ablation reveals that removing the ankle magnetometer collapses accuracy for dynamic locomotion by 47.1 percentage points, while wrist accelerometer removal erodes confidence for static postures by more than 50%. Class-specific IG heatmaps and temporal attribution curves expose activity-dependent sensor signatures consistent with biomechanical expectations: ankle-centric patterns for gait, wrist- and chest-centric patterns for upper-body movements, and diffuse low-energy profiles for resting states. Global IG and Shapley rankings converge, with accelerometers accounting for 89% of total attribution mass. The agreement across causal, gradient-based, and game-theoretic perspectives strengthens confidence that identified importance patterns reflect genuine model behaviour. Together, these sensor-group-level explanations provide actionable guidance for sensor selection, power-aware deployment, and clinically meaningful interpretation without sacrificing recognition performance.
Keywords:
human activity recognition
; explainable artificial intelligence
; wearable sensors
; integrated gradient
; Shapley values
1. Introduction
Over the past decade, wearable sensors have fundamentally transformed how we monitor and understand human movement. From tracking patient recovery in rehabilitation clinics [1] to enabling seamless interactions in smart homes [2], sensor-based human activity recognition (HAR) now underpins a remarkable range of practical applications. The widespread availability of inexpensive inertial measurement units (IMUs) and miniaturized physiological sensors embedded in everything from fitness bands to clinical-grade monitors has made continuous, unobtrusive activity tracking a daily reality for millions of users [3,4].
Deep learning has played a central role in this progress. Convolutional and recurrent neural networks routinely achieve recognition accuracies that rival or exceed human performance on standard benchmarks [5,6]. Yet this accuracy comes at a cost that grows more apparent as HAR systems migrate into high-stakes settings. Neural networks, by their nature, function as opaque predictors. They ingest sensor streams and emit class labels, but they rarely reveal why a particular activity was recognized or which input features drove the decision.
This opacity matters far less when the worst consequence of a misclassification is an inaccurate step count. It matters a great deal more when HAR informs clinical diagnoses [7], triggers fall alerts for elderly individuals living alone [8], or guides rehabilitation protocols after stroke or joint replacement [9]. In such contexts, practitioners cannot simply trust a black-box prediction; they need explanations that connect model outputs to physiological and biomechanical knowledge. Without that connection, clinicians struggle to identify failure modes, patients remain skeptical of automated assessments, and system designers lack the insight required to build genuinely safe devices [10].
Practical deployment pressures compound the interpretability challenge. Modern wearable HAR setups often combine accelerometers, gyroscopes, magnetometers, and even electrocardiogram (ECG) electrodes at multiple body locations. Such rich instrumentation can boost recognition performance, but it also inflates hardware cost, power consumption, and user burden. Designers therefore face pointed questions: Which of these sensors actually matter for a given application? Can some modalities be dropped without sacrificing accuracy? Do different activities depend on fundamentally different sensor subsets? Answering these questions requires more than aggregate accuracy metrics; it demands a window into how a trained model weighs its inputs.
A growing literature on explainable artificial intelligence (XAI) for HAR has begun to address these needs [11,12]. Researchers have adapted tools originally developed for image classification and natural language processing LIME [13], SHAP [14], gradient-based saliency [15] to the multivariate time-series setting. Attention mechanisms, now standard in many sequence models, offer another route to interpretability by exposing which time steps and channels receive the greatest weight during inference [16,17]. Nonetheless, existing work exhibits several persistent gaps that limit its usefulness for real-world multi-sensor systems.
Single-method explanations risk methodological bias. Most studies rely on a single XAI technique and assume the resulting attributions faithfully reflect model behaviour. Comparative analyses, however, reveal that different explanation methods can produce strikingly different feature rankings on identical models and datasets [18]. Without corroboration from alternative approaches, it remains unclear whether observed patterns are genuine or artifacts of the chosen method.
Granularity often mismatches design decisions. Explanations typically operate at the level of individual sensor channels (“ankle accelerometer X-axis”) or at the coarse level of entire body locations (“wrist”). Neither granularity aligns well with the hardware choices designers actually face. Sensor selection and pruning decisions are made at the level of functional sensor groups accelerometer versus gyroscope versus magnetometer versus ECG at a given placement yet systematic analyses at this intermediate level remain uncommon.
Global rankings obscure activity-specific structure. Many studies report dataset-wide importance scores that average over all activities. Such global views are convenient but hide the reality that different activities engage different movement patterns. Climbing stairs recruits leg muscles and gravitational orientation cues in ways that cycling does not; running emphasizes periodic lower-limb dynamics while sitting involves mostly subtle postural shifts. Per-class explanations are essential if practitioners are to verify that learned representations align with domain intuition and to explore activity-adaptive sensor configurations.
Saliency is rarely validated causally. Perhaps the most fundamental gap is the lack of counterfactual validation. Feature importance scores indicate which inputs the model appears to rely on, but they do not prove that removing those inputs would actually degrade performance. True causal evidence requires ablation: systematically masking candidate sensor groups and measuring the resulting changes in accuracy and confidence. While some studies include ablation experiments, the analysis is typically limited to aggregate accuracy drops without examining per-class or probability-level effects.
We set out to address these limitations through a unified, multi-method XAI framework designed specifically for multi-sensor wearable HAR. Our approach centers on a Time-Distributed LSTM (TD–LSTM) trained on the MHEALTH dataset [19], which records twelve diverse physical activities using eight sensor groups accelerometers, gyroscopes, magnetometers, and ECG distributed across the chest, ankle, and wrist. Around this baseline classifier, we organize four tightly coordinated experiments that examine model behaviour at global, sensor-group, and per-class levels:
- Experiment 1: Multi-level counterfactual ablation. Each of the eight sensor groups is removed in turn, and we measure three complementary outcomes: global accuracy degradation across the full test set, per-class accuracy changes for each of the twelve activities, and probability shifts for samples that remain correctly classified. This experiment yields direct causal evidence of sensor importance and exposes activity-specific vulnerabilities invisible in aggregate metrics.
- Experiment 2: Per-class Integrated Gradients attributions. We compute Integrated Gradients (IG) for every activity class, generating channel-level time–feature heatmaps and temporal sensor-group attribution curves. These visualizations reveal not only which sensor groups matter for each activity but also when during the activity window those groups exert their influence information critical for biomechanical interpretation.
- Experiment 3: Global IG sensor-group ranking. Aggregating IG attributions across the entire test set produces a dataset-wide importance ranking of sensor groups. This global view complements the per-class analysis by summarizing how the TD–LSTM distributes attention across modalities and body locations on average.
- Experiment 4: Shapley Value validation. We apply Shapley Value Sampling to derive an independent, model-agnostic importance ranking rooted in cooperative game theory. Comparing Shapley and IG rankings allows us to assess whether conclusions hold across fundamentally different theoretical frameworks gradient-based attribution versus game-theoretic contribution.
The empirical findings from these experiments converge on a coherent and biomechanically plausible picture. Ankle magnetometer and accelerometer signals prove indispensable for dynamic locomotion activities; wrist accelerometry emerges as the key modality for static postures and upper-body movements; chest accelerometry supports posture-related distinctions; and ECG, despite its clinical value in other domains, contributes negligibly to the activities studied here. Crucially, the agreement among counterfactual ablation, gradient-based IG, and game-theoretic Shapley analyses provides strong evidence that these patterns reflect genuine model behaviour rather than idiosyncrasies of any single explanation method.
The contributions of this work can be summarized as follows:
- 1.
- We present, to the best of our knowledge, the first multi-method XAI framework for wearable HAR that integrates counterfactual ablation, Integrated Gradients, and Shapley Value Sampling on a shared deep learning backbone. This design enables systematic cross-validation of explanations across complementary theoretical paradigms causal intervention, gradient attribution, and game-theoretic contribution thereby strengthening confidence in the resulting insights.
- 2.
- We introduce a sensor-group-level analysis that bridges the gap between raw XAI outputs and actionable hardware decisions. Our multi-level counterfactual study quantifies not only aggregate accuracy drops but also per-class and confidence-level degradation when individual sensor groups are masked, providing concrete guidance for sensor selection, pruning, and power-aware deployment.
- 3.
- We deliver a comprehensive per-class interpretability study on the MHEALTH benchmark, combining IG heatmaps and temporal attribution curves with global IG and Shapley rankings. The biomechanically grounded patterns that emerge from this analysis offer practical recommendations for resource-constrained HAR deployments and illustrate how multi-method XAI can reconcile model internals with domain expertise.
The remainder of this paper proceeds as follows. Section 2 surveys prior work on explainable HAR and positions our framework within the broader XAI landscape. Section 3 describes the MHEALTH dataset, preprocessing pipeline, TD–LSTM architecture, sensor-group definitions, and the four explainability experiments in detail. Section 4 reports baseline classification performance and presents empirical results for all experiments. Section 5 interprets the findings through the lenses of biomechanics, sensor design, and methodological implications, while also acknowledging limitations and avenues for future work. Section 6 summarizes the principal insights and outlines directions for continued research in explainable multi-sensor wearable HAR.
2. Related Work
As HAR systems increasingly serve safety-critical functions from clinical monitoring to autonomous fall detection the demand for transparent, interpretable models has intensified [2,11]. Deep neural networks excel at extracting discriminative patterns from sensor data, yet their internal workings remain largely inaccessible to practitioners who must ultimately trust, debug, and refine these systems. This tension has spurred a substantial body of research aimed at opening the black box, and recent surveys have catalogued the diverse strategies researchers employ to make HAR models more understandable [20]. Two broad approaches dominate the literature: embedding interpretability directly into model architectures, and applying post-hoc explanation techniques to models that were trained without explicit interpretability constraints.
Intrinsically Interpretable Architectures
One natural strategy is to design models whose structure inherently exposes the reasoning behind predictions. Attention mechanisms exemplify this philosophy. By learning to weight different time steps, sensor channels, or spatial locations, attention layers produce coefficients that can be visualized and inspected after inference. Ma and colleagues introduced AttnSense, a hybrid CNN–RNN architecture augmented with multi-level attention that explicitly highlights which sensors and temporal intervals most influence each prediction [16]. The model’s attention maps provided immediate insight into sensor prioritization, improving both accuracy and interpretability on multimodal HAR benchmarks. Building on similar ideas, Matthew et al. [21] examined attention distributions in MSANet, a recent state-of-the-art network, demonstrating that the learned weights track meaningful biomechanical cues shifting focus from lower-limb sensors during walking to upper-body sensors during arm exercises and thereby supporting user trust and failure diagnosis.
Attention is not the only route to built-in interpretability. Concept-based models take a more radical approach by requiring the network to express its reasoning through human-understandable intermediate representations. Jeyakumar et al. proposed X-CHAR, a system that recognizes complex activities by first predicting a sequence of sub-activity concepts for instance, decomposing “making a sandwich” into steps such as “reaching for bread” and “spreading condiment” [22]. Because these concepts correspond to everyday actions rather than opaque latent features, the resulting explanations align naturally with user intuitions, even when fine-grained annotations are unavailable during training. Such architectures trade some flexibility for transparency, embedding domain structure directly into the model.
Post-Hoc Feature Attribution
When modifying the architecture is impractical or when a high-performing black-box model already exists post-hoc explanation methods offer an alternative path to interpretability. Here, the trained model is treated as a fixed function, and external tools probe its behaviour to infer which inputs matter most. Gradient-based saliency methods, LIME, SHAP, and occlusion analyses all fall into this category, and each has been adapted to the peculiarities of time-series sensor data.
Gradient-based approaches compute how sensitive the model’s output is to small perturbations in each input feature. Integrated Gradients (IG), introduced by Sundararajan et al. [23], accumulates gradients along a path from a baseline input to the actual input, producing attributions that satisfy desirable axiomatic properties. IG has been applied to deep HAR networks to quantify each sensor channel’s contribution to a given prediction. Similarly, Mekruksavanich and Jitpattanakul [24] employed Grad-CAM originally designed for convolutional image classifiers on a squeeze-and-excitation network for HAR, generating heatmaps that highlighted critical accelerometer and gyroscope axes. In video-based activity recognition, Zhou et al. proposed Salience-CAM to identify the frames and skeletal joints most responsible for action classification [12].
Model-agnostic methods such as LIME [13] and SHAP [14] take a different tack. LIME fits a simple interpretable model typically a sparse linear regressor to the neighbourhood of a particular prediction, revealing which features drive that local decision. Mishra et al. adapted this idea to wearable audio signals in SoundLIME, generating perturbed versions of short audio clips and observing how the classifier’s confidence changes [12]. SHAP leverages Shapley values from cooperative game theory to allocate credit among features in a principled, axiomatic manner. Tempel et al. [25] applied SHAP to a graph convolutional network operating on skeleton data, identifying the body joints most influential for each action and confirming, through targeted perturbations, that masking high-SHAP joints caused the largest accuracy drops.
Beyond single-method studies, several frameworks have combined multiple XAI techniques to strengthen conclusions. Ullah and colleagues demonstrated the value of integrating statistical, visual, and rule-based explanations in medical image classification [26], while related work applied LIME to brain tumour detection [27] and occlusion sensitivity analysis to lung disease classification [28]. Although these studies target imaging rather than sensor data, they underscore a broader methodological point: triangulating across explanation methods can expose biases inherent in any single approach.
Wearable Sensor Analytics and Domain-Specific Explanations
The wearable computing community has increasingly tailored XAI methods to the unique characteristics of body-worn sensor data. Abdelaal et al. [29] conducted a systematic review of XAI applications in wearable analytics, mapping current practices and identifying gaps. For fall detection a domain where false negatives carry severe consequences Mankodiya et al. [30] proposed XAI-Fall, integrating sequence models with explanation tools to clarify why particular motion patterns triggered alerts. Tzanetis et al. [31] combined wearable signals with explainable risk assessment for health monitoring, while Troncoso-García et al. [32,33] developed interpretable pipelines for respiratory and sleep apnea analysis. These studies illustrate that effective explanations often require domain knowledge to translate raw attributions into clinically or biomechanically meaningful narratives.
A parallel thread of research embeds such knowledge directly into explanation frameworks. Bettini et al. advocated for eXplainable Activity Recognition (XAR) in smart-home settings, using interpretable classifiers and semantic features to produce explanations such as “activity = Cooking because stove-on = true and location = kitchen” [2]. Graph-based representations offer another avenue: Fiori et al. [34] developed GNN-XAR, a graph neural network whose explanations emphasize how sensor events connect to form coherent activity patterns. An evaluation using a large language model found that users preferred these graph-based explanations over less structured alternatives in the majority of test cases.
Recent work has also explored counterfactual explanations asking not only “what features matter?” but “what minimal change would alter the prediction?” Huang et al. [12] proposed a model-agnostic framework that generates counterfactual data augmentations, probing how small perturbations in signal properties (e.g., frequency content) shift classifier outputs. Interestingly, their approach not only clarified model behaviour but also improved overall recognition performance, suggesting that explanation techniques can serve double duty as training regularizers.
Positioning the Present Work
Table 1 situates our framework relative to prior studies along several dimensions: XAI methods employed, model architecture, dataset, sensor modalities, number of activity classes, granularity of analysis, presence of ablation studies, and provision of per-class explanations. Several observations emerge from this comparison.
First, most existing work relies on a single explanation technique attention weights, LIME, SHAP, or Grad-CAM without cross-method validation. While each technique has strengths, none is immune to methodological bias, and divergent rankings across methods have been documented [18]. Our framework explicitly combines counterfactual ablation, Integrated Gradients, and Shapley Value Sampling, enabling direct comparison of causal, gradient-based, and game-theoretic perspectives.
Second, ablation studies, when present, typically report only global accuracy drops. We extend ablation to per-class and probability-level analyses, revealing activity-specific vulnerabilities that aggregate metrics obscure.
Third, few studies provide per-class explanations despite the evident heterogeneity of activities in standard benchmarks. Our IG heatmaps and temporal attribution curves are computed separately for each of the twelve MHEALTH activities, exposing biomechanically distinct sensor signatures.
Fourth, the level of analysis rarely aligns with practical hardware decisions. By organizing explanations around functional sensor groups accelerometer, gyroscope, magnetometer, and ECG at each body location our framework speaks directly to the choices designers face when selecting and pruning sensors.
Taken together, these design choices yield a more comprehensive and actionable interpretability study than prior work, bridging the gap between abstract feature attributions and concrete guidance for deploying multi-sensor wearable HAR systems.
3. Methodology
This section presents the experimental framework underpinning our multi-method explainability analysis. We begin with the dataset and preprocessing pipeline, then describe the neural architecture chosen as our classification backbone, and finally detail the four XAI modules counterfactual ablation, per-class Integrated Gradients, global IG ranking, and Shapley Value Sampling that together probe how the trained model distributes importance across sensors, modalities, and time. Figure 1 provides a schematic overview of the complete pipeline.
The pipeline begins with raw multi-sensor recordings from the MHEALTH corpus, which are segmented into overlapping windows and partitioned subject-wise into training and held-out test sets. A Time-Distributed LSTM (TD–LSTM) classifier learns to map these windows to one of twelve activity labels, establishing the high-accuracy baseline upon which all subsequent interpretation rests. Once trained, the model is subjected to four complementary explainability analyses. Counterfactual ablation simulates the failure of individual sensor groups, measuring the resulting degradation in accuracy and confidence to establish causal importance. Per-class Integrated Gradients reveal which channels and time steps drive predictions for each activity, while a global IG aggregation summarizes importance across the entire test set. Finally, Shapley Value Sampling provides an independent, game-theoretic perspective that serves as a cross-check on the gradient-based findings. Throughout, attributions are aggregated at the level of functional sensor groups accelerometer, gyroscope, magnetometer, or ECG at a given body location so that insights translate directly into hardware design decisions.
3.1. Dataset and Preprocessing
Our experiments draw on the publicly available MHEALTH dataset [19], a widely used benchmark for wearable HAR research. Ten healthy volunteers performed twelve physical activities ranging from sedentary states like standing and sitting to dynamic locomotion including walking, jogging, and stair climbing while wearing sensors at three body locations: chest, right wrist, and left ankle. Each placement recorded tri-axial accelerometer, gyroscope, and magnetometer signals; the chest unit additionally captured a two-lead electrocardiogram (ECG). Together, these streams yield 23 synchronized channels sampled at 50 Hz, providing a rich multi-modal view of whole-body motion and cardiovascular response.
Preprocessing follows established conventions in the HAR literature [44]. The continuous recordings are segmented into fixed-length windows of samples, corresponding to 10 seconds of data at the native sampling rate. Adjacent windows overlap by 90%, achieved through a stride of 50 samples (1 second). This degree of overlap balances two competing concerns: it increases the effective number of training examples and smooths label boundaries, while remaining computationally tractable. Each window inherits the label of its dominant activity class, determined by majority vote over constituent samples. Prior to model training, each channel is standardized to zero mean and unit variance using statistics computed on the training partition, ensuring that no single modality dominates due to differences in physical units or dynamic range.
To preserve the integrity of generalization estimates, we adopt a subject-wise data split rather than a random window-level partition. Subjects 1 through 8 contribute to the training set; subjects 9 and 10 are held out exclusively for testing. This protocol prevents information leakage across the train–test boundary a subtle but consequential pitfall when consecutive windows from the same recording session share temporal structure and yields performance estimates that better reflect deployment to previously unseen individuals.
3.2. Model Architecture
The classifier at the core of our framework is a hybrid architecture that we refer to as TD–LSTM, combining time-distributed dense layers with a recurrent backbone. Several considerations motivated this design. Long Short-Term Memory networks have long demonstrated an aptitude for sequential modelling tasks, and their gated cell structure is well suited to capturing the temporal dependencies inherent in human movement [45]. Compared with Transformer-based alternatives, LSTMs impose substantially lower memory and compute demands an important consideration for eventual deployment on battery-powered wearable devices. Perhaps most relevant to the present study, the LSTM’s hidden state provides a natural temporal bottleneck that concentrates information flow, facilitating gradient-based explanation methods such as Integrated Gradients. While convolutional and attention-based architectures have achieved competitive results on HAR benchmarks [5,6], the LSTM’s interpretability advantages and its strong track record on MHEALTH make it a fitting choice for an explainability-focused investigation.
Concretely, the architecture proceeds as follows. Each input window , with time steps and channels, first passes through two time-distributed dense layers. Each layer comprises 128 units with ReLU activation, followed by batch normalization to stabilize training dynamics. Time-distributed application means that the same learned transformation is applied independently at every time step, preserving the temporal dimension. A temporal max-pooling operation then compresses the sequence, retaining the most salient activation at each feature dimension across time. The pooled representation feeds into a single-layer LSTM with 256 hidden units, which integrates information across the compressed sequence to produce a fixed-length context vector. Finally, a fully connected layer with softmax activation maps this vector to a probability distribution over the twelve activity classes.
Training employs the Adam optimizer with a learning rate of and a weight decay of to mitigate overfitting. Batches of 32 windows are processed for up to 100 epochs, with early stopping triggered if validation loss fails to improve for 15 consecutive epochs. Cross-entropy serves as the training objective. All random seeds are fixed to ensure reproducibility. Table 2 consolidates these hyperparameters alongside data configuration and XAI settings.
3.3. Sensor Grouping for Interpretability
A central goal of this work is to produce explanations that speak directly to hardware design decisions. Raw attribution maps, however, assign importance to individual input dimensions specific axes of specific sensors at specific time steps a granularity that is too fine for practical sensor selection. To bridge this gap, we aggregate the 23 input channels into eight functional sensor groups defined by the intersection of modality and body placement. Table 3 enumerates these groups.
This grouping reflects the physical reality of wearable system design: an engineer deciding whether to include a magnetometer at the ankle faces a binary choice that affects all three magnetometer axes simultaneously. By reporting attributions at the sensor-group level, our framework aligns XAI outputs with the actual levers available to hardware designers [46,47]. The same grouping also facilitates biomechanical interpretation, since each group corresponds to a coherent measurement modality at a specific anatomical location.
3.4. Counterfactual Sensor-Group Ablation
Gradient-based and game-theoretic attributions indicate which inputs the model appears to rely on, but they do not, by themselves, prove that removing those inputs would degrade performance. Counterfactual ablation closes this gap by directly intervening on the input and measuring the consequences. For each sensor group g, we construct an ablated version of every test window by replacing the channels belonging to g with zeros:
where denotes the set of channel indices assigned to group g. Zeroing mimics the situation in which the corresponding hardware component fails or is deliberately omitted, a scenario of direct practical relevance.
The impact of ablating group g is quantified at three levels. First, we compute the global accuracy drop:
where denotes classification accuracy over the full test set. A large signals that sensor group g is globally indispensable. Second, we disaggregate this metric by activity class, revealing which activities are most vulnerable to the loss of a particular sensor group. Third, for windows that remain correctly classified after ablation, we examine the shift in predicted probability for the true class. A sensor group may leave accuracy intact while substantially eroding model confidence a subtler but still consequential form of degradation that global accuracy alone would miss.
3.5. Temporal Attributions via Integrated Gradients
To understand not only which sensors matter but also when they matter, we turn to Integrated Gradients (IG), a gradient-based attribution method with appealing axiomatic properties [15]. IG attributes the model’s output to each input feature by accumulating gradients along a straight-line path from a reference baseline to the actual input. Formally, the attribution assigned to input element for target class c is
where is the baseline input, is the input of interest, and denotes the model’s pre-softmax logit for class c. The integral is approximated via the Riemann sum with 50 uniformly spaced steps, a resolution that balances fidelity and computational cost. We adopt a zero baseline throughout, interpreting it as the absence of sensor signal a natural reference point for wearable data.
Implementation requires care when the model contains LSTM layers, whose default CuDNN kernels are optimized for speed at the expense of gradient determinism. We disable CuDNN acceleration during IG computation to ensure reproducible gradients. For each of the twelve activity classes, we select up to 32 correctly classified test windows and average their IG maps to obtain a representative attribution tensor . Averaging suppresses sample-specific noise and highlights patterns that generalize across instances of the same activity.
These per-class attribution tensors serve two complementary visualizations. Channel-level heatmaps display directly, with time on one axis and input channels on the other, revealing fine-grained temporal structure. Temporal sensor-group curves aggregate attributions within each sensor group at every time step, showing how importance flows among modalities as the activity unfolds. Together, these views expose the biomechanical signatures that the TD–LSTM has learned to exploit.
3.6. Global Sensor-Group Ranking via Integrated Gradients
While per-class attributions illuminate activity-specific patterns, practitioners often require a single summary ranking that captures each sensor group’s overall contribution to model performance. We derive such a ranking by aggregating IG attributions across all correctly classified test samples, irrespective of class. For sensor group g, the global importance score is
where N is the number of test samples, T is the sequence length, is the set of channel indices for group g, and is the IG attribution for sample n at time t and channel f. Absolute values ensure that both positive and negative contributions features that increase or decrease the logit for the predicted class are counted toward importance. Normalizing by places sensor groups with different numbers of channels on a comparable footing.
The resulting ranking offers a dataset-wide perspective: which modalities and body locations does the model rely on most heavily when recognizing the full repertoire of activities? This complements the per-class view by highlighting sensors that are broadly useful versus those whose importance is confined to specific activities.
3.7. Shapley Value Sampling for Model-Agnostic Validation
Gradient-based methods like IG are computationally efficient but depend on the model’s internal structure. To verify that our conclusions are not artifacts of gradient pathologies or architectural idiosyncrasies, we employ Shapley Value Sampling [48], a model-agnostic approach grounded in cooperative game theory. The Shapley value assigns to each feature its average marginal contribution across all possible coalitions of features:
where the expectation ranges over all subsets S of the feature set F that exclude feature f. Intuitively, captures how much, on average, adding feature f to any coalition improves the model’s output.
Exact Shapley computation is intractable for high-dimensional inputs our windows contain scalar features so we resort to Monte Carlo approximation. For each of 32 randomly selected test samples, we estimate Shapley values using 20 random permutations of features, a configuration that balances variance and runtime. Features are grouped by sensor group during the permutation process, effectively treating each group as a single “player” in the cooperative game. This sensor-group-level Shapley analysis mirrors the granularity of our other experiments and produces an importance ranking that can be directly compared with the IG-based ranking.
Agreement between the IG and Shapley rankings strengthens confidence that observed importance patterns reflect genuine model behaviour rather than methodological quirks. Discrepancies, should they arise, would prompt further investigation into which assumptions gradient smoothness for IG, or the coalition-sampling approximation for Shapley may be violated.
3.8. Attribution Aggregation and Uncertainty Estimation
All attribution methods ultimately feed into a common aggregation step that summarizes importance at the sensor-group level. Given a raw attribution map whether produced by IG or Shapley sampling the importance score for sensor group g is computed as
This formulation averages absolute attributions over time and over the channels within each group, yielding a scalar that is directly comparable across groups of different sizes.
To convey the variability of these estimates, we report means and standard deviations computed across the sampled test windows. Large standard deviations signal that a sensor group’s importance fluctuates substantially from sample to sample perhaps because the group is critical only for certain activity instances whereas tight confidence intervals suggest stable, instance-independent importance. These uncertainty estimates inform both the reliability of our rankings and the potential for activity-adaptive sensor configurations.
4. Results
We now turn to the empirical evaluation of the proposed framework. The presentation proceeds in five stages: we first establish that the TD–LSTM achieves strong baseline performance on MHEALTH, confirming that subsequent explanations characterize a well-functioning classifier rather than one whose errors dominate its behaviour. We then report the outcomes of the four explainability experiments counterfactual ablation, class-specific Integrated Gradients heatmaps, temporal sensor-group attribution curves, and global importance rankings from both IG and Shapley Value Sampling. A brief statistical analysis concludes the section.
4.1. Baseline Classification Performance
Table 4 summarizes the per-class precision, recall, and F1-score achieved by the TD–LSTM on the held-out test set comprising subjects 9 and 10. The model reaches an overall accuracy of , with macro-averaged and weighted-averaged F1-scores both equal to . Every one of the twelve activities surpasses an F1-score of , demonstrating that the network reliably distinguishes not only coarse categories (static versus dynamic) but also fine-grained distinctions within each category.
Certain activities approach ceiling performance. Walking, Cycling, and Jogging all achieve F1-scores at or near , reflecting the strongly periodic and high-amplitude motion patterns that make these activities easy to discriminate. Slightly lower scores appear for Lying down () and Jump front & back (). The former is a low-motion posture whose subtle orientation cues overlap with other resting states; the latter is under-represented in the dataset ( test windows) and involves brief, explosive movements that occupy only a fraction of each window. The normalized confusion matrix in Figure 2 corroborates these observations: off-diagonal entries are sparse and concentrate among semantically related activities, such as occasional confusion between standing, sitting, and lying.
This strong baseline is prerequisite to meaningful interpretability analysis. Had the classifier performed poorly, subsequent attributions would reflect failure modes rather than the features genuinely useful for recognition. With near-ceiling accuracy, we can be confident that the explanations derived below characterize a model that has learned to solve the task.
4.2. Experiment 1: Counterfactual Sensor-Group Ablation
Having established the baseline, we proceed to probe which sensor groups the model actually depends on. The counterfactual ablation protocol described in Section 3 zeros out each of the eight sensor groups in turn and measures the resulting degradation in accuracy and confidence without retraining thereby providing direct causal evidence of functional importance.
4.2.1. Global Impact of Sensor-Group Removal
Table 5 reports the global consequences of ablating each sensor group. The most striking finding is the outsized role of the ankle magnetometer. Removing Ankle_MAG reduces accuracy from to a drop of nearly 47 percentage points and collapses macro-F1 from to . No other sensor group comes close to this level of criticality.
The next tier of importance comprises the wrist and ankle accelerometers. Ablating Wrist_ACC degrades accuracy to (), while removing Ankle_ACC yields (). Chest accelerometer and wrist magnetometer occupy an intermediate stratum, with accuracy drops of approximately 10 percentage points each. Wrist gyroscope ablation produces a modest accuracy loss.
Two sensor groups stand apart as dispensable. Chest ECG removal leaves accuracy unchanged at , indicating that the model extracts no discriminative information from the electrocardiogram at least for the activities and recording conditions in MHEALTH. Perhaps more surprising, ablating Ankle_GYRO actually improves accuracy slightly, from to . This counterintuitive result suggests that the ankle gyroscope introduces redundant or mildly noisy information that the model has learned to partially suppress; removing it eliminates a distraction rather than a resource.
4.2.2. Class-Wise Vulnerability and Confidence Erosion
Aggregate accuracy masks substantial heterogeneity across activities. Drilling into class-level effects reveals a biomechanically coherent pattern: each sensor group matters most for the activities whose dominant movements it is positioned to capture.
The ankle magnetometer is catastrophic for high-intensity locomotion. When Ankle_MAG is zeroed, accuracy for Jogging plummets from near-perfect to essentially chance (), and Running suffers a 77-point drop. Climbing stairs loses 42 points; Cycling and Jump front & back decline by smaller but still meaningful margins. These activities share a common kinematic feature: rapid, high-amplitude lower-limb motion whose orientation and heading information is encoded primarily by the magnetometer.
Wrist accelerometry, by contrast, proves essential for distinguishing sedentary states. Ablating Wrist_ACC reduces accuracy for Sitting and relaxing by approximately 55 points and for Standing still by 26 points, yet leaves dynamic activities such as Cycling and Jump front & back largely intact. The wrist, after all, rests relatively still during these high-leg-activity tasks but shifts subtly with postural adjustments when the body is otherwise stationary.
Chest accelerometry occupies a complementary niche. Its removal most severely affects Lying down () and Climbing stairs () activities in which trunk orientation or vertical oscillation carries discriminative weight. Meanwhile, Chest_ECG produces negligible per-class changes, and Ankle_GYRO shows small, non-systematic fluctuations consistent with its role as a redundant modality.
Accuracy is a coarse metric that ignores cases where the correct label survives but confidence erodes. To capture this subtler effect, we computed the mean predicted probability for the true class before and after ablation. Ankle_MAG removal induces an average confidence drop of across classes; at the activity level, Jogging falls from a mean probability of to , and Running from to . Chest_ACC ablation triggers confidence losses of approximately for Lying down and for Climbing stairs. Wrist_ACC removal erodes confidence for Sitting and relaxing by roughly and for Standing still by . These probability-level effects reinforce the class-wise accuracy findings and highlight activities whose recognition becomes fragile even if nominally correct when key sensor groups are absent.
In sum, Experiment 1 establishes that the TD–LSTM’s performance hinges on a small number of sensor groups whose importance is tightly linked to the biomechanics of the activities they monitor. The next experiments examine how the model exploits these sensors over time.
4.3. Experiment 2: Class-Specific Integrated Gradients
Counterfactual ablation reveals which sensors matter; it does not explain when during an activity window those sensors exert their influence, or which individual channels within a sensor group carry the signal. Integrated Gradients address these finer-grained questions. For each of the twelve activities, we computed IG attributions on up to 32 correctly classified windows using a zero baseline, then averaged across samples to obtain a representative time–feature map .
4.3.1. Time–Feature Heatmaps
Figure 3 displays the resulting heatmaps. Three broad regimes emerge, distinguished by attribution magnitude, temporal structure, and the sensor groups that dominate.
4.3.1.1. Static postures.
Standing still, Sitting and relaxing, and Lying down exhibit low overall attribution energy spread diffusely across time. The dominant contributions come from Chest_ACC and Ankle_ACC channels; gyroscopes and magnetometers contribute little. This pattern makes biomechanical sense: these activities differ primarily in subtle gravitational orientation and micro-movements rather than in pronounced periodic motion, and accelerometers are well suited to detecting such quasi-static cues.
4.3.1.2. Localized upper-body movements.
Waist bends forward, Frontal elevation of arms, and Knees bending produce stronger, more temporally concentrated attributions. IG peaks cluster in the middle portion of the window the interval during which the discrete movement occurs and emphasize Chest_ACC alongside Wrist_ACC and, to a lesser extent, Wrist_GYRO. Ankle sensors play a secondary role, consistent with the fact that these activities involve trunk and arm motion while the lower limbs remain relatively stationary.
4.3.1.3. Dynamic locomotion.
The remaining six activities Walking, Climbing stairs, Cycling, Jogging, Running, and Jump front & back generate the highest IG magnitudes and the richest temporal structure. Attributions concentrate on Ankle_ACC, Ankle_MAG, and Wrist_MAG. Gait-based activities such as Walking and Climbing stairs display quasi-periodic vertical bands, mirroring the cyclic nature of stepping. Cycling exhibits a similar periodicity but with greater wrist involvement, reflecting handlebar interaction. Jogging and Running produce intense, high-frequency attribution bursts on the ankle and wrist magnetometers, corresponding to impact forces and arm swing. Jump front & back concentrates its IG mass in a narrow central interval with sharp peaks on Ankle_MAG and Wrist_MAG, capturing the explosive launch and landing phases.
Across all classes, the channels receiving the largest IG attributions align closely with those whose ablation caused the greatest accuracy and confidence drops in Experiment 1. This concordance provides a first qualitative triangulation between gradient-based and causal explanations.
4.3.2. Temporal Sensor-Group Attribution Curves
To complement the channel-level view, we aggregated IG within each of the eight sensor groups at every time step, yielding curves that trace how importance flows among modalities as an activity unfolds. Figure 4 presents these curves for all twelve activities.
Several recurring patterns stand out. First, nearly every activity shows a pronounced rise in attribution during the final 5–10 time steps. This end-of-window effect reflects the TD–LSTM’s recurrent readout: the last hidden state integrates information accumulated over the sequence, and gradients backpropagating from the output concentrate on the inputs that most directly shape that final state.
Second, high-motion activities channel the bulk of their attribution through lower-body sensors. In Jogging, Running, and Cycling, Ankle_MAG and Ankle_ACC dominate the curves, with periodic undulations that mirror gait or pedalling cycles. Knees bending follows a similar pattern, though with somewhat lower amplitude. Running additionally exhibits large early peaks on both Ankle_MAG and Wrist_MAG, suggesting that the model attends to the initial strides and accompanying arm swing to lock in its prediction.
Third, upper-body activities shift emphasis to wrist and chest. For Frontal elevation of arms, Wrist_MAG and Chest_ACC carry the highest attribution throughout most of the window; ankle sensors remain nearly flat. Waist bends forward shows a similar but lower-magnitude profile, with Chest_ACC contributing more prominently during the trunk flexion phase.
Fourth, static postures yield low, flat curves across all sensor groups, with only modest contributions from Wrist_MAG and Ankle_ACC. The absence of sharp peaks or periodicity reflects the minimal kinematic variability inherent to standing, sitting, and lying.
Finally, Jump front & back produces a distinctive signature: simultaneous spikes on Ankle_MAG, Ankle_ACC, and Wrist_MAG concentrated in the latter half of the window, capturing the ballistic launch and landing. The burst is brief but intense, consistent with the explosive nature of jumping.
The sensor groups emphasized in these temporal curves correspond closely to those identified as critical in the ablation study, reinforcing the consistency of gradient-based and counterfactual explanations.
4.4. Experiment 3: Global Integrated Gradients Ranking
The preceding experiments focus on activity-specific patterns. Practitioners, however, often need a single summary that captures each sensor group’s overall contribution across the full activity repertoire. Experiment 3 addresses this need by aggregating IG attributions over 16 representative test windows irrespective of class.
Table 6 reports the resulting ranking. Wrist accelerometry emerges as the dominant modality, accounting for of the total IG mass. Chest and ankle accelerometers follow at and , respectively. Together, these three groups capture nearly of the aggregated attribution, underscoring the primacy of linear acceleration measured at distal and central body locations for this HAR task. Gyroscopes contribute a combined , magnetometers roughly , and Chest_ECG a mere .
An instructive discrepancy emerges when comparing this ranking with the ablation results. Ankle_MAG, whose removal caused the largest accuracy collapse, ranks only sixth in global IG. The explanation lies in the different quantities each method measures. IG captures the marginal contribution of each feature along the baseline-to-input integration path; ablation captures the functional consequence of complete removal. A sensor group can have modest average gradient yet act as a critical gating signal whose absence derails the decision process. Ankle_MAG appears to play precisely this role: it is not the loudest voice in the model’s computation on typical inputs, but its silence is devastating.
This discrepancy illustrates why multiple XAI perspectives are valuable. Global IG provides a useful default ranking for resource allocation, but ablation reveals hidden dependencies that average attribution scores would miss.
4.5. Experiment 4: Shapley Value Validation
Gradient-based attributions, for all their convenience, depend on the model’s differentiable structure and on the choice of baseline and integration path. To verify that our conclusions are not artifacts of these choices, we computed Shapley values using the sampling-based approximation described in Section 3. Shapley values arise from cooperative game theory and make no assumptions about model internals; they assign to each feature its average marginal contribution across all possible feature coalitions.
Figure 5 displays the Shapley-based importance ranking. Wrist accelerometry again tops the list, followed by ankle and chest accelerometers the same top three that dominate the IG ranking. Mid-tier positions go to the gyroscopes, while magnetometers and ECG occupy the bottom. The overall ordering closely mirrors that of global IG, with minor permutations among the lower-ranked groups.
This convergence between gradient-based and game-theoretic methods is reassuring. When two fundamentally different explanation frameworks agree, the shared conclusions are unlikely to be methodological artifacts. The dominance of accelerometers, the secondary role of gyroscopes, and the near-irrelevance of ECG appear to be genuine properties of the TD–LSTM’s learned decision function.
4.6. Statistical Considerations and Ranking Stability
The IG and Shapley rankings derive from modest sample sizes (16–32 windows), raising legitimate questions about reliability. To gauge stability, we performed bootstrap resampling with 1000 iterations, computing 95% confidence intervals for each sensor group’s mean attribution.
The results are encouraging for the top and bottom of the rankings. Wrist_ACC, Chest_ACC, and Ankle_ACC maintain their positions across all bootstrap samples, with confidence intervals that do not overlap those of the lowest-ranked groups (Chest_ECG, Wrist_MAG). The middle tier Ankle_GYRO, Wrist_GYRO, Ankle_MAG shows greater variability, with overlapping intervals that counsel caution when drawing fine distinctions among these groups.
For the ablation experiments, formal hypothesis tests such as McNemar’s statistic or paired bootstrap would strengthen the claims. Nonetheless, the magnitude of the observed effects is large: for Ankle_MAG far exceeds typical classification variance on MHEALTH, lending confidence to the qualitative conclusions even without formal testing. Future work should incorporate cross-validation across multiple subject splits and report confidence intervals for all metrics.
5. Discussion
The experiments reported above paint a consistent picture: the TD–LSTM achieves strong classification performance on MHEALTH, and that performance rests on sensor groups whose importance aligns with basic biomechanical intuition. In this section we step back to consider the broader implications of these findings what they reveal about the model’s internal representations, how they inform practical sensor design, why combining multiple XAI methods matters, and where the current analysis falls short.
5.1. Biomechanical Plausibility of Learned Representations
Perhaps the most reassuring outcome of this study is the degree to which the TD–LSTM’s explanations make biomechanical sense. The ablation study identifies ankle magnetometer and accelerometer signals as indispensable for dynamic locomotion, wrist accelerometry as crucial for distinguishing sedentary postures, and chest accelerometry as important for trunk-centric activities. The class-specific IG heatmaps and temporal curves refine this picture, showing that attributions concentrate on the body segments and time intervals one would expect from first principles: ankle-centric patterns during gait, wrist- and chest-centric patterns during arm elevation, and diffuse low-energy profiles during static resting states.
This alignment matters for two reasons. First, it suggests that the network has learned to exploit physically meaningful features rather than spurious correlations or dataset-specific artifacts. The fact that Jogging and Running produce intense IG peaks on Ankle_MAG and Wrist_MAG during impact and propulsion phases indicates sensitivity to the same high-frequency, high-amplitude components that human experts use to distinguish fast locomotion from slower gait. Second, the separation among static postures, localized upper-body movements, and dynamic locomotion suggests that the TD–LSTM has implicitly learned an internal taxonomy of activities. Although no explicit supervision distinguishes these categories, the attribution maps reveal that different subsets of the model’s capacity are effectively specialized to different movement regimes a form of emergent modular organization that bodes well for interpretability and robustness.
5.2. Practical Guidance for Sensor Selection
From a deployment standpoint, the most actionable findings concern which sensors can be retained or discarded under hardware and energy constraints. The ablation results make clear that not all modalities contribute equally. Ankle magnetometer and accelerometer form a bottleneck for dynamic locomotion; wrist accelerometer is essential for sedentary-state discrimination; and ECG and ankle gyroscope are largely redundant for the activities in MHEALTH.
These observations motivate a tiered design strategy. A minimal configuration for general-purpose monitoring might comprise wrist and ankle accelerometers, optionally supplemented by a chest accelerometer for improved posture recognition. Such a setup retains the modalities that dominate both the IG and Shapley rankings while shedding low-yield channels. On battery-limited devices, this translates directly into reduced power draw, lower wireless bandwidth, and simpler form factors.
Yet the probability-level analysis urges caution. Although Ankle_MAG contributes modestly to average attributions, its removal triggers catastrophic confidence collapse for high-intensity activities. In applications where missing a jogging or running episode carries safety implications fall detection, workplace hazard monitoring magnetometers may be non-negotiable despite their apparently secondary ranking. Sensor selection policies should therefore be informed not only by marginal importance scores but also by counterfactual tests of functional necessity.
The class-specific IG visualizations offer a further refinement: activity-targeted sensor pruning. For upper-limb rehabilitation, the heatmaps for Frontal elevation of arms and Waist bends forward indicate that wrist and chest sensors suffice, while ankle channels contribute little. For mobility monitoring in elderly populations, the strong ankle-centric patterns for walking and stair climbing suggest that an ankle-only configuration might be adequate, paired with a lightweight wrist unit to detect arm swing and balance compensation. The proposed framework thus supports principled, use-case-specific hardware decisions grounded in model behaviour rather than ad hoc intuition.
5.3. The Value of Multi-Method Explainability
A central methodological takeaway is that no single XAI technique tells the whole story. Counterfactual ablation measures functional impact under complete sensor removal. Integrated Gradients quantify marginal contributions along a baseline-to-input path, with fine temporal and channel resolution. Shapley values provide a model-agnostic, game-theoretic perspective that averages over all possible feature coalitions. Each method has known limitations ablation can overestimate importance when features are correlated; IG is sensitive to baseline choice; Shapley sampling can be noisy in high dimensions but their agreement or disagreement carries interpretive weight.
In our experiments, the three approaches largely converge. Sensor groups that trigger large accuracy and confidence drops under ablation also receive high mass in IG heatmaps and high Shapley scores. This convergence strongly suggests that the identified importance patterns reflect genuine properties of the TD–LSTM rather than idiosyncrasies of any single explanation method. The notable exception Ankle_MAG ranking modestly in global IG yet proving catastrophic under ablation highlights a subtlety that no single method would have revealed: some modalities act as gating signals whose absence is devastating even when their typical gradient is small.
More broadly, these results endorse a multi-lens philosophy for explainability in time-series HAR. Rather than seeking a single “true” importance ranking, practitioners should expect different XAI tools to illuminate different facets of model behaviour and should interpret them jointly. The framework developed here can serve as a template for future studies seeking robust explanations in domains where trust and safety are paramount.
5.4. Trust, Debugging, and Domain Relevtic
Beyond sensor selection, the ability to localize model attention in sensor space and time offers practical benefits for system validation. Class-specific IG heatmaps and curves provide a diagnostic tool for detecting spurious shortcuts. If a model trained on a different dataset were found to rely heavily on a channel with no biomechanical justification for a given activity, that finding would raise a red flag about overfitting to recording artifacts or labeling quirks. In the present study, no such pathological patterns emerged; attributions align with domain knowledge, bolstering confidence in the model’s generalization.
The temporal localization of IG peaks also opens the door to human-in-the-loop interfaces. Segments where confidence shifts rapidly but attributions are weak could be flagged for manual review; segments with strong, consistent attribution could generate explanatory summaries for clinicians or safety officers (“classification relied primarily on ankle accelerations during the push-off phase”). In regulatory environments where stakeholders demand not only accurate predictions but also rationales, such capabilities may prove essential.
5.5. Concrete Recommendations for System Design
Distilling the experimental findings into actionable guidance, we offer the following recommendations:
Minimal viable sensor set. For resource-constrained deployments targeting a broad activity mix, wrist and ankle accelerometers capture the lion’s share of discriminative information approximately of the combined IG and Shapley mass and should form the core of any configuration.
Activity-specific optimization. When the target activity set is known in advance, the class-specific IG heatmaps enable tailored sensor selection. Mobility monitoring can prioritize ankle sensors; upper-body rehabilitation can emphasize wrist and chest; mixed-use scenarios may require the full complement.
Safety-critical safeguards. In applications where failing to detect high-intensity locomotion carries serious consequences, magnetometers particularly at the ankle should be retained despite their lower average attribution scores. Their gating role makes them non-negotiable for certain failure modes.
Deployment workflow. We recommend a three-stage process: (1) train a baseline model on the full sensor array, (2) apply the multi-method XAI framework to identify critical and redundant groups for the target activities, and (3) validate pruned configurations via ablation before deployment. This systematic approach balances performance, interpretability, and resource efficiency.
5.6. Limitations and Directions for Future Work
Several caveats temper the conclusions drawn above.
Single-dataset scope. All experiments use MHEALTH, with its specific sensor placements, sampling rate, and activity taxonomy. Whether the identified importance hierarchies generalize to other benchmarks PAMAP2, OPPORTUNITY, or in-the-wild recordings remains an open question. Future work should validate the framework across diverse datasets and recording conditions.
Architecture dependence. The TD–LSTM is one design point among many. Transformer-based models and temporal convolutional networks have shown competitive or superior performance on some HAR tasks. The extent to which observed patterns (e.g., end-of-window IG peaks) are architecture-specific artifacts rather than intrinsic to the data is not fully resolved. Applying the multi-method pipeline to alternative architectures would clarify this issue.
Limited XAI sampling. Both IG and Shapley analyses rely on relatively small subsets (16–32 windows) for tractability. While bootstrap analysis supports the top-level conclusions, more exhaustive sampling would enable formal statistical testing and tighter confidence intervals. Scalable approximation schemes for game-theoretic explanations in high-dimensional time series remain an active research area.
Ablation versus retraining. Zeroing sensor groups at test time measures how much the current model depends on each group, not how much each group is intrinsically necessary for the task. Retraining from scratch after permanent sensor removal would provide complementary evidence about true task requirements and potential model adaptation.
Laboratory versus field conditions. MHEALTH comprises controlled laboratory recordings. Real-world deployments face sensor drift, intermittent connectivity, and non-stationary user behaviour that may affect both classification and explanation reliability. Field validation is necessary before the sensor-selection recommendations can be confidently deployed.
Looking ahead, several extensions appear promising. Applying the framework to additional datasets and architectures would strengthen generalizability claims. Incorporating formal statistical testing with cross-validation would sharpen the reliability of importance rankings. Perhaps most intriguingly, the explanations derived here could be fed back into training regularizing the model toward biomechanically plausible attention patterns, penalizing excessive reliance on low-importance sensors, or iteratively pruning and retraining in a closed loop. Such explanation-guided training procedures could improve robustness, facilitate domain adaptation, and further reduce the cost of deploying HAR systems in resource-constrained or safety-critical environments.
In summary, the experiments demonstrate that a TD–LSTM trained on multi-sensor wearable data can achieve high recognition performance while exhibiting interpretable, biomechanically grounded behaviour when analyzed through counterfactual ablation, Integrated Gradients, and Shapley Value Sampling. The resulting explanations support concrete sensor design decisions, provide tools for model debugging and trust assessment, and chart principled directions for future research on explainable human activity recognition.
6. Conclusions
This study set out to bridge two persistent gaps in wearable human activity recognition: the opacity of high-performing deep learning models, and the lack of principled methods for connecting explainability outputs to practical sensor design decisions. Our response has been a multi-method XAI framework that wraps counterfactual ablation, Integrated Gradients, and Shapley Value Sampling around a Time-Distributed LSTM classifier, producing explanations that are robust across complementary theoretical paradigms and directly interpretable at the level of hardware components.
The empirical results on the MHEALTH benchmark are encouraging on both fronts. The TD–LSTM itself achieves near-ceiling performance overall accuracy and a macro-F1 of establishing that the model has genuinely learned to discriminate among the twelve target activities rather than exploiting superficial shortcuts. More importantly, the four explainability experiments converge on a coherent and biomechanically plausible account of how that discrimination is achieved.
At the global level, accelerometers at the wrist, chest, and ankle dominate the importance rankings produced by both Integrated Gradients and Shapley Value Sampling, together capturing nearly nine-tenths of the total attribution mass. Counterfactual ablation corroborates this finding while exposing a subtler structure: the ankle magnetometer, though contributing modestly to average gradient-based scores, functions as a critical gating signal for dynamic locomotion its removal triggers catastrophic accuracy collapse for jogging and running. Wrist accelerometry proves indispensable for distinguishing sedentary postures, chest accelerometry supports trunk-centric activities, and ECG and ankle gyroscope channels turn out to be largely redundant for the activities studied here.
At the per-class level, Integrated Gradients heatmaps and temporal sensor-group curves reveal that the TD–LSTM allocates attention in ways that align with the dominant joints and movement phases for each activity. Gait-based tasks produce quasi-periodic, ankle-centric attribution patterns; upper-body exercises emphasize wrist and chest channels during the active movement interval; static postures yield low, diffuse profiles reflecting their minimal kinematic variability. This activity-specific structure suggests that the network has implicitly learned an internal taxonomy of movement regimes, lending interpretability to its otherwise opaque computations.
From a practical standpoint, these findings translate into concrete design guidance. A minimal sensor configuration comprising wrist and ankle accelerometers retains the bulk of discriminative information and may suffice for general-purpose activity monitoring under tight resource constraints. When the target activity set is known, the class-specific IG visualizations enable further pruning tailored to the application ankle-only for mobility monitoring, wrist-and-chest for upper-limb rehabilitation. At the same time, the gating role of the ankle magnetometer underscores that average importance scores can mask safety-critical dependencies; counterfactual testing remains essential before any sensor is removed in deployments where missing high-intensity activities carries serious consequences.
The broader methodological lesson is that no single XAI technique tells the whole story. Counterfactual ablation measures functional impact under complete sensor removal; Integrated Gradients quantify marginal contributions with fine temporal resolution; Shapley values provide a model-agnostic, game-theoretic cross-check. Their agreement strengthens confidence in the conclusions; their occasional divergence most notably the Ankle_MAG discrepancy reveals subtleties that any single method would miss. We commend this multi-lens philosophy to future work on explainable time-series modelling.
Several limitations temper these conclusions and point toward productive extensions. The analysis is confined to a single dataset with laboratory-collected data; validation on additional benchmarks and in-the-wild recordings is needed to assess generalizability. The TD–LSTM is one architecture among many, and the extent to which observed attribution patterns transfer to transformers or temporal convolutional networks remains open. The XAI computations rely on modest sample sizes; more exhaustive sampling and formal statistical testing would sharpen the reliability of importance rankings. Finally, our ablation experiments measure model dependence at test time rather than intrinsic task requirements; retraining after permanent sensor removal would provide complementary evidence.
Looking ahead, an intriguing direction is to feed explanations back into training regularizing the model toward biomechanically grounded attention, penalizing reliance on low-importance channels, or iteratively pruning and retraining in a closed loop. Such explanation-guided procedures could improve robustness, facilitate domain adaptation, and reduce the cost of deploying HAR systems in safety-critical environments.
In closing, this work demonstrates that accurate and interpretable activity recognition from multi-sensor wearables is achievable with current deep learning and XAI tools. The proposed framework offers a practical template for building transparent HAR systems whose sensor dependencies are understood, validated across multiple theoretical lenses, and aligned with domain knowledge qualities increasingly demanded in clinical, industrial, and everyday monitoring applications.
References
- Vijayvargiya, A.; Singh, P.; Kumar, R.; Dey, N. Hardware Implementation for Lower Limb Surface EMG Measurement and Analysis using Explainable AI for Activity Recognition. IEEE Transactions on Instrumentation and Measurement 2022, 71, 1–9.
- Chen, L.; Nugent, C.D.; Wang, H. A knowledge-driven approach to activity recognition in smart homes. IEEE Transactions on Knowledge and Data Engineering 2011, 24, 961–974.
- Zhang, S.; Li, Y.; Zhang, S.; Shahabi, F.; Xia, S.; Deng, Y.; Alshurafa, N. Deep Learning in Human Activity Recognition with Wearable Sensors: A Review on Advances. Sensors 2022, 22, 1476.
- Kwapisz, J.R.; Weiss, G.M.; Moore, S.A. Activity Recognition using Cell Phone Accelerometers. ACM SIGKDD Explorations Newsletter 2011, 12, 74–82.
- Yin, X.; Liu, Z.; Liu, D.; Ren, X. A Novel CNN-based Bi-LSTM Parallel Model with Attention Mechanism for Human Activity Recognition with Noisy Data. Scientific Reports 2022, 12, 7878.
- Khatun, M.A.; Yousuf, M.A.; Ahmed, S.; Uddin, M.Z.; Alyami, S.A.; Al-Ashhab, S.; Akhdar, H.F.; Khan, A.; Aziz, A.A.; Moni, M.A. Deep CNN-LSTM With Self-Attention Model for Human Activity Recognition Using Wearable Sensor. IEEE Journal of Translational Engineering in Health and Medicine 2022, 10, 1–16.
- Qi, W.; Lin, C.; Qian, K. Multimodel Lightweight Transformer Framework for Human Activity Recognition. In Proceedings of the 2024 46th Annual International Conference of the IEEE Engineering in Medicine and Biology Society (EMBC). IEEE, 2024, pp. 1–4.
- Liang, Q.; Jitpattanakul, A.; Mekruksavanich, S. Robust Human Activity Recognition Using a Transformer-Based Model for Aging Society. In Proceedings of the 2025 6th International Conference on Big Data Analytics and Practices (IBDAP). IEEE, 2025, pp. 272–277.
- Mennella, C.; Esposito, M.; De Pietro, G.; Maniscalco, U. Multiscale activity recognition algorithms to improve cross-subjects performance resilience in rehabilitation monitoring systems. Computer Methods and Programs in Biomedicine 2025, p. 108792.
- Khan, A.u.H.; Hussain, S.; Alromema, N.; Iqbal, S.; Mustafa, G.; Khattak, M.A.; Nasim, A.; Rizwan, A. An Explainable EEG-Based Human Activity Recognition Model Using Machine-Learning Approach and LIME. Sensors 2023, 23, 7452.
- Qureshi, T.S.; Shahid, M.H.; Farhan, A.A.; Alamri, S. A systematic literature review on human activity recognition using smart devices: advances, challenges, and future directions. Artificial Intelligence Review 2025, 58, 276.
- Huang, Y.; Zhou, Y.; Zhao, H.; Riedel, T.; Beigl, M. Explainable Deep Learning Framework for Human Activity Recognition. arXiv preprint arXiv:2408.11552 2024.
- Ribeiro, M.T.; Singh, S.; Guestrin, C. Why Should I Trust You? Explaining the Predictions of Any Classifier. In Proceedings of the Proceedings of the 22nd ACM SIGKDD International Conference on Knowledge Discovery and Data Mining. ACM, 2016, pp. 1135–1144.
- Lundberg, S.M.; Lee, S.I. A unified approach to interpreting model predictions. Advances in neural information processing systems 2017, 30.
- Sundararajan, M.; Taly, A.; Yan, Q. Axiomatic Attribution for Deep Networks. In Proceedings of the International Conference on Machine Learning. PMLR, 2017, pp. 3319–3328.
- Ma, H.; Li, W.; Zhang, X.; Gao, S.; Lu, S. AttnSense: Multi-level attention mechanism for multimodal human activity recognition. In Proceedings of the IJCAI, 2019, pp. 3109–3115.
- Wei, X.; Wang, Z. TCN-attention-HAR: Human Activity Recognition Based on Attention Mechanism Time Convolutional Network. Scientific Reports 2024, 14, 7414.
- Arrotta, L.; Barsocchi, P.; Calabrò, A.; Crivello, A.; La Morgia, M. Comparing LIME and SHAP Global Explanations for Human Activity Recognition. In Proceedings of the Springer Series in Bio-/Neuroinformatics. Springer, 2024, pp. 207–218.
- Banos, O.; Garcia, R.; Holgado-Terriza, J.A.; Damas, M.; Pomares, H.; Rojas, I.; Saez, A.; Villalonga, C. mHealthDroid: A Novel Framework for Agile Development of Mobile Health Applications. In Proceedings of the Ambient Assisted Living and Daily Activities; Pecchia, L.; Chen, L.L.; Nugent, C.; Bravo, J., Eds., Cham, 2014; pp. 91–98.
- Ullah, N.; Khan, J.A.; De Falco, I.; Sannino, G. Explainable artificial intelligence: importance, use domains, stages, output shapes, and challenges. ACM Computing Surveys 2024, 57, 1–36.
- Adesina, A.; Atoyeshe, A. MSANet: A Hybrid Deep Learning Framework with Self-Attention for Human Activity Recognition. Available at SSRN 5573238 2025.
- Cleland, I.; Nugent, L.; Cruciani, F.; Nugent, C. Leveraging large language models for activity recognition in smart environments. In Proceedings of the 2024 International Conference on Activity and Behavior Computing (ABC). IEEE, 2024, pp. 1–8.
- Sundararajan, M.; Taly, A.; Yan, Q. Axiomatic attribution for deep networks. In Proceedings of the International conference on machine learning. PMLR, 2017, pp. 3319–3328.
- Mekruksavanich, S.; Jitpattanakul, A. Efficient and Explainable Human Activity Recognition Using Deep Residual Network with Squeeze-and-Excitation Mechanism. Applied System Innovation 2025, 8, 57.
- Tempel, F.; Ihlen, E.A.F.; Adde, L.; Strümke, I. Explaining Human Activity Recognition with SHAP: Validating insights with perturbation and quantitative measures. Computers in Biology and Medicine 2025, 188, 109838.
- Ullah, N.; Guzmán-Aroca, F.; Martínez-Álvarez, F.; De Falco, I.; Sannino, G. A novel explainable AI framework for medical image classification integrating statistical, visual, and rule-based methods. Medical Image Analysis 2025, p. 103665.
- Ullah, N.; Hassan, M.; Khan, J.A.; Anwar, M.S.; Aurangzeb, K. Enhancing explainability in brain tumor detection: A novel DeepEBTDNet model with LIME on MRI images. International Journal of Imaging Systems and Technology 2024, 34, e23012.
- Ullah, N.; Khan, J.A.; De Falco, I.; Sannino, G. Bridging clinical gaps: multi-dataset integration for reliable multi-class lung disease classification with deepcrinet and occlusion sensitivity. In Proceedings of the 2024 IEEE Symposium on Computers and Communications (ISCC). IEEE, 2024, pp. 1–6.
- Abdelaal, Y.; Aupetit, M.; Baggag, A.; Al-Thani, D. Exploring the Applications of Explainability in Wearable Data Analytics: Systematic Literature Review. Journal of Medical Internet Research 2024, 26, e53863.
- Mankodiya, H.; Jadav, D.; Gupta, R.; Tanwar, S.; Alharbi, A.; Tolba, A.; et al. XAI-Fall: Explainable AI for fall detection on wearable devices using sequence models and XAI techniques. Mathematics 2022, 10, 1990.
- Tzanetis, G.; Toumpas, A.; Vasileiou, Z.; Meditskos, G.; Vrochidis, S.; Kompatsiaris, I. Enhancing Health Risk Monitoring: An Explainable Human-Centric Approach Using Wearable Data and Sensor Integration. In Proceedings of the International Conference on Pattern Recognition. Springer, 2024, pp. 407–419.
- Troncoso, Á.; Ortega, J.A.; Seepold, R.; Madrid, N.M. Non-invasive devices for respiratory sound monitoring. Procedia Computer Science 2021, 192, 3040–3048.
- Troncoso-García, A.R.; Martínez-Ballesteros, M.; Martínez-Álvarez, F.; Troncoso, A. Explainable machine learning for sleep apnea prediction. Procedia Computer Science 2022, 207, 2930–2939.
- Fiori, M.; Mor, D.; Civitarese, G.; Bettini, C. GNN-XAR: A Graph Neural Network for Explainable Activity Recognition in Smart Homes. arXiv preprint arXiv:2502.17999 2025.
- Harris, C.R.; Rouse, E.J.; Prost, L.E.; Kilgas, M.A.; Nakamura-Pereira, M.; Macaluso, R.L.; Gregg, R.D. Ablation Analysis to Select Wearable Sensors for Classifying Standing, Walking, and Running. Sensors 2021, 21, 194.
- Ronao, C.A.; Cho, S.B. Human Activity Recognition with Smartphone Sensors using Deep Learning Neural Networks. Expert Systems with Applications 2016, 59, 235–244.
- Borella, E.; Çakmakçı, U.B.; Gottardis, E.; Buratto, A.; Marchioro, T.; Badia, L. Effective Sensor Selection for Human Activity Recognition via Shapley Value. In Proceedings of the 2024 IEEE International Workshop on Metrology for Living Environment. IEEE, 2024, pp. 22–27.
- Pellano, K.N.; Strümke, I.; Ihlen, E.A.F. From Movements to Metrics: Evaluating Explainable AI Methods in Skeleton-Based Human Activity Recognition. Sensors 2024, 24, 1940.
- Jeyakumar, J.V.; Sarker, A.; Garcia, L.A.; Srivastava, M. X-CHAR: A Concept-based Explainable Complex Human Activity Recognition Model. Proceedings of the ACM on Interactive, Mobile, Wearable and Ubiquitous Technologies 2023, 7, 1–28.
- Wang, H.; Zhao, J.; Li, J.; Tian, L.; Tu, P.; Cao, T.; An, Y.; Wang, K.; Li, S. Human Activity Recognition using Wearable Sensors by Heterogeneous Convolutional Neural Networks. Engineering Applications of Artificial Intelligence 2022, 112, 104867.
- El-Adawi, E.; Essa, E.; Handosa, M.; Fahmy, D.; Attallah, O. Wireless Body Area Sensor Networks based Human Activity Recognition using Deep Learning. Scientific Reports 2024, 14, 2702.
- Kim, K.; Jeong, W.; Park, S.; Kim, H. Granular and Explainable Human Activity Recognition through Sound Segmentation and Deep Learning. Journal of Computational Design and Engineering 2025, 12, 252–268.
- Arrotta, L.; Civitarese, G.; Bettini, C. Using Large Language Models to Compare Explainable Models for Smart Home Human Activity Recognition. In Proceedings of the Companion of the 2024 ACM International Joint Conference on Pervasive and Ubiquitous Computing. ACM, 2024, pp. 704–709.
- Bulling, A.; Blanke, U.; Schiele, B. A tutorial on human activity recognition using body-worn inertial sensors. ACM Computing Surveys (CSUR) 2014, 46, 1–33.
- Ordóñez, F.J.; Roggen, D. Deep convolutional and lstm recurrent neural networks for multimodal wearable activity recognition. Sensors 2016, 16, 115.
- Jeyakumar, J.V.; Sarker, A.; Garcia, L.A.; Srivastava, M. X-char: A concept-based explainable complex human activity recognition model. Proceedings of the ACM on interactive, mobile, wearable and ubiquitous technologies 2023, 7, 1–28.
- Ellis, C.A.; Sendi, M.S.; Zhang, R.; Carbajal, D.A.; Wang, M.D.; Miller, R.L.; Calhoun, V.D. Novel methods for elucidating modality importance in multimodal electrophysiology classifiers. Frontiers in Neuroinformatics 2023, 17, 1123376.
- Strumbelj, E.; Kononenko, I. An efficient explanation of individual classifications using game theory. The Journal of Machine Learning Research 2010, 11, 1–18.
Figure 1.
Overview of the proposed explainability pipeline. Raw MHEALTH signals are segmented into fixed-length windows and processed by a TD–LSTM classifier. Four complementary XAI modules operate on the trained model: (i) counterfactual sensor-group ablation to quantify causal impact, (ii) per-class Integrated Gradients heatmaps and temporal attribution curves, (iii) global IG-based sensor-group ranking, and (iv) Shapley Value Sampling for model-agnostic validation. All attributions are aggregated at the sensor-group level, linking explanations directly to hardware components.
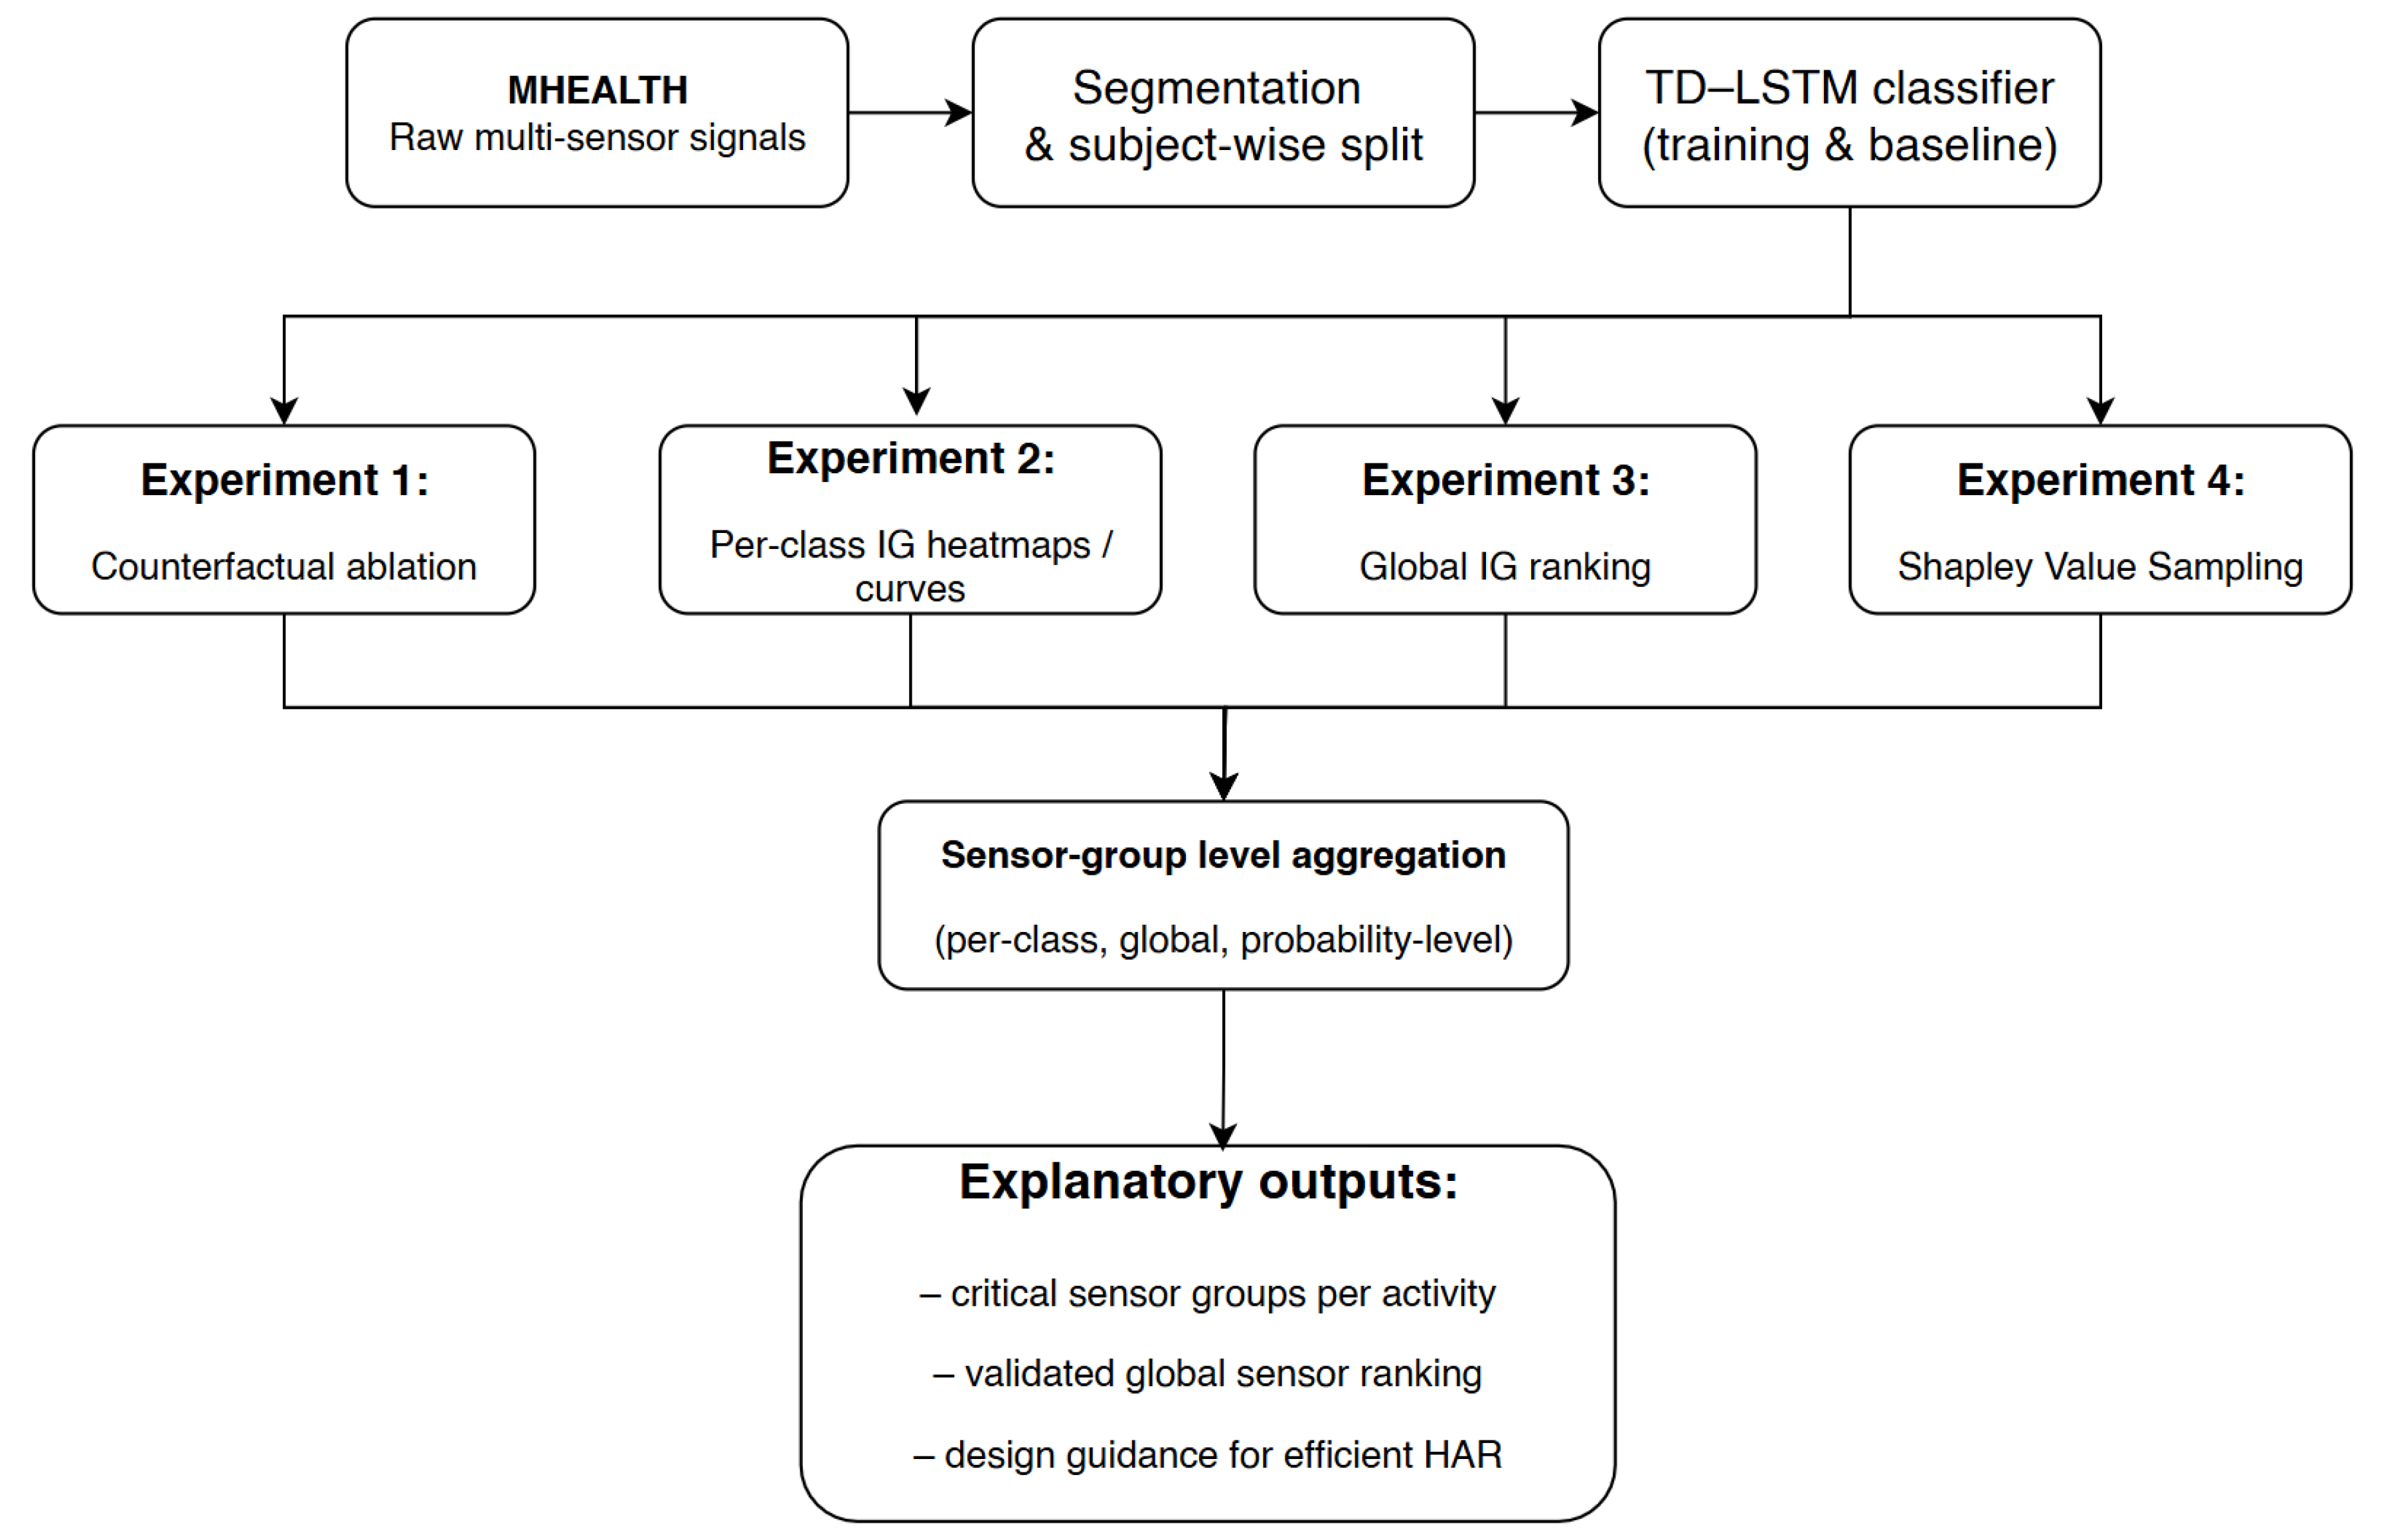
Figure 2.
Normalized confusion matrix of the baseline TD–LSTM model on the MHEALTH test set.
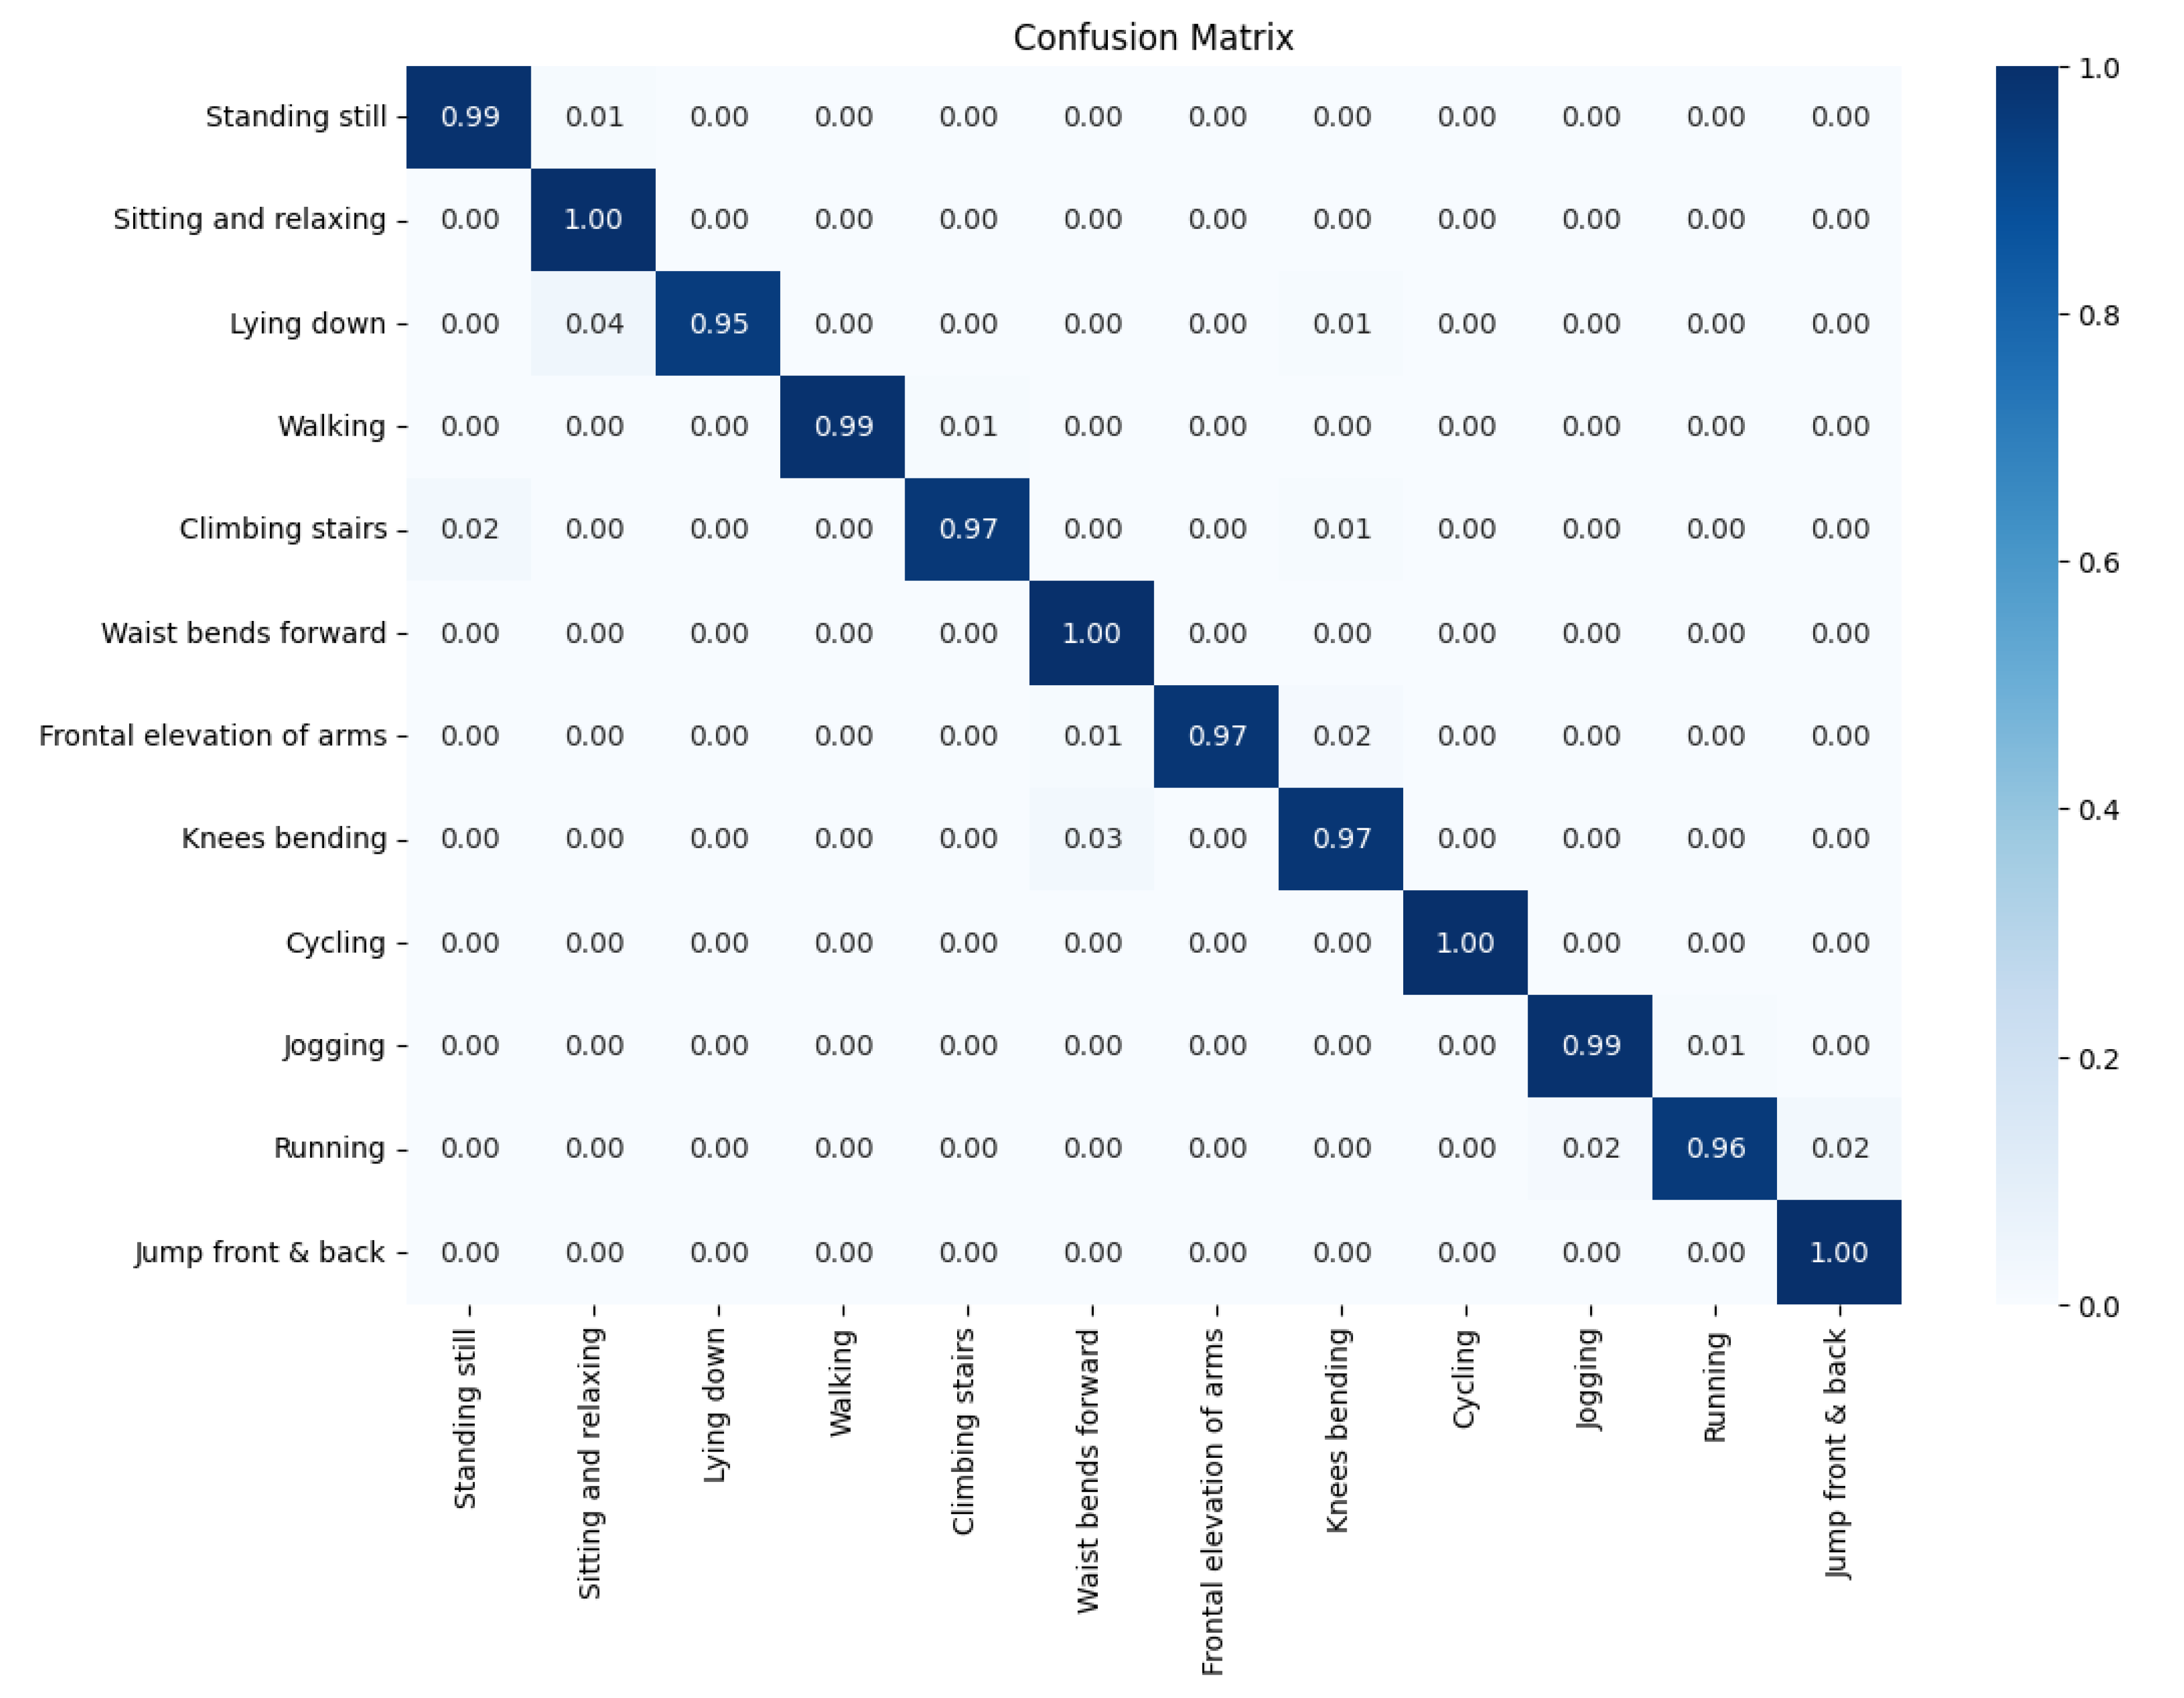
Figure 3.
Class-specific Integrated Gradients heatmaps for all twelve MHEALTH activities. Each panel visualizes the mean absolute attribution across time (horizontal axis) and sensor channels (vertical axis).
Figure 3.
Class-specific Integrated Gradients heatmaps for all twelve MHEALTH activities. Each panel visualizes the mean absolute attribution across time (horizontal axis) and sensor channels (vertical axis).
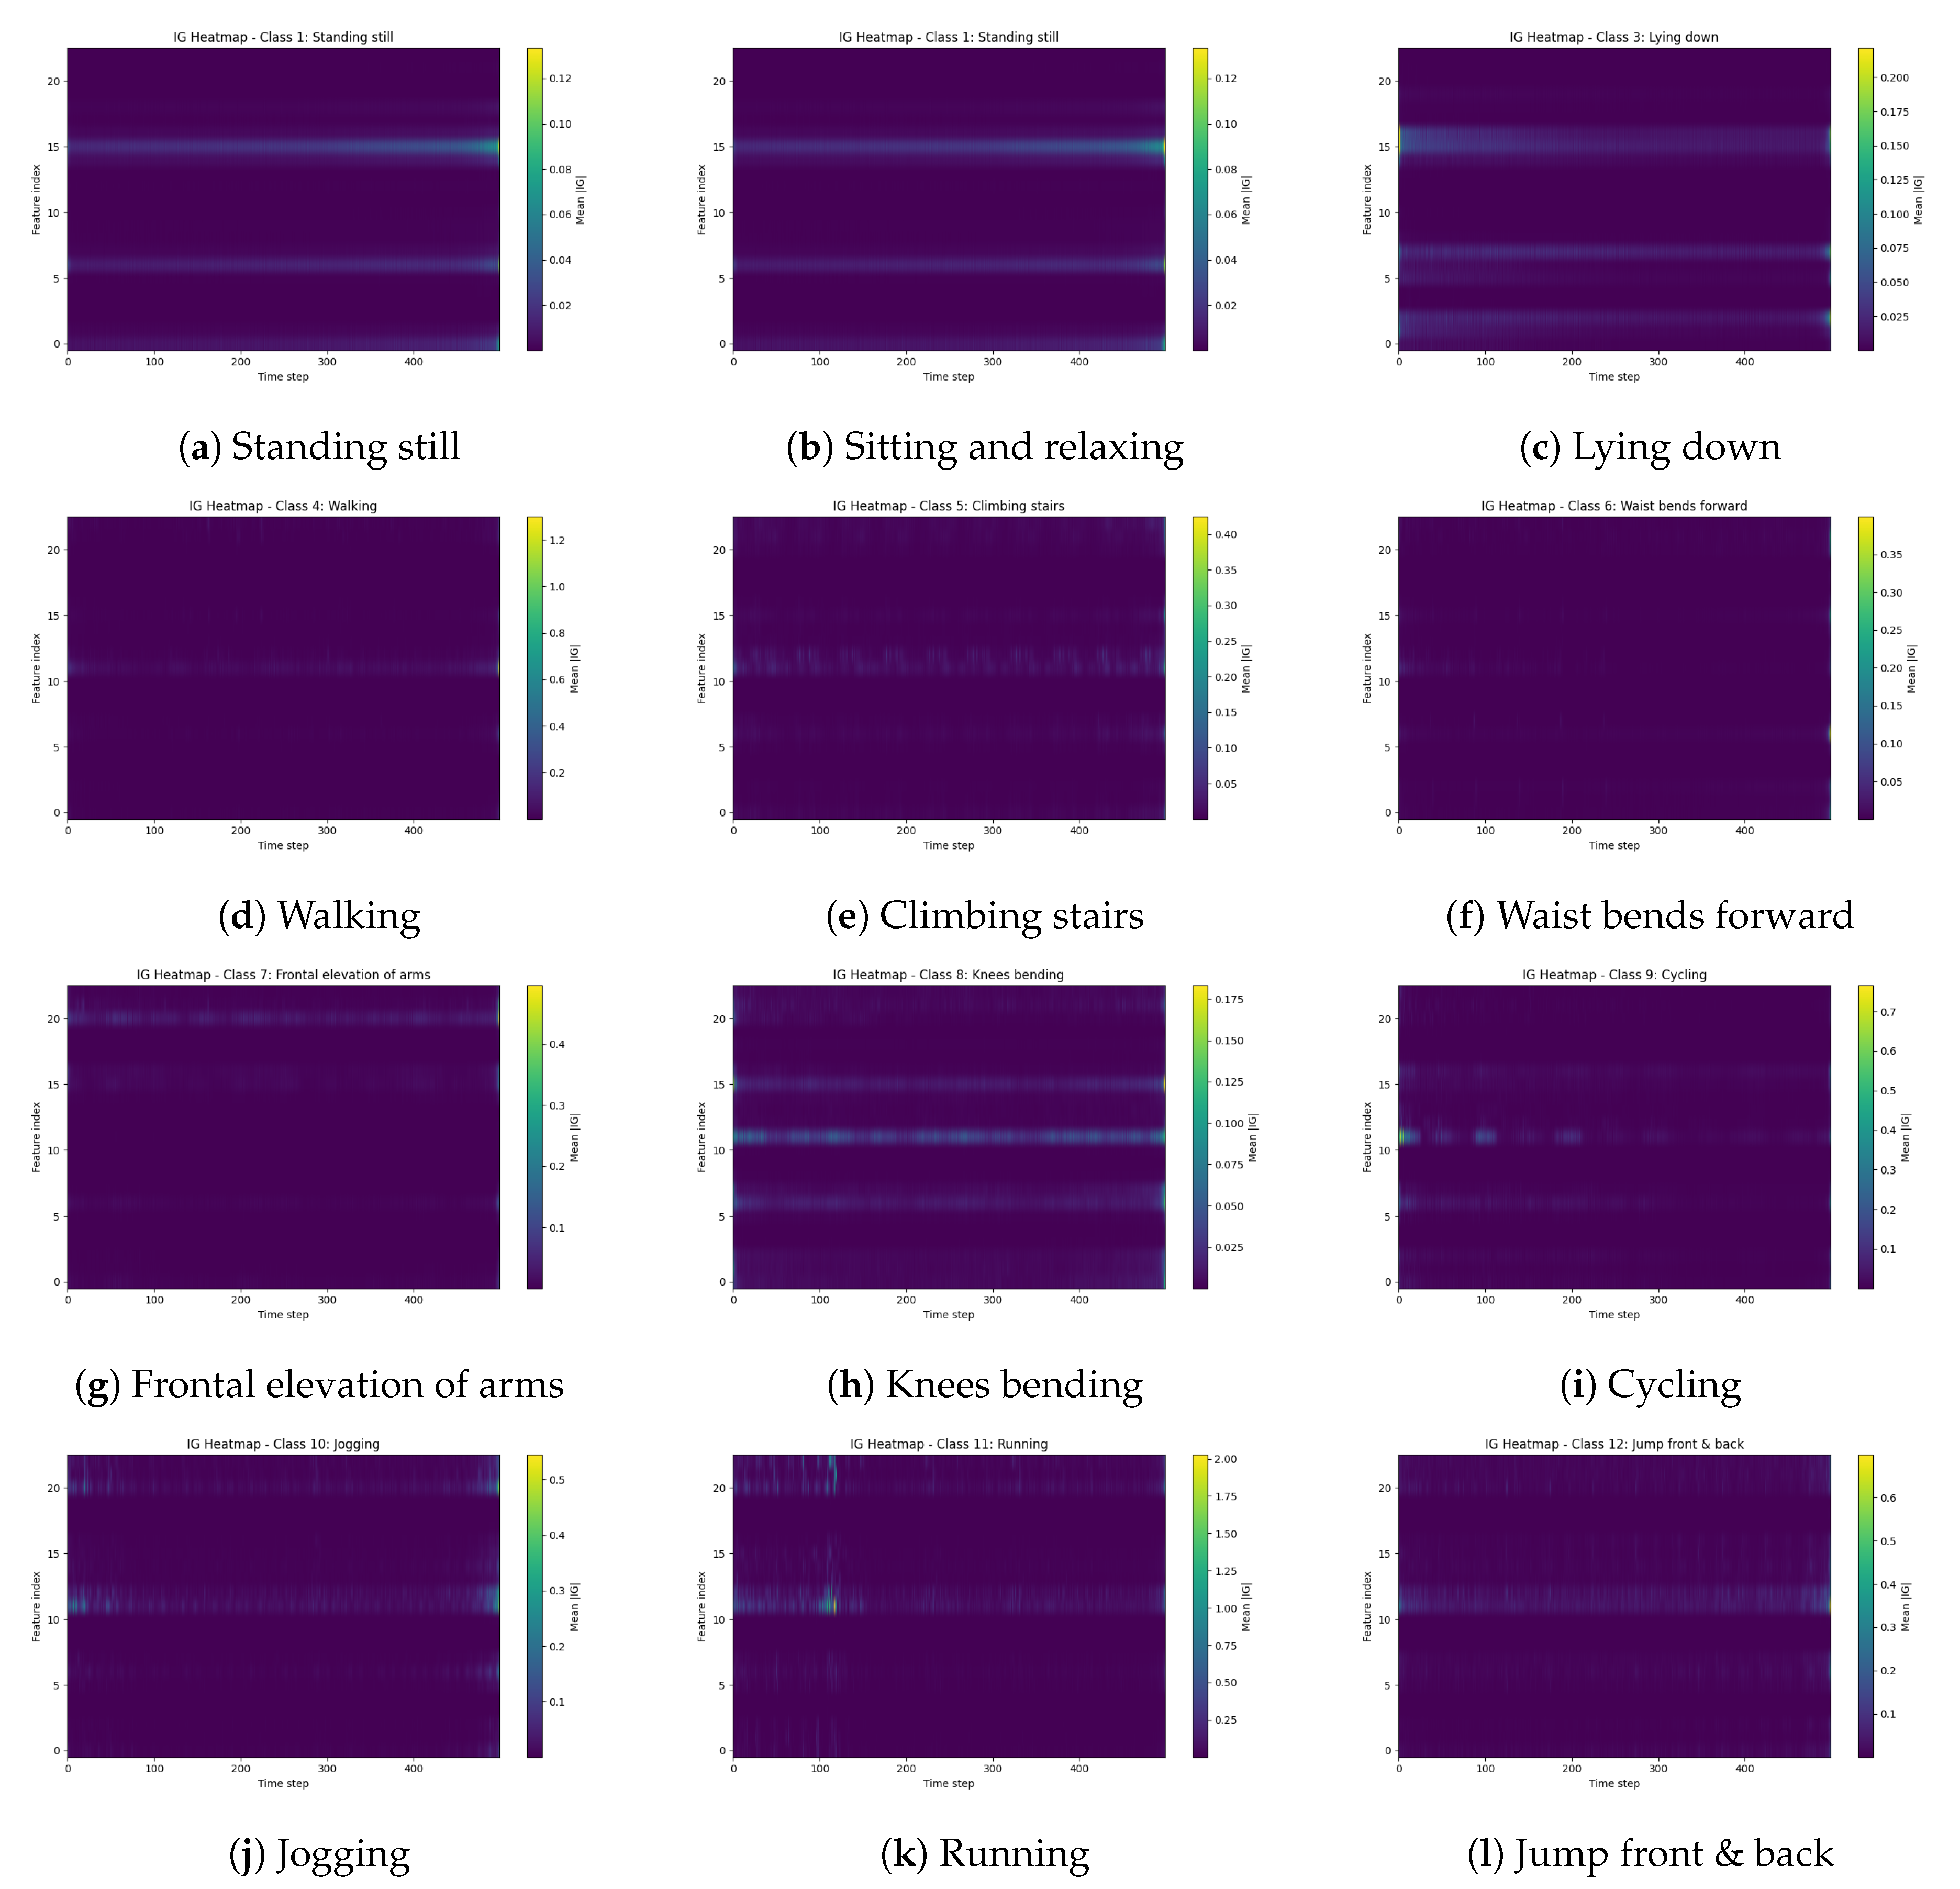
Figure 4.
Temporal Integrated Gradients attribution curves aggregated by sensor group for all twelve MHEALTH activities. Each panel shows the mean absolute IG attribution over time for the eight sensor groups.
Figure 4.
Temporal Integrated Gradients attribution curves aggregated by sensor group for all twelve MHEALTH activities. Each panel shows the mean absolute IG attribution over time for the eight sensor groups.
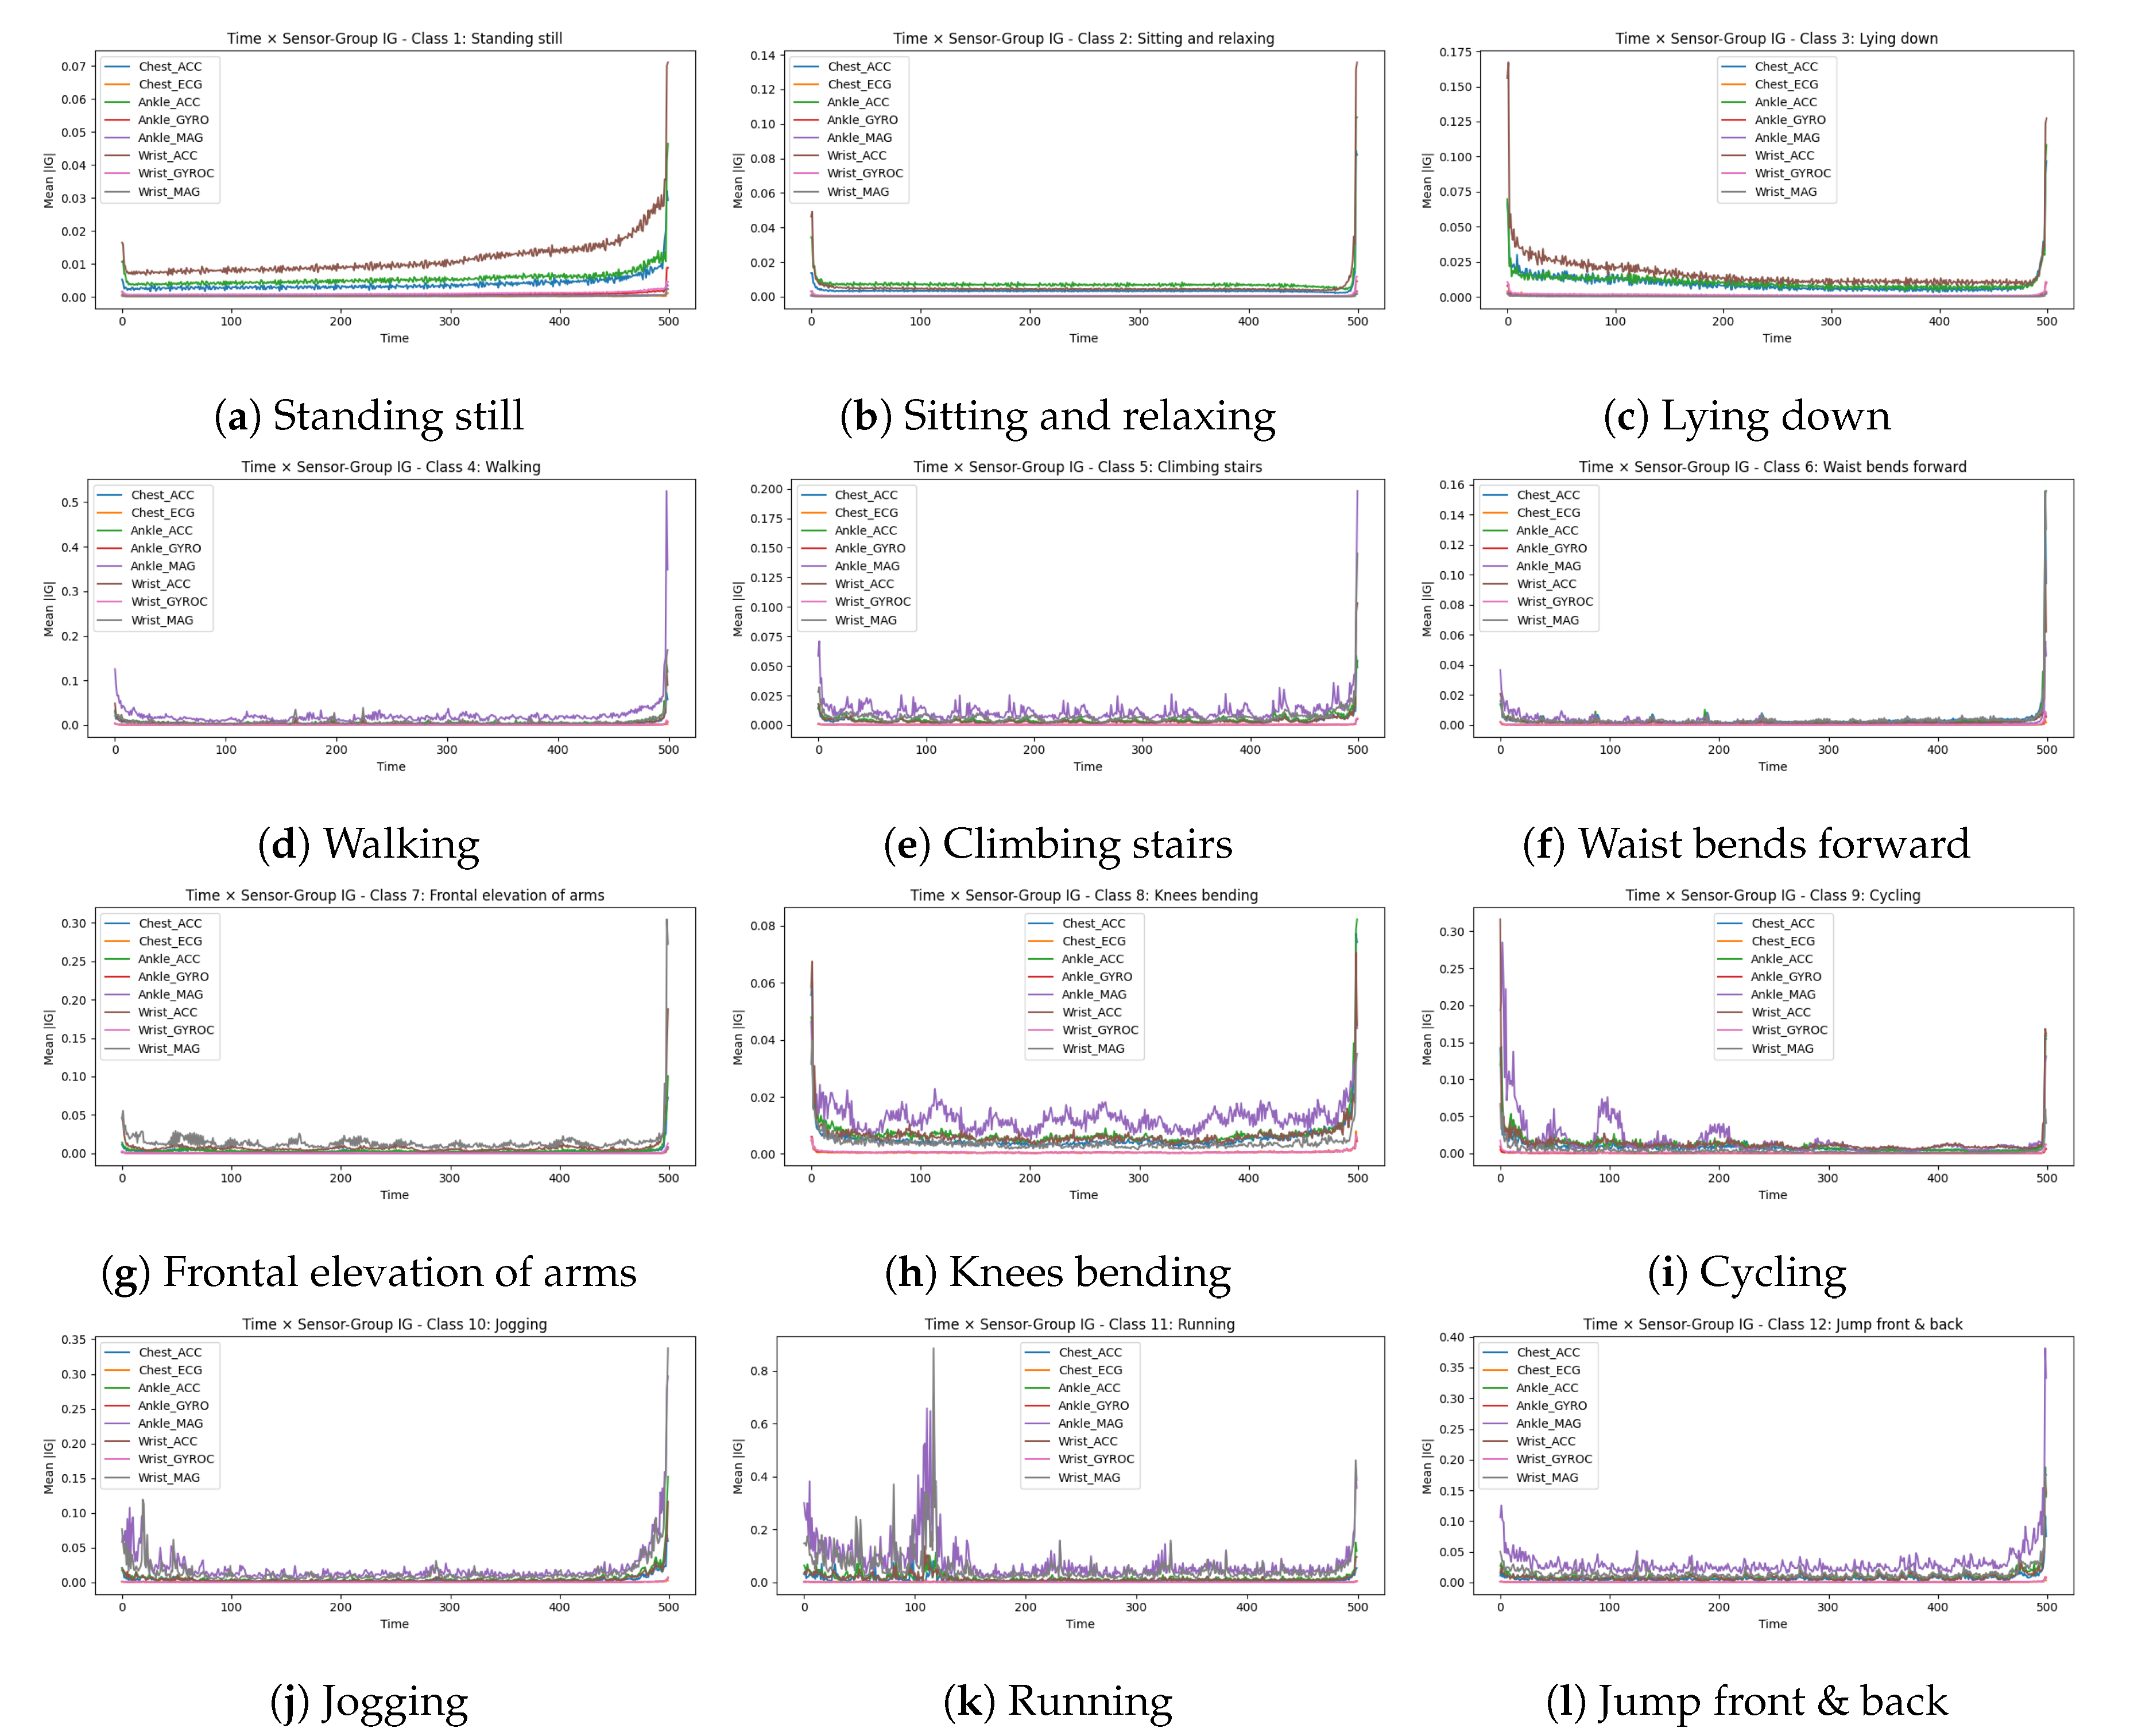
Figure 5.
Global sensor-group importance obtained via Shapley Value Sampling. Bars show mean absolute Shapley values aggregated over 32 test windows and 20 permutations per feature. Accelerometers dominate; magnetometers and ECG contribute comparatively little.
Figure 5.
Global sensor-group importance obtained via Shapley Value Sampling. Bars show mean absolute Shapley values aggregated over 32 test windows and 20 permutations per feature. Accelerometers dominate; magnetometers and ECG contribute comparatively little.
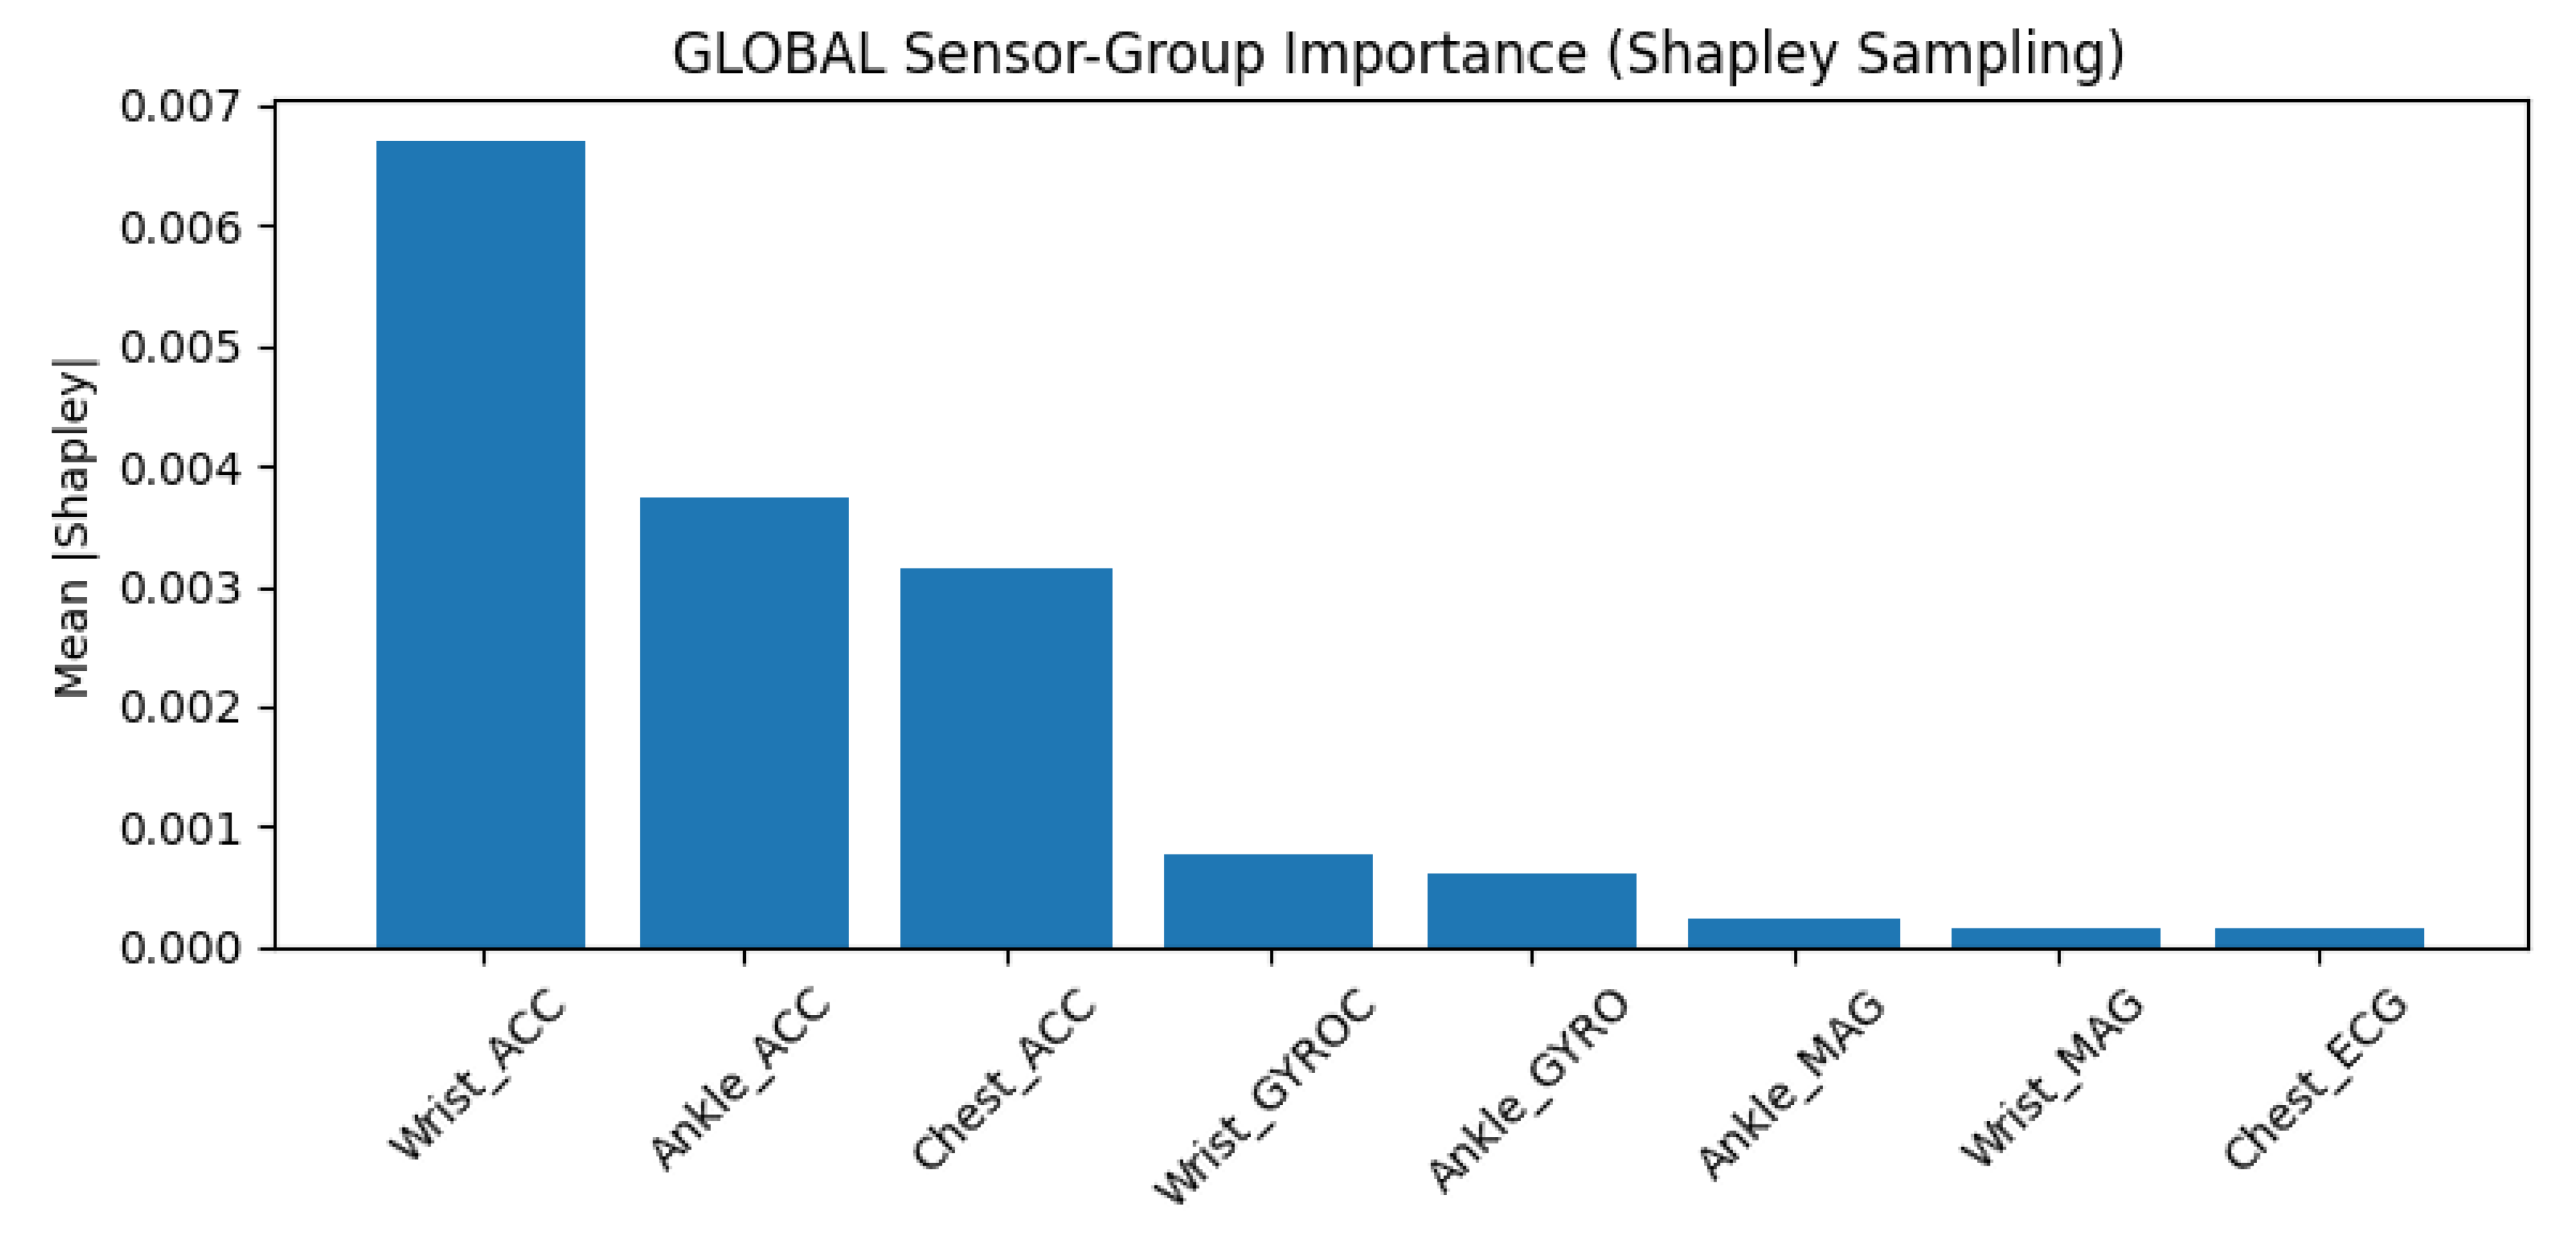

Table 1.
Comparison of Explainability Methods in Sensor-Based HAR.
| Study | XAI Method(s) | Model | Dataset | Sensor Types | Classes | Analysis Level | Ablation | Per-Class |
|---|---|---|---|---|---|---|---|---|
| Harris et al. [35] | PCA + Ablation | SVM | Custom | IMU, sEMG | 4 | Sensor placement | ✗ | |
| Ronao & Cho [36] | None | CNN | WISDM | ACC | 6 | - | ✗ | ✗ |
| Yin et al. [5] | Attention weights | CNN-BiLSTM | UCI-HAR | ACC, GYRO | 6 | Feature-level | ✗ | ✗ |
| Khatun et al. [6] | Self-attention | CNN-LSTM | MHEALTH, UCI-HAR | ACC, GYRO, MAG | 12, 6 | Feature-level | ✗ | ✗ |
| Khan et al. [10] | LIME | Random Forest | Custom EEG | EEG | 4 | Feature-level | ✗ | ✗ |
| Arrotta et al. [18] | LIME, SHAP | Various ML | KU-HAR, PAMAP2 | ACC, GYRO | 18, 12 | Feature-level | ✗ | |
| Borella et al. [37] | SHAP | Ensemble | Custom IMU | IMU (5 locations) | Material handling | Sensor-level | ✗ | ✗ |
| Pellano et al. [38] | CAM, Grad-CAM | EfficientGCN | NTU-RGB+D | Skeleton | 60 | Spatial-temporal | ✗ | |
| Jeyakumar et al. [39] | Concept Bottleneck | CNN-LSTM | Custom | ACC, GYRO | 12 complex | Concept-level | ✗ | |
| Wang et al. [40] | Ablation study | Het-CNN | OPPORTUNITY, PAMAP2 | Multi-sensor | 18, 12 | Architecture | ✗ | |
| El-Adawi et al. [41] | None | DenseNet+GAF | MHEALTH | ACC, GYRO, MAG | 12 | - | ✗ | ✗ |
| Wei & Wang [17] | Attention weights | TCN-Attention | Custom | ACC, GYRO | 6 | Temporal | ✗ | ✗ |
| Vijayvargiya et al. [1] | LIME | LSTM | Custom sEMG | sEMG | Lower limb acts | Feature-level | ✗ | ✗ |
| Kim et al. [42] | Grad-CAM | CNN | Custom audio | Audio | 7 daily sounds | Spectrogram | ✗ | |
| Arrotta et al. [43] | LIME, LLM eval | Various | CASAS | Smart home | 10 | Event-level | ✗ | ✗ |
| Our Work | Ablation, IG, SHAP | TD-LSTM | MHEALTH | ACC, ECG, GYRO, MAG | 12 | Multi-level | ||
| + Counterfactual | + MaxPool | (8 sensor groups) | (Global, per-class, | |||||
| probability-level) |
XAI Method(s): Primary explainability techniques employed. Analysis Level: Granularity of explanations (feature, sensor, concept, etc.). Ablation: Systematic feature/sensor removal study. Per-Class: Class-specific explanation analysis. ACC: Accelerometer, GYRO: Gyroscope, MAG: Magnetometer, IMU: Inertial Measurement Unit, sEMG: Surface Electromyography. TD-LSTM: Time-Distributed LSTM. IG: Integrated Gradients.
Table 2.
Experimental setup and hyperparameters.
| Parameter | Value |
|---|---|
| Data Configuration | |
| Window size (T) | 500 samples (10 s) |
| Stride | 50 samples (1 s) |
| Overlap | 90% |
| Training subjects | 1–8 |
| Test subjects | 9, 10 |
| Input channels (F) | 23 |
| Number of classes | 12 |
| Preprocessing | |
| Normalization | Z-score (per-channel) |
| Data augmentation | None |
| Model Architecture | |
| Time-distributed dense 1 | 128 units, ReLU, BatchNorm |
| Time-distributed dense 2 | 128 units, ReLU, BatchNorm |
| Temporal pooling | Max-pooling |
| LSTM hidden units | 256 |
| Output layer | Dense, softmax (12 classes) |
| Training Configuration | |
| Optimizer | Adam |
| Learning rate | |
| Batch size | 32 |
| Maximum epochs | 100 |
| Early stopping patience | 15 epochs |
| Loss function | Cross-entropy |
| Weight decay | |
| Random seed | 42 |
| XAI Configuration | |
| IG integration steps | 50 |
| IG samples per class | 32 |
| Shapley permutations | 20 |
| Shapley test samples | 32 |
Table 3.
Sensor group definitions. Channel indices refer to the 23-dimensional input feature vector.
Table 3.
Sensor group definitions. Channel indices refer to the 23-dimensional input feature vector.
| Sensor Group | Description | Channel Indices |
|---|---|---|
| Chest_ACC | Chest accelerometer (3-axis) | 0, 1, 2 |
| Chest_ECG | Chest ECG (2-lead) | 3, 4 |
| Ankle_ACC | Ankle accelerometer (3-axis) | 5, 6, 7 |
| Ankle_GYRO | Ankle gyroscope (3-axis) | 8, 9, 10 |
| Ankle_MAG | Ankle magnetometer (3-axis) | 11, 12, 13 |
| Wrist_ACC | Wrist accelerometer (3-axis) | 14, 15, 16 |
| Wrist_GYRO | Wrist gyroscope (3-axis) | 17, 18, 19 |
| Wrist_MAG | Wrist magnetometer (3-axis) | 20, 21, 22 |
Table 4.
Baseline classification report of the TD–LSTM model on MHEALTH.
| Class | Precision | Recall | F1-score | Support |
|---|---|---|---|---|
| Standing still | 0.97 | 0.99 | 0.98 | 118 |
| Sitting and relaxing | 0.95 | 1.00 | 0.98 | 123 |
| Lying down | 1.00 | 0.95 | 0.97 | 123 |
| Walking | 1.00 | 0.99 | 1.00 | 123 |
| Climbing stairs | 0.99 | 0.97 | 0.98 | 123 |
| Waist bends forward | 0.96 | 1.00 | 0.98 | 107 |
| Frontal elevation of arms | 1.00 | 0.97 | 0.99 | 112 |
| Knees bending | 0.97 | 0.97 | 0.97 | 117 |
| Cycling | 1.00 | 1.00 | 1.00 | 123 |
| Jogging | 0.98 | 0.99 | 0.99 | 122 |
| Running | 0.99 | 0.96 | 0.98 | 124 |
| Jump front & back | 0.92 | 1.00 | 0.96 | 36 |
| Accuracy | 0.98 | 1351 | ||
| Macro avg | 0.98 | 0.98 | 0.98 | 1351 |
| Weighted avg | 0.98 | 0.98 | 0.98 | 1351 |
Table 5.
Global accuracy and macro-F1 under single sensor-group ablation on the MHEALTH test set. Baseline: accuracy , macro-F1 . . denotes the mean confidence drop across all classes.
Table 5.
Global accuracy and macro-F1 under single sensor-group ablation on the MHEALTH test set. Baseline: accuracy , macro-F1 . . denotes the mean confidence drop across all classes.
| Sensor group | Abl. Acc | Abl. F1 | ||
|---|---|---|---|---|
| Ankle_MAG | 0.511 | 0.471 | 0.42 | 0.50 |
| Wrist_ACC | 0.824 | 0.158 | 0.81 | 0.28 |
| Ankle_ACC | 0.830 | 0.152 | 0.82 | 0.25 |
| Wrist_MAG | 0.877 | 0.105 | 0.86 | 0.18 |
| Chest_ACC | 0.881 | 0.101 | 0.87 | 0.22 |
| Wrist_GYRO | 0.945 | 0.038 | 0.94 | 0.08 |
| Chest_ECG | 0.982 | 0.000 | 0.98 | 0.00 |
| Ankle_GYRO | 0.984 | 0.98 |
Table 6.
Global Integrated Gradients ranking across sensor groups. denotes the mean absolute IG attribution aggregated over samples, time, and channels; %Total is the relative contribution to the sum over groups.
Table 6.
Global Integrated Gradients ranking across sensor groups. denotes the mean absolute IG attribution aggregated over samples, time, and channels; %Total is the relative contribution to the sum over groups.
| Sensor group | % Total | |
|---|---|---|
| Wrist_ACC | 2.07 | 48.6 |
| Chest_ACC | 0.95 | 22.2 |
| Ankle_ACC | 0.78 | 18.2 |
| Ankle_GYRO | 0.18 | 4.3 |
| Wrist_GYRO | 0.15 | 3.6 |
| Ankle_MAG | 0.06 | 1.4 |
| Wrist_MAG | 0.05 | 1.1 |
| Chest_ECG | 0.03 | 0.6 |
Disclaimer/Publisher’s Note: The statements, opinions and data contained in all publications are solely those of the individual author(s) and contributor(s) and not of MDPI and/or the editor(s). MDPI and/or the editor(s) disclaim responsibility for any injury to people or property resulting from any ideas, methods, instructions or products referred to in the content. |
© 2026 by the authors. Licensee MDPI, Basel, Switzerland. This article is an open access article distributed under the terms and conditions of the Creative Commons Attribution (CC BY) license (http://creativecommons.org/licenses/by/4.0/).
Copyright: This open access article is published under a Creative Commons CC BY 4.0 license, which permit the free download, distribution, and reuse, provided that the author and preprint are cited in any reuse.


