Preprint
Article

This version is not peer-reviewed.

The Number and Habitat Use of Mesopredators Based on the Camera Trapping and Location of Burrows in Hungary

Submitted:

24 December 2025

Posted:

25 December 2025

You are already at the latest version

Abstract

The increasing population of mesopredators in Central Europe necessitates precise monitoring for effective game management. This study aimed to estimate the minimum population and reproduction of the European badger (Meles meles), red fox (Vulpes vulpes), and golden jackal (Canis aureus) in two hunting grounds in southwestern Hungary (Drávaszentes and Darány). Methods included a total burrow count conducted in early 2025, followed by the deployment of wildlife cameras at inhabited setts to record adults and cubs. Results indicated an inhabited burrow density of 1.05/100 ha for badgers and 0.38/100 ha for foxes in Drávaszentes, with average litter sizes of 1.13 and 2.33 cubs, respectively. In Darány, badger density was 1.43/100 ha, while jackals were present at 0.2/100 ha. Additionally, habitat composition preference was analyzed using QGIS by comparing Corine Land Cover categories within 400 m buffers around burrows against random points. Habitat analysis suggested local preferences for non-irrigated arable land and mixed forests. These findings provide essential baseline data on predator population dynamics to support conscious management decisions.

Keywords: 
;  ;  ;  ;  ;  ;  ;  ;  

1. Introduction

In habitats where apex predators have been suppressed, mesopredators are receiving increasing attention. In such cases, food chains are shortened and mesopredators often move up to higher levels of the food chain [1,2]. Therefore, the study of mesopredators becomes important for understanding ecosystems [3]. According to the mesopredator release theory, as the population of medium-sized predators increases, so does the predation pressure on prey species. This top-down effect can also cause changes in biodiversity [1]. From the perspective of certain economic sectors (nature conservation, game management), mesopredators also have an economic impact, which manifests itself in several ways. One example is the direct destruction of individuals of species under nature conservation protection as well as small game species. In addition, predator control can also entail significant costs.
In a significant part of Central Europe, including Hungary, the red fox (Vulpes vulpes), Eurasian badger (Meles meles), and golden jackal (Canis aureus) are considered widespread species of mesopredators. The red fox (Vulpes vulpes) was the predator with the largest number of individuals in Hungary in the 2000s and 2010s [4]. In addition, the European badger (Meles meles) was added to the list of huntable species in 2001 due to its nationwide distribution [5,6,7]. In the 1980s, Hungary was one of the first countries where the golden jackal (Canis aureus) reappeared in Europe [8]. As no breeding individuals of the species were recorded between 1940 and 1990, the species was declared extinct in 1989 [9]. In the early 1990s, the species began to return, and its population grew so rapidly that it became a huntable species in 1994, as a species that could be hunted throughout the year until 1999 and again from 2012 onwards. In between this period, the hunting season was from 1st of July to the end of [10,11]. In addition to the above-mentioned effects of mesopredators, foxes and badgers are known to spread diseases that pose a risk to animal and human health [12]. Overall, these factors make it important to manage predators in a conscious manner based on measured data. For this reason, understanding the population dynamics and habitat selection of predators is necessary [13,14]. Foxes and badgers are species that use burrows. Therefore, one of the key elements to know the location of these underground shelters. The results of population estimations based on burrows can be biased by several behavioral factors. For example, badgers can live either alone or in clans [15]. On the other hand, foxes may use several burrows during a given period, which can lead to an overestimation of population size [16]. It is also possible that individuals of both species share the same burrows or that certain entrances are only used seasonally [17]. Due to these factors, it is important to observe the burrows found and integrate the data collected into predator management.
Based on the above, our study aimed to was to use wildlife cameras to estimate the minimum number of foxes, badgers and jackals per burrow. We conducted our studies in two differently managed (nature conservation, wildlife management) hunting areas in southwestern Hungary.

2. Materials and Methods

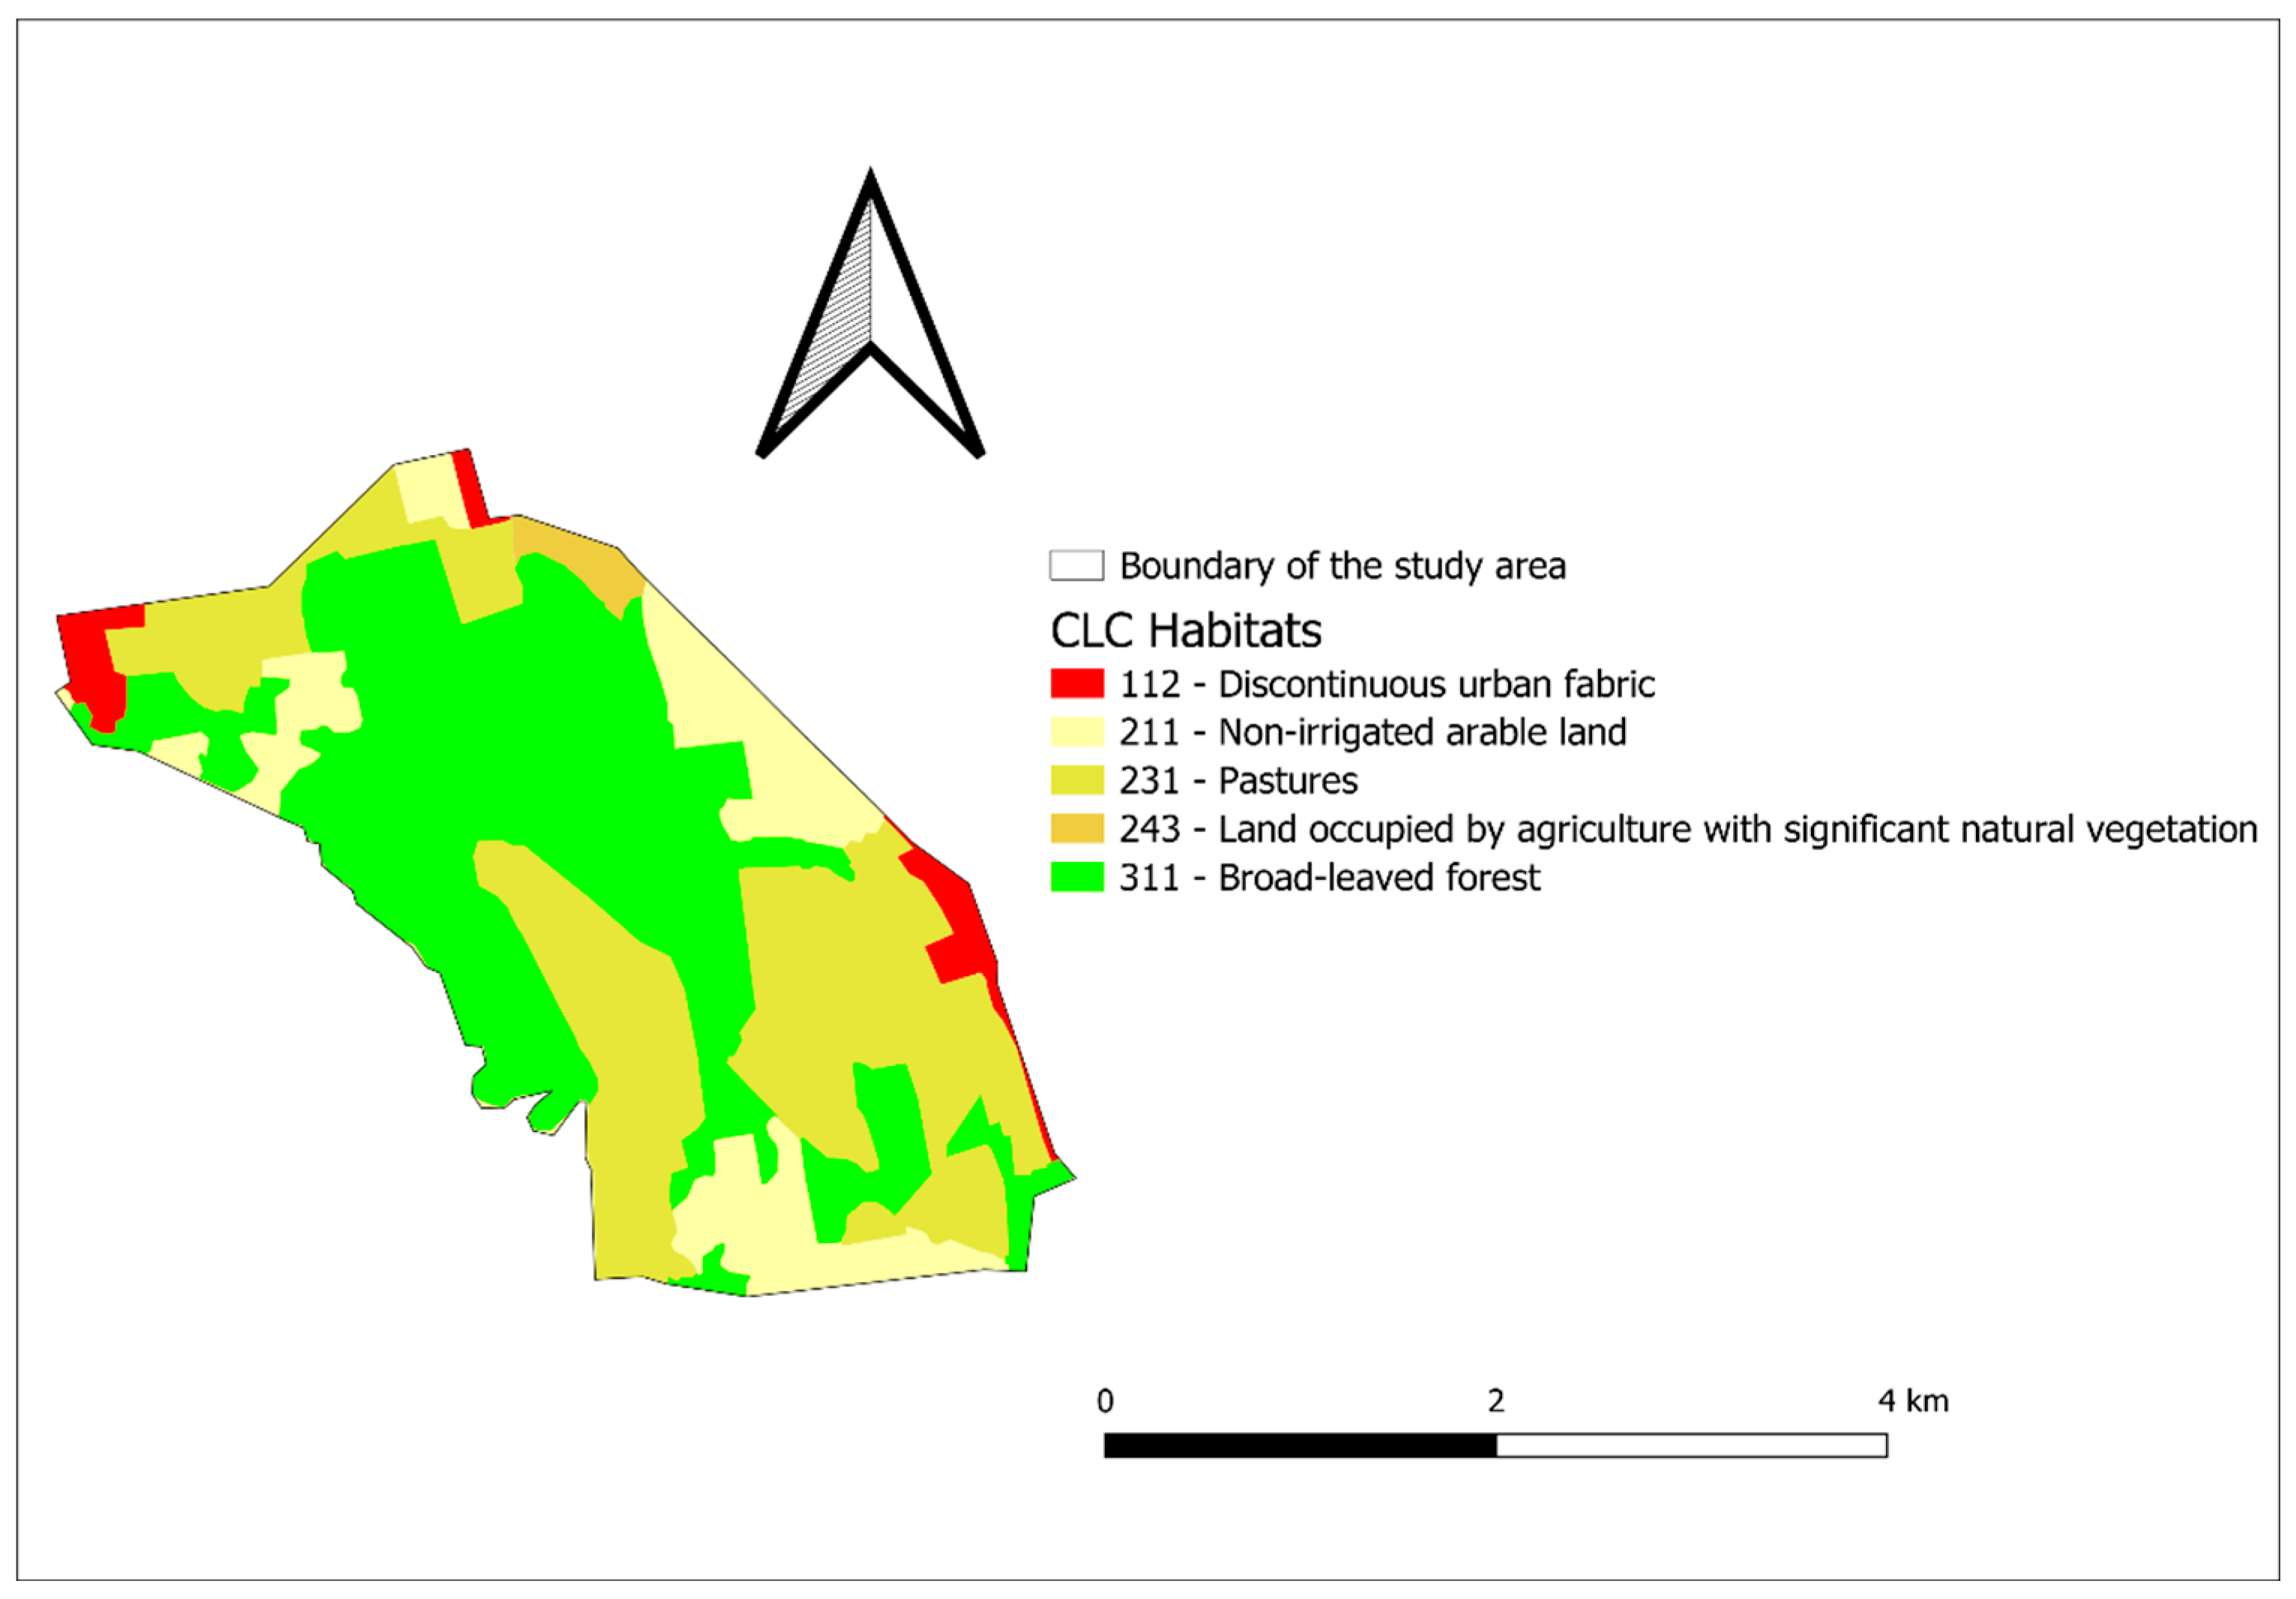
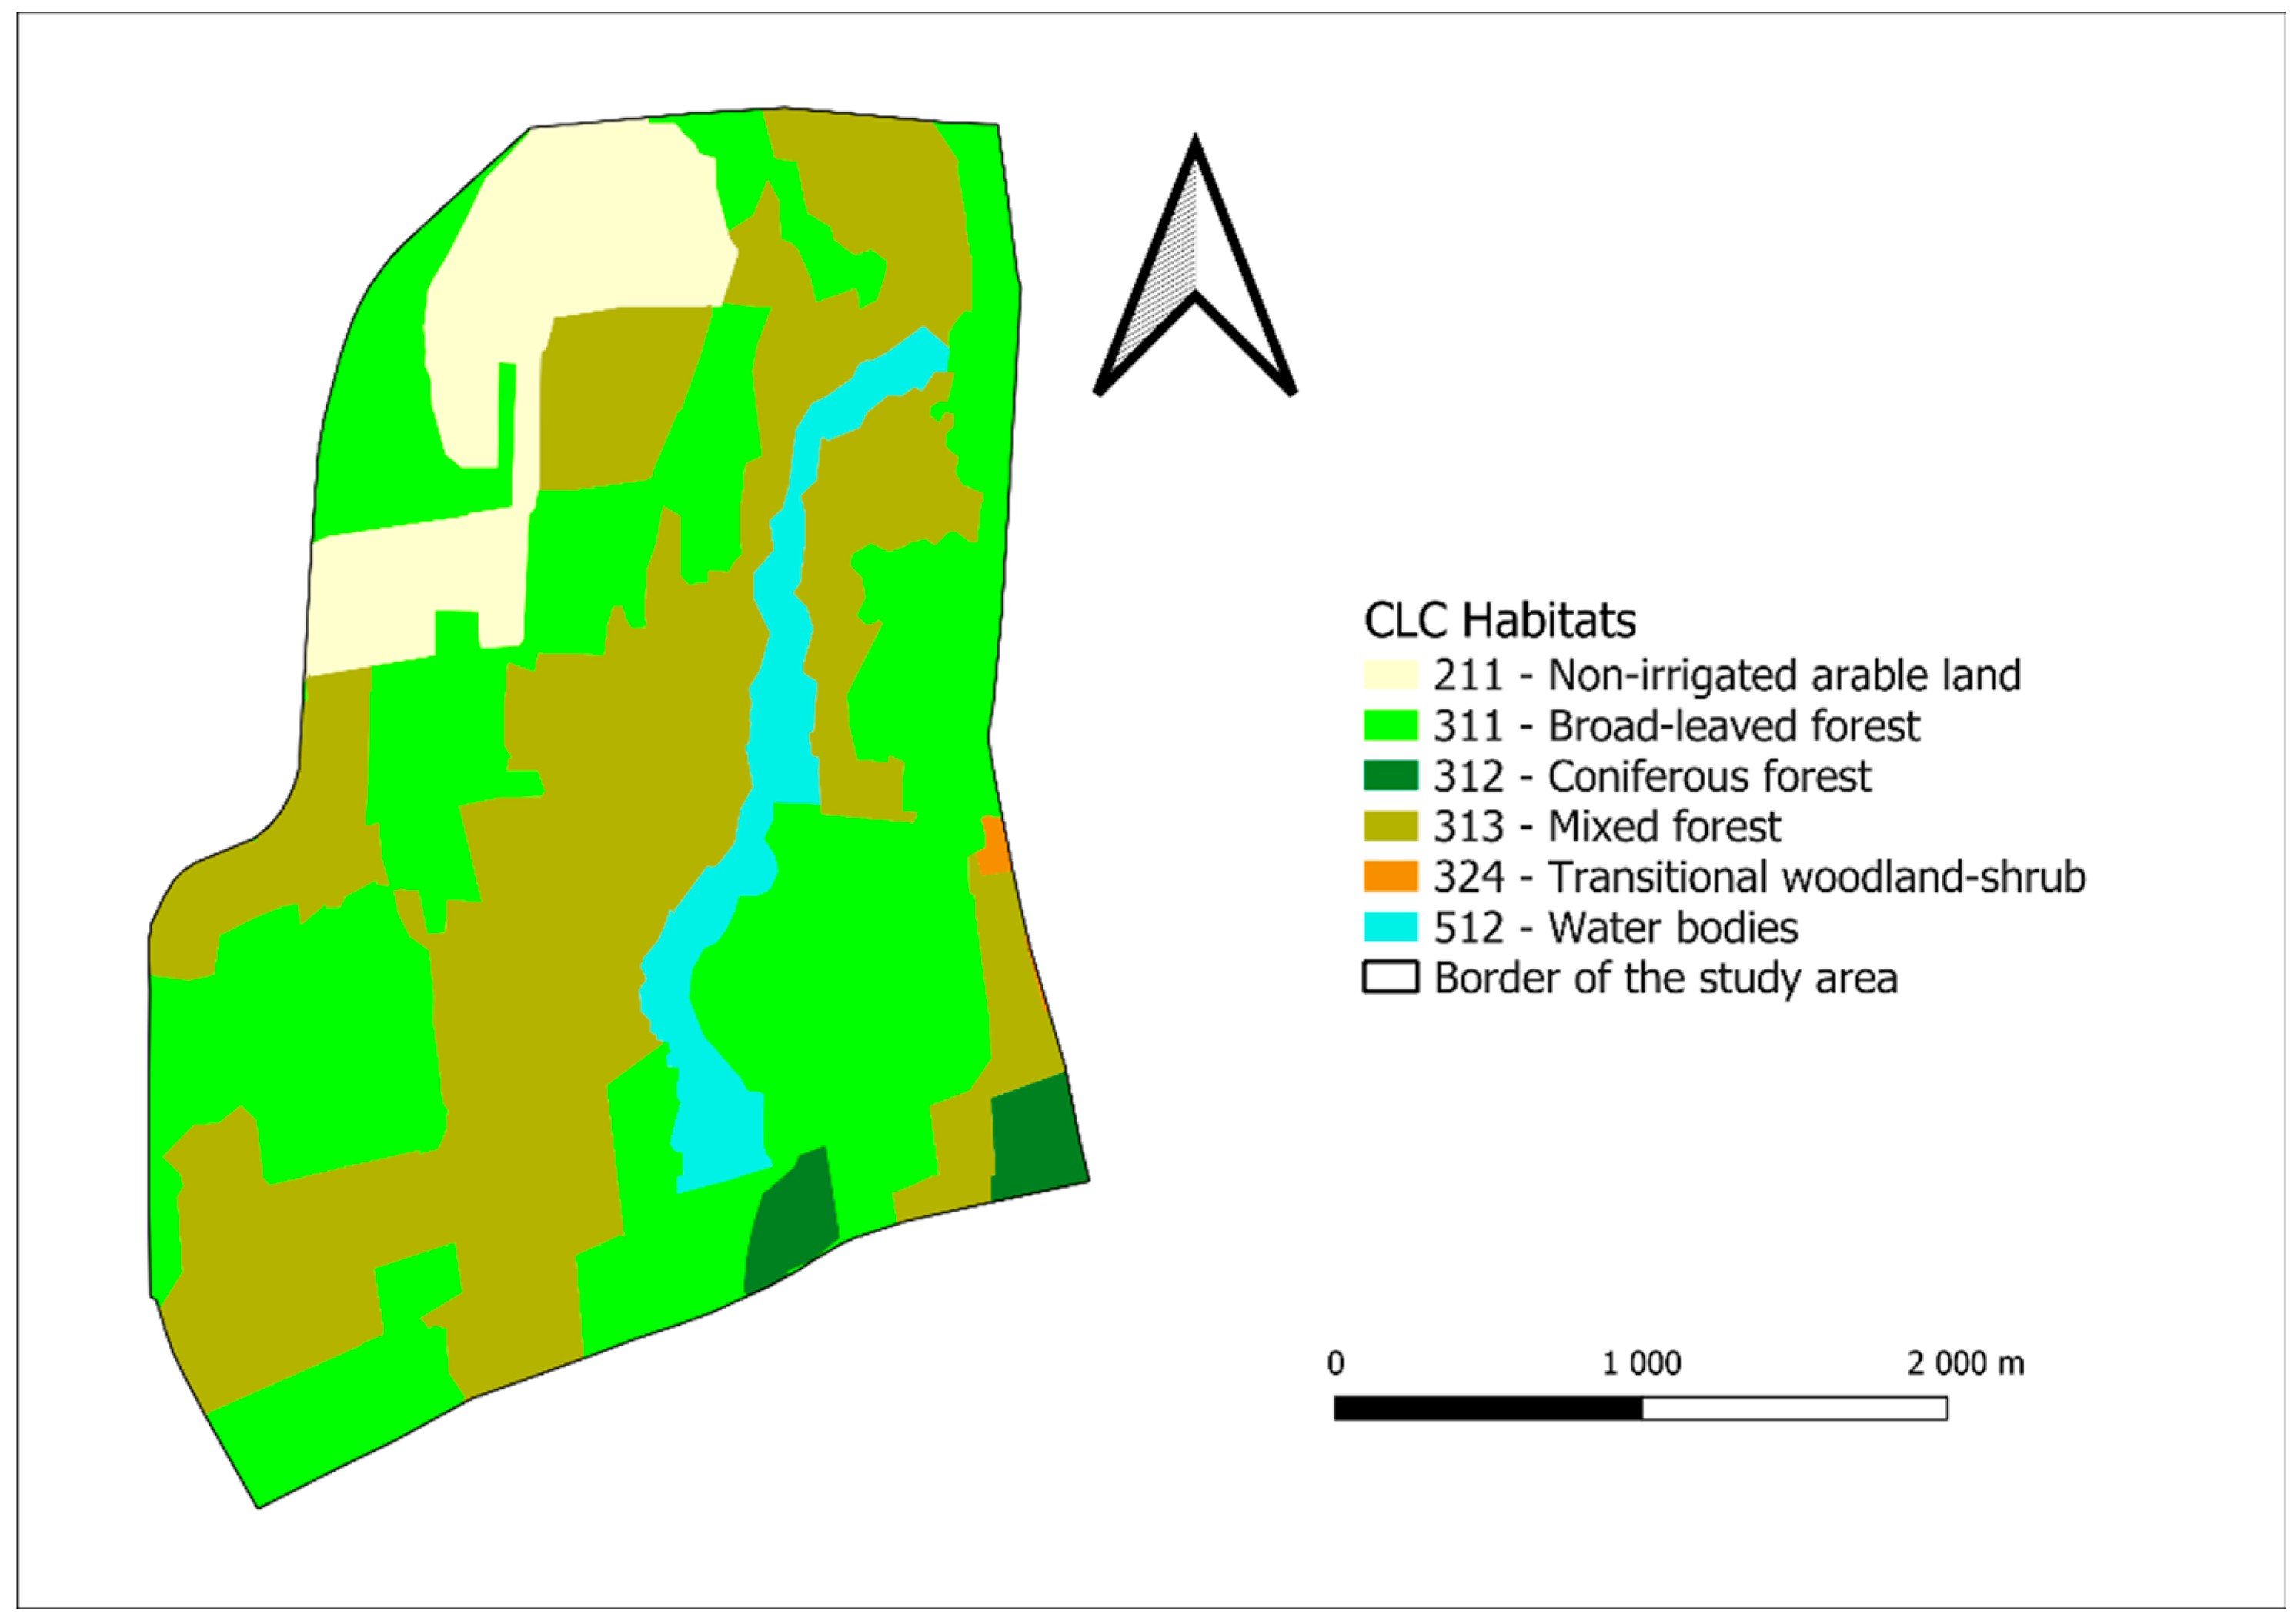
2.1. The Study Areas

The study area in Drávaszentes is located in the southern part of Somogy County, between the towns of Barcs, Komlósd and Péterhida (coordinates: 45.997562561,17.396221579). The area is a special game management unit managed by the Danube-Drava National Park Directorate. It covers an area of 1138 hectares, of which the hunting area is 1042 hectares (Figure 1). The forest cover of the area is 47%. The major forest types are alder forests (60%) and hardwood groves (24%). The open habitats in the area are mainly pastures and meadows, which cover 40% of the area.
The study area in Darány is also located in the southern part of Somogy County, between the towns of Barcs and Darány (coordinates: 45.986786021,17.533621622). It covers an area of nearly 1,000 hectares (980.8 ha). A significant part of the area (84%) is forested. In the north-eastern part, there are arable and grassland areas (95 ha – approx. 10%), and in the middle of the area there is a former fish pond system, which covers about 6% of the area (Figure 2). Fish farming no longer takes place in these fish ponds. Nowadays these areas can be considered as reed-rushy habitats.

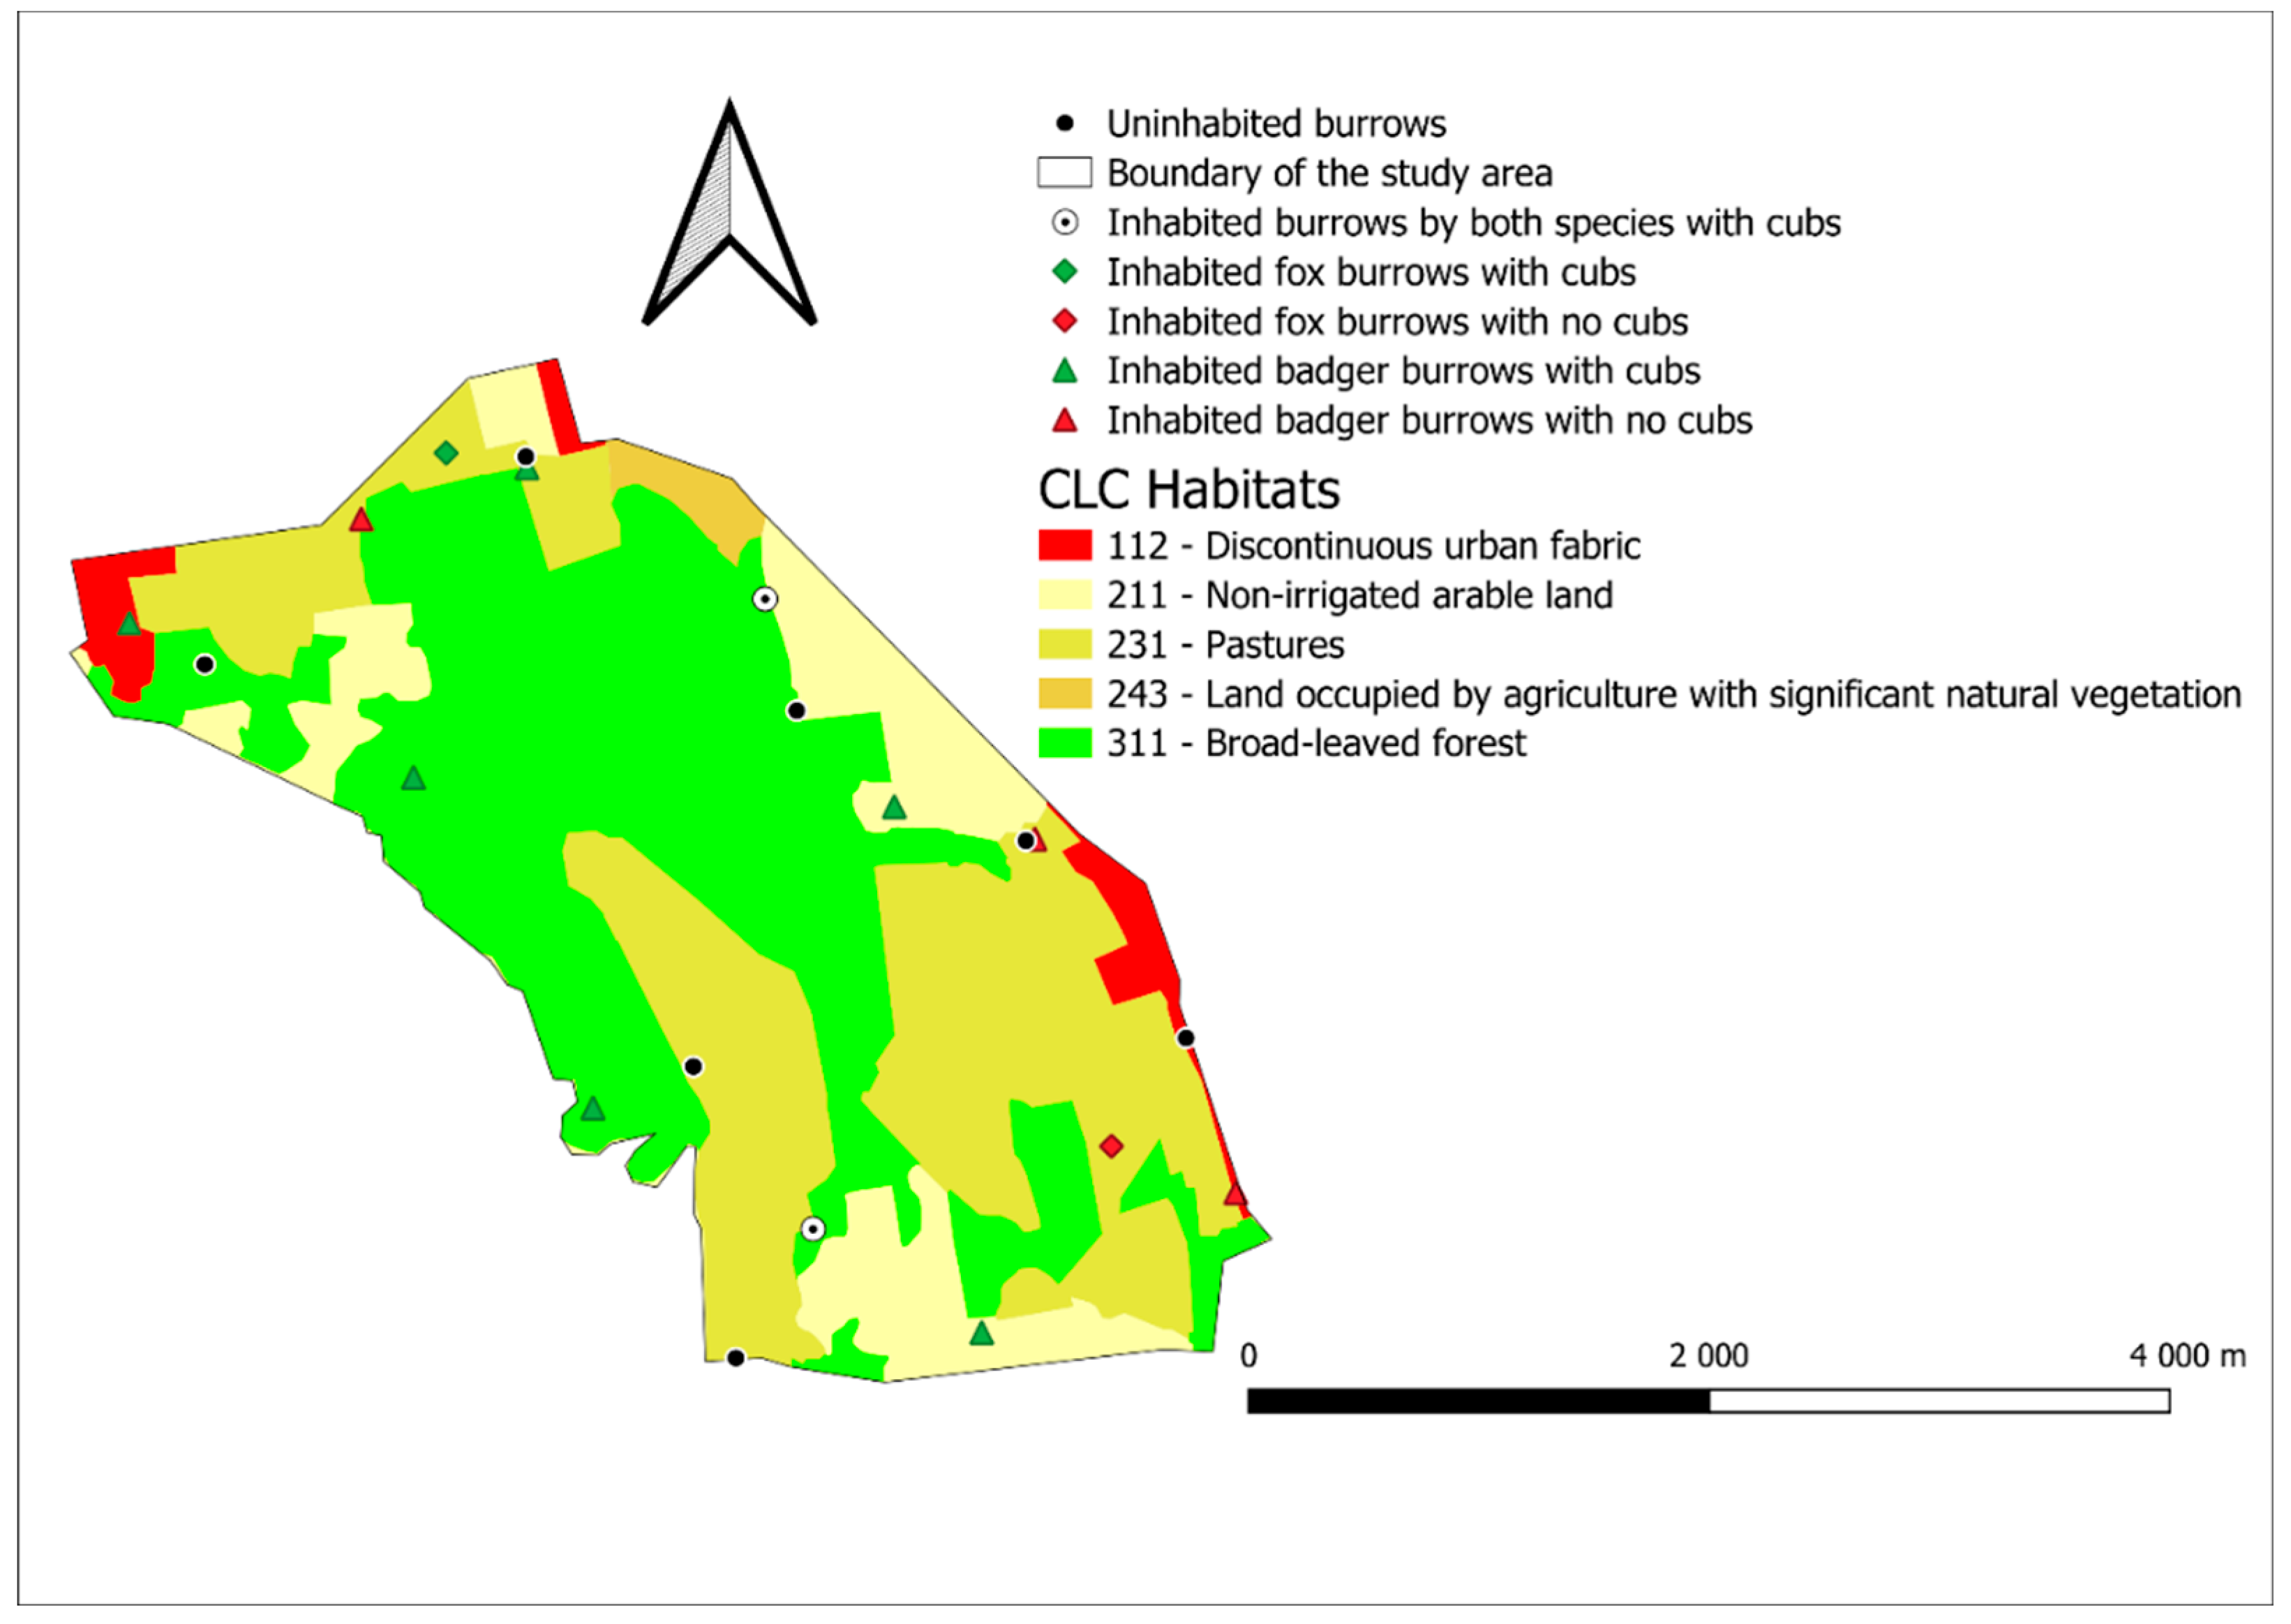
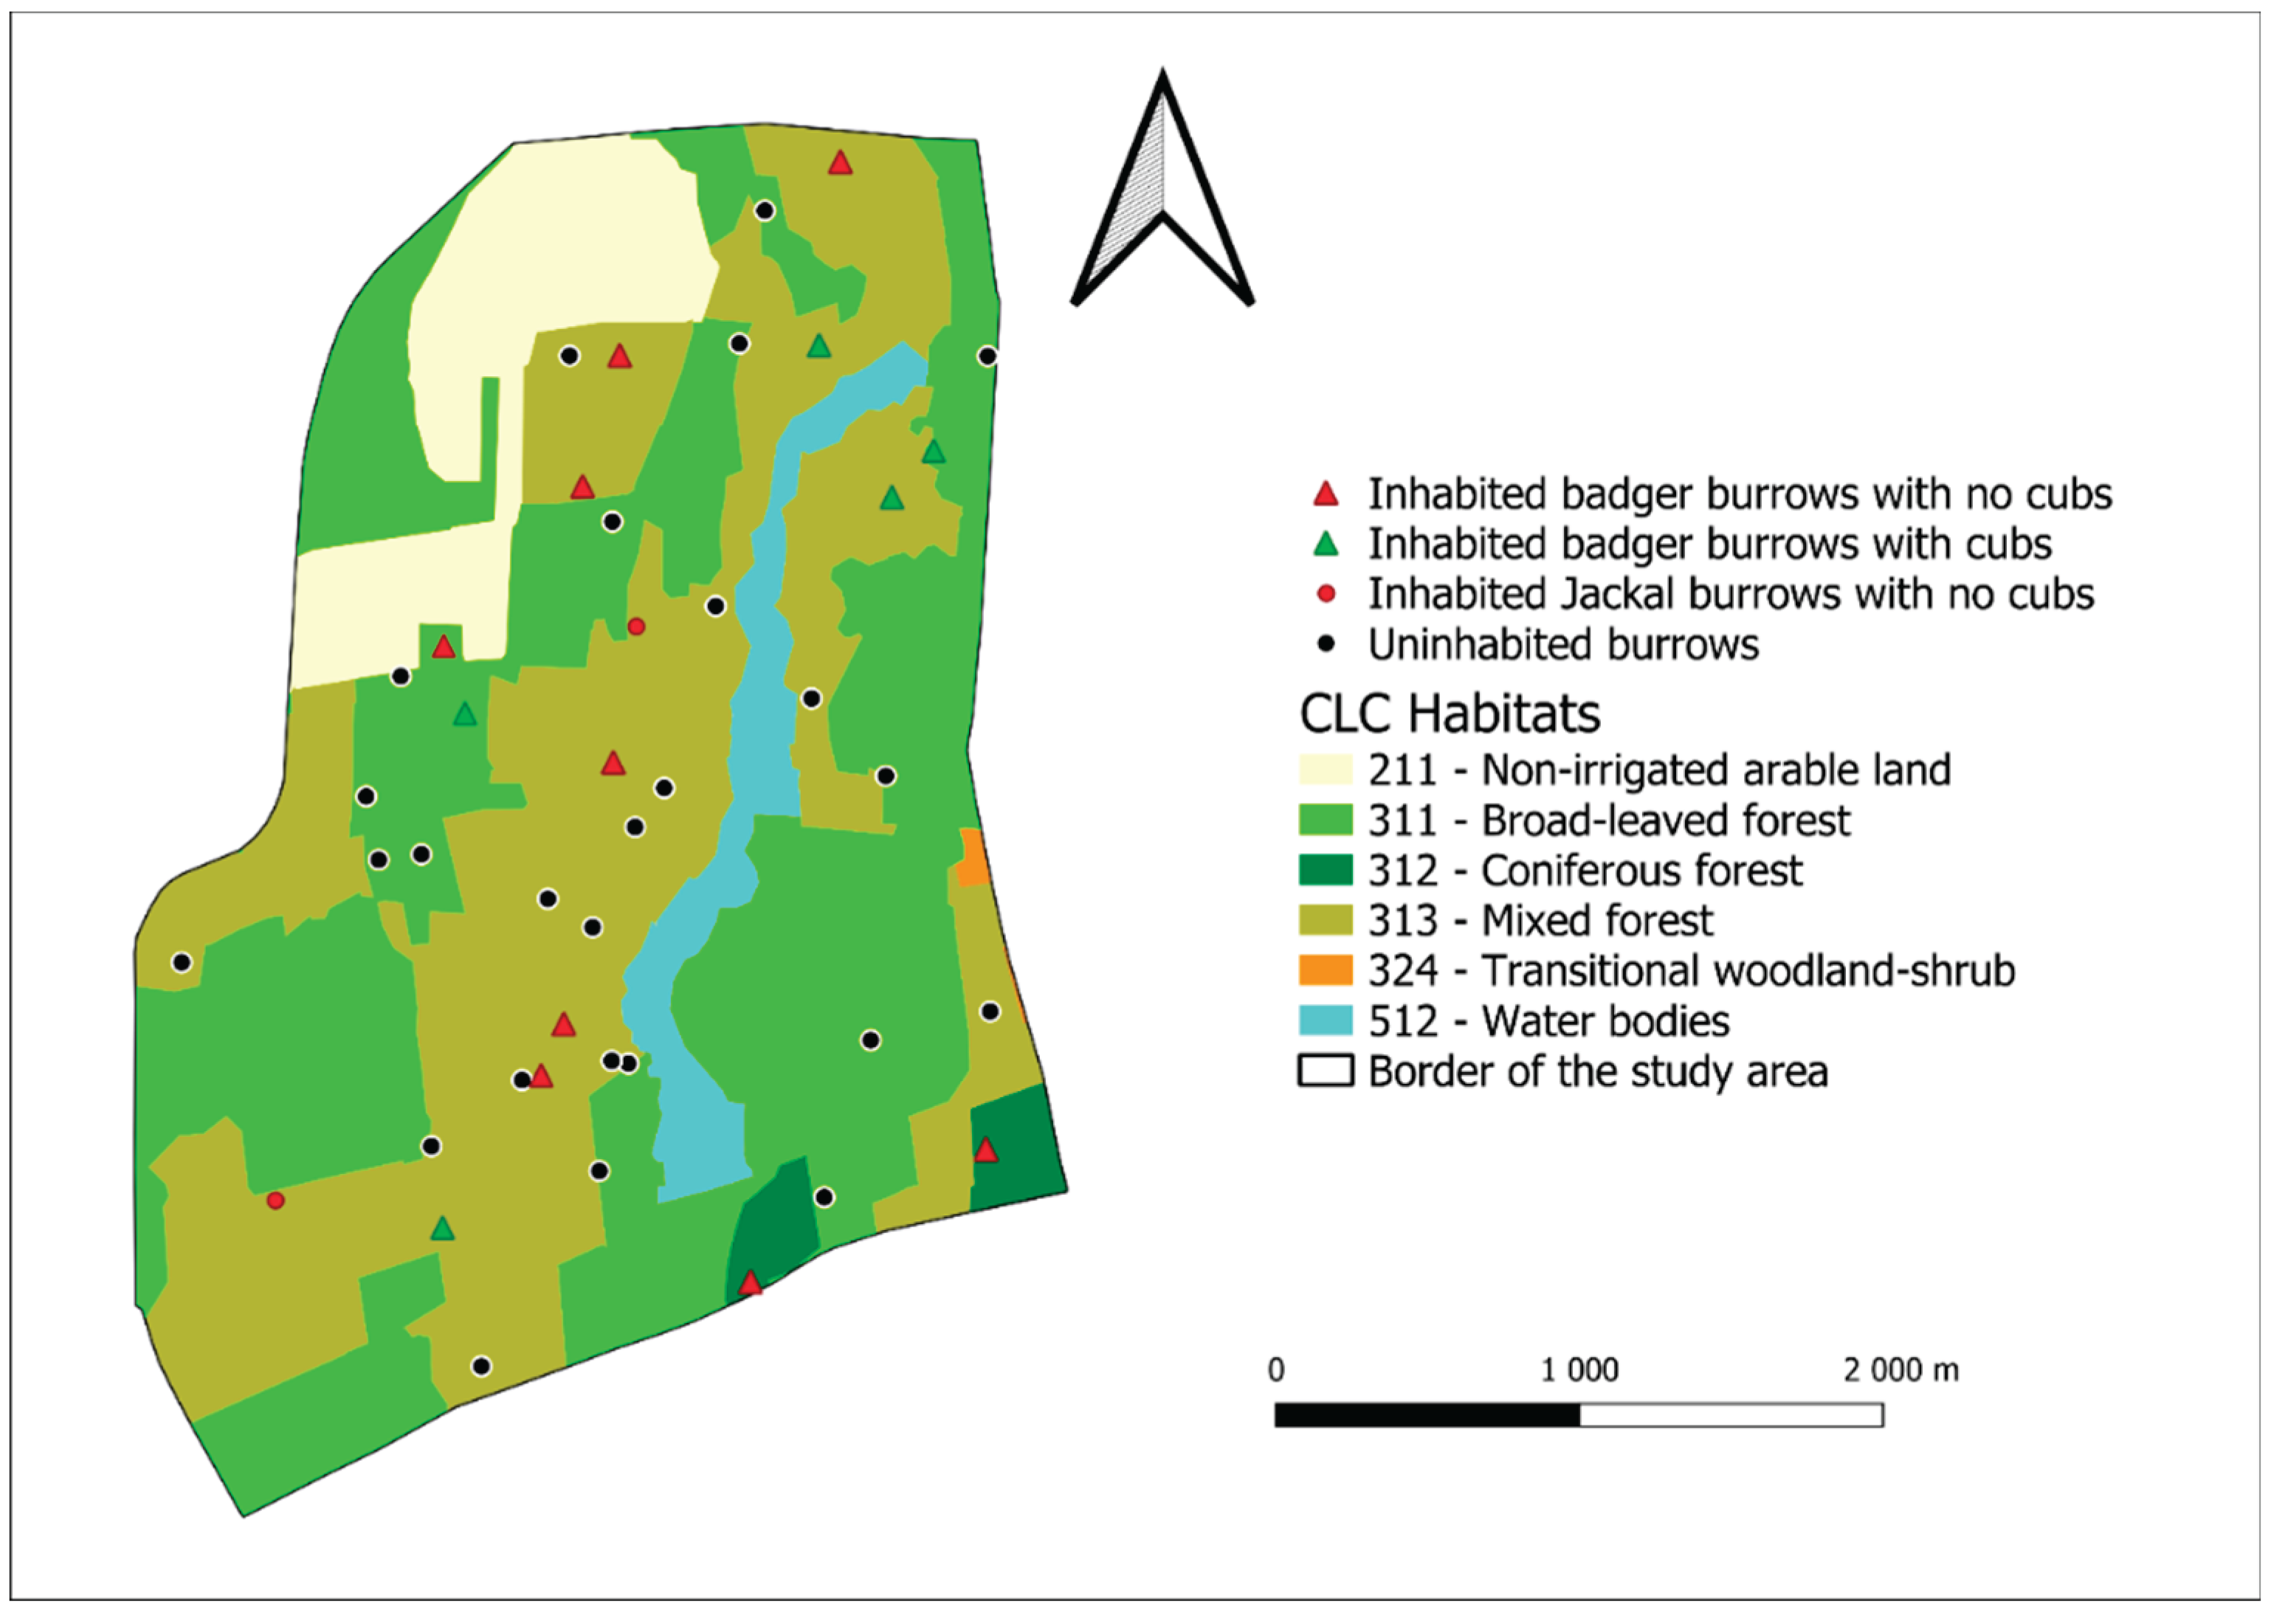
2.2. Data Collection

To locate the burrow systems, a total count survey was carried out on both study sites to collect the most reliable data possible. The surveys were carried out in 2025 from February to April. Early spring offers optimal visibility of the burrows, because the vegetation has not yet grown dense enough to obscure them. Throughout the fieldwork, maps and a Garmin GPSmap 62s GPS device were used to document every burrow we found, the coordinate system we used was the Unified National Projection System (EOV). The definition of a burrow was the following: a cavity deeper than one meter, with dimensions appropriate to the body size of the studied species [18]. The entrance generally measured between 15- and 60 cm in width providing a suitable shelter for the badger and red fox [19]. Where the nearest entrances were more than 50 meters apart, we treated them as a separate burrow [18]. A field log was maintained to hold the coordinates of each burrow recorded via GPS. This log also contained the serial number, occupancy status which species were using the given burrow. Species using burrows were identified by using tracks, footprints, scent marks, droppings, latrines and prey remains. [19]. We considered a burrow to be occupied if the entrances appeared to be clean and showed signs of recent activity. As for the badger, there were characteristic indicators that helped to distinguish their burrows from those of other species [20,21,22,23,24].
Where possible, motion-activated wildlife cameras were installed at identified burrows to record the number of adults and juveniles inhabiting them. Camera trapping can provide a valuable information on species that are nocturnal or elusive and are difficult to observe [25]. During the study, we used six cameras with image transmission capability and 15 cameras without image transmission capability. There were also multi-entrance burrow systems, where we installed multiple cameras. The models of cameras include Bushnell, Reconyx, Uovison, and Minox.
In the case of large burrows with several exits, it was not always feasible to position a camera at the specific entrance used by the predators. This presumably meant that it was not always possible to accurately determine the number of adults and juveniles. In open grassland habitats, the risk of illegal appropriation by unauthorized persons was higher, which limited the use of cameras in these areas. In such cases, we determined the minimum number of individuals based on the tracks observed.

2.3. Data Analysis

All camera recordings were analysed and organized into separate folders according to burrows. The analysis of the images enabled us to identify the number of adult individuals occupying each burrow from which we were able to determine the size of the annual population. Furthermore, we also observed the number of cubs and we were able to calculate the average number of cubs in the burrows, as well as the number of cubs in all inhabited burrows. The minimum number of individuals living in the area can be calculated from the sum of the number of adult individuals and cubs.
To estimate the habitat composition in the surrounding (400 metres radius buffer) of inhabited burrows we used Quantum GIS 3.31.1 software and Corine Land Cover 100 (version: 2018) layer [26]. When creating the database first we intersected the CLC100 overlay with the buffer areas. As a result we obtained the overlay of the buffers based on CLC categories [27]. In the next step, random points was placed (repeated five times) on the study areas. The number of random points were equal to the number of inhabited burrows found in the given study. In case of random points the habitat composition was estimated using the buffer (400 metres radius) method. For statistical analysis the inhabited burrows were divided into two groups which are the burrows with cubs and the burrows without cubs. Using the Mann-Whitney U-test the size of each CLC category found in the surrounding of burrows with cubs was compared to the categories found in the surrounding of burrows without cubs and random points. For statistical analysis we used Microsoft Excel and the GraphPad Instat 3 statistical program.

3. Results

3.1. Burrow Density

3.1.1. Drávaszentes

We surveyed 23 burrows in the study area in Drávaszentes, of which 15 belonged to badgers and 7 to foxes (Figure 3). Of the 15 badger burrows, 11 were inhabited, while of the 7 fox burrows, 4 were inhabited. Based on these data, it can be calculated that the number of inhabited burrows was 1.05 burrows/100 hectares for badgers and 0.38 burrows/100 hectares for foxes.

3.1.1. Darány

In the study area in Darány, we surveyed 42 burrows, of which 24 belonged to badgers, 16 to red foxes, and 2 to golden jackals (Figure 4). Of the 24 badger burrows, 14 were inhabited, none of the 16 fox burrows were inhabited, while both of the 2 golden jackal burrows were inhabited. From these figures, it can be calculated that the number of inhabited burrows per 100 hectares is 1.43 for badger, 0 for fox, and 0.2 for golden jackal.

3.2. Reproduction Results

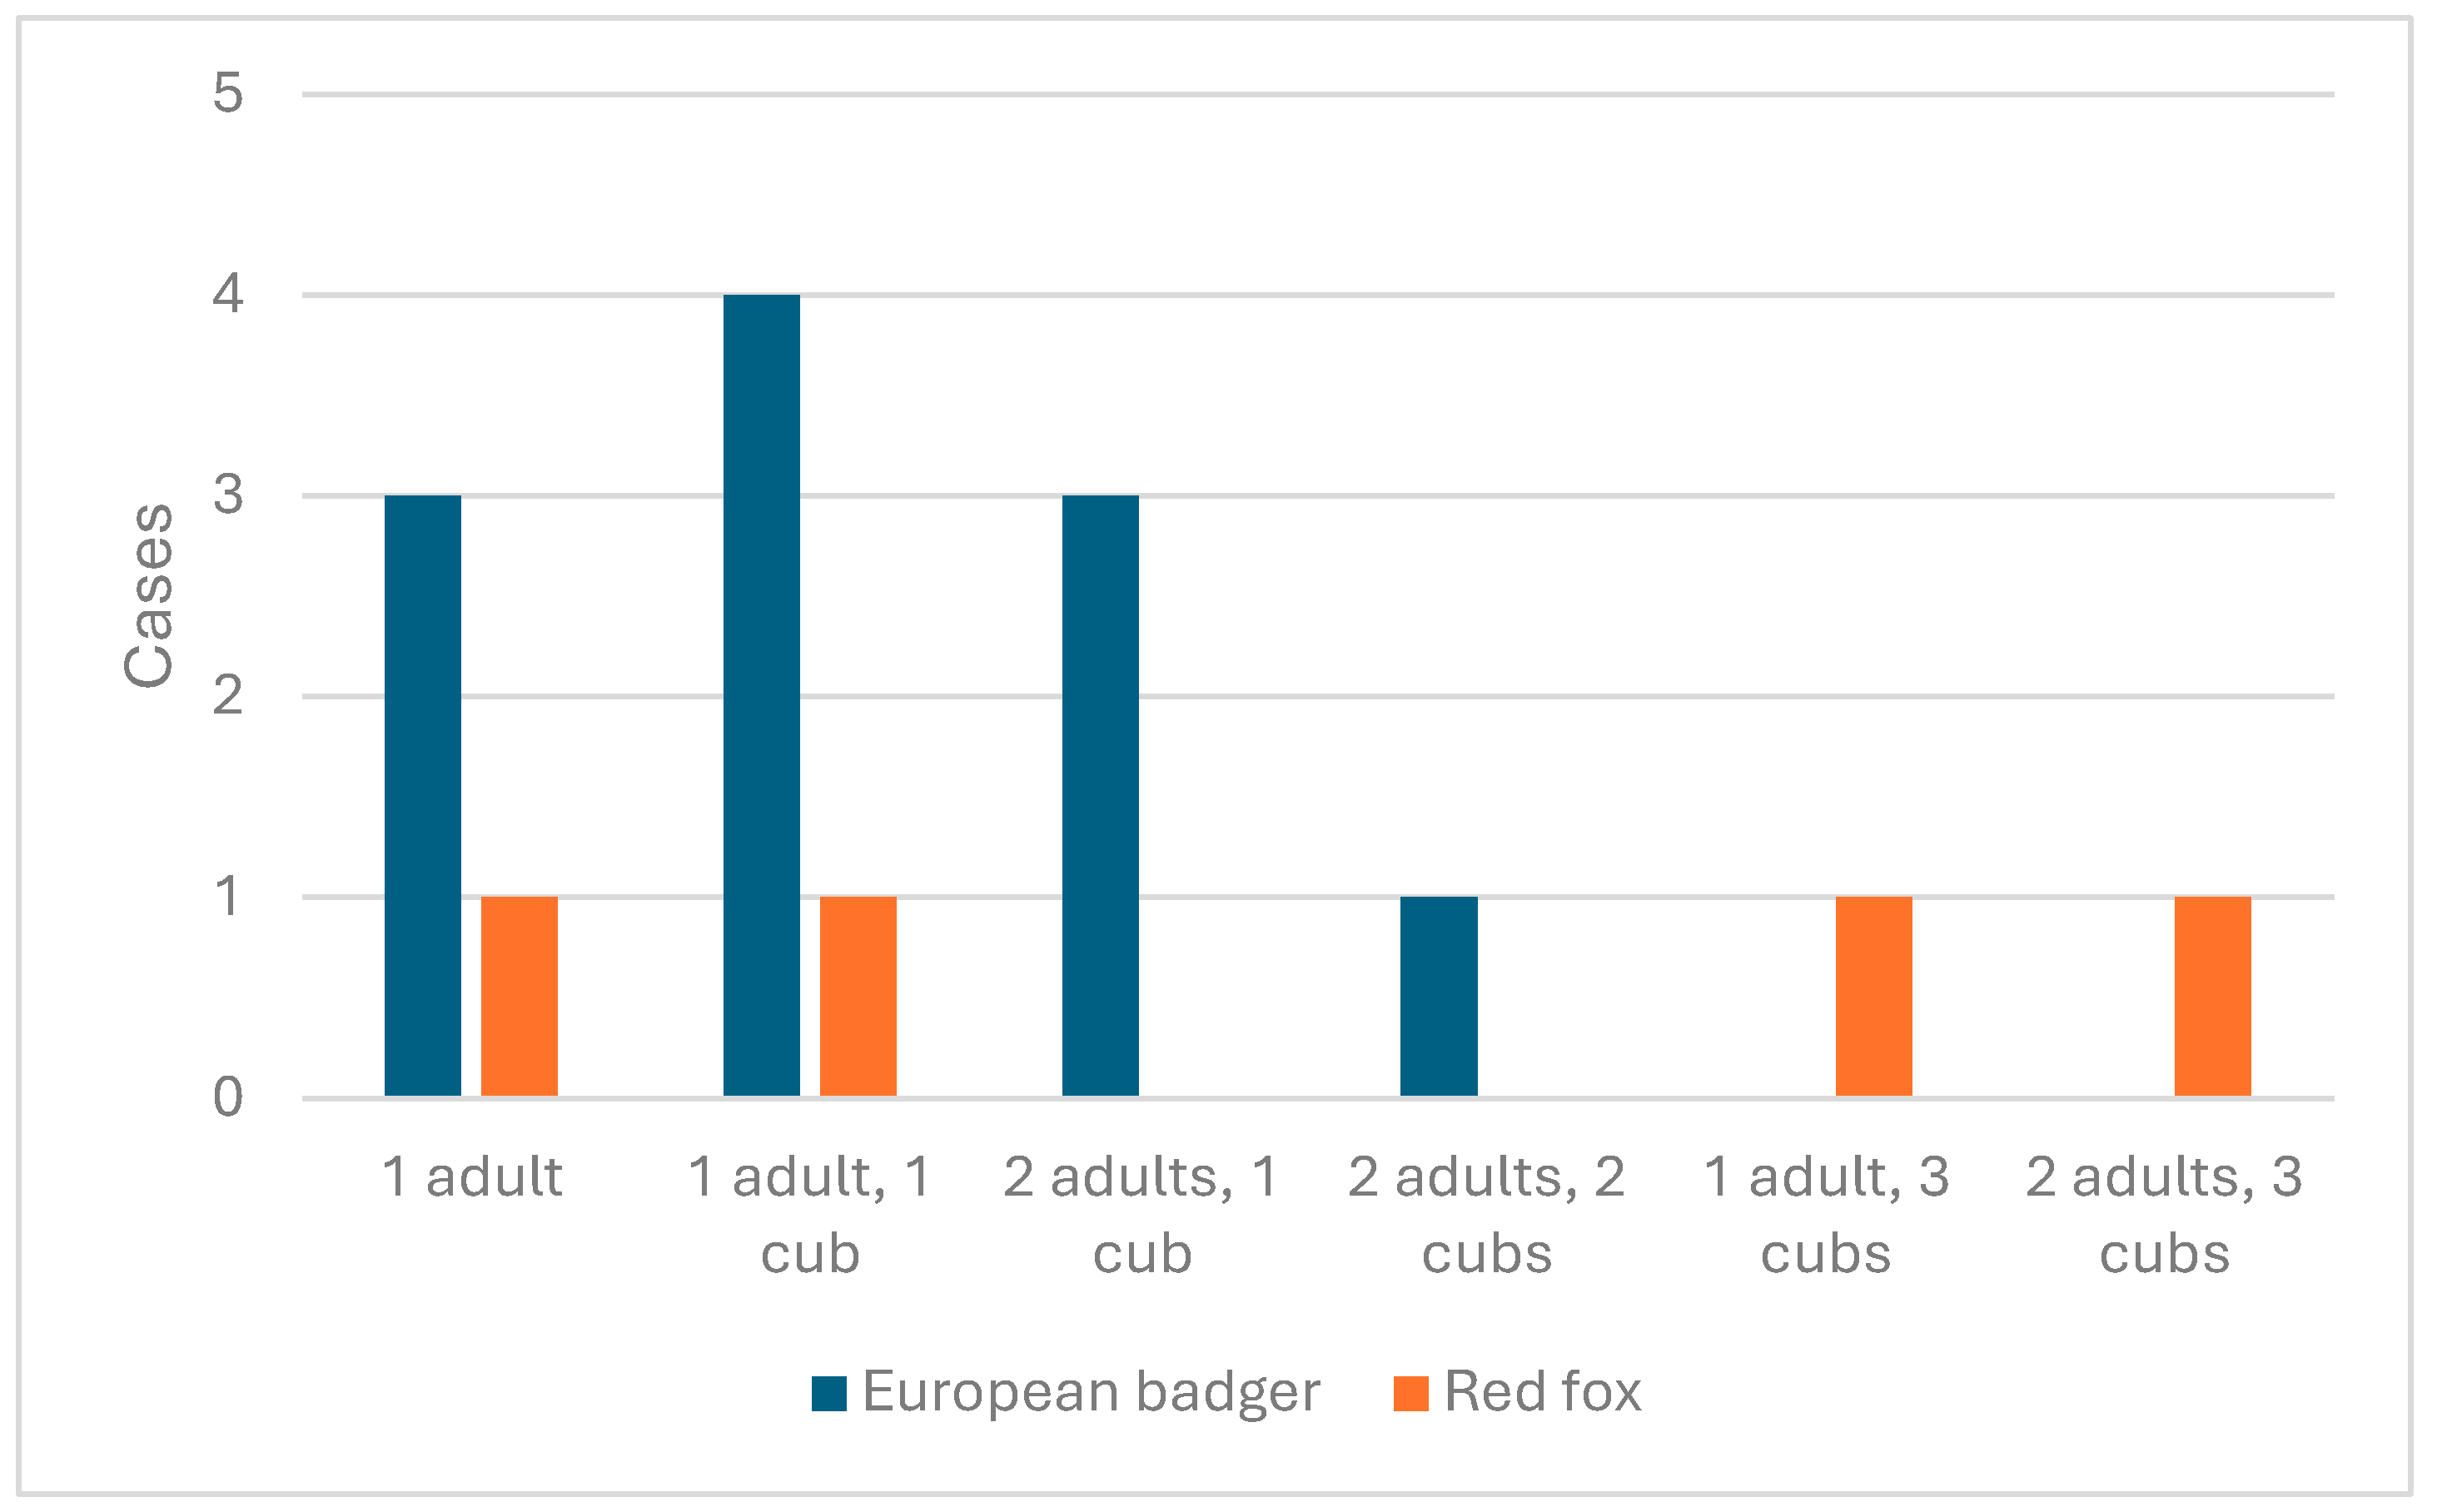
3.2.1. Drávaszentes Reproduction Results

Based on wildlife camera recordings, the following minimum numbers of individuals were observed in the 11 badger setts examined. In the case of badgers, cubs were observed in 8 cases (1 cub in 7 cases, 2 cubs in 1 case). Based on these data, it was possible to calculate the average number of cubs per burrow, which was 1.13 cubs/burrow, which meant 0.82 cubs/burrow when projected onto all inhabited burrows. The data obtained show that no litters larger than 2 cubs were observed during the study. In total we counted 9 cubs.
The number of adult individuals observed in inhabited burrows was 15, which means that there were 1.36 adult individuals/burrow. Adding the number of adult individuals and cubs together gives a value of 2.18 individuals/burrow. Thus, our estimated minimum population is 24 individuals, of which 15 are the core population (Figure 5).
Based on data provided by wildlife cameras, the following minimum numbers of individuals were observed in the 4 fox burrows studied. We observed fox cubs in 3 cases using wildlife cameras (1 cub in 1 case, 3 cubs in 2 cases). Thus, it was possible to calculate that the average number of cubs per burrow with cubs was 2.33 cubs/burrow, while the number of cubs per burrow was 1.75 cubs/burrow for all occupied burrows. The number of adults observed in the burrows was 1.25 adults/burrow. We recorded a total of 7 cubs. Adding the number of adults (5) and cubs together gives a result of 3 individuals per burrow. Thus, our estimated minimum population is 13 individuals and our core population is 5 individuals (Figure 5).

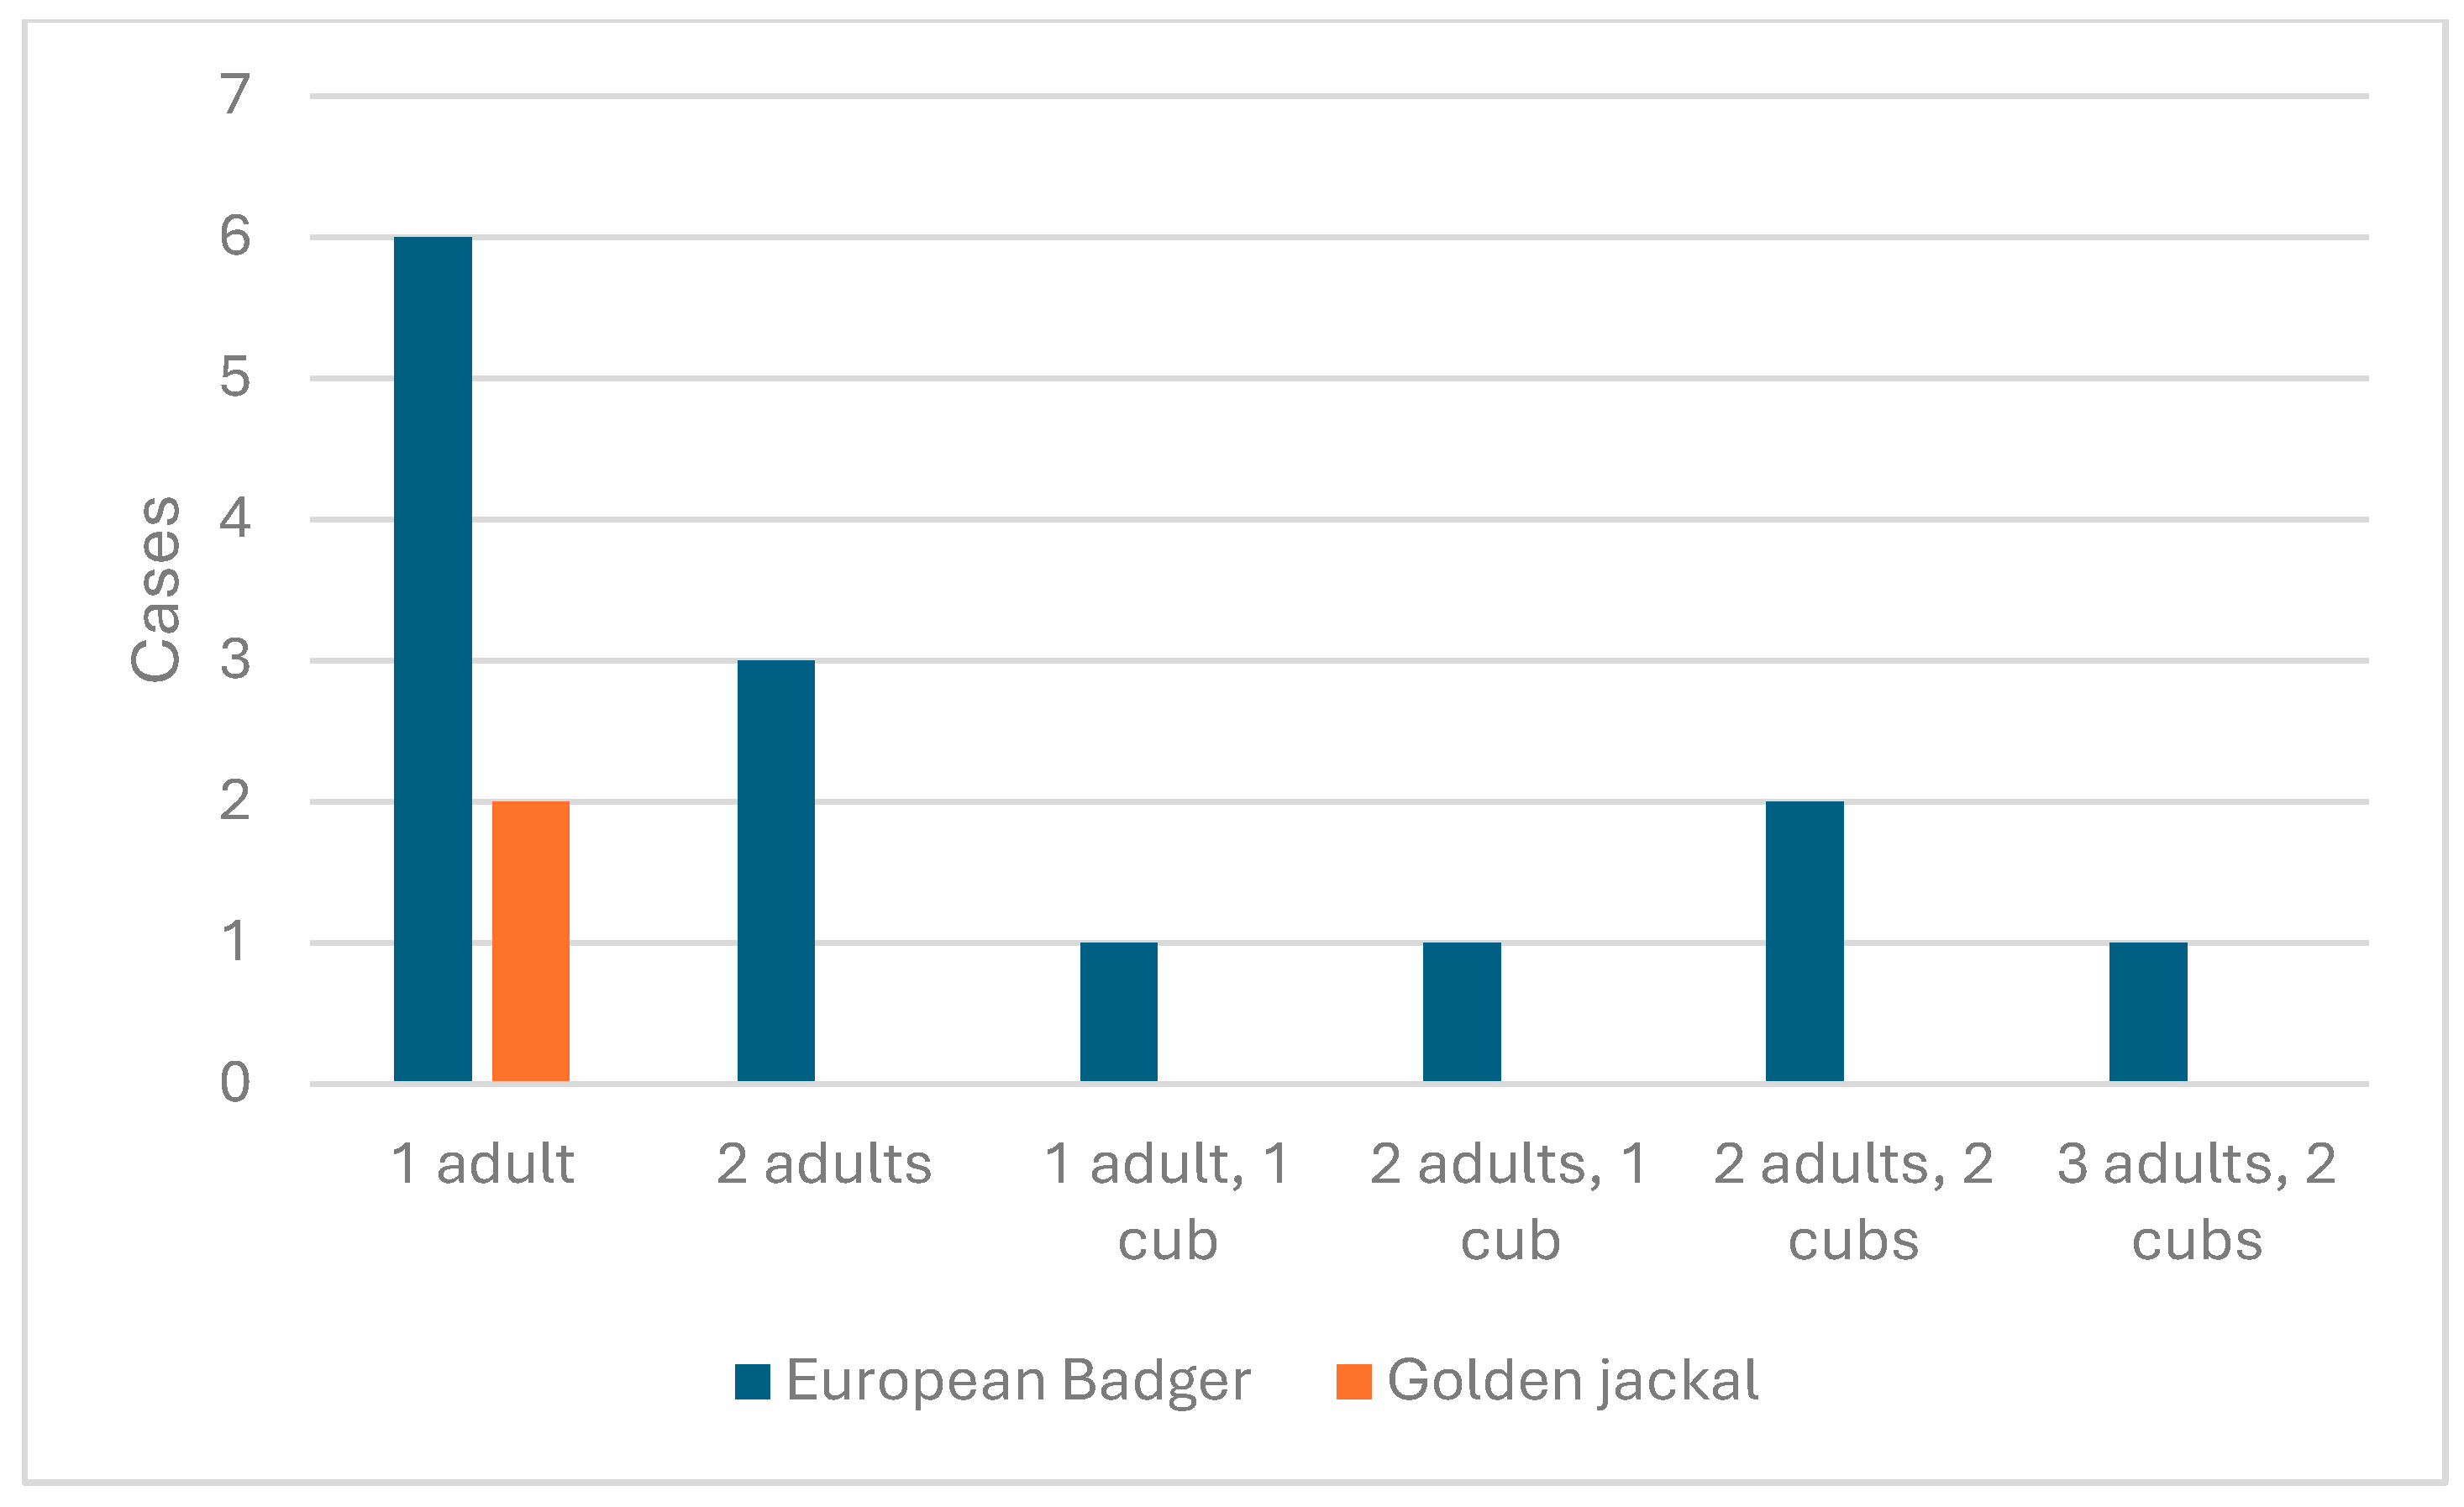
3.2.2. Darány Reproduction Results

Based on wildlife camera recordings, the following minimum numbers of individuals were observed in the 14 badger setts studied. In this area, we observed cubs on 5 occasions (1 cub in 2 cases, 2 cubs in 3 cases). From the data, it was calculated that the average number of cubs per burrow was 1.6 cubs/burrow, which, broken down to all inhabited burrows, gave a value of 0.58 cubs/burrow. No litters larger than 2 cubs were observed in this study area. We recorded a total of 8 cubs.
In terms of adult individuals, the value per burrow was 1.57 individuals. After adding up the number of adult individuals and cubs, we obtained a value of 2.15 individuals/burrow. Thus, our estimated minimum population is 30 individuals, of which 22 are the core population (Figure 6).
Based on wildlife camera recordings, the following minimum numbers of individuals were observed at the 2 jackal burrows studied. In the case of golden jackals, only adults were observed in the area (2 cases). Thus, the number of adult individuals observed is 1 adults/burrow. Therefore, our minimum estimated number of individuals is 2, of which 2 are part of our core population (Figure 6).

3.3. Habitat Composition Preference Results for Badger

3.3.1. Drávaszentes

At Drávaszentes study site, a statistically significant difference was found in one case (out of six) among the examined habitat types between burrows with cubs and the „random 5” points. The difference can be seen in case of non-irrigated arable land (CLC 211) (Table A1). Descriptive statistics also show that the median value for this habitat type in the surrounding of the burrows with cubs (18.42 hectare) was much higher than the measured for „random 5” points (0.64 hectare) (Table A3). This might be indicates that in this area, badger breeding burrows are more freqently located in enviroments where proportions of CLC 211 is high within the immediate 400 m vicinity. In other cases (Broad-leaved forest – CLC 311, Discontinious urban fabric – CLC 112, Pastures – CLC 231, Land occupied by agriculture with significant natural vegetation – CLC 243), no significant difference was detectable (p > 0.05), or the test could not be performed due to lack of data.

3.3.2. Darány

In the Darány area a significant pattern was obseved regarding forest habitats. Mixed forests (CLC 313) habitat occured in significantly higher proportions in the enviroment of burrows with cubs compared to random point in multiple cases. Compared to the „random 1”, the difference was significant (Table A2) where the median value for burrows with cubs (23.61 hectare) exceeded the random points (9.53 hectare). Similary a significant difference was found to the „random 2” group, again favoring burrows with cubs (median: 23.61 to 8.49 hectare) (Table A4). These result suggest that in Darány, mixed forest (CLC 313) is might be considered an important habitat for burrows with cubs. For other habitat types (Non-irrigated arable land – CLC 211, Broad-leaved forest – CLC 311, Coniferous – CLC 312, Mixed forest – CLC 313, Transitional woodland-shrub CLC 324, Water bodies – CLC 512) the examined comparison did not showed statistically verifiable difference.

4. Discussion

4.1. Burrow Density

In the Drávaszentes study area we recorded 1.05 burrows/100 hectares of badger and 0.38 burrows/ 100 hectares for red fox, and the total burrows (inhabited + uninhabited) were 1.44 burrows/100 hectares for badger and 0.67 burrows/100 hectares for fox.
In the Darány study area we got 1.43 burrows/ 100 hectares for badger, 0 for fox and 0,2 burrows/100 hectares for jackal. and for the total burrows it was 2.45 burrows/100 hectares for badger, 1.62 burrows/100 hectares for red fox and 0.2 burrows/100 hectares for jackal.
Comparing the inhabited burrow results obtained with previous studies for badger it can be seen that in rural areas of England and Wales where they covered 1330 km2 in England and 184km2 in Wales the estimated mean density of main setts was 0.49 burrows/100 hectares on a mosaic of agricultural and woodland habitats [28]. In Northern Ireland another country-wide survey was carried out on rural and agricultural landscapes. The average density of burrows was 0.56/100 hectares [29]. Both of these cases show lower burrow density than the areas that we studied. Also in Continental Europe for example in the Białowieża forest on the border of Poland and Belarus Kowalczyk et al. (2000) [30] based on surveys done in the 1990s, estimated the burrow density as 0,02 burrows/100 hectares which also shows a lower density than our study areas. In Portugal on a multi-use agricultural land Silva et al. (2021) [31] recorded 1.05 burrows/100 hectares which is the exact density recorded in our Drávaszentes study area, but lower than our other study area. In France in a rural environment located in Massif Central where the landscape is mostly composed of meadows (85%) and only around 10% percent was small woods and hedges the density of badger burrows was 0,45 burrows/100 hectares which is also lower than both of our study areas [32]. In Hungary Kozák and Heltai (2006) [33] in Erdőspuszták they recorded 1,07 burrows/100 hectares in a study area where the forest coverage was higher than 55% they also carried out a questionnaire with 6 eastern Hungarian hunters’ associations and they got a mean data of 0.32 burrows/100 hectares (Table 1).
For fox previous studies in Switzerland Meia and Weber (1992) [16] recorded 0.33 burrows/100 hectares in the Jura mountains. In the suburban Brussels Brochier (1989) [34] calculated 1 burrow/100 hectares. Meriggi et al. (1991) [35] carried out research in Northern Italy, Piacenza on 2589 km² where they found a total of 1451 fox burrows, resulting an average density in 0.67 burrows/100 hectares. They also found the highest density of burrows in protected areas (0.98 burrow/ 100 hectare, while the lowest was in hunting grounds (0.41 burrow/100 hectare) and in social hunting grounds (0.33 burrow/100 hectare). As for altitudal ranges they observe the following numbers: plains (0.28 dens/km²), low hills (0.71 dens/km²), middle hills (1.20 dens/km²), and mountains (0.41 dens/km²). In Pakistan Zaman et al. (2020) [36] in Shigar Valley found 1.3 burrows/100 hectares which is higher than both of our study areas. In Hungary Márton et al. (2012) [37] showed a much higher burrow density in Börzsöny (3.66 burrow/100 hectare) and in Bakony (4.08 burrow/100 hectare) (Table 2).

4.2. Individual Density

We compared our study areas individual density for badger which is 1.44 individual/100 hectares at the Drávaszentes study area and 2.24 individual/100 hectares at the Darány study area with other studies. In France Jacquier et al. (2021) [38] studied badger population density on 13 study sites and found that the density of adult badgers ranged from 1.66 to 7.86 per 100 hectares with an average of 3.84 ± 1.75 (SD) across all sites. They also recorded that the fragmented landscapes supported a lower amount of badgers than the more suitable habitats (forests, forest edges and hedgerows). In Portugal Rosalino et al. (2004) [39] investigated cork oak (Quercus suber L.) woodlands, because these landscapes provide a big contrast of other studies elsewhere. In this habitat they recorded 0.45 badgers/100 hectare which is one of the lowest population densities in Western Europe. In Spain in the SW part of Iberian Peninsula in an area dominated by Mediterranian scrubland, degraded cork oak woods, marshlands, and pine plantations they estimated the density of two different populations. One of them was in the zone, where a 0.67 adult individual/100 hectare was recorded, and the other was in Reserva Biologica, where 0.23 adult individual/ 100 hectare was recorded [40]. In Atlantic Spain Acerevo et al. (2014) [41] did a study in lowland pastoral areas according to the model that was used in Northen Ireland to accurately predict the badger abundance (48 1 km × 1 km squares in 12 localities) they got a mean density of adult badgers of 3.81 badger/100 hectare which is high in the mediterranians but lower than some areas in England. In Finland Kauhala et al. (2006) [42] studied the home range and density of the species with radio-collars and they found that in 2002 they had 7 radio collared badger and the minimum density of badgers was 0.21 badger/100 hectare, in 2003 they had 9 radio-collared badger and they got a minimum density of 0.26 badger/100 hectare (Table 3).
As for the red fox we recorded 0.48 adult/100 hectares in Drávaszentes and none in the Darány study area. In Norway Lindsø et al. (2021) [43] applied Spatial capture–recapture (SCR) modelling to non invasive sampling (NGS) to estimate the density of the species in central and southern Norway in the boreal forest. The central study area had a lower density (mean=0.04 foxes per 100 hectare in 2016, 0.10 in 2017, and 0.06 in 2018), than the southern area (0.16 in 2017 and 0.09 in 2018). In Western Poland Panek and Bresinski (2002) [44] studied red fox density in an open farmland, where forest cover was only 6% percent, they used nocturnal spotlight counting and snow tracking as the method in the spring and early winter between 1997-2000. The average fox density estimated with spotlight counts was 1.02 individuals/100 hectares in the spring and 1. 63 individuals/100 hectare in early winter, while the winter density obtained from the results of track counts was 1.26 individual/100 hectares. In Southern Finland during the spring of 2020 and 2021 on 11 and 16 wetlands respectively a data collection happened with 134 and 150 camera traps. In this study they found the average red fox density for the two years to be 0.6 individual/100 hectare [45]. In Central-East Portugal in the Serra da Malcata Sarmento et al. (2009) [46] used camera traps between July 2005 to August 2007, in 7 camera-trapping session to estimate the density of red fox in the area. They obtained an average density of 0.61 foxes/km2 (95% CI 5 0.54–0.69 foxes/100 hectare, which corresponds to a population of 53–67 foxes (excluding cubs) (Table 4).
As for the golden jackal we recorded none in Drávaszentes and 0.2 individual/100 hectares in Darány study area. In Romania Banea et al. (2012) [47] recorded the territorial reproductive groups in the Carpathian arch and in the Danube Delta Biosphere Reserve. They used the acoustic method which was performed from 66 calling stations. Romania: 1.41-1.74 territorial groups/10 km2 in areas from Giurgiu, 0.59-0.73 territorial group/10 km2 on the hunting terrain from Calarasi County, 0.46-0.52 territorial groups/10 km2 in Dobrogea (Dobrudzha), in Alba it was 0.43 territorial groups/10 km2, in Timisi it was 0.21-0.17 territorial groups/10 km2 and 1.56-1.74 territorial groups/10 km2 in Danube Delta maritime levees (0.55-0.61 territorial groups/10km2 for Grindul Chituc and 2.36-2.64 territorial groups/10 km2 for Grindul Lupilor). This data was converted by Singh et al. (2016) [48] to individuals by considering three individuals/ group. According that the datas are the following: Giurgiu 0.42–0.51 individuals/100 hectares, Calarasi 0.18–0.22 individuals/100 hectares, Dobrogea 0.14–0.16 individuals/100 hectares, Alba 0.11–0.13 individuals/100 hectares, Timis 0.05–0.06 individuals/100 ha, Romania–Chituc levee Danube delta 0.15–0.18 individuals/100 hectares. In Bosnia and Herzegovina Selimovic et al. (2021) [49] used bioacoustic stimulation on 92 calling stations, they received jackal answers at 29 in a total area of 1150 km2. This resulted in an estimated minimum relative group density of 3.5 territorial group/100 km2 or 0.35 group/10 km2. In Croatia Krofel (2008) [50] jackal howling was broadcast from 3 different locations (Ravni kotari-28 calling station, Vir island-4 calling station, Pag island-5 calling station. Altogether a reply was noted from 15 calling stations and they recorded 21 territorial jackal groups: Ravni kotari-19, Vir island-2 and none on Pag island. This amounted to a minimum estimate of 0.61-0.75 jackal territories per 10 km2 in Ravni kotari and 1.15 jackal territories /10 km2 on Vir island. In Slovenia acoustic (play-back) method was used for detecting the presence of territorial groups of jackals on four study areas Ljubljansko barje-12 calling stations, Zgorje Posočje-32, Kras-22, Bela Krajina-30. They got the following data: Ljubljansko barje, 0.25; Zgornje Posočje, 0.06; Kras, 0.29; Bela Krajina, 0.19 [51]. In Bosnia & Herzegovina Trbojević et al. (2018) [52] made the first systematic golden jackal survey. They gathered all jackal harvest record from managers of all hunting grounds from 2000 to 2016. That data showed 212 legally harvested jackals nad they found an increasing trend. They also used the acoustic (play-back) method and confirmed 80 territorial jackal groups along 6 transects covering 3081 km². In Northen Bosnia & Herzegovina they estimated a minimum density of 0.33 groups/10 km² and 0.10 groups/ 10 km² in Central Bosnia & Herzegovina.

4.3. Cubs Per Burrow

As for cubs per burrow we gathered the following: For badger we gathered that the average number of cubs per burrow, was 1.13 cubs/burrow, which meant 0.82 cubs/burrow when projected onto all inhabited burrows in the Drávaszentes study area. The average number of cubs per burrow was 1.6 cubs/burrow, which, gave a value of 0.58 cubs/burrow for all inhabited burrows at Darány study area. We didn’t record a litter larger than 2 cubs either of the study areas.
For red fox we only collected data at the Drávaszentes study area which was 2.33 cubs/burrow average per burrow with cubs, while the number of cubs per burrow was 1.75 cubs/burrow for all occupied burrows.
If we compare our collected badger data with previous studies we can see the following. The size of badger’s litter in Europe can range from one to five cubs. According to Neal and Cheeseman (1996) [22], the average litter size when cubs are first observed above ground is 2.4 cubs, while the average fetal litter size is 2.7 cubs. In Portugal on a farmstead which mainly focused on cork production, they monitored 12 burrows by camera-trapping, and cubs were detected in 5 burrows. The data showed that on 4 occasions they detected 2 different cubs and in 1 case they only found 1. This on average means 1.8 cubs/burrow [31]. In Central Poland in the Experimental Forest Station of Warsaw University of Life Sciences near Rogów a study was carried out on 9441 ha. Badger breeding was recorded at 17 different places and the litters varied between one to four. The lowest mean number of cubs was 2.5 and the highest was 3.3 and the average for all years was 2.7 cubs [53]. The number of cubs in Western Poland near Trzciel a research was carried out on a lowland region on 389.5 km2 where the dominant vegetation was Scots pine (Pinus sylvestris) they collected data using camera-trapping they estimated 1.7 cub per burrow [54] (Table 5)
As for red fox datas from previous studies we can see the following. In Western Poland near Trzciel a research was carried out on a lowland region on 389.5 km2 where the the dominant vegetation was Scots pine (Pinus sylvestris). A study carried out by Nowakowski et al. (2020) [54] recorded 18 litters and in those 2.4 cubs per burrow they collected data using camera-trapping. In Central Poland in the Experimental Forest Station of Warsaw University of Life Sciences near Rogów a study was carried out on 9441 ha. They found altogether 153 breeding cases in 67 different sites. The litters ranged between one to six and the lowest litter size in a year was 2.5 and the highest was 4.1. The average number of cubs in one litter was 3.5 cub [53] (Table 6).

4.4. Badger Habitat Composition Preference

From the result obtained from the habitat composition using buffers we can see that in Drávaszentes study area in one case the area of open habitat type was higher in the surronding of burrows with cubs copared to the random points („random 5”). Inn Darány study area the size (area) of forested habitat was higher than measured in case of random points („random 1” and „random 2”).
In Italy a study was carried out on 161 km² of hilly area in Southern Lombardy. They found 48 setts and they mapped 28 random points in QGIS. In a circular area (radius 300 m) around each point a statistical comparison was carried out. From these datas they found out that badgers dig burrows in places where tree cover is high and the decidous forests where strongly selected by Manly selection index [55] (Biancardi et al., 2014). In Portugal Rosalino et al. (2007) [56] used compositional analysis to determine habitat use at four spatial scales (1, 4, 25, 100km²) from setts, latrines, footprints and roadkills. The oak woodlands was the most preffered habitat on 3 scales (1, 4, and 100 km2). Pastures were most selected on 25km2 cell, but there was no significantly difference from oak woodlands. These result of showing the selection of decidous forests are similar to other studies in different environments [57,58,59,60]. In two semi arid region of Spain Lara-Romero et al. (2012) [61] studied habitat selection patterns. They sampled 57 plot, at each plot they collected badger latrines along 2.6 km transect, and they used the number of latrines per km as an index for habitat selection. These results showed that the species prefered fruit orchads and shrub and rock covered areas and avoided intensly cultivated fields and human settlements. In the Netherlands near Utrecht and Hilversum Apeldoorn et al., (2006) [62] described that the pastures are more prefered because of the avability of food. These result shows a difference from studies where orchards, cultivated areas and urban areas where avoided [60,61].
Based on the results of our study there are important data (number of adults and cubs per burrow), which can be used to planning predator management. Comparing the habitat composition between burrows with cubs and random points we have found few and slight differences. Further studies should focus on the fine scale (Virgós and Casanovas 1999) [63], microhabitat composition of burrows using higher sample size.

Funding

This research received no external funding.

Institutional Review Board Statement

Not applicable.

Data Availability Statement

The data presented in this study are available on request from the corresponding author.

Acknowledgments

I would like to thank the staff of the Duna-Dráva National Park Directorate, Zoltán Horváth and Csanád Sipter, for lending us trail cameras and for their assistance at the Drávaszentes study area. I would also like to thank Zoltán Puskás, Director of the Barcs Forestry of SEFAG Zrt., for granting permission to enter the Darány study area.

Conflicts of Interest

The authors declare no conflicts of interest.

Appendix A

Appendix A.1

Table A1. The results of Mann-Whitney U-test in case of Drávaszentes study area Legend: 112-Discontinuous urban fabric, 211-Non-irrigated arable land, 231-Pastures, 243-Land principally occupied by agriculture, with significant areas of natural vegetation, 311-Broad-leaved forest.
Habitat type Comparison U stat U' stat p value n
112 Burrows with cubs - Burrows with no cubs 7,000 17,000 0,355 11
Burrows with cubs - random 1 31,000 33,000 0,957 16
Burrows with cubs - random 2 32,000 32,000 0,957 16
Burrows with cubs - random 3 24,000 40,000 0,423 16
Burrows with cubs - random 4 28,000 36,000 0,700 16
Burrows with cubs - random 5 31,000 33,000 0,957 16
211 Burrows with cubs - Burrows with no cubs 11,000 13,000 0,921 11
Burrows with cubs - random 1 23,000 41,000 0,382 16
Burrows with cubs - random 2 21,000 43,000 0,279 16
Burrows with cubs - random 3 21,000 43,000 0,279 16
Burrows with cubs - random 4 24,000 40,000 0,442 16
Burrows with cubs - random 5 7,000 57,000 0,007 16
231 Burrows with cubs - Burrows with no cubs 6,000 18,000 0,279 11
Burrows with cubs - random 1 23,500 40,500 0,400 16
Burrows with cubs - random 2 26,500 37,500 0,598 16
Burrows with cubs - random 3 29,500 34,500 0,833 16
Burrows with cubs - random 4 29,500 34,500 0,833 16
Burrows with cubs - random 5 23,000 41,000 0,371 16
243 Burrows with cubs - Burrows with no cubs 0,000 0,000 0,000 11
Burrows with cubs - random 1 29,000 35,000 0,783 16
Burrows with cubs - random 2 0,000 0,000 0,000 16
Burrows with cubs - random 3 0,000 0,000 0,000 16
Burrows with cubs - random 4 0,000 0,000 0,000 16
Burrows with cubs - random 5 29,000 35,000 0,783 16
311 Burrows with cubs - Burrows with no cubs 6,000 18,000 0,279 11
Burrows with cubs - random 1 32,000 32,000 1,000 16
Burrows with cubs - random 2 29,000 35,000 0,798 16
Burrows with cubs - random 3 30,000 34,000 0,879 16
Burrows with cubs - random 4 32,000 32,000 1,000 16
Burrows with cubs - random 5 30,000 34,000 0,879 16
Table A2. The results of Mann-Whitney U-test in case of Darány study area. Legend: 211-Non-irrigated arable land, 231-Pastures, 311-Broad-leaved forest, 312-Coniferous forest, 313-Mixed forest, 324-Transitional woodland-shrub, 512-Water bodies.
Habitat type Comparison U stat U' stat p value n
211 Burrows with cubs - Burrows with no cubs 24,500 25,500 1,000 15
Burrows with cubs - random 1 4,500 20,500 0,116 10
Burrows with cubs - random 2 11,000 14,000 0,828 10
Burrows with cubs - random 3 11,000 14,000 0,828 10
Burrows with cubs - random 4 11,000 14,000 0,828 10
Burrows with cubs - random 5 11,000 14,000 0,828 10
231 Burrows with cubs - Burrows with no cubs 0,000 0,000 0,000 15
Burrows with cubs - random 1 0,000 0,000 0,000 10
Burrows with cubs - random 2 0,000 0,000 0,000 10
Burrows with cubs - random 3 0,000 0,000 0,000 10
Burrows with cubs - random 4 0,000 0,000 0,000 10
Burrows with cubs - random 5 0,000 0,000 0,000 10
311 Burrows with cubs - Burrows with no cubs 18,000 32,000 0,440 15
Burrows with cubs - random 1 5,000 20,000 0,151 10
Burrows with cubs - random 2 3,000 22,000 0,056 10
Burrows with cubs - random 3 12,000 13,000 1,000 10
Burrows with cubs - random 4 12,000 13,000 1,000 10
Burrows with cubs - random 5 9,000 16,000 0,548 10
312 Burrows with cubs - Burrows with no cubs 0,000 0,000 0,000 15
Burrows with cubs - random 1 0,000 0,000 0,000 10
Burrows with cubs - random 2 0,000 0,000 0,000 10
Burrows with cubs - random 3 0,000 0,000 0,000 10
Burrows with cubs - random 4 0,000 0,000 0,000 10
Burrows with cubs - random 5 0,000 0,000 0,000 10
313 Burrows with cubs - Burrows with no cubs 25,000 25,000 1,000 15
Burrows with cubs - random 1 2,000 23,000 0,032 10
Burrows with cubs - random 2 1,000 24,000 0,016 10
Burrows with cubs - random 3 11,000 14,000 0,841 10
Burrows with cubs - random 4 8,000 17,000 0,421 10
Burrows with cubs - random 5 8,000 17,000 0,421 10
324 Burrows with cubs - Burrows with no cubs 0,000 0,000 0,000 15
Burrows with cubs - random 1 0,000 0,000 0,000 10
Burrows with cubs - random 2 0,000 0,000 0,000 10
Burrows with cubs - random 3 0,000 0,000 0,000 10
Burrows with cubs - random 4 0,000 0,000 0,000 10
Burrows with cubs - random 5 0,000 0,000 0,000 10
512 Burrows with cubs - Burrows with no cubs 9,000 16,000 0,521 15
Burrows with cubs - random 1 9,000 16,000 0,521 10
Burrows with cubs - random 2 7,000 18,000 0,284 10
Burrows with cubs - random 3 6,000 19,000 0,199 10
Burrows with cubs - random 4 9,000 16,000 0,521 10
Burrows with cubs - random 5 10,000 15,000 0,674 10
Table A3. The results of descriptive statistics in hectare in case of Drávaszentes study area Legend: 112-Discontinuous urban fabric, 211-Non-irrigated arable land, 231-Pastures, 243-Land principally occupied by agriculture, with significant areas of natural vegetation, 311-Broad-leaved forest.
Category Habitat type MIN Q1 MED Q3 MAX
Burrows with cubs 112 0,00 0,00 0,00 1,56 22,11
211 5,55 8,87 18,42 21,44 37,77
231 0,00 0,00 4,62 12,94 23,82
243 0,00 0,00 0,00 0,27 3,76
311 7,58 11,36 18,43 26,00 42,06
Burrows with no cubs 112 0,00 3,16 6,32 6,65 6,98
211 14,78 16,91 19,03 19,56 20,09
231 13,79 16,19 18,58 18,97 19,35
243 0,00 0,00 0,00 0,00 0,00
311 3,79 7,44 11,09 13,98 16,87
random 1 112 0,00 0,00 0,00 0,00 2,57
211 0,00 0,00 8,70 8,97 11,64
231 0,00 0,00 4,07 15,66 20,12
243 0,00 0,00 0,00 0,00 0,00
311 4,09 4,09 14,95 17,25 21,51
random2 112 0,00 0,00 0,00 2,05 11,92
211 0,00 2,54 9,19 21,96 30,28
231 0,00 0,00 10,36 18,01 36,74
243 0,00 0,00 0,00 0,00 0,00
311 1,39 16,87 21,00 31,56 45,53
random 3 112 0,00 0,00 3,84 8,32 13,51
211 0,00 0,32 9,72 17,91 43,72
231 0,00 0,00 4,99 14,11 18,51
243 0,00 0,00 0,00 0,00 0,00
311 0,00 10,18 19,80 29,25 50,22
random 4 112 0,00 0,00 0,00 0,00 14,78
211 0,00 0,90 12,92 20,12 48,92
231 0,00 0,00 8,20 18,62 28,89
243 0,00 0,00 0,00 0,00 0,00
311 1,30 7,86 20,35 39,85 49,04
random 5 112 0,00 0,00 0,00 0,92 17,63
211 0,00 0,00 0,64 3,12 27,23
231 0,00 0,86 15,39 36,75 46,52
243 0,00 0,00 0,00 0,00 4,89
311 0,04 8,39 16,14 44,99 49,47
Table A4. The results of descriptive statistics in hectare in case of Darány study area. Legend: 211-Non-irrigated arable land, 231-Pastures, 311-Broad-leaved forest, 312-Coniferous forest, 313-Mixed forest, 324-Transitional woodland-shrub, 512-Water bodies.
Category Habitat type MIN Q1 MED Q3 MAX
Burrows with cubs 211 0,00 0,00 0,00 0,09 8,12
311 9,56 10,02 19,58 25,38 27,70
312 0,00 0,00 0,00 0,00 0,00
313 14,39 18,88 23,61 32,45 40,66
512 0,00 0,00 5,97 7,04 7,66
Burrows with no cubs 211 0,00 0,00 0,00 4,78 23,10
311 1,54 6,75 15,03 23,40 30,15
312 0,00 0,00 0,00 0,00 25,37
313 0,00 16,35 24,33 36,74 48,46
512 0,00 0,00 0,11 1,69 6,21
random 1 211 0,00 0,49 17,34 20,10 23,80
231 0,00 0,00 0,00 0,00 0,23
311 16,65 24,45 28,45 28,77 30,11
312 0,00 0,00 0,00 0,00 0,00
313 0,00 8,43 9,53 11,95 20,96
512 0,00 0,00 0,00 0,00 9,82
random2 211 0,00 0,00 0,00 0,00 32,57
231 0,00 0,00 0,00 0,00 7,30
311 10,36 29,10 31,24 34,94 41,73
312 0,00 0,00 0,00 3,51 12,19
313 0,00 0,00 8,49 9,17 15,84
324 0,00 0,00 0,00 1,77 6,12
512 0,00 0,00 0,00 0,00 6,80
random 3 211 0,00 0,00 0,00 0,00 29,80
231 0,00 0,00 0,00 0,00 1,66
311 7,38 10,38 14,09 27,33 43,76
312 0,00 0,00 0,00 0,00 0,11
313 4,67 6,35 22,89 39,11 42,83
324 0,00 0,00 0,00 0,00 0,00
512 0,00 0,00 0,00 0,00 0,73
random 4 211 0,00 0,00 0,00 0,00 11,23
231 0,00 0,00 0,00 0,00 0,00
311 1,35 11,60 21,62 24,53 35,37
312 0,00 0,00 0,00 0,00 36,81
313 12,04 14,46 14,84 27,29 27,29
324 0,00 0,00 0,00 0,00 0,01
512 0,00 0,00 0,00 0,00 11,33
random 5 211 0,00 0,00 0,00 0,00 12,38
231 0,00 0,00 0,00 0,00 0,00
311 11,46 16,60 23,95 25,43 43,31
312 0,00 0,00 0,00 0,00 0,46
313 0,00 13,89 14,95 26,98 33,62
324 0,00 0,00 0,00 0,00 0,00
512 0,00 0,00 6,91 9,38 11,79

References

  1. Prugh, Laura; Stoner, Chantal; Epps, Clinton; Bean, William; Ripple, William; Laliberte, Andrea; Brashares, Justin. The Rise of the Mesopredator. Aspen Bibliography 2009. [Google Scholar] [CrossRef]
  2. Roemer, Gary W.; Gompper, Matthew E.; Van Valkenburgh, Blaire. The Ecological Role of the Mammalian Mesocarnivore. BioScience 2009, Volume 59(Issue 2), Pages 165–173. [Google Scholar] [CrossRef]
  3. Ritchie, Euan; Johnson, Christopher. Predator interactions, mesopredator release and biodiversity conservation. Ecology letters 2009, 12, 982–98. [Google Scholar] [CrossRef]
  4. Csányi, S.; Márton, M.; Bőti, Sz.; Schally, G. Vadgazdálkodási Adattár - 2024/2025. vadászati év; MATE VTI, Országos Vadgazdálkodási Adattár: Gödöllő, 2025; p. 70. [Google Scholar]
  5. Available online: https://jogkodex.hu/jsz/2001_90_fvm_rendelet_9682074 (accessed on 20 December 2025).
  6. Heltai, M.; Torbó, L.T.; Lanszki, J.; Szabó, L. Az aranysakál (Canis aureus L. 1758) állománynagyságának vizsgálata közvetlen megfigyelések alapján. Tájökológiai Lapok 2012, 10(2), 405–411. [Google Scholar] [CrossRef]
  7. Lanszki, J.; Heltai, M.; Heltai, M. 2010: Eurázsiai borz (Meles meles Linnaeus, 1758). In Emlős ragadozók Magyarországon; Mezőgazda Kiadó: Budapest, 2010; pp. 67–72. [Google Scholar]
  8. Bijl, H; Schally, G; Márton, M; Heltai, M; Csányi, S. From invaders to residents: The golden jackal (Canis aureus) expansion in Hungary since the mid-1990s. PLOS ONE 2024, 19(7), e0306489. [Google Scholar] [CrossRef]
  9. Rakonczay Z. (szerk.) 1989: Vörös Könyv. Akadémiai Kiadó, Budapest.
  10. Szabó, L.; Heltai, M.; Szűcs, E.; Lanszki, J.; Lehoczki, R. Expansion range of golden jackal in Hungary between 1997 and 2006. Mammalia 2009, 73, 307–311. [Google Scholar] [CrossRef]
  11. Heltai, M.; Bíró, Zs.; Szemethy, L. : A borz terjeszkedése Magyarországon 1988 és 2000 között. Vadbiológia 2001, 8, 43–48. [Google Scholar]
  12. Takács, A.; Szemethy, L.; Takács, A. A.; Takács, P. T.; Heltai, M. Adatok az eurázsiai borz (Meles meles) parazitákkal való fertőzöttségéről Magyarországon. Magyar Állatorvosok Lapja 2012, 134(2), 106–110. [Google Scholar]
  13. Csányi, S. (2007): Vadbiológia. Budapest: Mezőgazda Kiadó, 135 p.
  14. Leopold, A. (Szerk.) (1933): Game management. New York: C. Scribner’s Sons, 481 p.
  15. Heltai, M. 2016: Ragadozóemlős-fajok monitorozási módszereinek fejlesztése, és a tudatos ragadozó-gazdálkodás megalapozása az aranysakál, az eurázsiai borz és a vörös róka esetében. Akadémiai nagydoktori mű, Szent István Egyetem.
  16. Meia, J. S.; Weber, J. M. Characteristics and distribution of breeding dens of the red fox (Vulpes vulpes) in a mountainous habitat. Mammalian Biology 1992, 57, 137–143. [Google Scholar]
  17. Goszczyński, J.; Wójtowicz, I. Annual dynamics of den use by red foxes Vulpes vulpes and badgers Meles meles in central Poland. Acta theriologica 2001, 46(4), 407–417. [Google Scholar] [CrossRef]
  18. Márton, M. Az európai borz és a vörös róka kotorékhely-kompetenciójának vizsgálata különböző terepbiológiai módszerekkel. Doktori dolgozat (Phd), Szent István Egyetem, Vadbiológiai és Vadgazdálkodási Tanszék, Gödöllő, 2018; p. 104. [Google Scholar]
  19. Heltai M. (Szerk.) (2010): Emlős ragadozók Magyarországon. Budapest: Mezőgazda Kiadó, 240 p.
  20. Jensen, P. Lidt om gravlingen. Naturens Verden 1959, 11, 289–320. [Google Scholar]
  21. Kruuk H. (Szerk.) (1989): The social badger. Oxford: Oxford University Press, 155 p.
  22. Neal E., Cheeseman C. (Szerk.) (1996): Badgers. London: T and AD Poyser Ltd., 271 p.
  23. Bang, P.; Dahlström, P. Állatnyomok és -jelek; M-érték Kiadó Kft.: Budapest, 2006; p. 264. [Google Scholar]
  24. Delahay, R. J.; Ward, A. I.; Walker, N.; Long, B.; Cheeseman, C. L. : Distribution of badger latrines in a high-density population: habitat selection and implications for the transmission of bovine tuberculosis to cattle. Journal of Zoology 2007, 272(3), 311–320. [Google Scholar] [CrossRef]
  25. Trolliet, Franck; Huynen, Marie-Claude; Vermeulen, Cédric; Hambuckers, Alain. Use of camera traps for wildlife studies. A review. Biology Agriculture Science Environnement 2014, 18, 446–454. [Google Scholar]
  26. Márton, M.; Markolt, F.; Szabó, L.; Heltai, M. Niche segregation between two medium-sized carnivores in a hilly area of Hungary. Annales Zoologici Fennici 2014, Vol. 51(No. 5), 423–432. [Google Scholar] [CrossRef]
  27. Kosztra, B.; Büttner, G.; Hazeu, G.; Arnold, S. (2017): Updated CLC illustrated nomenclature guidelines. European Topic Centre on Urban, land and soil systems; ETC/ULS. ETC/ULS.
  28. Judge, J.; Wilson, G.; Macarthur, R.; et al. Density and abundance of badger social groups in England and Wales in 2011–2013. Sci Rep 2014, 4, 3809. [Google Scholar] [CrossRef] [PubMed]
  29. Reid, Neil; Etherington, Thomas; Wilson, Gavin; Montgomery, Ian; Mcdonald, Robbie; Ian, W. Monitoring and population estimation of the European badger Meles meles in Northern Ireland. Wildlife Biology 2011, 18, 46–57. [Google Scholar] [CrossRef]
  30. Kowalczyk, Rafał; BUNEVICH, Aleksei; Jedrzejewska, Bogumila. Badger density and distribution of setts in Bialowieza Primeval Forest (Poland & Belrus) compared to other Eurasian populations. Acta Theriologica 2000, 45. [Google Scholar] [CrossRef]
  31. Silva, M.; Rosalino, L.M.; Alcobia, S.; Santos-Reis, M. Sett Use, Density and Breeding Phenology of Badgers in Mediterranean Agro-Sylvo-Pastoral Systems. Animals 2021, 11, 2663. [Google Scholar] [CrossRef]
  32. Rigaux, Pierre; Chanu, Cedric. Eurasian Badger (Meles meles) density and setts distribution in a rural landscape of Massif Central (Puy-de-Dome, France). Revue d Ecologie 2012, 67, 339–347. [Google Scholar]
  33. Kozák, L.; Heltai, M. (2006): Distribution and habitat selection of badgers in the region of Erdőspuszták (Eastern Hungary). Anale Universitatii din Oradea, Fascicula Biologie, Tom. XIII. 48-51 p.
  34. Brochier, B. Emplacement et densite des terriers de mise-bas du renard roux (Vulpes vulpesL.) en peripherie bruxelloise. Cahiers d'Ethologie appliquee 1989, 9, 495–508. [Google Scholar]
  35. Alberto, Meriggi; Paola, Rosa. Factors affecting the distribution of fox dens in northern Italy / Fattori influenzanti la distribuzione delle tane di volpe ( Vulpes vulpes ) in Italia settentrionale. Hystrix: the Italian Journal of Mammalogy 1991, 3. [Google Scholar] [CrossRef]
  36. Zaman, M. Den-site selection at multiple scales by the red fox (Vulpes vulpes subsp. montana) in apatchy human-dominated landscape. Global Ecology and Conservation. [CrossRef]
  37. Márton, Mihály & Markolt, Ferenc & Szabo, Laszlo & Heltai, Miklós. (2013). BURROW DENSITIES OF EURASIAN BADGER (MELES MELES) AND RED FOX (VULPES VULPES) IN BÖRZSÖNY MOUNTAINS. 2.
  38. acquier, M.; Vandel, JM.; Léger, F.; et al. Breaking down population density into different components to better understand its spatial variation. BMC Ecol Evo 2021, 21, 82. [Google Scholar] [CrossRef]
  39. Rosalino, L. M.; Macdonald, D. W.; Santos-Reis, M. : Spatial Structure And Land-Cover Use In A Low-Density Mediterranean Population Of Eurasian Badgers. Canadian Journal Of Zoology;P 2004, 82(9), 1493–1502. [Google Scholar] [CrossRef]
  40. Revilla, Eloy; Delibes, Miguel; Travaini, A.; Palomares, F. Physical and population parameters of Eurasian badgers (Meles meles L.) from Mediterranean Spain. Zeitschrift Fur Saugetierkunde-International Journal of Mammalian Biology 1999, 64, 269–276. [Google Scholar]
  41. Acevedo, Pelayo; González-Quirós, Pablo; Prieto, José M.; Etherington, Thomas R.; Gortázar, Christian; Balseiro, Ana. Generalizing and transferring spatial models: A case study to predict Eurasian badger abundance in Atlantic Spain. Ecological Modelling 2014, Volume 275, Pages 1–8. [Google Scholar] [CrossRef]
  42. Kauhala, Kaarina; Holmala, Katja; Lammers, Wiebke; Schregel, Julia. Home ranges and densities of medium-sized carnivores in south-east Finland, with special reference to rabies spread. Acta theriologica 2006, 51, 1–13. [Google Scholar] [CrossRef]
  43. Lindsø, L. K.; Dupont, P.; Rød-Eriksen, L.; Andersskog, I. P. Ø.; Ulvund, K. R.; Flagstad, Ø.; Bischof, R.; Eide, N. E. Estimating red fox density using non-invasive genetic sampling and spatial capture–recapture modelling. Oecologia 2022, 198(1), 139–151. [Google Scholar] [CrossRef] [PubMed]
  44. Panek, M.; Bresiński, W. Red fox Vulpes vulpes density and habitat use in a rural area of western Poland in the end of 1990s, compared with the turn of 1970s. Acta Theriologica 2002, 47(4), 433–442. [Google Scholar] [CrossRef]
  45. Selonen, V.; Brommer, J. E.; Klangwald, C.; Laaksonen, T. Successful invasion: camera trap distance sampling reveals higher density for invasive raccoon dog compared to native mesopredators . Biological Invasions 2024, 26, 1–10. [Google Scholar] [CrossRef]
  46. Sarmento, P.; Cruz, J.; Eira, C.; Fonseca, C. Evaluation of camera trapping for estimating red fox abundance . Journal of Wildlife Management 2009, 73(7), 1207–1212. [Google Scholar] [CrossRef]
  47. Banea, O. C.; Krofel, M.; Červinka, J.; Gargarea, P.; Szabó, L. New records, first estimates of densities and questions of applied ecology for jackals in Danube Delta Biosphere Reserve and hunting terrains from Romania . Acta Zoologica Bulgarica 2012, 64(4), 353–366. [Google Scholar]
  48. Singh, A; Mukherjee, A; Dookia, S; Kumara, HN. High resource availability and lack ofcompetition have increased population of a meso-carnivore. A case study of Golden Jackal in Keoladeo National Park, India. Mamm Res 2016, 61, 209–219. [Google Scholar] [CrossRef]
  49. Selimovic, A.; Schöll, E.M.; Bosseler, L.; et al. Habitat use of golden jackals (Canis aureus) in riverine areas of northern Bosnia and Herzegovina. Eur J Wildl Res 2021, 67, 14. [Google Scholar] [CrossRef]
  50. Krofel, Miha. Survey of golden jackals (Canis aureus L.) in Northern Dalmatia, Croatia: Preliminary results. Natura Croatica 2008, 17, 259–264. [Google Scholar]
  51. Krofel, M. Confirmed presence of territorial groups of golden jackals (Canis aureus) in Slovenia. Nat. Slo 2009, 11(1), 65–68. [Google Scholar] [CrossRef]
  52. Trbojević, Igor; Trbojević, Tijana; Malešević, Danijela; Krofel, Miha. The golden jackal (Canis aureus) in Bosnia and Herzegovina: density of territorial groups, population trend and distribution range. Mammal Research 2018, 63, 341–348. [Google Scholar] [CrossRef]
  53. Krauze-Gryz, D.; Gryz, J. Den-Dwelling Carnivores in Central Poland: Long-Term Trends in Abundance and Productivity. Diversity 2023, 15, 32. [Google Scholar] [CrossRef]
  54. Nowakowski, K; Ważna, A; Kurek, P; Cichocki, J; Gabryś, G. Reproduction success in European badgers, red foxes and raccoon dogs in relation to sett cohabitation. PLOS ONE 2020, 15(8), e0237642. [Google Scholar] [CrossRef]
  55. Biancardi, Carlo; Rigo, Valentina; Azzolini, Sonia; Gnoli, Claudio. Eurasian badger (meles meles) habitat and sett site selection in the northern Apennines. Natural History Sciences 2014, 1, 41. [Google Scholar] [CrossRef]
  56. Rosalino, L. M.; Macdonald, D. W.; Santos-Reis, M. : Spatial structure and land-cover use in a low-density Mediterranean population of Eurasian badgers. Canadian Journal of Zoology 2004, 82(9), 1493–1502. [Google Scholar] [CrossRef]
  57. Good, T. C.; Hindenlang, K.; Imfeld, S. A habitat analysis of badger (Meles meles L.) setts in a seminatural forest. Mammalian Biology 2001, 66, 204–214. [Google Scholar]
  58. Balestrieri, A.; Remonti, L.; Prigioni, C. Habitat selection in a low-density badger Meles meles popula-tion: a comparison of radio-tracking and latrine sur-veys. Wildlife Biology 2009, 15, 442–448. [Google Scholar] [CrossRef]
  59. Myslajek, R.; Nowak, S.; Jedrzejewska, B. Distribution, characteristics and use of shelters by the Eurasian badger Meles meles along an altitudinal gradient in the Western Carpathians, S Poland. Folia Zoologica 2012, 61, 152–160. [Google Scholar] [CrossRef]
  60. Do Linh San, E.; Ferrari, N.; Weber, J. M. : Socio-Spatial Organization Of Eurasian Badgers (Meles Meles) In A Low-Density Population Of Central Europe. Canadian Journal Of Zoology;P 2007, 85(9), 973–984. [Google Scholar] [CrossRef]
  61. Lara-Romero, C.; Virgós, E.; Escribano-Ávila, G.; Mangas, J. G.; Barja, I.; Pardavila, X. : Habitat Selection By European Badgers In Mediterranean Semiarid Ecosystems. Journal Of Arid Environments 2012, 76, 43–48. [Google Scholar] [CrossRef]
  62. Apeldoorn, *!!! REPLACE !!!*; Vink, J.; Matyastik, Tomas. Dynamics of a local badger (Meles meles) population in the Netherlands over the years 1983-2001. Mammalian Biology - Zeitschrift für Säugetierkunde 2006, 71, 71. [Google Scholar] [CrossRef]
  63. Virgós, E.; Casanovas, J. G. Badger Meles Meles Sett Site Selection In Low Density Mediterranean Areas Of Central Spain. Acta Theriologica 1999, 44(2), 173–182. [Google Scholar] [CrossRef]
Figure 1. The study area in Drávaszentes and the habitat categories.
Preprints 191369 g001
Figure 2. The study area in Darány and the habitat categories.
Preprints 191369 g002
Figure 3. The location of burrows found in the Drávaszentes study area.
Preprints 191369 g003
Figure 4. The location of burrows found in the Darány study area.
Preprints 191369 g004
Figure 5. European badger and red fox reproduction results at Drávaszentes study area.
Preprints 191369 g005
Figure 6. European badger and golden jackal reproduction results at Darány study area.
Preprints 191369 g006
Table 1. Summary of the literature used to describe the burrow density of European badger.
Country Density (burrow/100 ha) Reference
Hungary (Drávaszentes) 1.05 present study
Hungary (Darány) 1.43 present study
England and Wales 0.49 [28]
Northern Ireland 0.56 [29]
Poland / Belarus 0,22 [30]
Portugal 1.05 [31]
France 0,45 [32]
Hungary 1,07 [33]
Hungary (survey) 0.32 [33]
Table 2. Summary of the literature used to describe the burrow density of red fox.
Country Density (burrow/100 ha) Reference
Hungary (Drávaszentes) 0.38 present study
Hungary (Darány) 0 present study
Switzerland 0.33 [16]
Belgium 1 [34]
Italy 0.67 - average [35]
Pakistan 1.3 [36]
Hungary (Bakony) 3.66 [37]
Hungary (Börzsöny) 4.08 [37]
Table 3. Summary of the literature used to describe the individual density of European badger.
Country Density (individual/100 ha) Reference
Hungary (Drávaszentes) 1.44 present study
Hungary (Darány) 2.24 present study
France 3.84 [38]
Portugal 0.45 [39]
Spain (Coto del Rey) 0.67 [40]
Spain (Reserva Biologica)
Spain
0.23
3.81
[40]
[41]

Finland
2002 - 0.21
2003 - 0.26

[42]
Table 4. Summary of the literature used to describe the individual density of red fox.
Country Density (individual/100 ha) Reference
Hungary (Drávaszentes) 0.48 present study
Hungary (Darány) 0 present study

Norway (Central)
0.04 in 2016
0.10 in 2017
0.06 in 2018

[43]

Norway (Southern)
0.16 in 2017
0.09 in 2018

[43]

Poland (Western)
1.02 in the spring
1. 63 in early winter
[44]
(spotlight count method)

Poland (Western)

1.26 in winter
[44]
(track count method)
Finland (South) 0.6 [45]
Portugal (Central-East) 0.61 [46]
Table 5. Summary of the literature used to describe the litter size of European badger.
Country Number of cubs per burrow Reference
Hungary (Drávaszentes) 1.13 present study
Hungary (Darány) 1.6 present study
England 2.4 [22]
Portugal 1.8 [31]
Poland (Central) 2.7 [53]
Poland (West) 1.7 [54]
Table 6. Summary of the literature used to describe the litter size of red fox.
Country Number of cubs per burrow Reference
Hungary (Drávaszentes) 2.33 present study
Hungary (Darány) 0 present study
Poland (West) 2.4 [54]
Poland (Central) 3.5 [53]
Disclaimer/Publisher’s Note: The statements, opinions and data contained in all publications are solely those of the individual author(s) and contributor(s) and not of MDPI and/or the editor(s). MDPI and/or the editor(s) disclaim responsibility for any injury to people or property resulting from any ideas, methods, instructions or products referred to in the content.
Copyright: This open access article is published under a Creative Commons CC BY 4.0 license, which permit the free download, distribution, and reuse, provided that the author and preprint are cited in any reuse.
Prerpints.org logo

Preprints.org is a free preprint server supported by MDPI in Basel, Switzerland.

Subscribe

Disclaimer

Terms of Use

Privacy Policy

Privacy Settings

© 2026 MDPI (Basel, Switzerland) unless otherwise stated