Submitted:
24 December 2025
Posted:
25 December 2025
You are already at the latest version
Abstract
Lycium barbarum L. is widely used medicinal and edible Chinese medicinal materials. However, with consumers' heightened concern for health and food safety, pesticide residues have become one of the major challenges affecting its’ quality and safety. cyhalothrin is a pyrethroid insecticide, and is a typical type of pesticide with excessive pesticide residues in Lycium barbarum L. Rapid detection of pesticide residues is an effective way to ensure the quality and safety of traditional Chinese medicinal materials. In this work, a molecularly imprinted polymer electrochemiluminescence (ECL) sensor based on AuNPs@Ru-ZIF8 was constructed for cyhalothrin residues rapid detection. The prepared cyhalothrin molecularly imprinted polymer (MIPs) was used as a recognition element and modified onto the surface of GCE by electrochemical polymerization method. Gold nanoparticle (AuNPs) were utilized to promote the excitation of Ru(bpy)32+ and TPrA in the ECL system, which improved the observability of the light signal. The glassy carbon electrode(GCE) modified with the Metal Organic Frameworks ZIF8 was utilized to increase the specific surface area and thus improve the sensitivity of the sensor. In addition, the luminescent reagent Ru(bpy)32+ was introduced into the synthesis process of ZIF8, which caused Ru(bpy)32+ to be tightly bound around it and enhanced the stability of the sensor. Under optimal conditions, the linear detection range of the sensor is 1 × 10⁻¹~1 × 10⁴ nM, with a minimum detection limit (LOD) of 10 pM. The accuracy of the ECL MIPs sensor has been verified through spiked recovery experiments and actual sample testing. This study has opened up a new approach for rapid detection of pesticide residues in traditional medicinal herbs used for both food and medicine.
Keywords:
molecularly imprinted polymers
; medicinal herbs
; metal-organic frameworks
; electrochemiluminescence
1. Introduction
Lycium barbarum L. is rich in natural active ingredients such as polysaccharides, carotenoids and betaine, and has significant therapeutic effects, high clinical safety, and multi-target health regulation characteristics such as oxidation, immunomodulation and anti-tumor auxiliary effects[1]. In recent years, Lycium barbarum L. has attracted much attention in the domestic and foreign pharmaceutical and health product markets. Studies have confirmed that the compound preparation of Lycium barbarum L. can enhance the immune function of cancer patients through mechanisms such as activate T cells and regulate cytokine secretion and improve chemotherapy tolerance. Its market demand has driven the rapid growth of large-scale planting and export trade in major production areas such as Ningxia and Xinjiang. However, intensive cultivation models have led to a significant increase in the incidence of Lycium barbarum L. pests and diseases, and to ensure yield, growers generally rely on the highly effective insecticide cyanthrin. However, pesticide abuse and lack of supervision have caused the residual amount of cyanthrin in Lycium barbarum L. to exceed the standard[2,3], and it is difficult to completely degrade during processing . These residues can enter the human body through biological enrichment, interfering with neurotransmitter function and increasing the risk of chronic diseases, becoming a key issue restricting the sustainable development of the industry[4,5].
Electrochemiluminescence (ECL) is an analytical technology that triggers chemiluminescence through electrochemical reactions on the surface of the electrode. Its essence is a synergistic process between electron transfer at the electrochemical interface and the energy release of the excited state of the luminescent body[6]. Its core mechanism is: driven by an external potential, luminescent substances (such as metal complexes) fixed on the electrode surface undergo a redox reaction, and a high-energy excited state intermediate is generated through electron transfer; when the excited state molecules relax to the ground state, photons are released to generate detectable optical signals [7,8]. With its wide dynamic response range, extremely low background interference (no exogenous light source) and ultra-high sensitivity (can reach single molecule level), ECL has become a key technology in the fields of environmental pollutant screening, clinical diagnosis and food trace analysis [9]. Among many ECL systems, tri(2,2'-bipyridine)ruthenium(II)(Ru(bpy)₃²⁺) has become the most widely used luminescent material due to its excellent light stability, reversible electrochemical behavior and efficient luminescence quantum yield . To optimize its ECL intensity, it is often necessary to introduce co-reactants (such as triproamine, TPA) to construct an "oxidation-reduction" dual circulation path: TPA generates strong reducing free radicals (TPA*) during anodization, which can reduce the intermediate of Ru(bpy)₃³⁺ to the excited state Ru(bpy)₃²⁺, significantly amplify the luminescent signal [10,11]. Based on this, researchers have developed a variety of ECL sensors driven by Ru(bpy)₃²⁺/TPA collaborative system .
It is worth noting that in recent years, MIPs have been introduced into ECL sensing design as highly specific biometric elements [12]. Such molecules can accurately capture target objects through structural changes, thereby regulating the electron transfer efficiency or steric hindrance effect of the ECL reaction interface, and realize the controllable output of the signal (such as "signal on" or "signal off" mode), greatly expanding the application potential of ECL technology in complex biological sample detection.
The metal organic frame material ZIF-8 (zeolite-type porous crystals constructed with Zn²⁺ coordinated with 2-methylimidazole) has unique advantages in building high sensitivity sensors due to its high specific surface area (~1600 m²/g), adjustable pore size (0.34-1.16 nm) and surface functionalization capabilities [13,14,15]. Its three-dimensional pores can serve as an ideal carrier for molecular recognition sites: through pre-designed ligands or post-modification strategies (such as the introduction of functional groups such as thiol groups and amino groups)[16], ZIF-8 can selectively adsorb targets (such as heavy metal ions, biomarkers or volatile organics), and change the photo/electrochemical response characteristics of the material through host-guest interaction to achieve signal transduction. For example, in the field of electrochemical sensing, electrode materials (ZIF-8/CNTs) constructed in composite with carbon nanotubes can use the following synergistic mechanism to improve detection performance. At the signal amplification level, CNTs accelerate electron transfer, while ZIF-8's high loading enhances redox active site exposure[17,18]. In fluorescence sensing, ZIF-8 coats quantum dots (QDs@ZIF-8) can form a "fluorescence switch" system: when the target object (such as antibiotic residue) enters the ZIF-8 channel, it undergoes electron transfer or energy resonance effects with the surface of the quantum dot, resulting in fluorescence quenching or enhancement, and the detection limit can reach nano-Molar level [19,20].
In this work, first, according to the synthesis path based on ZIF8[21], ECL luminescent substances were added during the synthesis of ZIF8 to effectively avoid the loss of luminescent substances during the detection process. Secondly, the excellent adsorption characteristics of ZIF8 are utilized and AuNPs are encapsulated on the surface of ZIF8, aiming to compensate for the disadvantages of poor conductivity, and the second is to promote the excitation of the ECL luminescent system[22,23]. In addition, the glass carbon electrode is modified by using multi-walled carbon nanotubes, improving the conductivity of the electrode[24]. Molecular imprinted polymers were synthesized using cyanothrin as the template molecule and methacrylic acid as a functional monomer. When the molecularly imprinted polymer specifically recognizes and captures pesticide molecules, the intensity of ECL decreases, accurately measuring the concentration of cyanthrin based on changes in the light signal[25,26,27].
2. Experimental
2.1. .Reagents and Instrument
The reagents and instrument types used during the experiments are given in the Supplementary Material.
2.2. Preparation of AuNPs
The synthesis of gold nanoparticles (AuNPs) was conducted following the sodium citrate reduction method [28] with experimental modifications. Initially, 0.01 g of chloroauric acid trihydrate (HAuCl₄·3H₂O) was dissolved in 100 mL of ultrapure water to prepare a 0.01% (w/v) HAuCl₄ solution. This solution was transferred into a 250 mL sterilized beaker and heated to boiling point under continuous magnetic stirring. Subsequently, 10 mL of 1% (w/v) trisodium citrate solution was rapidly injected into the boiling mixture under vigorous agitation. An immediate chromatic transition from pale yellow to burgundy was observed, indicating the reduction of auric ions to metallic gold nanoparticles. The reaction system maintained thermal agitation for 15 minutes until achieving chromatic stability. Post-heating continuous stirring facilitated cooling to ambient temperature. The resultant AuNPs colloid was quantitatively transferred to a 100 mL volumetric flask and diluted to 50 mL with ultrapure water, designated as Solution A.
2.3. Preparation of AuNPs@Ru-ZIF8
For the synthesis of Ru-incorporated ZIF-8 (Ru-ZIF8) [21], an electrochemical luminescent complex (Ru(bpy)₃Cl₂·6H₂O) was integrated during the solvent-based crystallization process. Solution B was prepared by dissolving 2.97 g zinc nitrate hexahydrate (Zn(NO₃)₂·6H₂O) and 5 mg Ru(bpy)₃Cl₂·6H₂O (hereafter referred to as Ru-complex) in 100 mL methanol. Solution C contained 3.28 g 2-methylimidazole (C₄H₆N₂) dissolved in 100 mL methanol. Under ambient conditions, Solutions A and B were homogeneously mixed under constant magnetic stirring at 600 rpm, followed by rapid injection of 20 mL Solution C. The ternary mixture underwent continuous agitation for 24 h, during which progressive turbidity development signaled ZIF-8 crystal nucleation. After 30 min gravitational sedimentation, phase separation was enhanced through centrifugal processing (10 min at 5000 rpm, 4°C). The pale red precipitate underwent three successive washings with methanol, each followed by centrifugation. The purified product was re-dispersed in 100 mL ultrapure water and stored in light-proof containers under ambient conditions.
2.4. Construction of Electrochemiluminescence Aptasensor
The glassy carbon electrode (GCE) underwent sequential polishing using 0.3 µm and 0.05 µm alumina slurries under mechanical abrasion until achieving a mirror-like surface finish. Post-polishing, the electrode was rigorously rinsed with ultrapure water to eliminate residual alumina particles. Subsequent purification involved sequential immersion in ethanol and deionized water, each subjected to 5-min ultrasonication for organic/ionic contaminant removal, followed by nitrogen stream drying. A homogeneous AuNPs@Ru-ZIF8 composite suspension was prepared through 30-min ultrasonic dispersion, from which 5 mL aliquot was separated. Precise deposition of 5 µL suspension onto the GCE surface yielded an AuNPs@ZIF-8 modified electrode after ambient drying.For molecular imprinting preparation, 4.5 mg cyhalothrin standard was dissolved in 10 mL acetonitrile to formulate 1 mM template solution under continuous magnetic agitation. Sequential addition of 5 mg methacrylic acid (MAA) and 20 mg ethylene glycol dimethacrylate (EGDMA) into the template solution achieved complete monomer dissolution. The polymerization precursor solution underwent 10-min degassing via ultrasonication to remove dissolved oxygen.A three-electrode system was configured with the modified GCE as working electrode, platinum wire as counter electrode, and Ag/AgCl as reference electrode. Electropolymerization was performed through 10 cyclic voltammetric scans (-1.0 V to 1.5 V vs. Ag/AgCl, 50 mV/s scan rate). Post-polymerization, the electrode received thorough ultrapure water rinsing to eliminate unreacted monomers. Template molecule extraction involved triple methanol ultrasonication (10 min per cycle), followed by nitrogen drying. The resultant sensor, designated as ECL-MIPs sensor[6], was stored in light-proof containers under inert atmosphere.
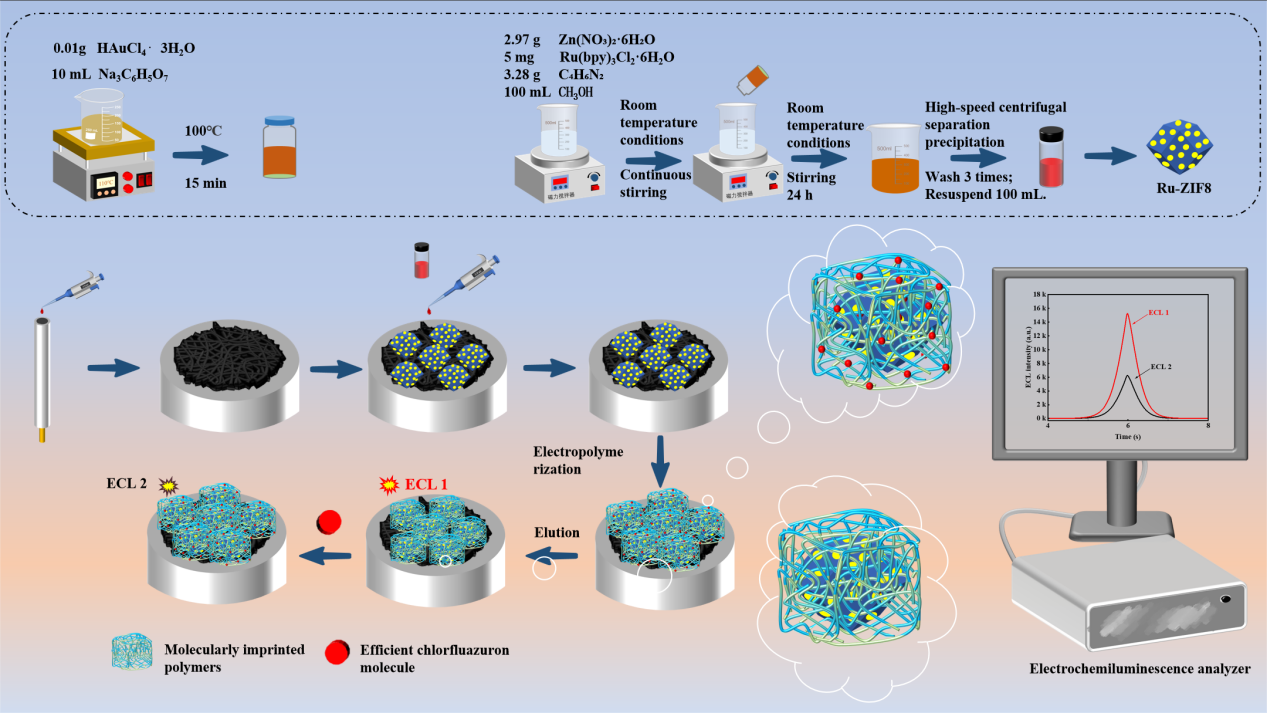
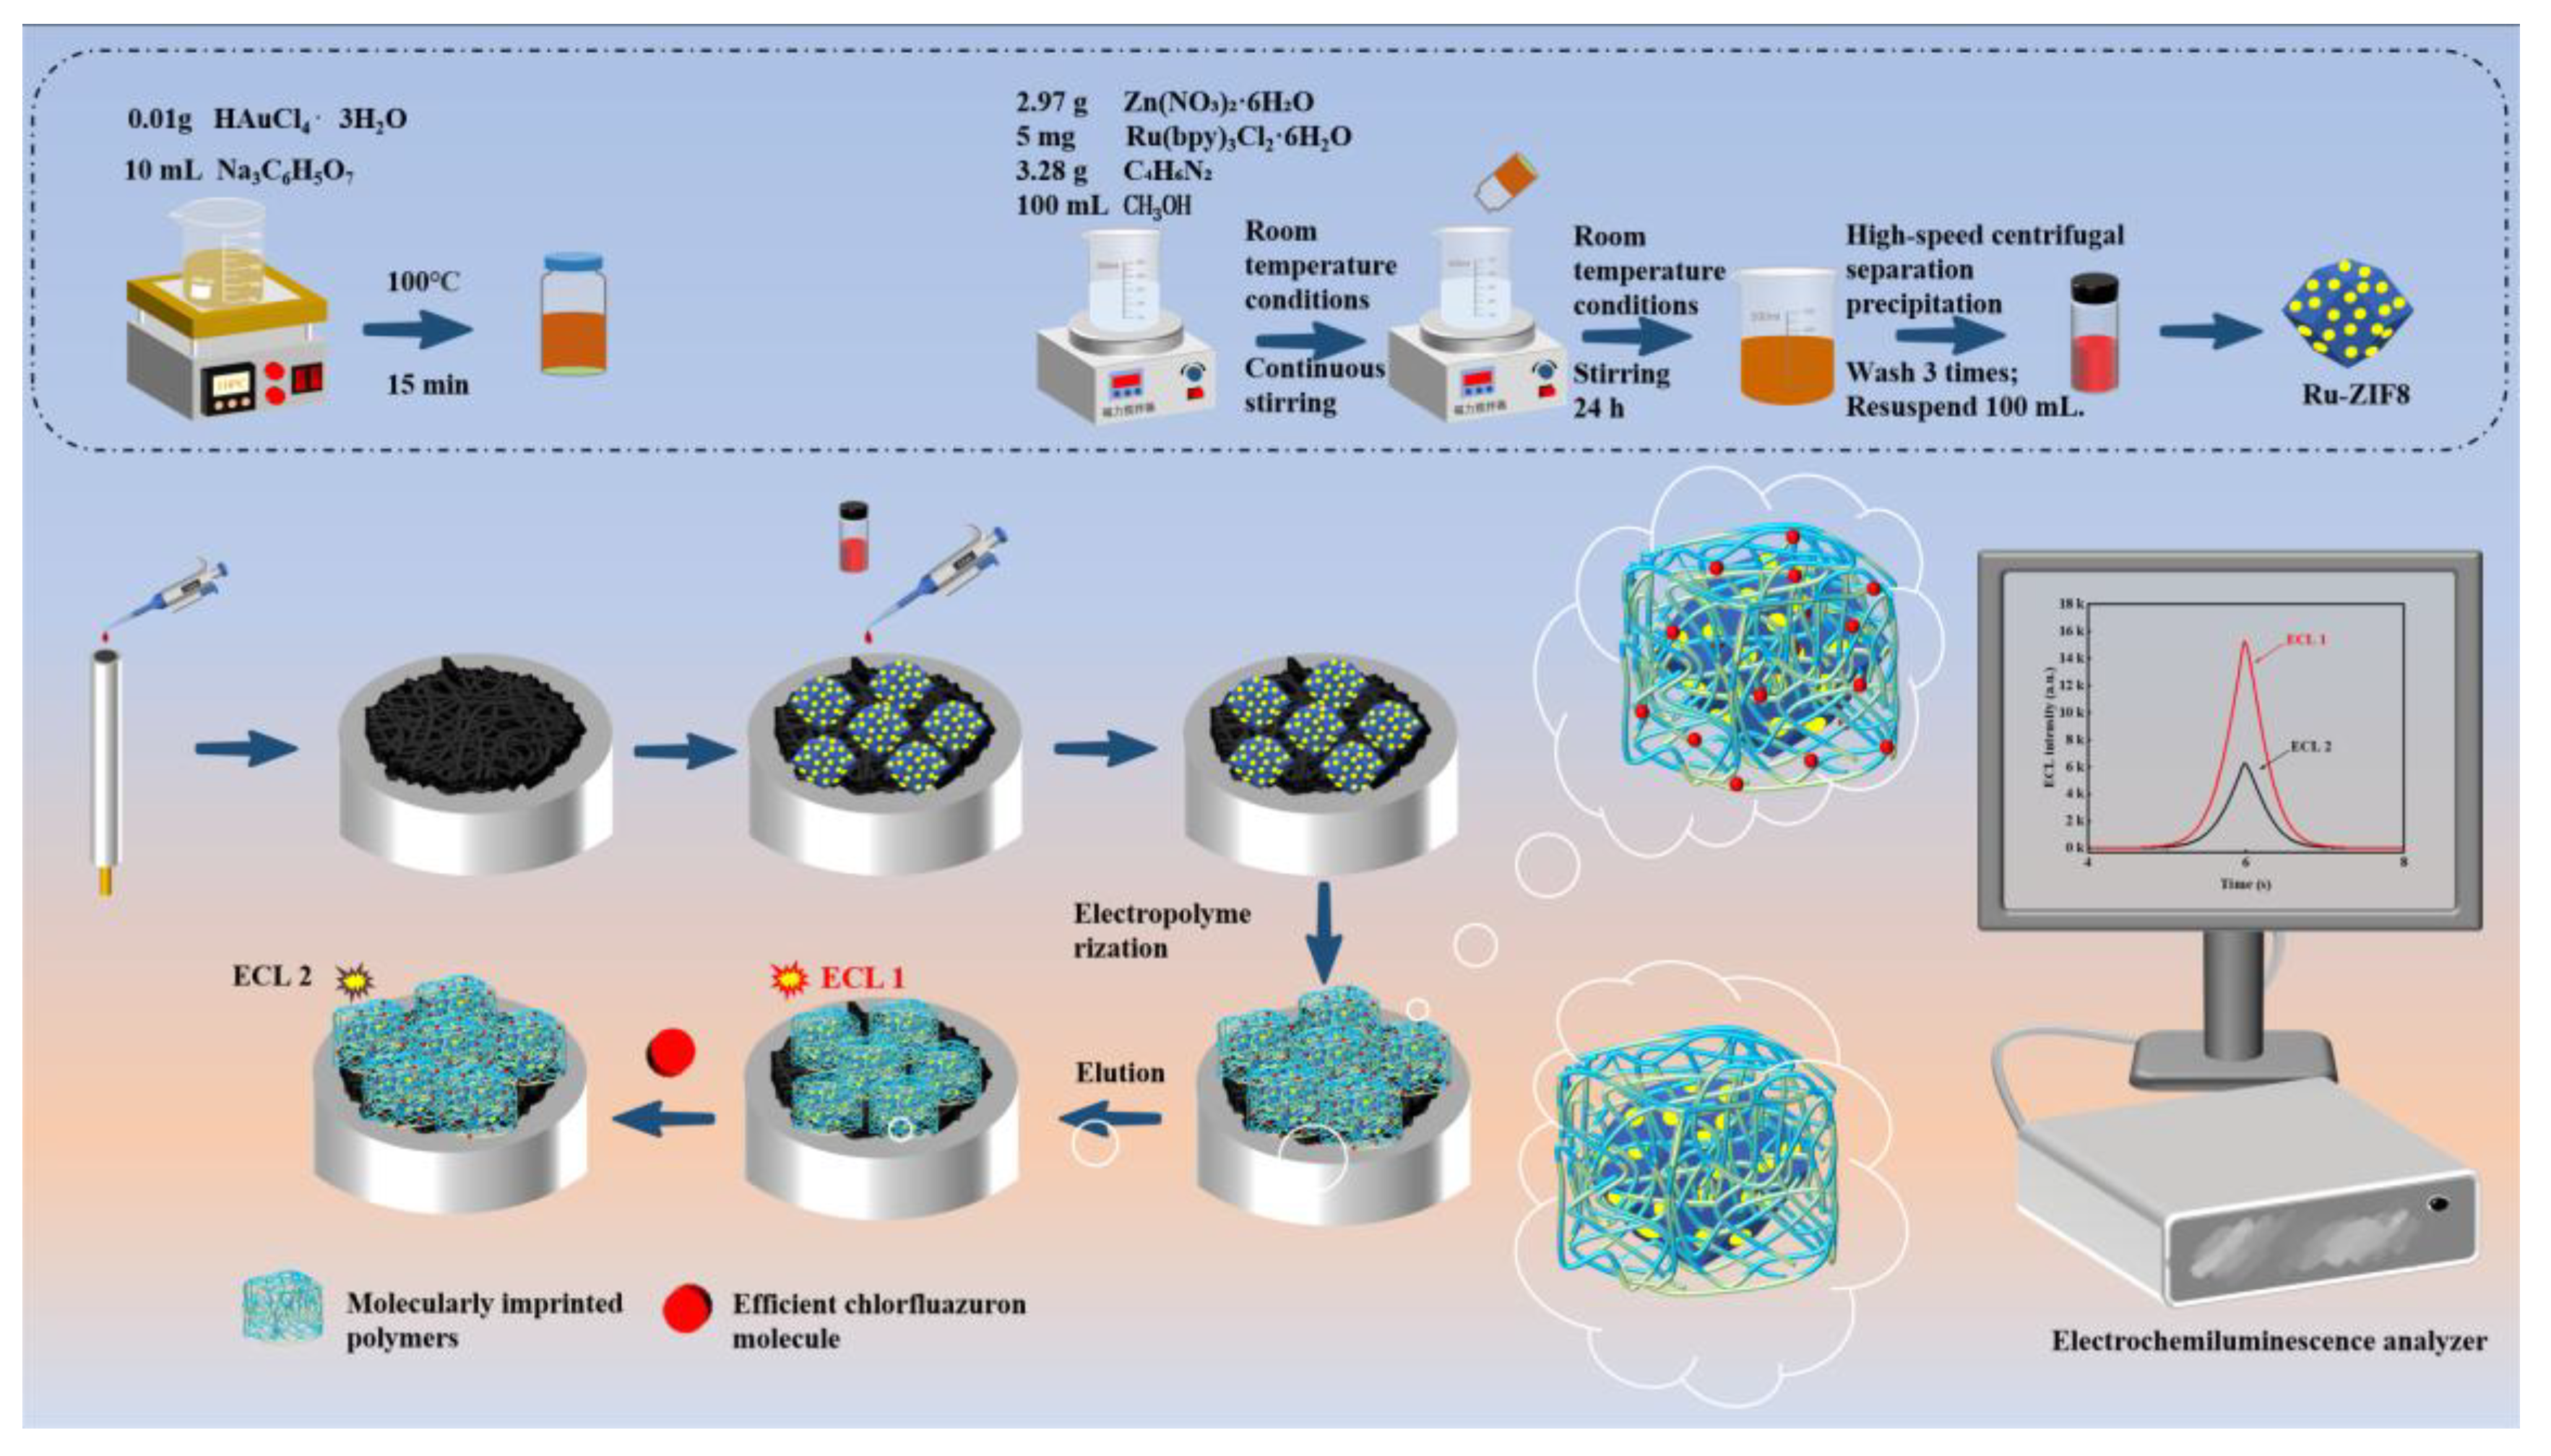
Scheme 1.
Sketch of material synthesis and aptasensor assembly.
2.5. Electrochemiluminescence Measurement
Electrochemical measurements included Cyclic Voltammetry (CV), Differential Pulse Voltammetry (DPV) and Electrogenerated Chemiluminescence (ECL) analysis. CV measurements were performed in the potential range of -0.2 to 0.6 V and at a scan rate of 50 mV s-1. DPV measurements were performed in the potential range of -2 to 0 V with a pulse period of 0.5 s. 0.1 M tri-n-propylamine (TPrA) was added to the PBS solution as a co-reactor of Ru(bpy)32+. The constructed ECL-MIPs sensor was used as the working electrode, the platinum wire electrode was used as the counter electrode, and the Ag/AgCl electrode was used as the reference electrode to construct a three-electrode ECL detection system. The voltage of the electrochemiluminescence workstation was set in the voltage range of -0.2 to 0.6 V. The CV scan was performed at a scanning rate of 50 mV s-1, and the photovoltaic high voltage was set at 600 V. The ECL-MIPs sensor was used as the working electrode.
2.6. Sample Pretreatment
The initial treatment of the sample was carried out first. 5 g of crushed Lycium barbarum was taken, and 50 mL of ultrapure water was added to the sample and extracted by ultrasound at constant temperature for 30 min, and then centrifuged at 5000 rpm for 5 min to obtain the aqueous phase as well as the solid residue. The solid residue was then added with 10 mL of ethyl acetate for the second extraction, and the organic phase was obtained by centrifugation at 5000 rpm for 5 min after 30 min of ultrasonic extraction. The organic phase was transferred to a centrifuge tube containing 50 mg of C18 adsorbent and 150 mg of anhydrous MgSO₄ for dispersive solid-phase extraction.C18 adsorbs volatiles through hydrophobicity, and anhydrous MgSO₄ removes residual water. (vortex shaking for 2 min followed by centrifugation at 5000 rpm for 5 min), and the supernatant was collected. The purified supernatant was concentrated to 5 mL by nitrogen blowing to obtain the Cyhalothrin assay sample, which was preserved. Results and discussions
2.7. Phase and Structure Analysis of Experimental Materials
The morphology of Ru-ZIF8 was observed by scanning electron microscope (SEM) and AuNPs were further observed by transmission electron microscope (TEM).The elemental composition of the materials was analyzed using energy dispersion X-ray spectroscopy (EDS)[29]. Energy dispersion X-ray spectroscopy (EDS) was used to analyze the elemental composition of the materials. The bonding between the physical phases and structures of the synthesized materials was analyzed using X-ray photoelectron spectrum (XPS).
Figure 3. 1 shows the TEM image of AuNPs. Based on the TEM observations, it can be seen that the AuNPs are roughly spherical and dispersed in the field of view. The size distribution of the particles is uneven, and some of the particles have aggregation phenomenon, forming small clusters. The scale bar in the lower right corner of the image is 100 nm, and the size of the particles is estimated to be about 10-20 nm. It can be observed from the image that most of the particles have a more complete morphology, but some of the particles have irregularities at the edges, which may be related to the adsorption of surfactants during the preparation process or defects during the growth of the particles. However, they can be completely used to construct ECL-MIPs sensors.
Figure 3.2 illustrates the SEM images of (A) ZIF8, (B) Ru-ZIF8, and (C) MIPs/AuNPs@Ru-ZIF8, presenting the surface morphology characteristics of the different materials. Figure 3.2 (D), (E), and (F) illustrate the EDS elemental distribution of Zn, Ru, and Au. The EDS images show the distribution of a specific element on the sample surface by means of color coding, where each bright spot represents the location of the detected specific element. Figure 3.2 (A) clearly shows the typical morphology of the ZIF8 material.The ZIF8 crystals show a regular rhombic dodecahedral structure with smooth crystal surfaces and clear sharp edges. The crystal size distribution is relatively uniform, indicating that the synthesized ZIF8 has good crystallinity and homogeneity. Figure 3.2 (B) shows the morphology of Ru-ZIF8. Compared with pure ZIF8, the crystal morphology of Ru-ZIF8 basically maintains the characteristics of rhombic dodecahedron, but the surface of the crystals is slightly roughened, which may be due to the introduction of Ru elements has a certain effect on the growth of ZIF8 crystals. Nevertheless, the crystal structure of Ru-ZIF8 still maintains a high degree of integrity. Figure 3.2 (C) shows the morphology of MIPs/AuNPs@Ru-ZIF8. Compared with Ru-ZIF-8, the surface roughening of MIPs/AuNPs@Ru-ZIF8 was further increased and obvious agglomeration appeared on some surfaces. This suggests that the polymerization of MIPs significantly affected the crystal morphology of Ru-ZIF8, which may have led to the alteration of the crystal surface structure and the appearance of agglomeration behavior. Overall, the TEM images clearly demonstrate the surface morphology features of ZIF-8, Ru-ZIF8 and MIPs/AuNPs@Ru-ZIF8, revealing the effects of the introduction of Ru elements and MIPs on the ZIF8 crystal structure. Figure 3.2 (D) shows the distribution of Zn elements, with the highlights appearing yellow in color and uniformly dispersed on a black background. This indicates that the Zn element in the sample is uniformly distributed throughout the field of view, corroborating the existence of the ZIF8 main frame nodes. The uniform distribution of the bright spots implies that the element is highly dispersed in the sample. Figure 3.2 (E) shows the distribution of the Ru element in the sample, with the bright spots appearing orange-red in color and again evenly dispersed on the black background. The different color of the bright spots in (E) compared to (D) suggests that another specific element, Ru, is distributed in the sample, and the uniform distribution of the bright spots suggests that the element Ru is also well dispersed in the sample. Figure 3.2 (F) shows the elemental distribution of Au, with the bright dots appearing blue or cyan in color and evenly dispersed on a black background. The color of the highlights in (F) is again different compared to (D) and (E), suggesting that another specific element, Au, is distributed in the sample, and the uniform distribution of the highlights suggests that this element is also well dispersed in the sample. Overall, the EDS elemental distribution map clearly shows the distribution of three different elements. The uniform distribution of the bright dots indicates that these elements are well dispersed in the respective samples. By comparing the colors of the bright spots in different samples, the different elemental compositions of the samples can be distinguished, and the EDS results provide an important basis for further analysis of the elemental composition and distribution of the samples.
The morphology of the composites was examined using scanning electron microscopy (SEM), while the specific dimensions were further observed using transmission electron microscopy (TEM). The elemental compositions of the materials were analyzed using energy dispersive X-ray spectroscopy (EDS). Additionally, the elemental composition of the composites was determined through ultraviolet-visible spectroscopy analysis (UV-vis), and X-ray photoelectron spectroscopy (XPS) to investigate the bonding between the physical phase and structure of the synthesized materials in this study.
Figure 3. 3.
(A) XPS spectrum of AuNPs@Ru-ZIF8; (B) XPS segmented peak fitting image of N 1s; (C) XPS image of Au element; (D) XPS segmented peak fitting image of C 1s; (E) XPS segmented peak fitting image of Ru 3p; (F) XPS image of Zn element.
Figure 3. 3.
(A) XPS spectrum of AuNPs@Ru-ZIF8; (B) XPS segmented peak fitting image of N 1s; (C) XPS image of Au element; (D) XPS segmented peak fitting image of C 1s; (E) XPS segmented peak fitting image of Ru 3p; (F) XPS image of Zn element.
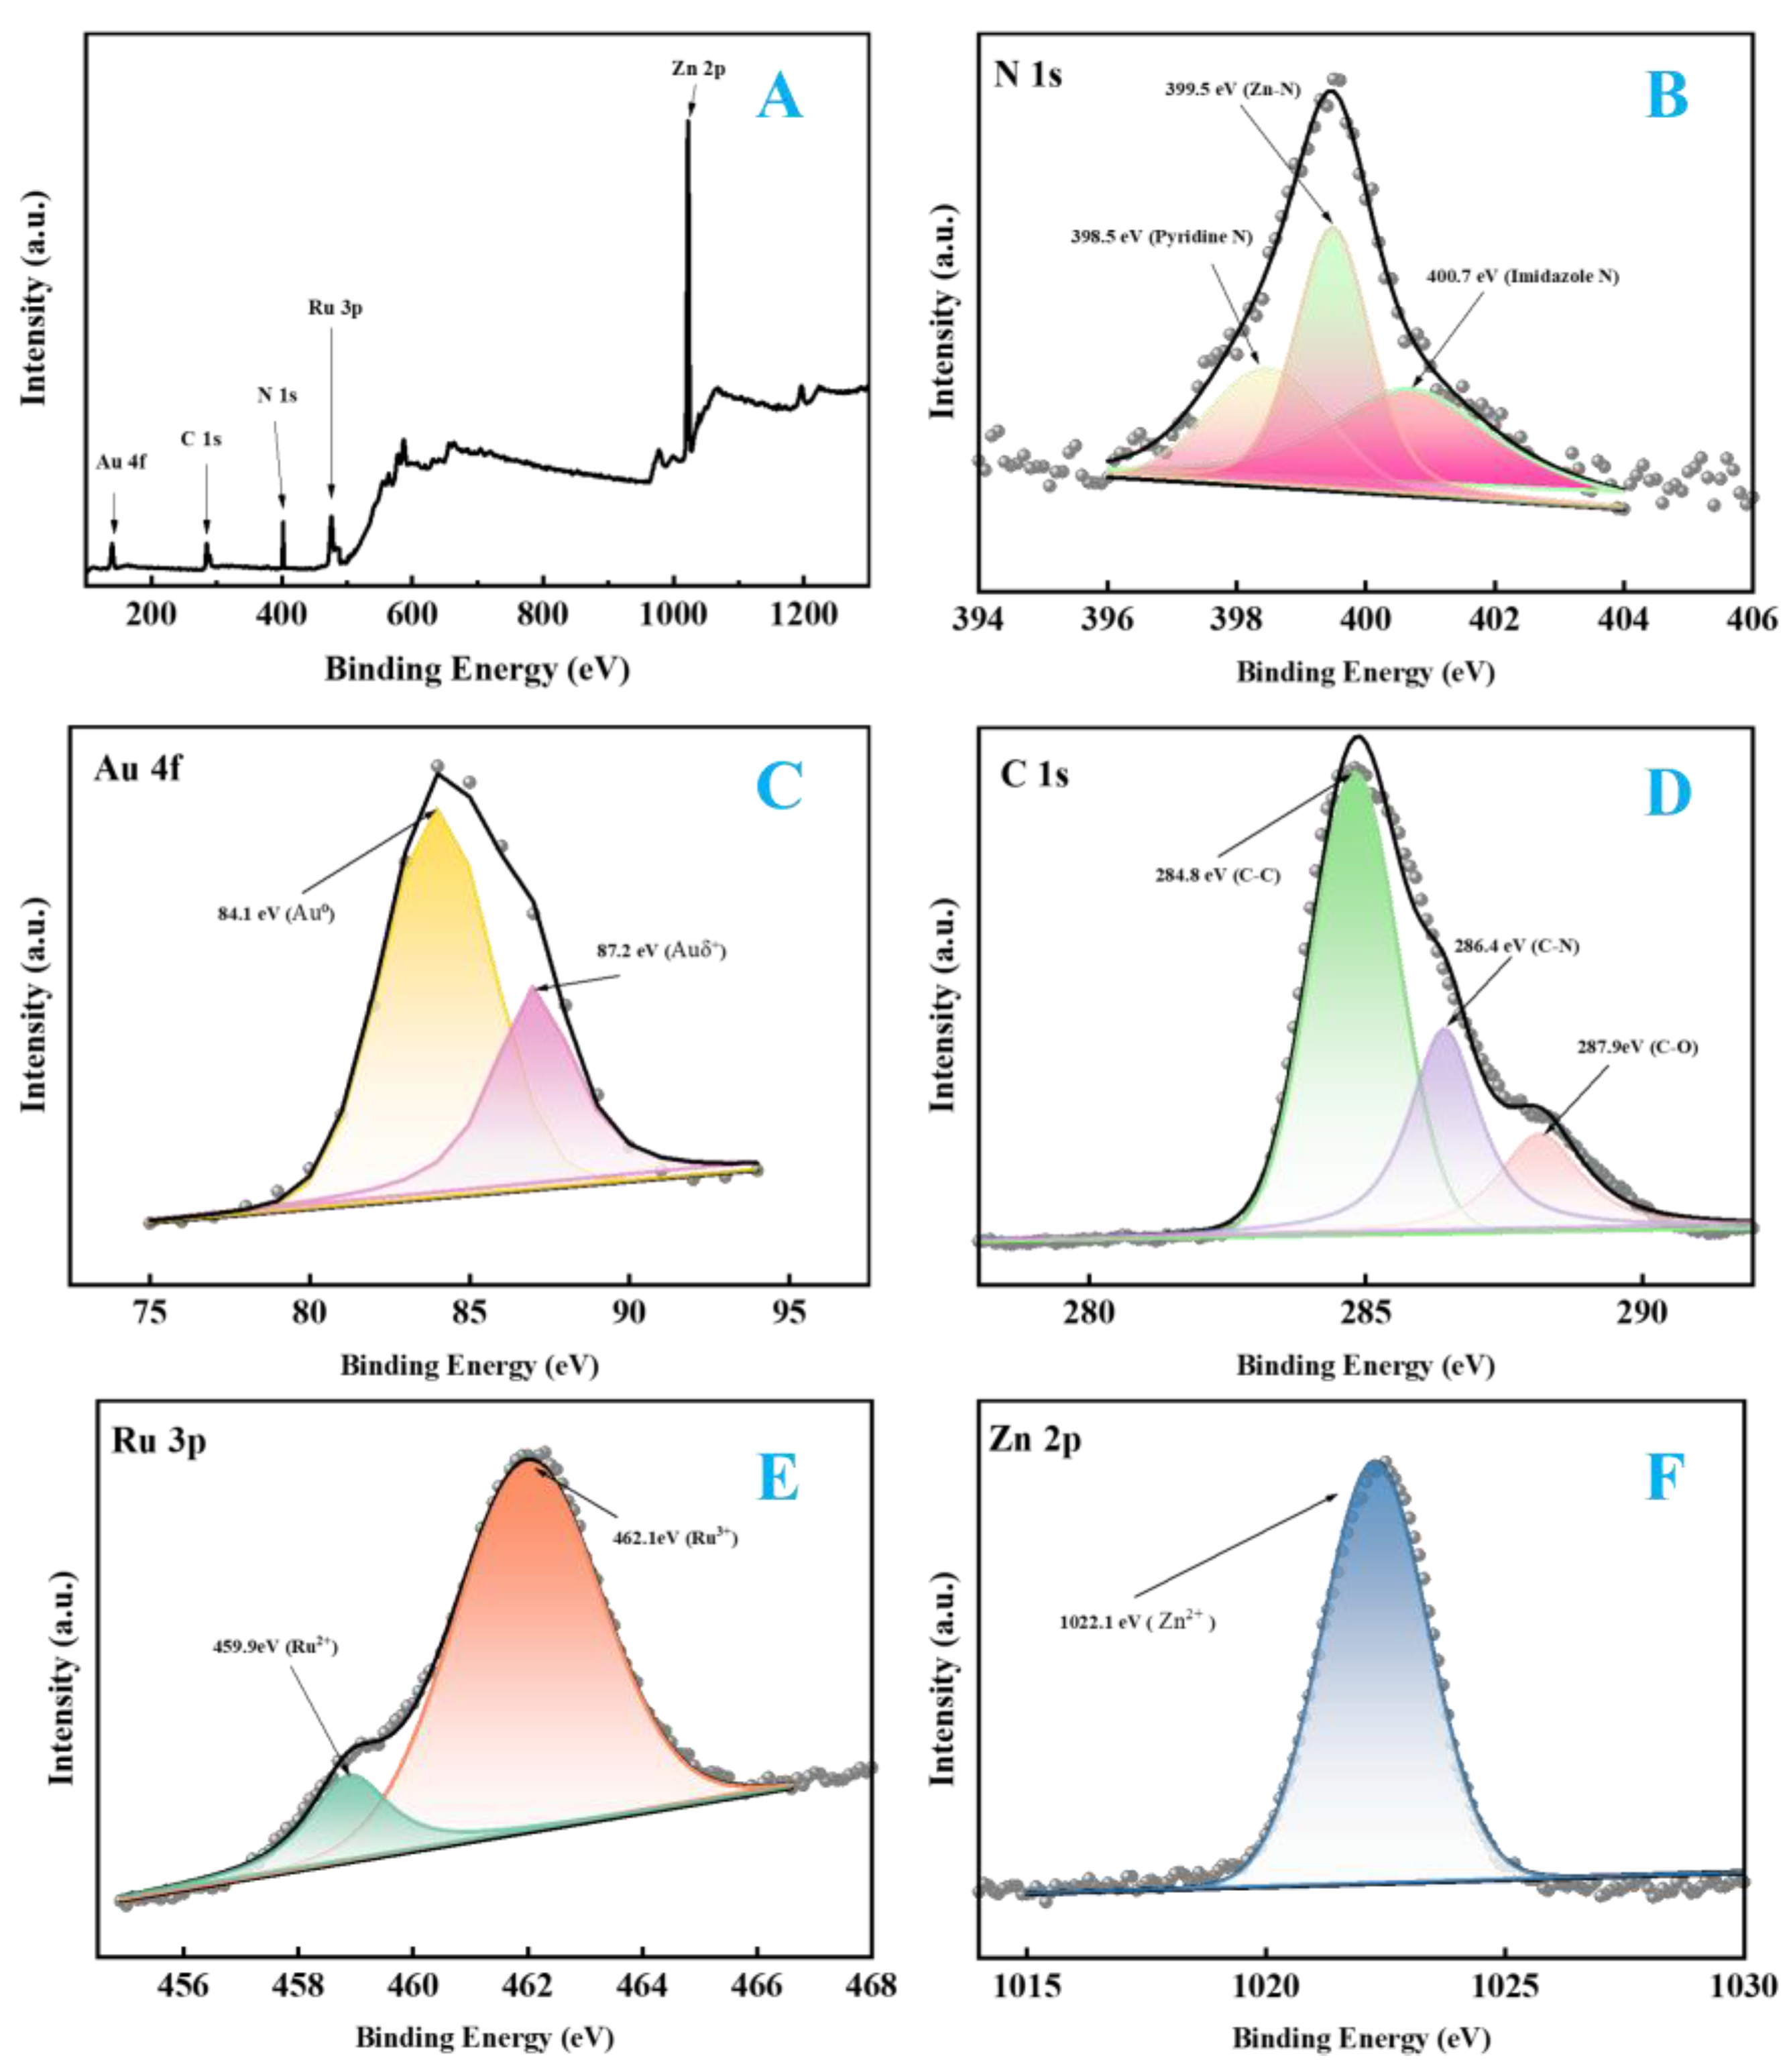
The surface elemental composition and chemical states of AuNPs@Ru-ZIF8 composites were analyzed in detail by XPS. Split-peak fitting is a common technique used in XPS analysis to decompose a complex spectrum into multiple components, thus obtaining more detailed information about the chemical state of a particular element. By analyzing the fine spectra of individual elements, the chemical states and interactions of the elements in the Ru@ZIF-8 material can be determined. Figure 3. 4 (A) Full spectrum confirms the presence of the elements gold (Au), carbon (C), ruthenium (Ru), nitrogen (N) and zinc (Zn) in the material. Figure 3. 4 (B) shows the fine spectrum of elemental N in the 1s orbital, and the split-peak fitting plot gives three states of elemental N. These are Zn-N at the binding energy of 339.5 eV, which proves the main structure of ZIF8, and uncoordinated nitrogen at 398.5 and 400.7 eV [15], i.e., nitrogen contained in imidazole ligands, and from the peak area of the spectrum it is clear that the majority of imidazole ligands are involved in the formation of the overall skeleton of ZIF8. Figure 3. 4 (C) shows the fine spectrum of elemental Au in the 4f orbital, the peak at 84.1 eV represents the AuNPs in the sample, while the peak at 87.2 eV represents the oxidation of some of the AuNPs, which is an unavoidable phenomenon in the analysis of samples. From the fine spectrum of element C in the 1s orbital in Figure 3. 4 (D), the peaks at 284.8, 286.4 and 287.9 eV can be clearly observed, which represent the C-C, C-N and C-O bonds, respectively [15], and their presence also proves that the synthesis of ZIF8 material is successful. The fine spectral image of element Ru in the 3p orbital clearly shows two peaks at 458.9 and 462.1 eV, as shown in Figure 3. 4 (E), in which the smaller area of the peaks represents the luminescent material Ru(bpy)32+ , while the larger area may be the divalent Ru after reduction by AuNPs. Figure 3. 4 (F) shows the XPS image of element Zn, and the peak at 1022.1 eV is the XPS image of the ZIF8 material, and the peak at 1022.1 eV is the XPS image of the ZIF8 material. The peak at eV is Zn2+, which is clearly observed as a node of the ZIF8 framework.
2.8. Electrochemical and Electrochemiluminescent Validation
Each assembly process of the ECL-MIPs sensor was analyzed in detail using CV, DPV and ECL, respectively. As shown in Figure 3. 5 (A), the CV plots demonstrate the curve changes of GCE at different modification stages, which clearly reveals the effect of each step of modification on the peak current. Firstly, the peak current increased significantly after modifying MWCNTs (curve a), and the peak current of GCE reached 150 μA after the modification of MWCNTs, indicating that MWCNTs greatly enhanced the electron transfer ability of the electrodes by virtue of their high surface area and high conductivity, which laid an excellent basic performance for the sensor. Secondly, after the addition of AuNPs@RuZIF8 on top of MWCNTs (curve b), the peak currents decreased to ~140 μA (0.25 V) for the anode and -140 μA (0.05 V) for the cathode, which can be attributed to the poor electrical conductivity of ZIF8 partially offsetting the electrical conductivity of both MWCNTs and AuNPs; however, the peak current was lower than that of the simple Ru- ZIF8 (curve c). This is attributed to the poorer conductivity of ZIF8 partially offsetting the conductivity of MWCNTs and AuNPs; however, compared with Ru- ZIF8 alone (curve c), the addition of AuNPs still increases the current, reflecting the improved conductivity of AuNPs. Then, after immobilization of MIPs by electropolymerization (curve d), the peak currents further decreased to about 117 μA (0.25 V) at the anode and -117 μA (0.05 V) at the cathode, which may be attributed to the insulating nature of MIPs hindering the electron transfer, and also proved that MIPs were successfully immobilized to provide the basis for specific detection. Subsequently, after the addition of Cyhalothrin (curve f), its binding to the specific sites of MIPs continued to reduce the peak currents to about 95 μA (0.25 V) at the anode and -95 μA (0.05 V) at the cathode, reflecting that the molecularly blocked sites of Cyhalothrin limited the electron transfer and verified the specific detection capability of the sensor. Finally, the selectivity of the sensor was further confirmed by non-imprinted polymers (NIPs) control experiments, in which NIPs had no significant effect on the electrochemical response (curve e), ruling out non-specific interference. DPV analysis was done simultaneously for the assembly process of the ECL-MIPs sensor, as shown in Figure 3. 5(B). The DPV signal trends throughout the assembly process had the same results as in the CV analysis. The ECL curves in Figure 3. 5 (C) show that the ECL intensity of AuNPs@Ru-ZIF8/MWCNTs/GCE modified with AuNPs was significantly increased (curve a) compared to that of Ru-ZIF8/MWCNTs/GCE with unmodified AuNPs (curve b). Subsequent electropolymerization of MIPs resulted in a decrease in
ECL signal (curve e). The ECL intensity of the eluted MIPs/AuNPs@Ru-ZIF8/MWCNTs/GCE (curve c) was not significantly different from that of the NIPs/AuNPs@Ru-ZIF8/MWCNTs/GCE obtained by electric polymerization without the addition of template molecules (curve d). When 3 μL of 1 nM Cyhalothrin was added dropwise to the sensor for ECL observation, its ECL intensity decreased significantly (curve f). The reasons for the above trends are consistent with those that led to changes in current values in the CV analysis.
2.9. Optimizing Experimental Parameters
The experiments mainly examined the effects of the electropolymerization cycle, the pH of the polymerization solution, the molar ratio of template molecules to functional monomers, and the elution time on the sensors of the ECL-MIPs, and the error lines in the images indicate the error intervals under the same experimental conditions for three times. The experimental results showed that the ECL intensity showed an increasing and then decreasing trend with the increase of the number of polymerization cycles, as shown in Figure 3. 6 (A). Specifically, the ECL intensity gradually increases when the polymerization period increases from 5 to 15, which indicates that the responsiveness of the sensor to the target molecules is enhanced with the increase of the polymer film thickness. However, when the polymerization period exceeds 15 and continues to increase to 20, the ECL intensity begins to decrease, which indicates that an excessively thick polymer membrane is instead detrimental to the sensitivity of the sensor. Too thin polymer membranes are easily damaged during the elution process, leading to insufficient blotting cavities and thus reduced sensitivity, while too thick polymer membranes may hinder the complete removal of template molecules, which also affects sensitivity. Therefore, through the experimental data, 15 cycles were determined to be the optimal cycle for electropolymerization, and the molecularly imprinted polymer membranes prepared under this condition had the best performance. As shown in Figure 3. 6(B), the variation of ECL intensity with pH shows a typical bell-shaped curve, indicating the existence of an optimal pH value for maximum sensor response. Specifically, a significant upward trend in the ECL intensity was observed during the gradual increase in pH from 6.5 to 8.0 and peaked at pH 8.0. This phenomenon suggests that the polymerization reaction effectively promotes the formation of high-quality molecularly imprinted polymer films in this pH range, which improves the recognition of target analytes by the sensor. However, the ECL intensity decreased rapidly when the pH exceeded 8.0 and continued to increase to 9.0. This suggests that the structure of the polymer film is distorted at too high pH conditions, leading to a decrease in sensor sensitivity. The molar ratio of template molecules to functional monomers has a significant effect on the formation of molecularly imprinted cavities. As shown in Figure 3. 6(C), the ECL intensity showed a clear peak with the molar ratio. At lower molar ratios, there is an excess of functional monomers, resulting in an insufficient number of imprinted cavities, which reduces the binding ability of the sensor to the target molecule. As the molar ratio increases, the number of imprinted cavities gradually increases and the ECL intensity rises. However, when the molar ratio is too high, there is an excess of template molecules, which may lead to uneven distribution of the imprinted cavities or even residual template molecules, thus reducing the sensitivity of the sensor. The experimental data showed that the MIPs formed by polymerization with a molar ratio of 1:4 provided the best conditions for the formation of imprinted cavities and achieved the optimal ECL signal response. The elution process is a critical step to remove the template molecules from the polymer membrane, which directly affects the sensor's ability to recognize the target analyte. As shown in Figure 3. 6 (D), a significant increase in ECL intensity with elution time was observed for shorter elution times (10 to 20 min). This suggests that the residual template molecules in the polymer membrane gradually decrease with increasing elution time, thus releasing more imprinted cavities and improving the binding ability of the sensor to the target analyte. However, when the elution time exceeded 25 min, the ECL intensity reached a plateau and no longer increased significantly. This suggests that the template molecules have been basically completely removed under this condition, and further prolongation of the elution time has a limited effect on the enhancement of the sensor performance. However, excessive elution time may adversely affect the structure of the polymer membrane. Excessive elution may lead to the destruction of the pore structure of the polymer membrane or even the collapse of the imprinted cavity, thus reducing the sensitivity and selectivity of the sensor. Therefore, an elution time of 25 min was determined to be the optimal condition to effectively remove the template molecules while maintaining the integrity of the polymer membrane, thus achieving the highest ECL signal response. In summary, 15 cycles of electric polymerization, a polymerization solution pH of about 8.0, a molar ratio of template molecules to functional monomers of 1:4, and an elution of 25 min were selected as the optimal experimental conditions.
2.10. Aptasensor Performance Analysis
The detection performance of the ECL-MIPs sensor was further tested under optimal detection conditions. The test was performed by adding nine sets of different concentrations of Cyhalothrin to the ECL-MIPs sensor, and the test results are shown in Figure 3. 7 (A). The concentration of Cyhalothrin (CCyh) showed a negative correlation with the intensity of ECL, I, in the range of 1 × 10 -1 to 1 × 10 4 nM (Figure 3. 7 B), with a correlation coefficient R2 of 0.992, and a regression equation of I = 9930.77 1527.58 LgCCyh. The lowest Limit of Detection (LOD) was 10 pM.
2.11. Stability, Reproducibility and Specificity
Eighteen identical ECL-MIPs sensors were pre-prepared to evaluate its stability under optimal experimental conditions. Tests were performed using Cyhalothrin at a concentration of 1 nM, and the 18 ECL-MIPs sensors were randomly divided into 6 groups, and one group was randomly selected by dropping 3 μL of 1 nM Cyhalothrin standard solution onto 3 ECL-MIPs sensors, respectively, and waiting for natural drying to perform ECL analysis. The remaining 5 groups of ECL-MIPs sensors were randomly sampled every 3 days, and the test results are shown in Figure 3. 8 (A). After comparing the six sets of data, the intensity of ECL varied within 600 intervals within 18 days with an RSD of 2.82%. The results indicate that the ECL-MIPs sensor has good stability. Four ECL-MIPs sensors were prepared under optimal experimental conditions, and 3 μL of 1 nM Cyhalothrin standard solution was added and waited for drying to be tested immediately, and the change in ECL was utilized to assess the repeatability of the ECL-MIPs sensors. The experimental results showed the relative standard deviation RSD = 1.06% for the four sensors. , indicating that the ECL-MIPs sensors have good repeatability. The specificity of the ECL-MIPs sensors was tested separately using different pesticides, (α) mixed pesticides, (β) Cyhalothrin, (γ) Acetamiprid, (δ) Carbofuran, (ε) Trichlorfon, (ζ) Propoxypyrin, (η) Malathion, (θ) Chlorpyrifos, (ι) Thiamethoxam, (κ) Buthionate and (λ) Imidacloprid. As the results in Figure 3. 8(C) show, the ECL intensities of γ, δ, ε, ζ, η, θ, ι, κ, and λ are much higher than those of α and β, while the ECL intensities of α and β are not similar to each other, which fully demonstrates the good specificity of the ECL-MIPs sensor.
2.13. Analysis of Lycium barbarum L.
The analytical results of the LC-MS/MS method[30] were used as a comparison to the standard sample addition method by adding 0, 10 and 100 ng/mL diluted solutions of Cyhalothrin to the pre-treated Lycium barbarum and Angelica sinensis samples, respectively, and detecting them using the ECL-MIPs sensor. The experimental data are shown in Table 3.3, and the recoveries of the ECL-MIPs sensor ranged from 100.08% to 116.50%. Referring to the results of the LC-MS/MS method, it can be proved that the prepared sensor has the same detection ability for real samples. According to the sample processing method in Chapter 2, Angelica sinensis and Lycium barbarum from different origins were grouped and observed independently for three times to obtain the average ECL values. The ECL was calculated according to the standard curve equation and the results are shown in Table 3.4. The four different origins of Angelica sinensis and Lycium barbarum met the requirements of the current Chinese national standard GB2763-2021 Minimum Detectable Amounts (MDAMs) in Foods. In addition, research articles published within the last five years were compared. The ECL sensor showed a larger linear range and lower LOD compared to colorimetric and fluorescence methods methods methods, and the present work had a lower LOD compared to EC and previous ECL sensors (see Table 3.5).
3. Conclusions
This experiment combined with MIT and ECL analysis methods to successfully construct an ECL-MIPs sensor for Cyhalothrin residue detection in wolfberry and angelica. The ECL-MIPs sensor uses ZIF8 with extremely high specific surface area and ordered microporous structure as the basic framework, and the luminescent material Ru(bpy)32+ is simultaneously compounded in ZIF8. The improved Ru-ZIF8 composite avoids the Ru(bpy)32+ loss in the electrochemiluminescence system of Ru(bpy)32+ and TPrA systems. The introduction of AuNPs has enhanced the ability of Ru-ZIF8 to catalyze the luminescence reaction of the Ru(bpy)32+ & TPrA system. MIPs produced by electric polymerization have specificity in identifying Cyhalothrin. The developed aptamer sensor can operate linearly in the detection range of 1×10⁻¹~1×10⁴ nM, and its LOD=10 pM (S/N=3). In actual sample analysis, the Cyhalothrin recovery rate of ECL-MIPs sensors ranged from 97% to 115.5%. The prepared ECL-MIPs sensors have good selectivity, repeatability and stability, providing a reliable method for detecting Cyhalothrin residues in wolfberry and angelica.
Author Contributions
Chengqiang Li: Conceptualization, Investigation, Writing-original draft, Formal analysis, Methodology. Jiashuai Sun: Writing-review and editing. Peisen Li: Writing-review and editing. Jiwei Dong: Writing-review and editing, Supervision. Jingcheng Huang: Writing-review and editing, Formal analysis. Nortoji A. Khujamshukurov: Writing-review and editing, Supervision. Haowei Dong: Formal analysis, Visualization, Software. Lingjun Geng: Writing-review and editing. Zhiping Yu: Writing-review and editing, Supervision, Validation. Pengwei Zhang: Writing-review and editing. Yuchen Cai:Writing-review and editing. Haifang Wang: Writing-review and editing, Supervision, Validation. Wei Chen: Writing-review and editing. Formal analysis. Xia Sun: Writing-review and editing, Project administration, Funding acquisition. Yemin Guo: Writing-review and editing, Project administration, Funding acquisition, Resources.
Acknowledgments
This work was supported by the National Natural Science Foundation of China (32372438), Technological innovation guidance project of Department of Science & Technology of Gansu Province (22CX8NA023), Natural Science Foundation of Shandong Province (ZR202210150017).
References
- Fu, Yan; Yang, Ting; Zhao, Jian. Determination of eight pesticides in Lycium barbarum by LC-MS/MS and dietary risk assessment. Food Chemistry 2017, 218, 192–198. [Google Scholar] [CrossRef]
- Mikac, L.; Kovačević, E.; Ukić, Š.; Raić, M.; Jurkin, T.; Marić, I.; Gotić, M.; Ivanda, M. Detection of multi-class pesticide residues with surface-enhanced Raman spectroscopy. Spectrochim. Acta Part A: Mol. Biomol. Spectrosc. 2021, 252, 119478. [Google Scholar] [CrossRef]
- Wang, L.; Zhang, L.-J.; Lv, W.; Han, S.-H.; Zhang, F.-K.; Pan, J.-R. Determination of Organophosphorus Pesticides Based on Biotin-Avidin Enzyme-Linked Immunosorbent Assay. Chin. J. Anal. Chem. 2011, 39, 346–350. [Google Scholar] [CrossRef]
- Liu, M.; Dou, S.; Vriesekoop, F.; Geng, L.; Zhou, S.; Huang, J.; Sun, J.; Sun, X.; Guo, Y. Advances in signal amplification strategies applied in pathogenic bacteria apta-sensing analysis—A review. Anal. Chim. Acta 2024, 1287, 341938. [Google Scholar] [CrossRef]
- Sun, J.; Wang, H.; Li, P.; Li, C.; Li, D.; Dong, H.; Guo, Z.; Geng, L.; Zhang, X.; Fang, M.; et al. Metal-organic framework-based aptasensor utilizing a novel electrochemiluminescence system for detecting acetamiprid residues in vegetables. Biosens. Bioelectron. 2024, 259, 116371. [Google Scholar] [CrossRef]
- Sayyad, P.W.; Park, S.-J.; Ha, T.-J. Recent advances in biosensors based on metal-oxide semiconductors system-integrated into bioelectronics. Biosens. Bioelectron. 2024, 259, 116407. [Google Scholar] [CrossRef]
- Ji, Fangyan; Wang, Peilin; Li, Zhenrun. PVDF-HFP/EMIM: Otf film-based self-supporting ECL sensing system with CB[8]/Cu NC host-guest strategy for piR-36743 detection in gastric cancer ascites [J]. Chemical Engineering Journal 2025, 509, 161221. [Google Scholar] [CrossRef]
- Barhoum, A.; Altintas, Z.; Devi, K.S.; Forster, R.J. Electrochemiluminescence biosensors for detection of cancer biomarkers in biofluids: Principles, opportunities, and challenges. Nano Today 2023, 50. [Google Scholar] [CrossRef]
- Tao, Q.; Lv, L.; Liu, T.; Wang, X. A fluorescence-validated MIP-ECL sensor based on UiO66 loaded carbon nitride for detection of trace Patulin in series fruit products. Microchem. J. 2024, 207. [Google Scholar] [CrossRef]
- Zhou, X.; Gu, X.; Zhang, S.; Zou, Y.; Yan, F. Magnetic graphene oxide and vertically-ordered mesoporous silica film for universal and sensitive homogeneous electrochemiluminescence aptasensor platform. Microchem. J. 2024, 200. [Google Scholar] [CrossRef]
- Hiramoto, Kaoru; Hirano-Iwata, Ayumi; Ino, Kosuke; et al. Electrochemiluminescence of [Ru(bpy)3]2+/tri-n-propylamine to visualize different lipid compositions in supported lipid membranes[J]. Chemical Communications 2025, 61, 4495–4498. [Google Scholar] [CrossRef]
- Lu, Zhiwei; Ma, Jun. Electroactive MIPs/N, S-Mo2C/Ag NPs nanocomposites for dual-signal ratiometric electrochemical sensing of carbendazim. Journal of Alloys and Compounds 2025, 1020, 179488. [Google Scholar] [CrossRef]
- Hu, X.; Zhang, Y.; Li, J.; Su, M.; Yang, M.; Fang, X.; Wang, H.; Li, G. Synthesis and performance studies of functionalized metal-organic framework UiO-66 composites in water bodies. J. Taiwan Inst. Chem. Eng. 2024, 159, 105512. [Google Scholar] [CrossRef]
- Huang, J.; Dong, H.; Geng, L.; Xu, R.; Liu, M.; Guo, Z.; Sun, J.; Sun, X.; Guo, Y. Rational design and controlled synthesis of metal-organic frameworks to meet the needs of electrochemical sensors with different sensing characteristics: An overview. Compos. Part B: Eng. 2024, 281, 111536. [Google Scholar] [CrossRef]
- Khorgami, G.; Haddadi, S.A.; Okati, M.; Mekonnen, T.H.; Ramezanzadeh, B. In situ-polymerized and nano-hybridized Ti3C2-MXene with PDA and Zn-MOF carrying phosphate/glutamate molecules; toward the development of pH-stimuli smart anti-corrosion coating. Chem. Eng. J. 2024, 484. [Google Scholar] [CrossRef]
- Fallah, A.; Fooladi, A.A.I.; Havaei, S.A.; Mahboobi, M.; Sedighian, H. Recent advances in aptamer discovery, modification and improving performance. Biochem. Biophys. Rep. 2024, 40, 101852. [Google Scholar] [CrossRef]
- Su, C.; Dong, C.; Jiang, D.; Shan, X.; Chen, Z. Construction of electrochemiluminescence aptasensor for acetamiprid detection using flower-liked SnO2 nanocrystals encapsulated Ag3PO4 composite as luminophore. Microchem. J. 2023, 187, 108374. [Google Scholar] [CrossRef]
- Chen, F.-L.; Song, K.-H.; Xu, J.-T.; Wang, K.-Z.; Feng, X.-Z.; Han, G.-C.; Kraatz, H.-B. An electrochemical aptamer sensor for rapid quantification sulfadoxine based on synergistic signal amplification of indole and MWCNTs and its electrooxidation mechanism. Sensors Actuators B: Chem. 2024, 401, 135008. [Google Scholar] [CrossRef]
- Wang, X.; Yu, H.; Li, Q.; Tian, Y.; Gao, X.; Zhang, W.; Sun, Z.; Mou, Y.; Sun, X.; Guo, Y.; et al. Development of a fluorescent sensor based on TPE-Fc and GSH-AuNCs for the detection of organophosphorus pesticide residues in vegetables. Food Chem. 2024, 431, 137067. [Google Scholar] [CrossRef] [PubMed]
- He, K.; Dong, S.; Yang, J.; Shi, Q.; Guan, L.; Sun, L.; Chen, Z.; Feng, J. Efficient and switchable aptamer “fluorescence off/on” method based on UiO-66@Cu for ultrasensitive detection of acetamiprid. J. Environ. Chem. Eng. 2022, 10, 108178. [Google Scholar] [CrossRef]
- Guan, J.; Wang, X.; Tian, Z.; Jia, F.; Wang, J.; Xie, L.; Lan, J.; Han, P.; Lin, H.; Huang, X.; et al. Controlled-release of cinnamaldehyde from MXene/ZIF8/gelatin composite coatings: An integrated strategy to combat implant-associated infection. Colloids Surfaces B: Biointerfaces 2025, 251, 114615. [Google Scholar] [CrossRef]
- Gong, Q.; Xu, X.; Cheng, Y.; Wang, X.; Liu, D.; Nie, G. A novel “on-off-on” electrochemiluminescence strategy based on RNA cleavage propelled signal amplification and resonance energy transfer for Pb2+ detection. Anal. Chim. Acta 2024, 1290, 342218. [Google Scholar] [CrossRef] [PubMed]
- Ye, Z.; Liu, Y.; Pan, M.; Tao, X.; Chen, Y.; Ma, P.; Zhuo, Y.; Song, D. AgInZnS quantum dots as anodic emitters with strong and stable electrochemiluminescence for biosensing application. Biosens. Bioelectron. 2023, 228, 115219. [Google Scholar] [CrossRef] [PubMed]
- Wang, T.; Xu, S.; Liu, L.; Zhang, Y.; Li, G. A highly stable voltammetric sensor for trace ofloxacin determination coupling molecularly imprinting film with AuNP and UiO-66 MOF dual-encapsulated black phosphorus nanosheets. Mater. Today Chem. 2024, 43, 102468. [Google Scholar] [CrossRef]
- Kou, Jing; Lu, Lili; Fan, Zhaoyu; et al. A Molecularly Imprinted Polymer Sensor Based on the Electropolymerization of p-Aminothiophenol-Functionalized Au Nanoparticles Electrode for the Detection of Nonylphenol [J]. Biomedical and Environmental Sciences 2020, 33, 887–891. [Google Scholar] [PubMed]
- Wang, J.; Qiu, H.; Shen, H.; Pan, J.; Dai, X.; Yan, Y.; Pan, G.; Sellergren, B. Molecularly imprinted fluorescent hollow nanoparticles as sensors for rapid and efficient detection λ-cyhalothrin in environmental water. Biosens. Bioelectron. 2016, 85, 387–394. [Google Scholar] [CrossRef] [PubMed]
- de Souza, J.C.; Silva, J.P.; Zanoni, M.V.B.; de Andrade, A.R. High sensitive phosphorene and molecular imprinted polymers electrochemical sensor to determine benzene in oilfield-produced water. J. Environ. Chem. Eng. 2024, 12, 111703. [Google Scholar] [CrossRef]
- He, Juan; Miao, Yanqing; Liu, Chunye; et al. Progress in the preparation and application of gold nanoparticles. Chemical Technology 1–12.
- Pham, T.B.; Bui, H.; Pham, V.H.; Do, T.C. Surface-enhanced Raman spectroscopy based on Silver nano-dendrites on microsphere end-shape optical fibre for pesticide residue detection. Optik 2020, 219, 165172. [Google Scholar] [CrossRef]
- Saito-Shida, S.; Saito, M.; Tsutsumi, T. Comparison of nitrogen and helium as carrier gases for determination of pesticide residues in foods via gas chromatography–tandem mass spectrometry with atmospheric pressure chemical ionization. J. Food Compos. Anal. 2024, 134. [Google Scholar] [CrossRef]
- Zhu, X.; Su, H.; Liu, H.; Sun, B. A selectivity-enhanced fluorescence imprinted sensor based on yellow-emission peptide nanodots for sensitive and visual smart detection of λ-cyhalothrin. Anal. Chim. Acta 2023, 1255, 341124. [Google Scholar] [CrossRef] [PubMed]
Figure 3. 1.
Image of AuNPs under TEM.
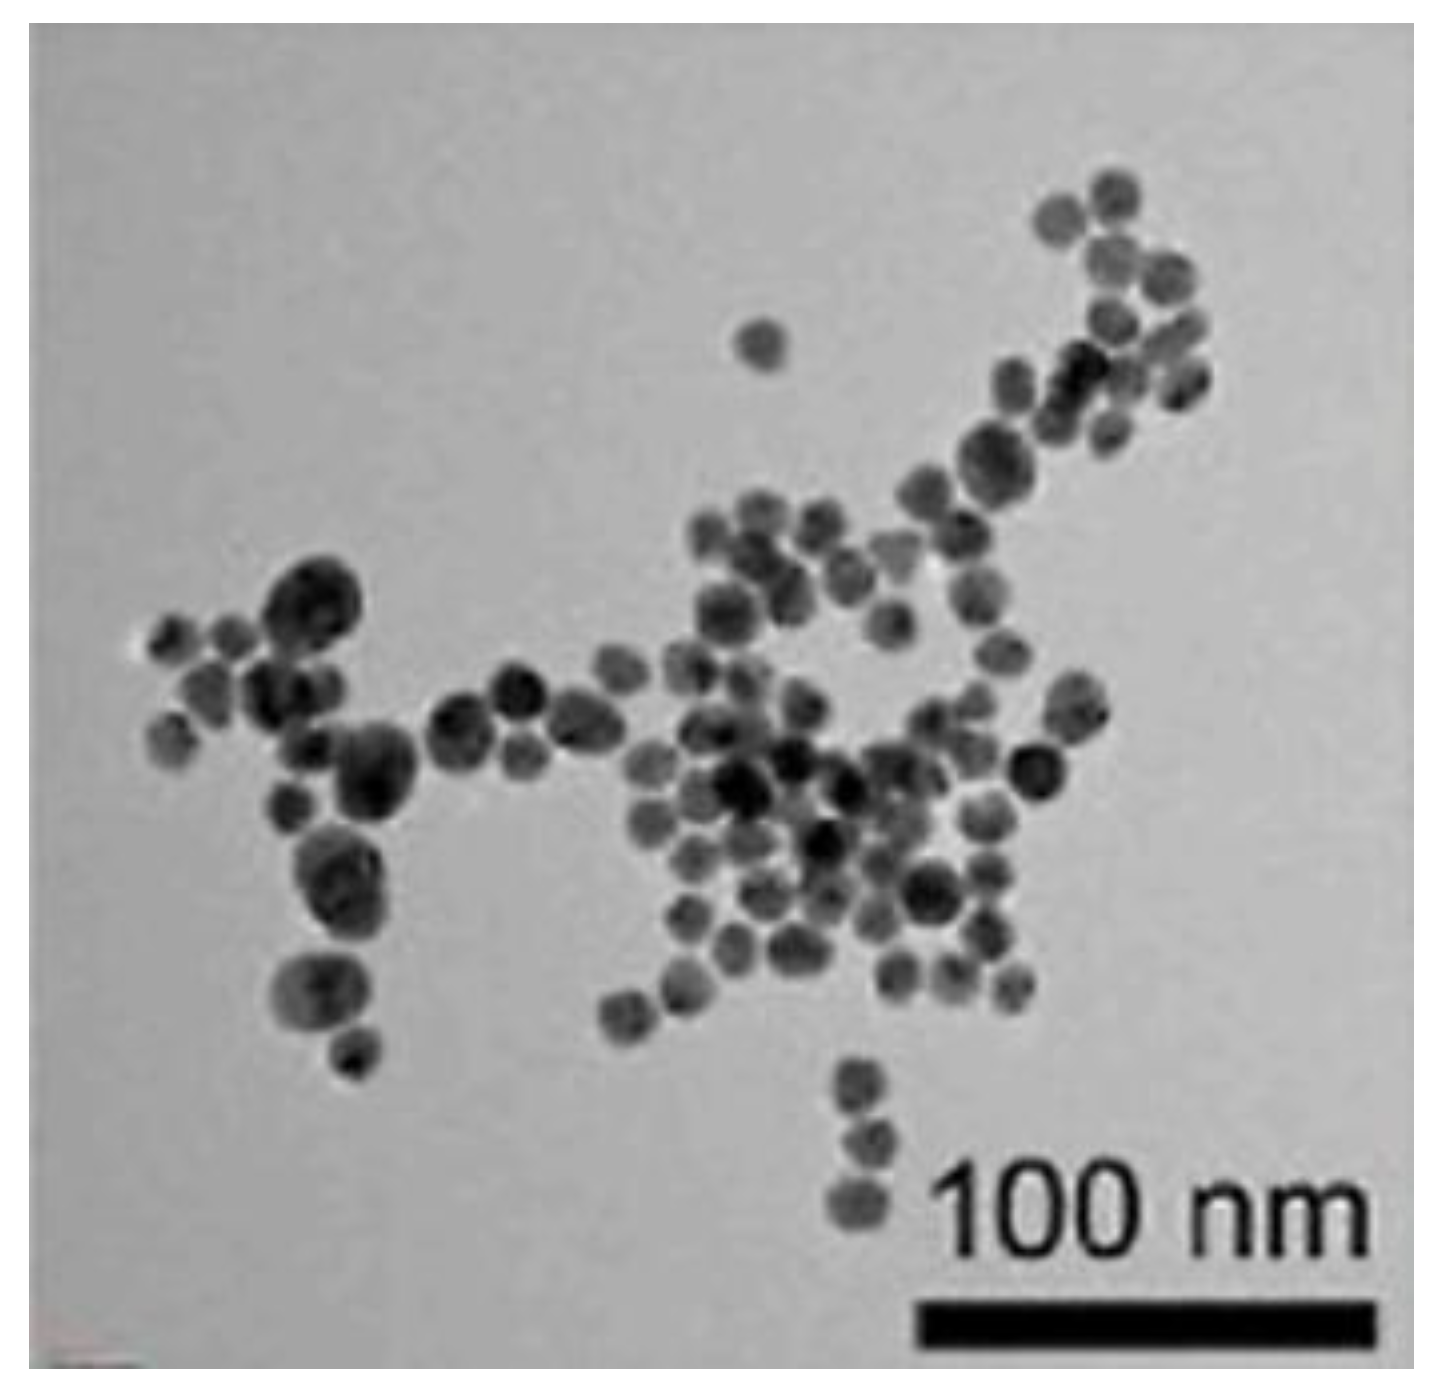
Figure 3. 2.
(A) SEM image of ZIF8; (B) SEM image of Ru-ZIF8; (C) SEM image of MIPs/AuNPs@Ru-ZIF8; (D), (E) and (F) is the EDS element distribution images of Zn, Ru and Au.
Figure 3. 2.
(A) SEM image of ZIF8; (B) SEM image of Ru-ZIF8; (C) SEM image of MIPs/AuNPs@Ru-ZIF8; (D), (E) and (F) is the EDS element distribution images of Zn, Ru and Au.
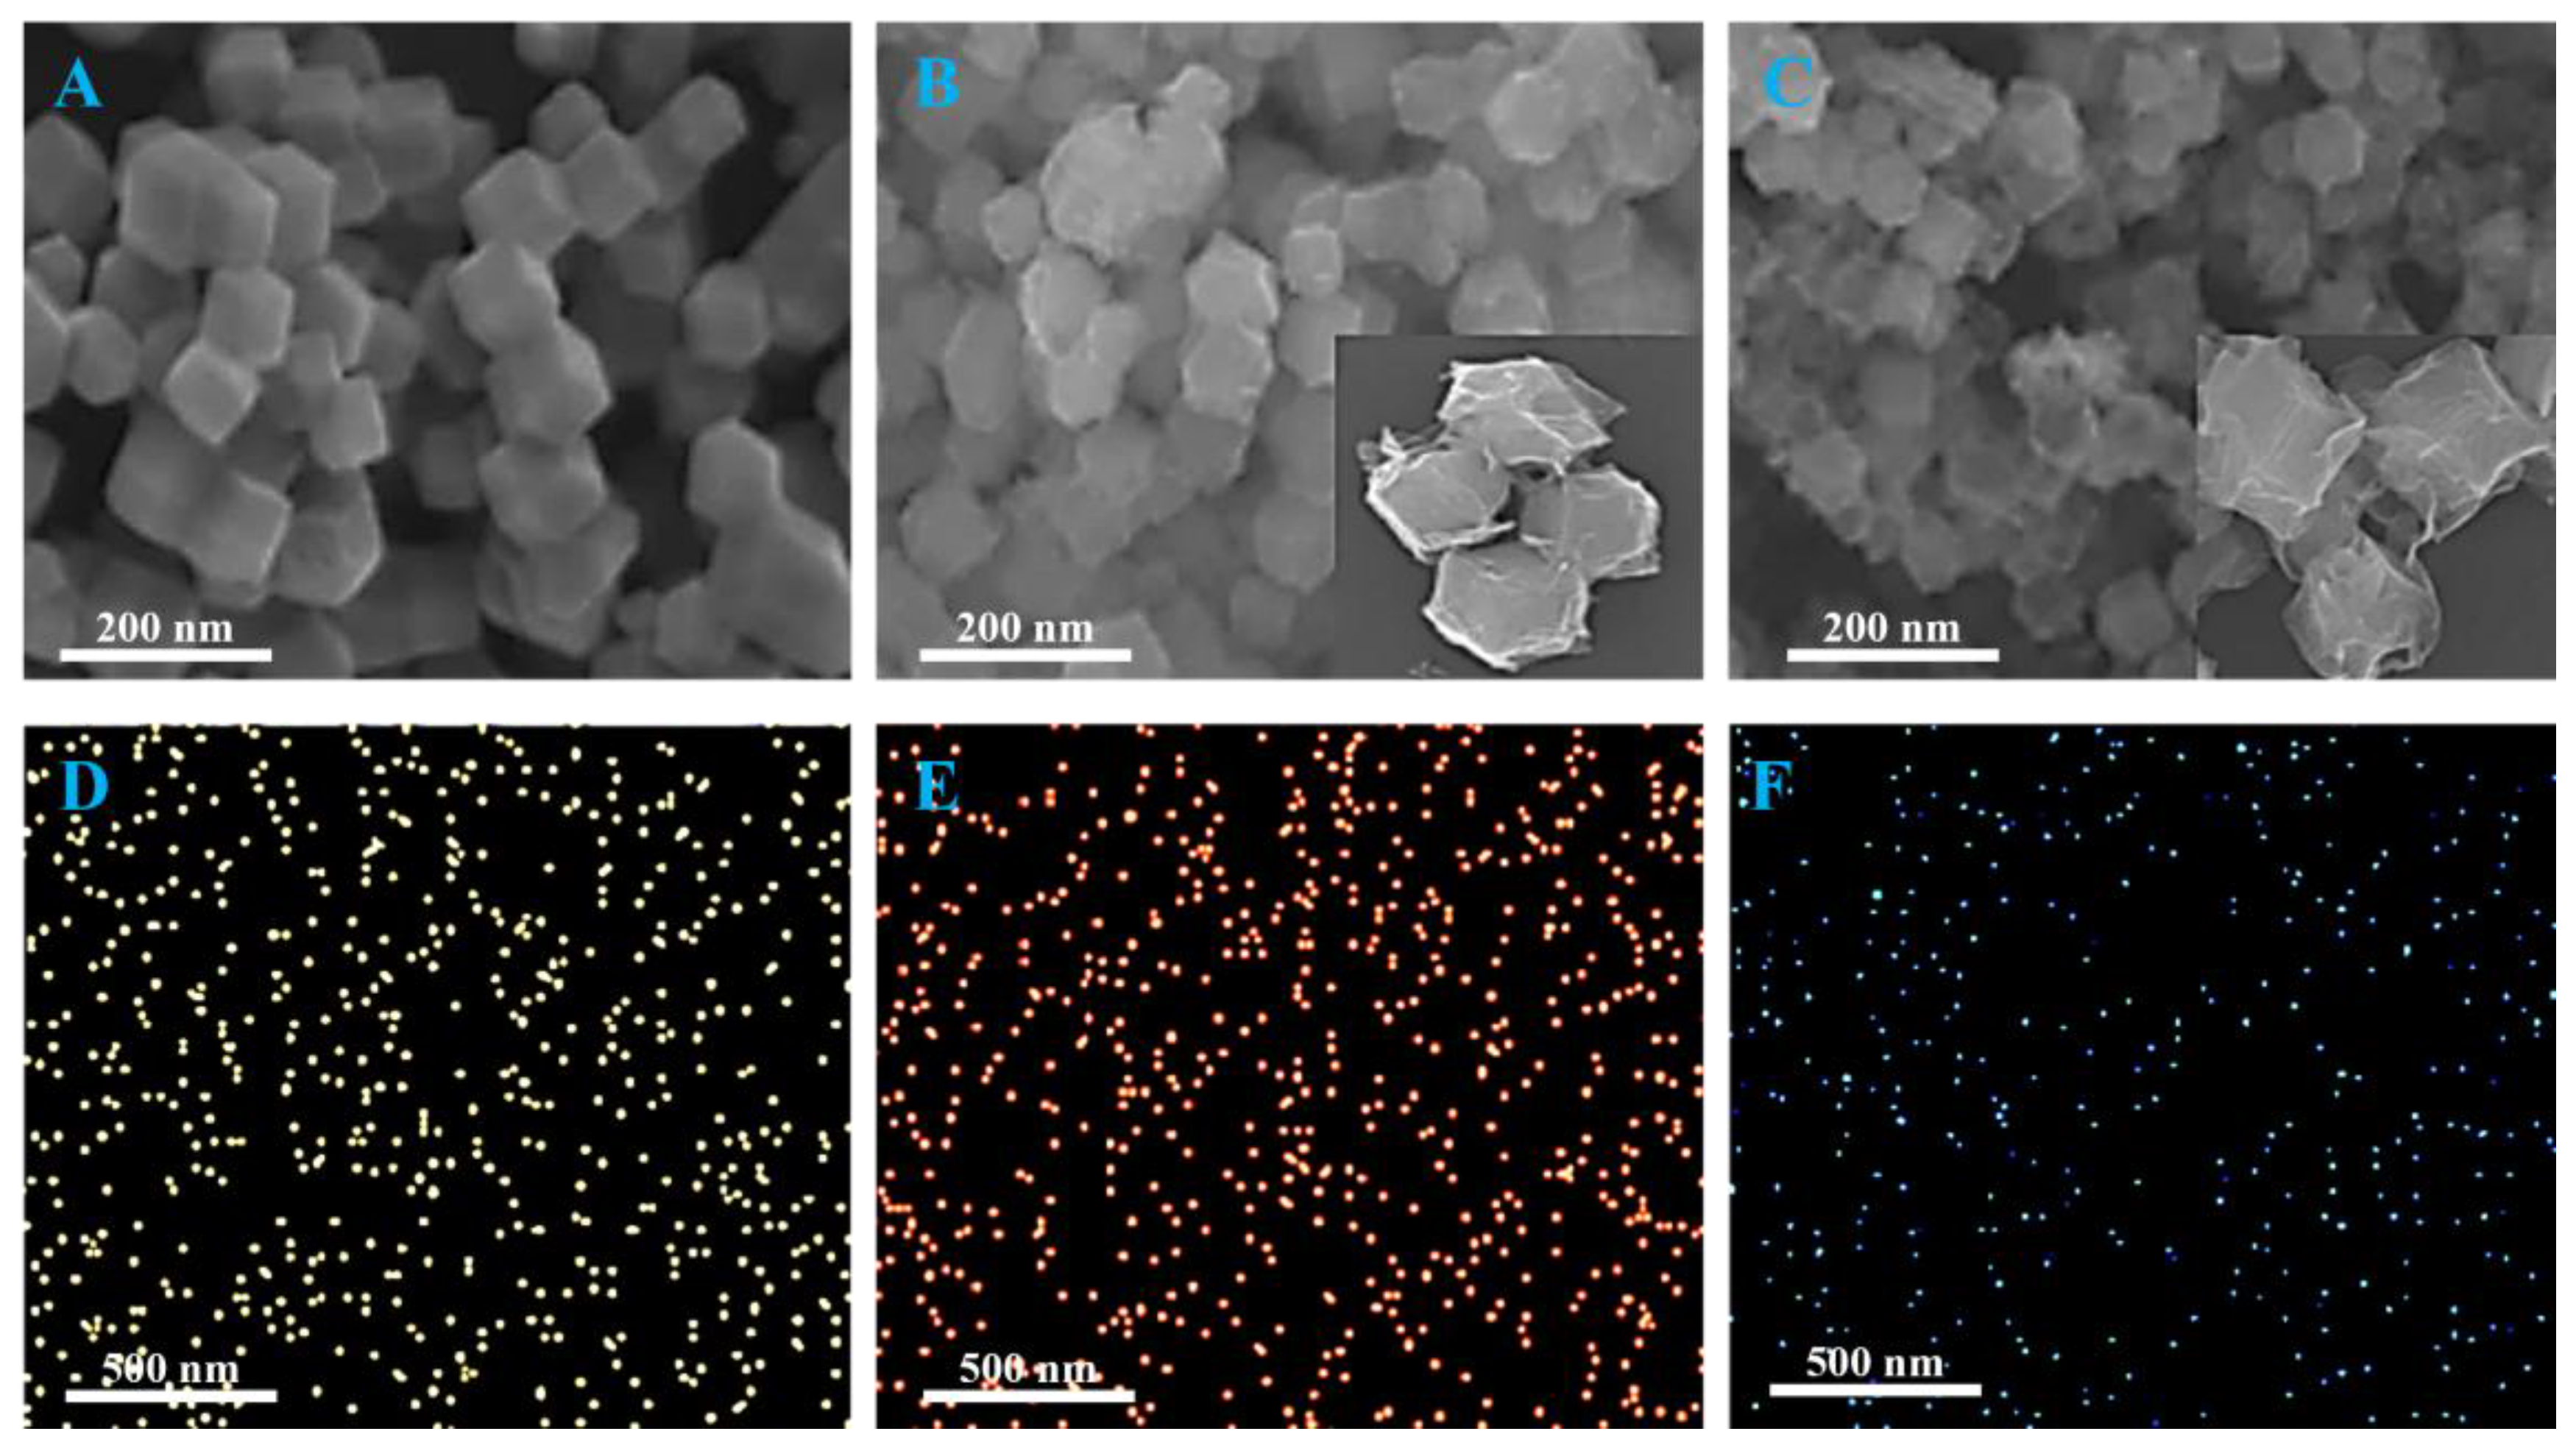
Figure 3. 5.
(A) CV characterization diagram of ECL-MIPs sensors:a. MWCNTs/GCE, b. AuNPs@Ru-ZIF8/MWCNTs/GCE, c. Ru-ZIF8/MWCNTs/GCE, d. MIPs/AuNPs@Ru-ZIF8/MWCNTs/GCE, e. NIPs/AuNPs@Ru-ZIF8/MWCNTs/GCE, f. Cyhalothrin /MIPs/AuNPs@Ru-ZIF8/MWCNTs/GCE;(B) DPV characterization diagram of ECL-MIPs sensors:a. MWCNTs/GCE, b. AuNPs@Ru-ZIF8/MWCNTs/GCE, c. Ru-ZIF8/MWCNTs/GCE, d. MIPs/AuNPs@Ru-ZIF8/MWCNTs/GCE, e. NIPs/AuNPs@Ru-ZIF8/MWCNTs/GCE, f. Cyhalothrin /MIPs/AuNPs@Ru-ZIF8/MWCNTs/GCE;(C) ECL characterization diagram of ECL-MIPs sensors:a. AuNPs@Ru-ZIF8/MWCNTs/GCE, b. Ru-ZIF8/MWCNTs/GCE, c. MIPs/AuNPs@Ru-ZIF8/MWCNTs/GCE, d. NIPs/AuNPs@Ru-ZIF8/MWCNTs/GCE, e. Cyhalothrin /MIPs/AuNPs@Ru-ZIF8/MWCNTs/GCE;.
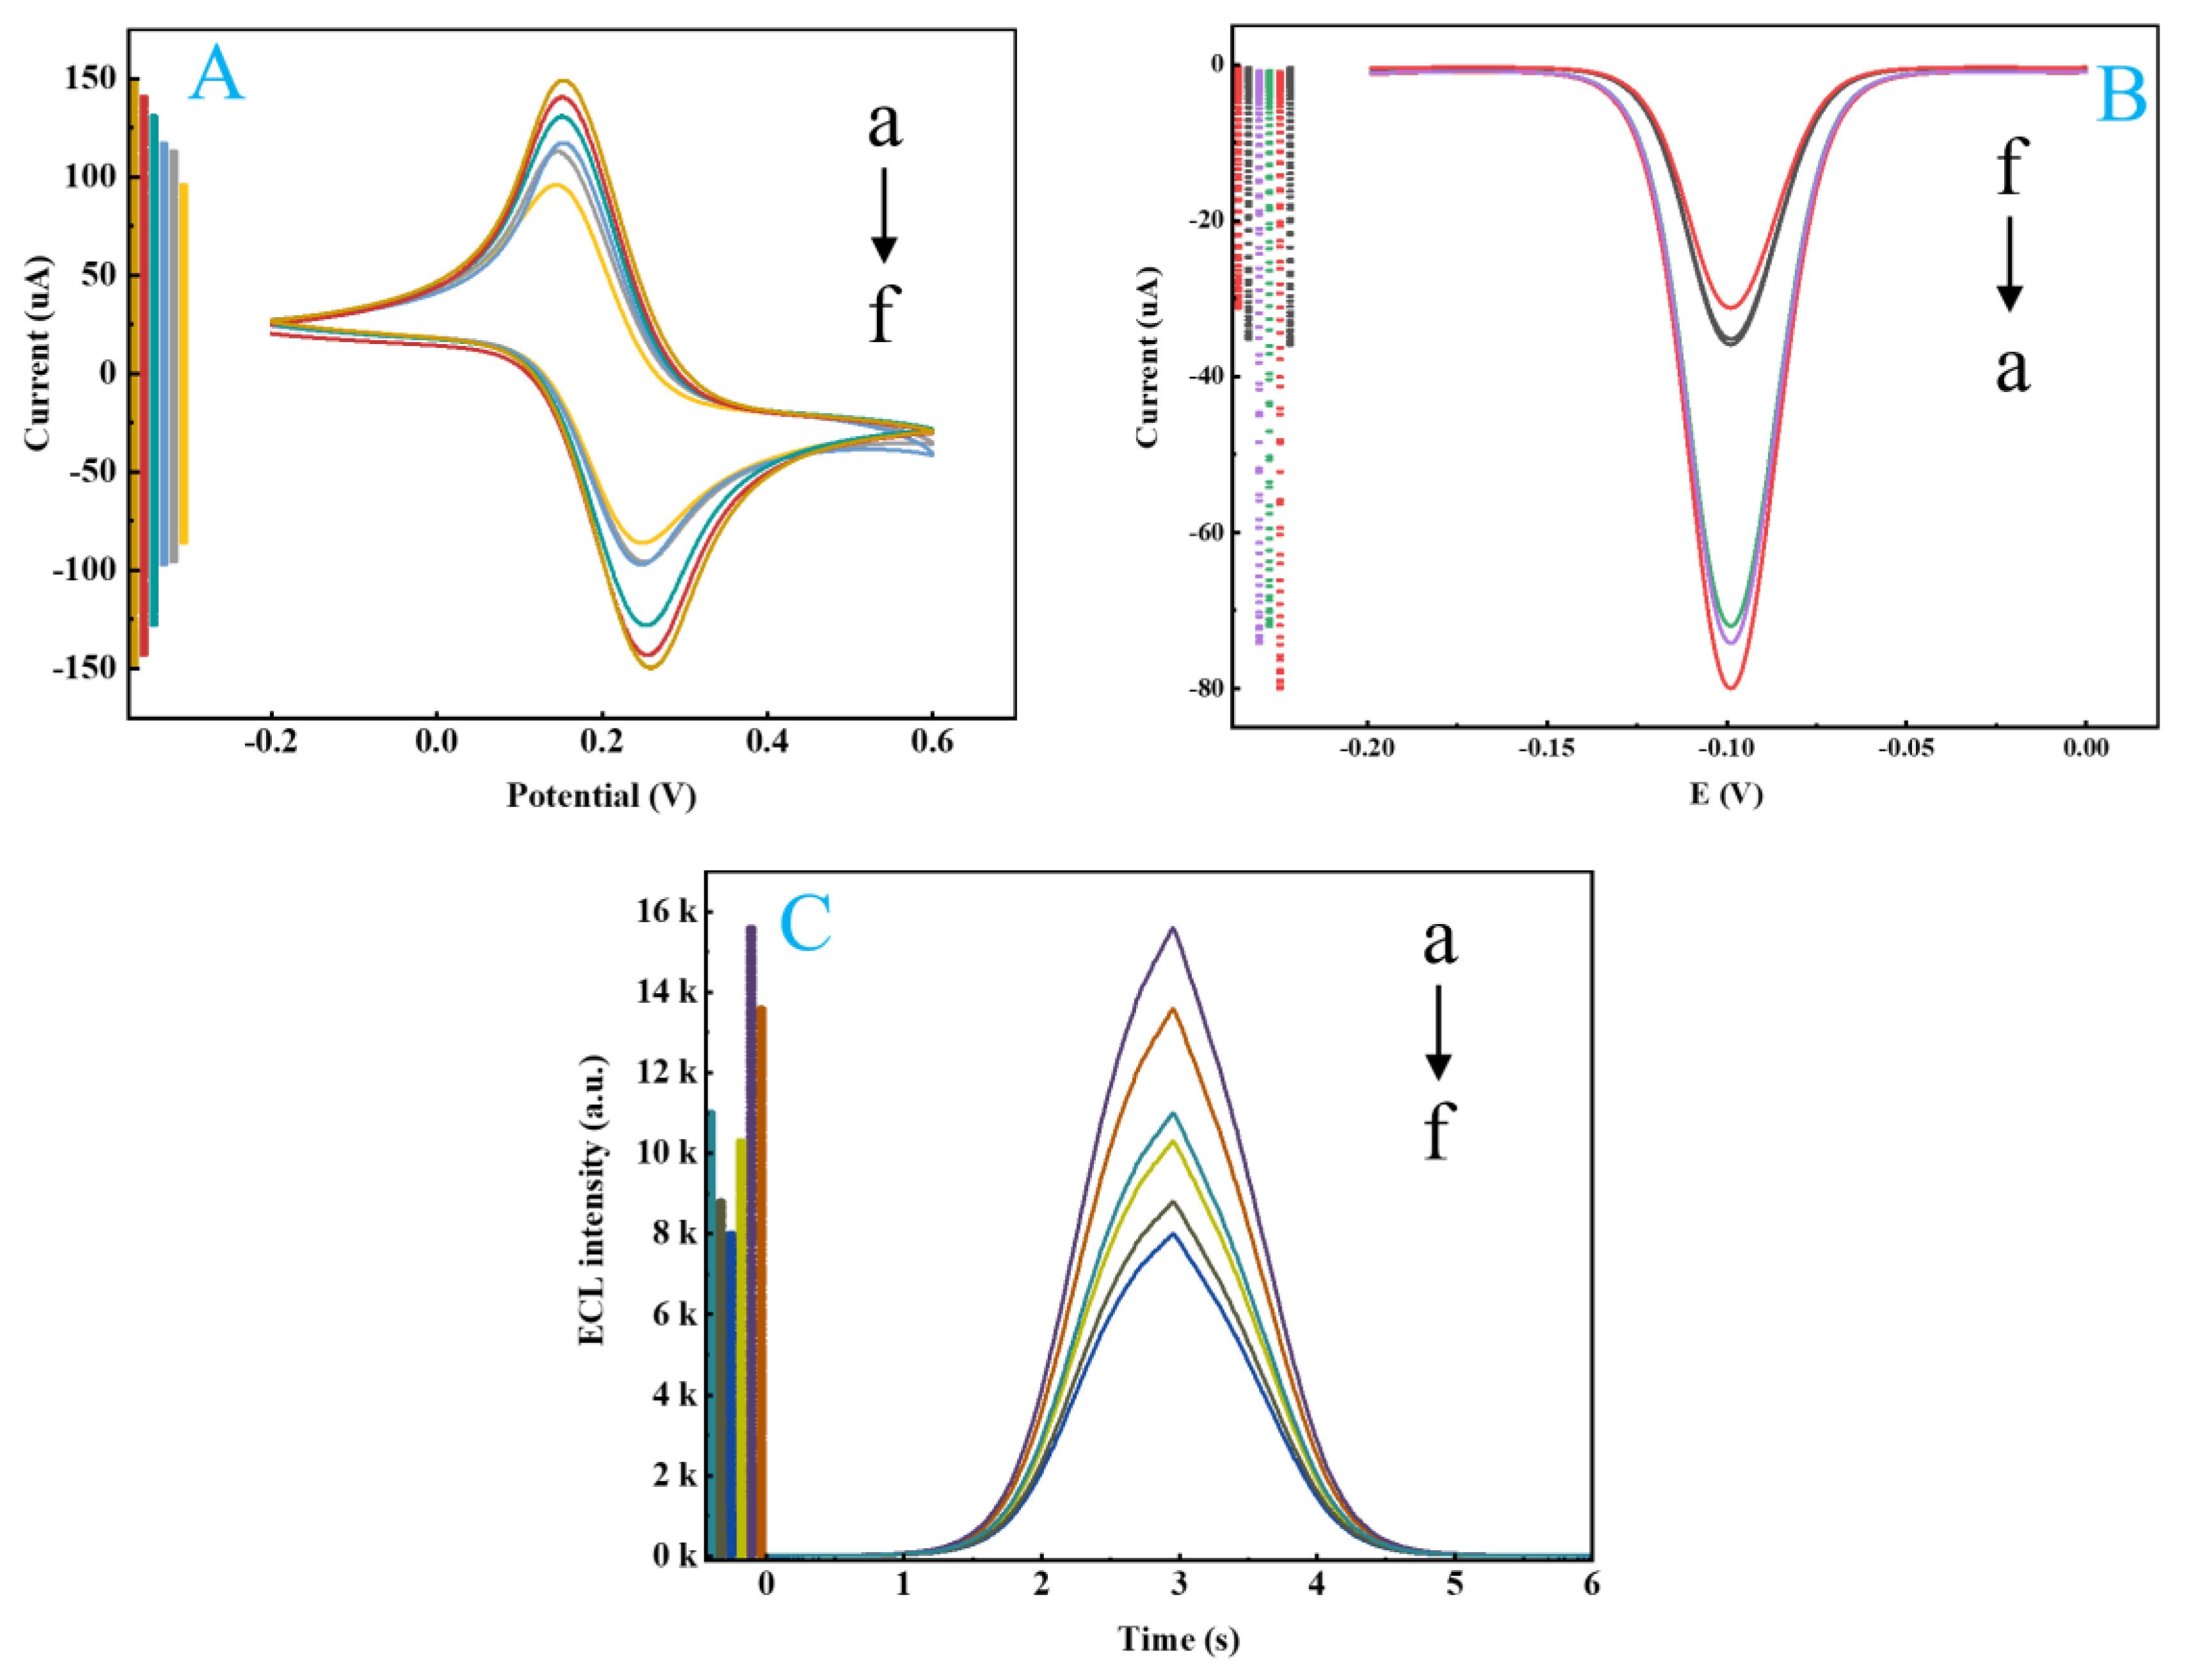
Figure 3. 6.
Optimization results of ECL-MIPs sensors: (A) electrical polymerization period; (B) pH of polymerization solution; (C) molar ratio of template molecules to functional monomers and (D) elution time of template molecules.
Figure 3. 6.
Optimization results of ECL-MIPs sensors: (A) electrical polymerization period; (B) pH of polymerization solution; (C) molar ratio of template molecules to functional monomers and (D) elution time of template molecules.
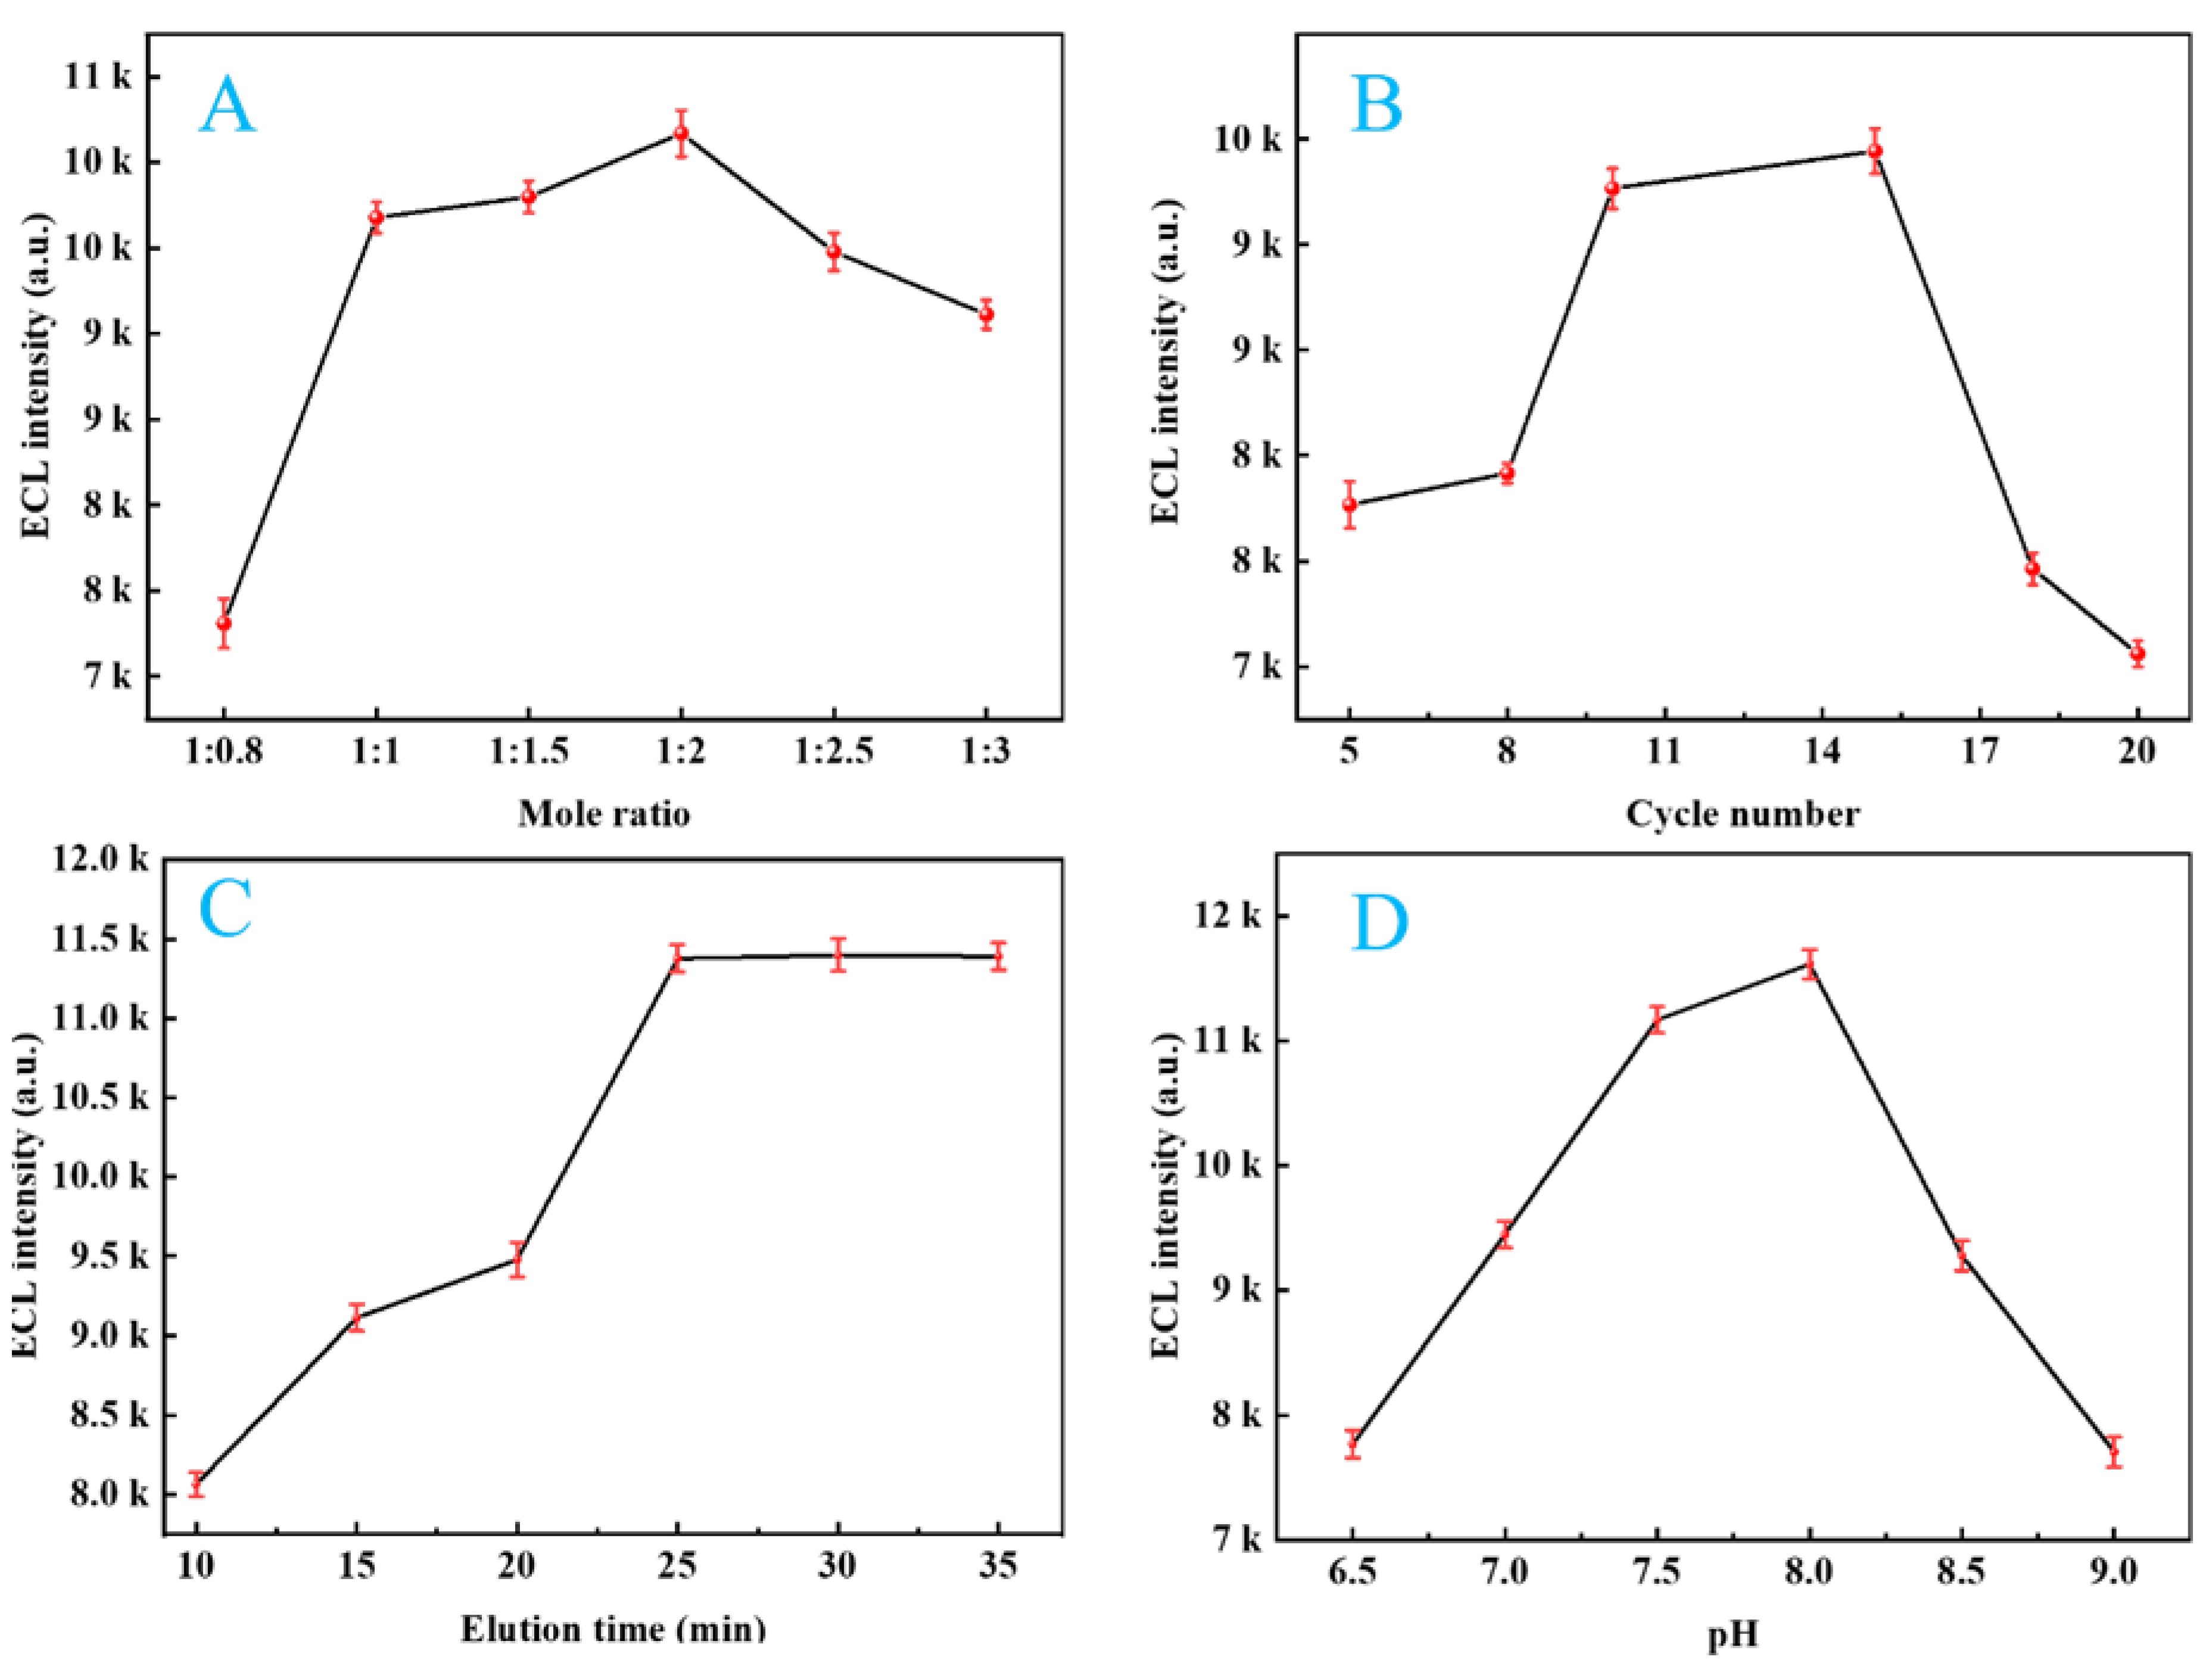
Figure 3. 7.
(A) Linear fitting curve of ECL-MIPs sensors; (B) Detection results at 9 groups of different Cyhalothrin concentrations.
Figure 3. 7.
(A) Linear fitting curve of ECL-MIPs sensors; (B) Detection results at 9 groups of different Cyhalothrin concentrations.
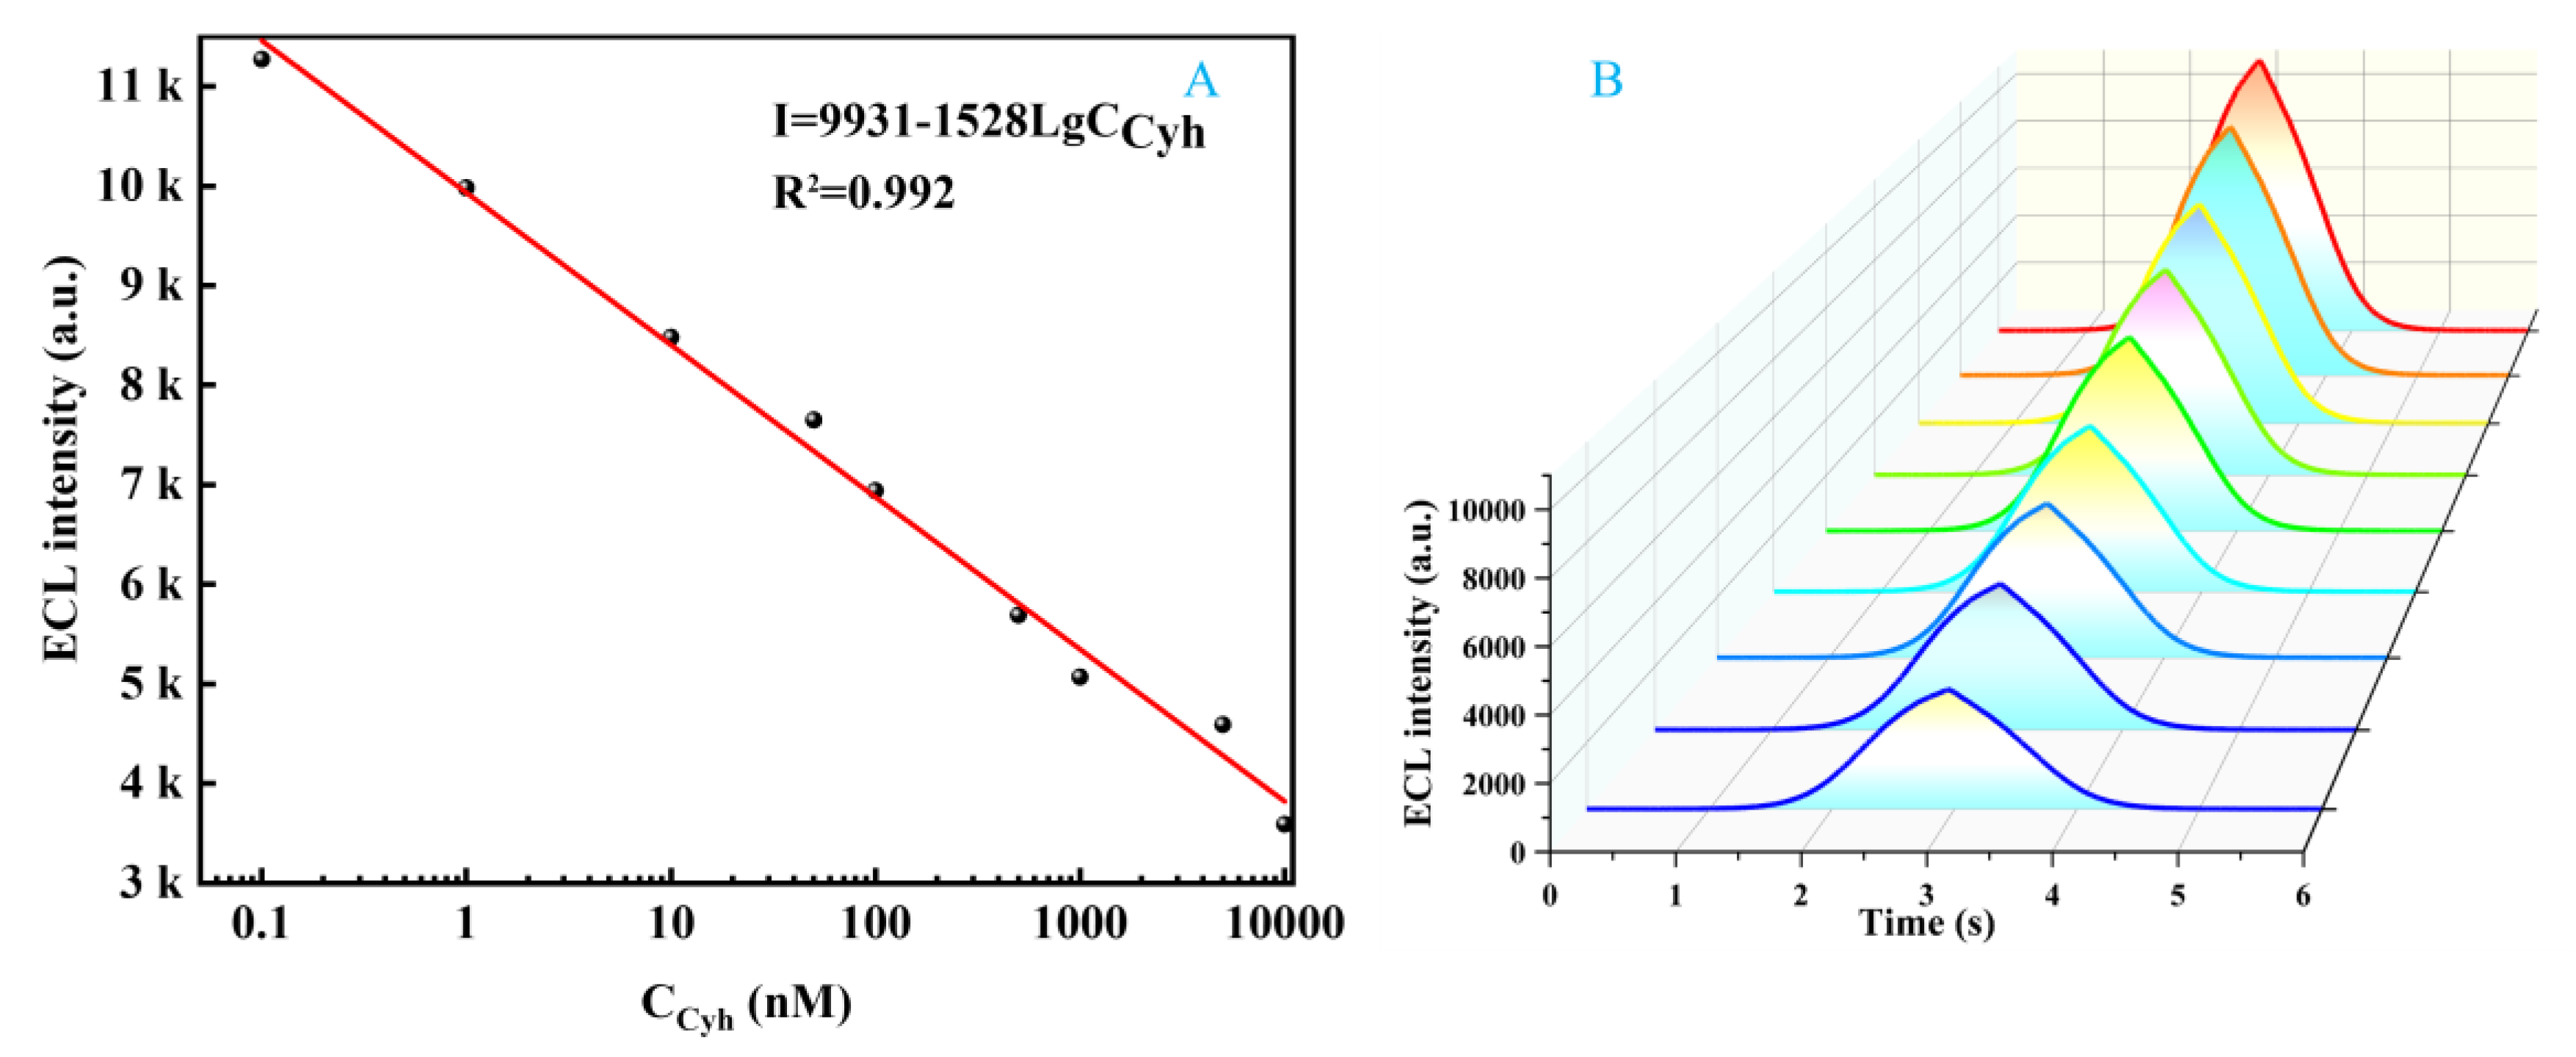
Figure 3. 8.
Stability, repetition and specificity test of ECL-MIPs sensors. (A) Stability assessment; (B) Repeatability assessment; (C) Specific assessment.
Figure 3. 8.
Stability, repetition and specificity test of ECL-MIPs sensors. (A) Stability assessment; (B) Repeatability assessment; (C) Specific assessment.
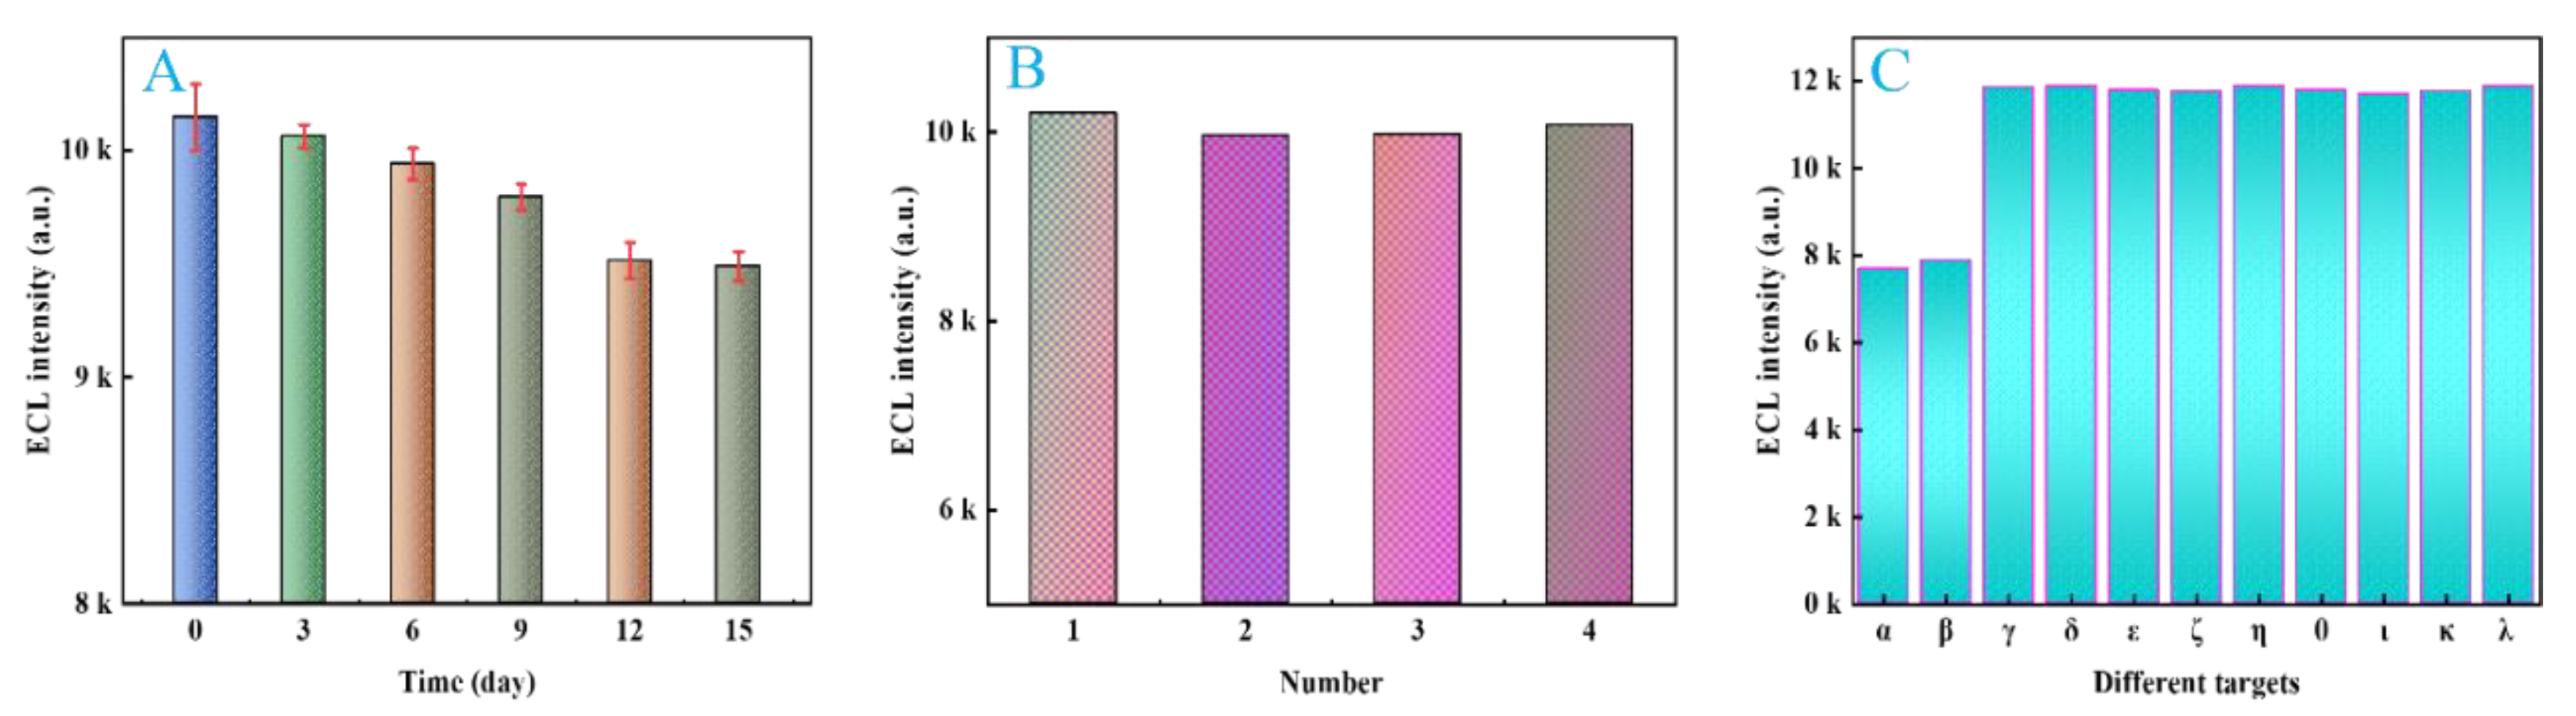

Table 3.3.
Test results of Cyhalothrin content in samples (N=3).
| Added amount (ng/ mL) | Method | detection value (ng/ mL) |
RSD (%) | Recovery rate (%) |
| 0 | LC-MS/MS ECL-MIPs |
0 0 |
- - |
- - |
| 10 | LC-MS/MS ECL-MIPs |
10.16 10.23±0.28 |
3.13 4.00 |
101.60 102.30 |
| 100 | LC-MS/MS ECL-MIPs |
107.02 106.50±4.60 |
5.10 4.55 |
107.02 116.50 |
Table 3.4.
Realistic ECL results of samples from different source.
| Source | ECL detection value | detection value (ng/mL) |
| Ningxia | 9170 | 1.42 |
| Gansu | 9020 | 1.79 |
| Qinghai | 9200 | 1.34 |
| Xinjiang | 8950 | 1.98 |
Disclaimer/Publisher’s Note: The statements, opinions and data contained in all publications are solely those of the individual author(s) and contributor(s) and not of MDPI and/or the editor(s). MDPI and/or the editor(s) disclaim responsibility for any injury to people or property resulting from any ideas, methods, instructions or products referred to in the content. |
© 2025 by the authors. Licensee MDPI, Basel, Switzerland. This article is an open access article distributed under the terms and conditions of the Creative Commons Attribution (CC BY) license (http://creativecommons.org/licenses/by/4.0/).
Copyright: This open access article is published under a Creative Commons CC BY 4.0 license, which permit the free download, distribution, and reuse, provided that the author and preprint are cited in any reuse.


