
Submitted:
23 December 2025
Posted:
25 December 2025
You are already at the latest version
Abstract
The exponential rise of microsatellite constellations offers unprecedented temporal resolution for urban monitoring. However, ensuring the radiometric integrity of these sensors over heterogeneous built environments remains a critical challenge due to low signal-to-noise ratios and spectral uncertainties. Traditional vicarious calibration relies on homogeneous pseudo-invariant calibration sites (PICS) in deserts, which fail to represent the spectral complexity and adjacency effects of urban landscapes. This study presents a novel triple-platform validation framework integrating ground (Hyperspectral), UAV (Multispectral), and satellite (Sentinel-2) data to bridge the "Point-to-Pixel" scale gap. We introduce a physics-informed "Double Calibration" protocol—combining the empirical line method with spectral response function convolution—and a block kriging spatial upscaling technique to mathematically model intra-pixel heterogeneity. Results from a 2025 campaign in a complex urban environment (Cheongju, Republic of Korea) demonstrate that simple point-averaging introduces significant representation errors (R^2\approx0.46 with time lag). In contrast, our UAV-based block kriging approach recovered high correlations even with a 1-day time lag and dramatically improved the coefficient of determination (R2) under simultaneous acquisition conditions: from 0.68 to 0.92 in the blue band and to 0.96 in the NIR band. Furthermore, quantitative spatial analysis identified artificial grass as the most stable "Urban PICS" (\sigma\approx0.020), whereas Asphalt exhibited unexpected high spatial heterogeneity (\sigma>\ 0.09) due to surface aging, challenging conventional assumptions. This framework establishes a rigorous, scalable standard for validating "New Space" data products in complex urban domains.
Keywords:
urban remote sensing
; radiometric calibration
; UAV upscaling
; block kriging
; urban PICS
; scale effect
; microsatellites
1. Introduction
The paradigm shift towards “New Space” has fundamentally democratized Earth observation, transitioning the field from a reliance on a few large, government-funded satellites to agile constellations of microsatellites. This explosion in orbital sensors provides the high-frequency revisit times—often daily or sub-daily—that are essential for operational smart city monitoring, disaster response, and rapid environmental assessment [1,2]. However, the utility of this data is frequently compromised by the physical limitations of the platforms themselves. Unlike flagship missions such as Landsat-9 or Sentinel-2, which carry large, strictly calibrated instruments, microsatellites often suffer from radiometric inconsistencies due to severe size, weight, and power constraints [3,4]. These hardware limitations result in lower signal-to-noise ratios and spectral instability, making the direct usage of raw data risky for scientific analysis. Consequently, establishing rigorous post-launch calibration and validation protocols is not merely a technical formality but a mandatory step to ensure these data products meet analysis ready data (ARD) standards [5]. While cross-calibration techniques are well-established for large, stable satellites [6], applying them to microsatellite constellations is complicated by distinct spectral bandwidth differences and orbital variability [7].
Historically, the remote sensing community has relied on pseudo-invariant calibration sites (PICS) located in vast, homogeneous deserts to monitor sensor degradation [8]. These sites offer spectral stability and minimal atmospheric interference. However, desert PICS fail to represent the spectral characteristics of urban environments, where the landscape is a complex mosaic of diverse materials [9]. This disconnect creates a critical validation challenge known as the “Scale Gap.” Attempting to validate a 10 m satellite pixel (100m2) using a ground spectroradiometer with a footprint of less than 1cm2 introduces significant representation errors [10,11]. In a heterogeneous urban scene, a single ground point measurement cannot account for the spectral mixing of asphalt, concrete, vegetation, and varying shadow depths that exist within the satellite’s instantaneous field of view. This representation error is widely recognized as the dominant source of uncertainty in urban remote sensing [12], necessitating the development of advanced scaling methods that go beyond simple arithmetic aggregation [13].
To address this spatial disconnect, unmanned aerial vehicles (UAVs) have emerged as a potential “spatial bridge” capable of linking discrete ground points with broad satellite pixels [14,15]. Operating at low altitudes, UAVs can capture intra-pixel heterogeneity at centimeter-level resolution, revealing the fine-scale texture of the urban surface [16]. Despite this potential, current validation methodologies often underutilize UAVs, treating them merely as high-resolution cameras rather than scientific radiometers. Researchers frequently apply simple linear averaging to upscale UAV data to satellite resolution [17]. This approach is mathematically flawed for complex surfaces as it neglects spatial covariance and adjacency effects—physical phenomena where photons from bright surfaces (like concrete roofs) scatter into adjacent dark pixels (like shadowed streets) [18]. Recent reviews emphasize that for UAVs to serve as reliable validation tools, they must be operated under rigorous radiometric protocols comparable to those used for satellite sensors [19,20].
Furthermore, the remote sensing field is increasingly moving towards physics-informed deep learning to handle tasks such as spectral super-resolution and multi-source data fusion [21,22]. While deep learning offers immense promise for cross-calibration and data enhancement [23], these “black box” models rely heavily on high-quality training data that accurately represents surface heterogeneity [24]. If the training data contains representation errors due to improper upscaling, the resulting artificial intelligence (AI) models will be fundamentally flawed. Therefore, establishing a robust, physics-based physical validation framework is a critical prerequisite for training the next generation of artificial intelligence models for Earth observation [25].
This study proposes a comprehensive, physics-informed multi-scale validation framework specifically designed to overcome the challenges of urban environments. First, we aim to operationalize the concept of “Urban PICS” by statistically identifying stable urban surfaces—such as artificial grass—that can replace traditional desert sites for operational calibration in built environments. Second, to rigorously bridge the scale gap, we apply block kriging rather than simple averaging to upscale UAV data. This geostatistical approach mathematically models intra-pixel heterogeneity, preserving the spatial variance that is often lost in linear aggregation. Finally, we implement a “Double Calibration” protocol that integrates spectral response function (SRF) convolution and linear radiometric correction. This step transforms commercial UAV sensors into precision transfer radiometers, ensuring that the bridge between ground truth and satellite observations is physically consistent and traceable.
2. Materials and Methods
2.1. Study Area and Design
The research was conducted at the Chungbuk National University campus in Cheongju, Chungcheongbuk-do, Republic of Korea (36°37’N, 127°27’E). This site acts as a “Digital Twin” of a complex city [26], characterized by an intricate mixture of artificial structures, such as roads and buildings, and diverse natural vegetation. Such spatial complexity makes it an optimal testbed for evaluating the impact of spatial heterogeneity on satellite radiometric validation (Figure 1). To comprehensively assess the proposed upscaling framework, we selected five distinct surface types commonly observed in urban environments: asphalt (Roads), urethane track (Sports facilities), artificial grass, natural grass, and permeable concrete blocks (Sidewalks). These targets were chosen to represent a broad range of spatial homogeneity, from the highly uniform appearance of asphalt to the textured, heterogeneous patterns of concrete blocks, allowing for the rigorous testing of spectral unmixing and scaling effects [27].
The selection of the five surface types was driven by the need to represent the full spectrum of urban heterogeneity. Asphalt, typically used for roads, represents a surface with high thermal capacity and potential aging effects, such as aggregate exposure and micro-cracking. Urethane tracks, common in school zones, provide a spectrally uniform synthetic surface with high durability. Artificial grass mimics vegetation but offers spectral stability unaffected by chlorophyll/water content fluctuations, making it an ideal candidate for invariant calibration. Conversely, natural grass introduces biological variability, serving as a dynamic target sensitive to soil moisture and phenological stages. Finally, permeable concrete blocks represent the most heterogeneous surface, characterized by a complex texture of geometric patterns and interstitial gaps filled with soil or vegetation. Validating satellite data over such diverse targets ensures the robustness of the proposed framework across various urban scenarios.
2.2. The Triple-Platform Data Acquisition
To rigorously track surface reflectance from the ground to space, this study adopted a three-tiered acquisition strategy (Figure 2). Data collection was conducted through two campaigns on June 23, 2025, and July 10, 2025, to establish a multi-scale radiometric dataset integrating ground, UAV, and satellite observations. Notably, the June 23 dataset involved a one-day time lag between the UAV flight and the satellite overpass due to the orbital schedule, whereas the July 10 dataset represents a fully concurrent acquisition, allowing for an assessment of temporal mismatch effects.
The first tier (Ground) involved ground-based measurements utilizing a PSR-2500 Spectroradiometer (Spectral Evolution, Haverhill, MA, USA), covering a spectral range of 350–2500 nm with 1 nm resolution. This instrument served as the absolute radiometric standard traceable to physical units [28]. To ensure representativeness for each land cover type, spectral reflectance was measured at 10 randomly selected points per class. A calibrated 99% white reference panel was utilized prior to each measurement to minimize errors caused by solar irradiance variations and to convert radiance to absolute reflectance.
The second tier (Air) utilized a DJI Matrice 300 RTK UAV (Shenzhen, China) equipped with a MicaSense RedEdge-MX Dual camera (Seattle, WA, USA). This 10-band multispectral sensor captures wavelengths from coastal blue to near-infrared (NIR), closely matching the spectral configuration of the Sentinel-2 satellite. The UAV flights were conducted under clear-sky conditions at an altitude of 150 m above ground level, yielding a ground sampling distance of approximately 10 cm. This ultra-high spatial resolution was essential for capturing the spatial variance required for upscaling [29], enabling the identification of micro-scale surface features such as cracks in asphalt or gaps between concrete blocks.
Finally, the third tier (Space) targeted satellite data from Sentinel-2 Level-2A (Bottom-of-atmosphere reflectance) products, which serve as the reference standard due to their well-documented radiometric performance [30]. We utilized the 10 m (Blue, Green, Red, NIR) and 20 m (Red Edge) resolution bands for comparison with the upscaled UAV data. All imagery underwent precise geometric correction to ensure pixel-to-pixel alignment across the multi-scale dataset.
2.3. Physics-Based Preprocessing: SRF Convolution
To resolve the spectral mismatch between the continuous ground data and discrete satellite bands, we calculated the weighted average of the ground hyperspectral data according to the SRF of Sentinel-2 to compute the ground reflectance for each band [31,32]. At this time, the relative spectral response (RSR), which normalizes the SRF to a value between 0 and 1, was applied as a weight to calculate the weighted average. This step is critical because direct comparison of band-center reflectance leads to significant errors in broad-band sensors [33,34].
where, represents the simulated satellite reflectance for a specific band, derived by integrating the ground-measured hyperspectral reflectance, . This integration is weighted by the satellite sensor’s RSR function, , which describes the sensor’s sensitivity across different wavelengths. The variables and define the lower and upper wavelength limits of the specific spectral band being simulated. By normalizing this weighted integral with the total area under the sensor’s response curve, the equation yields a single reflectance value that physically replicates what the satellite sensor would observe, ensuring spectral consistency between the high-resolution ground measurements and the discrete, broad bands of the satellite sensor.
Table 1 details the spectral matching parameters used to ensure physical comparability between Sentinel-2 and the UAV sensor (RedEdge-MX Dual).
2.4. The “Double Calibration” Protocol
Commercial UAV sensors, despite their high spatial resolution, often rely on non-metric detectors that suffer from inherent radiometric instabilities, including vignetting effects and significant sensor bias [35]. To mitigate these hardware limitations and transform the drone into a precision transfer radiometer, we implemented a rigorous “Double Calibration” protocol consisting of two sequential correction stages. First, the empirical line method (ELM) was applied to strictly linearize the sensor’s response. This process utilized eight standardized calibration tarps with reflectance values ranging from 3% to 56%, ensuring an accurate conversion from raw surface reflectance to physical reflectance units across the full dynamic range of the urban scene [36]. Subsequently, to eliminate residual systematic offsets that the ELM might miss, we performed a secondary spectral fine-tuning. This critical step involved deriving a specific bias correction factor by cross-referencing the UAV data with ground hyperspectral measurements that had been mathematically convolved with the satellite’s SRF. This physics-informed adjustment ensures optimal spectral alignment between the airborne bridge and the satellite target, adhering to established best practices for high-fidelity remote sensing [37,38].
2.5. Spatial Upscaling: Block Kriging
Simple aggregation methods, such as arithmetic averaging, face significant difficulties in calculating satellite pixel reflectance because they fundamentally ignore the spatial structure and variance inherent in heterogeneous urban surfaces. To rigorously address this limitation, this study utilized high-resolution UAV reflectance values—previously corrected via the “Double Calibration” protocol—and applied block kriging to upscale the data to the satellite’s resolution [39]. Unlike simple averaging, which treats all sub-pixels equally, block kriging is a geostatistical method that estimates the average value of a variable over a finite area (the block) by explicitly modeling the spatial autocorrelation structure through a variogram [40]. This approach allows for the mathematical integration of intra-pixel heterogeneity, effectively accounting for the “support effect” where data variance relies on the size of the sampling unit. Consequently, block kriging minimizes the estimation error variance and provides a best linear unbiased prediction of the surface reflectance. This results in a validation dataset that offers a superior, physics-based representation of the satellite sensor’s actual integrated energy response compared to traditional linear averaging [41].
3. Results
3.1. Verification of UAV Radiometry
The radiometric consistency of the UAV reflectance products, processed via the proposed “Double Calibration” protocol, was rigorously verified through a cross-comparison with Sentinel-2 Level-2A satellite data. This assessment utilized datasets from two distinct campaigns: the first on June 23, 2025, which involved a one-day time lag between UAV and satellite acquisitions, and the second on July 10, 2025, which featured fully concurrent observations.
Initially, the stability of the primary calibration step was confirmed through the ELM. As illustrated in Figure 3, the relationship between the UAV’s raw digital numbers and the reflectance of the eight calibration tarps demonstrated excellent linearity (R2 > 0.99) for both campaign dates, ensuring the sensor’s linear response prior to spectral tuning.
The analysis of the June 23 data revealed robust correlations despite the temporal mismatch. The near-infrared (NIR) band (UAV Band 10 vs. Sentinel-2 Band 8) achieved a notably high coefficient of determination (R2 = 0.952), and the red band (Band 6 vs. Band 4) also maintained strong linearity (R2 = 0.925). However, the presence of the time lag resulted in higher root mean square error (RMSE) values (e.g., 0.080 in NIR) compared to the simultaneous campaign, reflecting minor atmospheric or surface state variations.
In contrast, the July 10 campaign demonstrated superior data quality and outstanding physical consistency due to the simultaneous acquisition. Correlation coefficients significantly improved across the visible spectrum, with the blue (R2 = 0.951), green (R2 = 0.953), and red (R2 = 0.976) bands all exceeding 0.95. The NIR band sustained this high performance with an R2 of 0.959. Table 2 corroborates this validation, showing a marked reduction in error metrics. Notably, the RMSE for the blue band decreased from 0.052 in June to 0.015 in July, confirming the Double Calibration protocol’s effectiveness in establishing precise radiometric consistency.
3.2. Identification of “Urban PICS”
In this study, the spatial homogeneity of various surface types was quantitatively evaluated by calculating the standard deviation () for each spectral band using ultra-high resolution UAV imagery and averaging the results. Data acquired on June 23 and July 10, 2025, were used for the analysis, and the comparative results by period are presented in Table 3.
The analysis results showed that artificial grass recorded an average standard deviation of approximately 0.020 in both periods, exhibiting the lowest spatial variability among the analyzed targets. This indicates that artificial grass maintains excellent spatial homogeneity while ensuring temporal stability, confirming it as an optimal target for urban PICS.
On the other hand, natural grass demonstrated high spatial homogeneity with a low standard deviation in the June data, but variation in deviation was observed when comparing it with the July data. This variability is attributed to seasonal factors such as vegetation growth and maintenance conditions. Therefore, while natural grass may be spatially homogeneous at a specific point in time, its temporal stability may be somewhat compromised, requiring caution when using it as a pseudo-invariant calibration target.
Urethane track showed relatively decent stability with an average standard deviation of 0.030. However, Block and Asphalt recorded high standard deviations exceeding 0.043 and 0.092, respectively, revealing significant spatial heterogeneity. In particular, the high variability observed in asphalt is interpreted as a reflection of fine surface heterogeneity such as cracks or surface aging, suggesting that a cautious approach is needed when utilizing asphalt as a single PICS.
In conclusion, this analysis confirms that artificial grass possesses the most suitable spectral characteristics as an Urban PICS for radiometric calibration within urban areas.
3.3. Validation Accuracy Assessment
The accuracy of the triple-platform framework was quantitatively evaluated by comparing Sentinel-2 satellite imagery with ground/UAV-based observation values. In particular, we compared and analyzed the results of the June campaign, where a 1-day lag occurred between satellite (6/22) and UAV (6/23) acquisition, and the July campaign, where all data was acquired on the same day (7/10), to verify the importance of temporal synchronization and the utility of the upscaling technique (Table 4).
The analysis results showed that in the June campaign, the accuracy of the ‘Raw Ground Points’ method was very low () due to changes in atmospheric and illumination conditions caused by the time lag. Specifically, the red edge band showed the lowest correlation with an R2 of 0.35. However, when block kriging was applied, despite the presence of the time lag, R2 improved significantly to the level of 0.55 (Red Edge) – 0.85 (NIR), demonstrating that the UAV’s spatial correction can partially offset errors caused by the time lag (Figure 4).
In the July campaign, where data was acquired on the same day, the performance of block kriging was maximized. R2 exceeded 0.90 in most bands, and in particular, the NIR band showed the highest agreement with R2 = 0.96. While the red edge band showed a slightly lower raw correlation (R2 = 0.40), the application of block kriging recovered this to 0.54, reducing the RMSE from 0.096 to 0.071. This suggests that while block kriging improves data consistency, certain bands like red edge band may remain sensitive to spectral mixing or bidirectional reflectance distribution function effects in complex urban scenes.
4. Discussion
4.1. UAVs as Time-Lag Mitigators and Spatial Integrators
This study fundamentally reassesses the sources of error in urban radiometric validation, demonstrating that the primary challenge is not merely the scale difference, but the compounding effect of spatial representation errors and temporal mismatches. Traditional validation methods, which rely on point-based ground measurements, fail to account for the “spectral cocktail” inherent in a 10 m urban pixel. Our results confirm that this limitation is severe. Even a one-day time lag between ground and satellite acquisition causes the coefficient of determination (R2) to drop sharply below 0.5 when using simple point averaging. However, the application of UAV-based block kriging offers a robust solution. By mathematically modeling the spatial covariance of the surface, this technique effectively integrates the heterogeneous contributions of shadows, interstitial gaps, and texture to match the satellite sensor’s integrated energy response. This process creates a “buffer effect” that stabilizes validation metrics, recovering high correlations even when strict temporal synchronization is impossible. Consequently, UAVs serve not just as high-resolution cameras, but as essential spatial bridges that operationalize calibration campaigns in complex environments where simultaneous satellite overpasses cannot be guaranteed.
4.2. The Necessity of Physics-Informed Approaches
The successful implementation of SRF convolution and the “Double Calibration” protocol highlights that reliance on simple statistical correlation is inadequate for traceable metrology. Commercial UAV sensors often exhibit non-linear biases that cannot be corrected through simple regression alone. To achieve the stringent uncertainty targets required for modern constellation validation, it is mandatory to physically model both the sensor’s specific spectral response [31] and the surface’s spatial structure [14]. Our framework ensures physical consistency by convolving high-resolution ground spectra with satellite band passes before upscaling, thereby removing spectral mismatches. This rigorous, physics-informed approach enables the clear differentiation of spectrally similar surface types [43,44], establishing a validation standard that supports the training of highly accurate, physics-aware AI models for future remote sensing applications.
4.3. Re-Evaluation of Urban PICS: Asphalt vs. Artificial Grass
A critical finding of this study is the quantitative re-evaluation of potential “Urban PICS”. While asphalt has traditionally been viewed as a stable calibration target in urban remote sensing [42], our ultra-high-resolution analysis reveals significant limitations. Asphalt exhibited high spatial heterogeneity () driven by surface aging effects, such as micro-cracking and exposed aggregates, which introduce unpredictable spectral noise at the pixel scale. This variability suggests that asphalt is unsuitable for single-pixel radiometric validation. In stark contrast, artificial grass demonstrated superior stability, maintaining a consistently low standard deviation () across both temporal campaigns. This identifies artificial grass as an optimal Urban PICS candidate, offering both the spatial homogeneity of a desert site and the temporal durability required for frequent monitoring. While natural grass also exhibited spatial homogeneity, its susceptibility to phenological changes—such as seasonal growth and moisture variation—limits its reliability as a constant reference target.
5. Conclusions
This study successfully established and demonstrated a robust, physics-informed UAV upscaling framework designed to bridge the persistent “Scale Gap” between ground observations and satellite measurements in complex urban environments. By integrating SRF convolution, a rigorous “Double Calibration” protocol, and geostatistical block kriging into a unified workflow, we achieved a high-precision radiometric validation of Sentinel-2 imagery using 10 cm ultra-high-resolution UAV data.
The quantitative findings of this research highlight three critical implications for the remote sensing community:
First, the proposed block kriging method demonstrated significantly superior validation accuracy compared to traditional point-based averaging methods. The upscaled UAV reflectance exhibited a high coefficient of determination () and minimized RMSE across visible and near-infrared bands when compared with Sentinel-2 Level-2A products. This provides compelling evidence that accounting for the spatial structure of heterogeneous surfaces through variogram modeling is not merely an enhancement but a necessity for accurate upscaling in built environments.
Second, we presented a fundamental re-evaluation of “Urban PICS” through ultra-high-resolution spatial analysis. Contrary to conventional wisdom, asphalt exhibited significant spatial heterogeneity () due to surface aging, micro-cracks, and aggregate exposure, rendering it less ideal for high-precision validation7. In contrast, artificial grass and urethane tracks demonstrated superior spatial homogeneity () and temporal stability. Therefore, we propose these synthetic materials as the new standard for “Urban PICS” candidates for the radiometric validation of high-resolution sensors.
Third, we quantitatively confirmed the critical impact of temporal synchronization on validation accuracy. A comparison between the June 23 dataset (1-day time lag) and the concurrently observed July 10 dataset revealed that the concurrent data yielded significantly lower RMSE and higher correlation (e.g., R2 recovery from 0.68 to 0.92 in the blue band). This implies that even a single day’s lag can introduce substantial validation uncertainty due to changes in atmospheric conditions or surface moisture. However, our results also indicate that the UAV spatial upscaling technique acts as a buffer, partially mitigating these errors when strict synchronization is operationally unfeasible.
In summary, the framework proposed in this study is a sensor-agnostic methodology applicable to a wide range of remote sensing platforms. It provides a scalable and automated validation standard for ensuring the ARD quality of next-generation satellite constellations operating in urban environments. Future research will aim to extend this work by automating the processing workflow and incorporating hyperspectral UAV sensors to further minimize spectral mismatch errors, ultimately facilitating the creation of AI-ready datasets for smart city monitoring.
Author Contributions
Conceptualization, D.-H.L., J.-H.P. and S.-H.G.; methodology, S.-H.G.; software, S.-H.G. and W.-K.J.; validation D.-H.L., J.-H.P., S.-H.G. and W.-K.J.; formal analysis, S.-H.G.; investigation, S.-H.G. and W.-K.J.; resources, S.-H.G. and J.-H.P.; data curation, S.-H.G.; writing—original draft preparation, S.-H.G.; writing—review and editing, J.-H.P.; visualization, S.-H.G.; supervision, J.-H.P.; project administration, J.-H.P.; funding acquisition, J.-H.P. All authors have read and agreed to the published version of the manuscript.
Funding
This research was supported by the Regional Innovation System & Education (RISE) program through the (Chungbuk Regional Innovation System & Education Center), funded by the Ministry of Education (MOE) and the (Chungcheongbuk-do), Republic of Korea. (2025-RISE-11-014-01).
Data Availability Statement
The data presented in this study are available on request from the corresponding author. The data are not publicly available due to privacy restrictions of the university campus testbed.
Conflicts of Interest
The authors declare no conflicts of interest.
References
- Belward, A.S.; Skøien, J.O. Who launched what, when and why; trends in global land-cover observation capacity from civilian earth observation satellites. ISPRS J. Photogramm. Remote Sens. 2015, 103, 115-128. [CrossRef]
- Marcuccio, S.; Ullo, S.; Carminati, M.; Kanoun, O. Smaller Satellites, Larger Constellations: Trends and Design Issues for Earth Observation Systems. IEEE Aerosp. Electron. Syst. Mag. 2019, 34, 50-59. [CrossRef]
- Czapla-Myers, J.; McCorkel, J.; Anderson, N.; Thome, K.; Biggar, S.; Helder, D.; Aaron, D.; Leigh, L.; Mishra, N. The Ground-Based Absolute Radiometric Calibration of Landsat 8 OLI. Remote Sens. 2015, 7, 600-626. [CrossRef]
- Tu, Y.-H.; Johansen, K.; Aragon, B.; El Hajj, M.M.; McCabe, M.F. The radiometric accuracy of the 8-band multi-spectral surface reflectance from the planet SuperDove constellation. Int. J. Appl. Earth Obs. Geoinf. 2022, 114, 103035. [CrossRef]
- Bradburn, J.; Aksoy, M.; Apudo, L.; Vukolov, V.; Ashley, H.; VanAllen, D. ACCURACy: A Novel Calibration Framework for CubeSat Radiometer Constellations. Remote Sens. 2025, 17, 486. [CrossRef]
- Chander, G.; Hewison, T.J.; Fox, N.; Wu, X.; Xiong, X.; Blackwell, W.J. Overview of Intercalibration of Satellite Instruments. IEEE Trans. Geosci. Remote Sens. 2013, 51, 1056-1080. [CrossRef]
- Philippe, M.T.; Gunar, F.; Kurtis, J.T. Spectral band difference effects on radiometric cross-calibration between multiple satellite sensors in the Landsat solar-reflective spectral domain. In Proceedings of the Sensors, Systems, and Next-Generation Satellites VIII, Maspalomas, Canary Islands, Spain, 13-16 September, 2004; pp. 307-316.
- Hu, X.; Wang, L.; Wang, J.; He, L.; Chen, L.; Xu, N.; Tao, B.; Zhang, L.; Zhang, P.; Lu, N. Preliminary Selection and Characterization of Pseudo-Invariant Calibration Sites in Northwest China. Remote Sens. 2020, 12, 2517. [CrossRef]
- Small, C. A global analysis of urban reflectance. Int. J. Remote Sens. 2006, 26, 661-681. [CrossRef]
- Wu, H.; Li, Z.L. Scale issues in remote sensing: a review on analysis, processing and modeling. Sensors 2009, 9, 1768-1793. [CrossRef]
- Wang, S.; Li, X.; Ge, Y.; Jin, R.; Ma, M.; Liu, Q.; Wen, J.; Liu, S. Validation of Regional-Scale Remote Sensing Products in China: From Site to Network. Remote Sens. 2016, 8, 980. [CrossRef]
- Kotthaus, S.; Smith, T.E.L.; Wooster, M.J.; Grimmond, C.S.B. Derivation of an urban materials spectral library through emittance and reflectance spectroscopy. ISPRS J. Photogramm. Remote Sens. 2014, 94, 194-212. [CrossRef]
- Zirlewagen, D.; von Wilpert, K. Upscaling of environmental information: support of land-use management decisions by spatio-temporal regionalization approaches. Environ. Manag. 2010, 46, 878-893. [CrossRef]
- Phang, S.K.; Chiang, T.H.A.; Happonen, A.; Chang, M.M.L. From Satellite to UAV-Based Remote Sensing: A Review on Precision Agriculture. IEEE Access 2023, 11, 127057-127076. [CrossRef]
- Yao, H.; Qin, R.; Chen, X. Unmanned Aerial Vehicle for Remote Sensing Applications—A Review. Remote Sens. 2019, 11, 1443. [CrossRef]
- Arroyo-Mora, J.; Kalacska, M.; Inamdar, D.; Soffer, R.; Lucanus, O.; Gorman, J.; Naprstek, T.; Schaaf, E.; Ifimov, G.; Elmer, K.; et al. Implementation of a UAV–Hyperspectral Pushbroom Imager for Ecological Monitoring. Drones 2019, 3, 12. [CrossRef]
- Markham, K.; Frazier, A.E.; Singh, K.K.; Madden, M. A review of methods for scaling remotely sensed data for spatial pattern analysis. Landsc. Ecol. 2023, 38, 619-635. [CrossRef]
- Chen, S.; Ren, H.; Ye, X.; Dong, J.; Zheng, Y. Geometry and adjacency effects in urban land surface temperature retrieval from high-spatial-resolution thermal infrared images. Remote Sens. Environ. 2021, 262, 112518. [CrossRef]
- Alvarez-Vanhard, E.; Corpetti, T.; Houet, T. UAV & satellite synergies for optical remote sensing applications: A literature review. Sci. Remote Sensing 2021, 3, 100019. [CrossRef]
- Olson, D.; Anderson, J. Review on unmanned aerial vehicles, remote sensors, imagery processing, and their applications in agriculture. Agron. J. 2021, 113, 971-992. [CrossRef]
- Karniadakis, G.E.; Kevrekidis, I.G.; Lu, L.; Perdikaris, P.; Wang, S.; Yang, L. Physics-informed machine learning. Nat. Rev. Phys. 2021, 3, 422-440. [CrossRef]
- Mei, S.; Jiang, R.; Li, X.; Du, Q. Spatial and Spectral Joint Super-Resolution Using Convolutional Neural Network. IEEE Trans. Geosci. Remote Sens. 2020, 58, 4590-4603. [CrossRef]
- Peng, B.; Chen, W.; Tang, H.; Lu, B.; Yang, L.; Qian, Y. A Novel Interband Calibration Method for the FY3D MERSI-II Sensor Based on a Combination of Physical Mechanisms and a DNN Regression Model. IEEE Trans. Geosci. Remote Sens. 2025, 63, 1-16. [CrossRef]
- Zhu, X.X.; Tuia, D.; Mou, L.; Xia, G.-S.; Zhang, L.; Xu, F.; Fraundorfer, F. Deep Learning in Remote Sensing: A Comprehensive Review and List of Resources. IEEE Geosci. Remote Sens. Mag. 2017, 5, 8-36. [CrossRef]
- Reichstein, M.; Camps-Valls, G.; Stevens, B.; Jung, M.; Denzler, J.; Carvalhais, N.; Prabhat. Deep learning and process understanding for data-driven Earth system science. Nature 2019, 566, 195-204. [CrossRef]
- Helder, D.L.; Basnet, B.; Morstad, D.L. Optimized identification of worldwide radiometric pseudo-invariant calibration sites. Can. J. Remote Sens. 2014, 36, 527-539. [CrossRef]
- Shi, C.; Wang, L. Incorporating spatial information in spectral unmixing: A review. Remote Sens. Environ. 2014, 149, 70-87. [CrossRef]
- Thome, K.J. Absolute radiometric calibration of Landsat 7 ETM+ using the reflectance-based method. Remote Sens. Environ. 2001, 78, 27-38. [CrossRef]
- Shan, Y.; Yao, Y.; Wang, L.; Wang, Z.; Yi, H.; Fu, Y.; Li, W.; Zhang, X.; Wang, W.; Jing, Z. Prediction of canopy mean traits in herbaceous plants by the UAV multispectral data: The quest for a better leaf-to-canopy upscaling method. Int. J. Appl. Earth Obs. Geoinf. 2025, 141, 104650. [CrossRef]
- Gascon, F.; Bouzinac, C.; Thépaut, O.; Jung, M.; Francesconi, B.; Louis, J.; Lonjou, V.; Lafrance, B.; Massera, S.; Gaudel-Vacaresse, A.; et al. Copernicus Sentinel-2A Calibration and Products Validation Status. Remote Sens. 2017, 9, 584. [CrossRef]
- Trishchenko, A.P.; Cihlar, J.; Li, Z. Effects of spectral response function on surface reflectance and NDVI measured with moderate resolution satellite sensors. Remote Sens. Environ. 2002, 81, 1-18. [CrossRef]
- Gao, B.-C.; Montes, M.J.; Davis, C.O.; Goetz, A.F.H. Atmospheric correction algorithms for hyperspectral remote sensing data of land and ocean. Remote Sens. of Environ. 2009, 113, S17-S24. [CrossRef]
- Teillet, P.M.; Fedosejevs, G.; Thome, K.J.; Barker, J.L. Impacts of spectral band difference effects on radiometric cross-calibration between satellite sensors in the solar-reflective spectral domain. Remote Sens. Environ. 2007, 110, 393-409. [CrossRef]
- Teillet, P.M.; Barker, J.L.; Markham, B.L.; Irish, R.R.; Fedosejevs, G.; Storey, J.C. Radiometric cross-calibration of the Landsat-7 ETM+ and Landsat-5 TM sensors based on tandem data sets. Remote Sens. Environ. 2001, 78, 39-54. [CrossRef]
- Garzonio, R.; Di Mauro, B.; Colombo, R.; Cogliati, S. Surface Reflectance and Sun-Induced Fluorescence Spectroscopy Measurements Using a Small Hyperspectral UAS. Remote Sens. 2017, 9, 472. [CrossRef]
- Smith, G.M.; Milton, E.J. The use of the empirical line method to calibrate remotely sensed data to reflectance. Int. J. Remote Sens. 2010, 20, 2653-2662. [CrossRef]
- Toth, C.; Jóźków, G. Remote sensing platforms and sensors: A survey. ISPRS J. Photogramm. Remote Sens. 2016, 115, 22-36. [CrossRef]
- Markham, B.L.; Helder, D.L. Forty-year calibrated record of earth-reflected radiance from Landsat: A review. Remote Sens. Environ. 2012, 122, 30-40. [CrossRef]
- Van der Meer, F. Remote-sensing image analysis and geostatistics. Int. J. Remote Sens. 2012, 33, 5644-5676. [CrossRef]
- Oliver, M.A.; Webster, R. A tutorial guide to geostatistics: Computing and modelling variograms and kriging. CATENA 2014, 113, 56-69. [CrossRef]
- Kang, J.; Jin, R.; Li, X. Regression Kriging-Based Upscaling of Soil Moisture Measurements From a Wireless Sensor Network and Multiresource Remote Sensing Information Over Heterogeneous Cropland. IEEE Geosci. Remote Sens. Lett. 2015, 12, 92-96. [CrossRef]
- Weng, Q. Remote sensing of impervious surfaces in the urban areas: Requirements, methods, and trends. Remote Sens. Environ. 2012, 117, 34-49. [CrossRef]
- Deng, C.; Wu, C. A spatially adaptive spectral mixture analysis for mapping subpixel urban impervious surface distribution. Remote Sens. Environ. 2013, 133, 62-70. [CrossRef]
- Roessner, S.; Segl, K.; Heiden, U.; Kaufmann, H. Automated differentiation of urban surfaces based on airborne hyperspectral imagery. IEEE Trans. Geosci. Remote Sens. 2001, 39, 1525-1532. [CrossRef]
Figure 1.
Location and composition of the study site. The research was conducted at Chungbuk National University in Cheongju, Republic of Korea 36°37’N, 127°27’E), selected as a representative heterogeneous urban environment. (a) Geographic location of the study area within the Korean peninsula. (b) High-resolution UAV orthomosaic acquired using the RedEdge-MX Dual sensor, capturing the complex spatial arrangement of the urban landscape. White checkerboard markers indicate Ground Control Points (GCPs). (c) In situ photographs of the five target surface types used for radiometric validation: Block, Asphalt, Natural Grass, Artificial Grass, and Urethane Track.
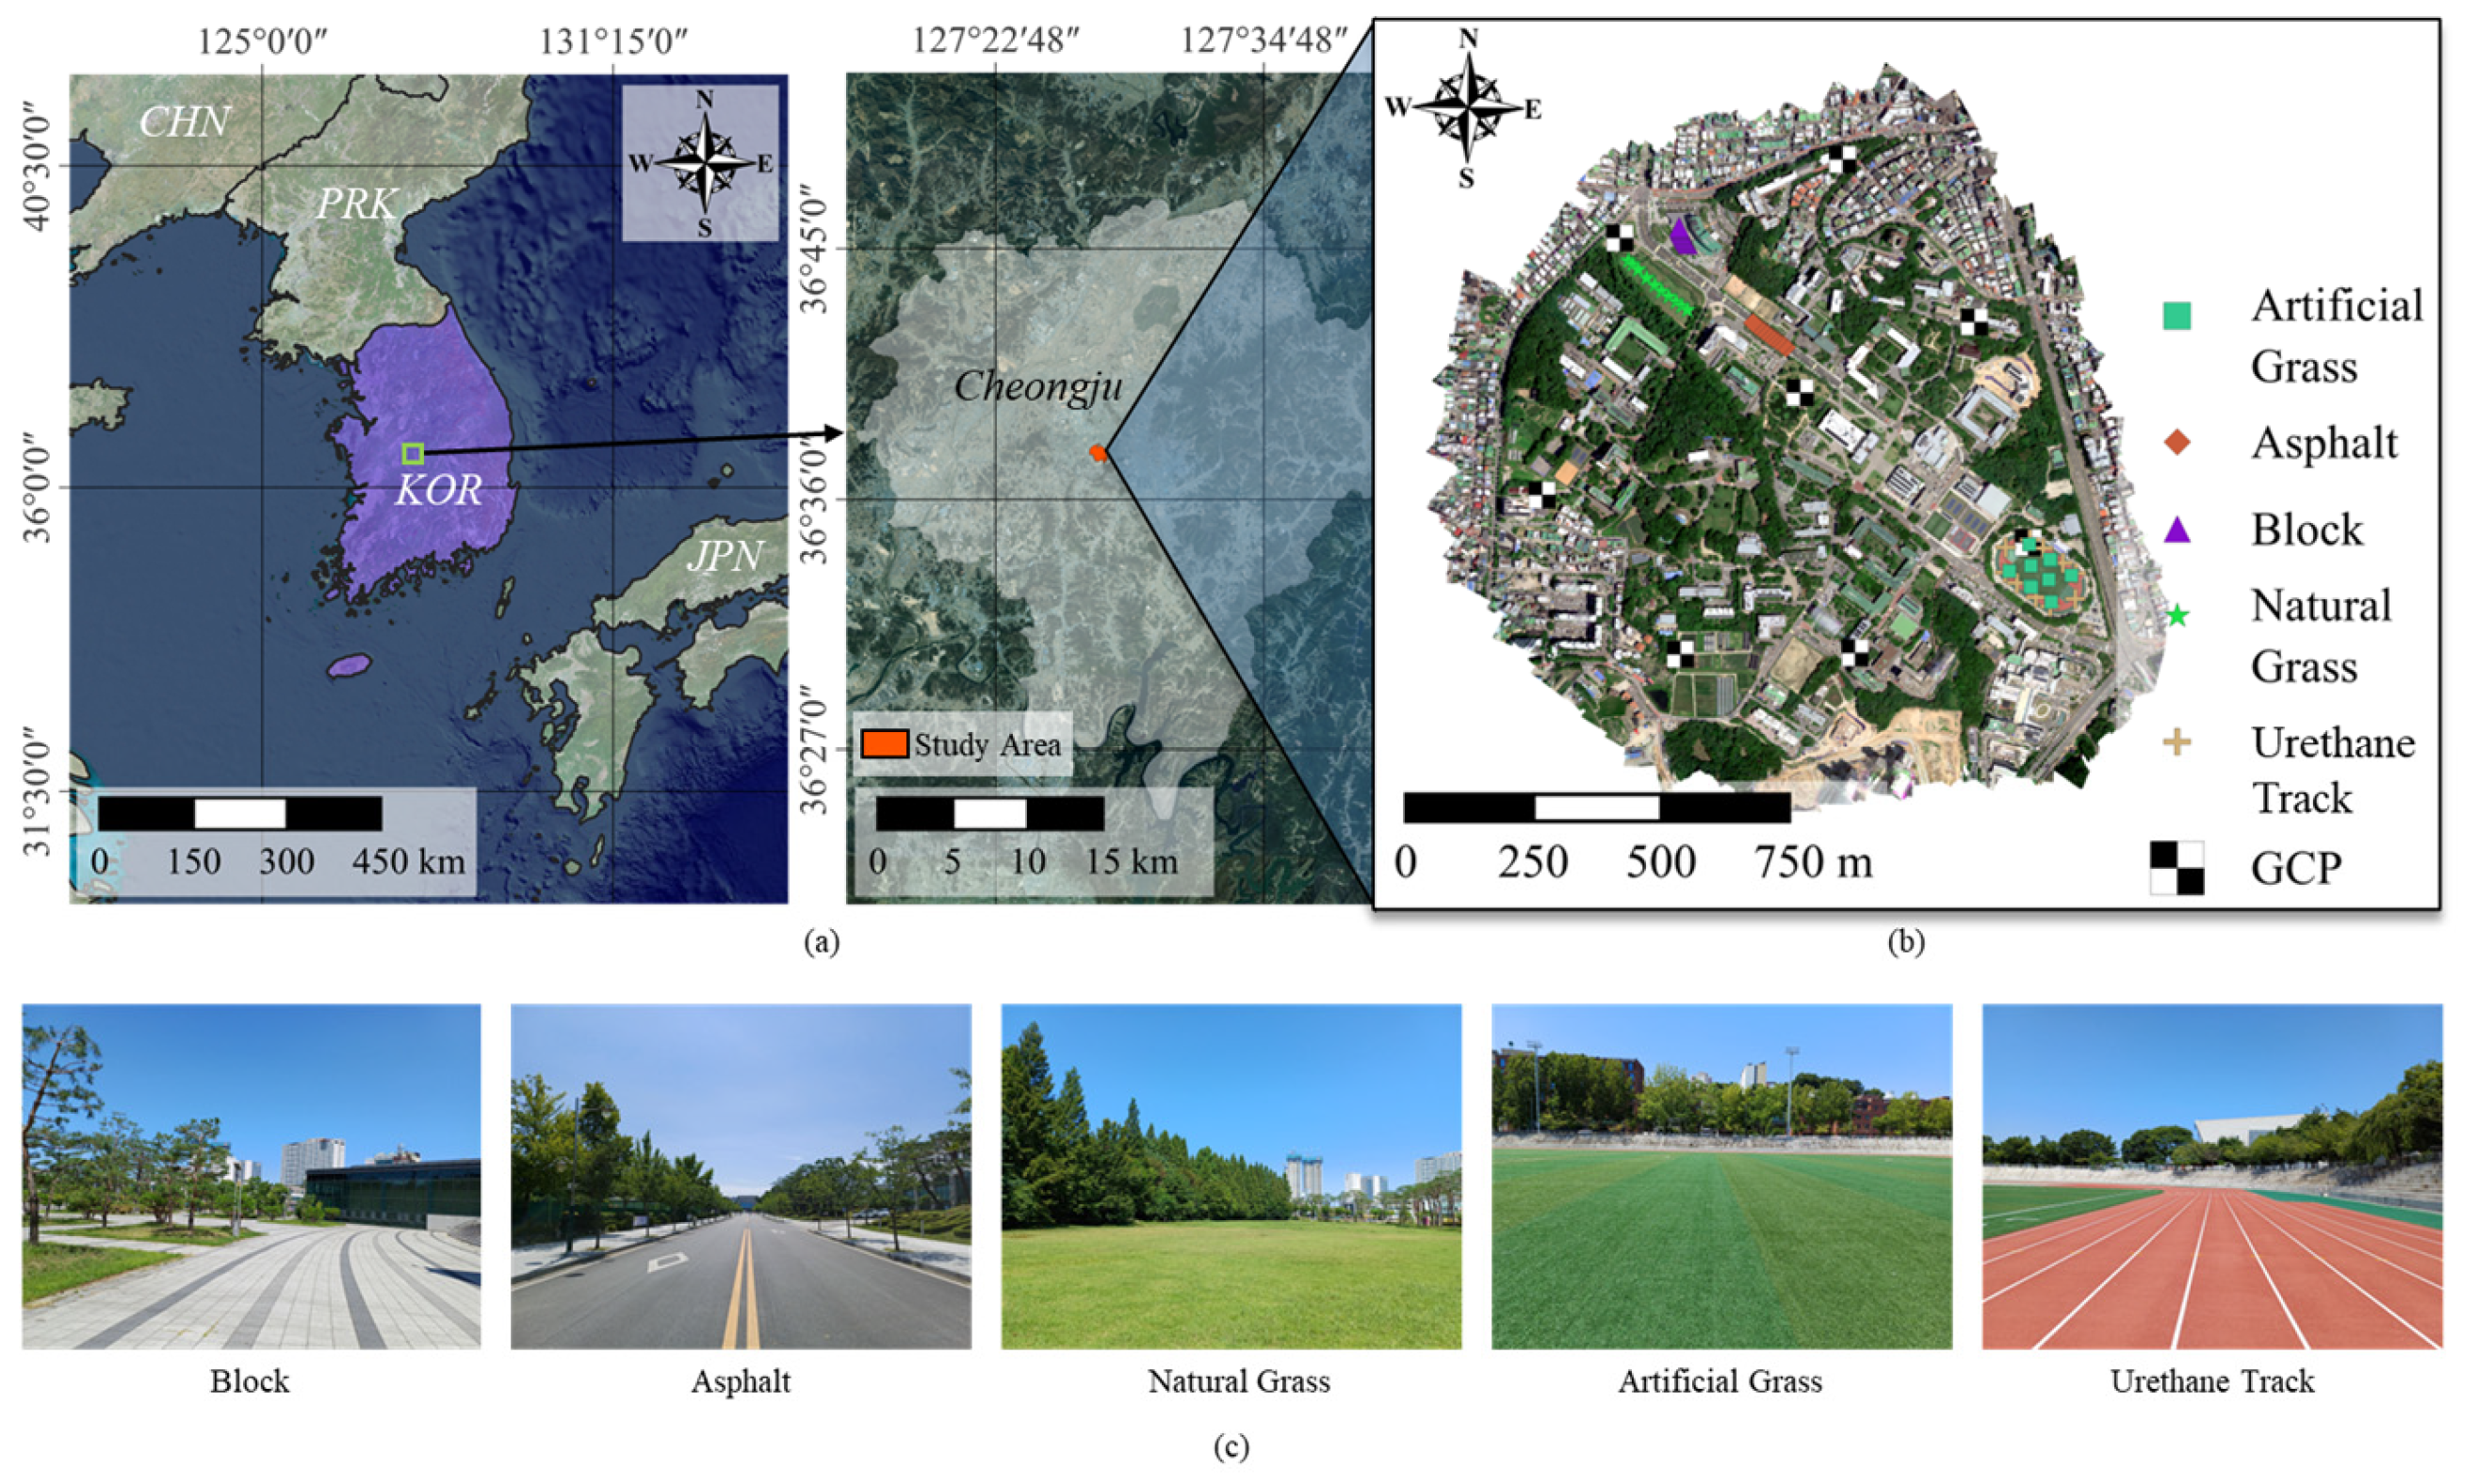
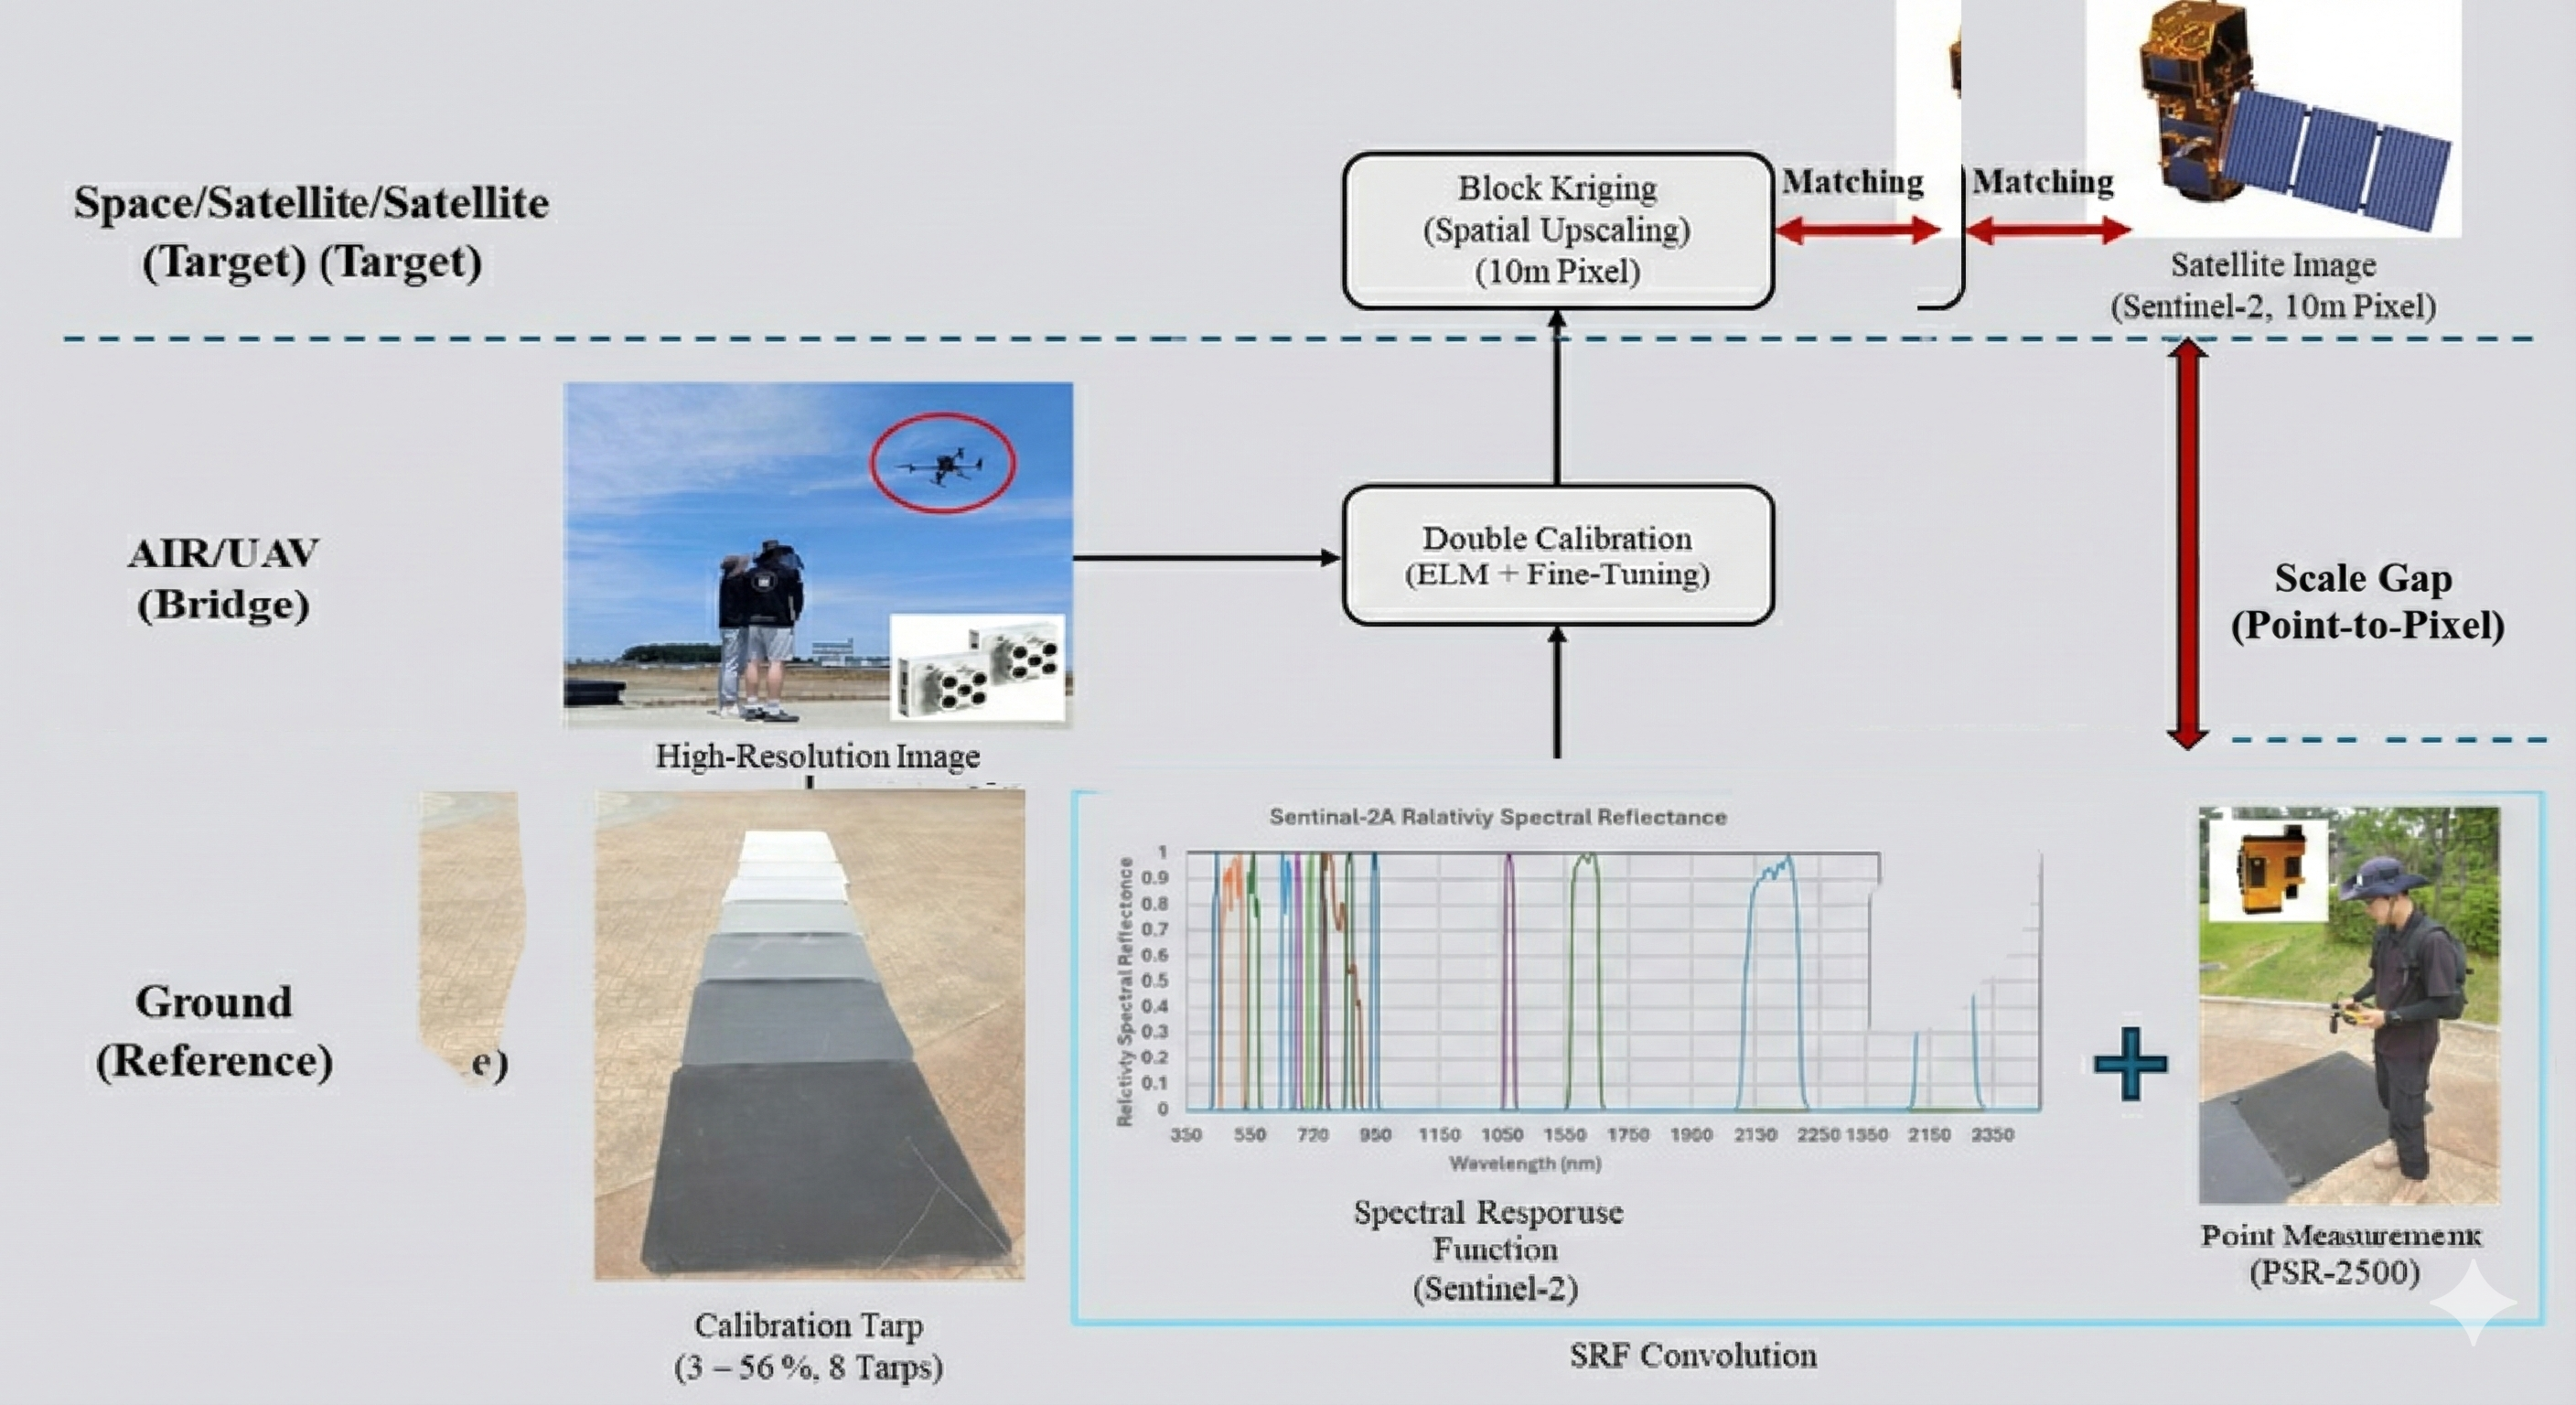
Figure 2.
The triple-platform validation framework. This schematic illustrates the data acquisition and processing workflow integrating three tiers: ground (Reference), UAV (Spatial Bridge), and satellite (Target). Key processing steps include spectral response function (SRF) convolution to ensure physical comparability, “Double Calibration” of UAV imagery, and spatial upscaling via block kriging to bridge the point-to-pixel scale gap.
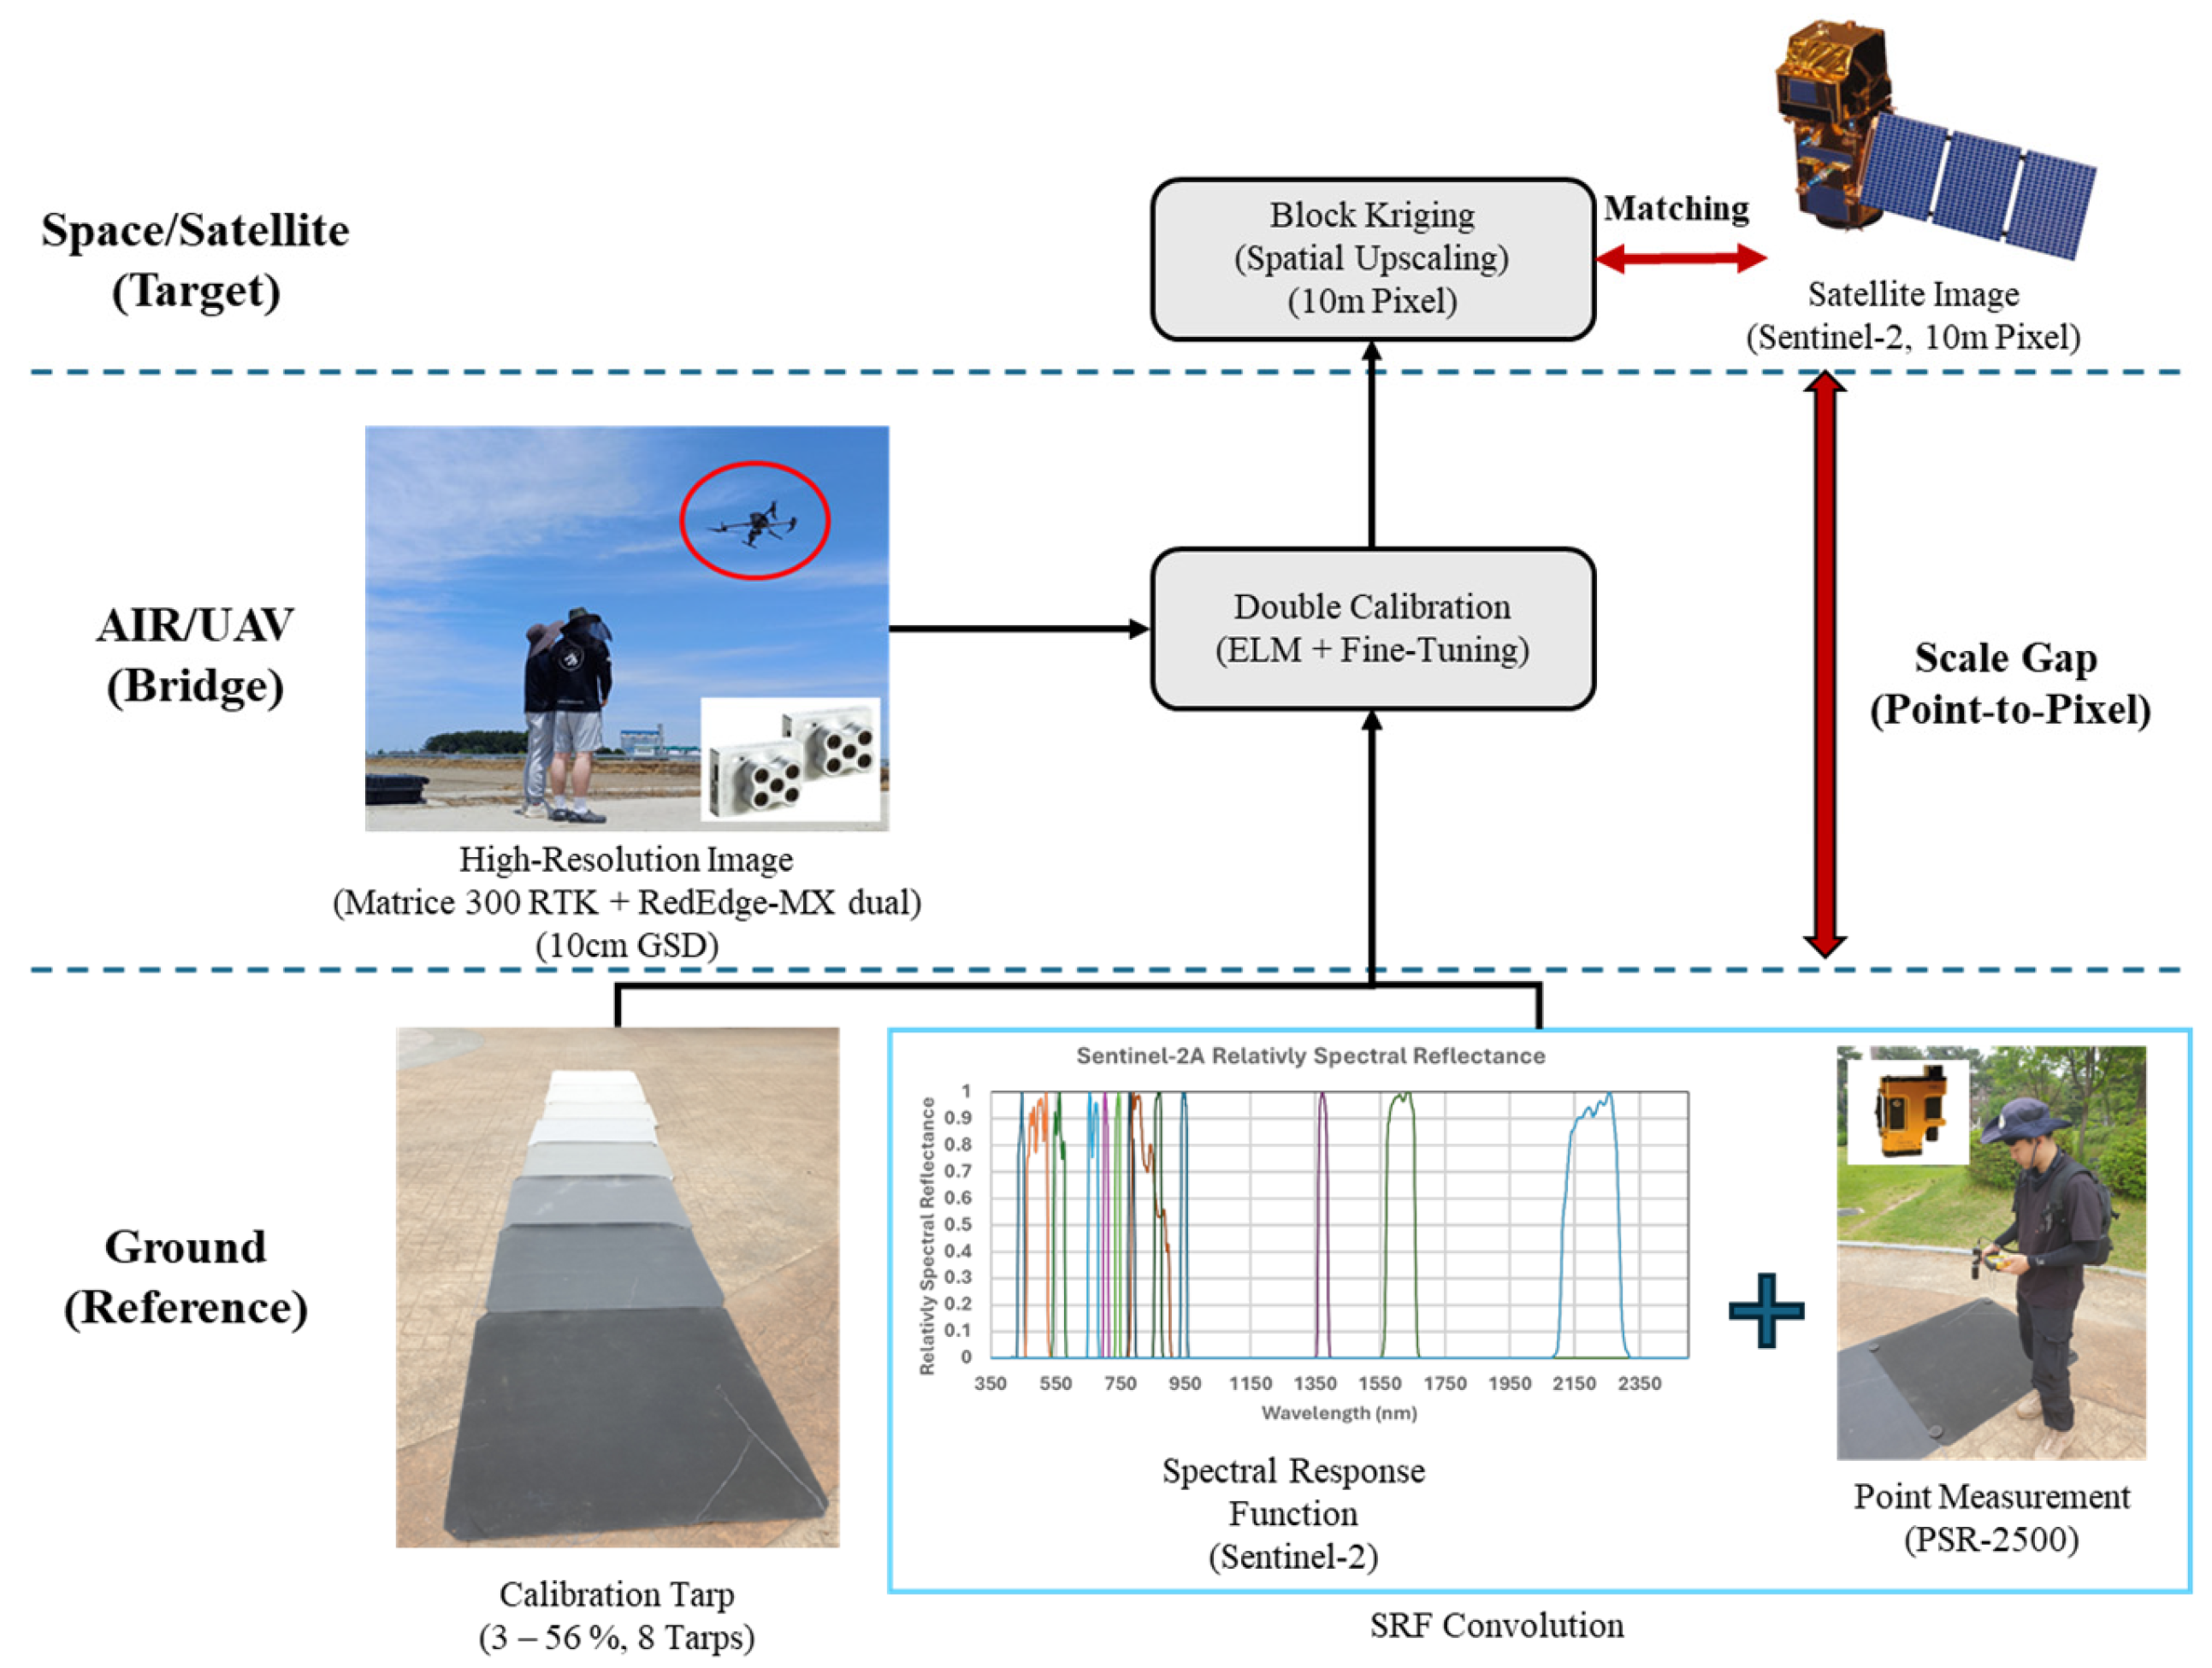
Figure 3.
Linearity between UAV reflectance measurements and eight calibration tarps for (a) June 23 and (b) July 10.
Figure 3.
Linearity between UAV reflectance measurements and eight calibration tarps for (a) June 23 and (b) July 10.
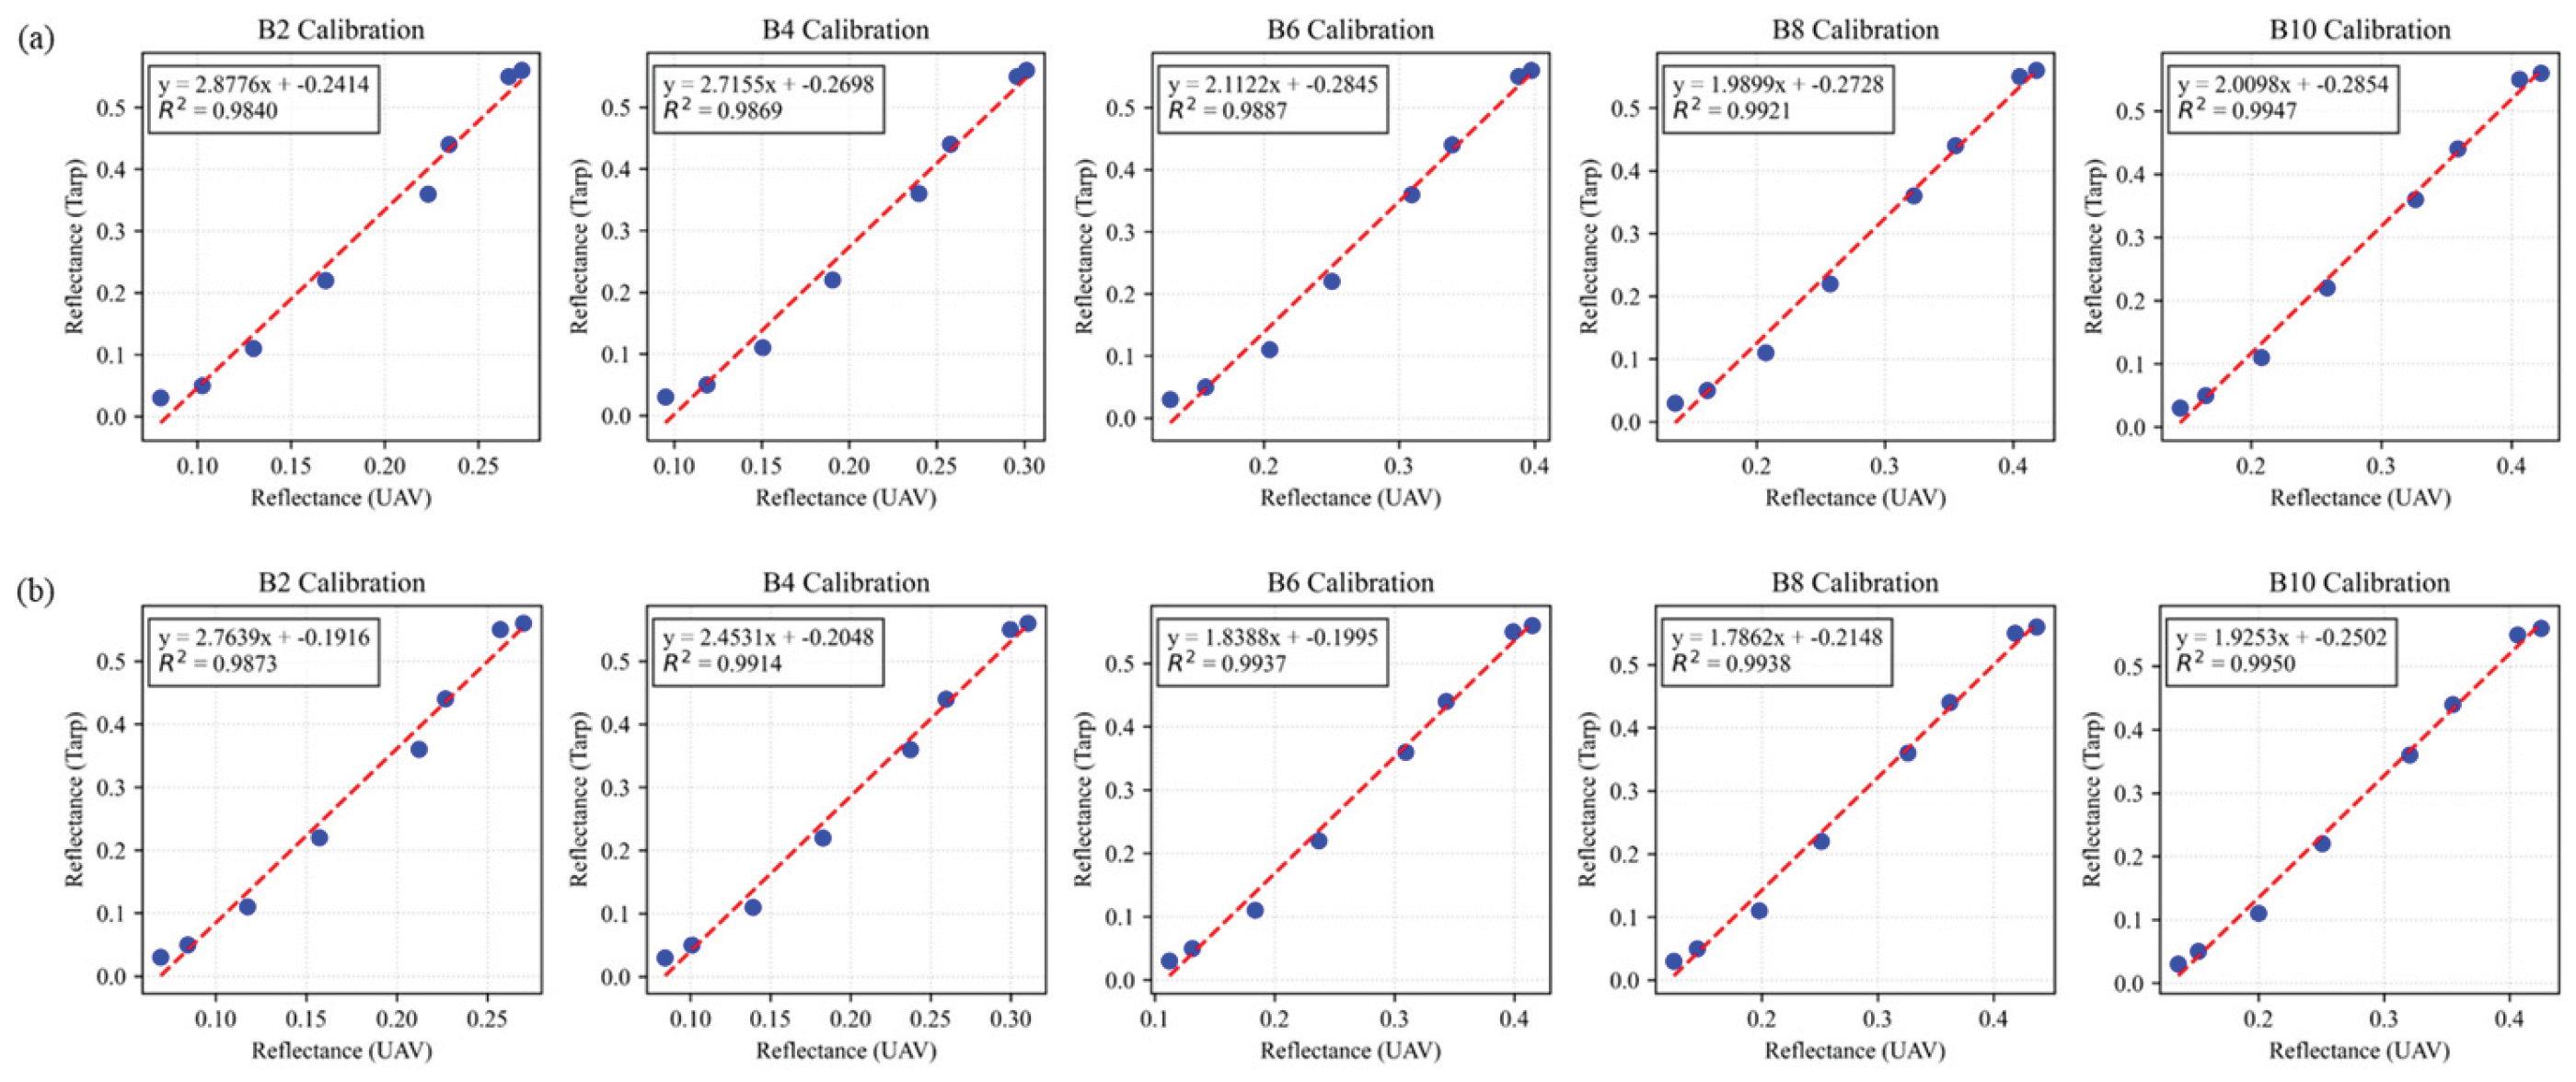
Figure 4.
Accuracy validation of upscaled UAV reflectance against Sentinel-2 imagery. Scatter plots compare the correlation for (a) the June 23 dataset, which includes a 1-day time lag, and (b) the July 10 dataset, acquired simultaneously. The application of block kriging (colored points) significantly improves correlation (R2) and reduces RMSE compared to raw point-based validation, particularly in the near-infrared (NIR) band.
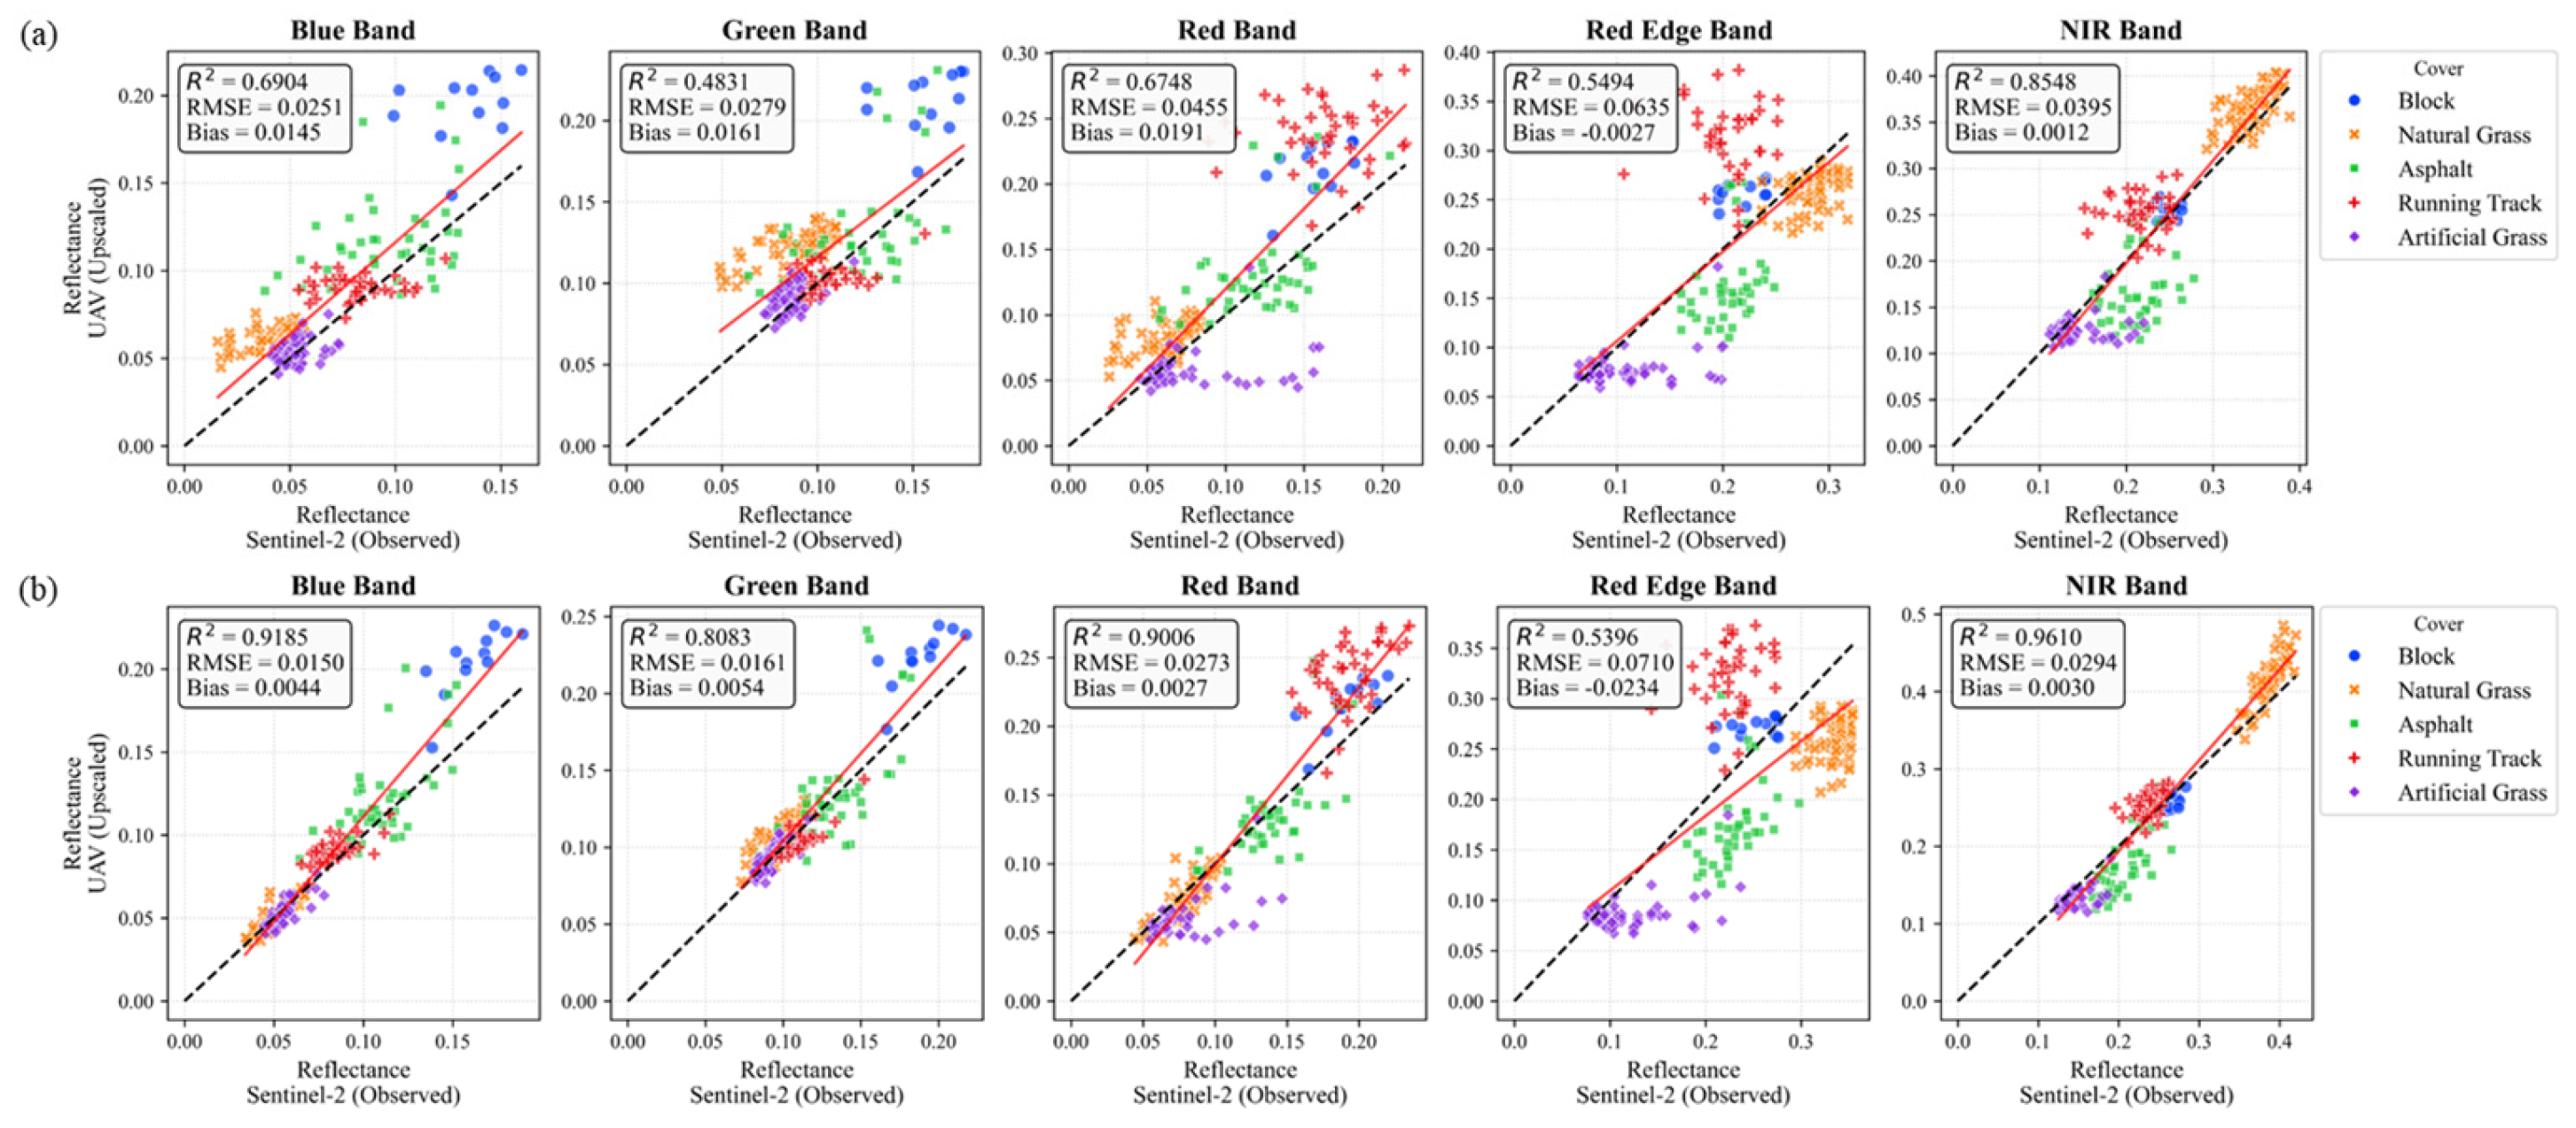

Table 1.
Comparison of spectral band characteristics (Center Wavelength and Bandwidth) between the Sentinel-2 (Satellite) and RedEdge-MX Dual (UAV) sensors used for spectral matching.
Table 1.
Comparison of spectral band characteristics (Center Wavelength and Bandwidth) between the Sentinel-2 (Satellite) and RedEdge-MX Dual (UAV) sensors used for spectral matching.
| Band | Sentinel-2 (S2A/B) | RedEdge-MX Dual | ||
| Center Wavelength (nm) | Bandwidth (nm) | Center Wavelength (nm) | Bandwidth (nm) | |
| Blue | 490 | 65 | 475 | 32 |
| Green | 560 | 35 | 560 | 27 |
| Red | 665 | 30 | 668 | 14 |
| Red Edge | 740 | 15 | 740 | 18 |
| NIR | 842 | 115 | 842 | 57 |
Table 2.
Statistical performance of the UAV “Double Calibration” protocol, summarizing linearity (Slope, Intercept, R2) and error metrics (RMSE) for each spectral band.
Table 2.
Statistical performance of the UAV “Double Calibration” protocol, summarizing linearity (Slope, Intercept, R2) and error metrics (RMSE) for each spectral band.
| Band | 2025-06-23 (1-day Lag) | 2025-07-10 (Same Day) | |||||||
| Slope (a) |
Intercept (b) |
R2 | RMSE | Slope (a) |
Intercept (b) |
R2 | RMSE | ||
| Blue | 0.4874 | 0.1139 | 0.859 | 0.052 | 0.5717 | 0.0999 | 0.951 | 0.015 | |
| Green | 0.5144 | 0.1287 | 0.848 | 0.051 | 0.6077 | 0.1060 | 0.953 | 0.012 | |
| Red | 0.5256 | 0.1445 | 0.925 | 0.073 | 0.6181 | 0.1152 | 0.976 | 0.027 | |
| Red Edge | 0.6257 | 0.1599 | 0.899 | 0.096 | 0.7121 | 0.1409 | 0.846 | 0.096 | |
| NIR | 0.5417 | 0.1484 | 0.952 | 0.080 | 0.5732 | 0.1381 | 0.959 | 0.029 | |
Table 3.
Quantitative evaluation of spatial homogeneity for urban surfaces based on standard deviation () derived from 10 cm resolution UAV imagery.
Table 3.
Quantitative evaluation of spatial homogeneity for urban surfaces based on standard deviation () derived from 10 cm resolution UAV imagery.
| Surface Type | 6/23 Avg Std Dev (σ) | 7/10 Avg Std Dev (σ) | Suitability Evaluation |
| Artificial Grass | 0.020 | 0.020 | High |
| Natural Grass | 0.020 | 0.024 | Seasonal Caution |
| Urethane Track | 0.030 | 0.029 | Moderate |
| Block | 0.043 | 0.047 | Low |
| Asphalt | 0.092 | 0.094 | Very Low |
Table 4.
Comparison of validation metrics (R2, RMSE) between traditional raw ground point methods and the proposed block kriging framework across different campaign dates.
Table 4.
Comparison of validation metrics (R2, RMSE) between traditional raw ground point methods and the proposed block kriging framework across different campaign dates.
| Band | Date (Condition) | Upscaling Method | R2 | RMSE | Remarks |
| Blue | 6/23 (1-day Lag) | Raw Ground Points | 0.46 | 0.052 | Poor performance due to lag |
| Block Kriging | 0.69 | 0.025 | Correlation Recovery | ||
| 7/10 (Same Day) | Raw Ground Points | 0.68 | 0.041 | ||
| Block Kriging | 0.92 | 0.015 | Optimal Performance | ||
| Green | 6/23 (1-day Lag) | Raw Ground Points | 0.43 | 0.051 | |
| Block Kriging | 0.72 | 0.022 | |||
| 7/10 (Same Day) | Raw Ground Points | 0.61 | 0.043 | ||
| Block Kriging | 0.94 | 0.012 | High Precision | ||
| Red | 6/23 (1-day Lag) | Raw Ground Points | 0.40 | 0.073 | High error occurrence |
| Block Kriging | 0.67 | 0.045 | |||
| 7/10 (Same Day) | Raw Ground Points | 0.61 | 0.059 | ||
| Block Kriging | 0.90 | 0.027 | Significant Error Reduction | ||
| Red Edge | 6/23 (1-day Lag) | Raw Ground Points | 0.35 | 0.096 | Lowest raw correlation |
| Block Kriging | 0.55 | 0.063 | |||
| 7/10 (Same Day) | Raw Ground Points | 0.40 | 0.096 | ||
| Block Kriging | 0.54 | 0.071 | Error Reduction | ||
| NIR | 6/23 (1-day Lag) | Raw Ground Points | 0.46 | 0.080 | |
| Block Kriging | 0.85 | 0.039 | Major Improvement | ||
| 7/10 (Same Day) | Raw Ground Points | 0.66 | 0.072 | ||
| Block Kriging | 0.96 | 0.029 | Best Performance |
Disclaimer/Publisher’s Note: The statements, opinions and data contained in all publications are solely those of the individual author(s) and contributor(s) and not of MDPI and/or the editor(s). MDPI and/or the editor(s) disclaim responsibility for any injury to people or property resulting from any ideas, methods, instructions or products referred to in the content. |
© 2025 by the authors. Licensee MDPI, Basel, Switzerland. This article is an open access article distributed under the terms and conditions of the Creative Commons Attribution (CC BY) license (http://creativecommons.org/licenses/by/4.0/).
Copyright: This open access article is published under a Creative Commons CC BY 4.0 license, which permit the free download, distribution, and reuse, provided that the author and preprint are cited in any reuse.


