
Submitted:
31 March 2025
Posted:
01 April 2025
You are already at the latest version
Abstract
Accurate hyperspectral simulations are critical for the vicarious calibration of next-generation space-based sensors and for ensuring the long-term consistency of climate data records. This study presents a refined methodology to generate simulated radiometric calibration references (RCRs) over bright desert pseudo-invariant calibration sites (PICS), specifically designed to meet the stringent accuracy requirements of hyperspectral observations. Building on metrology principles, and in the absence of SI-traceable references, the approach leverages simulated reflectance over stable desert targets as a community-accepted calibration reference. Key advancements include improved surface reflectance modelling using the RPV model and CISAR algorithm, enhanced atmospheric property characterization from multiple state-of-the-art datasets, and the use of the Eradiate Monte Carlo-based radiative transfer model. These refinements reduce uncertainty in simulated top-of-atmosphere reflectance, achieving an accuracy within ±3% in high-transmittance spectral regions. Validation against both multispectral and hyperspectral satellite data (i.e., EMIT, EnMAP and PRISMA) confirms the robustness of the methodology. This work establishes a reliable framework for hyperspectral sensor calibration and intercalibration, addressing the pressing need for traceable, high-fidelity reference data in Earth observation.
Keywords:
vicarious calibration
; hyperspectral
; radiative transfer modelling
; bright desert
; pseudo invariant calibration site
1. Introduction
Vicarious calibration refers to techniques that make use of specific calibration references for the post-launch radiometric verification of Earth Observation sensors. Metrology principles are a crucial aspect of these techniques. They form the foundation of vicarious calibration principles and require the use of a calibration reference, ideally traceable to the Système international d’unités (SI) standard. However, as no such SI-traceable reference currently exists, an alternative is to establish a “community consensus” reference [1]. The use of a single community consensus reference presents the distinctive advantage to ease the harmonisation of different satellite data.
Calibration references consist in Earth or Moon targets that are characterised either through remote observations with well-calibrated devices or simulations with Radiative Transfer Models (RTMs). In the former case, these calibration references are imaged in near-coincident fashion by the sensor to be calibrated and by one or more well-calibrated sensors from satellite, aircraft platforms or on the ground. In the latter case, it is crucial to accurately characterize the radiative characteristics of the calibration reference that affect its observation. It is therefore preferable to select locations on the Earth’s surface exhibiting consistent and stable radiometric properties over time, reducing thereby the effort to characterise their radiative properties. Such targets are referred to as Pseudo Invariant Calibration Sites (PICSs) [2].
PICSs are categorized based on their geographical and environmental characteristics. One such category includes bright desert sites, which were initially used to monitor radiometer degradation over time while in orbit relative to an arbitrary reference date. Since the early nineties, this type of PICSs has been employed to assess the degradation of reflective sensors, such as Advanced Very High-Resolution Radiometer (AVHRR) observations [3]. Since then, desert PICSs have been successfully used to monitor various instruments, including the Landsat Multispectral Scanner, Thematic Mapper, Enhanced Thematic Mapper Plus, Moderate Resolution Imaging Spectroradiometer (MODIS), and Visible Infrared Imaging Radiometer Suite (VIIRS), among others (e.g., [4,5,6]).
PICSs are also utilized for satellite intercalibration with respect to a reference instrument. However, this approach requires careful consideration of discrepancies in spectral characteristics and observation geometries between the radiometers being compared. While satellite intercalibration is widely used today, it is not applicable to early Earth observation datasets, where all available satellite observations were subject to similar radiometric calibration limitations in the shortwave spectral region. To overcome these limitations, a novel approach was proposed, wherein the Radiometric Calibration Reference (RCR) is derived from simulated radiances at the satellite level over bright desert PICSs [7]. This method was successfully applied to calibrate the visible band of the mviri radiometer onboard the mfg series [8].
Over bright deserts, surface reflection typically dominates radiative processes. However, aerosol scattering can also be significant, especially in the visible spectral region, where surface reflectance is relatively low. Most CEOS PICSs located in the Sahara Desert and the Arabian Peninsula have demonstrated remarkable stability, with inter-annual variations better than 2% [9]. The reflectance magnitude over PICSs in the 400–2500 spectral range is sufficiently high to define a RCR. Consequently, this approach is well-suited for multi-mission harmonization. However, the use of bright desert PICSs for absolute RCR calibration requires highly accurate characterization of radiative processes at both the surface and in the atmosphere, as well as accounting for their radiometric coupling.
The PICSs method, as implemented in [8], relies on Top of Atmosphere (TOA) simulated radiance and reflectance generated using the 6S code [10] over approximately 20 bright desert targets [2]. Several improvements have since been introduced [11]. The first improvement involves an enhanced characterization of the surface Bidirectional Reflectance Factor (BRF), extending its coverage to the 400–2500 spectral range with a 1 resolution. The second improvement significantly refines aerosol property characterization through the use of AERONET data [12]. Finally, the 6SV model has been adopted in place of 6S [13]. The accuracy of this simulated RCR has been estimated to be approximately ±3% [14].
Historically, vicarious calibration has focused on multispectral sensors, but the increasing availability of spaceborne hyperspectral instruments calls for a refined approach. Hyperspectral missions, such as Earth Surface Mineral Dust Source Investigation (EMIT), Environmental Mapping and Analysis Program (EnMAP), and PRecursore IperSpettrale della Missione Applicativa (PRISMA), offer high spectral resolution across a broad wavelength range (400–2500) and demand more accurate calibration due to their sensitivity to spectral variability in both surface and atmospheric properties. With the emergence of hyperspectral missions, the need for high-fidelity radiometric references has grown. PICSs are now being leveraged not only for monitoring sensor degradation but also for generating simulated top-of-atmosphere (TOA) reflectance at 1 nm resolution over the full optical domain. These references can then serve as a benchmark for both absolute calibration and intercomparison of hyperspectral data.
Additionally, current and future generations of space-based sensors designed for climate monitoring require a reduction in the uncertainty associated with simulated RCR over PICSs. For example, the Ocean and Land Colour Instrument (OLCI) instrument onboard Sentinel-3 and the upcoming Multi-Viewing Multi-Channel Multi-Polarization Imaging Mission (3MI) instrument onboard the epssg have radiometric accuracy requirements of better than 2%, with a threshold requirement of 5%. Furthermore, a new generation of satellite-based radiometers, referred to as SITSat, is currently under development, with an expected accuracy of better than 1% [15].
To support data harmonization efforts of both multi- and hyper-spectral instruments, vicarious calibration methods as developed by [8] require continuous improvements in accuracy. This study addresses several well-identified issues, including:
- Uncertainties in surface reflectance characterization, which introduce systematic biases. Since these surfaces are assumed to be invariant, addressing this issue is critical. This paper proposes a new method to improve surface BRF characterization.
- Atmospheric property characterization, which plays a crucial role in calibration accuracy. Various improvements are introduced in this study through the combined use of multiple state-of-the-art datasets.
- The accuracy of RTMs used to generate a RCR, which must be carefully evaluated. Sensitivity analyses indicate that discrepancies among different RTMs range from 0.5% to 3%, depending on the spectral region [16]. The proposed approach utilizes Eradiate, a new generation open-source 3D RTMs based on Monte Carlo ray-tracing methods, specifically designed for calibration and validation activities [17].
- Simulations of hyperspectral observations, which require high spectral fidelity. This study demonstrates that the refined methodology achieves agreement within 3% for most spectral regions, thereby supporting the suitability of PICSs for hyperspectral calibration.
This manuscript is structured as follows. Section 2.1 describes the selection criteria for PICSs characterization. The proposed improvements in surface and atmospheric property characterization are detailed in Section 2.2 and Section 2.3, respectively. The generation of an accurate RCR, incorporating these enhancements, is presented in Section 3.1. Finally, RCR simulations for multi- and hyperspectral instruments obtained using the Eradiate model are presented in Section 3 and discussed in Section 4. These improvements are expected to yield significant accuracy gains, which are rigorously quantified in this study. The refined simulated radiometric calibration reference will enhance sensor degradation monitoring and intercalibration across satellite instruments, particularly those operating in the hyperspectral domain.
2. Data and Methods
2.1. List of Selected PICSs
The targets selected for this study are Libya-4, due to its extensive historical use as a bright desert PICSs, and Gobabeb, part of the HYPERNETS project [18] and of the CEOS initiative Radiometric Calibration Network (RadCalNet) [19]. The two selected sites, centred on the coordinates provided in Table 1, have different spatial extent: Gobabeb has an extension of 2×2, compared to 20×20 for Libya-4. Elevation information for the selected targets has been derived from the Copernicus Copernicus Digital Elevation Model (DEM) COP-DEM_GLO-30 dataset [20].
Each of the selected PICS exhibits distinct morphological characteristics:
- Libya-4: The most well-known and widely used bright desert PICS, located in the Great Sand Sea. Its significance stems from its large size and radiometric stability, making it essential for radiometer drift monitoring, sensor intercalibration, and absolute calibration based on simulated radiances. Its morphology consists of oriented sand dunes shaped by dominant winds [21]. Some spatial variations in sand granularity are expected depending on dune positioning. Its longitudinal elevation profile is shown in Figure 1.
- Gobabeb: Located in Namibia, this site was added to the list initially proposed by [2]. As part of RadCalNet, it differs from the other sites in having a limited spatial extent of 2, compared to 20 for the other targets.
2.2. Surface Reflectance Characterisation
2.2.1. Overview of the Approach
The anisotropy of PICSs reflectance is primarily influenced by radiative effects at two different spatial scales: at the microscopic level, surface reflectance results from scattering by sand grains; at the macroscopic scale, typically larger than 100, features such as stones, topography, or sand dunes contribute to shaping the BRF. In practice, PICS targets are assumed to be perfectly uniform and flat, allowing their surface properties to be represented by a 1D surface reflectance model [7]. Ref. [21] estimated that this assumption introduces a worst-case uncertainty of about 1%.
As in [11], the Rahman Pinty Verstraete (RPV) model [22] is here used to characterize PICSs surface reflectance. This model is designed to represent the overall reflectance anisotropy effects, regardless of the spatial scale, albeit under the 1D assumption; these anisotropy effects remain invariant with respect to the actual azimuth angles, with only their relative direction being pertinent. The RPV model comprises four wavelength dependent parameters:
- : Governs the mean amplitude of the BRF, predominantly controlling surface albedo.
- k: The modified Minnaert contribution, determining the bowl shape of the BRF.
- : Represents the asymmetry parameter of the modified Henyey-Greenstein phase function.
- : Controls the amplitude of the hot spot due to medium porosity.
Observations from well-calibrated radiometers over the selected PICS were processed using the Combined Inversion of Surface and AeRosol (CISAR) algorithm [23], which removes atmospheric radiative effects through an Optimal Estimation (OE) approach [24]. This method rigorously propagates uncertainties from Level-1 to Level-2 data and outputs the full covariance matrix of the RPV parameters. These parameters are then interpolated at a 1 resolution across the 350–2500 spectral range (Section 2.2.4).
2.2.2. Input Data
TOA BRF time series are extracted from satellite images acquired over the selected PICS by the instruments listed in Table 2. The CISAR algorithm requires additional parameters as input to its RTM, namely the Column Water Vapour (TCWV), Total Column Ozone (TCO3) and surface pressure. These model parameters are obtained from Copernicus Atmosphere Monitoring Service (CAMS) [25]. Clear-sky TOA BRF observations, acquisition geometry and model parameters are then aggregated at 20 or 2, according to the target. Spinning Enhanced Visible and Infrared Imager (SEVIRI) and POLarization and Directionality of the Earth’s Reflectances ( POLDER) data are excluded for Gobabeb due to their ground resolution exceeding 2. It should be stressed that these satellite data were not homogenised prior to their use.
2.2.3. Atmospheric Effect Removal
The retrieval of surface BRF from satellite observations requires the removal all atmospheric effects, a task performed with the CISAR algorithm [23]. Ref. [26] have underscored the importance of the prior information and its associated uncertainty with respect to the observation vector information content. Initial prior information on the RPV parameters is derived from the values proposed by [7]. Considering that MultiSpectral Instrument (MSI) observations are limited to the nadir view, their potential for retrieving the RPV anisotropy parameters () is rather limited. Consequently, MSI data are processed last, allowing prior information on RPV anisotropy parameters to be derived from the other instruments with larger angular sampling, such as MODIS, POLDER or SEVIRI.
In all CISAR inversions, the prior information on the Aerosol Optical Thickness (AOT) is taken from CAMS Atmospheric Composition Reanalysis 4 (EAC4) data and distributed among fine (absorbing and non-absorbing) and coarse modes, according to the ratios among the three classes obtained from the MACv2 climatology [27]. Figure 2 shows an example of the surface reflectance, expressed in terms of Directional Hemispherical Reflectance (DHR) [28], for a Sun Zenith Angle (SZA) of 10° computed from the CISAR retrieved RPV parameters, averaged over the processed time series, over Libya-4. The surface reflectance is expressed as DHR for consistency with respect to high resolution bare soil spectra used for the RPV parameters as described in Section 2.2.4.
As stated in Section 2.2.2, satellite data are not homogenised prior to being processed by the CISAR algorithm. Consequently, the retrieved surface albedo might exhibit spectral discontinuities when satellite spectral bands overlap. In such case, an averaging process is implemented, accounting for the retrieval uncertainties. Since these retrievals are done on independent datasets, the uncertainties on these retrievals will also be independent (i.e.have random error correlation). When averaging among the available CISAR retrievals, the associated uncertainty is calculated as the quadratic sum of the CISAR retrieval uncertainty divided by the number of available retrievals N, in accordance with the Guide to the expression of the Uncertainty (GUM) guidelines for uncertainties with random error correlation [29]:
2.2.4. RPV Parameter Spectral Interpolation
The interpolation of the RPV parameters at a 1 spectral resolution is based on three major of processing steps.
- Surface BRF simulation. The PICS surface BRF is simulated with the RPV model for all the spectral bands listed in Table 2. The uncertainty associated with these simulated BRF is computed as follows:where and is the correlation between two RPV parameters.
-
BRF spectral interpolation. The BRF field simulated in the spectral bands of the selected radiometers is interpolated at a 1 resolution from 350 – 2500 using the comet_maths tool, developed by npl. This tool also returns the interpolated uncertainties and is part of the open-source CoMet Toolkit [30], designed to facilitate the handling of error-covariance information in measurement data analysis. Beyond mathematical calculations for uncertainty propagation, comet_maths incorporates uncertainty-quantified interpolation algorithms. Specifically, it allows to interpolate values between low-resolution data points while preserving the spectral shape of a higher-resolution dataset (or model). The low-resolution data points are computed using the RPV model with parameters retrieved by the CISAR algorithm, while the high-resolution model is derived from the MARMIT database [31], which contains sand optical properties over the 400–2500 range. These soil spectra are expressed in terms of DHR [28], with an illumination angle of 15°.To refine the spectral behavior of the DHR, the five best-fitting spectra from the MARMIT database are selected based on minimal Euclidean distance (root-sum-of-squares) to the CISAR retrievals. These spectra are then averaged using a weighting mechanism that accounts for their geometric distance from the CISAR data. The resulting weighted reference curve (dashed black curve in Figure 3, referred to as ) is used by comet_maths to interpolate the spectral behavior of the BRF between the processed wavelengths, incorporating associated uncertainties. This process is illustrated by the red solid line in Figure 3.In addition to interpolation, comet_maths extrapolates the BRF and its uncertainty at the spectral range boundaries, where no CISAR retrievals are available. This extrapolation increases the relative uncertainty of the BRF (defined as the absolute uncertainty divided by the measured value), particularly at shorter wavelengths, where surface reflectance exhibits significant spectral variability.
-
Inversion of the high-resolution surface BRF. The third step involves inverting the surface BRF field interpolated at a 1 spectral resolution. This process relies on the RPV Model Inversion Package developed by [32], which retrieves the RPV parameters along with the associated covariance matrix. The uncertainty for each parameter corresponds to the diagonal elements of this matrix and tends to be larger at the spectral range extremes due to extrapolation performed by the comet_maths tool.Figure 4 illustrates an example of the relative uncertainty at the extrapolated wavelengths for the parameter over Libya-4, showing particularly high values at the shortest wavelengths.
2.3. Characterisation of Atmospheric Properties
2.3.1. Description of the Method
The characterisation of atmospheric properties to obtain the RCR includes the derivation of an aerosol model over the Sahara and Gobabeb, and the generation of atmospheric vertical profiles over each selected PICS. The AOT is taken from CAMS global reanalysis data referred to as EAC4 [33]. EAC4 AOT values haven been extensively evaluated through systematic comparison against AErosol RObotic NETwork (AERONET) data [34]. Ref. [35] reported an overestimation of aerosol in CAMS reanalysis compared to AERONET stations of about 5%–10%. As the selected PICSs are located in remote place with no aerosol observation and over bright surfaces where satellite retrieval is often of poor quality, a 20% uncertainty on the AOT was assumed. The AOT vertical distribution relies on the climatology elaborated by [27]. EAC4 data are used to characterise the vertical profile of temperature, pressure and molecular concentration of the following species: CO, NO2, NO, O3, H2O, SO2, N2O, O2, CH4, CO2 [35,36]. The procedure applied to generate these vertical profiles for the Eradiate RTMs is described in [37].
The proposed method to derive an aerosol model relies on the analysis of AERONET inversion data [38] over the selected targets to derive the following micro-physical properties:
- The fine mode mean radius and standard deviation
- The coarse mode mean radius and standard deviation
- The number of particles in each mode;
- The particles oblateness;
- The real and imaginary part of the refractive index
The index of refraction is then extrapolated to the entire spectral region of interest, i.e., from 350 up to 2500, as described in Section 2.3.3. Finally, the corresponding single scattering properties are calculated from these micro-physical properties using the spheroid package included in the Generalized Retrieval of Aerosol and Surface Properties (GRASP) algorithm [39]. It is assumed that the fine and coarse mode are characterized by the same oblateness and index of refraction.
2.3.2. AERONET Data Analysis
Data from AERONET V3 L1.5 inversion products [12] are analysed to observe the variations of the single-scattering properties among the stations located in the vicinity of the targets listed in Table 1. For Libya-4, the stations considered to get the aerosol model are: Agoufou, Borjy Badji Mokhtar, Homburi, Ouarzazate and Tamanrasset INM. For Gobabeb, data from the corresponding AERONET station and results from Hemeret et al., in preparation, are used. The choice of L1.5 is motivated by the availability of the sphericity parameter, which is not available in L2.0. However, the Level-2 flags available in the Level-1 products are used to keep only retrievals with high quality. The average size distribution parameters (median radius and standard deviation), sphericity and index of refraction are derived from the AERONET dataset.
The uncertainty associated with the microphysical properties obtained from the AERONET V3 L1.5 is computed analysing their statistical distribution among all the available data points. The uncertainties were defined as the standard deviation of the distribution, excluding the tails of the resulting histogram (less than 5% of the data). This approach does not significantly alter the estimated aerosol properties, but rather serves to reduce the associated uncertainty. An example of the coarse mode radius distribution is shown in Figure 5. The calculation is performed excluding the tails of the histograms to avoid outliers that could significantly increase the associated uncertainty. The real and imaginary parts of the index of refraction are also extracted from AERONET data at the following wavelengths: 440, 675, 870, and 1020.
The particle size distribution obtained from AERONET inversion data over the two Region Of Interest (ROI)s is shown in Figure 6. While over the Sahara region dust remains the main aerosol type, over Gobabeb aerosol particles can be originating from dust, black carbon, pollution and marine aerosols [40,41].
2.3.3. Spectral Interpolation
To interpolate the index of refraction derived in Section 2.3.2 across wavelengths in the 350 to 2500 spectral range, aerosol datasets from the Library of Advanced Data Products (LADP) of Eurochamp [42] and the Optical properties of Aerosols and Clouds (OPAC) [43] are exploited. The 5 refractive index spectra from these datasets with the smallest geometric distance from the values obtained from AERONET analysis are selected and the median value among these datasets is computed. The resulting median spectrum, weighted by the geometric distance between of each selected spectrum and the averaged properties derived from AERONET is used as high-resolution spectrum in the comet_maths tool, similarly to the method described in Section 2.2.4.
2.3.4. Single Scattering Properties and AOT Estimation
The aerosol microphysical properties derived as described in Section 2.3.2 and Section 2.3.3, are used to compute the single scattering properties using the spheroid package included in the GRASP algorithm [39]. The inputs to spheroid package consist of the particle refractive index, the particle size distribution and the particle axis ratio distribution. The particle size distribution is specified by the average values of the parameters of a bi-lognormal particle size distribution, over the different AERONET stations in the ROI. The bi-lognormal particle size distribution is expressed as:
where r is the radius of the spherical particle with the same volume as the spheroid particle, N is the number of particles with a radius r, i is an index denoting the lognormal component (1 = fine, 2 = coarse), w is a weighting factor and is such that is the standard deviation of where is the magnitude of r. The particle axis ratio distribution is built from AERONET sphericity parameter, according to the following equation:
where a is the spheroid particle axis ratio, N is the number of particles with an axis ratio of a, s is the value of the AERONET sphericity parameter, is the Dirac’s delta distribution and and are given in [38].
Figure 7 shows the Single Scattering Albedo (SSA) and asymmetry factor resulting from the microphysical properties obtained as described in Section 2.3.2 and Section 2.3.3. The SSA over Gobabeb has also been compared to the results by Hemeret et al., in preparation, at , , and , showing a mean bias less then .
2.4. Calibration Reference Accuracy Analysis
The method described in Section 2.2 and Section 2.3 involves certain limitations and assumptions. One key limitation is that CISAR relies on a scalar approximation to solve the radiative transfer equation. This simplification introduces non-negligible errors at short wavelengths, where polarized scattering is significant. Neglecting polarization effects can result in reflectance errors of up to 7% at the top of the atmosphere when assuming a Lambertian surface [13].
Ideally, the accuracy of the proposed method should be evaluated against an SI-traceable reference standard. However, the radiometers listed in Table 2 are not directly traceable to such a standard. Nonetheless, their radiometric accuracy is widely recognized by the scientific community (e.g., [44]), making them a community-consensus reference suitable for assessing the accuracy of the newly proposed RCR.
Clear-sky observations acquired by the sensors listed in Table 2 were simulated using Eradiate, incorporating the atmospheric properties from Section 2.3 and the RPV parameters derived in Section 2.2. These simulations were then used to apply a bias correction to the surface BRF, specifically to the parameter, governing the overall magnitude of surface reflectance. Discrepancies between the RCR and observations may arise due to limitations in the proposed method and sensor characterization (e.g., radiometric calibration, sensor response function characterisation, etc.). To maintain independence from any single sensor, the bias correction is performed using the ensemble of radiometers listed in Table 2. In spectral regions where multiple observations from different sensors are available, the correction is based on the mean simulated TOA BRF. The correction was weighted by the standard deviation of the bias associated with each sensor to ensures that more reliable sensors have a stronger influence on the bias adjustment. In spectral regions with limited multispectral observations, hyperspectral sensors such as PRISMA, EnMAP, and EMIT are leveraged to refine the accuracy of the new RCR.
In order to evaluate the accuracy of the atmospheric simulations, the same method as proposed in [45] is used. Figure 8 shows that the bias between observations and simulations rapidly decreases with increasing iterations (corresponding to the number of clear-sky observations), which is consistent with the findings in [45]. However, a key improvement introduced by the method proposed in this manuscript is the significant reduction in the standard deviation of the accumulated bias, decreasing from 1.7% [45] to 0.7%, demonstrating a substantial improvement in simulation accuracy and stability. This suggests that the revised approach leads to:
- Fast convergence to a stable bias: few iterations are needed to reach a reliable estimate.
- Reduced uncertainty: the much lower standard deviation compared to [45] implies that the surface anisotropy and atmosphere characterisation are improved.
These improvements are mostly attributed to an improved characterisation of the surface anisotropy and a more precise atmospheric profile selection [37]. Overall, these results demonstrate that the proposed methodology offers an accurate and stable framework for atmospheric correction, making it a valuable tool for vicarious calibration applications.
3. Results
3.1. Generation of the Calibration Reference
The RCR is derived using the RPV surface parameters outlined in Section 2.2 and aerosol properties characterized in Section 2.3, with optical thickness obtained from CAMS global reanalysis data. The atmospheric vertical profile and molecular concentrations are similarly sourced from CAMS to represent the state of the atmosphere at the time and location of the satellite observations. Simulations are performed using the Eradiate RTM under the assumption of a 1D atmosphere overlying a flat surface. The following experimental conditions define the RCR generation process:
- A flat surface at the elevation given in Table 1, with reflectance characterized using the RPV model.
- A uniform aerosol layer composed of fine and coarse modes, as detailed in Section 2.3.
- The vertical profile of pressure, temperature, and molecular concentrations generated following [46].
- An irradiance dataset expressing exo-atmospheric solar radiation at 1 1AstronomicalUnit (AU). The Total and Spectral Solar Irradiance Sensor-1 (TSIS-1) Hybrid Solar Reference Spectrum (HSRS) [47] serves as the default model in Eradiate.
- Generation of RCR at 1 resolution using Eradiate, producing simulated TOA BRF over selected spectral intervals and viewing geometries , where and represent the illumination and viewing angles.
The RCR is thus expressed as
where are the RTM input parameters, p and t are the PICS location and acquisition time, is the Sun-Earth distance in AU at time t, is the Sun Zenith Angle (SZA) and the simulated outgoing radiance. Let be a TOA BRF acquired in the spectral band by a space-based radiometer. The corresponding RCR is computed as:
where is the normalised Sensor Spectral Function (SRF) of the radiometer in spectral band j.
The relative bias between the satellite observation and RCR in spectral band j is defined as:
This manuscript focuses on results over Libya-4, due to its historical significance and comparison with [14], and over Gobabeb, as a recently introduced calibration site. These locations provide distinct case studies to assess the robustness of the RCR methodology and its potential for multi-mission calibration efforts.
3.2. Multispectral Results
The RCR generated using the Eradiate radiative transfer model as described in Section 3 was compared with the observations acquired from the multispectral satellites listed in Table 2 to assess the accuracy of the proposed method. The comparison focused on the relative difference between observed and simulated top-of-atmosphere (TOA) reflectance values across wavelengths ranging in the 350–2500 spectral range.
3.2.1. Libya4
The results over Libya4, illustrated in Figure 9, indicate that the relative differences for most sensors remain within , with a mean close to zero across visible and near-infrared (VNIR) wavelengths. The uncertainty bars represent the standard deviation of multiple clear-sky observations. MODIS (AQUA and TERRA) observations, with a calibration accuracy of 2% [48], align well with the RCR, confirming the validity of the approach. Similarly, the Sentinel-3 OLCI instruments (A and B) exhibit stable behaviour with minimal bias across their spectral range, reinforcing their suitability for vicarious calibration applications. It should be noted that no calibration correction has been applied on the instruments observations. This explains the larger biases observed in OLCI on-board Sentinel-3A, known to be about 2% brighter with respect to Sentinel-3B [49]. Notably, the bias observed at 1020 for POLDER aligns with recent calibration studies, which indicate a systematic 5% correction was required for this band due to on-orbit sensor drift over time [50]. These discrepancies highlight the necessity of continuous monitoring and recalibration to maintain long-term sensor accuracy.
3.2.2. Gobabeb
The results over the Gobabeb pseudo-invariant calibration site are presented in Figure 10, which shows the mean relative bias between TOA BRF observations and the simulated RCR across the spectral range for multiple multispectral instruments. As with Libya-4, the agreement remains generally within , particularly in high-transmittance regions. MODIS (Aqua and Terra) and Sentinel-3 OLCI (A and B) show biases that are generally within , with no strong spectral trend. These results are consistent with those observed over Libya-4 and confirm the reliability of the proposed RCR over a smaller and more spatially constrained target like Gobabeb. Sentinel-2A/MSI shows a consistent negative bias across the VNIR and SWIR ranges, with values ranging from –3% to –5%, with the largest negative bias observed in the SWIR. These findings are particularly interesting when compared to [52], who used in situ surface reflectance from the LANDHYPERNET station at Gobabeb and propagated it to TOA using the 6SV radiative transfer model [53]. Figure 6 of [52] shows comparable bias with respect to Sentinel-2/MSI, with the largest bias observed in band 11 (centred at ). However, discrepancy in the magnitude and the sign of the bias at shorter wavelengths are observed, due to the different surface and atmosphere characterisation.
This larger biases and associated standard deviations compared to Libya-4 could reflect limitations in atmospheric or surface reflectance characterisation over Gobabeb, especially considering its smaller spatial extent (2 km × 2 km) relative to other PICSs. The aerosol properties in the area surrounding the Gobabeb site are subject to strong seasonal variability, which cannot be captured using the predefined aerosol model as in Section 2.3 [54]. Furthermore, the use of CAMS data to retrieve the AOT represents a limitation over Gobabeb given the limited spatial extent. The use of AERONET data, as in [52], could potentially improve the quality of the simulations.
Importantly, these results confirm the applicability of the RCR methodology to smaller sites like Gobabeb, despite their limited spatial footprint and sparser observational datasets. The consistency across instruments supports the robustness of the proposed approach and reinforces Gobabeb’s utility as a supplementary calibration target in multi-mission harmonisation frameworks.
While Libya-4 remains a reference PICS for many vicarious calibration efforts due to its large spatial extent and frequent overpasses by multispectral sensors, Gobabeb offers several strategic advantages. As one of the few desert sites equipped with operational in situ instrumentation (e.g., RadCalNet and LANDHYPERNET), it enables traceable surface reflectance measurements with high temporal resolution. Its smaller, homogeneous footprint makes it especially well-suited for the calibration and validation of high-resolution sensors such as Sentinel-2. Gobabeb thus provides a valuable complementary site to Libya-4, particularly for validating SI-traceable calibration chains, testing atmospheric correction methods, and supporting missions requiring high spatial and temporal fidelity. Despite the limitation associated to the limited spatial footprint and the assumptions in the atmospheric characterisation (e.g., one aerosol model, AOT taken from CAMS at a coarser resolution), these results confirm the applicability of the RCR methodology to Gobabeb. The consistency across instruments supports the robustness of the proposed approach and reinforces Gobabeb’s utility as a supplementary calibration target in multi-mission harmonisation frameworks.
3.2.3. Summary
A key pattern across the selected PICSs is that the standard deviation of the relative bias increases at shorter wavelengths (400–900), especially in the blue, where Rayleigh scattering and aerosol uncertainties dominate. Conversely, the SWIR bands (1000–2500) show more stable behaviour with smaller standard deviations. Overall, the results confirm that the RCR generated using Eradiate, combined with improved surface and atmospheric characterization, achieves sensor-agnostic consistency within in most cases, and typically within , even over spatially limited targets like Gobabeb. The comparison with [52] highlights that methodological choices (e.g., use of climatologies vs local measurements) can lead to differences in the sign and magnitude of the biases. Further improvements in surface reflectance characterization and aerosol property retrievals may help refine these estimates, provided the availability of sensors with a radiometric accuracy better than , such as the SITSat radiometers [15].
3.3. Hyperspectral Results
The validation of hyperspectral observations against the Eradiate-generated Rayference RCR provides an in-depth assessment of the accuracy and consistency of the simulated TOA BRF across the full optical spectral range (350–2500) at 1 resolution. This section focuses on spaceborne hyperspectral instruments, including EMIT, PRISMA, and EnMAP, with the Libya-4 PICSs serving as the reference target due to its radiometric stability and historical use in vicarious calibration. Table 3 reports the time span of the observations considered in this study, as well as the number of clear-sky observations over Libya-4 and Gobabeb.
3.3.1. Libya4
Figure 11 shows the mean TOA BRF acquired over Libya-4 from EMIT (top panel), EnMAP (mid panel) and PRISMA (bottom panel) compared to the RCR simulations obtained as described in Section 3.1. A qualitative evaluation of these results confirms the capability of the RCR to simulate hyperspectral simulations with high accuracy, in particular in spectral region with high atmospheric transmittance. The three hyperspectral sensors have an estimated absolute radiometric accuracy between 2.5% and 5% ([55,56,57]); this is in line with the differences compared to the RCR. Moreover, only 6 clear-sky observations acquired by EMIT are available for this study, affecting the reliability of statistical results. A spike in the mean reflectance acquired by EMIT can be observed at 1290; this is known feature of the instrument, due to order sorting filter seams [58].
The relative bias between observed and simulated TOA reflectance, computed according to Equation (7), is shown in Figure 12, which illustrates the comparison for EMIT (blue), PRISMA (orange), and EnMAP (green) over Libya-4, with atmospheric molecular transmittance overlaid (gray-shaded background) to highlight absorption-dominated spectral regions.
3.3.2. Gobabeb
Figure 13 presents the mean TOA BRF observed by EMIT and EnMAP over Gobabeb compared to the Eradiate-simulated RCR. Despite Gobabeb’s limited number of valid satellite overpasses, the agreement between observations and simulations remains consistent in spectral windows with high atmospheric transmittance. The relative bias, shown in Figure 14, remains within ±3% for most of the VNIR and SWIR range, with higher discrepancies in regions dominated by atmospheric absorption. The spike at 1290 in the mean reflectance acquired by EMIT and discussed in [58] is visible in Figure 13. The patterns observed for Gobabeb are similar to those over Libya-4, although the standard deviation is slightly larger, similar to what observed in Section 3.2. While [52] employed in situ HYPERNETS surface reflectance to estimate TOA reflectance via 6SV, this study shows that a top-down RCR approach using Eradiate can yield comparable levels of agreement. The results over Gobabeb demonstrate that, even with a limited number of clear-sky observations, the RCR generated through the proposed methodology provides robust, traceable reflectance references, suitable for high-resolution hyperspectral sensor validation. This highlights Gobabeb’s growing relevance as a reference site, particularly in the context of SI-traceable calibration chains.
3.3.3. Summary
The hyperspectral validation over both Libya-4 and Gobabeb confirms the high accuracy and stability of the RCR simulations across the full solar spectral range. The relative bias generally remains within ±3% in high-transmittance regions, consistent with the radiometric accuracy of the evaluated sensors. Discrepancies above 3% are primarily observed in strong atmospheric absorption bands, such as those centred at 970, 1200, 1450 and 1950.To better understand the role of atmospheric transmittance, Figure 15 and Figure 16 correlate observed biases with molecular transmittance. This analysis confirms that biases remain low (< 3%) in high-transmittance regions (e.g., 500 – 700, 1600 – 1700), while discrepancies increase in water vapour absorption bands (e.g., 1450 and 1950). The comparison with hyperspectral observations is better than 3% when the molecular transmittance exceeds 83%. While the bias variability is slightly higher at Gobabeb, the correlation between bias and transmittance observed at Libya-4 is preserved, reinforcing the robustness of the RCR even under data-sparse conditions. For atmospheres with a molecular transmittance below 83% (considered opaque), further research is required to identify the causes of the observed discrepancies.
Importantly, this study demonstrates a substantial improvement in simulation stability, with the standard deviation of the accumulated bias reduced from 1.7% to 0.7%, as compared to previous methodologies (Section 2.4). This improved precision is particularly critical when only a few observations are available — such as with EMIT or over spatially constrained targets like Gobabeb. The consistency of bias estimates across iterations and missions supports the suitability of the proposed RCR approach for validating new hyperspectral missions under data-sparse conditions.
As atmospheric absorption remains the main source of uncertainty in specific spectral windows, further refinements in gaseous absorption modelling — possibly with higher spectral resolution RTMs — will be neceSSAry to meet the 1% accuracy threshold of upcoming missions such as CHIME or SITSat.
4. Discussion and Conclusions
This study set out to develop an enhanced methodology for generating a simulated RCR over bright desert PICS, with the goal of improving the radiometric accuracy and inter-mission consistency of Earth observation hyperspectral instruments. To achieve this, key methodological improvements were introduced in three core areas: (i) surface reflectance characterisation, (ii) atmospheric property modelling, and (iii) radiative transfer simulations using the state-of-the-art Eradiate model. The resulting RCR exhibits markedly improved accuracy and stability, with the standard deviation of the accumulated bias reduced from 1.7% to 0.7%, compared to previous approaches [45].
Validation of the RCR against multispectral observations over Libya-4 confirms the effectiveness of the method, with mean relative biases generally within ±3%, consistent with the radiometric calibration accuracy of sensors such as MODIS, Sentinel-2 MSI, and Sentinel-3 OLCI. The analysis over Gobabeb reveals larger biases and instrument discrepancies, notably a large negative bias for Sentinel-2A/MSI in the SWIR, in agreement with earlier studies using in situ data and alternative RTMs [52].
A central outcome of this work is the validation of the refined RCR against hyperspectral instruments, namely EMIT, PRISMA, and EnMAP. Across both Libya-4 and Gobabeb, mean reflectance biases remain below ±3% across most of the spectral domain. This confirms the methodology’s ability to support high-resolution spectral calibration requirements. Discrepancies are lowest (<3%) in spectral regions where transmittance exceeds 83%, and rise in absorption bands. These results confirm that a single, simulation-based RCR can serve as a reliable calibration reference across multiple hyperspectral sensors, paving the way for their radiometric harmonisation. This is of particular relevance for the generation of consistent long-term hyperspectral climate data records and supports inter-mission comparability and continuity.
Gobabeb’s relevance as a calibration site is reinforced by this study. While its small size limits the number of usable satellite acquisitions, it benefits from the availability of in situ data, making it uniquely suited for traceable calibration validation. Its homogeneity and suitability for high-resolution sensors complement the strengths of Libya-4, supporting the need for a multi-site RCR strategy.
The refined RCR methodology represents a powerful asset for the verification of multi- and hyper-spectral sensors and supports the harmonization of radiometric datasets across missions, addressing challenges in climate data record continuity. For future missions, particularly those with stringent radiometric accuracy requirements (e.g., better than 1% for SITSat instruments), the continuous improvement of calibration references will be essential. By incorporating high-resolution surface reflectance, advanced aerosol characterisation, and Monte Carlo-based radiative transfer, this approach lays the groundwork for next-generation harmonisation techniques tailored to hyperspectral data.
In conclusion, the methodological improvements presented in this paper provide a substantial step forward in the simulation of radiometric calibration references, with particular value for hyperspectral mission support. The improvements in surface and atmospheric characterization, combined with the use of the Eradiate RTM, significantly reduce uncertainty and improve consistency across satellite sensors and potentially contribute to the long-term stability of climate data records. Moreover, by demonstrating that a common RCR can be applied across EMIT, PRISMA, and EnMAP, the results strongly support its use for harmonising hyperspectral instruments and securing long-term consistency in climate data records. The method described in this manuscript offer a robust foundation to support upcoming hyperspectral missions such as Copernicus Hyperspectral Imaging Mission (CHIME) and SITSat.
Author Contributions
Conceptualization, Y.G. and M.L.; methodology, M.L.; software, N.M.; validation, M.L. and Y.G.; writing—original draft preparation, M.L.; writing—review and editing, Y.G.; project administration, Y.G.; funding acquisition, Y.G. All authors have read and agreed to the published version of the manuscript.
Funding
This research work has been performed under the EUMETSAT RPV4PICS (contract N° EUM/CO/22/4600002648/SeW) and ESA HyperPICS (CCN N° 10 to contract N° QA4EO/SER/SUB/24) projects.
Data Availability Statement
The simulation presented in this paper can be delivered upon request.
Acknowledgments
The authors would like to thank Dr. Paola Formenti and Dr. François Hemeret for sharing the aerosol data over Gobabeb; the Italian Space Agency (ASI) for providing support regarding PRISMA observations and Dr. Claudia Emde for her scientific support and valuable feedback during the preparation of the manuscript.
Conflicts of Interest
The authors declare no conflicts of interest.
References
- Boesch, H.; Brindley, H.; Carminati, F.; Fox, N.; Helder, D.; Hewison, T.; Houtz, D.; Hunt, S.; Kopp, G.; Mlynczak, M.; et al. SI-traceable space-based climate observation system: A CEOS and GSICS Workshop. National Physical Laboratory, UK, 9–11 Sept 2019. Technical report, National Physical Laboratory, 2022. [CrossRef]
- Cosnefroy, H.; Leroy, M.; Briottet, X. Selection and Characterization of Saharan and Arabian Desert Sites for the Calibration of Optical Satellite Sensors. Remote Sensing of Environnment 1996, 58, 101–114. [Google Scholar] [CrossRef]
- Staylor, W.F. Degradation Rates of the AVHRR Visible Channel for the NOAA 6, 7, and 9 Spacecraft. Journal of Atmospheric and Oceanic Technology 1990, 7, 411–423. [Google Scholar] [CrossRef]
- Bhatt, R.; Doelling, D.; Wu, A.; Xiong, X.; Scarino, B.; Haney, C.; Gopalan, A. Initial Stability Assessment of S-NPP VIIRS Reflective Solar Band Calibration Using Invariant Desert and Deep Convective Cloud Targets. Remote Sensing 2014, 6, 2809–2826. [Google Scholar] [CrossRef]
- Smith, D.L.; Mutlow, C.T.; Rao, C.R.N. Calibration Monitoring of the Visible and Near-Fnfrared Channels of Along-Track Scanning Radiometer-2 (ATSR-2) Using Stable Terrestrial Sites. Applied Optics 2002, 41, 515–523. [Google Scholar] [CrossRef] [PubMed]
- Wu, A.; Xiong, X.; Cao, C.; Angal, A. Monitoring MODIS Calibration Stability of Visible and Near-IR Bands from Observed Top-of-Atmosphere BRDF-normalized Reflectances over Libyan Desert and Antarctic Surfaces. In Proceedings of the Earth Observing System XIII; Butler, J.J., Xiong, J., Eds.; 2008; p. 708113–708113–9. [Google Scholar] [CrossRef]
- Govaerts, Y.M.; Clerici, M. Evaluation of Radiative Transfer Simulations over Bright Desert Calibration Sites. IEEE Transactions on Geoscience and Remote Sensing 2004, 42, 176–187. [Google Scholar] [CrossRef]
- Govaerts, Y.; Clerici, M.; Clerbaux, N. Operational Calibration of the Meteosat Radiometer VIS Band. IEEE Transactions on Geoscience and Remote Sensing 2004, 42, 1900–1914. [Google Scholar] [CrossRef]
- Bacour, C.; Briottet, X.; Bréon, F.M.; Viallefont-Robinet, F.; Bouvet, M. Revisiting Pseudo Invariant Calibration Sites (PICS) Over Sand Deserts for Vicarious Calibration of Optical Imagers at 20 km and 100 km Scales. Remote Sensing 2019, 11, 1166. [Google Scholar] [CrossRef]
- Vermote, E.F.; Tanré, D.; Deuzé, J.L.; Herman, M.; Morcrette, J.J. Second Simulation of the Satellite Signal in the Solar Spectrum, 6S: An Overview. IEEE Transactions on Geoscience and Remote Sensing 1997, 35, 675–686. [Google Scholar] [CrossRef]
- Govaerts, Y.; Sterckx, S.; Adriaensen, S. Use of Simulated Reflectances over Bright Desert Target as an Absolute Calibration Reference. Remote Sensing Letters 2013, 523–531. [Google Scholar] [CrossRef]
- Giles, D.M.; Sinyuk, A.; Sorokin, M.G.; Schafer, J.S.; Smirnov, A.; Slutsker, I.; Eck, T.F.; Holben, B.N.; Lewis, J.R.; Campbell, J.R.; et al. Advancements in the Aerosol Robotic Network (AERONET) Version 3 Database – Automated near-Real-Time Quality Control Algorithm with Improved Cloud Screening for Sun Photometer Aerosol Optical Depth (AOD) Measurements. Atmospheric Measurement Techniques 2019, 12, 169–209. [Google Scholar] [CrossRef]
- Kotchenova, S.Y.; Vermote, E.F.; Matarrese, R.; Klemm, F.J. Validation of a Vector Version of the 6S Radiative Transfer Code for Atmospheric Correction of Satellite Data. Part I: Path Radiance. Applied Optics 2006, 45, 6762–6774. [Google Scholar] [CrossRef] [PubMed]
- Govaerts, M.Y. Estimating the Accuracy of 1D Radiative Transfer Models over the Libya-4 Site. Technical Report RTMPV-WO1-2.3, Rayference, 2019. Available online: https://www.eradiate.eu/resources/docs/reports/report-assessment_calibration_libya4-2.3-20191007.pdf (accessed on 20 April 2025).
- Boesch, H.; Brindley, H.; Carminati, F.; Fox, N.; Helder, D.; Hewison, T.; Houtz, D.; Hunt, S.; Kopp, G.; Mlynczak, M.; et al. SI-traceable Space-Based Climate Observation System: A CEOS and GSICS Workshop. National Physical Laboratory, UK, 9–11 Sept 2019. Technical report, National Physical Laboratory, 2022. [CrossRef]
- Govaerts, Y.; Nollet, Y.; Leroy, V. Radiative Transfer Model Comparison with Satellite Observations over CEOS Calibration Site Libya-4. Atmosphere 2022, 13, 1759. [Google Scholar] [CrossRef]
- Leroy, V.; Nollet, Y.; Schunke, S.; Misk, N.; Marton, N.; Govaerts, Y. Eradiate radiative transfer model, 2024.
- Ruddick, K.G.; Bialek, A.; Brando, V.E.; De Vis, P.; Dogliotti, A.I.; Doxaran, D.; Goryl, P.; Goyens, C.; Kuusk, J.; Spengler, D.; et al. HYPERNETS: A network of automated hyperspectral radiometers to validate water and land surface reflectance (380–1680 nm) from all satellite missions. Frontiers in Remote Sensing 2024, 5. [Google Scholar] [CrossRef]
- Bialek, A.; Greenwell, C.; Lamare, M.; Meygret, A.; Marcq, S.; Lacherade, S.; Woolliams, E.; Berthelot, B.; Bouvet, M.; King, M.; et al. New radiometric calibration site located at Gobabeb, Namib desert. In Proceedings of the 2016 IEEE International Geoscience and Remote Sensing Symposium, IGARSS 2016 - Proceedings, United States, 15 July 2016; pp. 6094–6097. [Google Scholar] [CrossRef]
- European Space Agency.; Airbus. Copernicus DEM, 2022. 2025. [CrossRef]
- Govaerts, Y.M. Sand Dune Ridge Alignment Effects on Surface BRF over the Libya-4 CEOS Calibration Site. Sensors 2015, 15, 3453–3470. [Google Scholar] [CrossRef] [PubMed]
- Rahman, H.; Pinty, B.; Verstraete, M.M. Coupled Surface-Atmosphere Reflectance (CSAR) Model. 2. Semiempirical Surface Model Usable with NOAA Advanced Very High Resolution Radiometer Data. Journal of Geophysical Research 1993, 98, 20791–20801. [Google Scholar] [CrossRef]
- Govaerts, Y.; Luffarelli, M. Joint Retrieval of Surface Reflectance and Aerosol Properties with Continuous Variation of the State Variables in the Solution Space – Part 1: Theoretical Concept. Atmospheric Measurement Techniques 2018, 11, 6589–6603. [Google Scholar] [CrossRef]
- Govaerts, Y.; Luffarelli, M. Joint retrieval of surface reflectance and aerosol properties with continuous variation of the state variables in the solution space – Part 1: Theoretical concept. Atmospheric Measurement Techniques 2018, 11, 6589–6603. [Google Scholar] [CrossRef]
- Hersbach, H.; Bell, B.; Berrisford, P.; Biavati, G.; Horányi, A.; Muñoz Sabater, J.; Nicolas, J.; Peubey, C.; Radu, R.; Rozum, I.; et al. ERA5 hourly data on single levels from 1940 to present, 2023. [CrossRef]
- Luffarelli, M.; Govaerts, Y. Joint Retrieval of Surface Reflectance and Aerosol Properties with Continuous Variation of the State Variables in the Solution Space – Part 2: Application to Geostationary and Polar-Orbiting Satellite Observations. Atmospheric Measurement Techniques 2019, 12, 791–809. [Google Scholar] [CrossRef]
- Kinne, S. Aerosol Radiative Effects with MACv2. Atmospheric Chemistry and Physics 2019, 19, 10919–10959. [Google Scholar] [CrossRef]
- Nicodemus, F.E.; Richmond, J.C.; Hsia, J.J.; Ginsberg, I.W.; Limperis, T. Geometrical Considerations and Nomenclature for Reflectance. Technical Report NBS MONO 160, National Bureau of Standards, Gaithersburg, MD, 1977. [CrossRef]
- GUM. Evaluation of Measurement Data—An Introduction to the “Guide to the Expression of the Uncertainty in Measurement” and Related Documents. GUM JCGM 104:2009, BIPM, Paris, 2009. Available online: https://www.bipm.org/documents/20126/2071204/JCGM_104_2009.pdf/19e0a96c-6cf3-a056-4634-4465c576e513?version=1.8&download=true (accessed on 17 March 2025).
- NPL. comet_maths toolkit, 2023. Available online: https://www.comet-toolkit.org/tools/comet_maths/ (accessed on 2 March 2025).
- Dupiau, A.; Jacquemoud, S.; Briottet, X.; Fabre, S.; Viallefont-Robinet, F.; Philpot, W.; Di Biagio, C.; Hébert, M.; Formenti, P. MARMIT-2: An improved version of the MARMIT model to predict soil reflectance as a function of surface water content in the solar domain. Remote Sensing of Environment 2022, 272, 112951. [Google Scholar] [CrossRef]
- Lavergne, T.; Kaminski, T.; Pinty, B.; Taberner, M.; Gobron, N.; Verstraete, M.; Voßbeck, M.; Widlowski, J.L.; Giering, R. An RPV Model Inversion Package Using Adjoint and Hessian Codes. In Proceedings of the International Meeting on Data Assimilation in Carbon Cycle Science, Edinburgh, UK, 2006. [Google Scholar]
- Benedetti, A.; Morcrette, J.J.; Boucher, O.; Dethof, A.; Engelen, R.J.; Fisher, M.; Flentje, H.; Huneeus, N.; Jones, L.; Kaiser, J.W.; et al. Aerosol Analysis and Forecast in the European Centre for Medium-Range Weather Forecasts Integrated Forecast System: 2. Data Assimilation. Journal of Geophysical Research: Atmospheres 2009, 114, 2008JD011115. [Google Scholar] [CrossRef]
- Gueymard, C.A.; Yang, D. Worldwide Validation of CAMS and MERRA-2 Reanalysis Aerosol Optical Depth Products Using 15 Years of AERONET Observations. Atmospheric Environment 2020, 225, 117216. [Google Scholar] [CrossRef]
- Inness, A.; Ades, M.; Agustí-Panareda, A.; Barré, J.; Benedictow, A.; Blechschmidt, A.M.; Dominguez, J.J.; Engelen, R.; Eskes, H.; Flemming, J.; et al. The CAMS Reanalysis of Atmospheric Composition. Atmospheric Chemistry and Physics 2019, 19, 3515–3556. [Google Scholar] [CrossRef]
- Agustí-Panareda, A.; Barré, J.; Massart, S.; Inness, A.; Aben, I.; Ades, M.; Baier, B.C.; Balsamo, G.; Borsdorff, T.; Bousserez, N.; et al. Technical Note: The CAMS Greenhouse Gas Reanalysis from 2003 to 2020. Atmospheric Chemistry and Physics, 3859. [Google Scholar] [CrossRef]
- Leroy, V.; Schunke, S.; Franceschini, L.; Misk, N. Impact of atmospheric vertical profile on hyperspectral simulations over bright desert pseudo-invariant calibration site. European Journal of Remote Sensing 2024, 57, 2389798. [Google Scholar] [CrossRef]
- Dubovik, O.; Sinyuk, A.; Lapyonok, T.; Holben, B.N.; Mishchenko, M.; Yang, P.; Eck, T.F.; Volten, H.; Munoz, O.; Veihelmann, B.; et al. Application of Spheroid Models to Account for Aerosol Particle Nonsphericity in Remote Sensing of Desert Dust. Journal of Geophysical Research-Atmospheres 2006, 111, 11208–11208. [Google Scholar] [CrossRef]
- Dubovik, O.; Fuertes, D.; Litvinov, P.; Lopatin, A.; Lapyonok, T.; Doubovik, I.; Xu, F.; Ducos, F.; Chen, C.; Torres, B.; et al. A Comprehensive Description of Multi-Term LSM for Applying Multiple a Priori Constraints in Problems of Atmospheric Remote Sensing: GRASP Algorithm, Concept, and Applications. Frontiers in Remote Sensing 2021, 2, 706851. [Google Scholar] [CrossRef]
- Ali, M.A.; Nichol, J.E.; Bilal, M.; Qiu, Z.; Mazhar, U.; Wahiduzzaman, M.; Almazroui, M.; Islam, M.N. Classification of aerosols over Saudi Arabia from 2004–2016. Atmospheric Environment 2020, 241, 117785. [Google Scholar] [CrossRef]
- Hemeret, F.; Formenti, P.; Di-Biagio, C.; Language, B.; Chevaillier, S.; Féron, A.; Cazaunau, M.; Torres-Sánchez, R.; Piketh, S.; Engelbrecht, F.; et al. New observations of climate-relevant properties of atmospheric aerosols in Namibia, southern Africa. Technical Report EGU23-465, Copernicus Meetings, 2023. Conference Name: EGU23. [CrossRef]
- EUROCHAMP. EUROCHAMP Data Centre, 2023. https://data.eurochamp.org. Accessed on 02-01-2025.
- Hess, M.; Koepke, P.; Schult, I. Optical Properties of Aerosols and Clouds: The Software Package OPAC. Bulletin of the American Meteorological Society 1998, 79, 831–844. [Google Scholar] [CrossRef]
- S2 MSI ESL team. Sentinel-2 Annual Performance Report – Year 2023. Technical Report OMPC.CS.APR.003, ESA, 2024. https://sentiwiki.copernicus.eu/__attachments/1673423/OMPC.CS.APR.003%20-%20S2%20MSI%20Annual%20Performance%20Report%202023%20-%201.0.pdf?inst-v=42dc07dd-44ef-491c-a236-c4c0594343a7. Accessed on 20-03-2025.
- Misk, N.; Nollet, Y.; Franceschini, L.; Govaerts, Y. Analysis of the impact of water vapour on Sentinel-2 MSI bands 8 and 8a TOA reflectance. https://eradiate.eu/resources/docs/reports/report-analysis_water_s2_8_8a-1.0.1-20220902.pdf. Accessed on 18-03-2025.
- Leroy, V.; Schunke, S.; Franceschini, L.; Misk, N.; Govaerts, Y. Impact of atmospheric vertical profile on hyperspectral simulations over bright desert pseudo-invariant calibration site. European Journal of Remote Sensing 2024, 57, 2389798. [Google Scholar] [CrossRef]
- Coddington, O.M.; Richard, E.C.; Harber, D.; Pilewskie, P.; Woods, T.N.; Chance, K.; Liu, X.; Sun, K. The TSIS-1 Hybrid Solar Reference Spectrum. Geophysical Research Letters 2021, 48, e2020GL091709. [Google Scholar] [CrossRef]
- Xiong, X.; Barnes, W. An overview of MODIS radiometric calibration and characterization. Advances in Atmospheric Sciences 2006, 23, 69–79. [Google Scholar] [CrossRef]
- Lamquin, N.; Clerc, S.; Bourg, L.; Donlon, C. OLCI A/B Tandem Phase Analysis, Part 1: Level 1 Homogenisation and Harmonisation. Remote Sensing 2020, 12. [Google Scholar] [CrossRef]
- Fougnie, B. Improvement of the PARASOL Radiometric In-Flight Calibration Based on Synergy Between Various Methods Using Natural Targets. IEEE Transactions on Geoscience and Remote Sensing 2016, 54, 2140–2152. [Google Scholar] [CrossRef]
- Anderson, G.P.; Clough, S.A.; Kneizys, F.X.; Chetwynd, J.H.; Shettle, E.P. AFGL atmospheric constituent profiles (0.120km), 1986.
- De Vis, P.; Howes, A.; Vanhellemont, Q.; Bialek, A.; Morris, H.; Sinclair, M.; Ruddick, K. Feasibility of satellite vicarious calibration using HYPERNETS surface reflectances from Gobabeb and Princess Elisabeth Antarctica sites. Frontiers in Remote Sensing 2024, 5, 1323998. [Google Scholar] [CrossRef]
- Kotchenova, S.Y.; Vermote, E.F.; Matarrese, R.; Frank, J. Klemm, J. Validation of a vector version of the 6S radiative transfer code for atmospheric correction of satellite data. Part I: Path radiance. Appl. Opt. 2006, 45, 6762–6774. [Google Scholar] [CrossRef] [PubMed]
- Formenti, P. A new station for long-term in situ observations of optical and microphysical properties of aerosols in Gobabeb, Namibia, 2023. https://earth.esa.int/documents/20142/4300037/10-QA4EO_CalVal_WS4_Formenti.pdf. Accessed on 2025-03-25.
- ASI. PRISMA Algorithm Theoretical Basis Document, 2021. https://prisma.asi.it/missionselect/docs/PRISMA%20ATBD_v1.pdf. Accessed on 20-03-2025.
- Storch, T.; Honold, H.P.; Chabrillat, S.; Habermeyer, M.; Tucker, P.; Brell, M.; Ohndorf, A.; Wirth, K.; Betz, M.; Kuchler, M.; et al. The EnMAP imaging spectroscopy mission towards operations. Remote Sensing of Environment 2023, 294, 113632. [Google Scholar] [CrossRef]
- Coleman, R.W.; Thompson, D.R.; Brodrick, P.G.; Ben-Dor, E.; Cox, E.; García-Pando, C.P.; Hoefen, T.; Kokaly, R.; Meyer, J.M.; Ochoa, F.; et al. An Accuracy Assessment of the Surface Reflectance Product from the EMIT Imaging Spectrometer, 2024. https://essopenarchive.org/users/751176/articles/722321-an-accuracy-assessment-of-the-surface-reflectance-product-from-the-emit-imaging-spectrometer?commit=676d1a5d345289a86c1384f61035e235f2616f33. 2025. [Google Scholar] [CrossRef]
- Thompson, D.R.; Green, R.O.; Bradley, C.; Brodrick, P.G.; Mahowald, N.; Dor, E.B.; Bennett, M.; Bernas, M.; Carmon, N.; Chadwick, K.D.; et al. On-orbit calibration and performance of the EMIT imaging spectrometer. Remote Sensing of Environment 2024, 303, 113986. [Google Scholar] [CrossRef]
Figure 1.
Longitudinal transect of the Libya-4 target.
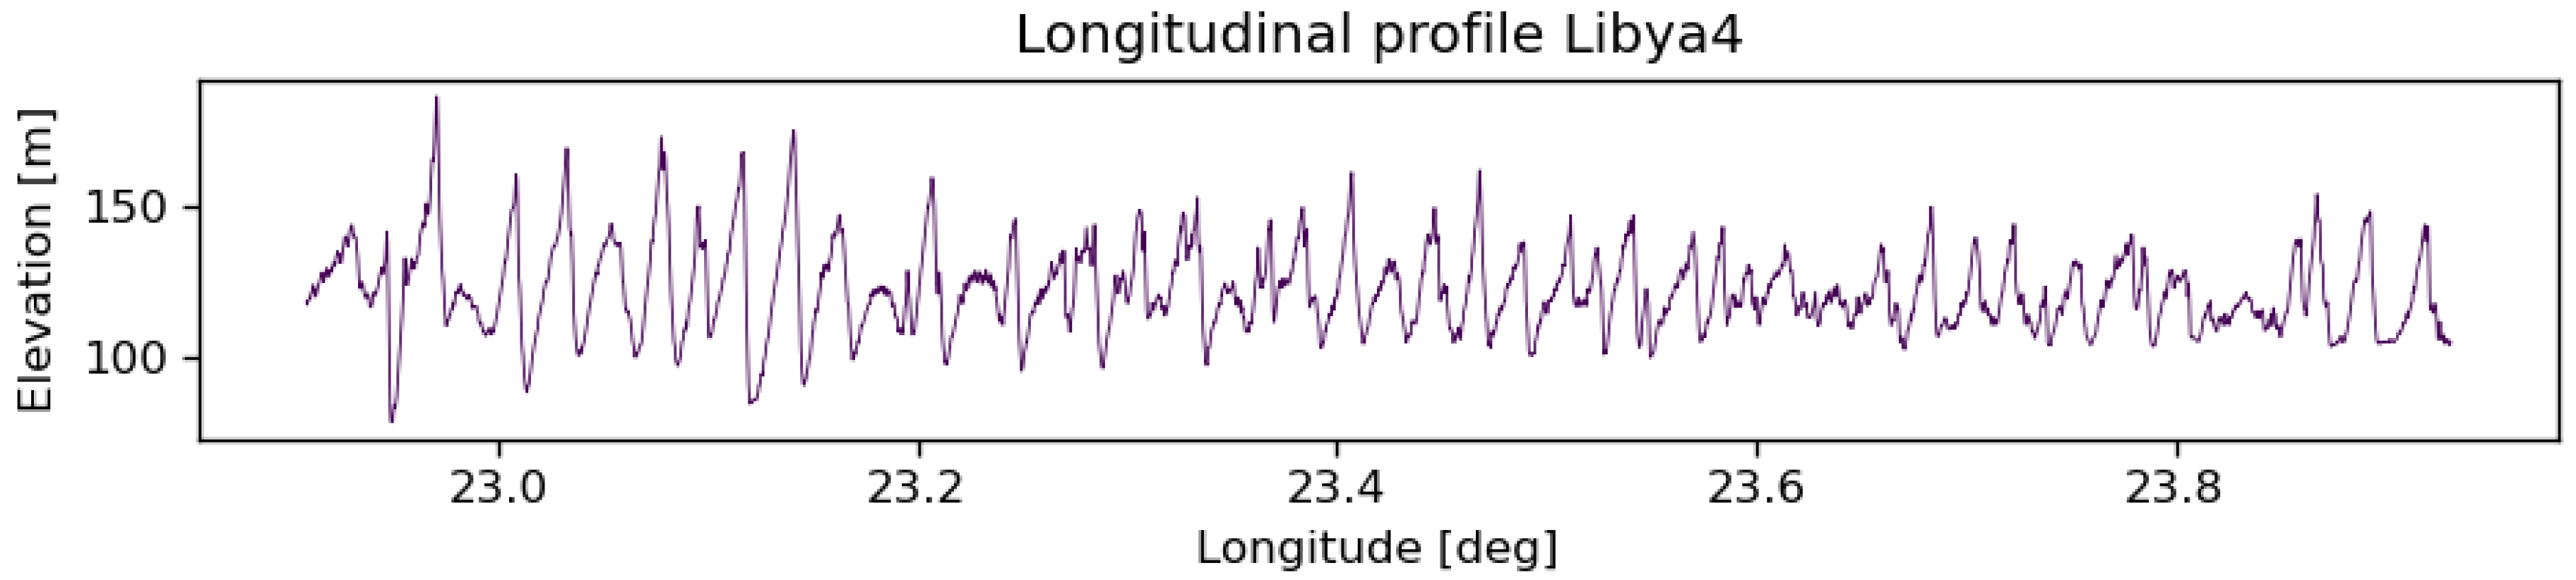
Figure 2.
DHR computed for a SZA of 10° from the RPV parameters retrieved by CISAR over Libya-4 in the spectral bands listed in Table 2. The vertical bars represent the uncertainty associated to CISAR retrieval.
Figure 2.
DHR computed for a SZA of 10° from the RPV parameters retrieved by CISAR over Libya-4 in the spectral bands listed in Table 2. The vertical bars represent the uncertainty associated to CISAR retrieval.
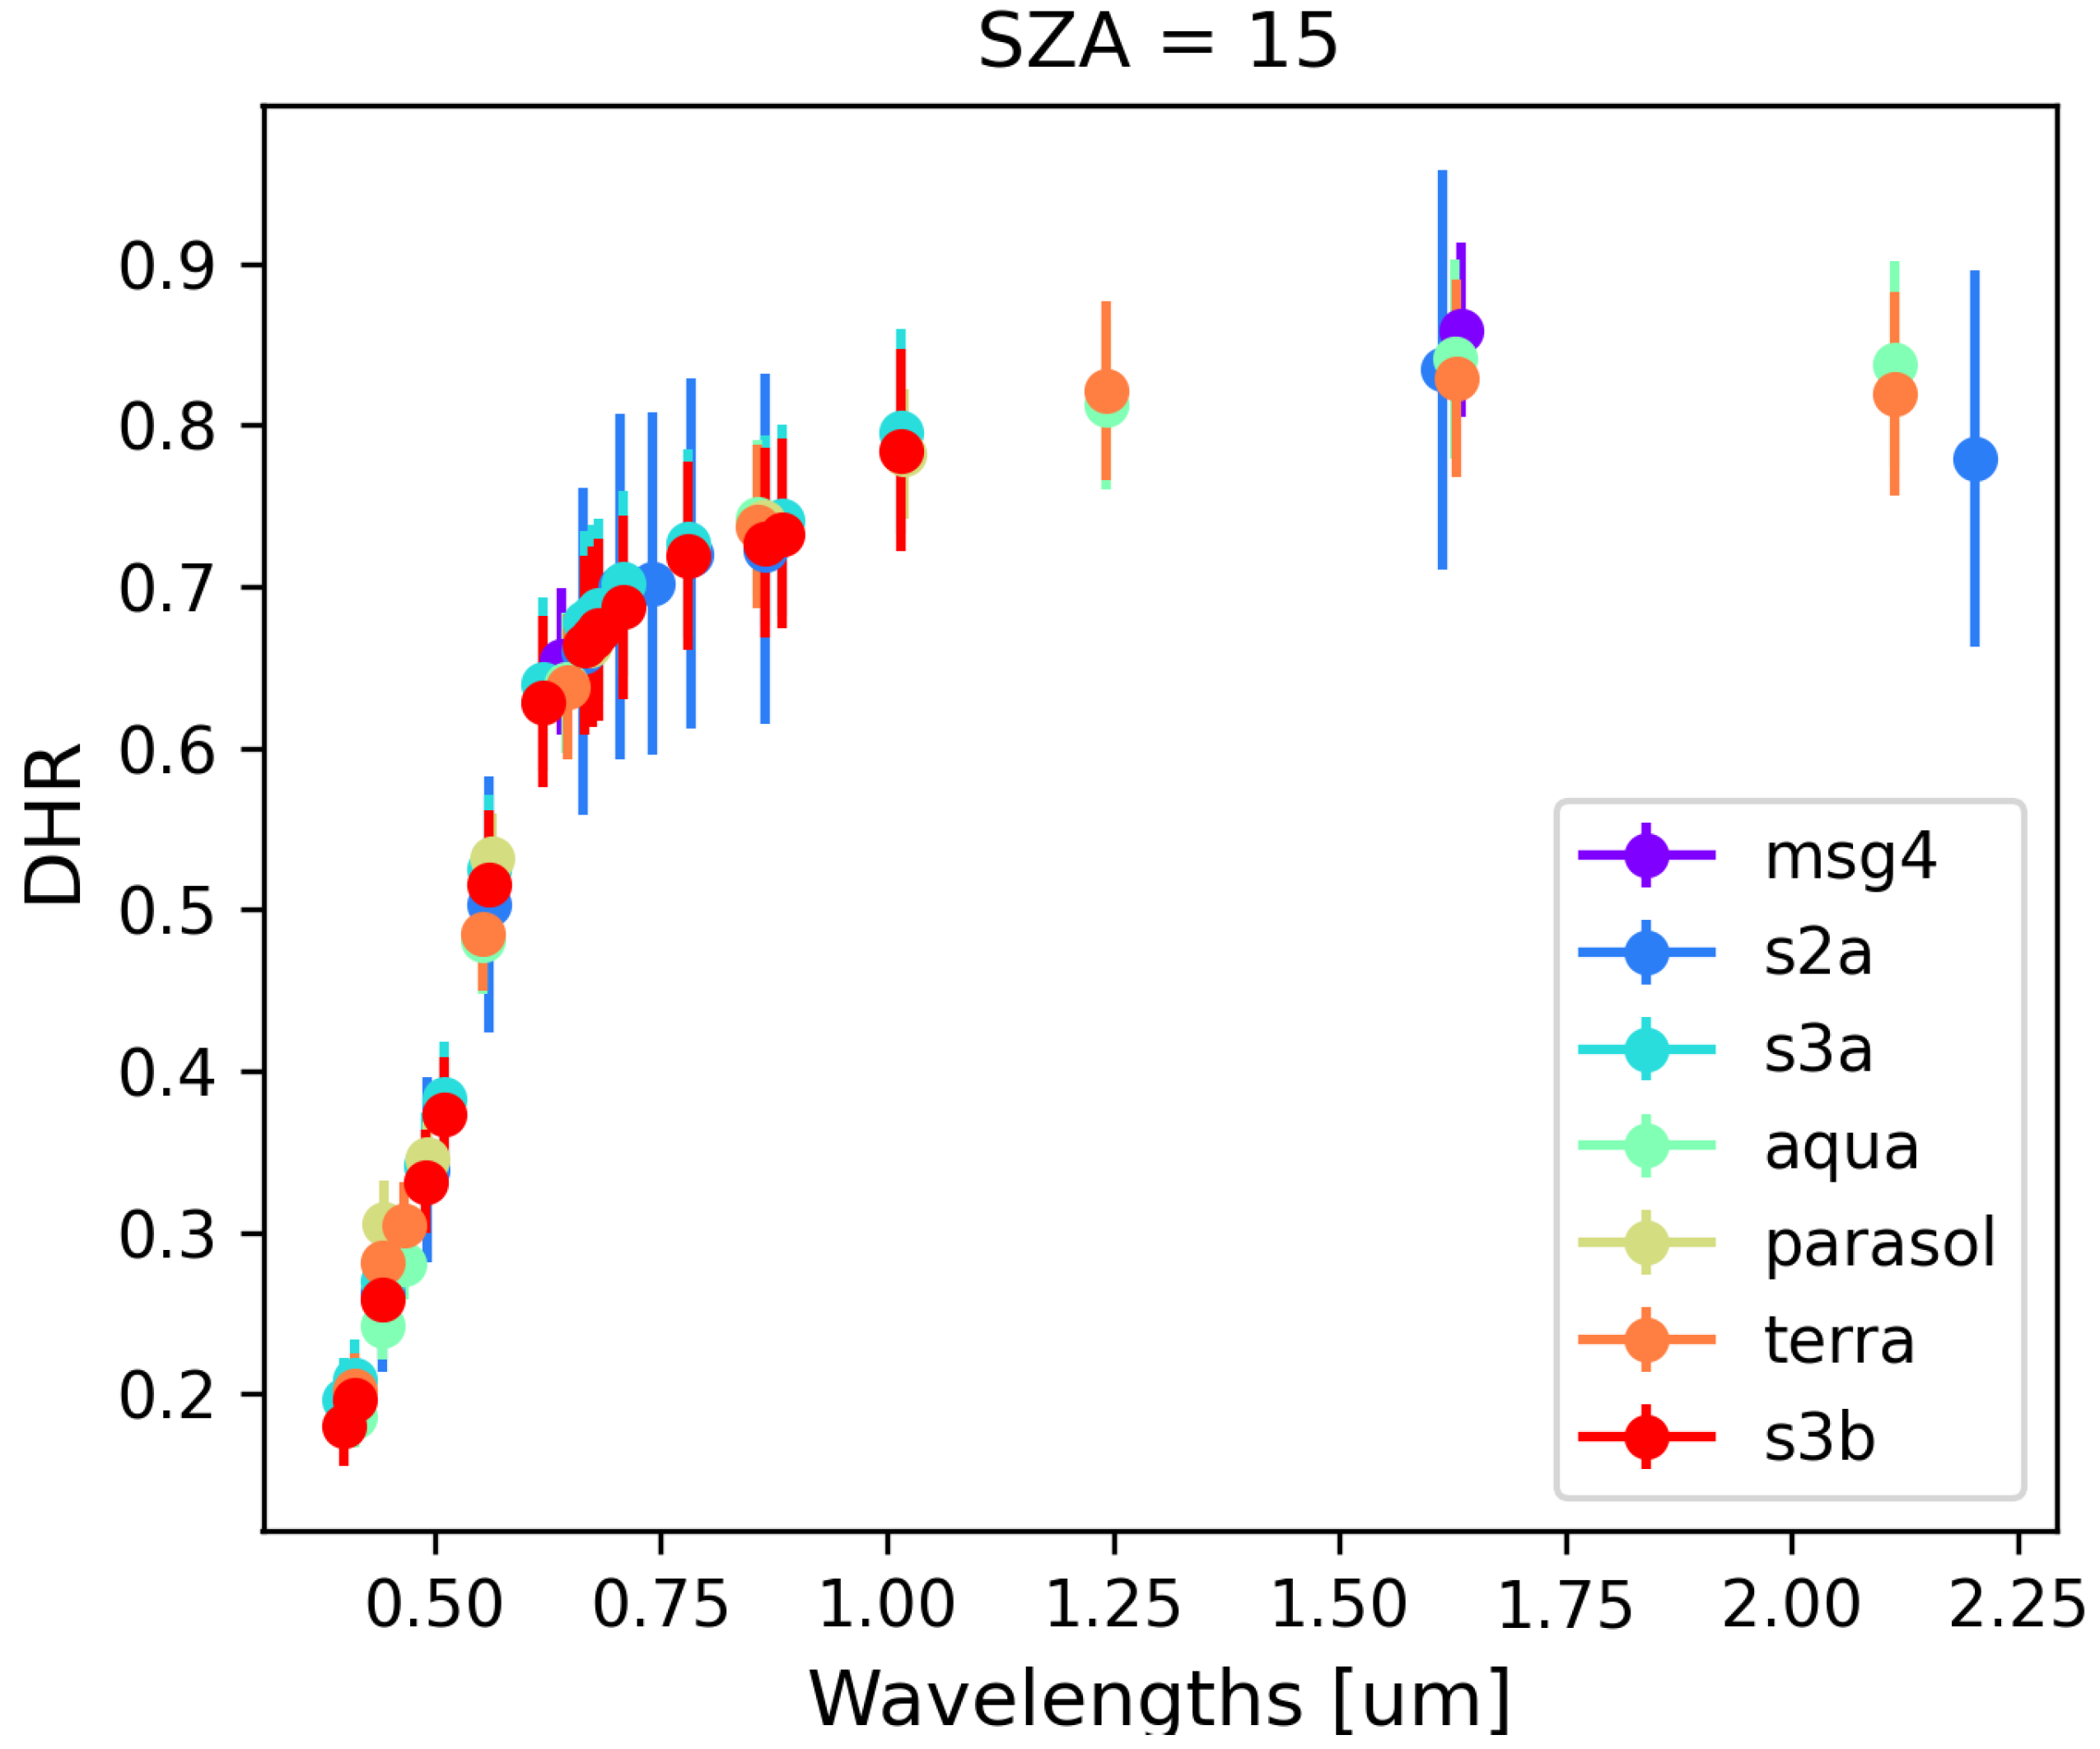
Figure 3.
The red solid line represents DHR derived from the CISAR retrieved RPV parameters (dashed blue line), interpolated enforcing the spectral behaviour obtained from MARMIT weigthed mean spectra (dashed black line) through the comet_maths interpolation tool. Results are for Libya-4.
Figure 3.
The red solid line represents DHR derived from the CISAR retrieved RPV parameters (dashed blue line), interpolated enforcing the spectral behaviour obtained from MARMIT weigthed mean spectra (dashed black line) through the comet_maths interpolation tool. Results are for Libya-4.
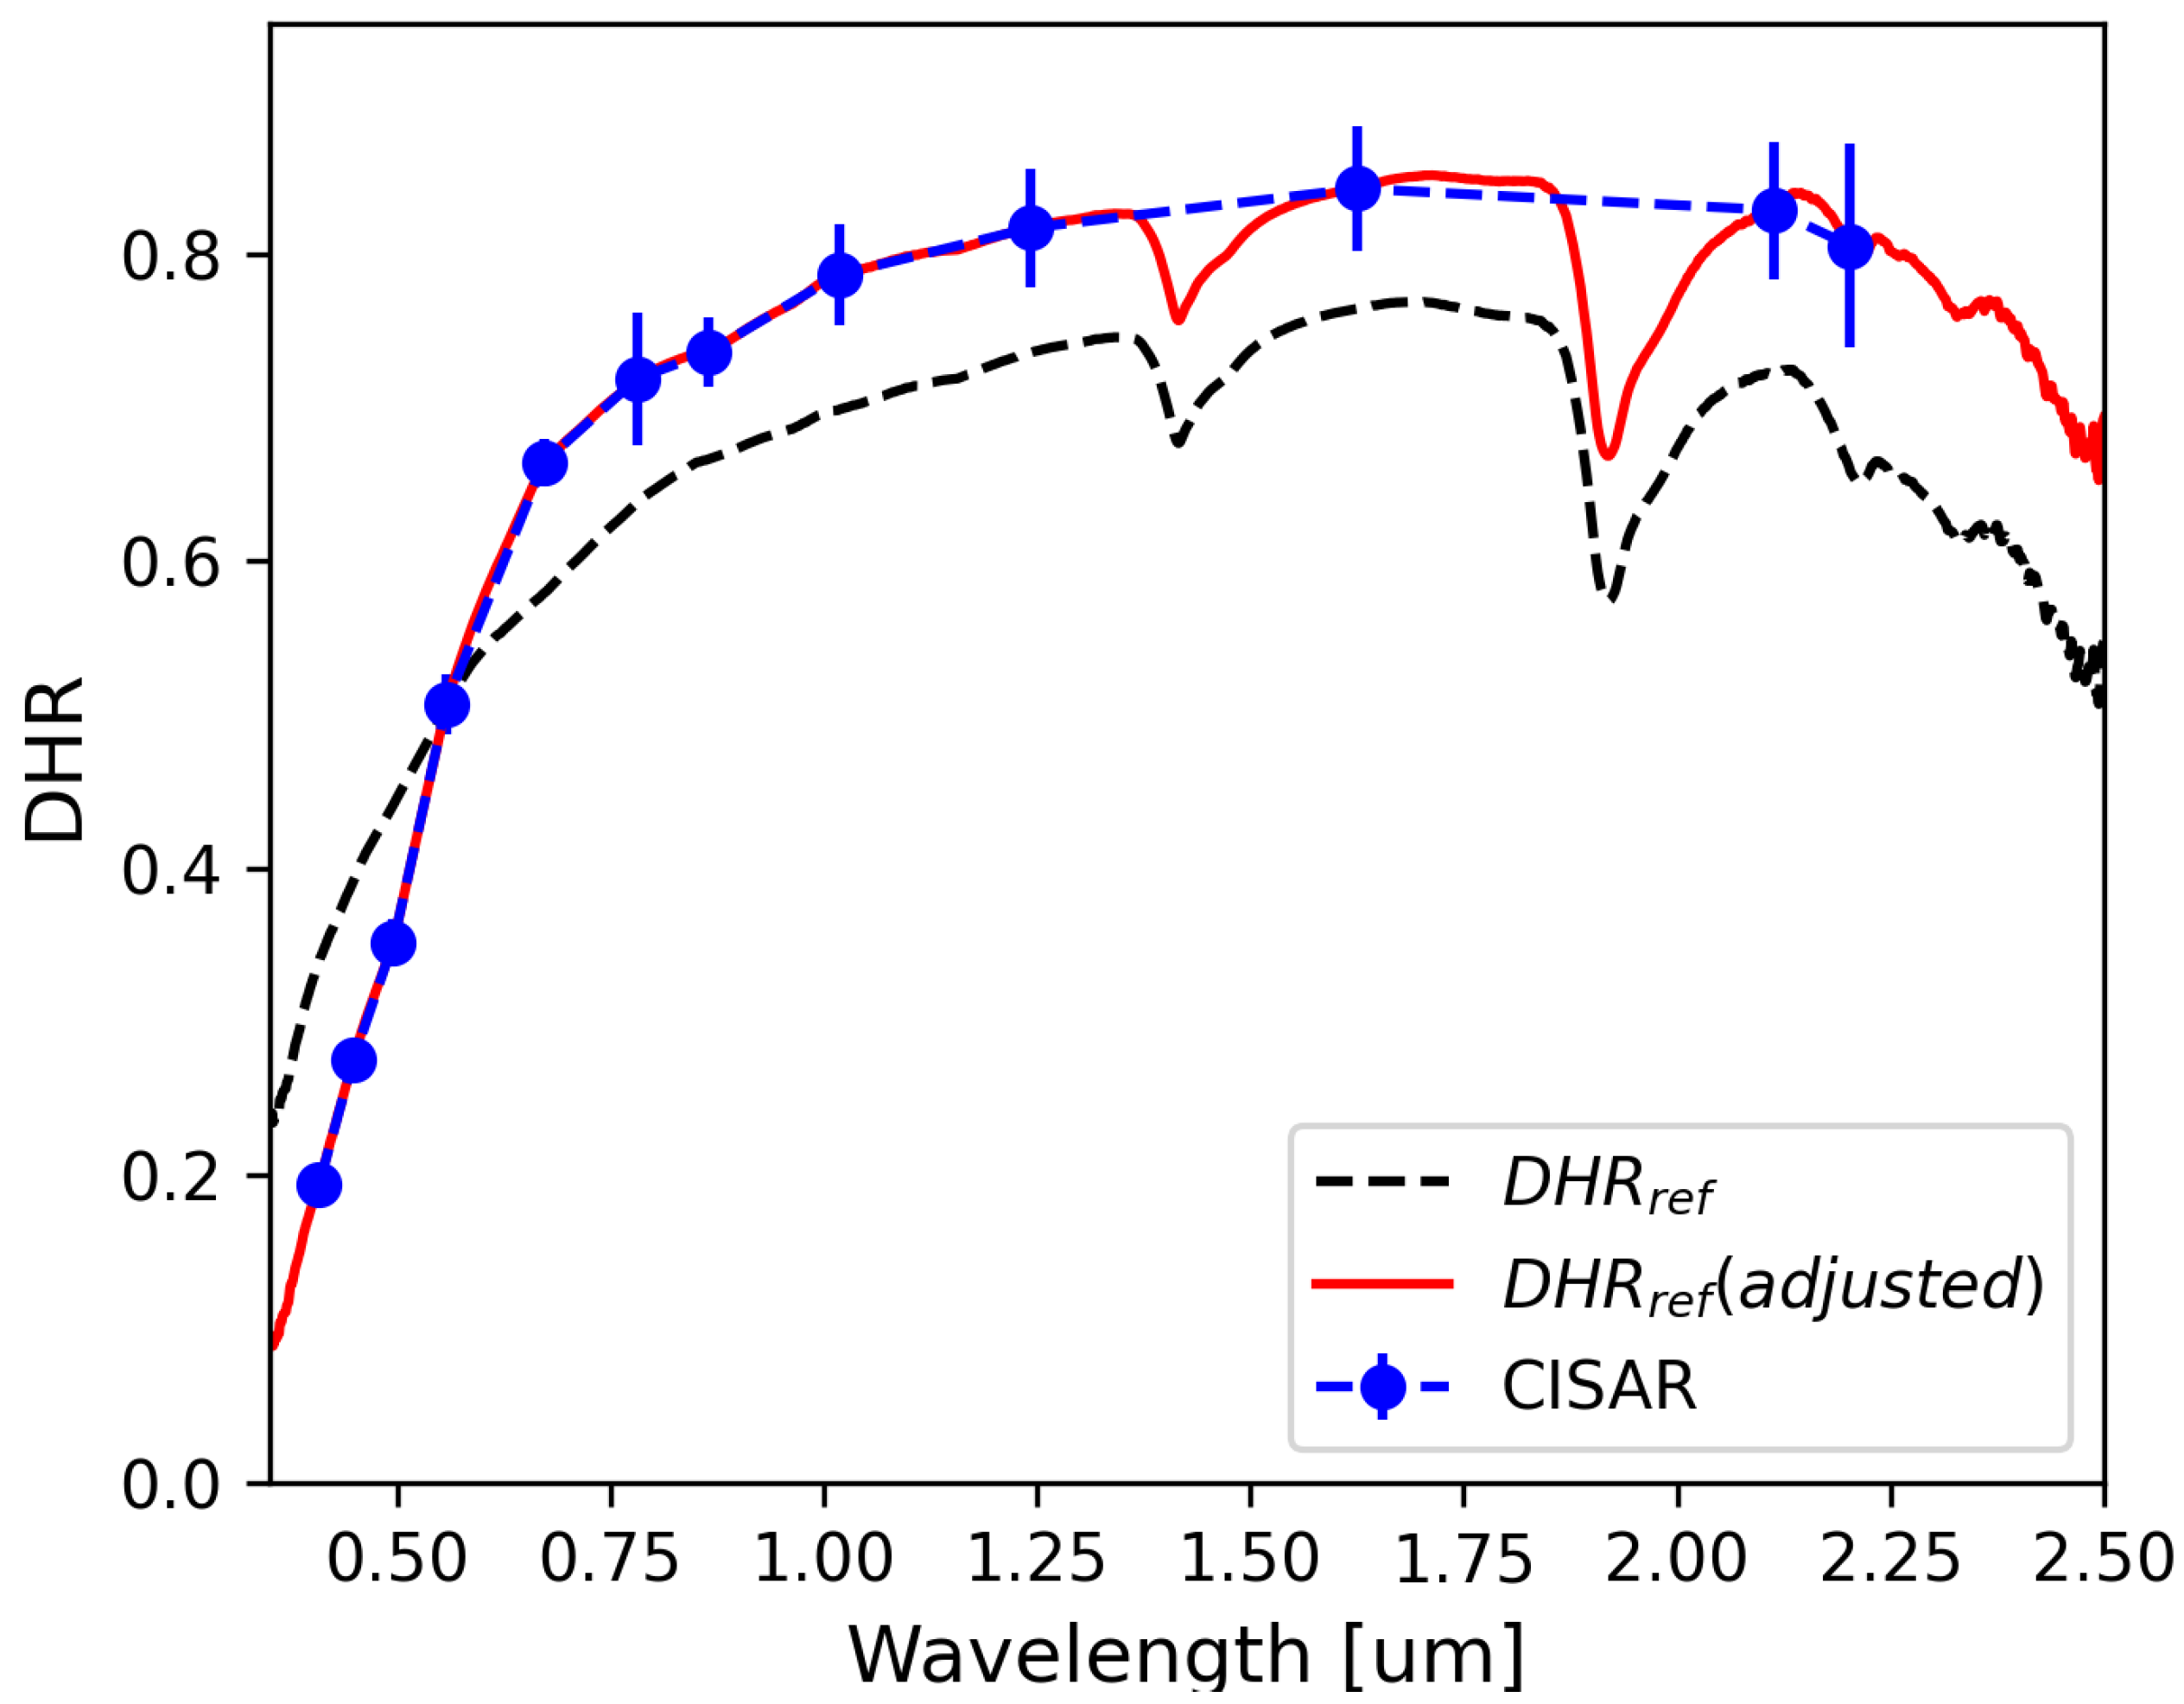
Figure 4.
Relative uncertainty associated to the high-resolution parameter over Libya4.
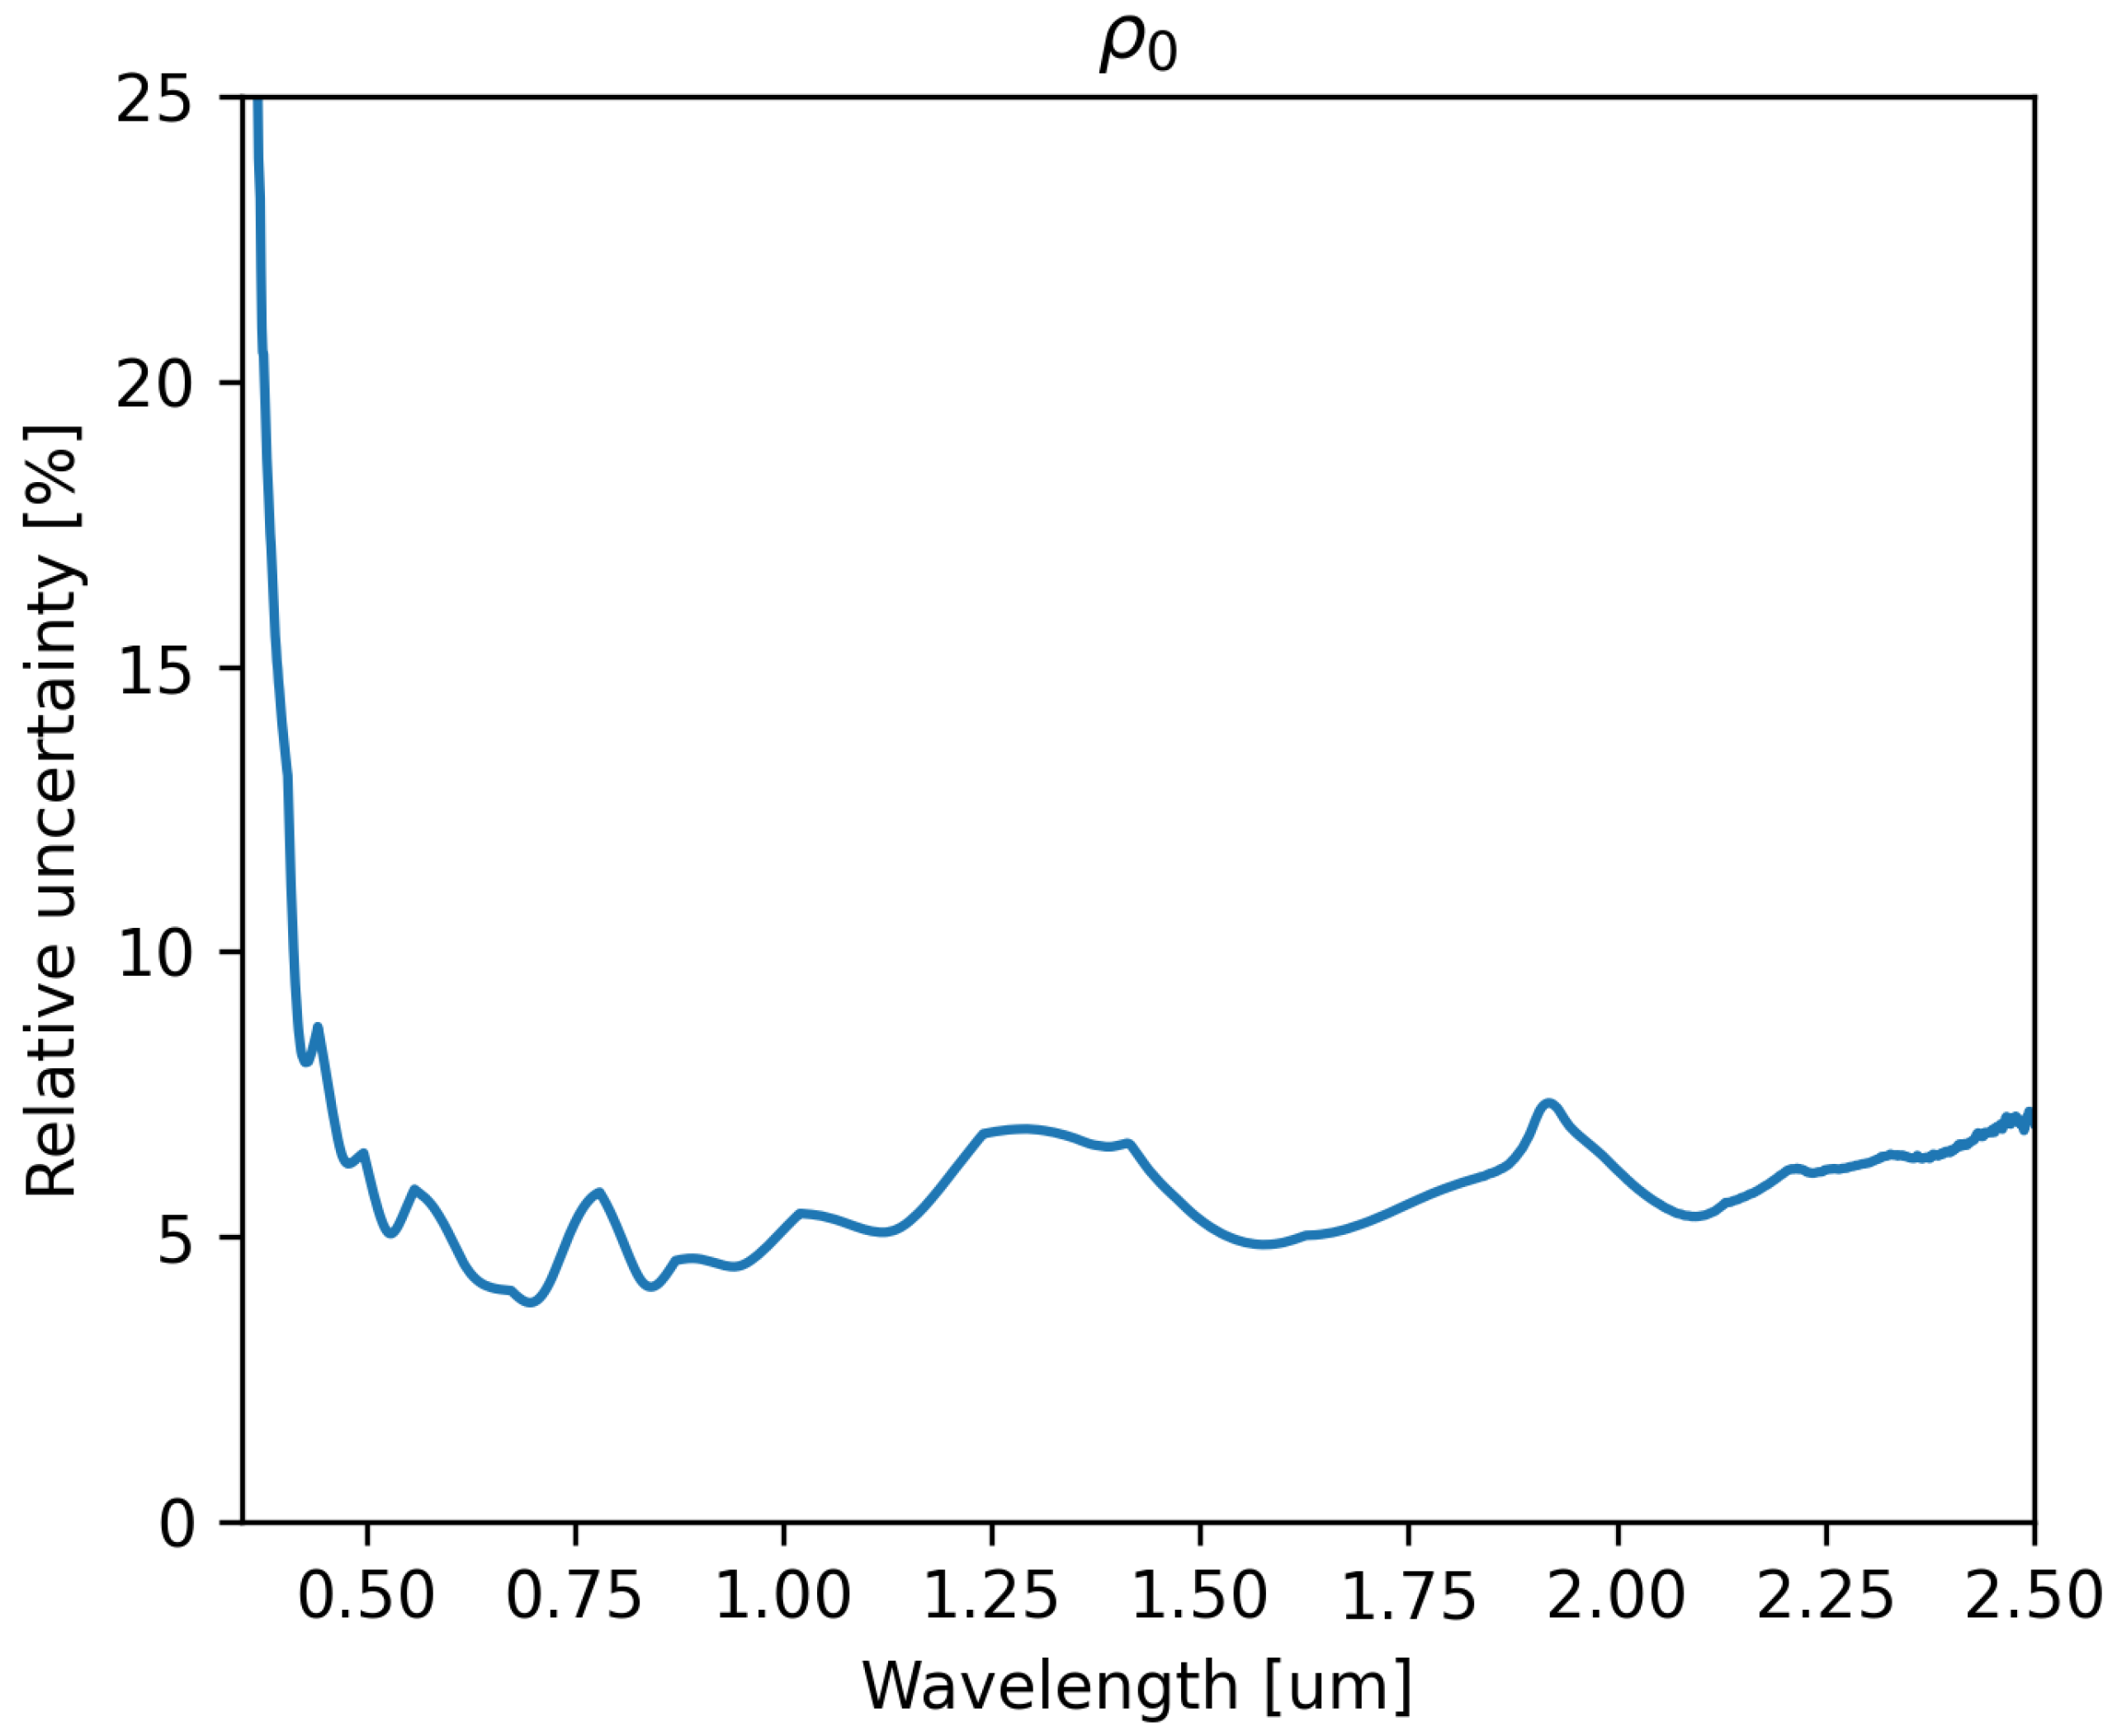
Figure 5.
Statistical distribution of the coarse mode radius over Libya4. The black dashed line represents the fitted normal distribution calculated using all available data points. The green dashed line represents the fitted normal distribution obtained by excluding the tails of the histogram from the calculation.
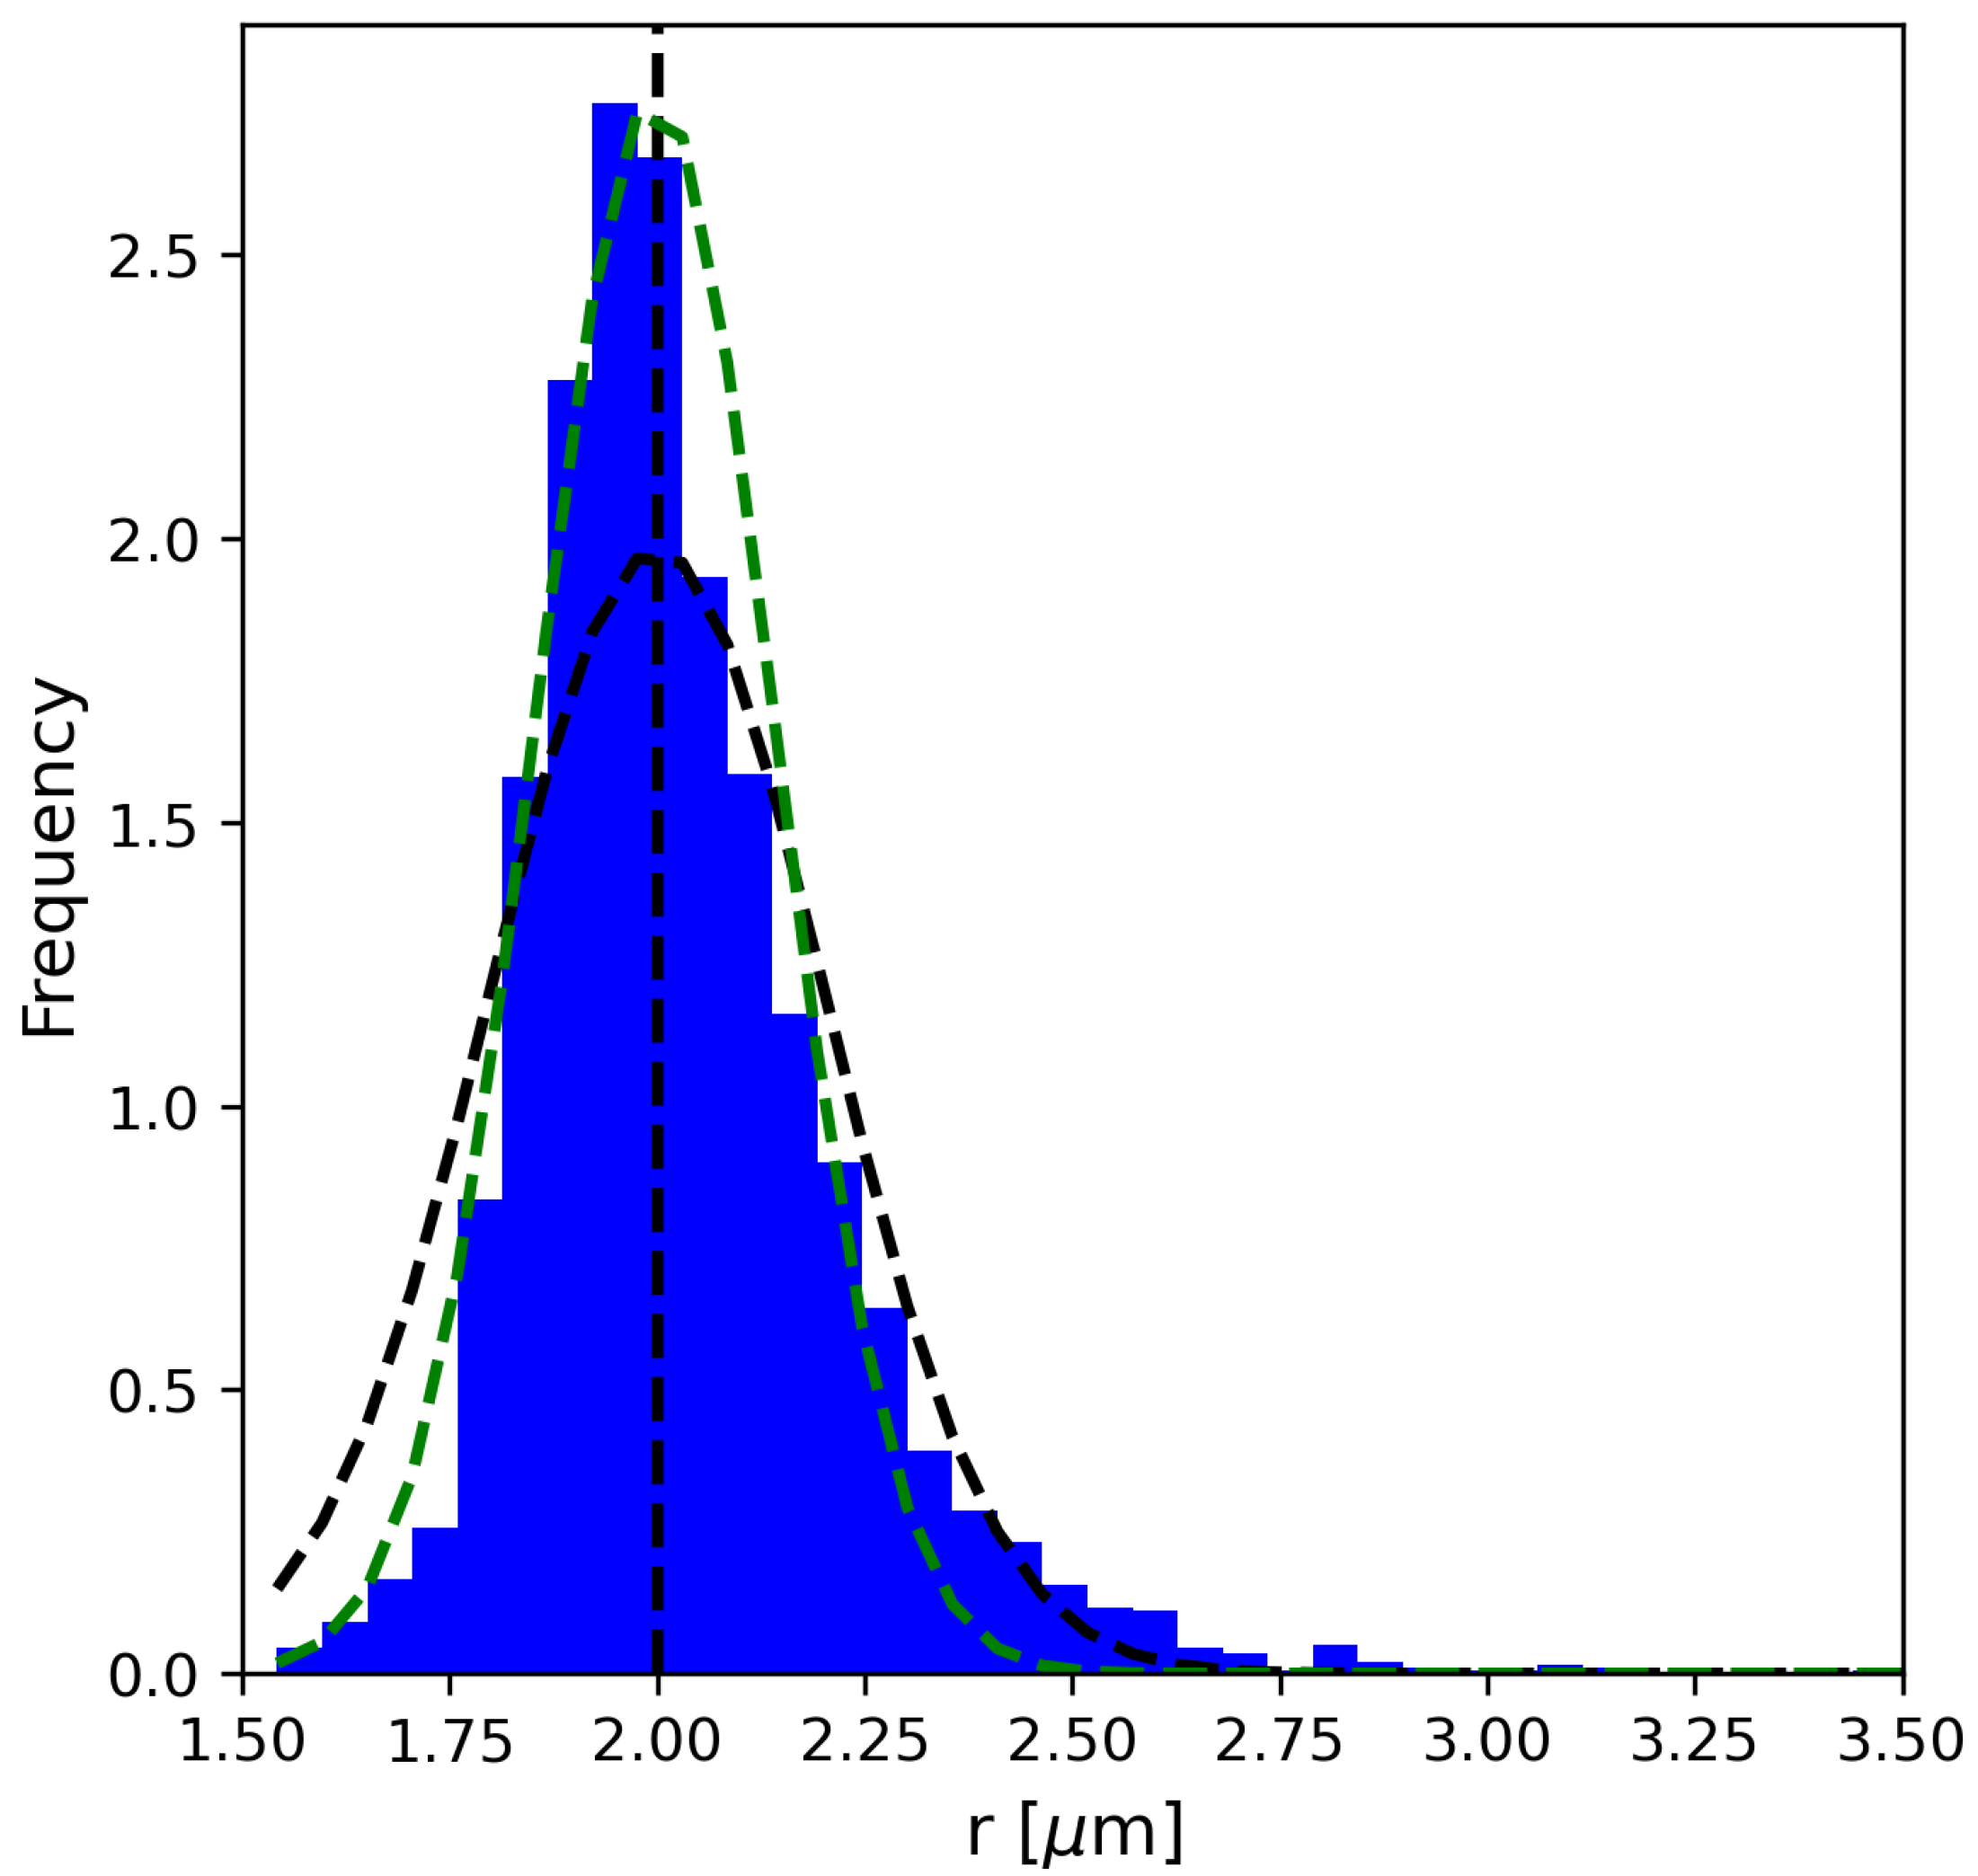
Figure 6.
Particle size distribution over Gobabeb (blue line) and Sahara (green line), as defined in Equation (3).
Figure 6.
Particle size distribution over Gobabeb (blue line) and Sahara (green line), as defined in Equation (3).
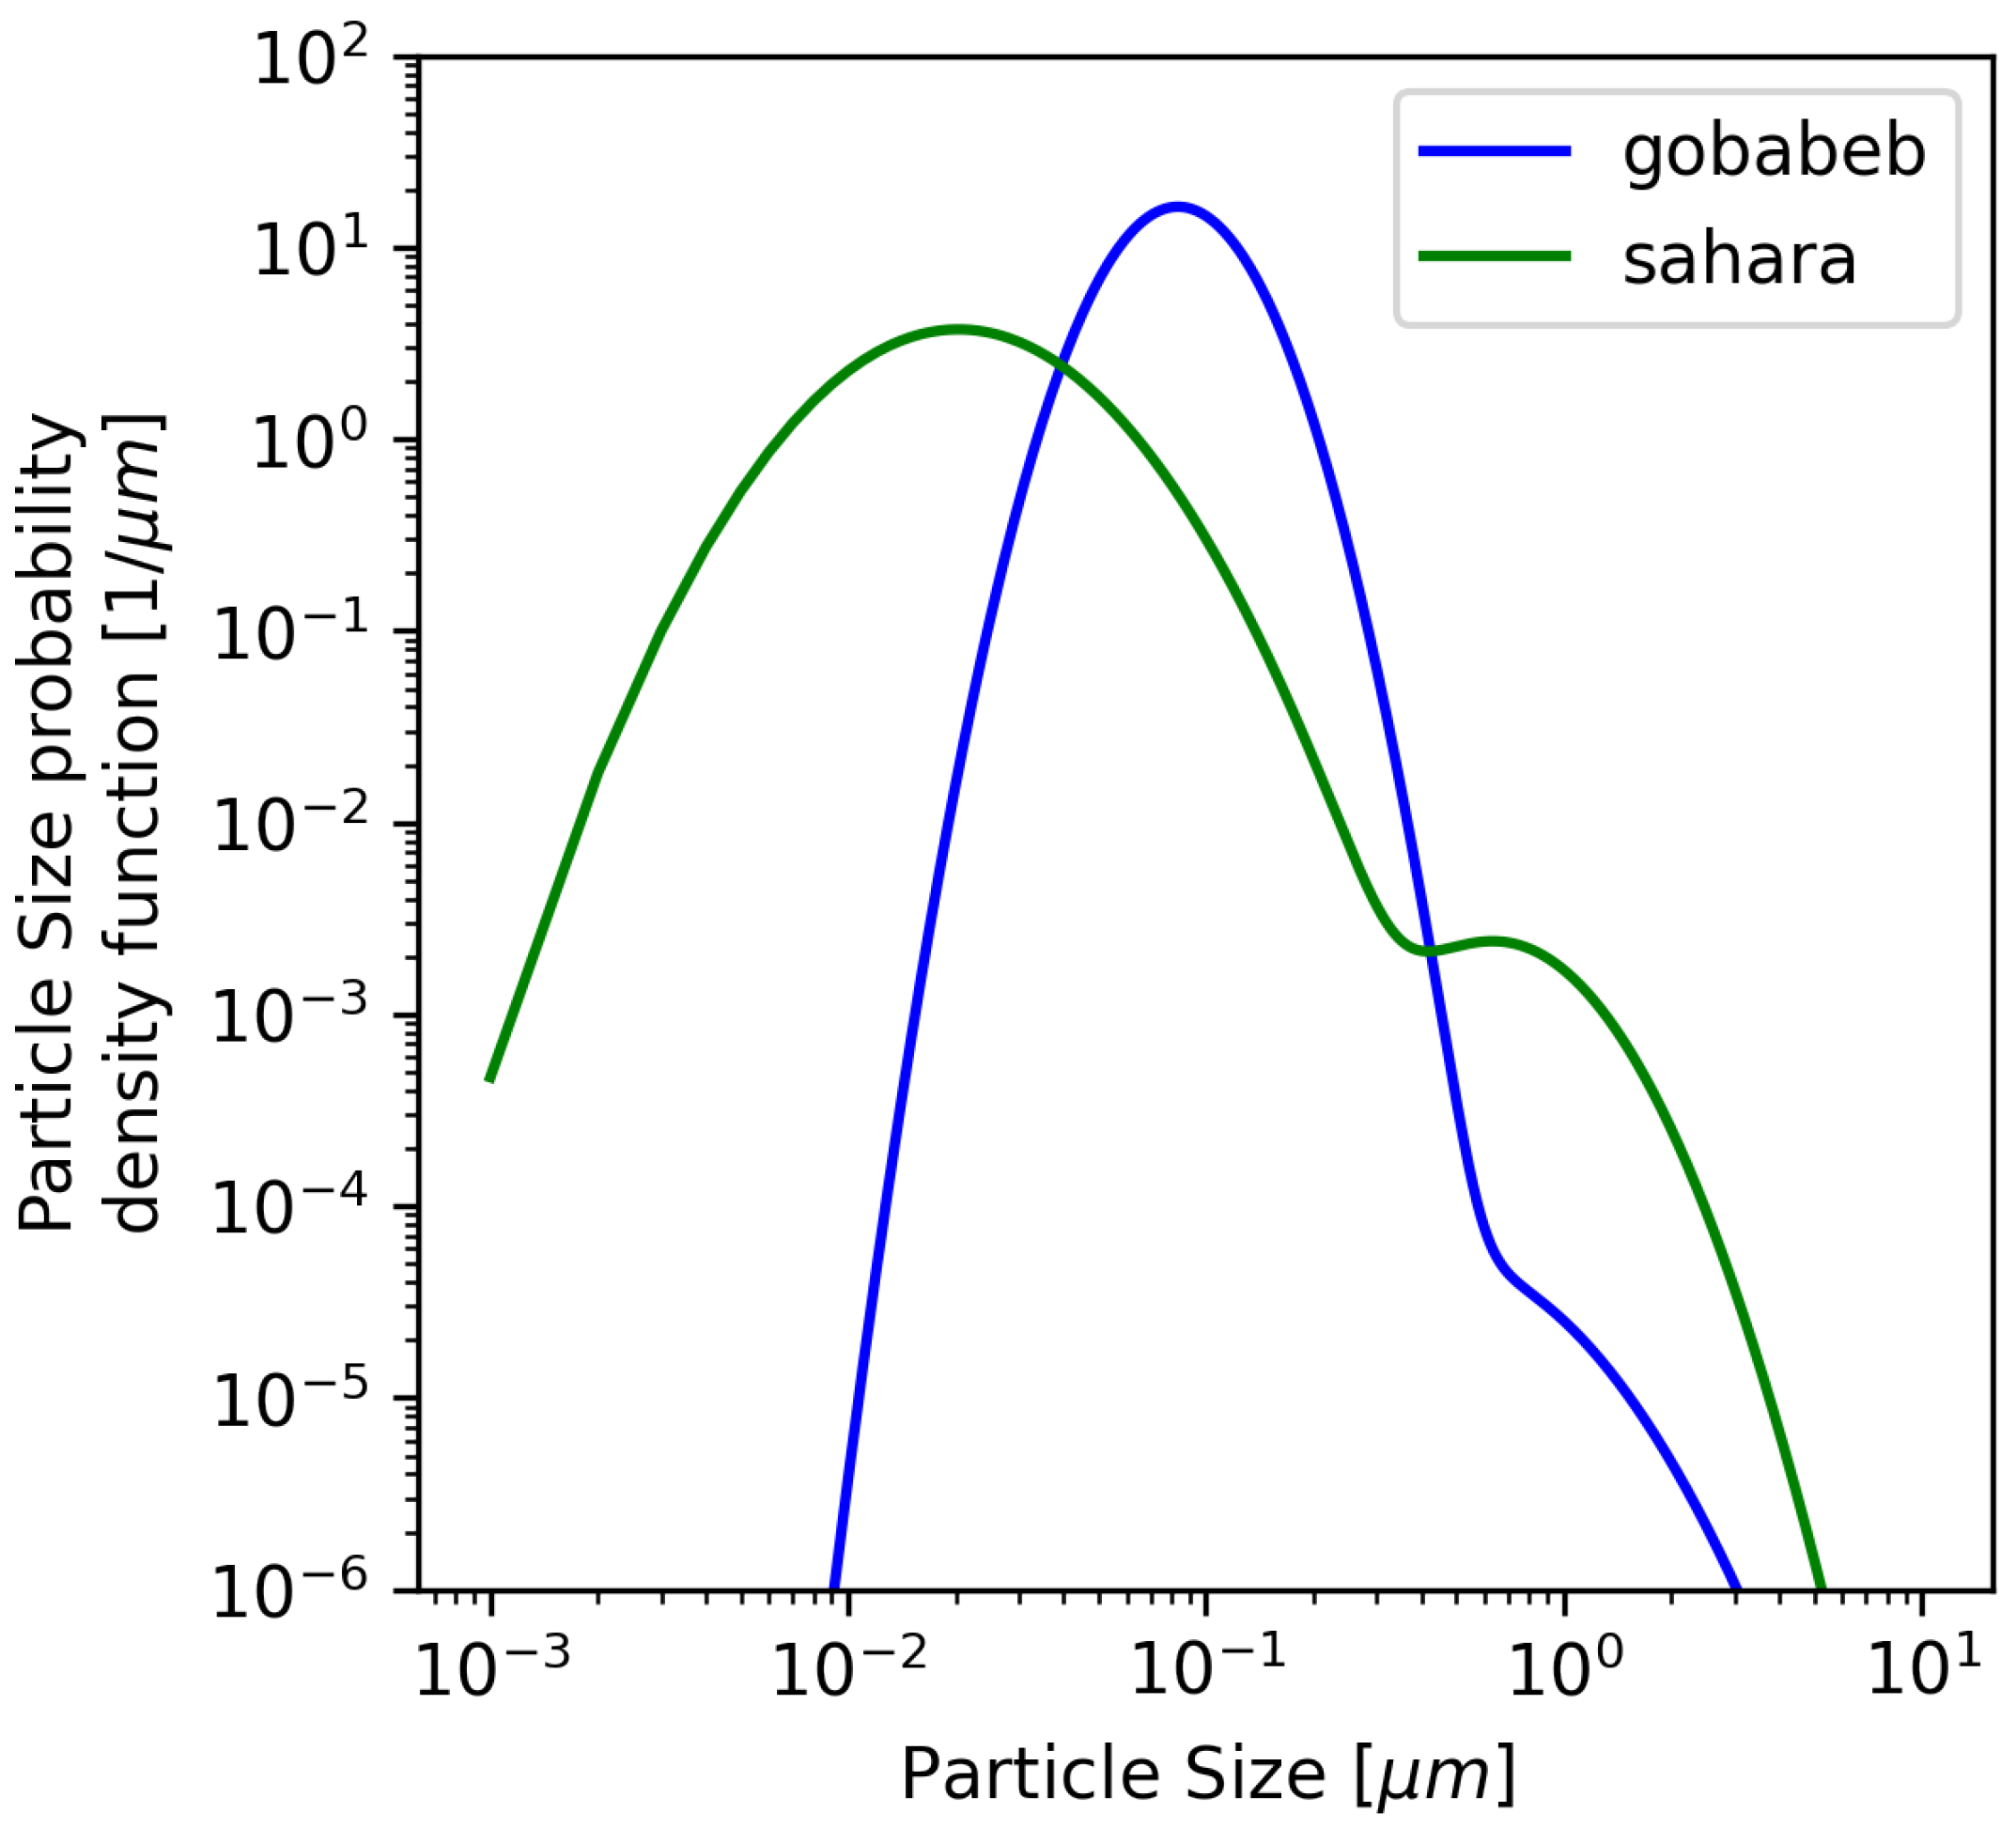
Figure 7.
SSA and asymmetry factor over the three ROIs. The color code is the same as in Figure 6. The dots correspond to , the triangles to , the squares to and finally the crosses to .
Figure 7.
SSA and asymmetry factor over the three ROIs. The color code is the same as in Figure 6. The dots correspond to , the triangles to , the squares to and finally the crosses to .
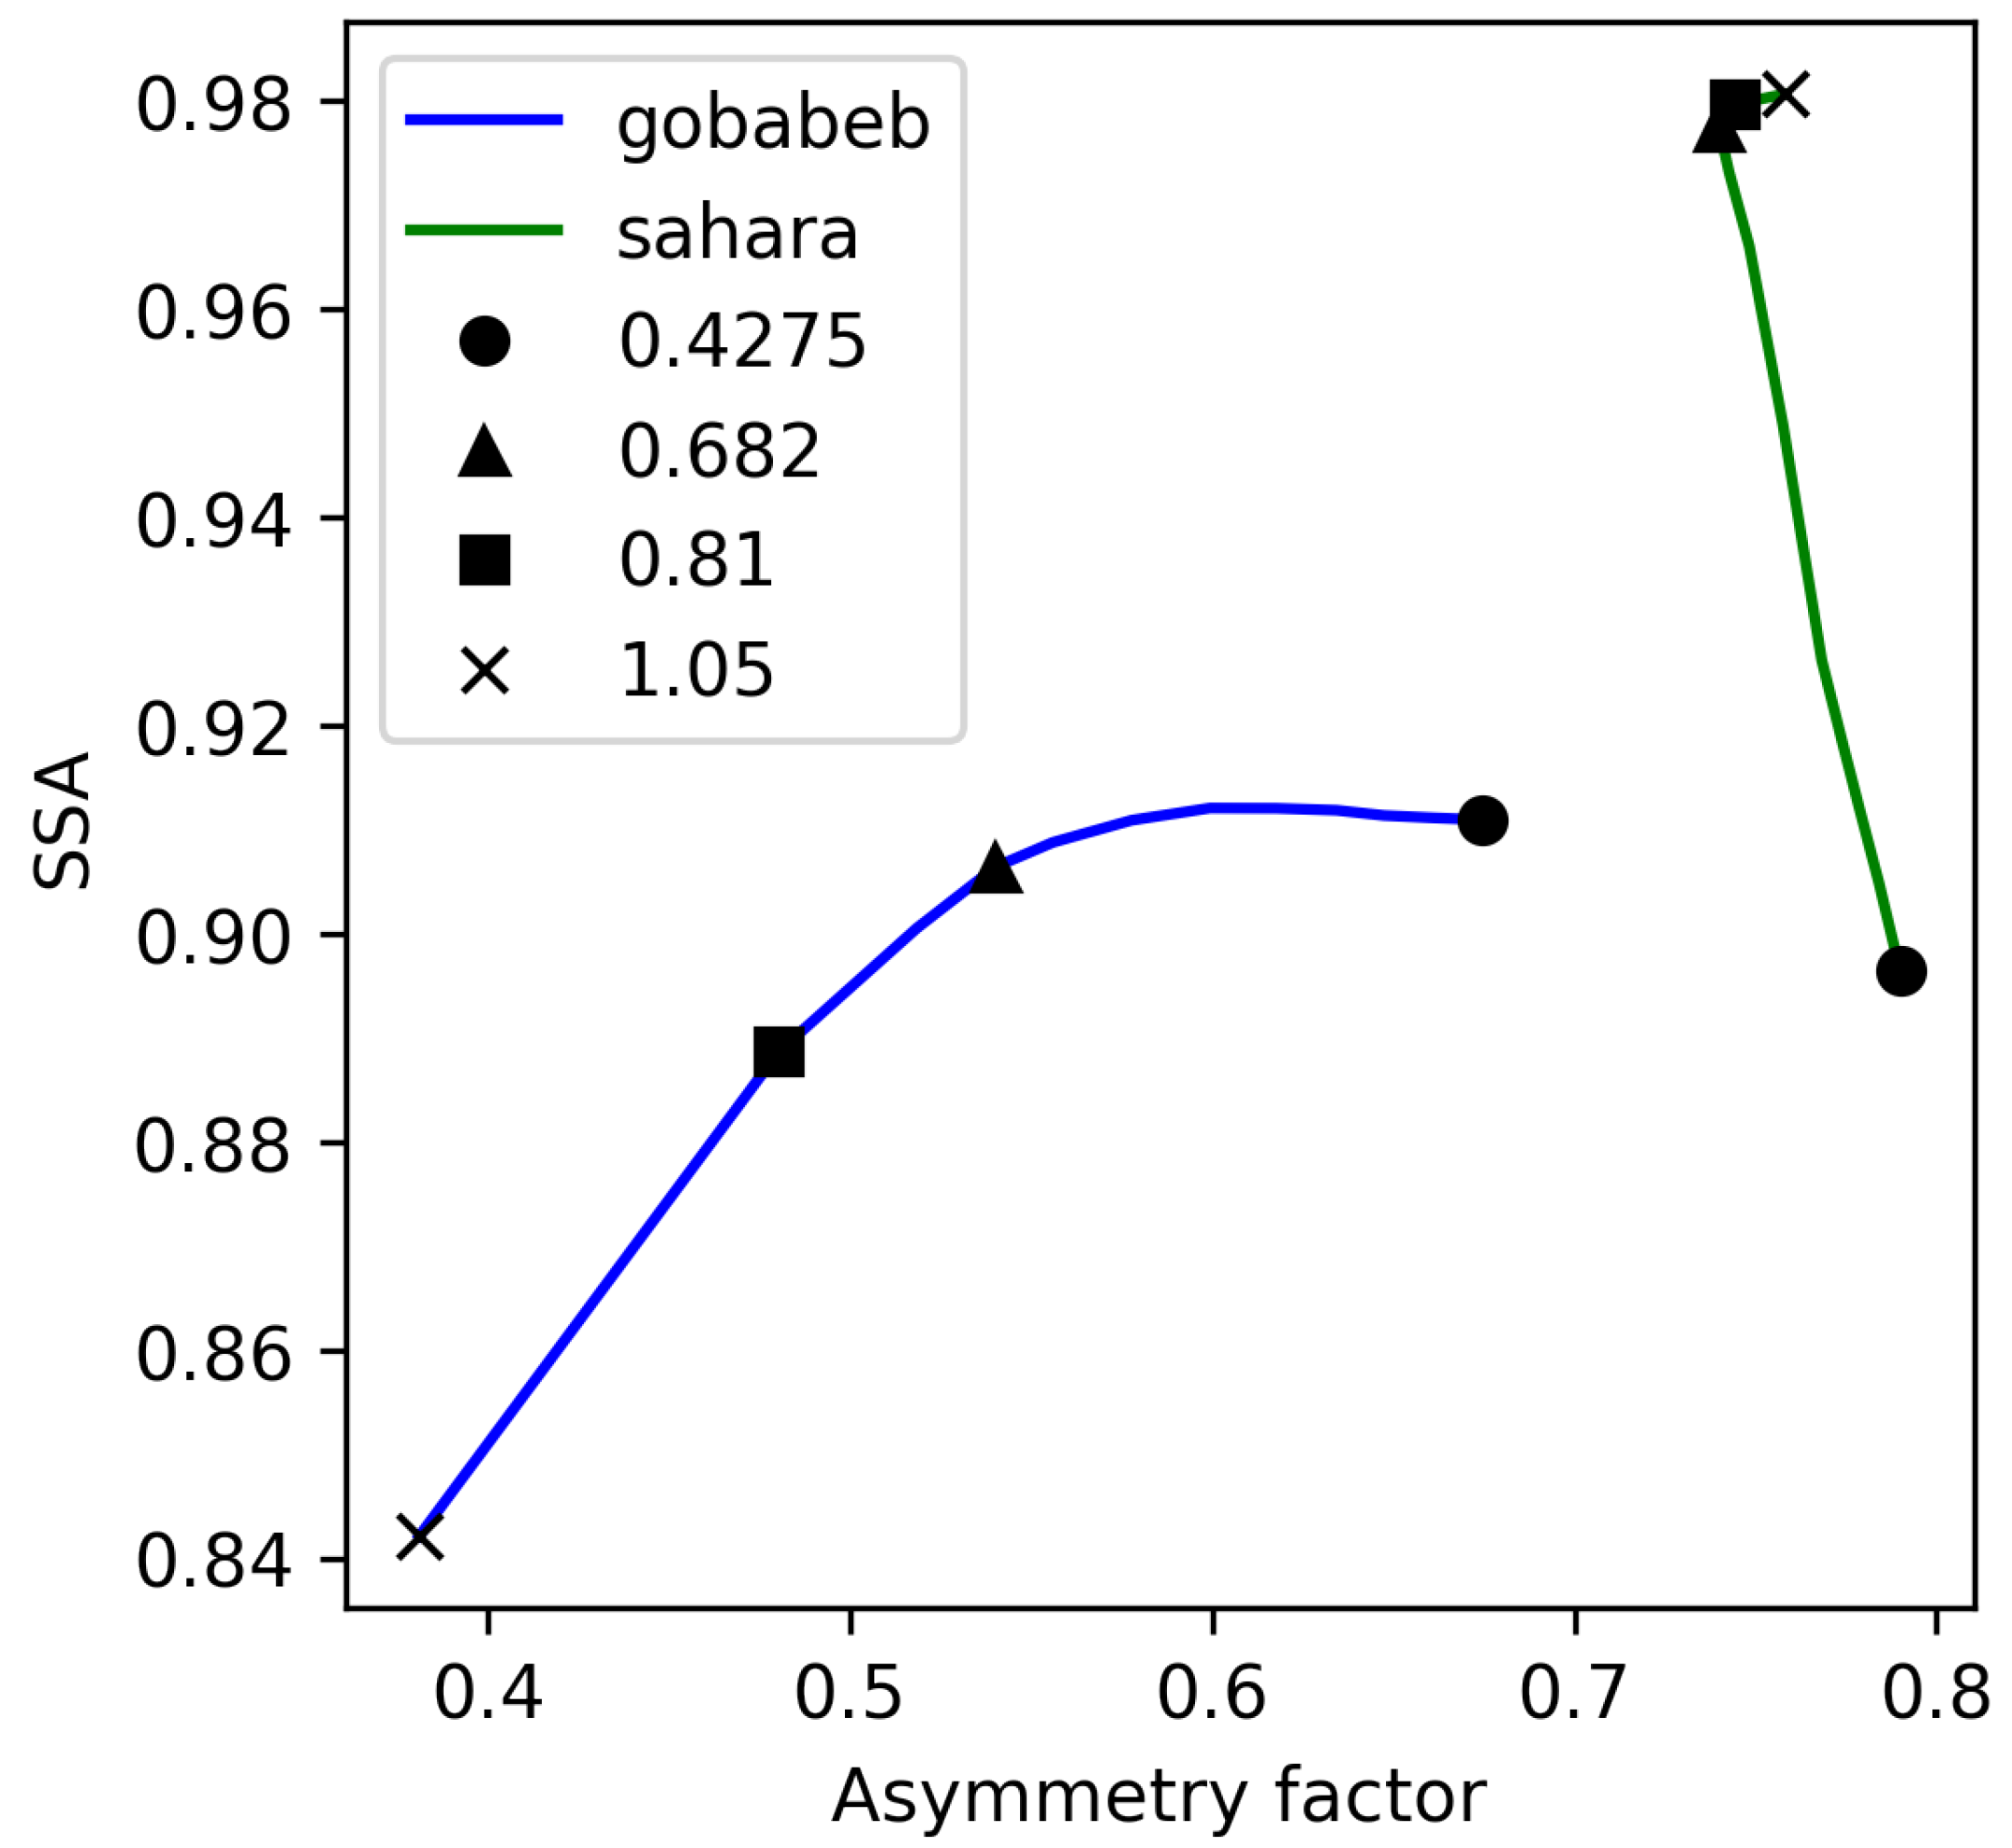
Figure 8.
Eradiate accumulated bias over 30 Monte Carlo sampling iterations in band 8 of MSI on board Sentinel-2A, following Figure 6.3 of [45].
Figure 8.
Eradiate accumulated bias over 30 Monte Carlo sampling iterations in band 8 of MSI on board Sentinel-2A, following Figure 6.3 of [45].
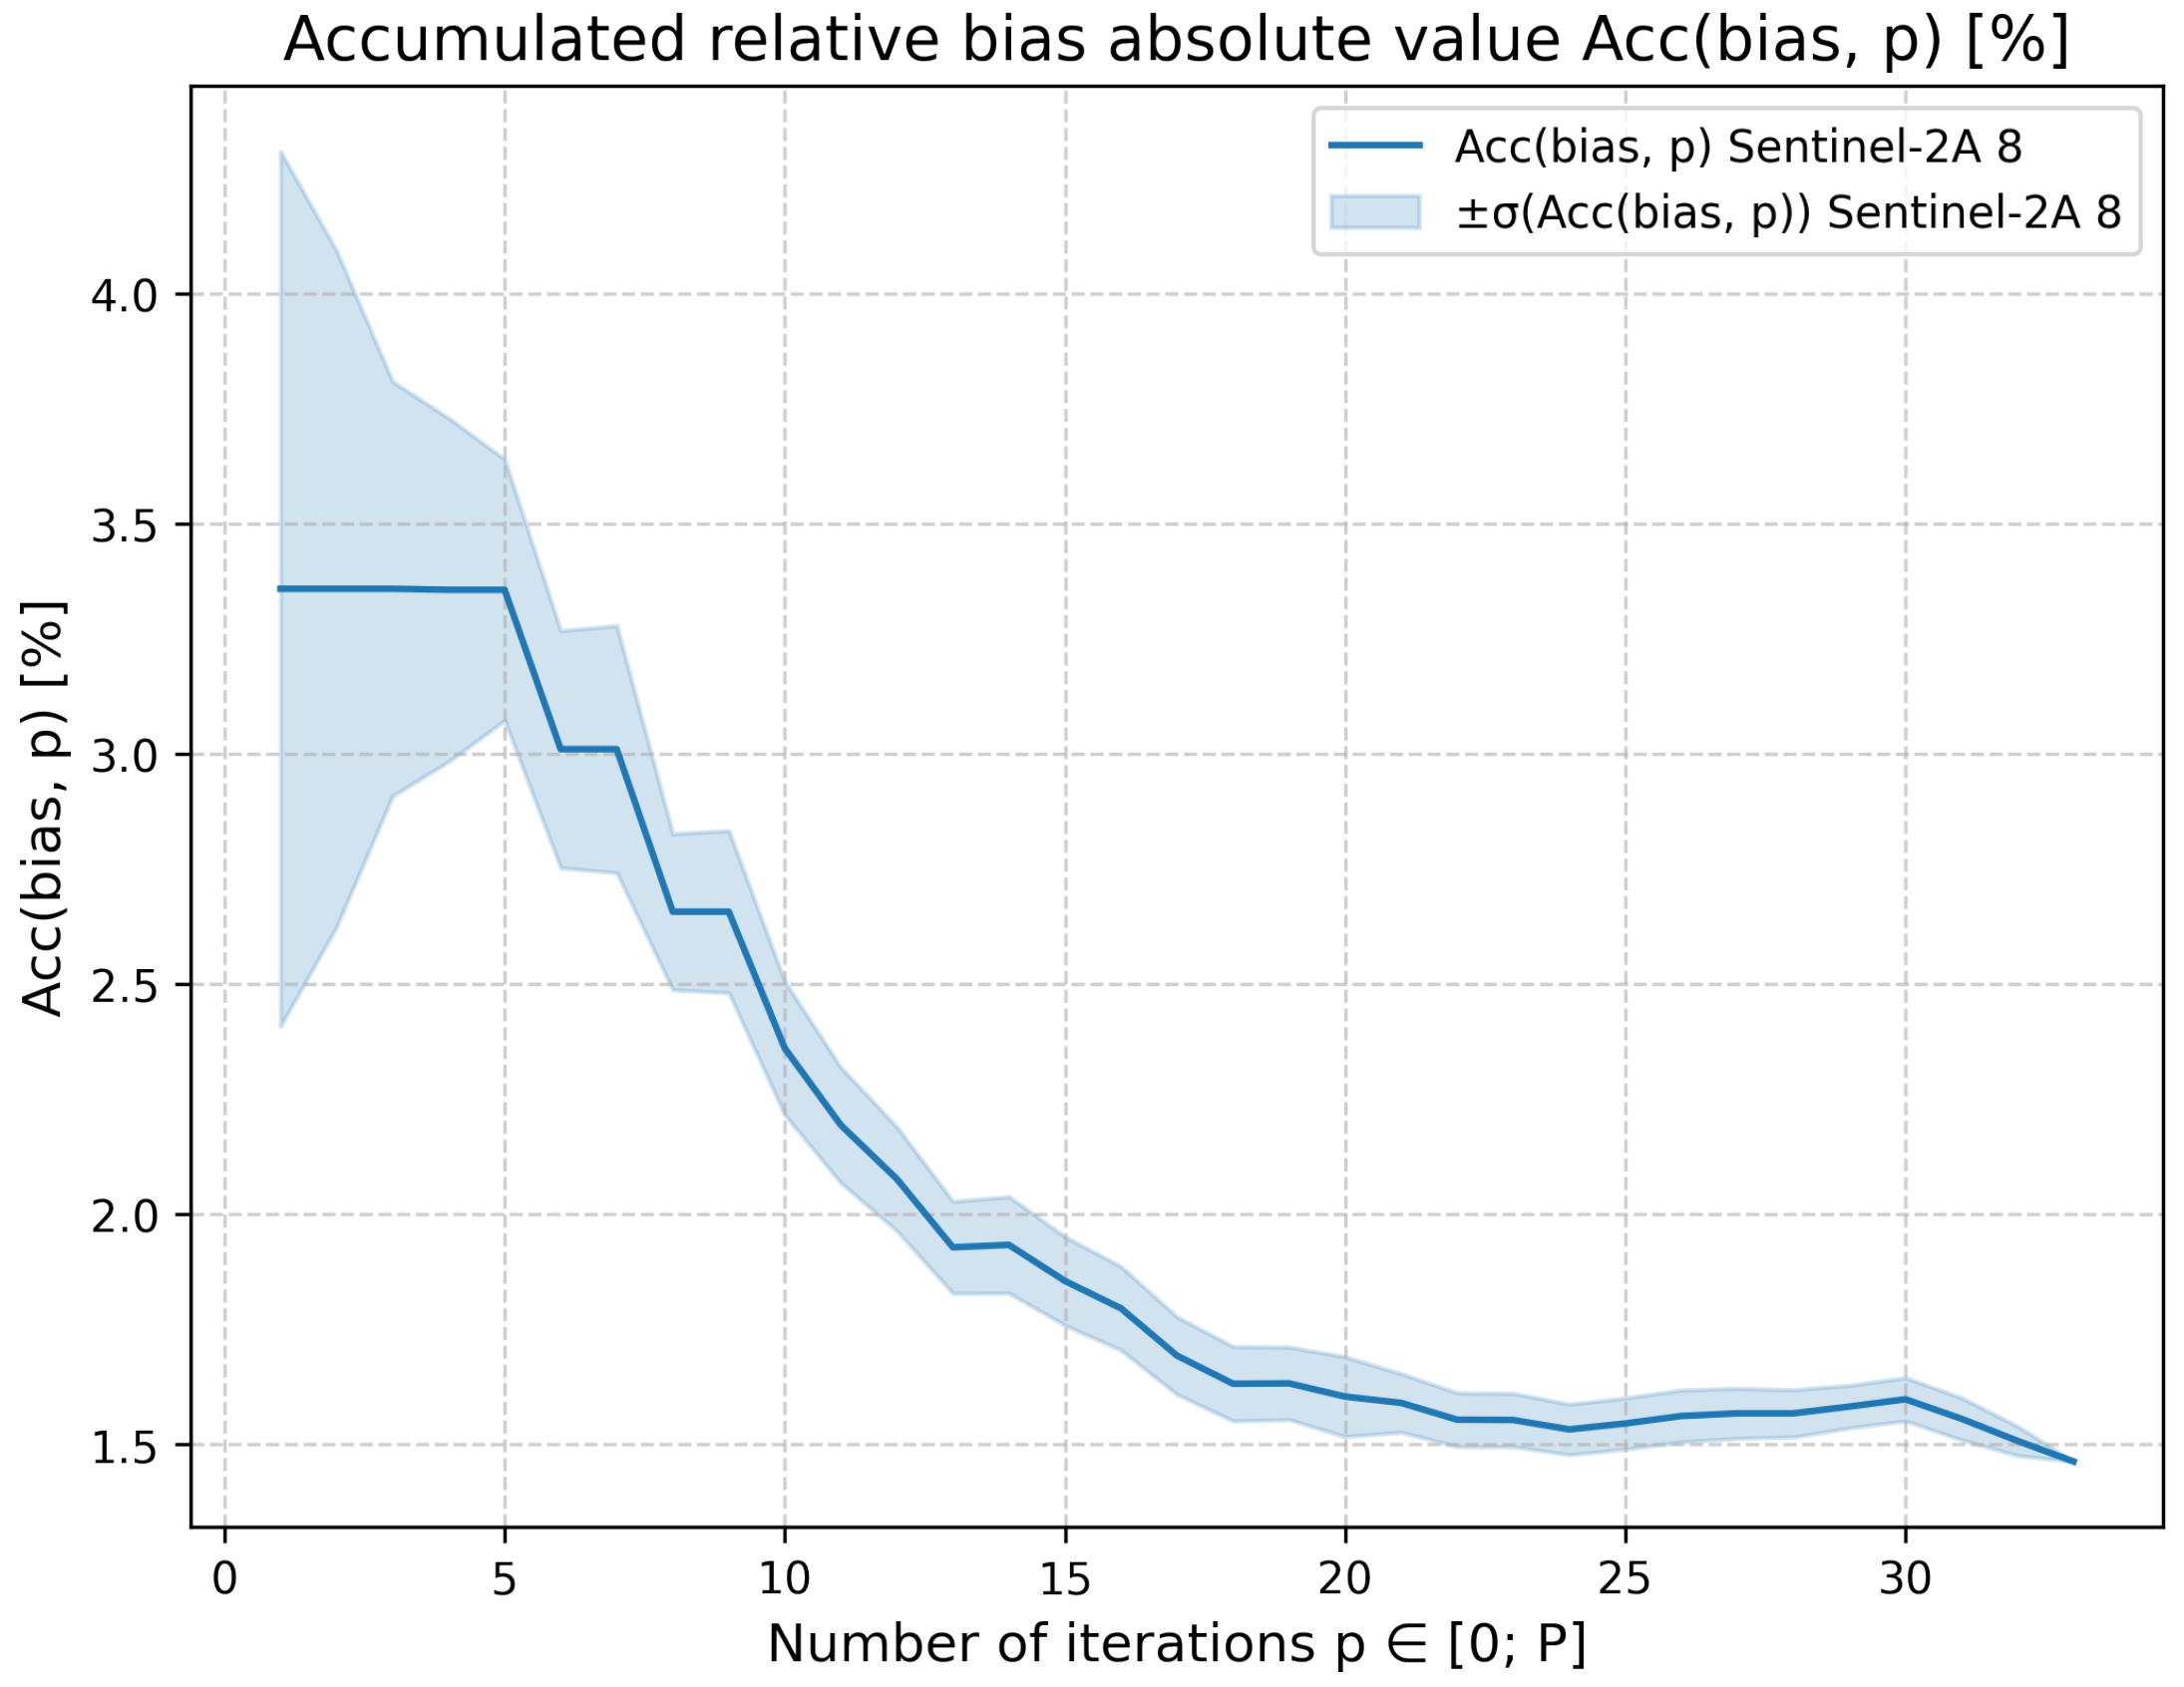
Figure 9.
Mean relative bias of multispectral sensors over Libya-4. The vertical bars represent the standard deviation. The dotted and dashed lines represent the ± 5% and ±3% limits, with the latter being the estimated accuracy in [14]. The grey shaded area represents the molecular absorption transmittance of the AFGL 1986 (U.S. Standard) atmospheric profile [51] (right y axis).
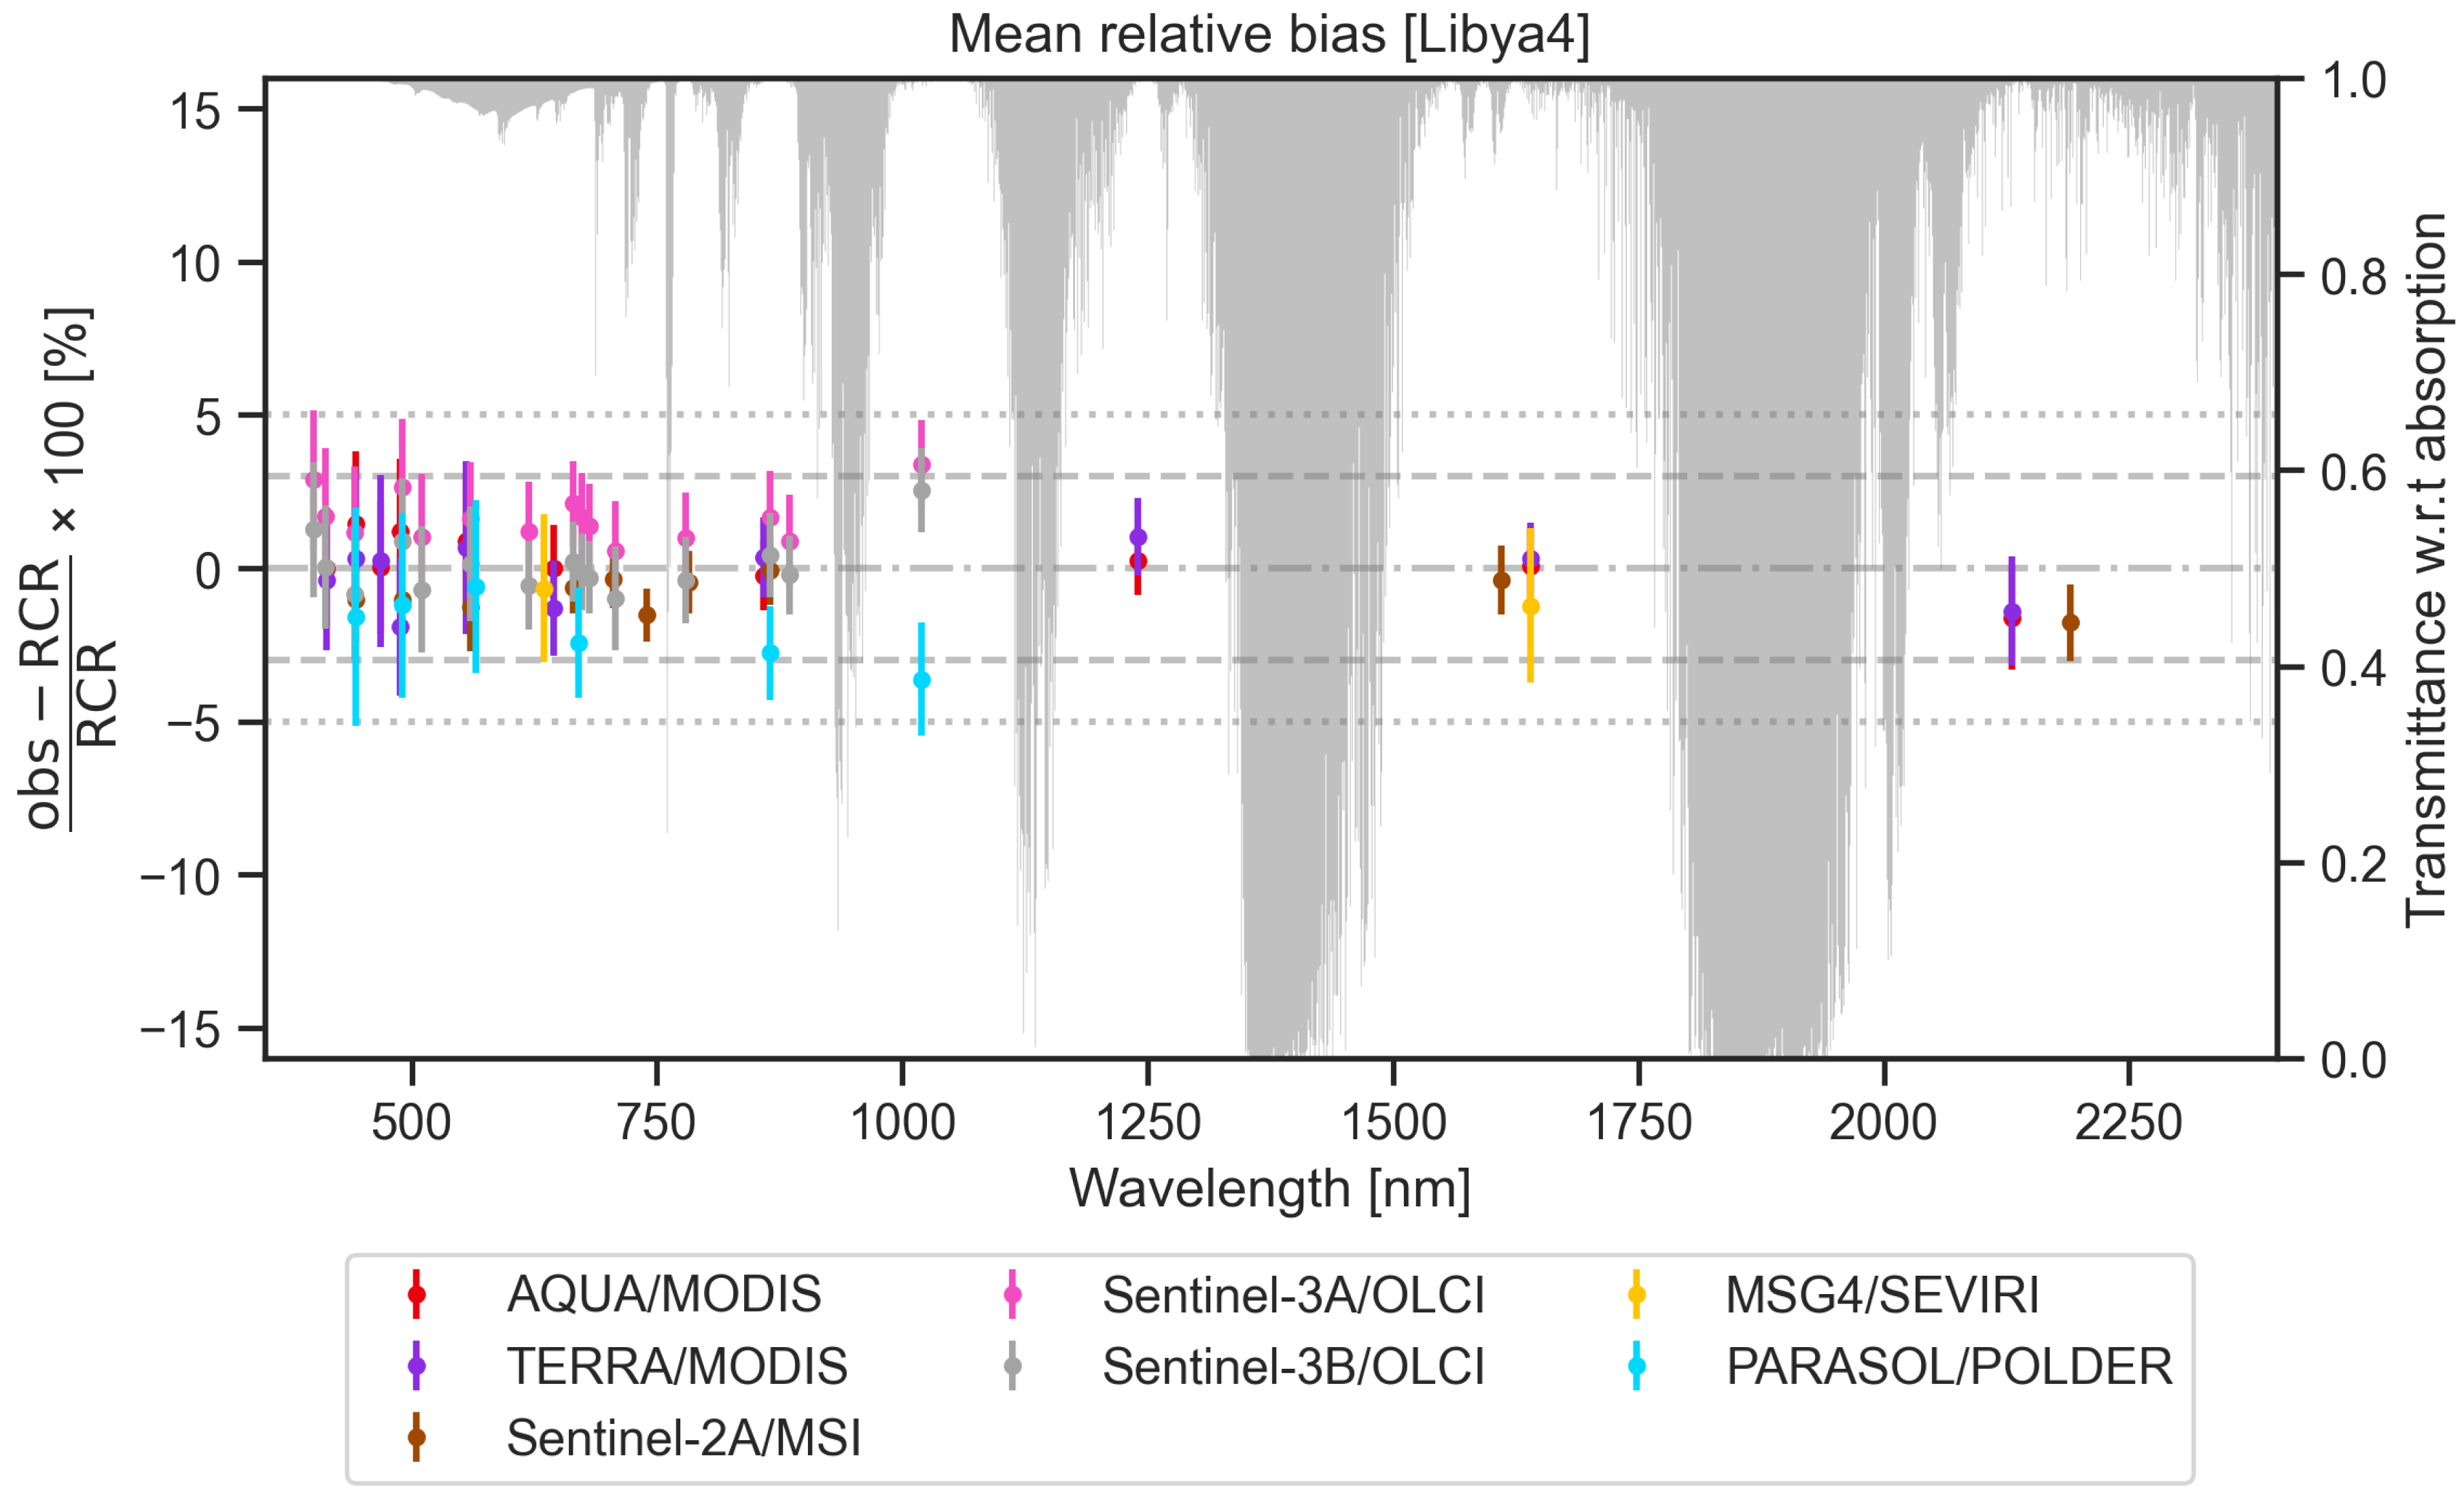
Figure 10.
Same as Figure 9 over Gobabeb.
Figure 10.
Same as Figure 9 over Gobabeb.
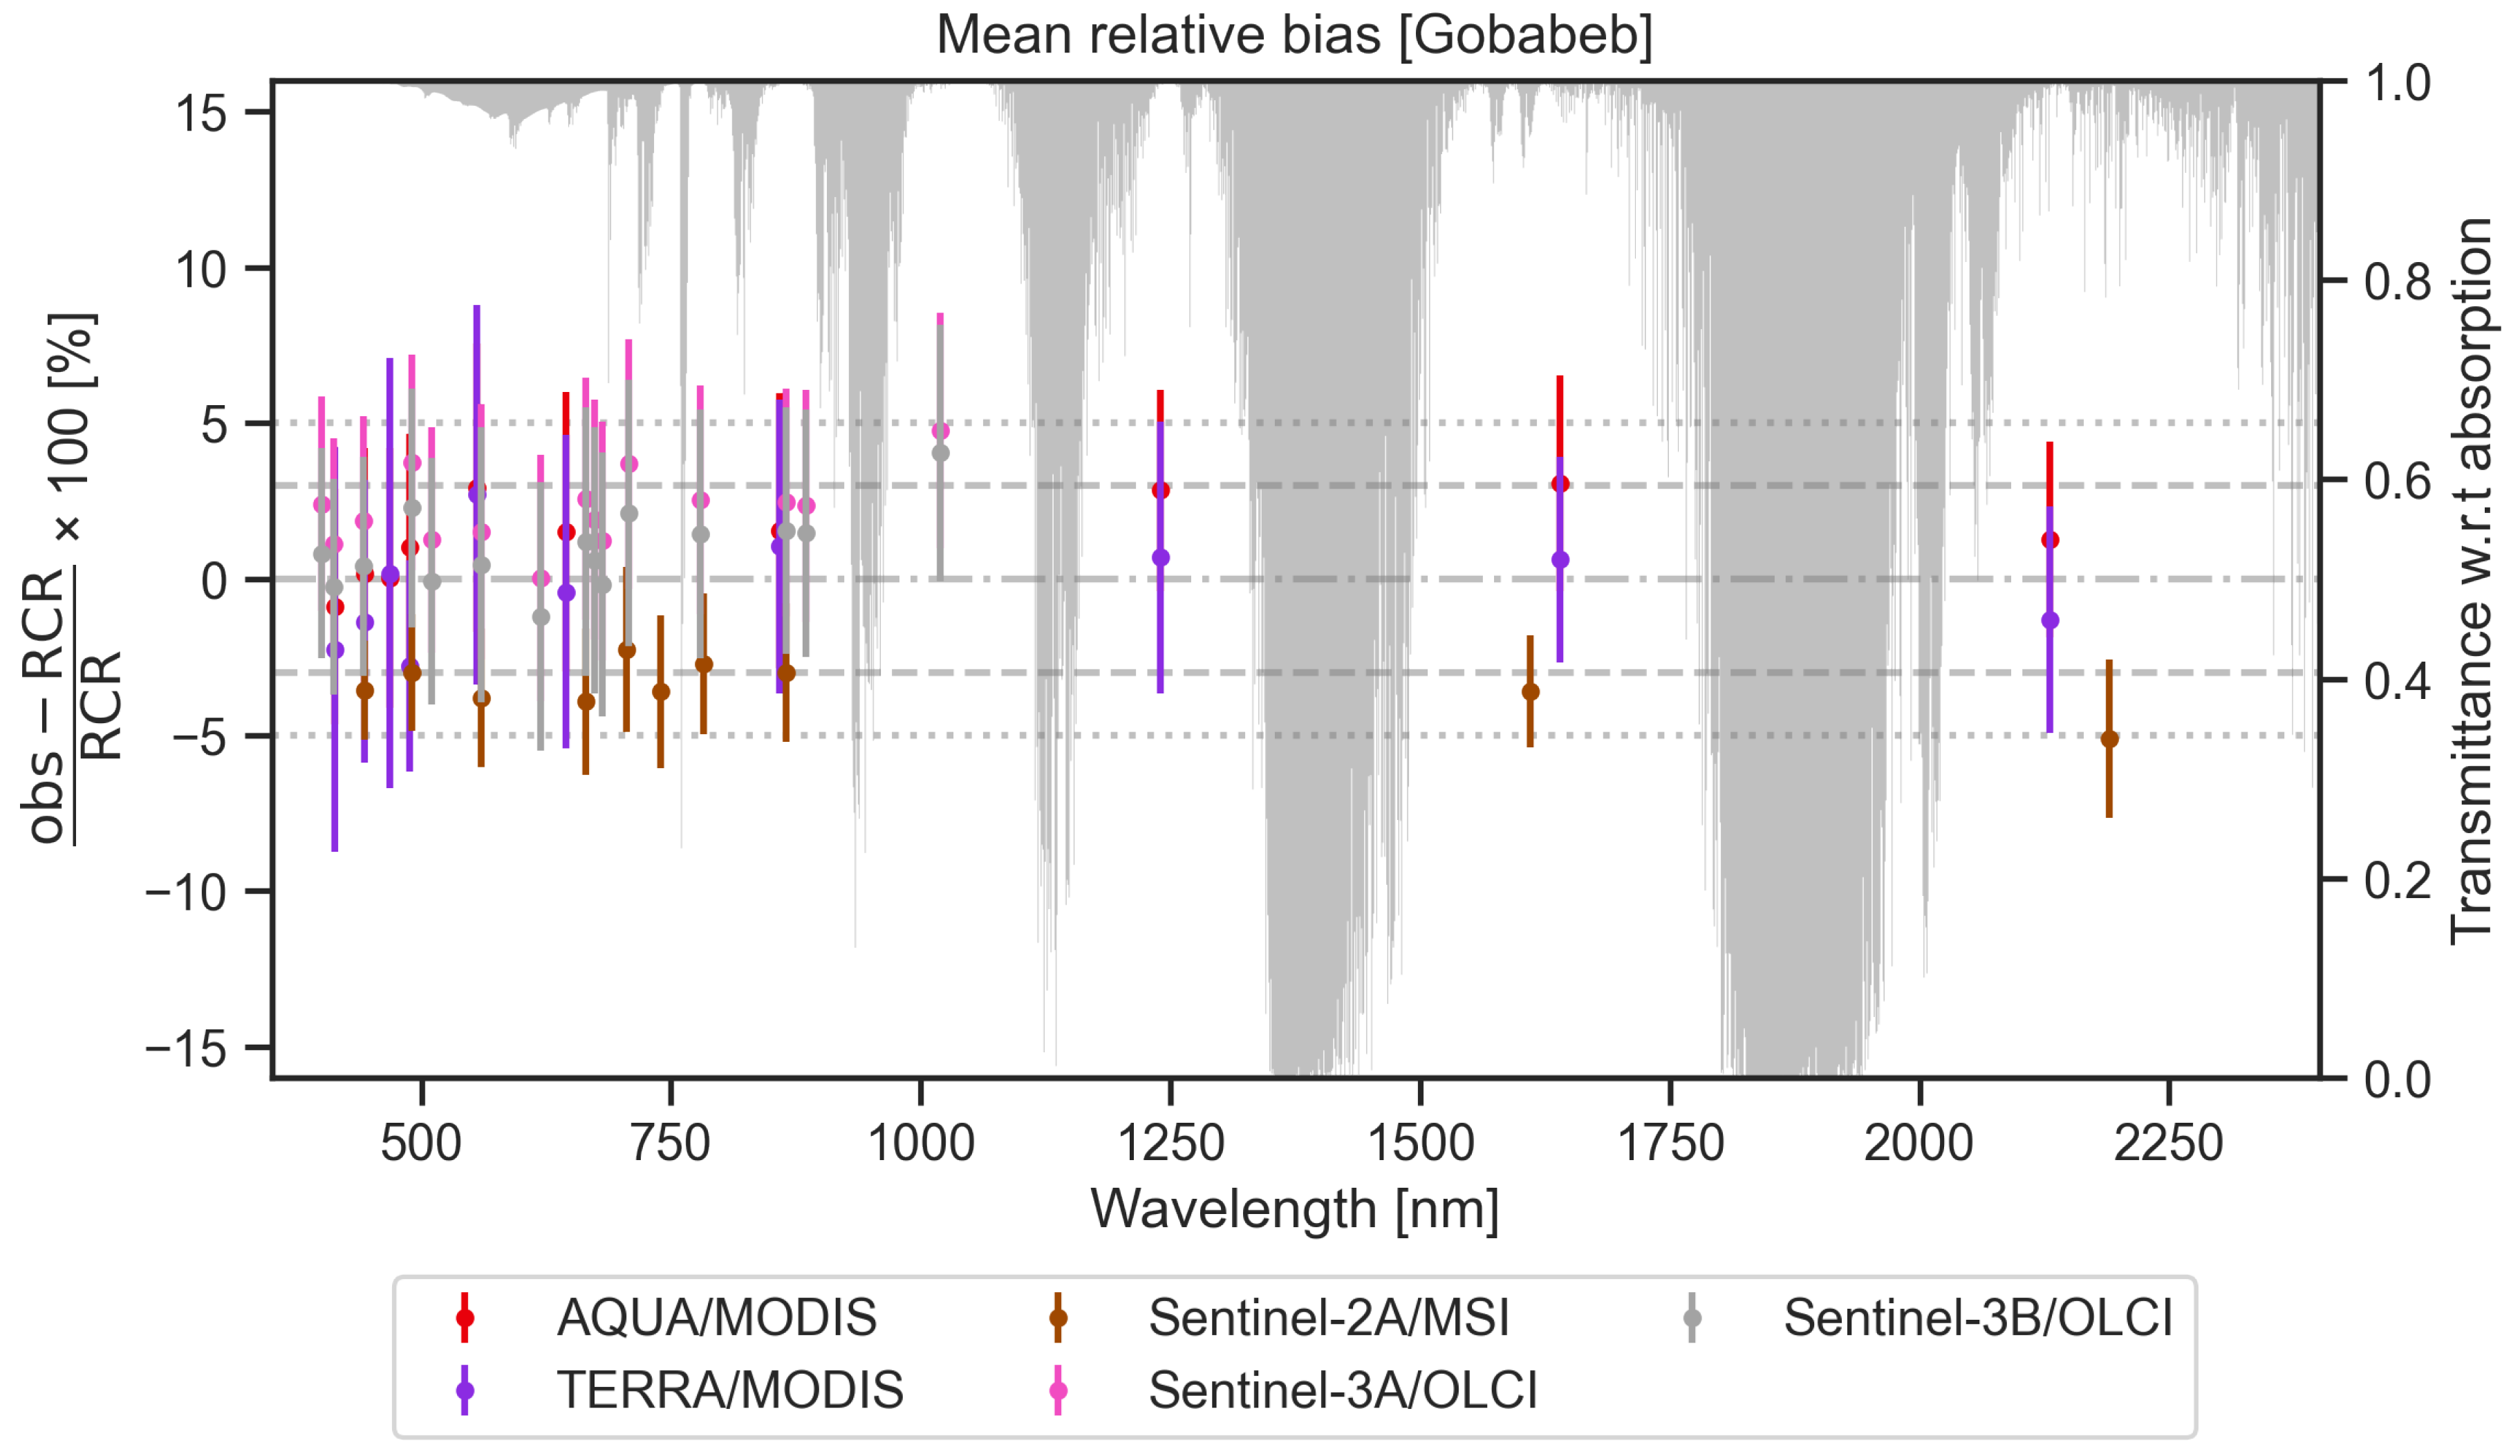
Figure 11.
Observed (blue) and simulated (orange) TOA reflectance for hyperspectral sensors over Libya-4, averaged in time. The comparison includes EMIT (top panel), EnMAP (mid panel), and PRISMA (bottom panel). The background shading (right y axis) represents atmospheric molecular transmittance, highlighting absorption-dominated spectral regions.
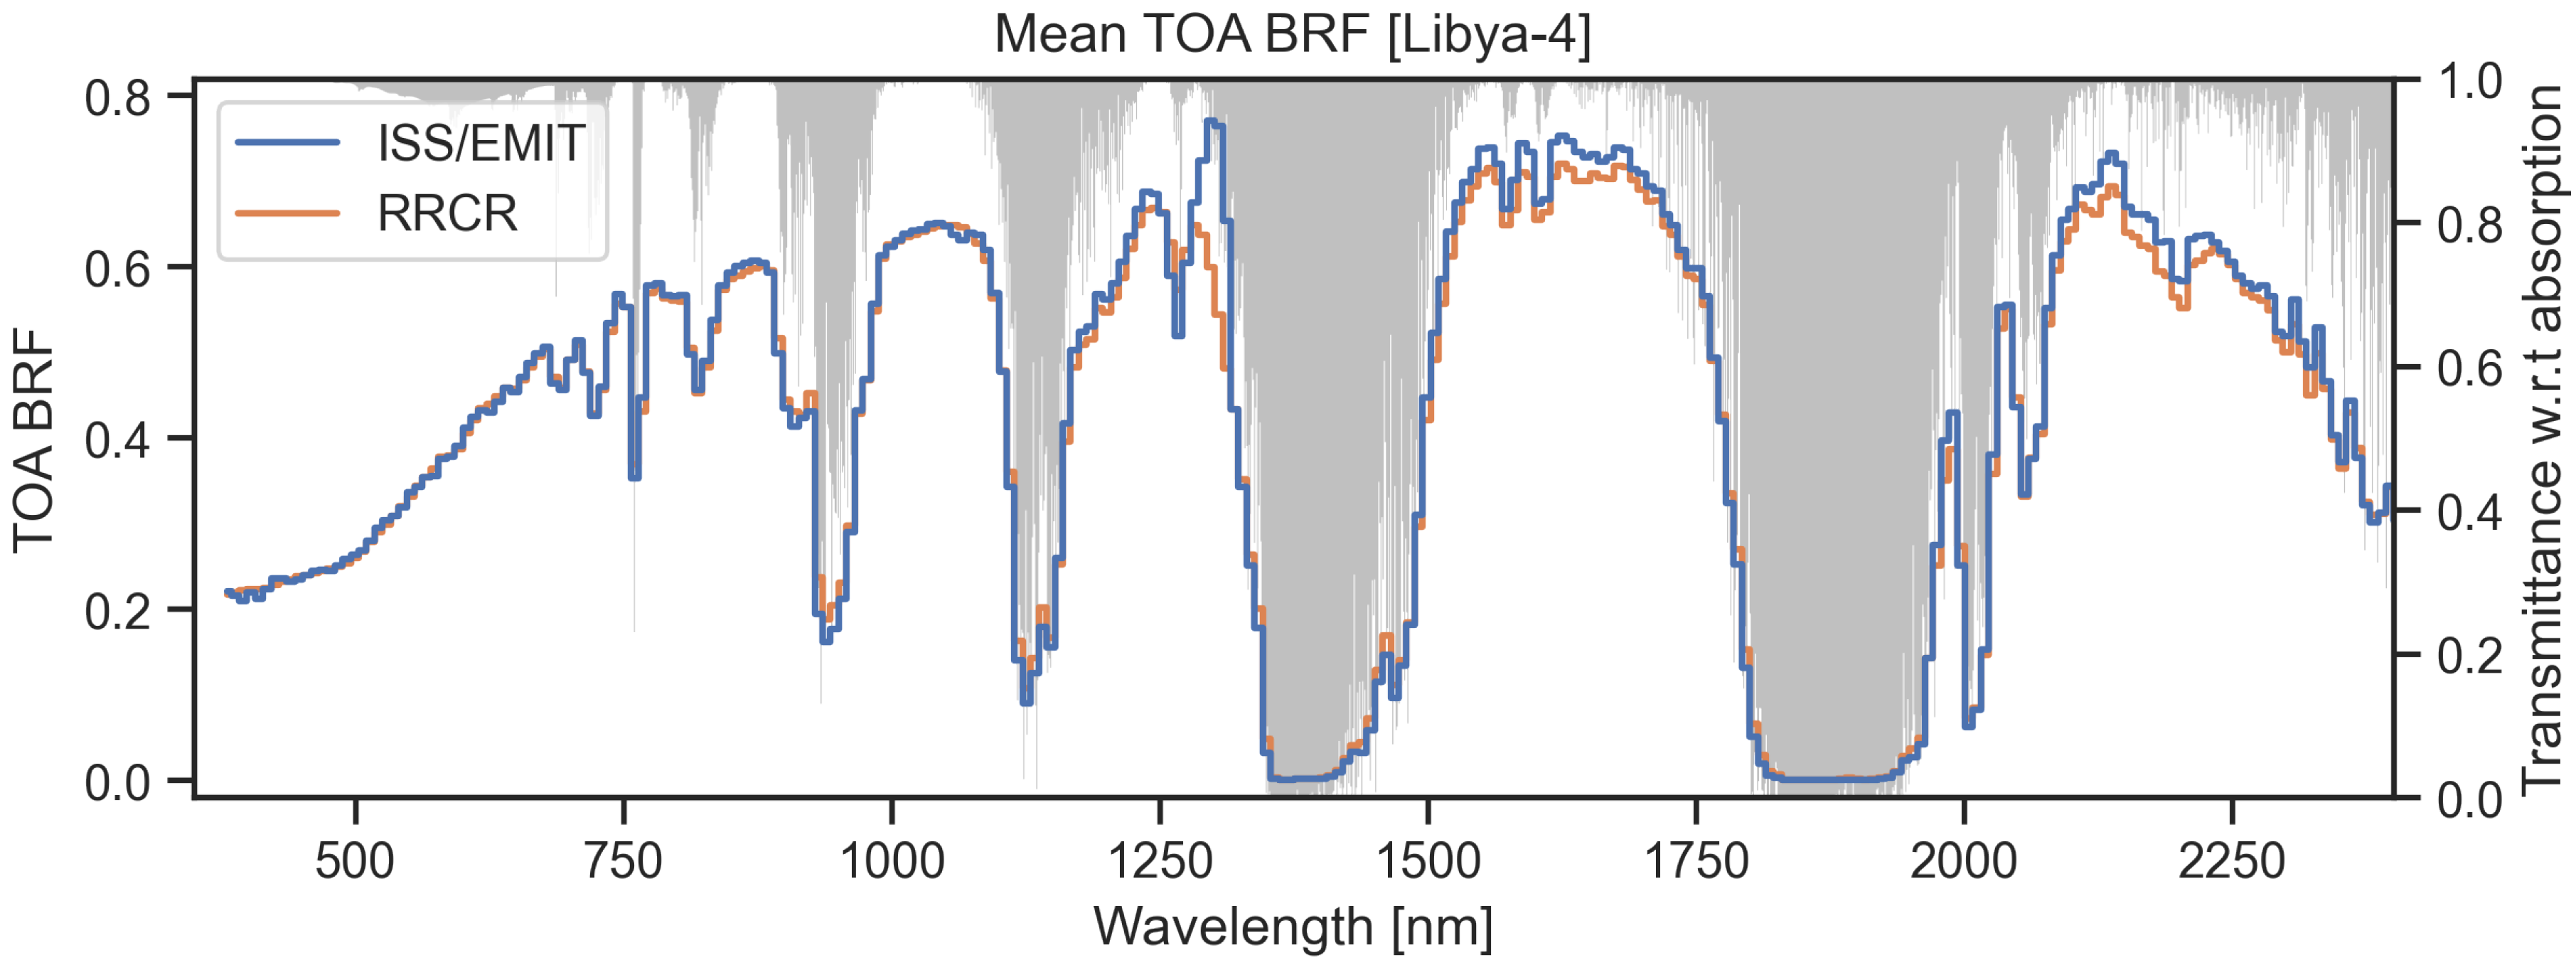
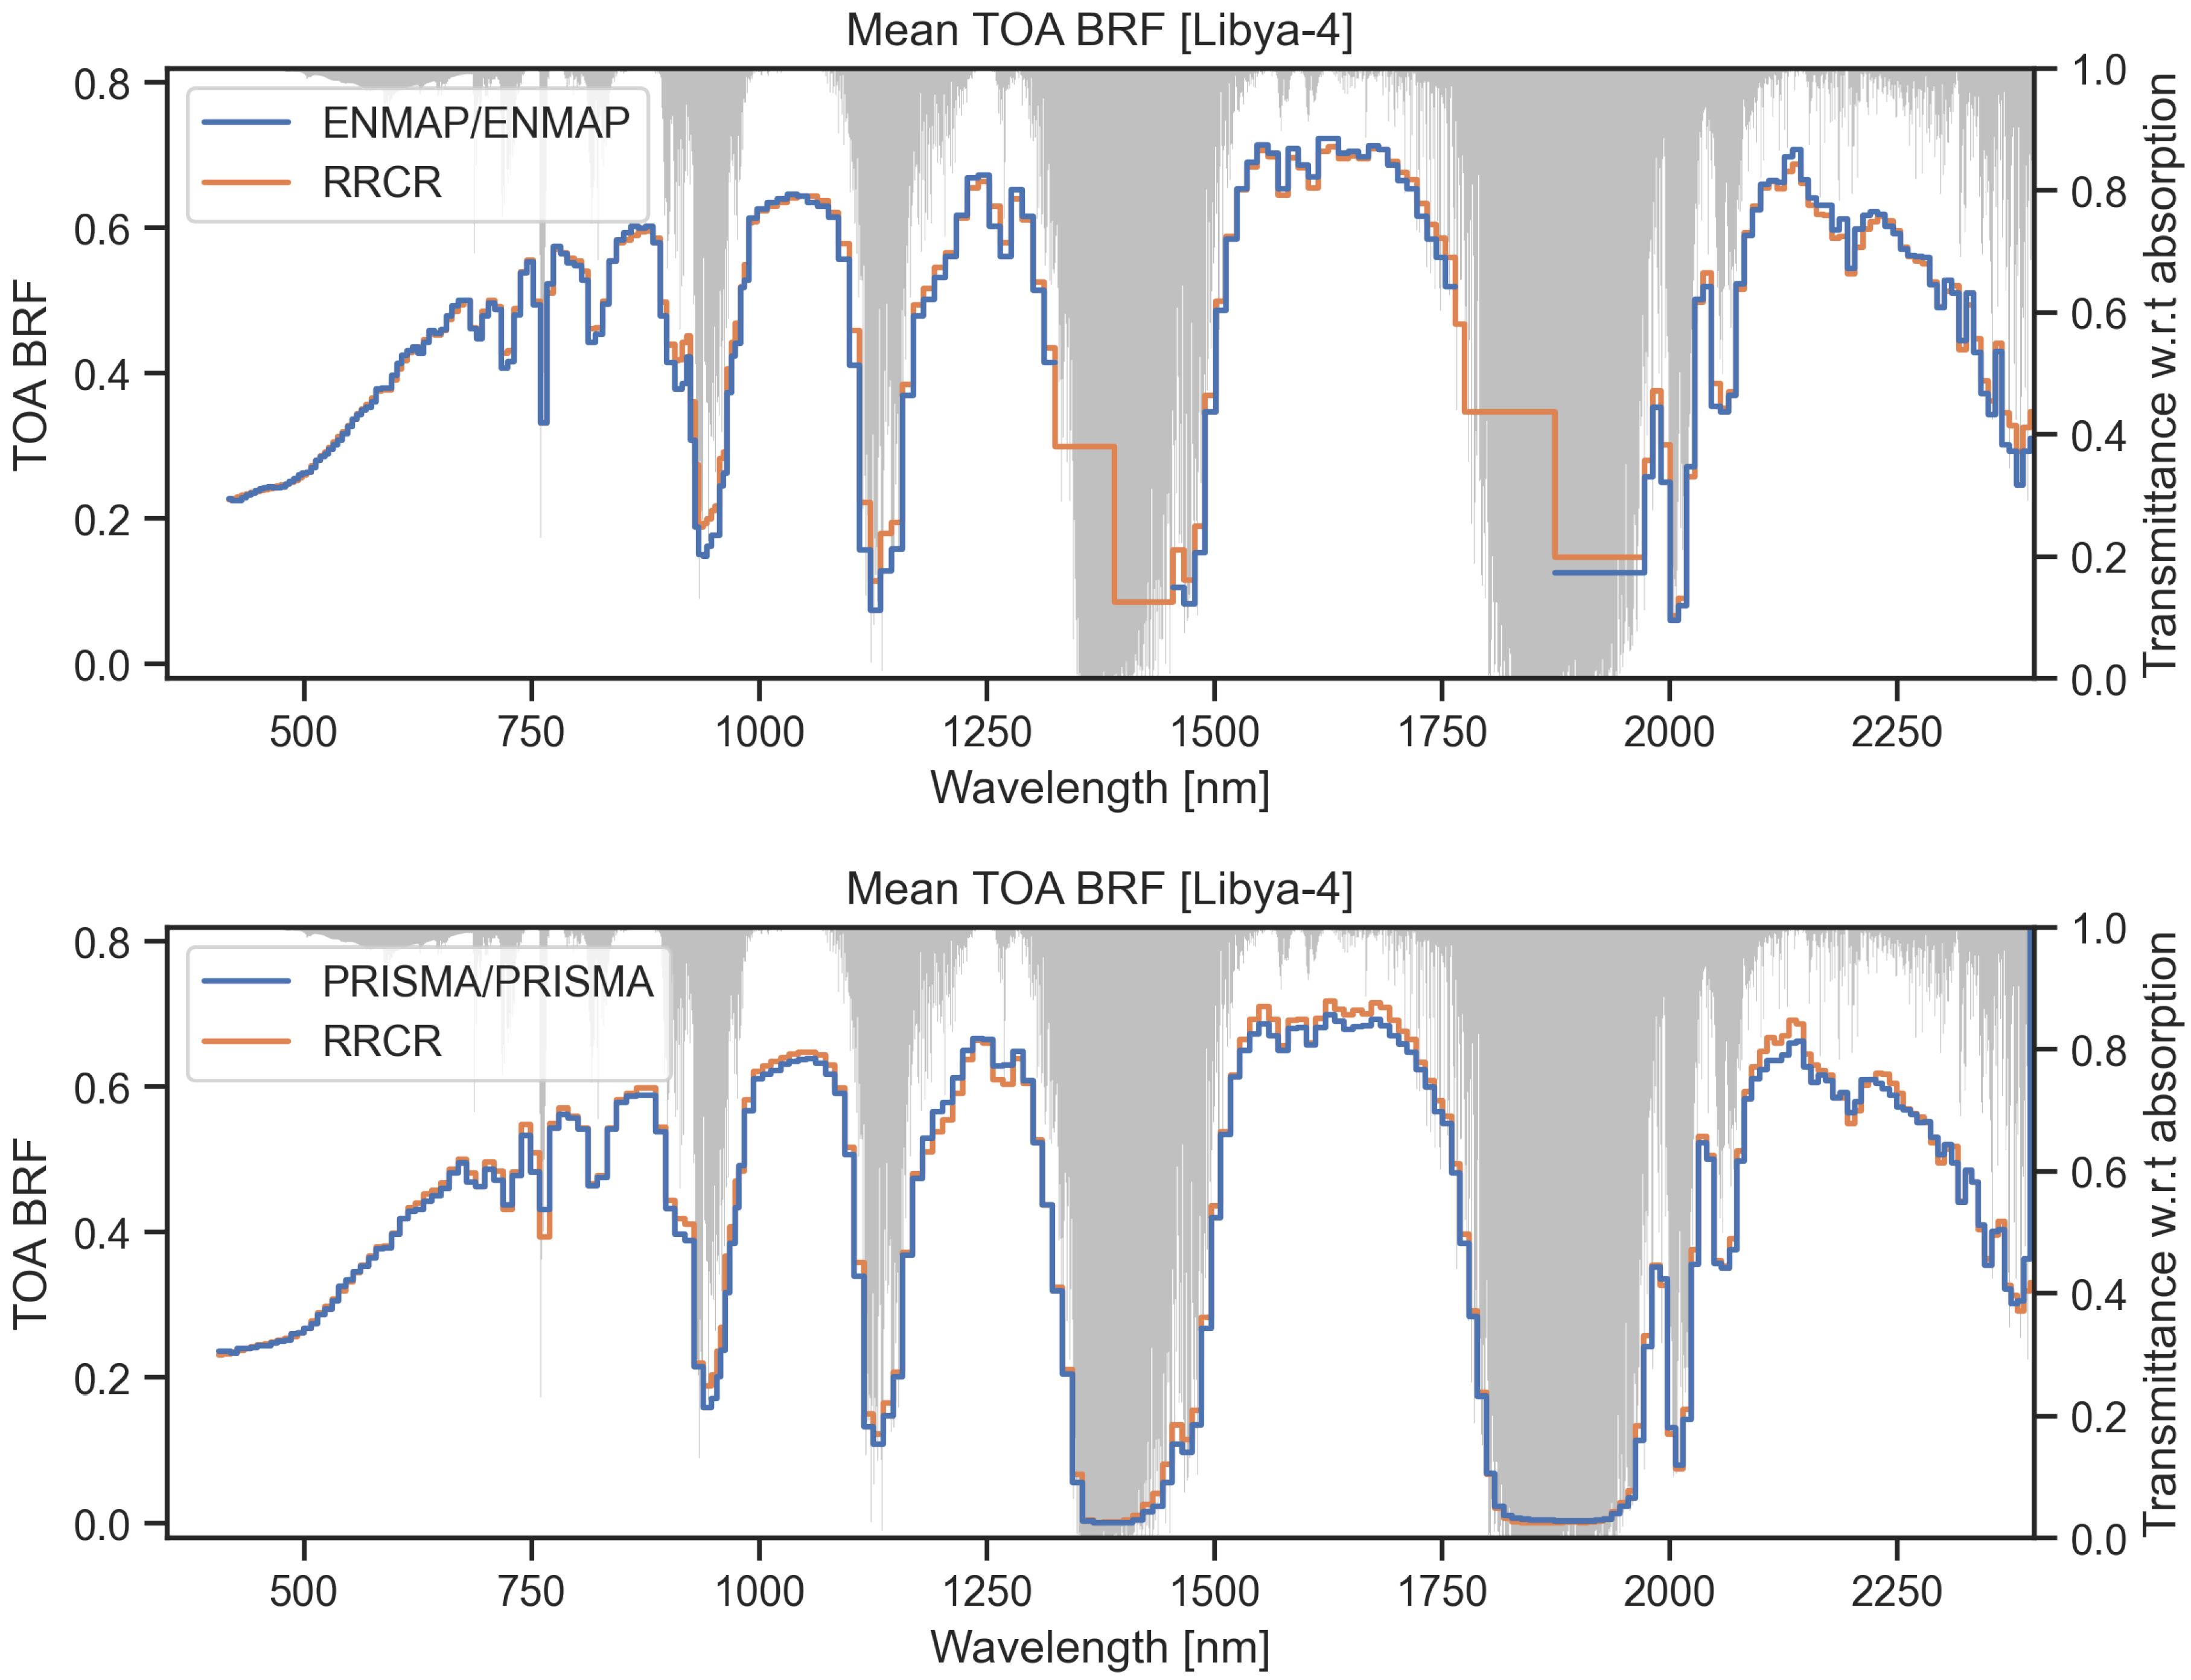
Figure 12.
Mean relative bias of hyperspectral Sensors over Libya-4. The dotted lines represent the ± 5% limit, the dashed line ±3% limit, corresponding to the estimated accuracy in [14]. The grey shaded area represents the atmospheric transmittance (right y axis). Notably, EMIT has limited observations over Libya-4, which may affect statistical robustness.
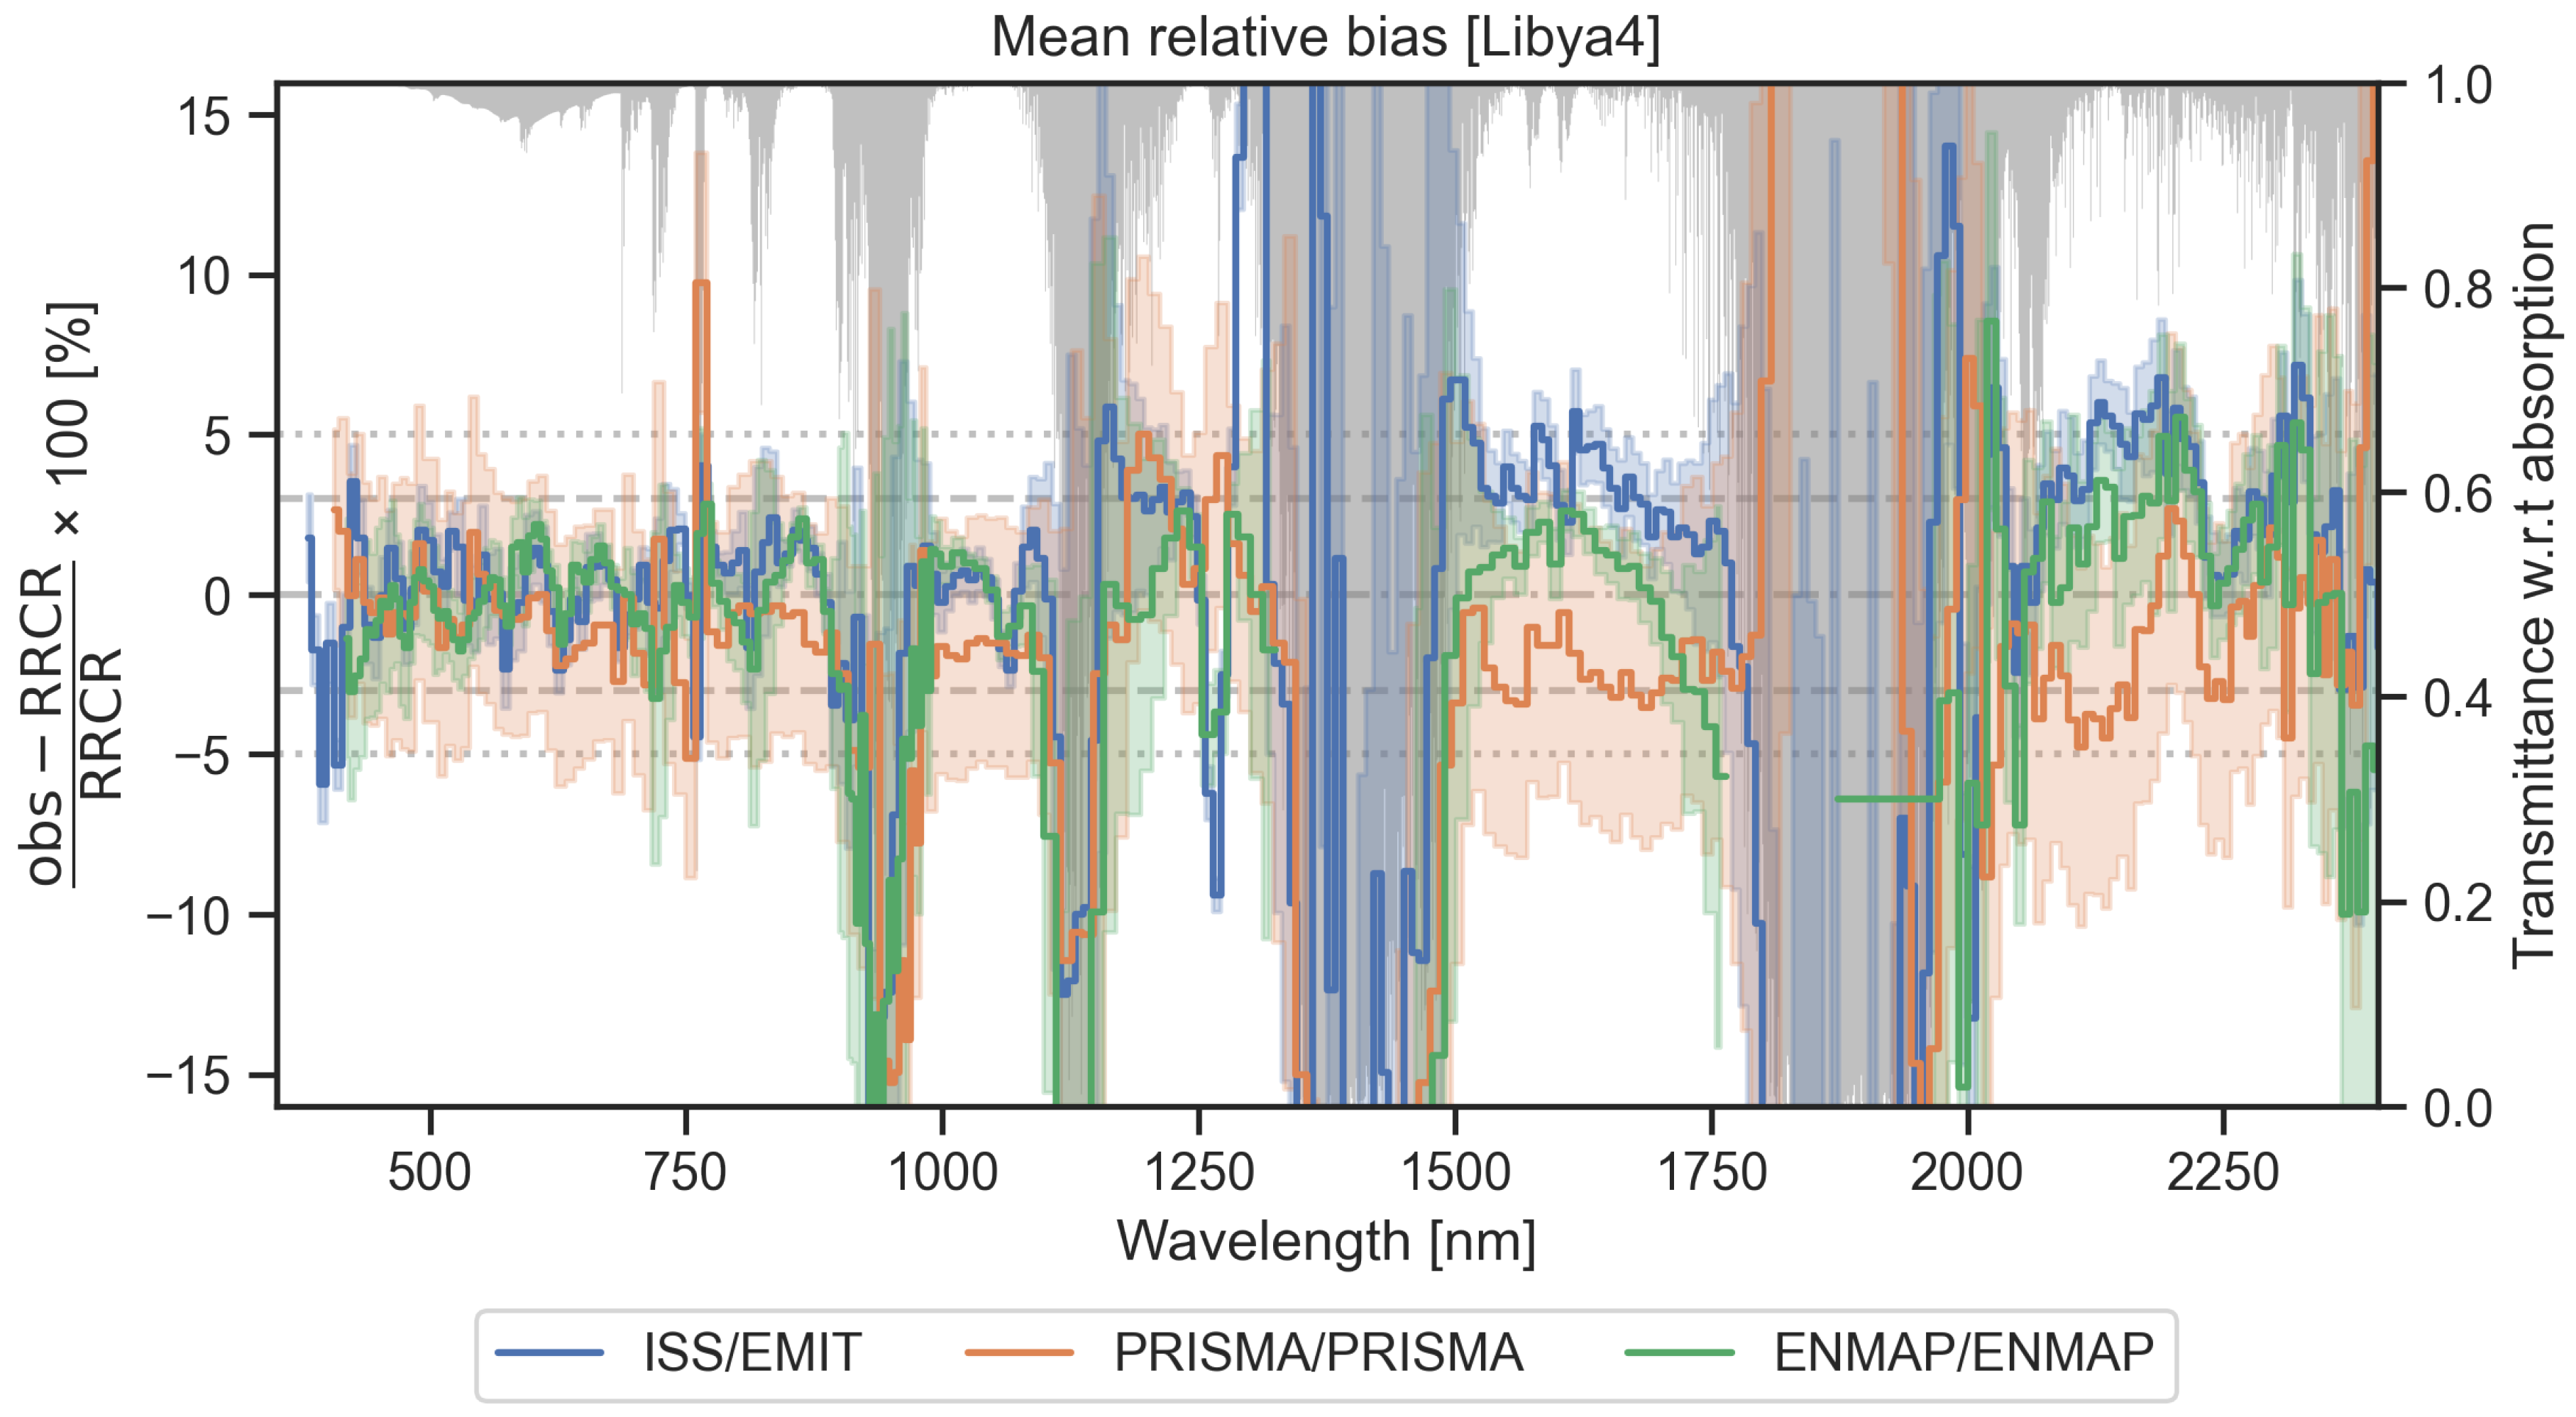
Figure 13.
Same as Figure 11 over Gobabeb.
Figure 13.
Same as Figure 11 over Gobabeb.
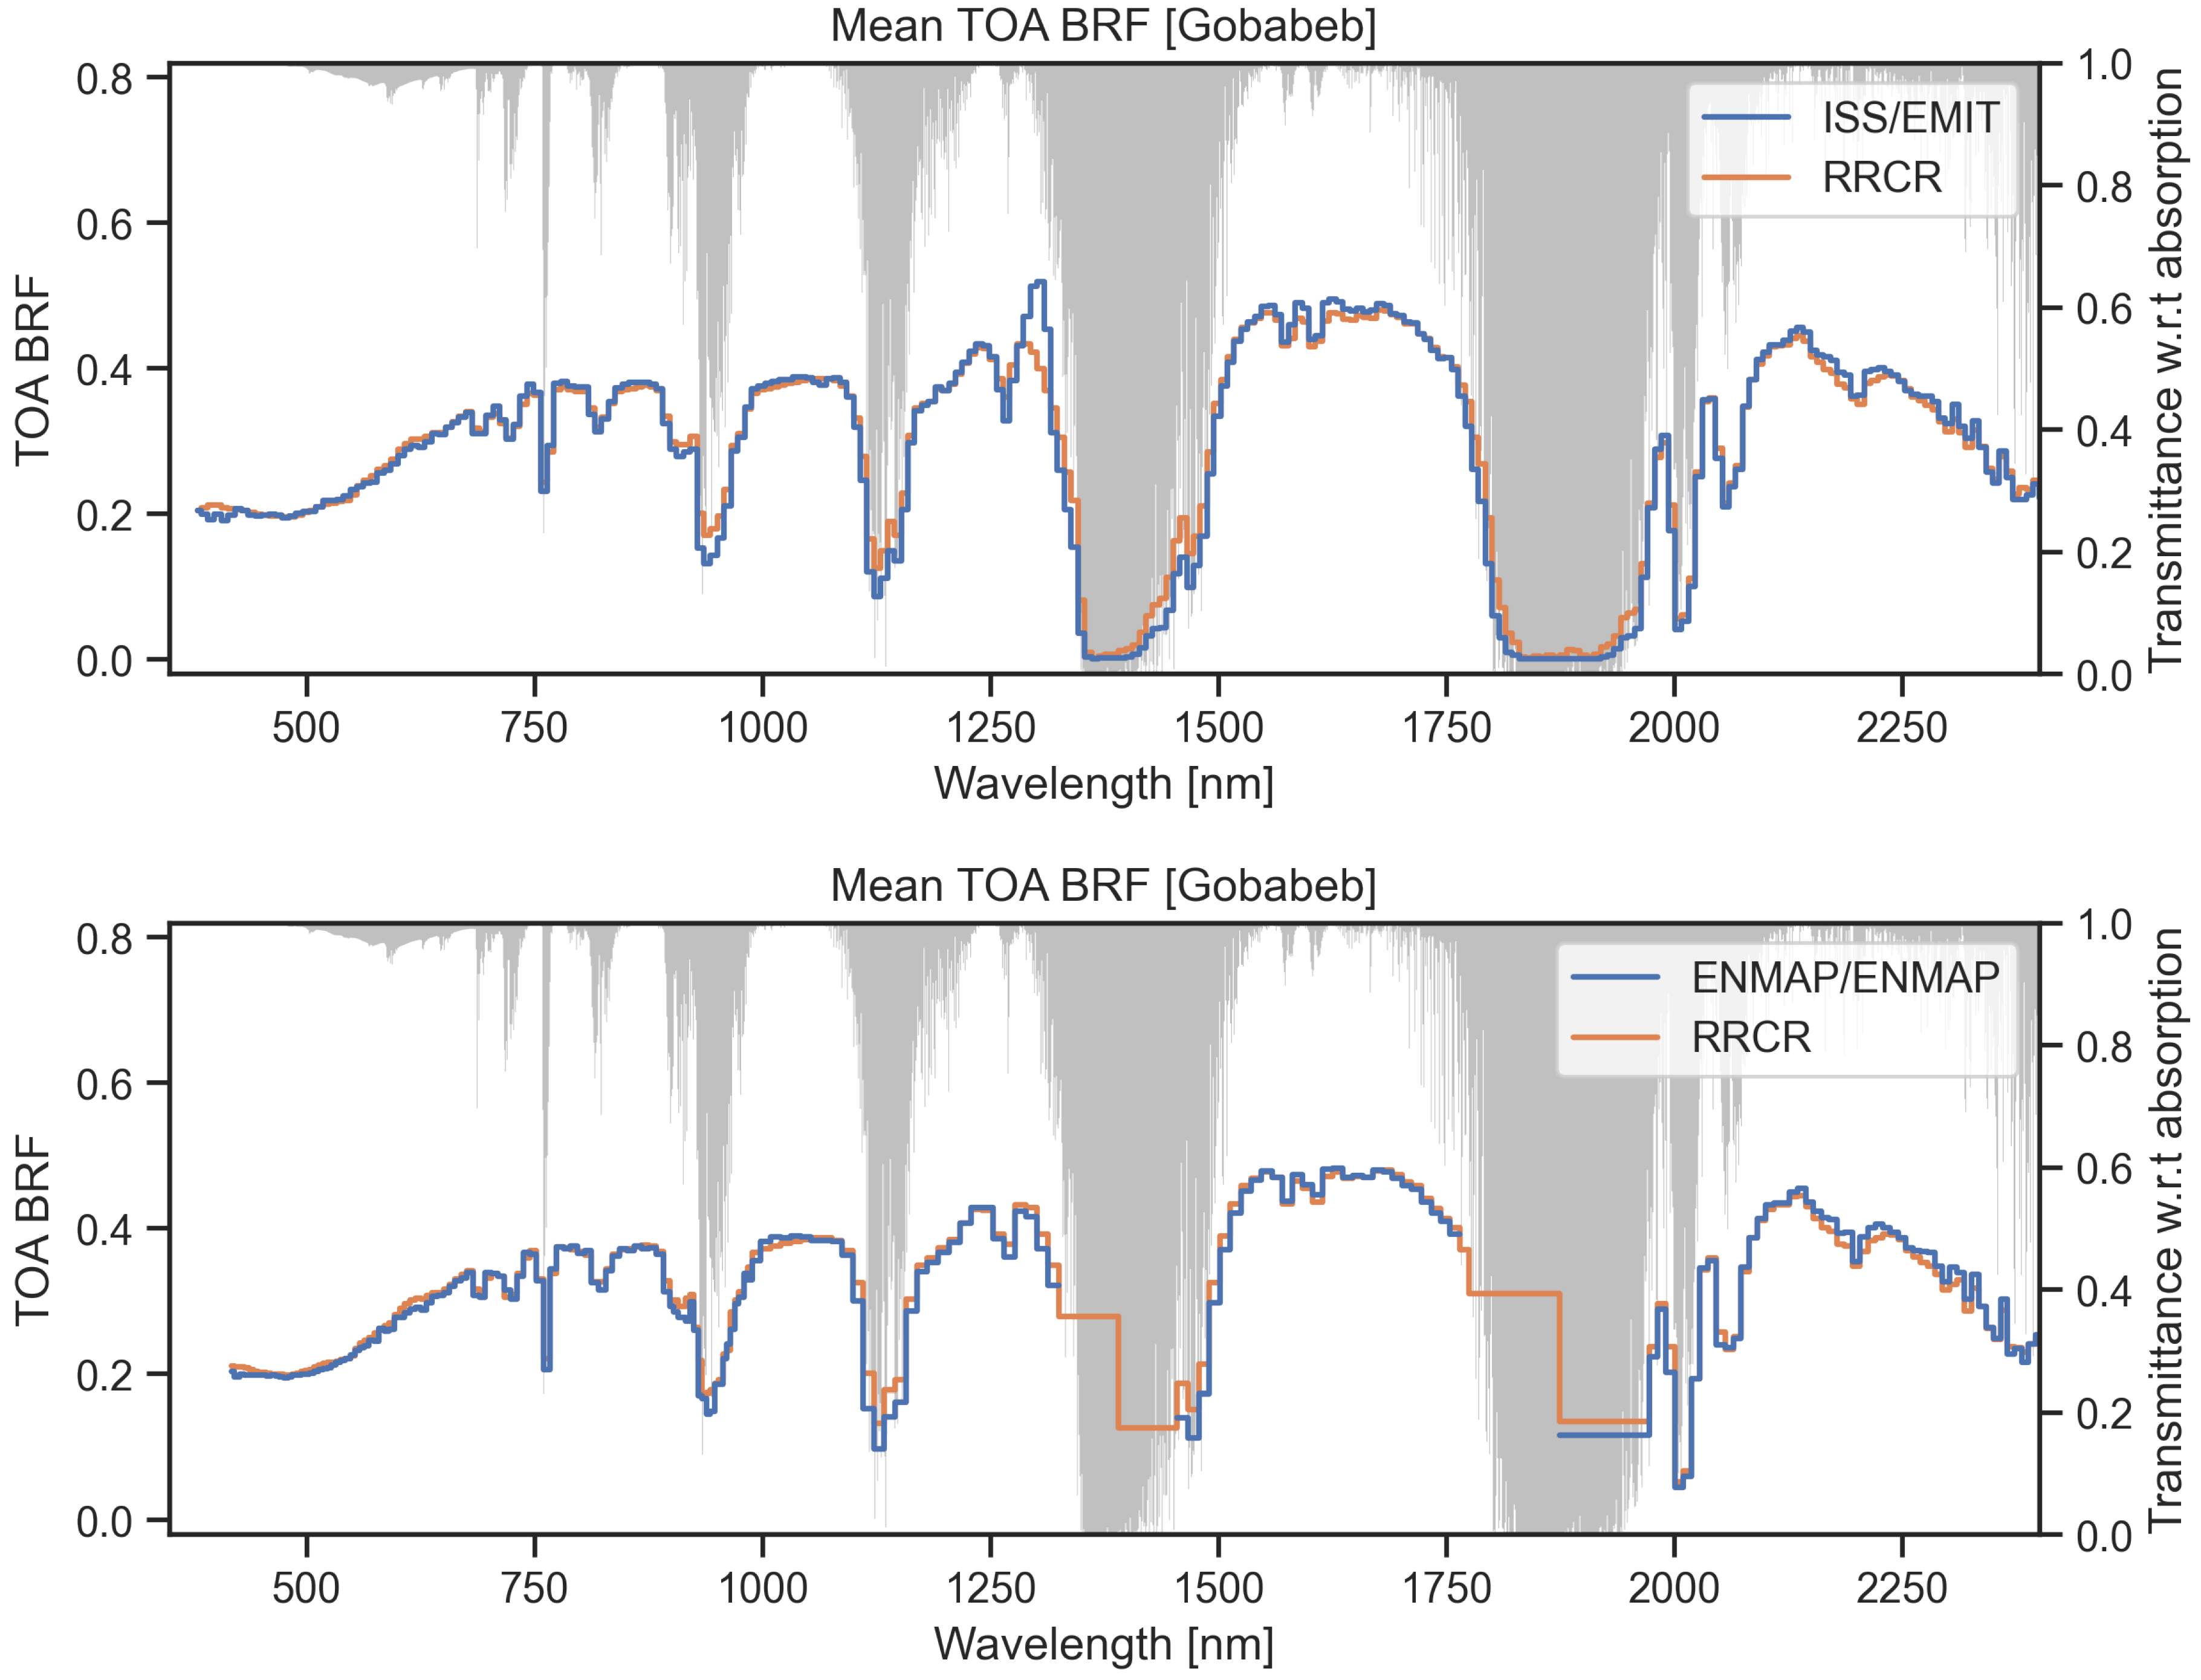
Figure 14.
Same as Figure 12 over Gobabeb.
Figure 14.
Same as Figure 12 over Gobabeb.
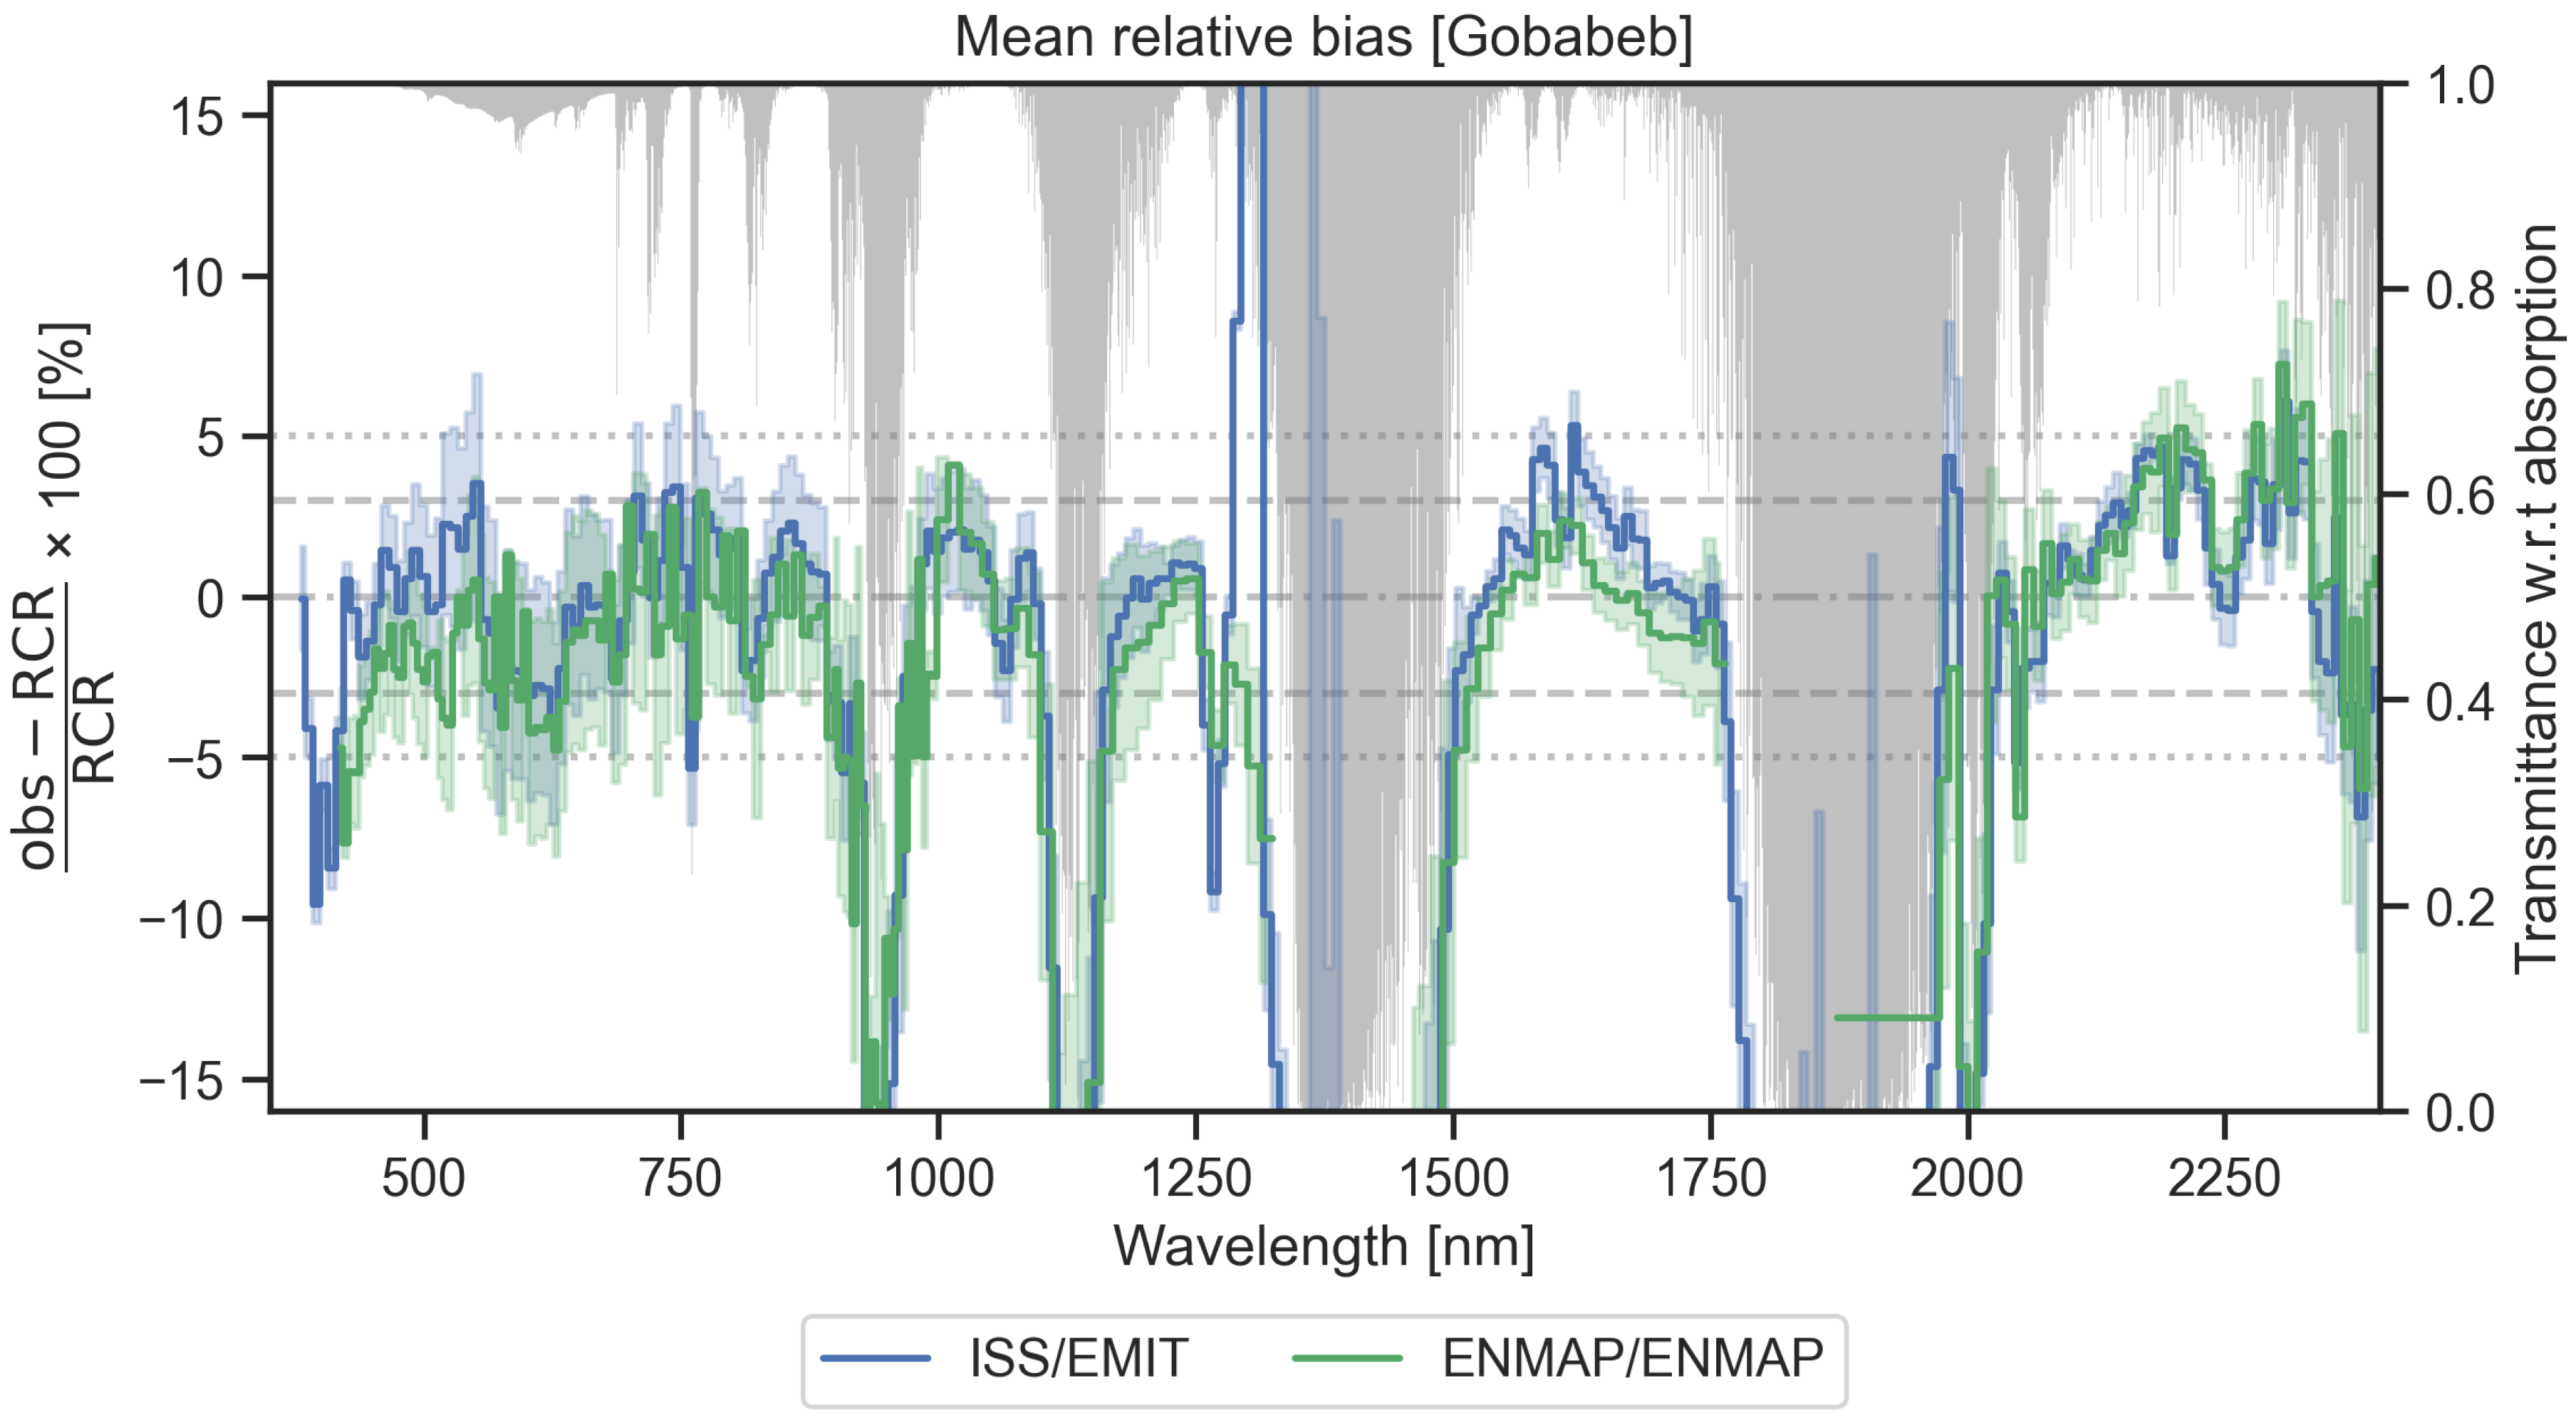
Figure 15.
Correlation between observed biases and molecular transmittance across the spectral range over Libya-4. The dotted lines represent the ± 5% limit, the dashed line ±3% limit, corresponding to the estimated accuracy in [14].
Figure 15.
Correlation between observed biases and molecular transmittance across the spectral range over Libya-4. The dotted lines represent the ± 5% limit, the dashed line ±3% limit, corresponding to the estimated accuracy in [14].
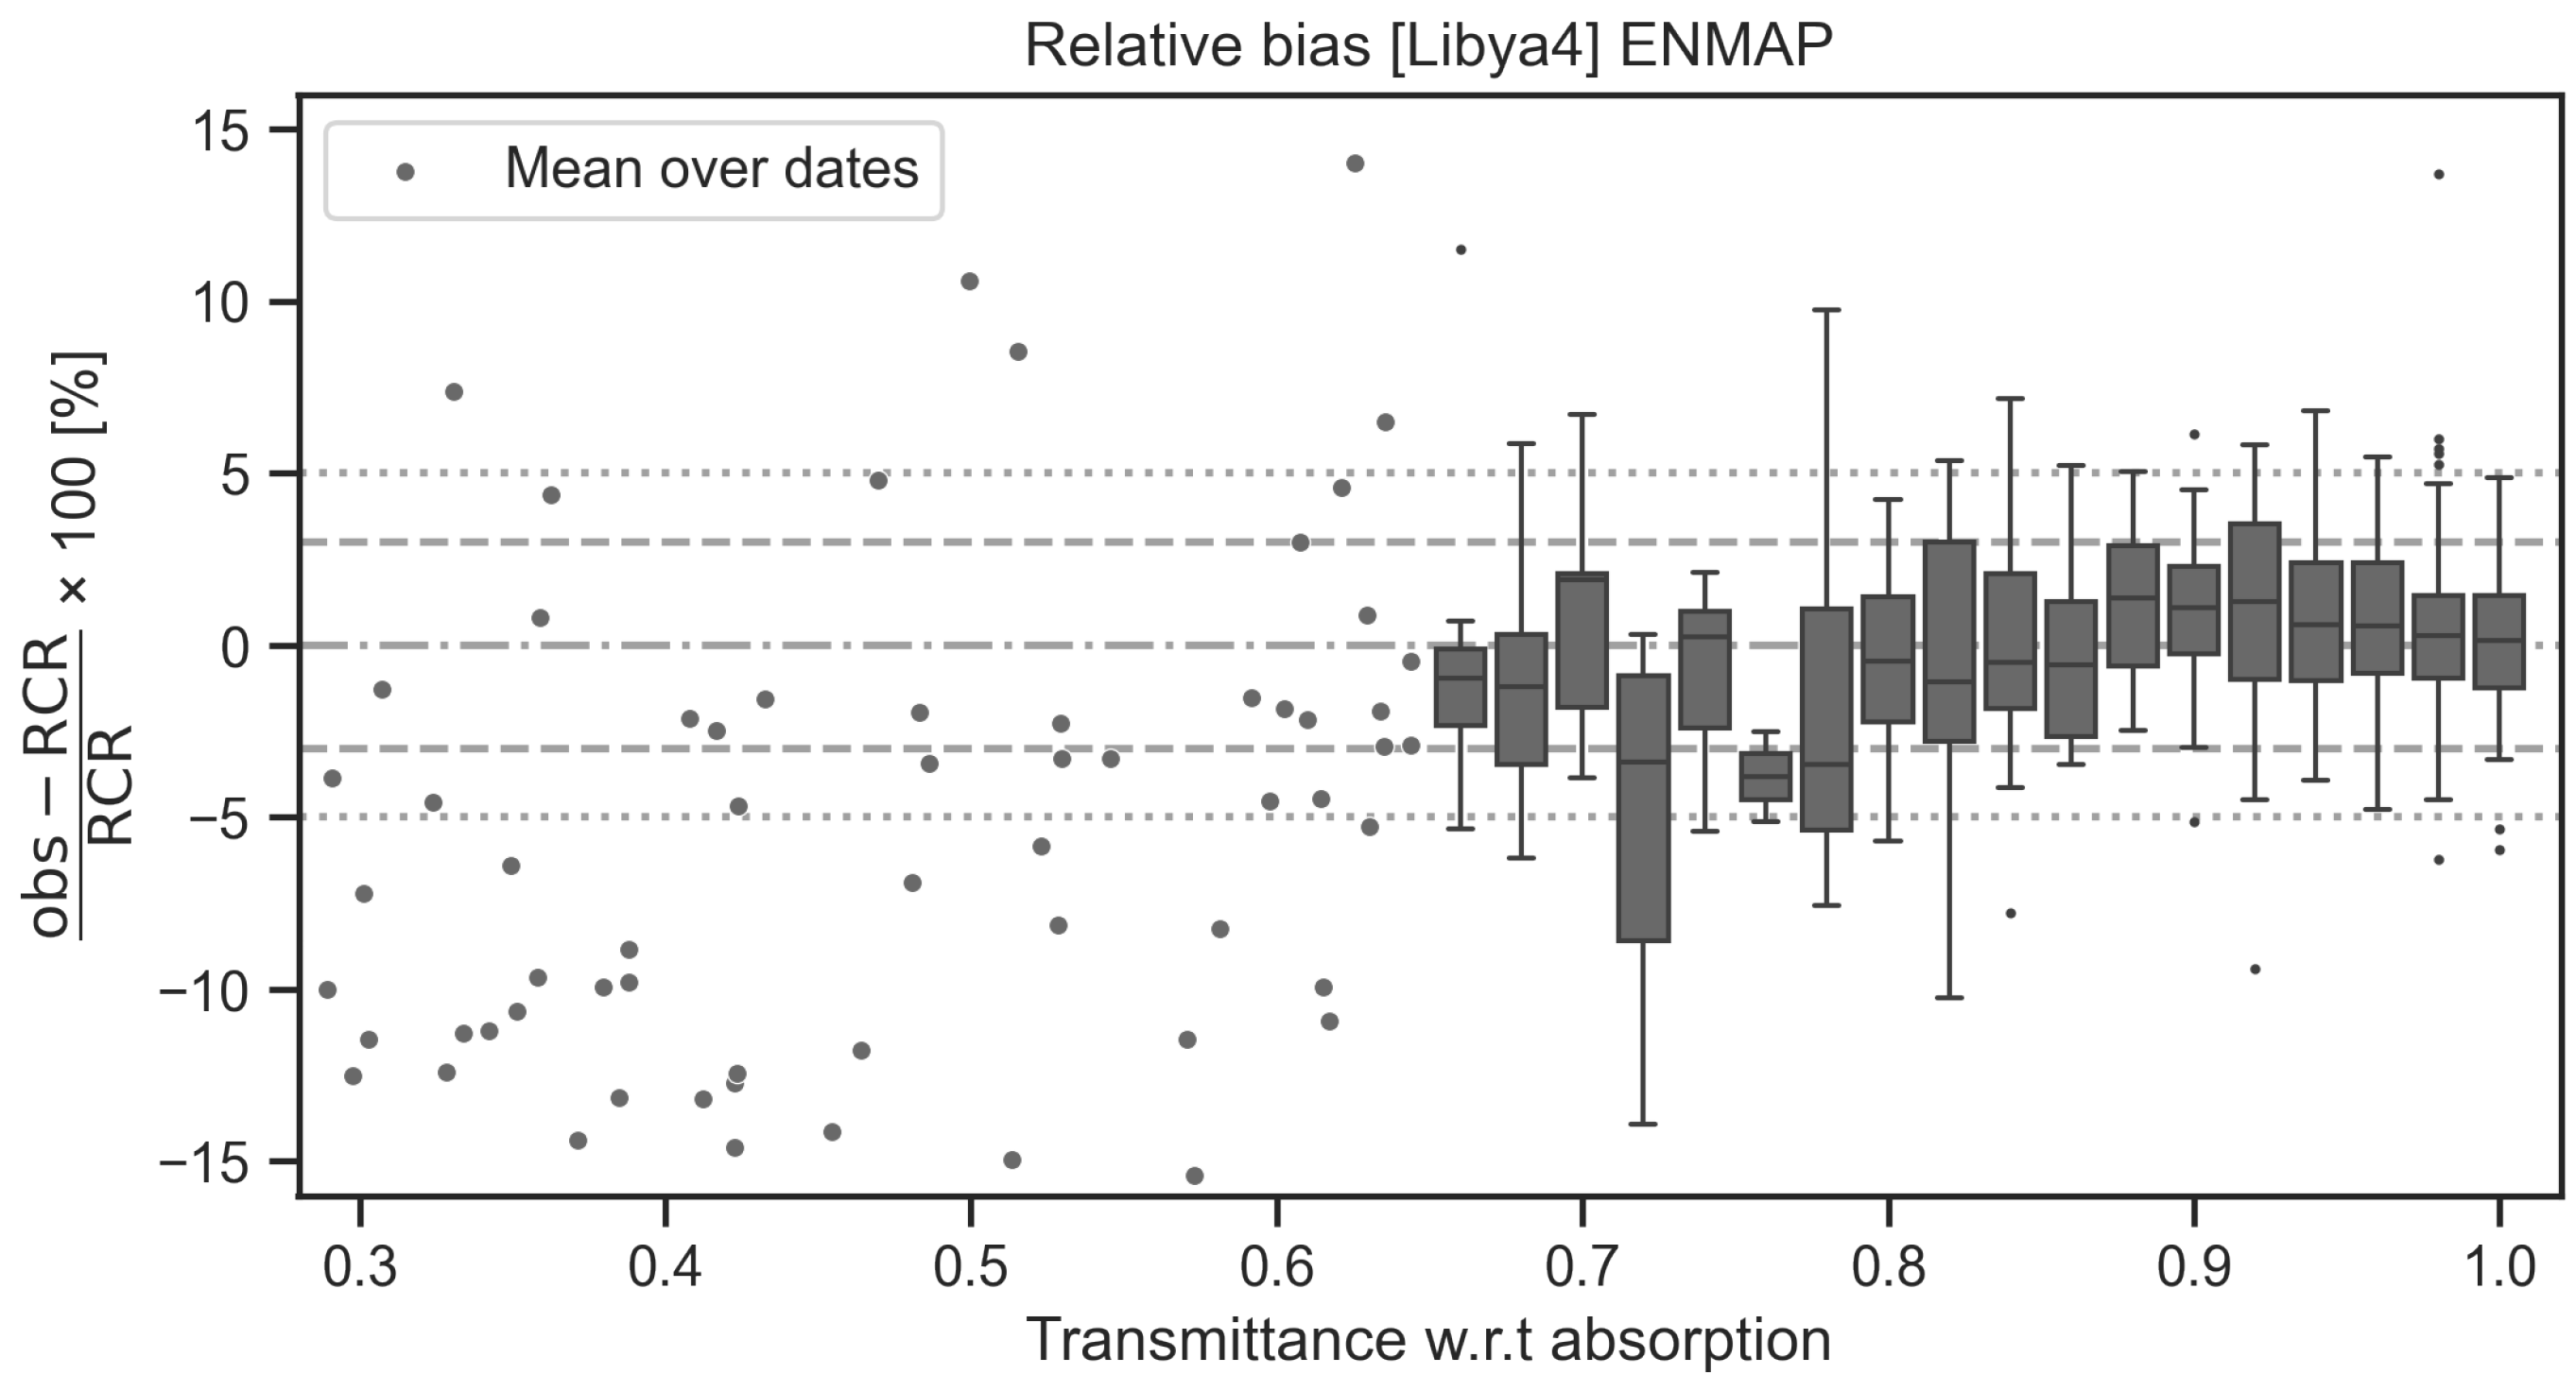
Figure 16.
Same as Figure 15 over Gobabeb.
Figure 16.
Same as Figure 15 over Gobabeb.
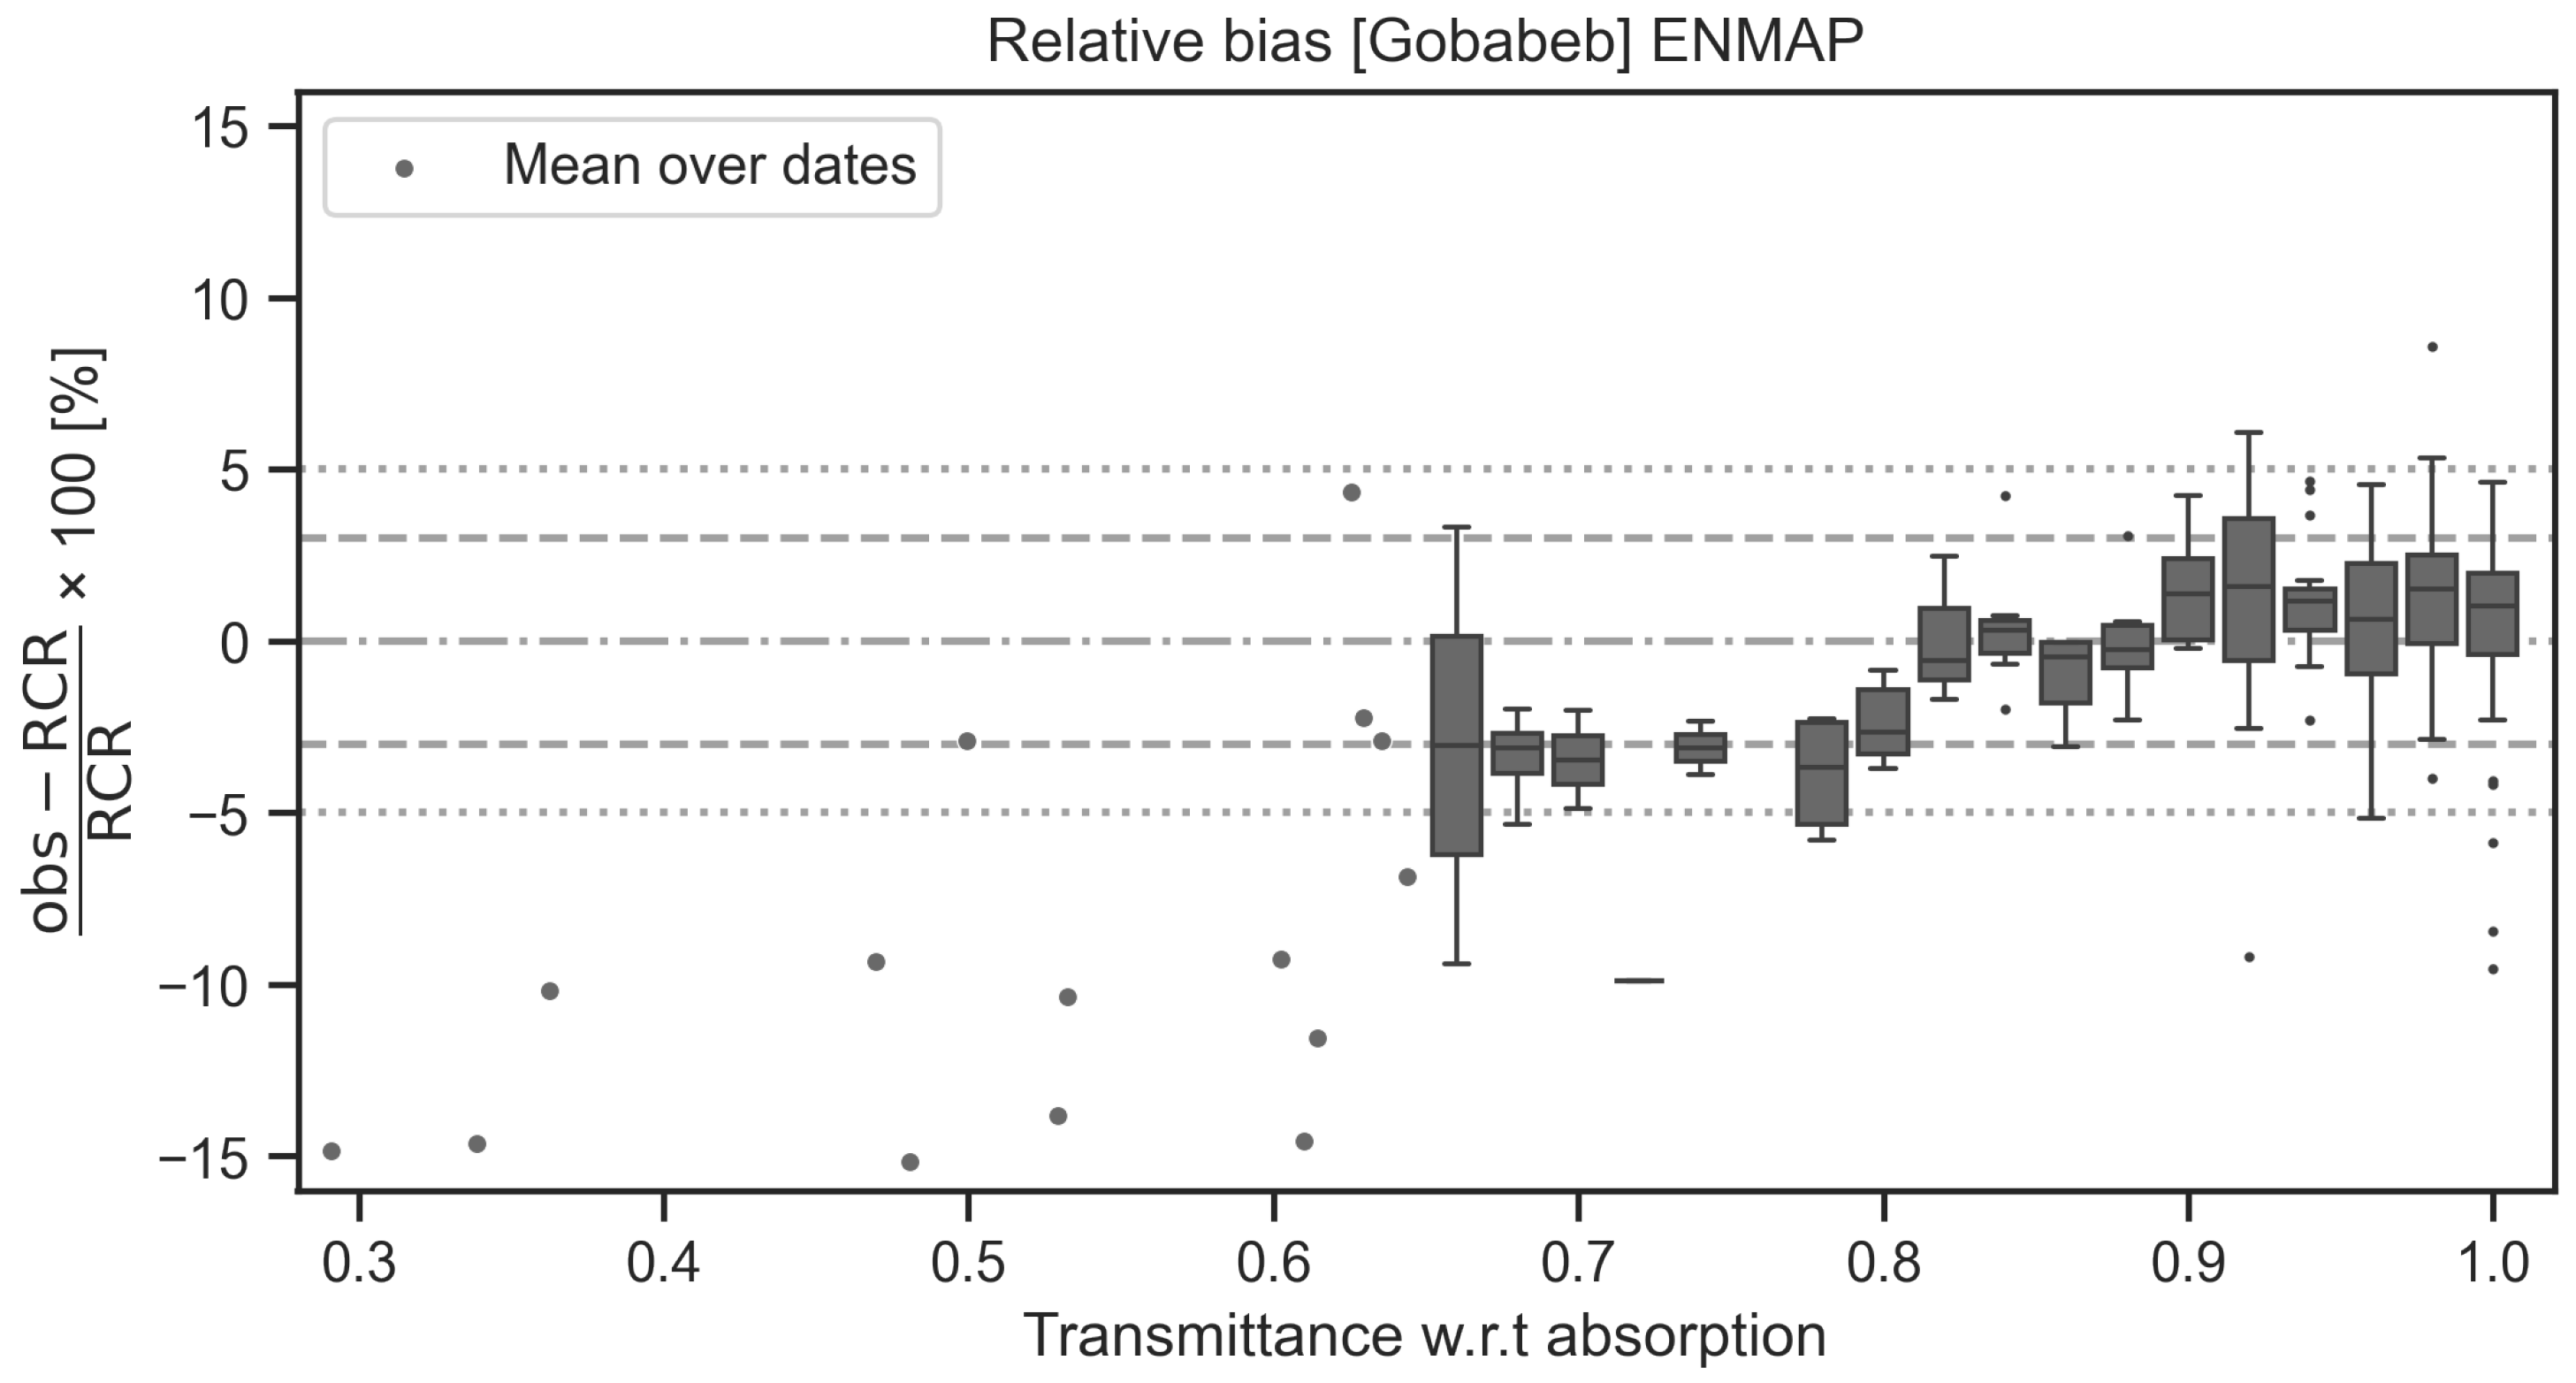

Table 1.
List of selected bright desert PICS. Longitude and latitude are given in degree. The elevation is expressed in meter and includes the mean value and its standard deviation. Target size is given in km.
Table 1.
List of selected bright desert PICS. Longitude and latitude are given in degree. The elevation is expressed in meter and includes the mean value and its standard deviation. Target size is given in km.
| Name | Lon. | Lat. | Elevation | Size |
|---|---|---|---|---|
| Libya-4 | 23.42 | 28.67 | 130 (11) | 20 |
| Gobabeb | 15.12 | -23.60 | 498 (7) | 2 |
Table 2.
List of radiometers data acquired over the PICS to retrieve the RPV parameters with the CISAR algorithm. N is the number of clear sky observations over the selected targets.
Table 2.
List of radiometers data acquired over the PICS to retrieve the RPV parameters with the CISAR algorithm. N is the number of clear sky observations over the selected targets.
| Platform | Radiom. | Data Source | Product | Spectral bands | Years | N - Libya4 | N - Gobabeb |
|---|---|---|---|---|---|---|---|
| AQUA/ TERRA | MODIS | NASA EarthData LAADS/ LP DAAC | MOD021KM MYD021KM MOD35_L2 MYD35_L2 | B01–B10 | 2005, 2006 | 270/ 240 | 269/ 267 |
| S2A | MSI | ESA Copernicus Data Space Ecosystem | S2A_MSIL1C | B1–B7, B8A, B11, B12 | 2018 | 31 | 31 |
| S3A/B | OLCI | ESA Copernicus Data Space Ecosystem | S3A_OL_1_EFR S3B_OL_1_EFR | Oa01–Oa11, Oa16–Oa18, Oa21 | 2021 – 2022 | 148 | 204 |
| MSG-4 | SEVIRI | EUMETSAT Data Store | MSG15, HRSEVIRI | VIS06, NIR16 | 2020 | 5542 | 0 |
| PARASOL | POLDER | AERIS/ ICARE Data and Services Center | POLDER3_L1B-BG1 | 0443, 0490, 0565, 0670, 0865, 1020 | 2008 – 2009 | 3405 | 0 |
Table 3.
List of hyperspectral instruments data acquired the selected Table 2 and the corresponding clear sky obsSITSatbya-4 and Gobabeb.
Table 3.
List of hyperspectral instruments data acquired the selected Table 2 and the corresponding clear sky obsSITSatbya-4 and Gobabeb.
| Instrument | Data Source | Product | Years | N - Libya4 | N - Gobabeb |
|---|---|---|---|---|---|
| EMIT | NASA EarthData LAADS DAAC | EMIT_L1B_RAD EMIT_L1B_OBS EMIT_L2A_MASK EMIT_L2A_RFL EMIT_L2A_RFLUNCERT | 2022, 2023 | 6 | 3 |
| PRISMA | ASI Prisma catalogue client | PRS_L1_STD | 2019, 2020, 2021, 2022, 2023 | 28 | 0 |
| ENMAP | DLR EOC EOWEB GeoPortal | ENMAP.HSI.L1C | 2022, 2023 | 34 | 26 |
Disclaimer/Publisher’s Note: The statements, opinions and data contained in all publications are solely those of the individual author(s) and contributor(s) and not of MDPI and/or the editor(s). MDPI and/or the editor(s) disclaim responsibility for any injury to people or property resulting from any ideas, methods, instructions or products referred to in the content. |
© 2025 by the authors. Licensee MDPI, Basel, Switzerland. This article is an open access article distributed under the terms and conditions of the Creative Commons Attribution (CC BY) license (http://creativecommons.org/licenses/by/4.0/).
Copyright: This open access article is published under a Creative Commons CC BY 4.0 license, which permit the free download, distribution, and reuse, provided that the author and preprint are cited in any reuse.


