
Submitted:
24 December 2025
Posted:
24 December 2025
You are already at the latest version
Abstract
National-scale monitoring of mangrove forests, including their spatial structure (e.g., canopy height and above-ground biomass), is necessary for the implementation of global agreements related to climate change and biodiversity conservation. Field measurements of mangrove structural parameters, however, are costly to collect. Here, we investigated the use of freely available data from multiple satellite sensors to monitor mangrove height and above-ground biomass at the national scale in Mauritius. L-band synthetic aperture radar data, optical multispectral data, and an existing global tree canopy height map were used as the main inputs to a regression model for estimating mangrove canopy height, while satellite LIDAR height measurements (Global Ecosystem Dynamics Inves-tigation (GEDI) data) were used to calibrate and validate the models. Based on 5-fold cross-validation, random forest regression achieved an R2 value of 0.46 and root-mean-square error (RMSE) of 4.45m. The main factor limiting higher model accuracy was likely the sparsity of satellite LIDAR data points in man-grove areas of Mauritius (n = 65), and this may be an issue in other SIDS also due to the limited geographic coverage of the LIDAR data. Still, our approach outperformed the existing global tree canopy height map (RMSE = 5.33) and a linear regression modeling approach (R2 = 0.34, RMSE = 4.85m).
Keywords:
ecosystem services
; LIDAR
; synthetic aperture radar
; PALSAR‐2
1. Introduction
Regular monitoring of forest structural information (e.g., forest height and carbon stocks) is needed to support global climate change and biodiversity agreements, including the Paris Agreement [1] and the Kunming-Montreal Global Biodiversity Framework [2]. For example, countries need to conduct national greenhouse gas inventories, including CO2 emissions/removals related to land use, land use change and forestry (LULUCF) [1]. Mangroves represent important type of forest in tropical island countries, protecting the coastline from climate (change) hazards like storm surge, coastal erosion, and sea level rise, while at the same time storing large amounts of carbon and providing habitat for terrestrial and marine organisms [3,4,5,6]. In small island developing states (SIDS) like Mauritius, mangroves are also an important resource local people, many of whom rely on mangrove ecosystems for their livelihoods (e.g., fishing, crabbing, and ecotourism), health (e.g., medicinal plants), and recreational/cultural activities (e.g., picnicking and leisure fishing) [7]. Aside from spatial extent, mangrove canopy height and above-ground biomass (AGB) are commonly used as indicators of the level of biodiversity and ecosystem services provided by mangrove ecosystems.
Collecting data on mangrove canopy height and AGB is typically done through field surveys, which are costly and difficult to conduct over large geographic areas and/or frequent time intervals. Satellite remote sensing data, on the other hand, can be used to retrieve information on canopy height/AGB over large areas and a high frequency (e.g., annually, or even seasonally) [8]. Optical remote sensing data, i.e., visible, near-infrared, and mid-infrared images, are often used to map mangrove extent, but limited in terms of their ability to estimate height/AGB because they can only observe the level of “greenness” of the mangroves at the top of the canopy. On the other hand, synthetic aperture radar (SAR) and LIDAR (light detection and ranging) satellite data are able to penetrate through the vegetation canopy and provide more accurate vegetation structural information, e.g., canopy height [9] and AGB [10]. SAR and LIDAR satellite data also have the benefits of being able to penetrate cloud cover (which optical data cannot do), which makes them particularly useful for monitoring vegetation in tropical regions where mangroves are typically found.
Considering the above, in this study we evaluated the potential of using satellite remote sensing data, including optical, SAR, and LIDAR data, for monitoring mangrove canopy height and AGB at the national scale in Mauritius. LIDAR measurements of mangrove canopy height were used to train and validate a random forest regression model that incorporated optical and SAR data (as well as an existing global tree canopy height map [11]). Although some other previous studies have also estimated mangrove canopy height/AGB using optical, SAR, and/or LIDAR satellite data [8,12], few have focused on SIDS, which may face particular limitations related to data availability (e.g., sparse field survey data and airborne LIDAR data). Notably, all of the remote sensing datasets used in our methodology are freely available, so this kind of approach may be cost-effective to apply in other SIDS as well.
2. Methods and Materials
2.1. Study Area
Mauritius is a SIDS located in the Southwestern Indian Ocean, around 2,000 km off the coast of Africa. It has an area of 2,040 km2 and a population of 1.235 million (https://statsmauritius.govmu.org/Pages/Censuses%20and%20Surveys/Census/2022_Population_census_Main_results.aspx). While in the past, the country contained large areas of mangrove forests, as of the year 2020, their coverage is estimated to be only around 242 ha based on the map generated in Koenig et al. [13]. The government of Mauritius has a target of restoring an additional 403 ha of mangrove forests and other wetlands by the year 2030 as part of its climate change adaptation efforts [14]. A map of the country and the general locations of its mangrove forests is presented in Figure 1.
2.2. Datasets
The remote sensing datasets used in this study included optical satellite data from the Multispectral Instrument (onboard the European Space Agency’s Sentinel-2 satellite), L-band synthetic aperture radar satellite data from the PALSAR-2 instrument (onboard the Japan Aerospace Exploration Agency’s ALOS-2 satellite), and LIDAR data from the Global Ecosystem Dynamics Investigation (GEDI) instrument (onboard the International Space Station). Aside from these remote sensing datasets, we also used a 10m resolution global canopy height map, produced in a prior study through deep learning analysis of Sentinel-2 images (with model training/validation using GEDI LIDAR height data) [11]. This global canopy height map was used for the sake of comparison with our proposed approach, and also as an input for our regression modeling. While a global mangrove height map for the 2011-2013 period also exists [12], we found that this map actually does not contain any data for Mauritius (perhaps due to a lack of available remote sensing data for Mauritius at that time), so it was not used in our study.
2.3. Methodology
We processed all of the remote sensing datasets using the Google Earth Engine cloud computing platform [15]. Table 1 summarizes the procedures for each dataset (described in more detail below), and Figure 2 shows several of the processed datasets in an example site in Mauritius.
Sentinel-2 optical image processing. First, we extracted all Sentinel-2 images with less than 20% cloud cover acquired in 2024, and calculated the normalized difference vegetation index [16] of pixels in these images flagged as not cloudy using the Sentinel-2 Quality Assistance band. We then calculated the maximum NDVI value at each pixel location (10m spatial resolution) as a measure of the maximum annual leaf area index [17] at each location.
PALSAR-2 SAR image processing. We processed two types of PALSAR-2 data, each having a different spatial and temporal resolution. First, we extracted normalized radar backscatter values from PALSAR-2 annual mosaic images acquired in 2024. These images have a 25m spatial resolution, with one image per location annually, and include both the HH (signal horizontally transmitted and horizontally received) and HV (signal horizontally transmitted and vertically received) polarizations. Next, we extracted all PALSAR-2 ScanSAR images from 2024. These images have a 60-100m spatial resolution, with multiple images per location annually. From these ScanSAR images, we calculated the median and maximum normalized backscatter values at each pixel location as measures of vegetation structure (e.g., canopy height/AGB). This is because L-band SAR backscatter intensity generally has a positive relationship with canopy height and AGB.
GEDI LIDAR data processing. We extracted all GEDI LIDAR data acquired over Mauritius between March 2019 and November 2024, using the GEDI level 2a raster canopy top height dataset (https://developers.google.com/earth-engine/datasets/catalog/LARSE_GEDI_GEDI02_A_002_MONTHLY, last accessed August 13, 2025). LIDAR height data points flagged as “Quality” observations were used, while data points flagged as “Degraded” were removed to avoid including poor quality canopy height measurements. This dataset has a 25m spatial resolution, but unlike the optical and SAR data, its geographic coverage is relatively limited. As in past research on mangrove height estimation [12], from this dataset we used the Relative Height (RH) 98 data, a metric that describes the relative height at which 98% of the LIDAR waveform emitted from the GEDI sensor is collected (assumed to be the top of the vegetation canopy, i.e., the tree height). We then extracted GEDI LIDAR values only in areas mapped as “Mangrove Forest” in a previous study [13]. Finally, we overlaid the extracted LIDAR data onto high-resolution satellite images in Google Earth, and selected only the LIDAR points that were actually located completely within a mangrove forest (as some areas may have been either erroneously mapped as “Mangrove Forest” in the previous work, or mangrove losses may have occurred since the previous mapping was conducted).
Global canopy height map. We extracted the canopy height values at each pixel location (10m spatial resolution) from this dataset.
Regression modeling. From the processed GEDI LIDAR data, we identified 65 points (~25m in size) that were located in mangrove areas. For each of these 65 points, we extracted the optical and SAR image pixel values, as well as the canopy height values from the Lang et al. [11] map. Because the datasets had different spatial resolutions, all were resampled to the finest resolution (10m resolution) using the nearest neighbor resampling method. In total, eight independent variables were included in the regression model: maximum annual NDVI, ScanSAR maximum annual HH, ScanSAR maximum annual HV, ScanSAR median annual HH, ScanSAR median annual HV, PALSAR-2 annual mosaic HH, PALSAR-2 annual mosaic HV, and canopy height values from Lang et al. [11] map. Regression modeling was carried out using Random Forest regression [18], a machine-learning approach that can perform well for remote sensing analysis even with few training samples [19,20] (as in our study). We carried out Random Forest regression using Weka (Version 3.8.6), an open-source machine learning package [21]. Similar to past research, for the Random Forest regression model parameters, we set the number of regression trees set to 500, and the number of variables used for generating each decision node in a regression tree as log2(# of independent variables) + 1 [20]. Regression model training and validation was carried out through 5-fold cross-validation, and typical accuracy metrics including mean absolute error (MAE), root mean square error (RMSE), correlation coefficient (R), and R2 were calculated to understand the accuracy of the mangrove canopy height predictions.
For comparison with our Random Forest regression model, we also calculated the RMSE value of the global canopy height map produced by Lang et al. [11] by comparing the map’s canopy height values with the GEDI LIDAR height values. In addition, we also compared our Random Forest model with a linear regression model that was developed by fitting the height values of the Lang et al. [11] map to the GEDI LIDAR height values (also through 5-fold cross-validation). The rationale for this linear regression modelling was to see to what degree the global canopy height measurements could be improved using locally obtained LIDAR data.
Conversion of canopy height values to AGB values: Finally, we converted the canopy height estimates from our Random Forest regression model to AGB values using the allometric equation developed in Suwa et al. [22] through empirical modelling of the relationship between canopy height and AGB. This equation is given by:
Where H is the estimated mangrove canopy height, in meters, and AGB is the above-ground biomass in Mg ha-1.
lnAGB = -0.54 + 2.29lnH
3. Results and Discussion
As shown in Table 2, our Random Forest regression model achieved higher accuracy than the Lang et al. [11] global canopy height map and the linear regression model which fit the Lang et al. (2023) height values to GEDI LIDAR data from Mauritius. This suggests that our proposed approach has potential for mangrove canopy height estimation. The lowest accuracy values were for the Lang et al. (2023) map, which is likely due to the fact that this map was: (1) generated using training data from many countries around the world rather than Mauritius alone, and (2) reliant solely on optical remote sensing imagery (Sentinel-2 data) for estimating canopy height from GEDI LIDAR height measurements. Correcting this global map using GEDI LIDAR observations from Mauritius and linear regression modeling was relatively simple and effective, which demonstrates the potential this approach for simple estimation of local canopy heights of a particular type of forest of interest (e.g., mangroves) utilizing existing global canopy height maps. Figure 3 shows an example of the mangrove canopy height mapping results. As seen in this Fig., mangroves located along riverbanks/near river mouths were often taller than those located directly along/adjacent to the coastline.
The average mangrove canopy height in Mauritius, calculated based on the 65 GEDI LIDAR measurements, was 9.42 m, while the average canopy height value estimated by our Random Forest regression model at these same 65 locations was 9.37 m, indicating our results are slightly underestimated. Also, considering this average tree height value of ~9.42, the level of uncertainty of our modeling results (e.g., MAE = 3.43 m) is still somewhat high, probably due to the limited number of GEDI LIDAR samples available for model training. Our modeling results could potentially be further improved by incorporating additional sources of canopy height data for model training, e.g., airborne LIDAR data or field-based measurements of mangrove canopy height at selected locations. The main challenge to this would be the additional costs incurred for data collection.
Finally, as explained in Section 2.3., we applied an allometric equation (i.e., Equation 1 [22]) to convert all mangrove canopy height values to AGB values. Considering the estimated AGB values in the 242 ha of areas previously mapped as “Mangrove” by Koenig et al. [13], we estimated the total mangrove AGB in Mauritius in the year 2020 to be 15,696 Mg. Based on this, the average mangrove AGB of mangroves in Mauritius is estimated to be 64.86 Mg ha-1. Previous estimates of mangrove AGB in Mauritius have been obtained from various study sites, and found to vary significantly from site to site depending on mangrove tree age, e.g., from 19.42 to 461.88 Mg ha-1 [23], so our results suggest that most of the mangrove sites are relatively young (or degraded), which matches with the findings of a previous study in Mauritius [24]. Because the allometric equation used to calculate AGB in this study is based on field observations from Southeast and East Asian regions (due to lack of data specific to Mauritius), however, our AGB estimates should be interpreted with caution. Ideally, an allometric equation specific to Mauritius should be used for this, but the equations that currently exist for Mauritius require information on tree diameter at breast height (DBH) [23], which is not possible to accurately retrieve DBH using the available satellite remote sensing data.
4. Conclusions
We tested an approach for remote estimation of mangrove canopy height and AGB in Mauritius, which uses freely available satellite LIDAR, optical, and L-band SAR data. While the amount of satellite LIDAR-based mangrove canopy height measurements is still quite limited (n = 65), a Random Forest regression modelling approach allowed for estimation of mangrove canopy height and AGB at a reasonable level of accuracy (and within the ranges or previous estimates based on field survey data). Our approach had the benefit of utilizing solely freely available satellite data. However, to reduce the level of uncertainty of our regression modeling results, the freely available satellite LIDAR data from GEDI could be supplemented with field measurements of mangrove canopy height/AGB and/or airborne LIDAR data (which can cover smaller sites with a higher level of detail), to allow for better model training and validation.
References
- United Nations, ‘Paris Agreement’. 2015. [Online]. Available: https://unfccc.int/sites/default/files/english_paris_agreement.pdf. 2015.
- CBD, ‘CBD/COP/15/L.25’. 2022. Accessed: Jan. 26, 2023. [Online]. Available: https://www.cbd.int/doc/c/e6d3/cd1d/daf663719a03902a9b116c34/cop-15-l-25-en.pdf.
- C. C. Jakovac et al., ‘Costs and Carbon Benefits of Mangrove Conservation and Restoration: A Global Analysis’, Ecological Economics, vol. 176, no. March, 2020. March. [CrossRef]
- B. A. Johnson, P. Kumar, N. Okano, R. Dasgupta, and B. R. Shivakoti, ‘Nature-based solutions for climate change adaptation: A systematic review of systematic reviews’, Nature-Based Solutions, vol. 2, p. 100042, Dec. 2022. [CrossRef]
- N. Kumano, M. Tamura, T. Inoue, and H. Yokoki, ‘Estimating the cost of coastal adaptation using mangrove forests against sea level rise’, Coastal Engineering Journal, vol. 63, no. 3, pp. 263–274, July 2021. [CrossRef]
- H. Liu, K. Zhang, Y. Li, and L. Xie, ‘Numerical study of the sensitivity of mangroves in reducing storm surge and flooding to hurricane characteristics in southern Florida’, Continental Shelf Research, vol. 64, pp. 51–65, 2013. [CrossRef]
- R. Merven, C. Appadoo, V. Florens, and P. Iranah, ‘Dependency on mangroves ecosystem services is modulated by socioeconomic drivers and socio-ecological changes – insights from an insular biodiversity hotspot’, Human Ecology, vol. 51, no. 6, pp. 1141–1156, May 2023. [CrossRef]
- M. K. Nesha, Y. A. Hussin, L. M. Van Leeuwen, and Y. B. Sulistioadi, ‘Modeling and mapping aboveground biomass of the restored mangroves using ALOS-2 PALSAR-2 in East Kalimantan, Indonesia’, International Journal of Applied Earth Observation and Geoinformation, vol. 91, p. 102158, Sept. 2020. [CrossRef]
- R. Gupta and L. K. Sharma, ‘Mixed tropical forests canopy height mapping from spaceborne LiDAR GEDI and multisensor imagery using machine learning models’, Remote Sensing Applications: Society and Environment, vol. 27, p. 100817, Aug. 2022. [CrossRef]
- M. Santoro et al., ‘Design and performance of the Climate Change Initiative Biomass global retrieval algorithm’, Science of Remote Sensing, vol. 10, p. 100169, Dec. 2024. [CrossRef]
- N. Lang, W. Jetz, K. Schindler, and J. D. Wegner, ‘A high-resolution canopy height model of the Earth’, Nat Ecol Evol, vol. 7, no. 11, pp. 1778–1789, Nov. 2023. [CrossRef]
- M. Simard et al., ‘A New Global Mangrove Height Map with a 12 meter spatial resolution’, Sci Data, vol. 12, no. 1, p. 15, Jan. 2025. no. 1. [CrossRef]
- X. G. H. Koenig, P. N. K. Deenapanray, J.-L. Weber, S. Rakotondraompiana, and T. A. Ramihangihajason, ‘Are Neutrality Targets Alone Sufficient for Protecting Nature? Learning From Land Cover Change and Land Degradation Neutrality Targets in Mauritius’, Land Degradation & Development, vol. 36, no. n/a, pp. 265–280, 2025. [CrossRef]
- Republic of Mauritius, ‘Final Country Report of the LDN Target Setting Programme – Republic of Mauritius’. 2018. Accessed: Aug. 18, 2025. [Online]. Available: https://www.unccd.int/sites/default/files/ldn_targets/Mauritius%20LDN%20TSP%20Country%20Report.pdf.
- ‘Google Earth Engine’. Accessed: Aug. 13, 2025. [Online]. Available: https://earthengine.google.com/.
- L. Gao et al., ‘Remote sensing algorithms for estimation of fractional vegetation cover using pure vegetation index values: A review’, ISPRS Journal of Photogrammetry and Remote Sensing, vol. 159, pp. 364–377, Jan. 2020. [CrossRef]
- Q. Wang, S. Adiku, J. Tenhunen, and A. Granier, ‘On the relationship of NDVI with leaf area index in a deciduous forest site’, Remote Sensing of Environment, vol. 94, no. 2, pp. 244–255, Jan. 2005.
- L. Breiman, ‘Random Forests’, Machine Learning, vol. 45, no. 1, pp. 5–32, 2001.
- M. Belgiu and L. Drăguţ, ‘Random forest in remote sensing: A review of applications and future directions’, ISPRS Journal of Photogrammetry and Remote Sensing, vol. 114, pp. 24–31, Apr. 2016. [CrossRef]
- B. A. Johnson and Z. Xie, ‘Classifying a high resolution image of an urban area using super-object information’, ISPRS Journal of Photogrammetry and Remote Sensing, vol. 83, pp. 40–49, Sept. 2013.
- M. Hall, E. Frank, G. Holmes, B. Pfahringer, P. Reutemann, and I. H. Witten, ‘The WEKA Data Mining Software : An Update’, SIGKDD Explorations, vol. 11, no. 1, pp. 10–18, 2009.
- R. Suwa et al., ‘Mangrove biomass estimation using canopy height and wood density in the South East and East Asian regions’, Estuarine, Coastal and Shelf Science, vol. 248, p. 106937, Jan. 2021. [CrossRef]
- D. Ramdhun and C. Appadoo, ‘A contribution to understanding blue carbon sequestration and forest structure in mangroves of different ages in a small island ( Mauritius )’, Ocean Life, vol. 4, no. 2, pp. 74–81, 2020. [CrossRef]
- M. D. D. Doodee, S. D. D. V. Rughooputh, and S. Jawaheer, ‘Mangrove biomass productivity and sediment carbon storage assessment at selected sites in Mauritius: the effect of tidal inundation, forest age and mineral availability’, Environ. Res. Commun., vol. 7, no. 1, p. 015037, Jan. 2025. [CrossRef]
Figure 1.
Map of Mauritius showing where mangrove forests are generally located in the country (points shown rather than polygons, for easier visualization).
Figure 1.
Map of Mauritius showing where mangrove forests are generally located in the country (points shown rather than polygons, for easier visualization).
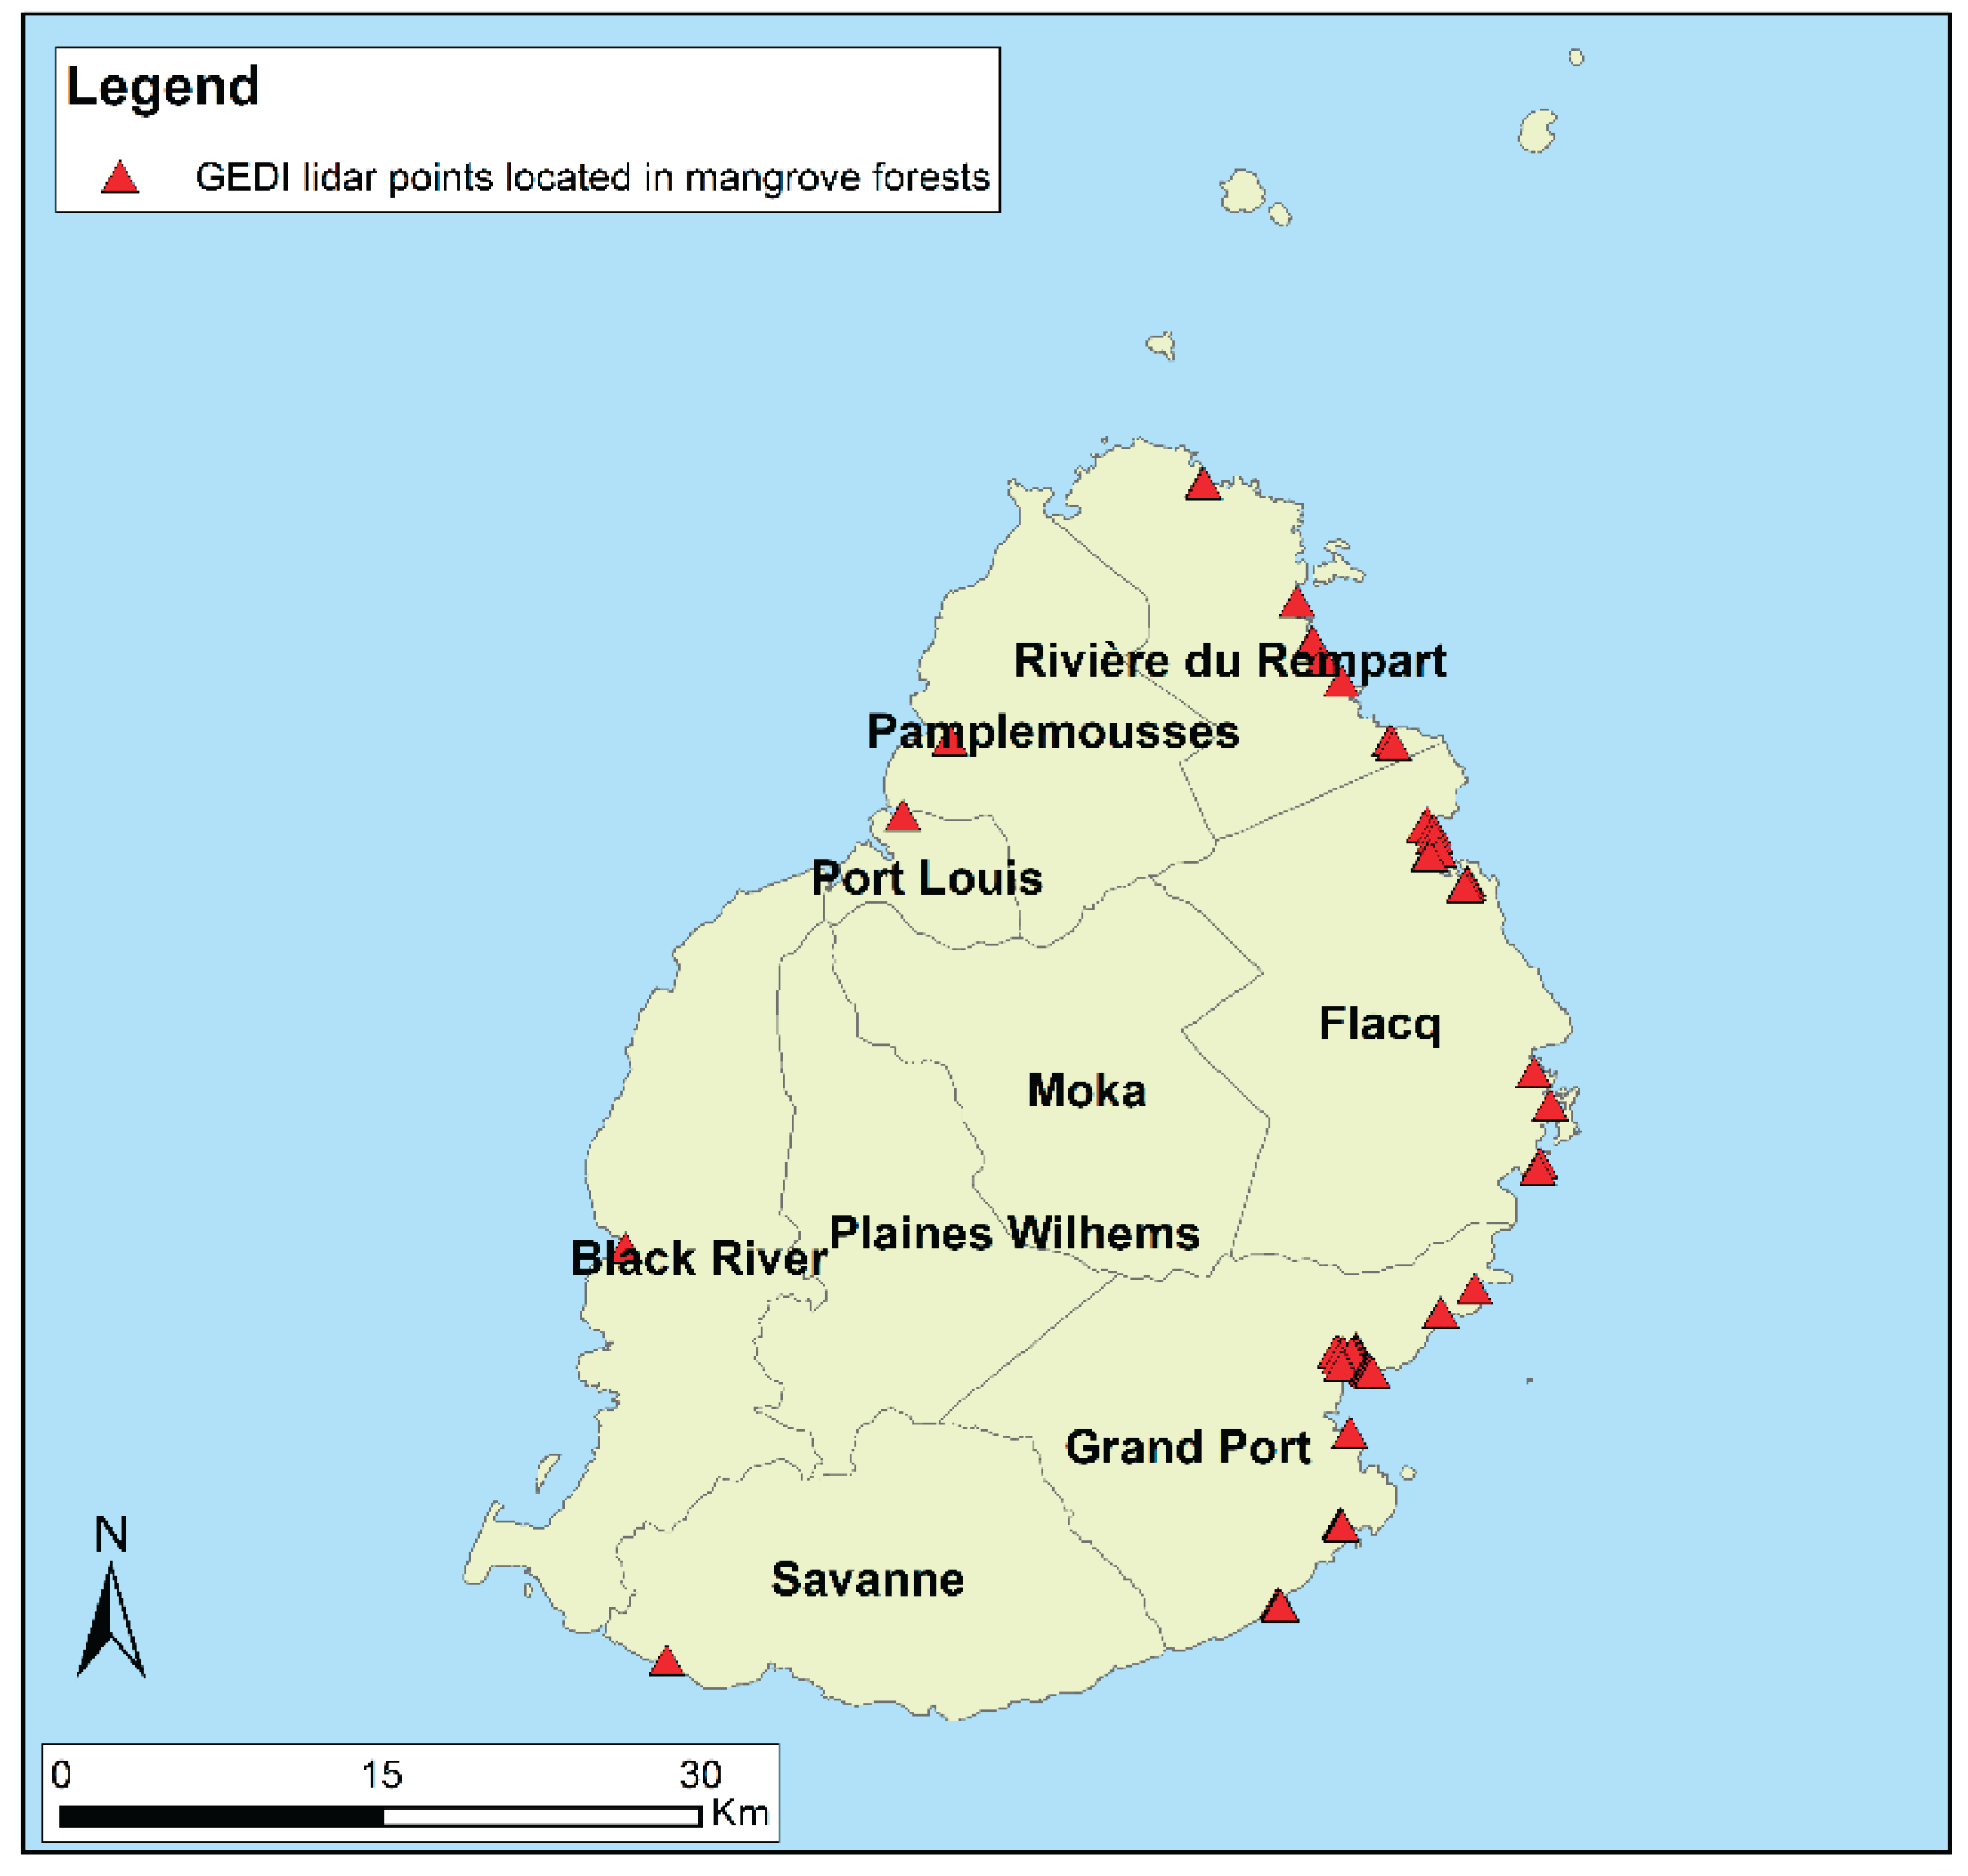
Figure 2.
GEDI LIDAR points in selected mangrove sites overlaid onto: visible imagery and a mangrove map produced in Koenig et al. [13] (a), Sentinel-2 maximum NDVI imagery (b), PALSAR-2 annual mosaic HV polarization imagery (c), and the global canopy height map produced in Lang et al. [11].
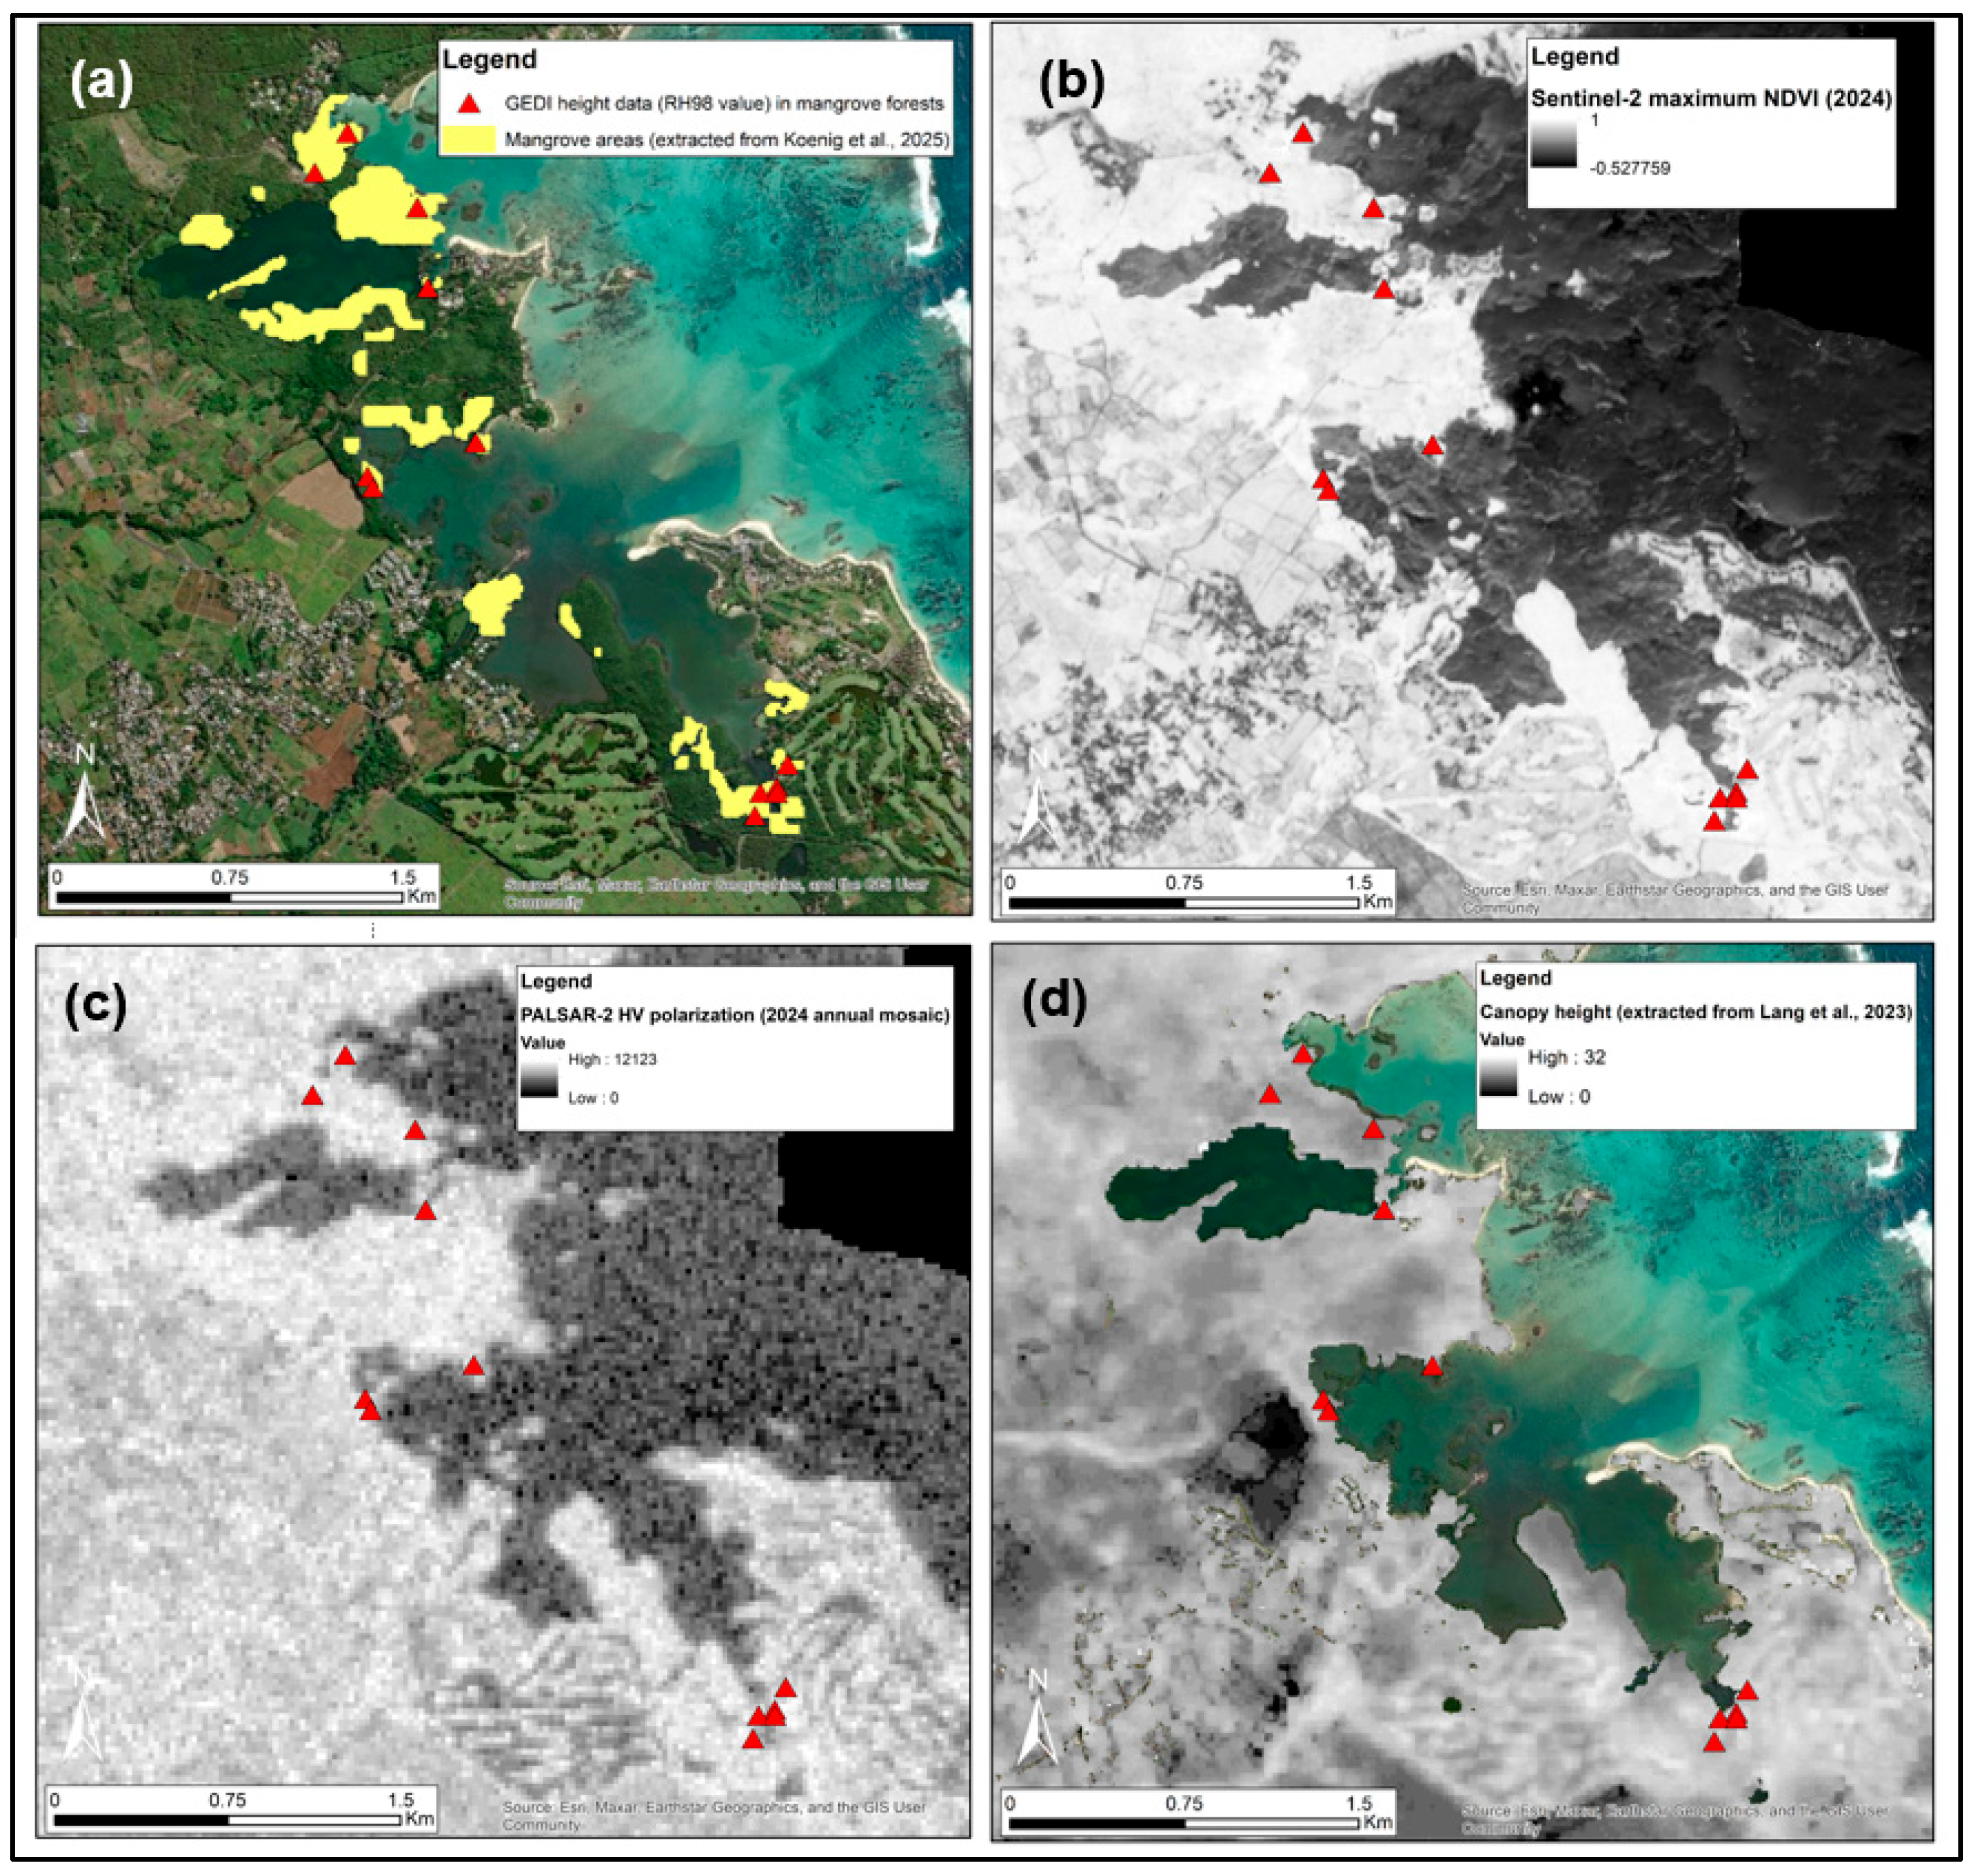
Figure 3.
Satellite imagery of an example mangrove site (a), and spatial distribution of mangroves with different canopy heights (b).
Figure 3.
Satellite imagery of an example mangrove site (a), and spatial distribution of mangroves with different canopy heights (b).
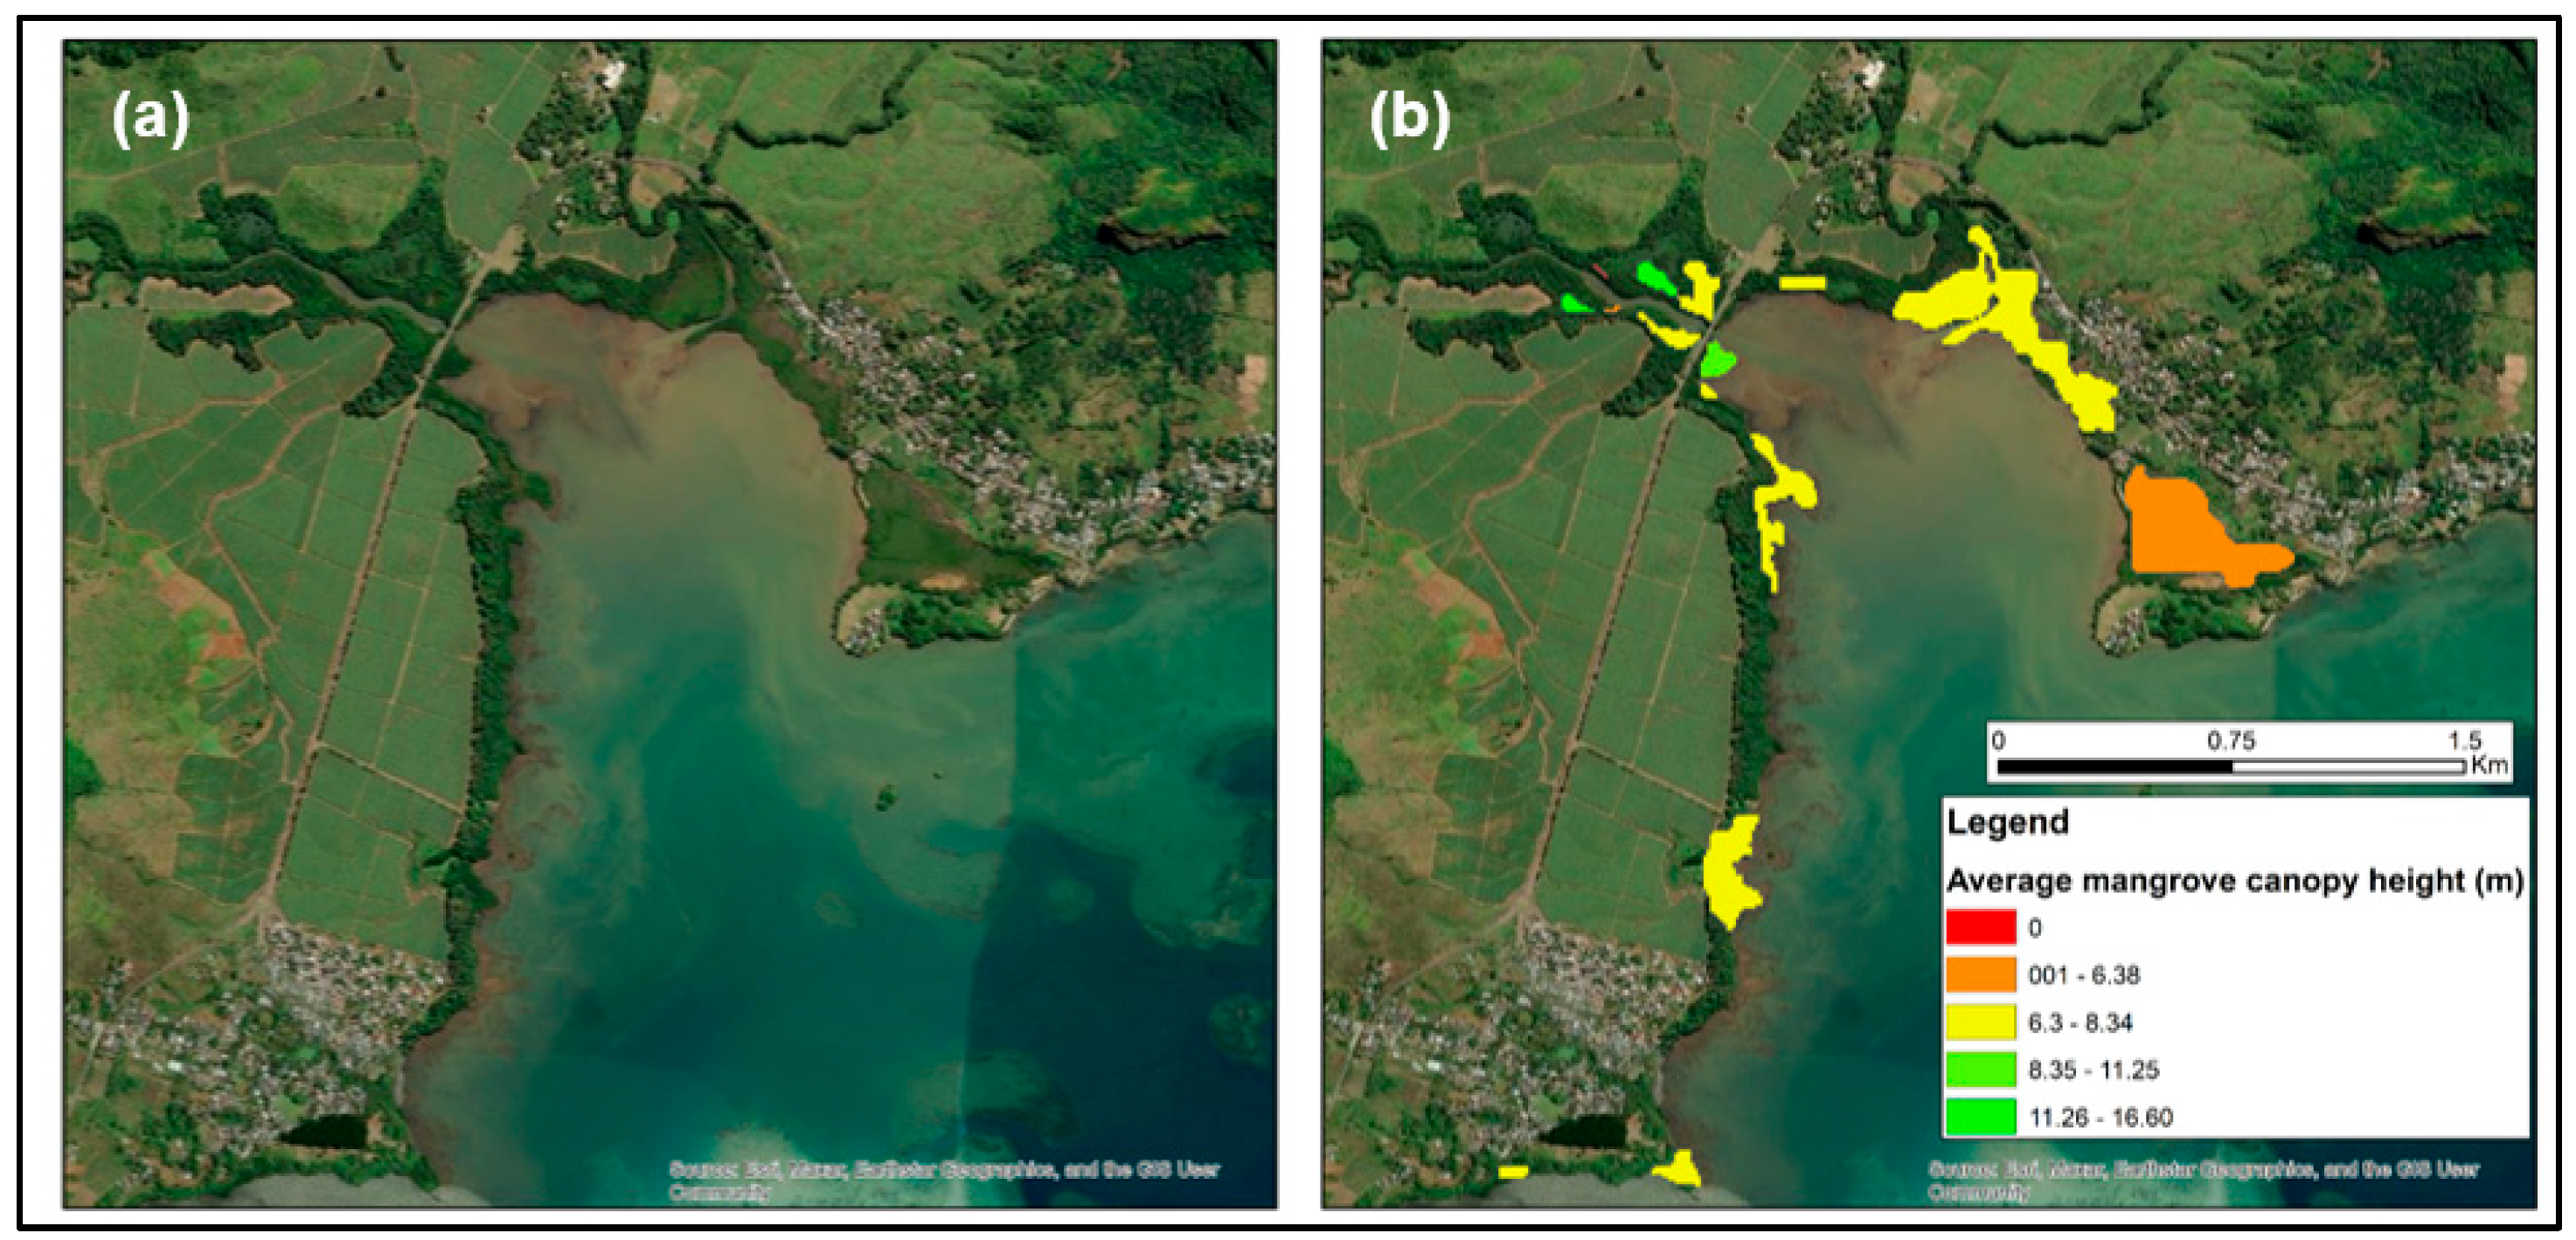

Table 1.
Datasets used in this study.
| Dataset | Usage in this study |
| Sentinel-2 multispectral imagery |
To calculate maximum annual NDVI (normalized difference vegetation index) value for the year 2024 |
| PALSAR-2 annual mosaic imagery |
To extract SAR backscatter at 25m resolution in HH and HV polarizations for the year 2024 |
| PALSAR-2 ScanSAR imagery |
To extract median and maximum SAR backscatter at 60-100m resolution in HH and HV polarizations for the year 2024 |
| GEDI LIDAR data |
To extract LIDAR canopy height measurements of mangrove forests (Relative Height 98% metric) |
| Global canopy height map | As additional input variable for regression modeling, and for comparison with our regression modeling results |
Table 2.
Accuracy of estimated mangrove canopy heights, considering GEDI LIDAR height values as reference data.
Table 2.
Accuracy of estimated mangrove canopy heights, considering GEDI LIDAR height values as reference data.
| Map | Mean Absolute Error |
Root Mean Square Error |
R | R2 |
| Random Forest model output (this study) |
3.43 m | 4.45 m | 0.68 | 0.46 |
| Global canopy height map from [11] |
4.38 m | 5.33 m | n/a | n/a |
| Linear regression model output (this study) |
3.64 m | 4.84 m | 0.58 | 0.34 |
Disclaimer/Publisher’s Note: The statements, opinions and data contained in all publications are solely those of the individual author(s) and contributor(s) and not of MDPI and/or the editor(s). MDPI and/or the editor(s) disclaim responsibility for any injury to people or property resulting from any ideas, methods, instructions or products referred to in the content. |
© 2025 by the authors. Licensee MDPI, Basel, Switzerland. This article is an open access article distributed under the terms and conditions of the Creative Commons Attribution (CC BY) license (http://creativecommons.org/licenses/by/4.0/).
Copyright: This open access article is published under a Creative Commons CC BY 4.0 license, which permit the free download, distribution, and reuse, provided that the author and preprint are cited in any reuse.


