
Submitted:
22 December 2025
Posted:
24 December 2025
You are already at the latest version
Abstract
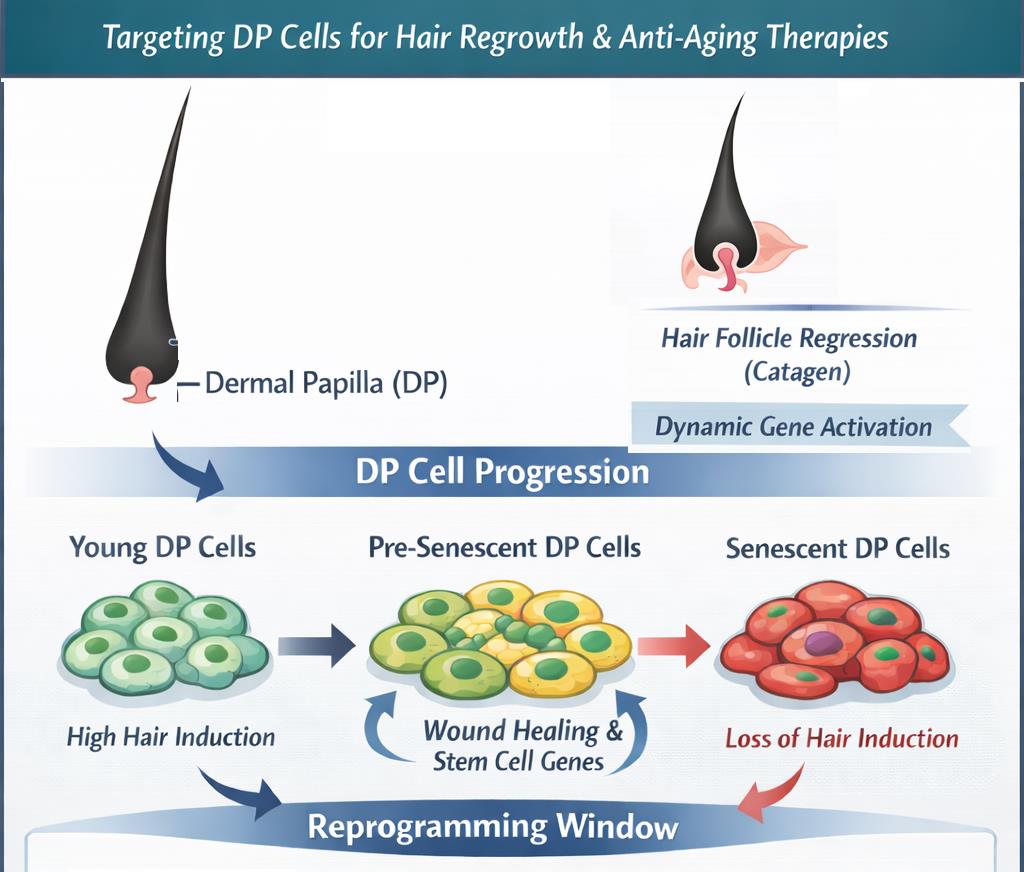
Adult stem cells are crucial for the regeneration of organs, such as hair follicles and skin, but the molecular pathways underlying their origin remain incompletely understood. The dermal papilla (DP), a mesenchymal component of the hair follicle, demonstrates significant plasticity and stem cell potential in vitro. DP cells are crucial for hair growth, but their inductive capacity is temporarily suppressed during the catagen phase or permanently lost in culture, leading to cellular senescence. This study examined the molecular signatures associated with DP cell plasticity and the capacity to maintain signals essential for initiating new hair follicle cycles. By culturing DP explants and propagating young cells, three DP cell populations were generated, each representing progressive loss of hair induction and increased senescence. Global gene expression analysis and data mining, combined with gene interactive networks, revealed a transient upregulation of wound healing and stem cell markers in pre-senescent DP cells. This upregulation coincides with the signatures characterising hair follicle regression, suggesting that dynamic changes in gene expression are closely linked to the plasticity and regenerative potential of DP cells. These findings indicate that the reprogramming window in DP cells could be leveraged for hair growth and skin rejuvenation strategies.
Keywords:
hair follicle
; dermal papilla
; cell reprogramming
; senescence
; skin rejuvenation
1. Introduction
Stem cells are of significant biomedical and industrial interest, offering an attractive system for tissue repair and treatment of injury. Such a notion applies to multiple tissues, where exogenous stem cells can restore damaged or non-functional biological systems such as the cornea, bone marrow, spinal cord or cartilage [1,2,3,4]. Stem cells are documented to reside in the human body throughout adulthood; one particularly well-studied regenerative system is the skin and its appendages, such as hair follicles [5]. The widely held notion that dermal fibroblasts can be considered adult stem cells of mesenchymal origin is supported by their remarkable plasticity and the capacity to undergo several differentiation programs [6,7]. Inter-follicular fibroblasts and follicular dermal papilla (DP) cells can partially differentiate into other cell types, such as adipocyte, osteoblast or myoblast [8,9,10,11]. This raises the question of whether pluripotent stem cells can originate in adult tissues from differentiated cells as a part of innate physiological and tissue repair processes.
The original study demonstrated the generation of induced pluripotent stem cells (iPSCs) from fibroblasts with a set of four reprogramming factors, Oct-4 (Pou5f1), Sox2, Klf4 and cMyc (OSKM), known as Yamanaka factors [12]. The standardised protocol has since been adopted by laboratories worldwide and is extensively used as a modern way to generate and explore pluripotent stem cells for the treatment of degenerative disorders or cancer [13,14]. Since the original discovery, multiple recent studies have also documented the reprogramming of fibroblasts to iPSCs using various small molecules. So far, the molecules have been characterised mostly in animal cellular models; they can act as epigenetic regulators and chemical replacers of the original OSKM factors; for example, inducing their expression or acting as modulators of cellular enzymes to facilitate the reprogramming. To date, only a handful of chemicals, such as Sodium butyrate or Parnate, have been identified as inducers of reprogramming in human cells, with the Oct-4 transcription factor central to the process [15].
Cell reprogramming is a promising current strategy for skin rejuvenation, paving the way for faster and cost-effective applications to sustain and enhance the innate regenerative capacities of the tissue. It has been demonstrated that young and aged fibroblasts respond differently to reprogramming factors, and reversing the phenotypes of senescent fibroblasts, which are thought to accumulate in ageing skin, is an attractive strategy for both the biomedical and cosmetic industries [16]. One striking model to study cell reprogramming and senescence is the dermal papilla (DP), comprised of the mesenchymal cells in the hair follicle bulb. In the skin, the major function of DP is hair induction, where the DP cells are thought to provide molecular signals to the surrounding epithelium in the active growth phase of the hair follicle cycle (anagen). This results in the proliferation and differentiation of hair follicle keratinocytes, leading to the formation of hair shafts [17]. DP cells are continuous with the second outermost mesenchymal component of the hair follicle, dermal sheath, and are thought to be engaged in the cellular exchange with the interfollicular dermal fibroblasts through migration or differentiation programs [18,19]. Although currently not characterised in detail, such a mechanism offers a likely explanation for the maintenance of dermal homeostasis, both during ageing and skin repair after injury [20,21].
Numerous studies have demonstrated that the inductive capacity of DP cells is maintained because of the interactions with the epithelium during anagen [22]. Loss of the mesenchymal-epithelial interactions, which can be brought about by culturing DP explants in vitro, is associated with the rapid transition of DP cells to a non-inductive state and acquisition of a senescent phenotype [23]. Gene expression analysis also documented that such a loss of induction is characterised by the presence of the biomarkers defining the regression phase (catagen) of the hair follicle cycle [24]. Studies performed so far have documented that the inductive capacity of DP cells can be partially restored early on by extrinsic small molecule factors or specific cell culture techniques, which are centred around the intrinsic capacities of DP to initiate the new regenerative phase during each cycle of the follicle [25,26,27].
This raises a question about poorly characterised biological activities and molecular signatures of non-inductive or senescent DP cells. Understanding these factors can contribute to wider applications of hair growth and skin rejuvenation, in particular, through the likely effect on the biomarkers driving the regeneration of skin and its appendages. This study utilised the system of DP explants and the cells that have been expanded and serially passaged until reaching senescence. Stimulation of wound healing responses in these cellular populations and transcriptional analysis revealed gene networks consistent with transient expression of stem cell markers that overlap with loss of hair growth markers and increased inflammation and precede the acquisition of senescent phenotypes. These signatures could represent the events of cellular reprogramming during hair follicle degeneration/regeneration cycles and have the potential to be explored for skin repair and rejuvenation applications.
2. Materials and Methods
2.1. Dermal Papilla Cultures
Dermal papilla (DP) cultures were established in the Laboratory of Prof. Angela Christiano, Columbia University. The Laboratory received an Institutional Review Board exemption to use discarded tissue obtained from occipital scalp samples during hair transplantation surgery. The discarded tissue was designated as non-human subject research under 45 CFR Part 46, as described previously (https://doi.org/10.1073/pnas.1309970110) [97]. Intact dermal papillae were isolated from the end bulbs of 6-8 hair follicles of the donor using 27G needles and transferred to 35 mm tissue culture dishes under a dissecting microscope. The DP samples were then cultured in Dulbecco’s Modified Eagle Medium (DMEM) containing 20% fetal calf serum (FCS) and penicillin/streptomycin for 7 days; during this time, the cells migrated out from the explant and filled the dish (Expl). The cells were subsequently passaged at a ratio of 1:2 in DMEM with 10% FCS, with passages 3 (p3) and 5 (p5) retained for analysis. The images of the cultures were captured with light microscopy.
2.2. Microarray Analysis
For the gene expression analysis, the Expl, p3 and p5 DP samples from up to 3 donors were cultured in growth media with low (0.1%) FCS for 24 hours, followed by re-stimulation with growth media supplemented with 10% FCS for 3 hours. RNA was extracted from all samples using the mRNA micro kit (Qiagen), then amplified using the two-cycle 3’IVT amplification kit (Affymetrix) to produce biotin-labelled cRNA. 15 mg of fragmented cRNA was subsequently hybridised onto Affymetrix U133 plus 2.0 gene chips for microarray analysis following standard protocols, resulting in transcriptome CEL files.
2.3. Transcriptome Analysis Console
The analysis of microarray data output was performed with the Transcriptome Analysis Console (TAC, Applied Biosystems). A total of 54,613 genes on the list were analysed for each uploaded file, against the hg19 (Homo sapiens) genome version, with labelling and hybridisation controls (3’ and 5’ threshold). Changes in the biomarker expression were compared for the sample pairs p3 versus Explant and p5 versus Explant, with Log2 output values and fold-change values obtained for each transcript. Differentially expressed genes were identified based on a differential cutoff for gene-level fold change < -2 or > 2 and p-value < 0.05. For distribution and patterns of differentially expressed genes, scatter plot (1 Avg [log2] vs 2 Avg [log2]) and hierarchical clustering were obtained for each comparison group.
2.4. String Gene Clustering Analysis
The gene lists from TAC analysis were next examined for protein interactions using the STRING (Search Tool for the Retrieval of Interacting Genes/Proteins) database. The screening incorporated active interaction sources based on text mining, experimental data, co-expression, neighbourhood, gene fusion, and co-occurrence. The analysis included functional and physical protein interactions with a medium-confidence (0.400) score, generating nodes and edges with PPI enrichment p-value <1.0e-16. The resulting gene networks were then subjected to enrichment analysis, with defined clusters identified based on the k-means clustering algorithm. Molecular interactions and functional involvement of the biomarkers in each cluster were subsequently identified using Reactome pathways, which ranged from 6 to 120 pathways per cluster.
2.5. Construction of Gene Networks in Cytoscape
The nodes and one-way edges group outputs, corresponding to four clusters (Development, Proliferation, Inflammation and ECM) from the STRING analysis, were subsequently uploaded to Cytoscape. The resulting network was then merged with the node tables generated in the TAC analysis for p3 v Expl and p5 v Expl samples, with fold changes for each gene in the dataset. The continuous mapping labels from -5 to 5 were applied to highlight the differences in relative levels of expression. The analysis was then repeated for each representative cluster. Network topology filters based on the set number of neighbours and the measurements of node closeness centrality were applied to identify the biomarkers with the most pronounced effects on the network.
2.6. Topology of the Nodes with Variable Significance
The final biomarkers with the highest impact on the networks and relevance to biological processes associated with stem cell function, inflammation, proliferation and ECM remodelling were assembled in high-confidence (0.700) functional networks following k-means clustering. To identify key nodes impacting information transmission within networks and connections between different biomarker groups based on network centralities, the following algorithms were applied: 1) Average shortest path length (ASPL), the average distance between any two nodes, with significant nodes on the shortest paths; 2) Betweenness centrality, the number of shortest paths passing through a node; 3) Node degree, the number of neighbours for each node; and 4) Nodes with low radiality, the number of nodes accessible from a central node, for their potential to connect different clusters or subnetworks.
2.7. PCR Analysis
RNA extracts were prepared from DP Explant, passage 3 and passage 5 using the RNeasy kit (Qiagen). The concentration and purity of the samples were determined using a BioMate 3 spectrophotometer with v.2 software (Thermo Scientific). 1.5 mg RNA was converted into cDNA using the GoScript Reverse Transcription System, and PCR reactions were performed using the PCR Master Mix (Promega) and specific primers (Invitrogen). The primer sequences were: GAPDH forward 5’-TGATGACATCAAGAAGGTGGTGAAG-3’; GAPDH reverse 5’-TCCTTGGAGGCCATGTGGGCCAT-3’; MYC forward 5’-ACTCTGAGGAGGAACAAGAA-3’; MYC reverse 5’-TGGAGACGTGGCACCTCTT-3’; KI67 forward 5’-AGGCACTTTGGAAGGTGTGAGG-3’; KI67 reverse 5’-CAAGGAGGGTTGTGTAGAAGTGG-3’. The PCR reaction conditions were: 2 min 95 °C, 30 sec 95 oC, 30 sec 55 oC, 30 sec 72 oC, 35 cycles, 5 min 72 oC. The amplified products were resolved on 1% agarose gel and visualised with ethidium bromide under UV. The microphotographs were analysed for the density of the band using ImageJ software.
3. Results
3.1. Construction of the Functional Gene Networks
To gain an insight into the molecular signatures of dermal papilla (DP) cells undergoing a transition from three-dimensional (3D) hair-inductive phenotype to non-inductive and senescent phenotypes, the dermal papillae were dissected from hair follicles, and the explants (Expl) were placed onto a 35 mm cell culture dish for cell expansion in vitro. In this system, the cells migrated out of the explant and proliferated until becoming confluent. The cells were subsequently passaged, resulting in a proliferative population at passage 3 (p3) and a non-proliferative population with enlarged cells at passage 5 (p5; Figure 1A).
It could be hypothesised that cell migration and proliferation outside the explant represent the wound-healing events that occur upon loss of mesenchymal-epithelial interactions and hair-inductive activity. Previous studies also documented that the exposure of fibroblasts to serum induces gene expression profiles similar to wound healing responses, particularly for early growth response and proliferation markers [28]. Accordingly, the quiescent Expl, p3 and p5 DP cells were cultured in low (0.1%) serum growth media for 24 hours, followed by re-stimulation with growth media supplemented with 10% serum for 3 hours. The microarray analysis was performed on the HG-U133 Plus 2.0 array type. The resulting CEL files were uploaded to the Transcriptome Analysis Console (TAC, Applied Biosystems), and gene expression analysis was performed for 54,613 genes against the hg19 (Homo sapiens) genome version. Changes in gene expression were obtained from the comparisons of the samples p3 versus Expl and p5 versus Expl, with the analysis setting a cutoff for gene-level fold change < -2 or > 2 and gene-level p-value < 0.05.
The significantly altered genes could be identified; the p3 versus Expl comparison sample had a total of 2444 (4.48%) such genes, with 1887 genes (3.46%) upregulated and 557 genes (1.02%) downregulated. The p5 versus Expl comparison sample had a total of 3353 (6.14%) significantly altered genes, with 2614 genes (4.79%) upregulated and 739 genes (1.35%) downregulated (Figure 2A). Scatter plots and hierarchical clustering showed the distribution and patterns of differentially expressed genes, with a relatively higher proportion of the upregulated genes (Figure 1B&C, red label- upregulated genes, blue label- downregulated genes).
The gene lists generated in the TAC analysis were subsequently uploaded to the STRING (Search Tool for the Retrieval of Interacting Genes/Proteins) database for examination of known and predicted protein interactions. Active interaction sources included text mining, experimental data, co-expression, neighbourhood, gene fusion and co-occurrence. The analysis conditions were set for a full network type, including functional and physical protein interactions, with a medium confidence (0.400) interaction score. The p3 versus Expl samples returned 1732 nodes and 16,086 edges, with PPI enrichment p-value <1.0e-16. Enrichment analysis of this gene network was performed based on the k-means clustering algorithm, with 9 clusters defined based on their centroids and containing 150-200 genes each.
Each cluster could then be defined by Reactome pathways, combining the data on both the molecular interactions between the biomarkers and their functional involvement in biological processes. The gene enrichment could identify each cluster as follows: 1) Metabolism of RNA; 2) Signal transduction; 3) Metabolism of proteins; 4) Energy metabolism; 5) Cytokine signalling; 6) Extracellular matrix; 7) Membrane trafficking; 8) Tissue development and 9) Cell cycle (Figure 2A). The clusters significantly differed in the quantity of Reactome pathways they contained, ranging from 6 to 120 pathways. The most profound enrichment in the pathways could be observed in the following clusters: Cytokine signalling (120 pathways), Cell cycle (103 pathways) and Tissue development (43 pathways, Figure 2B).
When the STRING analysis was performed on the p5 versus Expl samples, it returned 2000 nodes and 22,503 edges, with PPI enrichment p-value <1.0e-16. The k-means clustering of this gene network into 9 clusters based on both physical and functional interactions revealed a striking shift in the quantities of Reactome pathways in several clusters. For example, the k-means analysis did not return the Tissue development cluster in p5 versus Expl, and the number of Reactome pathways was reduced, compared to p3 versus Expl, in the following clusters: Metabolism of RNA (5 pathways) and Cytokine signalling (41 pathways). In contrast, several clusters were enriched in the Reactome pathways, namely Signal transduction (204 pathways), Energy metabolism (197 pathways), Extracellular matrix (20 pathways) and Cell cycle (246 pathways). This indicated that the p3 versus Expl sample had a robust biological activity centred around developmental processes and inflammation, and that this pattern was likely altered in the p5 versus Expl sample, indicated by significantly reduced numbers of Reactome pathways.
3.2. Gene Interaction Networks Reveal Discrete Clusters Relevant to Response to Injury and Tissue Regeneration in Cultured DP Cells
To gain further insight into the gene signatures characterising populations of cultured DP cells, the pathways defined through the STRING k-means clustering were then analysed, focusing on the enriched networks relevant to hair follicles, response to injury and tissue regeneration. Initially, Hair Follicle Development pathways, namely Organogenesis (WikiPathways, WP2839) and Cytodifferentiation (WP2840) were identified in the global gene network obtained in the STRING analysis before clustering. Subsequently, the Reactome pathways were identified and pulled together from several clusters. Cluster 5 (Cytokine signalling) was enriched in the Innate Immune System (HSA-168249), Cytokine Signalling in the Immune System (HSA-1280215), Signalling by Interleukins (HSA-449147), Interleukin 6 Family Signalling (HSA-6783589), Interleukin 10 Signalling (HSA-6783783) and Regulation of Complement Cascade (HSA-977606). Cluster 6 (Extracellular matrix) was enriched in Crosslinking of Collagen Fibrils (HSA-2243919), Elastic Fibre Formation (HSA-1566948), Molecules Associated with Elastic Fibres (HSA-2129379), Collagen Formation (HSA-1474290), Organisation of Extracellular Matrix (HSA-1474244), Assembly of Collagen Fibrils (HSA-2022090), Collagen Biosynthesis and Modifying Enzymes (HSA-1650814), Collagen Chain Trimerization (HSA-8948216) and Degradation of Extracellular Matrix (HSA-1474228). Cluster 8 (Tissue development) contained Embryonic Stem (ES) Cell Reprogramming (WikiPathways, WP3299) and Developmental Biology (Reactome HSA-1266738). Finally, Cluster 9 (Cell cycle) contained the pathways describing Cell Cycle (HSA-1640170) and Senescence (HSA-2559583).
The STRING analysis outputs containing nodes and one-way edges (A-B) were then exported to Cytoscape, an open-source software platform to visualise the networks. Each network belonged to one of the four clusters identified in the STRING: Development (65 nodes, 166 edges), Proliferation (165 nodes,1126 edges), Inflammation (159 nodes, 852 edges) and Extracellular matrix (159 nodes, 632 edges).
The resulting Cytoscape-merged network incorporated all unique and duplicated nodes and edges and contained a final 251 nodes and 1795 edges. The network was subsequently merged with node tables containing fold changes in the expression of all genes generated from TAC analysis for p3 versus Expl and p5 versus Expl comparison samples. The changes in relative expression levels were highlighted with continuous mapping labels, with blue representing down-regulated genes and red representing up-regulated genes, with minimum to maximum relative fold changes equal to -5 to 5 assigned for the labels (Figure 3).
Both networks had a distinctive arrangement of the four gene clusters, with the biomarkers of Development (Cluster 1) directly linked to and positioned between the biomarkers of Proliferation (Cluster 2) and Inflammation (Cluster 3). Cluster 3 was further associated with the biomarkers of the Extracellular matrix (Cluster 4). Many genes were, as expected, also shared between the clusters. A comparison between both networks revealed that the Development cluster was more enriched in p3 v Expl than in p5 v Expl, which was significantly disrupted and largely disconnected from the Inflammation cluster. The Inflammation cluster was also enriched in upregulated genes in younger DP passages, with a total of 81 nodes and 564 edges in p3 v Expl and 58 nodes and 336 edges in p5 v Expl networks. In contrast, the older DP passages were enriched in the genes with downregulated expression in the Proliferation cluster, with a total of 62 nodes and 597 edges in the p5 v Expl network and 45 edges and 352 edges in the p3 v Expl network (Figure 3A&B). These data suggested that DP cells have distinctive transcriptional signatures in response to serum stimulation that differ between freshly explanted and passaged young and aged populations.
3.3. Cultured DP Cells Transiently Express Stem Cell Markers Indicative of Tissue Regenerative Capacity upon Loss of Hair Induction
3.3.1. Hair Follicle Development Network
To visualise the Hair Follicle Development gene networks, the biomarker networks identified in STRING were imported to Cytoscape and combined with node tables containing gene fold expression from TAC analysis (Figure 4A).
Measurements of node centrality in the p3 v Expl network (25 nodes, 74 edges) revealed the most important nodes as LEF1, SOX9, GLI2, DKK1 and LGR5, with closeness centrality 0.7-0.6. The LEF1 node also had the highest score for betweenness centrality in the network, indicative of the strong influence of this node over a flow of information in the graph. LEF1 is a transcription factor with an important role in hair follicle development and the growth phase (anagen) of the hair follicle cycle [29]. GLI2 is a transcription factor with an essential role in hair follicle development, and LGR5 (UniProt O75473, Leucine-rich repeat-containing G protein-coupled receptor 5) is a marker of stem cells in hair follicles, crucial for hair follicle morphogenesis and maintenance [30,31]. All three biomarkers were downregulated in passaged DP compared to Explant, with LEF1 decreasing further, 4-fold in p5 v Expl compared to p3 v Expl (Figure 4A). These nodes were indicative of the progressive loss of hair-inductive capacity by cultured DP cells. This conclusion was further supported by the upregulated expression of DKK1 and SFRP1 near this cluster. Both genes have documented roles in suppressing hair follicle development and promoting catagen, hair follicle regression [32,33]. In TAC analysis, DKK1 was upregulated from 11-fold in p3 v Expl to 41-fold in p5 v Expl, whilst SRFP1 was increased >2 fold.
One striking feature of the passaged DP cells gene network was the presence of additional nodes in proximity to LEF1, GLI2, LGR5 and DKK1 clusters in the p3 v Expl network. The nodes, namely SOX9, NOTCH2, FZD1 and RUNX2, denoted the genes with increased expression that were either downregulated or absent in the p5 v Expl network (19 nodes, 46 edges). SOX9 plays a role in maintaining hair follicle stem cells and promoting hair follicle growth [34]. Both NOTCH2 and FZD1 have a function in the maintenance of hair follicle structure and morphogenesis [35,36]. RUNX2 has a documented role in hair follicle development and maturation [37]. (Table 1).
Some of the biomarkers present in the Hair Follicle Development networks also play important roles in stem cell biology. LEF1 can determine cell fate in multipotent skin stem cells, whilst NOTCH2 and FZD1 are responsible for the maintenance of the stem cell pool, activity and lineage specification [38,39,40]. MSX2 has a role in hair follicle morphogenesis, and it also initiates and accelerates the specification of mesenchymal cells [41,42]. MYC has a documented function in hair follicle development and in promoting somatic cell reprogramming to pluripotency [43,44]. EGR2 is involved in dermal cell fate during hair follicle development and stem cell lineage commitment and differentiation [45,46]. (Table 2).
3.3.2. Stem Cell Network
To further expand on this, the STRING Tissue Development networks containing ES Cell Reprogramming and Developmental Biology were imported to Cytoscape and merged with node tables containing gene fold expression from TAC analysis (Figure 4B).
Measurements of node centrality in the p3 v Expl network (28 nodes, 73 edges) revealed MYC and KLF4 as the most important nodes, with closeness centrality of 0.87 and 0.62, respectively. MYC biomarker also had the highest score for betweenness centrality (0.67) and number of edges (24). Both MYC and KLF4 were upregulated in p3 DP cells compared to the explant; however, MYC was absent and KLF4 decreased in p5 v Expl network (12 nodes, 18 edges), indicative of the major effect of these nodes in transcriptional patterns of young passaged cells. Both MYC and KLF4 are highly expressed in embryonic stem cells and belong to the original set of reprogramming factors or pluripotency-associated genes, including the reprogramming of dermal papilla cells to iPSCs [12,47]. Increased expression of MYC and KLF4 in p3 DP cells suggests their capacity to undergo a reprogramming process.
MYC node was closely linked to several stem cell markers present uniquely in the p3 v Expl network. In addition to LEF1, SOX9 and EGR2, the MYC node formed part of the network comprised of the biomarkers involved in stem cell survival, self-renewal and lineage commitment [48,49,50,51,52]. This group included transcriptional regulators PAK 2, EGR1, SMAD3, EBF1 and KLF5. Other genes, such as CCL2 and LIF, were significantly up-regulated in p3 v Expl compared to p5 v Expl network, up to 83-fold and 15-fold, respectively. CCL2 and LIF are cytokines secreted by mesenchymal stem cells and involved in the chemoattraction of immune cells to the sites of injury and wound healing, with LIF playing a major role as a morphogenic factor in the maintenance of pluripotency [53,54]. (Table 1).
Several of the genes in this group have been documented to have activity in controlling hair follicle regeneration cycles. EGR1 promotes the proliferation of dermal papilla cells through transcriptional control of BMP7 (Bone morphogenic protein 7) and is associated with hair follicle development [55]. SMAD3 promotes hair follicle regeneration via TGFb2 (Transforming growth factor b2) and transition from telogen to anagen in the hair cycle [56]. EBF1 supports the anagen phase of the hair follicle cycle, and CCL2 has a role in immune regulation and enhancement of hair regeneration [57,58]. KLF4 can inhibit hair follicle regeneration by arresting the hair growth cycle in telogen and early anagen phases [59]. Interestingly, the biomarker with significantly upregulated (20-fold) expression in the p5 v Expl network was DPP4. DPP4 has been identified as a profibrotic factor linked to hair follicle growth arrest and alopecia [60] (Figure 4B and Table 2).
This analysis suggested that stimulation of wound healing responses in DP cells in culture was associated with acquiring the molecular signatures consistent with stem cell activation. Such patterns could be revealed upon cellular transition from the explant to early passages in the p3 v Expl network and accompanied by the expression of hair follicle markers characteristic of partial loss of induction and entry into catagen. A decrease in node quantities in p5 v Expl networks suggests that the potential tissue repair and regenerative capacity would be transient in this system.
3.4. Expression Patterns of the Inflammation and Senescence Markers Become Uncoupled in Cultured Young and Aged DP Cells
The Hair Follicle Development and Stem Cell network was located between and directly connected via several nodes to two clusters, namely Inflammation and Proliferation, in the initial DP transcriptional network comprised of additional nodes (Figure 3 A&B, clusters 1-3). To gain further insight into significant gene interactions within these networks, the STRING Inflammation, Proliferation and Extracellular matrix networks were imported to Cytoscape for further analysis. Given the extent of the information within these networks, with ¬160 nodes and up to 1100 edges, the network topology filter was applied, selecting the most significant nodes based on the set number of neighbours. The networks were then combined with node tables containing gene fold expression of p3 v Expl and p5 v Expl comparison samples from TAC analysis.
3.4.1. Inflammation Network
The inflammation network for the p3 v Expl comparison sample contained 21 nodes and 153 edges, with at least 19 neighbours per node after applying a topology filter (Figure 5).
The nodes with the top closeness centrality between 1 and 0.95 were CXCL1, MMP9, CXCL8, IL6 and CCL2. CXCL1 and CXCL8 are chemokines responsible for the recruitment of inflammatory cells and are crucial in facilitating the wound healing process [61].
CCL2 is a proinflammatory cytokine that promotes wound healing through macrophages [62]. MMP9 is a tissue remodelling enzyme; the expression of the protein is increased in fibroblasts in response to injury and stress [63]. IL6 is a key inflammatory cytokine expressed by fibroblasts; IL6 can be a key factor driving fibrosis [64]. The expression of these biomarkers was decreased or maintained at a similar level between the two networks, except IL6, which was upregulated from 14-fold in p3 v Expl to 30-fold in p5 v Expl. Among other markers, ICAM1 and VCAM1, both cell surface glycoproteins, increased up to 16-fold in p3 v Expl but were absent from the p5 v Expl network. ICAM1 and VCAM1 are the receptors that mediate the adhesion of immune cells to endothelial cells and fibroblasts as part of cellular responses to injury and progression of inflammation [65,66] (Table 3).
Compared to p3 v Expl, the p5 v Expl network contained less information, with 15 nodes and 84 edges, indicative of a significant decrease in the inflammation markers in older passages of DP cells (Figure 5).
The inflammation markers can also affect the regeneration of the hair follicle. CXCL1 and CXCL8 were shown to inhibit the growth and maintenance of hair follicles, for example, inducing catagen and delaying the transition between telogen and anagen [67,68]. MMP9 activity fluctuates during the hair follicle cycle and may play a role in ECM remodelling during the anagen phase [69]. IL6 can inhibit cell proliferation and hair growth and promote regression of hair follicles [70]. ICAM1 may play a role in late anagen and catagen of the hair follicle cycle and be involved in follicle regression [71]. (Table 2)
3.4.2. Proliferation and Extracellular Matrix Networks
The Proliferation network for the p3 v Expl comparison sample contained 17 nodes and 113 edges, with at least 22 neighbours per node after applying a topology filter.
The nodes with the top closeness centrality of 1 were CDC6, CCNB1, CHEK1, CCNA2 and CDK1, with all biomarkers decreased in expression (Figure 6). The p5 v Expl contained 22 nodes and 193 edges, with CCNB2 and CCNE2 as additional significant nodes and further downregulation of gene expression, up to 5-fold, compared to p3 v Expl. CDC6, component of the pre-replication complex, is one of the key regulators of DNA replication, coordinating S-phase and mitosis during the cell cycle [72]. CCNA2 is implicated in the initiation and progression through DNA synthesis, whilst CCNB1 and CCNB2 control the G2/M phase of cell cycle progression by binding to and activating CDK1. All biomarkers are downregulated with the execution of the senescence programme in fibroblasts [73,74]. CCNE2 controls G1/S-phase during the cell cycle and is inactivated in senescent fibroblasts [73,75].
In hair biology, upregulated levels of CDC6 protein can prolong the telogen phase of the hair follicle cycle [76]. CCNA2 can play a positive role in the development of hair follicles and hair density; increased levels of both CCNA2 and CCNB1 proteins may be associated with the promotion of anagen signalling [77,78]. Expression of CDK1, CCNB1 and CCNB2 was also identified to be increased during the anagen phase and down-regulated in regressing and resting hair follicles [79]. (Table 4)
The Extracellular matrix network for the p3 v Expl comparison sample contained 17 nodes and 97 edges, with at least 14 neighbours per node after applying a topology filter. The nodes with the top closeness centrality between 1 and 0.9 were FN1, ELN, COL3A1,1, LOX and LOX1 (Figure 6B). FN1, a high molecular weight glycoprotein, is an adhesive protein that binds to the surface of cells, facilitating their movement and alteration of shape. FN1 molecule forms fibrillar complexes with other proteins and is involved in tissue repair [80]. FN1 biomarker expression was upregulated in both p3 v Expl and p5 v Expl networks. ELN forms the main component of elastic fibres, providing elasticity and structural integrity to the skin. Production of ELN protein in the skin decreases with age, and alteration of the elastic fibre network can be detrimental to wound healing, resulting in scars [81]. COL3A1 constitutes one of the major fibrillar collagens that regulates the formation of type 1 collagen fibrils that strengthen the skin. The expression of both collagens decreases in the dermis with age [82]. LOX, extracellular copper enzyme, and LOXL1, copper-dependent monoamine oxidase, are responsible for the biosynthesis of elastin and cross-linking of collagen proteins, providing strength to connective tissues [83]. The biomarkers play a major role in the stabilisation and remodelling of the ECM and are crucial to the process of regeneration and wound healing [84]. Expression of ELN, COL3A1, LOX and LOX1 was decreased or absent in the p5 v Expl network. Another biomarker that was significantly upregulated in p3 v Expl and absent in p5 v Expl network was THBS2, an adhesive glycoprotein that modulates cell-matrix interactions and collagen fibrillogenesis, increasing the tensile strength of the skin [85].
The p5 v Expl network contained 15 nodes and 73 edges (Figure 6B). In this network, the nodes with the highest closeness centrality (1-0.9) were FN1, TIMP1, TIMP2 and TIMP3. TIMPs are secreted proteins that modulate the activity of MMPs (Matrix metalloproteinases) and the integrity of the ECM. Three MMPs were also present in the network, namely MMP1, MMP3 and MMP12, which are involved in the proteolytic remodelling of ECM. Expression of MMP1 and MMP2 is upregulated by stress responses and ageing, leading to fragmentation of collagen, whilst MMP12 is a major protease responsible for elastin degradation [86,87]. All biomarkers were upregulated up to 12-fold in the p5 v Expl network.
Some of the ECM markers also have a function in hair follicle cycling and regeneration (Table 2). FN1 may cooperate with other genes to control the hair thickness [88]. LOXL protein may be involved in hair follicle regeneration and cycling, linked to the maintenance of elastin and collagen levels in the skin [89]. Expression and activity of MMP2 are increased in anagen and decreased in catagen and telogen of the hair growth cycle. Levels of TIMP1 and TIMP2 proteins are inversely correlated with these events [69]. In contrast, the expression of TIMP3 is upregulated at the beginning of anagen and downregulated in catagen [90].
The gene network analysis suggested that cultured DP cells possess unique patterns of biomarker expression that can be revealed by stimulation with serum and altered with cellular age. Compared to the DP explant, young and proliferating passages of cells express an enhanced network of inflammation genes and ECM proteins, indicative of extensive stabilisation of elastic fibres. The relative number of inflammation markers is lower in older passages, which is accompanied by a more pronounced downregulation of key cell cycle genes and expression of enzymes associated with ECM degradation, characterising senescence.
3.5. Network Analysis of the Summative Biomarkers Points to Cell Reprogramming at the Interface Between Inflammation and Senescence
To gain more insight into the components with the highest impact on the network functions and biological processes, the topology analysis of the nodes with variable significance was performed. The biomarker components of p3 v Expl and p5 v Expl comparison samples discussed so far were uploaded to STRING, and the high-confidence (0.700) functional protein networks were constructed following k-means clustering. To identify key nodes with a significant impact on the transmission of information within the networks and connections between different functional groups of biomarkers based on network centralities, several algorithms were applied. 1) Average shortest path length (ASPL), defined as the average distance between any two nodes in the network, with the significant nodes located on the shortest paths; 2) Betweenness centrality, based on the number of shortest paths passing through a given node; 3) Node degree, evaluating the number of neighbours for each node; and 4) Nodes with low radiality, measured as the number of nodes accessible from a central node, for their potential to act as biomarkers connecting different clusters or subnetworks at their boundaries crossing.
This approach delivered defined patterns of node behaviour in the networks of proliferating (p3 v Expl) and senescent (p5 v Expl) DP cells (Figure 7A&B).
3.5.1. p3 v Expl Network
This network was characterised by the presence of three nodes with the lowest ASPL values, namely MYC, FN1 and IL6. MYC node belonged to the cluster associated with the development and stem cell markers; it was also characterised by the lowest ASPL and highest betweenness centrality values. Based on this, the MYC node could be considered central to this network and likely conveys major biological effects. The FN1 and MYC nodes belonged to the largest cluster comprised of inflammation and ECM remodelling genes; these nodes also had the highest betweenness centrality and node degree values within this cluster. The MYC, IL6 and FN1 nodes were directly connected, bringing these two clusters together. The inflammation and ECM genes were the most enriched, with the cluster comprised of CCL2, CXCL1 and CXCL8 chemokines, cell adhesion proteins ICAM1 and VCAM1, matrix metalloproteinase inhibitors TIMP1 and TIMP2 and collagen crosslinking gene LOX. The MYC node was involved in direct interactions with SMAD3, LEF1, EGR1 and KLF4, which were now a part of the development and stem cell cluster. The MYC node also formed edges with cell cycle clusters comprised of CCNA2, CDC6, CCNB1, CDK1 and CHEK1, pointing to the likely biological associations between the formation of stem cells and the inhibition of cell cycle events in cultured DP cells.
Interestingly, the DKK1 node, a marker of catagen, was linked to FZD1, a receptor for Wnt signalling protein. This cluster was also directly connected to RUNX2 and LEF1 nodes, suggesting that stem cell genes related to hair follicle biology can manifest significant roles during the phase of hair follicle regression.
Finally, the nodes with the lowest radiality in the p3 v Expl network were FZD1 and LGR5, suggesting the potential for hair follicle morphogenesis and Wnt signalling biomarkers to form connections with other biological subnetworks in young proliferating DP cells (Figure 7A).
3.5.2. p5 v Expl Network
The nodes with the lowest ASPL values of 1 were CCNA2, CDC6, CCNB1, CCNB2, CDK1, CHEK1, and CCNE2, indicative of the major effect of the cell cycle genes on stress response and execution of the senescence programme. Two other pairs of nodes, namely DKK1-LEF1 and LGR5-SOX9, also had the ASPL values of 1. This suggests the likely effect of hair follicle and stem cell genes in the network. However, these four nodes also had the lowest degree, suggesting that their influence on the information flow in the network could be minor.
The second major cluster with relatively low ASPL values was formed by ECM remodelling genes, with predominant contribution from FN1, MMP1, MMP2 and MMP3 nodes. These biomarkers also had the highest node degree values (11-12 neighbours) within the network and, therefore, would have a significant impact on its stability through multiple protein interactions. The four major nodes in the ECM remodelling network were connected further with IL6, CXCL1, CCL2 and CXCL8 nodes forming a part of the inflammation cluster. The CCL2 node had the relatively lowest ASPL value; it was also characterised by the highest betweenness centrality and degree values among the nodes in the inflammation cluster. Interestingly, CCL2, CXCL1 and IL6 interacted with LIF and KLF4, which were also a part of the inflammation cluster in this network. The KLF4 was also a node with the lowest radiality in the p5 v Expl network, suggesting its potential to act as a connector at boundary crossing with other networks (Figure 7B).
3.5.3. Validation of the Most Central Node in the p3 v Expl Network by PCR
The centrality and major biological effects of the MYC node were indicated by the most significant values of ASPL. Based on this, it is likely that changes in the biomarker level of expression would have effects on the entire network. To validate the in-silico findings, a PCR analysis of MYC levels was performed in the Expl, p3 and p5 DP samples. Each sample was also analysed for the proliferation marker Ki67, alongside housekeeping gene GAPDH as an internal control. MYC was upregulated in all three DP samples at passage 3 compared to the DP explants, and subsequently downregulated at passage 5. The Ki67 was maintained at high levels in both explant and passage 3, consistent with significant proliferative potential, before downregulation at passage 5 along with MYC (Figure 7C). This analysis confirmed that MYC, the significant node within the p3 v Expl network, is highly expressed upon the transition of DP cells from explant to actively proliferating cell culture.
4. Discussion
This study performed the in-silico analysis of the transcriptional profiles of cultured hair follicle dermal papilla (DP) cells in response to wound healing signals, combined with data mining on the biomarkers, and uncovered the signatures consistent with the activation of stem cell programmes that precede cellular senescence. Hair follicle undergoes constant renewal, characterised by a cycle of growth (anagen), regression (catagen) and rest (telogen), with the initiation of a new cycle intimately linked to the reorganisation and inductive signals produced by the mesenchymal component, DP cells that instruct epithelial cells to undergo differentiation to hair shaft [17,22]. It is well-documented that the inductive capacity of DP cells is diminished upon culturing in vitro, thought to be caused by loss of the mesenchymal-epithelial interactions, which leads to the expression of the markers consistent with catagen and senescence [23,24]. The unique activity of cultured DP cells is furthermore underlined by their plasticity and differentiation programmes characteristic of mesenchymal stem cells [91]. This raises the question about the biological activity of non-inductive DP in vivo, in particular, the biomarkers associated with cellular fates and choices between fibroblast senescence or the commitment to the next regenerative cycle of hair follicles.
It can be hypothesised that culturing DP cells that have migrated out of a hair follicle explant is initially reminiscent of wounding and triggers responses to injury. Consistent with this notion, the cultures were treated with the media containing fresh serum to induce wound healing responses as documented before [28], followed by transcriptional analysis. Microarray global gene expression data obtained from DP explants, passage 3 and passage 5 were analysed using three consecutive bioinformatics programmes, TAC, STRING and Cytoscape. The resulting gene networks, which were constructed based on a comparison between explant versus passage 3 (Expl v p3) and explant versus passage 5 (Expl v p5) were subject to k-means clustering and topology filtering. The study applied several approaches to node centrality metrics to identify the significant biomarkers based on the networks’ topological properties. The closeness centrality algorithm was applied as an effective tool to detect the central nodes, which are crucial in the context of influence and regulatory functions within the network. Average shortest path length (ASPL) and betweenness centrality were used to define the important nodes based on the average reciprocal distance and the number of shortest paths passing through each node. A central regulatory role for a node was also assessed by the node degree, identifying the relevant biomarkers with the highest numbers of interactions. Finally, the nodes with the lowest radiality were also included in the analysis, since such nodes are thought to have the potential to serve as connections between additional clusters at the network boundaries. It has been postulated that there is a close connection between the gene networks and biological phenotypes, particularly through changes in key nodes that could inform the potential targets for treatments [92].
DP cells at passage 3 (p3) retained a relatively high proliferative capacity, with spindle-like cellular shapes indicative of a relatively young fibroblast phenotype. Nevertheless, the expression of markers involved in S-phase and G2/M cell cycle progression was downregulated in p3 compared to explant, with gradual progression towards senescence. A comparison of the transcriptional changes also revealed that the p3 cellular population largely lost its inductive capacity signature, which could be identified by decreased expression of anagen markers LEF1, GLI2 and LGR5 and upregulated marker of catagen DKK1. However, these changes were accompanied by increased expression of several other genes that have a documented essential role in support of anagen and hair follicle development and are also markers of stem cells. The gene group included SOX9, NOTCH2, FZD1, RUNX2, MSX2, MYC, EGR1, EGR2, SMAD3 and EBF1. Further analysis of the stem cell gene network identified additional nodes, namely KLF4, CCL2 and LIF. Interestingly, these genes, alongside MYC, are implicated in the cellular responses to injury and wound healing. CCL2 and LIF cytokines form further interactions with several inflammatory markers responsible for the recruitment of immune cells to the site of injury and wound healing, such as CXCL1, CXCL8, IL6, ICAM1 and VCAM1. These genes have documented involvement in the stimulation of catagen and hair follicle regression, therefore potentially linking these events to stem cell activation.
Based on ASPL, betweenness centrality and node degree values, MYC, FN1 and IL6 were likely to convey major biological effects within the network. Direct connections between MYC and the clusters of cell cycle and stem cell markers could be indicative of the activation of developmental or regenerative pathways when the proliferation of the general cell population is diminishing. In agreement with this model, the MYC had the most significant ASPL value in the p3 v Expl network. MYC was also validated by PCR to be transiently up-regulated in p3 DP cells, before downregulation of proliferation marker Ki67 in p5 DP cells, indicative of likely convergence of reprogramming capacities through this node. Changes in MYC levels would therefore likely have biological consequences on the entire network.
The prominent position of FN1, a biomarker with active roles in cell adhesion and tissue repair, within the cluster of inflammation and ECM remodelling genes, which was also the most enriched within the network, suggests a close functional link between these two biological activities. For example, loss of hair induction and follicle regression could trigger local inflammatory responses coupled with remodelling of the ECM, crucial to regeneration or wound healing. Stabilisation of connective tissue microenvironment could be facilitated by upregulated expression of LOX, LOX1 and THBS2, which are involved in the biosynthesis of elastin and collagen crosslinking and fibrillogenesis. Other genes, also upregulated in the p3 v Expl network, included TIMP1, TIMP2 and TIMP3, the inhibitors of matrix metalloproteinases involved in collagen degradation. This could suggest that the tensile strength of the cellular environment and inflammation could be linked to hair follicle regenerative cycles and signalling in tissue repair.
When the cells progressed to passage 5 (p5), the downregulated expression of cell cycle genes specific for the G1/S phase and G2/M phase could be driving the senescence programme. The genes, particularly those coding the cyclins, CCNA2, CCNB1, CCNB2 and CCNE2, were decreased further compared to p3. The cell cycle nodes cluster also had the lowest ASPL values, suggesting their major effect on the information within the network linked to the execution of the senescence programme.
The second major cluster, which was independent of the cell cycle cluster, was comprised of the ECM remodelling nodes. Based on the ASPL and the highest node degree values, FN1, MMP1, MMP2 and MMP3 nodes would have a significant impact through multiple protein interactions. These nodes were further connected to the inflammation cluster, which comprised IL6, CXCL1, CCL2, and CXCL8, with KLF4 now forming part of these interactions in the absence of stem cell markers. The inflammation and ECM clusters were disconnected from the LEF1 and DKK1 nodes, indicating that these events are independent of hair loss induction.
MMPs and cytokines form a part of the senescence-associated secretory phenotype (SASP) that characterises aged fibroblasts. Secretion of inflammatory cytokines and ECM-degrading proteases is thought to affect the cellular microenvironment and further propagate the senescent signals [93]. Although the inflammation and ECM-remodelling markers were present in both p3 v Expl and p5 v Expl samples, the networks had different structures. The p3 v Expl was enriched in inflammatory genes, whilst p5 v Expl was enriched in the ECM-remodelling genes, with the prominent presence of MMPs suggesting extensive ECM degradation characterising fibroblast senescence. Inflammatory signals are recognised as a crucial component of the bystander effect, defined as a biological response in a cell that occurs as a result of signals produced by its neighbours. Bystander effect can lead to enhanced proliferation, changes in gene expression or chromatin alterations [94]. Recently, IL6 has been implicated as a key molecule involved in the transmission of the bystander effect [95]. In the p3 v Expl network, IL6 is directly connected to the central MYC node, forming interactions with pluripotency factors LIF and KLF4. It is therefore plausible that IL6, and possibly other inflammatory factors produced by stressed or ageing cells, could activate the cellular programs initiating tissue repair in heterogeneous populations.
Products of MYC and KLF4 genes have been implicated in the reprogramming of somatic cells into induced pluripotent stem cells (iPSc). Several other stem cell markers in the p3 v Expl network lead to an attractive hypothesis that loss of hair induction and presence of wounding signals could be associated with partial cell reprogramming towards initiating the regenerative cycle. The fate of such cells, i.e. contribution to hair growth or skin repair, would remain to be established.
In conventional reprogramming approaches based on Yamanaka factors, senescent fibroblasts from aged animal models demonstrate variability in cell reprogramming efficiency. This correlates with secreted inflammatory cytokines’ profiles and wound healing-related gene expression. Reprogramming efficiency also negatively correlates with cell senescence but corresponds to the proportions of activated fibroblasts in cultures [96]. This leads to further questions regarding the time-dependent potential of somatic cells to undergo the reprogramming process in the heterogeneous and ageing cellular population.
Based on the analysis performed in this study, the working model can be proposed to summarise the likely biological signatures and cellular activities of cultured dermal papilla cells (Figure 8). 1) The interactions with epithelium define the inductive capacities of DP cells; these capacities are crucial to maintaining the regeneration of hair follicles in vivo. 2) The progressive loss of hair induction characterises the DP explant, which is initially accompanied by proliferation and migration of the cells and acquisition of the molecular signatures consistent with the catagen phase of hair growth cycle. 3) This cellular population is also highly susceptible to wound healing responses and expression of stem cell markers linked to cellular reprogramming. Such signatures could be characteristic of activated cells that have the potential to drive tissue regeneration, including the regeneration of hair follicles. Interestingly, there is some retention of specific and overlapping hair and stem cell markers, which could constitute the factors also priming for the next regenerative phase (E-M interactions). In the current model, the cells would retain such capacities for a transient duration of time, before 4) entering the senescence programme in the final stage. Therefore, this phase can be better defined as pre-senescent, linked to the bystander effect, and closely associated with the transient up-regulation of inflammatory markers. In this context, the stress response to injury in a highly regenerative system could trigger tissue-repair processes, involving the activation of stem cell markers and cellular reprogramming (Figure 8).
5. Conclusions
This study demonstrates that DP explants and their expanded cellular populations undergo significant transcriptional changes during serial passage, culminating in cellular senescence. The stimulation of wound healing responses in these cells reveals gene networks marked by transient stem cell marker expression, loss of hair growth markers, and increased inflammation—events that precede the onset of senescent phenotypes. These molecular signatures likely reflect cellular reprogramming processes occurring during hair follicle degeneration and regeneration cycles, offering promising avenues for future research in skin repair and rejuvenation. Furthermore, pre-senescent DP cells exhibit characteristics of proliferation, migration, and molecular changes associated with the catagen phase of the hair growth cycle. Their heightened responsiveness to injury and expression of stem cell markers underscore a transient, regenerative state driven by stress and inflammation. Ultimately, this stress response may activate tissue-repair mechanisms or, if unresolved, lead to irreversible senescence and scarring, contributing to conditions such as alopecia.
Funding
This research was funded by the Medical Research Council, London, UK, fellowship award number G0500501.
Data Availability Statement
The raw data supporting the conclusions of this article will be made available by the author upon request.
Acknowledgments
Ewa Markiewicz would like to thank Prof. Colin Jahoda (Durham University) and Prof. Angela Christiano (Columbia University) for providing dermal papilla cells and laboratory space for the duration of the experimental work.
Conflicts of Interest
The author reports no conflicts of interest in this work.
References
- Wang, M.; Li, Y.; Wang, H.; Meng, L.; et al. Corneal regeneration strategies: From stem cell therapy to tissue engineered stem cell scaffolds. Biomed. Pharmacother. 2023, 165, 115206. [Google Scholar] [CrossRef]
- Grove, J.E.; Bruscia, E.; Krause, D.S. Plasticity of bone marrow-derived stem cells. Stem Cells 2004, 22, 487–500. [Google Scholar] [CrossRef]
- Zeng, C.W. Advancing spinal cord injury treatment through stem cell therapy: A comprehensive review of cell types, challenges, and emerging technologies in regenerative medicine. Int. J. Mol. Sci. 2023, 24, 14349. [Google Scholar] [CrossRef]
- Wang, M.; Yuan, Z.; Ma, N.; Hao, C.; et al. Advances and prospects in stem cells for cartilage regeneration. Stem Cells Int. 2017, 2017, 4130607. [Google Scholar] [CrossRef]
- Wang, B.; Liu, X.M.; Liu, Z.N.; Wang, Y.; et al. Human hair follicle-derived mesenchymal stem cells: Isolation, expansion, and differentiation. World J. Stem Cells 2020, 12, 462–470. [Google Scholar] [CrossRef]
- Ichim, T.E.; O’Heeron, P.; Kesari, S. Fibroblasts as a practical alternative to mesenchymal stem cells. J. Transl. Med. 2018, 16, 212. [Google Scholar] [CrossRef]
- Salzer, M.C.; Lafzi, A.; Berenguer-Llergo, A.; Youssif, C.; et al. Identity noise and adipogenic traits characterize dermal fibroblast aging. Cell 2018, 175, 1575–1590.e22. [Google Scholar] [CrossRef]
- Tai, C.; Xie, Z.; Li, Y.; Feng, Y.; et al. Human skin dermis-derived fibroblasts are functional mesenchymal stromal cells. Cell Biosci. 2022, 12, 105. [Google Scholar] [CrossRef]
- Sowa, Y.; Kishida, T.; Louis, F.; Sawai, S.; et al. Direct conversion of human fibroblasts into adipocytes using a novel small molecular compound. Cells 2021, 10, 605. [Google Scholar] [CrossRef]
- Cayami, F.K.; Claeys, L.; de Ruiter, R.; Smilde, B.J.; et al. Osteogenic transdifferentiation of primary human fibroblasts to osteoblast-like cells with human platelet lysate. Sci. Rep. 2022, 12, 14686. [Google Scholar] [CrossRef]
- Abdel-Raouf, K.M.A.; Rezgui, R.; Stefanini, C.; Teo, J.C.M.; Christoforou, N. Transdifferentiation of human fibroblasts into skeletal muscle cells. Biology 2021, 10, 539. [Google Scholar] [CrossRef]
- Takahashi, K.; Yamanaka, S. Induction of pluripotent stem cells from mouse embryonic and adult fibroblast cultures by defined factors. Cell 2006, 126, 663–676. [Google Scholar] [CrossRef]
- Smith, D.K.; He, M.; Zhang, C.L.; Zheng, J.C. Therapeutic potential of cell identity reprogramming for aging-related neurodegenerative disorders. Prog. Neurobiol. 2017, 157, 212–229. [Google Scholar] [CrossRef]
- Gong, L.; Yan, Q.; Zhang, Y.; et al. Cancer cell reprogramming: A promising therapy converting malignancy to benignity. Cancer Commun. 2019, 39, 48. [Google Scholar] [CrossRef] [PubMed]
- Ma, X.; Kong, L.; Zhu, S. Reprogramming cell fates by small molecules. Protein Cell 2017, 8, 328–348. [Google Scholar] [CrossRef]
- Mahmoudi, S.; Mancini, E.; Xu, L.; Moore, A.; et al. Heterogeneity in old fibroblasts is linked to variability in reprogramming and wound healing. Nature 2019, 574, 553–558. [Google Scholar] [CrossRef]
- Matsuzaki, T.; Yoshizato, K. Role of hair papilla cells in induction and regeneration of hair follicles. Wound Repair Regen. 1998, 6, 524–530. [Google Scholar] [CrossRef]
- Martino, P.A.; Heitman, N.; Rendl, M. The dermal sheath: An emerging component of the hair follicle stem cell niche. Exp. Dermatol. 2021, 30, 512–521. [Google Scholar] [CrossRef]
- Jahoda, C.A. Cell movement in the hair follicle dermis—More than a two-way street? J. Invest. Dermatol. 2003, 121, ix–xi. [Google Scholar] [CrossRef]
- Zhou, S.; Li, Z.; Li, X.; Ye, Y.; et al. Crosstalk between endothelial cells and dermal papilla entails hair regeneration and angiogenesis during aging. J. Adv. Res. 2025, 70, 339–353. [Google Scholar] [CrossRef]
- Leirós, G.J.; Kusinsky, A.G.; Drago, H.; Bossi, S.; et al. Dermal papilla cells improve the wound healing process and generate hair bud-like structures in grafted skin substitutes using hair follicle stem cells. Stem Cells Transl. Med. 2014, 3, 1209–1219. [Google Scholar] [CrossRef]
- Morgan, B.A. The dermal papilla: An instructive niche for epithelial stem and progenitor cells in development and regeneration of the hair follicle. Cold Spring Harb. Perspect. Med. 2014, 4, a015180. [Google Scholar] [CrossRef]
- Kishimoto, J.; Burgeson, R.E.; Morgan, B.A. Wnt signaling maintains the hair-inducing activity of the dermal papilla. Genes Dev. 2000, 14, 1181–1185. [Google Scholar] [CrossRef]
- O’Shaughnessy, R.F.L.; Yeo, W.; Gautier, J.; et al. The WNT signalling modulator, Wise, is expressed in an interaction-dependent manner during hair-follicle cycling. J. Invest. Dermatol. 2004, 123, 613–621. [Google Scholar] [CrossRef]
- Ohyama, M.; Kobayashi, T.; Sasaki, T.; Shimizu, A.; Amagai, M. Restoration of the intrinsic properties of human dermal papilla in vitro. J. Cell Sci. 2012, 125, 4114–4125. [Google Scholar] [CrossRef]
- Abreu, C.M.; Cerqueira, M.T.; Pirraco, R.P.; Gasperini, L.; et al. Rescuing key native traits in cultured dermal papilla cells for human hair regeneration. J. Adv. Res. 2021, 30, 103–112. [Google Scholar] [CrossRef]
- Li, Y.; Lin, C.M.; Cai, X.N.; Li, G.Q. Reconstruction of human hair dermal papilla with microencapsulation in vitro. J. Dermatol. Sci. 2005, 38, 107–109. [Google Scholar] [CrossRef]
- Iyer, V.R.; Eisen, M.B.; Ross, D.T.; Schuler, G.; et al. The transcriptional program in the response of human fibroblasts to serum. Science 1999, 283, 83–87. [Google Scholar] [CrossRef]
- Li, J.; Zhao, B.; Yao, S.; Dai, Y.; et al. Dermal papilla cell-derived exosomes regulate hair follicle stem cell proliferation via LEF1. Int. J. Mol. Sci. 2023, 24, 3961. [Google Scholar] [CrossRef]
- Mill, P.; Mo, R.; Fu, H.; Grachtchouk, M.; et al. Sonic hedgehog-dependent activation of Gli2 is essential for embryonic hair follicle development. Genes Dev. 2003, 17, 282–294. [Google Scholar] [CrossRef]
- Jaks, V.; Barker, N.; Kasper, M.; et al. Lgr5 marks cycling, yet long-lived, hair follicle stem cells. Nat. Genet. 2008, 40, 1291–1299. [Google Scholar] [CrossRef]
- Kwack, M.H.; Kim, M.K.; Kim, J.C.; Sung, Y.K. Dickkopf 1 promotes regression of hair follicles. J. Invest. Dermatol. 2012, 132, 1554–1560. [Google Scholar] [CrossRef]
- Hawkshaw, N.J.; Hardman, J.A.; Haslam, I.S.; Shahmalak, A.; et al. Cyclosporine A suppresses the Wnt inhibitor SFRP1 in the dermal papilla of human scalp hair follicles. PLoS Biol. 2018, 16, e2003705. [Google Scholar] [CrossRef]
- Kadaja, M.; Keyes, B.E.; Lin, M.; Pasolli, H.A.; et al. SOX9 is a stem cell transcriptional regulator of secreted niche signaling factors. Genes Dev. 2014, 28, 328–341. [Google Scholar] [CrossRef]
- Wang, X.; Liu, Y.; He, J.; Wang, J.; et al. Regulation of signaling pathways in hair follicle stem cells. Burns Trauma 2022, 10, tkac022. [Google Scholar] [CrossRef]
- Reddy, S.T.; Andl, T.; Lu, M.M.; Morrisey, E.E.; Millar, S.E. Expression of Frizzled genes in developing and postnatal hair follicles. J. Invest. Dermatol. 2004, 123, 275–282. [Google Scholar] [CrossRef]
- Glotzer, D.J.; Zelzer, E.; Olsen, B.R. Impaired skin and hair follicle development in Runx2-deficient mice. Dev. Biol. 2008, 315, 459–473. [Google Scholar] [CrossRef]
- Merrill, B.J.; Gat, U.; DasGupta, R.; Fuchs, E. Tcf3 and Lef1 regulate lineage differentiation of multipotent stem cells in skin. Genes Dev. 2001, 15, 1688–1705. [Google Scholar] [CrossRef]
- Fujimaki, S.; Seko, D.; Kitajima, Y.; Yoshioka, K.; et al. Notch1 and Notch2 coordinately regulate stem cell function in muscle satellite cells. Stem Cells 2018, 36, 278–285. [Google Scholar] [CrossRef]
- Nabhan, A.N.; Webster, J.D.; Adams, J.J.; Blazer, L.; et al. Targeted alveolar regeneration with Frizzled-specific agonists. Cell 2023, 186, 2995–3012.e15. [Google Scholar] [CrossRef]
- Ma, L.; Liu, J.; Wu, T.; Plikus, M.; et al. Cyclic alopecia in Msx2 mutants. Development 2003, 130, 379–389. [Google Scholar] [CrossRef]
- Zhang, L.; Wang, H.; Liu, C.; Wu, Q.; et al. MSX2 initiates mesenchymal stem cell specification of hPSCs. Stem Cell Rep. 2018, 11, 497–513. [Google Scholar] [CrossRef]
- Wang, N.; Yang, T.; Li, J.; Lei, M.; et al. Expression and role of c-Myc in mouse hair follicle morphogenesis. Acta Histochem. 2012, 114, 199–206. [Google Scholar] [CrossRef]
- Chappell, J.; Dalton, S. Roles for MYC in pluripotency. Cold Spring Harb. Perspect. Med. 2013, 3, a014381. [Google Scholar] [CrossRef]
- Ge, W.; Tan, S.J.; Wang, S.H.; Li, L.; et al. Single-cell transcriptome profiling of embryonic hair follicle development. Theranostics 2020, 10, 7581–7598. [Google Scholar] [CrossRef]
- Wang, S.S.; Huang, H.Y.; Chen, S.Z.; Li, X.; et al. Early growth response 2 plays opposing roles in stem cell commitment. Int. J. Biochem. Cell Biol. 2013, 45, 1825–1832. [Google Scholar] [CrossRef]
- Muchkaeva, I.A.; Dashinimaev, E.B.; Artyuhov, A.S.; et al. Generation of iPS cells from human hair follicle dermal papilla cells. Acta Naturae 2014, 6, 45–53. [Google Scholar] [CrossRef]
- Binder, P.; Wang, S.; Radu, M.; Zin, M.; et al. Pak2 as a therapeutic target for cardioprotective ER stress response. Circ. Res. 2019, 124, 696–711. [Google Scholar] [CrossRef]
- Min, I.M.; Pietramaggiori, G.; Kim, F.S.; Passegué, E.; et al. EGR1 controls proliferation and localization of hematopoietic stem cells. Cell Stem Cell 2008, 2, 380–391. [Google Scholar] [CrossRef]
- Li, S.N.; Wu, J.F. TGF-β/SMAD signaling in adipocyte commitment. Stem Cell Res. Ther. 2020, 11, 41. [Google Scholar] [CrossRef]
- Phan, Q.M.; Salz, L.; Kindl, S.S.; Lopez, J.S.; et al. Lineage commitment of dermal fibroblast progenitors. EMBO J. 2023, 42, e113880. [Google Scholar] [CrossRef]
- Takeda, T.; Yokoyama, Y.; Takahashi, H.; et al. KLF5 regulates CCAT1 via genome structure. Br. J. Cancer 2022, 126, 109–119. [Google Scholar] [CrossRef]
- Whelan, D.S.; Caplice, N.M.; Clover, A.J.P. Mesenchymal stromal cell-derived CCL2 accelerates wound healing. Sci. Rep. 2020, 10, 2642. [Google Scholar] [CrossRef]
- Hirai, H.; Karian, P.; Kikyo, N. Regulation of embryonic stem cell pluripotency by LIF. Biochem. J. 2011, 438, 11–23. [Google Scholar] [CrossRef] [PubMed]
- Xu, Y.; Wang, S.; Cao, X.; Yuan, Z.; et al. Effect of EGR1 on dermal papilla cell proliferation. Genes 2022, 13, 1242. [Google Scholar] [CrossRef] [PubMed]
- Oshimori, N.; Fuchs, E. Paracrine TGF-β signaling in hair follicle stem cell activation. Cell Stem Cell 2012, 10, 63–75. [Google Scholar] [CrossRef]
- Hochfeld, L.M.; Bertolini, M.; Broadley, D.; Botchkareva, N.V.; et al. Interaction of WNT10A and EBF1 in male-pattern baldness. PLoS ONE 2021, 16, e0256846. [Google Scholar] [CrossRef]
- Wu, W.; Zhou, W.; Jiang, J.; Wang, M.; et al. Mechanical stimuli-induced CCL2 restores hair follicle regeneration. Mol. Ther. Nucleic Acids 2023, 32, 94–110. [Google Scholar] [CrossRef]
- Han, H.; Qin, H.; Yang, Y.; et al. Effect of KLF4 overexpression on hair follicle development. Dev. Genes Evol. 2013, 233, 137–145. [Google Scholar] [CrossRef]
- Helm, M.; Schmidt, M.; Del Duca, E.; Liu, Y.; et al. Repurposing DPP4 inhibition for hair follicle regeneration. J. Invest. Dermatol. 2023, 143, 2132–2144.e15. [Google Scholar] [CrossRef]
- Ridiandries, A.; Tan, J.T.M.; Bursill, C.A. Chemokines in wound healing. Int. J. Mol. Sci. 2018, 19, 3217. [Google Scholar] [CrossRef]
- Wood, S.; Jayaraman, V.; Huelsmann, E.J.; Bonish, B.; et al. Pro-inflammatory chemokine CCL2 promotes healing in diabetic wounds. PLoS ONE 2014, 9, e91574. [Google Scholar] [CrossRef]
- Iyer, R.P.; Jung, M.; Lindsey, M.L. MMP-9 signaling following myocardial infarction. Am. J. Physiol. Heart Circ. Physiol. 2016, 311, H190–H198. [Google Scholar] [CrossRef]
- Kechagia, J.; Ezra, D.; Burton, M.; et al. Fibroblast profiling in scarring trachoma identifies IL-6 feedback loops. Sci. Rep. 2016, 6, 28261. [Google Scholar] [CrossRef]
- Bui, T.M.; Wiesolek, H.L.; Sumagin, R. ICAM-1 as a master regulator in inflammation. J. Leukoc. Biol. 2020, 108, 787–799. [Google Scholar] [CrossRef]
- Olivares-Silva, F.; Landaeta, R.; Aránguiz, P.; Bolivar, S.; et al. Heparan sulfate enhances leukocyte adhesion on cardiac fibroblasts. Biochim. Biophys. Acta Mol. Basis Dis. 2018, 1864, 831–842. [Google Scholar] [CrossRef]
- Jian, C.; Feng, Z.X.; Zhang, D.C.; Guo, Y.L.; et al. Dermal white adipose tissue modulates hair follicle aging. Front. Cell Dev. Biol. 2021, 9, 728188. [Google Scholar] [CrossRef]
- Narla, S.; Azzam, M.; Townsend, S.; Vellaichamy, G.; et al. Immune system targets in hidradenitis suppurativa. Br. J. Dermatol. 2021, 184, 1004–1013. [Google Scholar] [CrossRef]
- Hou, C.; Miao, Y.; Wang, X.; Chen, C. Expression of matrix metalloproteinases in the hair cycle. Exp. Ther. Med. 2016, 12, 231–237. [Google Scholar] [CrossRef]
- Kwack, M.H.; Ahn, J.S.; Kim, M.K.; Kim, J.C.; Sung, Y.K. Dihydrotestosterone-inducible IL-6 inhibits hair shaft elongation. J. Invest. Dermatol. 2012, 132, 43–49. [Google Scholar] [CrossRef]
- Müller-Röver, S.; Bulfone-Paus, S.; Handjiski, B.; Welker, P.; et al. ICAM-1 and hair follicle regression. J. Histochem. Cytochem. 2000, 48, 557–568. [Google Scholar] [CrossRef]
- Borlado, L.R.; Méndez, J. CDC6 from DNA replication to oncogenesis. Carcinogenesis 2008, 29, 237–243. [Google Scholar] [CrossRef]
- Lim, S.; Kaldis, P. Cdks, cyclins and CKIs beyond cell cycle regulation. Development 2013, 140, 3079–3093. [Google Scholar] [CrossRef]
- Marthandan, S.; Baumgart, M.; Priebe, S.; Groth, M.; et al. Conserved senescence-associated genes in fibroblasts. PLoS ONE 2016, 11, e0154531. [Google Scholar] [CrossRef]
- Stein, G.H.; Drullinger, L.F.; Soulard, A.; Dulić, V. Roles of p21 and p16 in senescence. Mol. Cell. Biol. 1999, 19, 2109–2117. [Google Scholar] [CrossRef]
- Búa, S.; Sotiropoulou, P.; Sgarlata, C.; Borlado, L.R.; et al. Deregulated Cdc6 affects hair growth cycle. Cell Cycle 2015, 14, 3897–3907. [Google Scholar] [CrossRef]
- Chen, S.J.; Liu, T.; Liu, Y.J.; Dong, B.; et al. CCNA2 polymorphisms and wool density. Genet. Mol. Res. 2011, 10, 3365–3370. [Google Scholar] [CrossRef]
- Choi, Y.K.; Kang, J.; Hyun, J.W.; Koh, Y.S.; et al. Myristoleic acid promotes anagen signaling. Biomol. Ther. 2021, 29, 211–219. [Google Scholar] [CrossRef]
- Gao, G.; Feng, Y.; Yang, X.; Liu, W.; et al. Genes related to hair follicle cycling in cashmere goats. Front. Vet. Sci. 2022, 9, 894380. [Google Scholar] [CrossRef]
- Gimeno-LLuch, I.; Benito-Jardón, M.; Guerrero-Barberà, G.; Burday, N.; Costell, M. Role of the fibronectin synergy site in wound healing. Cells 2022, 11, 2100. [Google Scholar] [CrossRef]
- Baumann, L.; Bernstein, E.F.; Weiss, A.S.; Bates, D.; et al. Clinical relevance of elastin in skin. Aesthet. Surg. J. Open Forum 2021, 3, ojab019. [Google Scholar] [CrossRef]
- Calleja-Agius, J.; Brincat, M.; Borg, M. Skin connective tissue and ageing. Best Pract. Res. Clin. Obstet. Gynaecol. 2013, 27, 727–740. [Google Scholar] [CrossRef]
- Kothapalli, C.R.; Ramamurthi, A. Lysyl oxidase enhances elastin synthesis. J. Tissue Eng. Regen. Med. 2009, 3, 655–661. [Google Scholar] [CrossRef] [PubMed]
- Cai, L.; Xiong, X.; Kong, X.; Xie, J. Lysyl oxidases in tissue repair. Tissue Eng. Regen. Med. 2017, 14, 15–30. [Google Scholar] [CrossRef]
- Bornstein, P.; Kyriakides, T.R.; Yang, Z.; Armstrong, L.C.; Birk, D.E. Thrombospondin 2 modulates collagen fibrillogenesis. J. Invest. Dermatol. Symp. Proc. 2000, 5, 61–66. [Google Scholar] [CrossRef]
- Freitas-Rodríguez, S.; Folgueras, A.R.; López-Otín, C. Matrix metalloproteinases in aging. Biochim. Biophys. Acta Mol. Cell Res. 2017, 1864, 2015–2025. [Google Scholar] [CrossRef]
- Shin, J.W.; Kwon, S.H.; Choi, J.Y.; Na, J.I.; et al. Molecular mechanisms of dermal aging. Int. J. Mol. Sci. 2019, 20, 2126. [Google Scholar] [CrossRef]
- Huang, D.; Ding, H.; Wang, Y.; Cheng, G.; et al. Hair follicle transcriptome analysis in Angora rabbits. Biology 2023, 12, 445. [Google Scholar] [CrossRef]
- Hayashi, K.; Cao, T.; Passmore, H.; Jourdan-Le Saux, C.; et al. Progressive hair loss in rough coat mice. J. Invest. Dermatol. 2004, 123, 864–871. [Google Scholar] [CrossRef]
- Airola, K.; Ahonen, M.; Johansson, N.; Heikkilä, P.; et al. TIMP-3 expression in hair growth cycle. J. Histochem. Cytochem. 1998, 46, 437–447. [Google Scholar] [CrossRef]
- Jahoda, C.A.; Whitehouse, J.; Reynolds, A.J.; Hole, N. Hair follicle dermal cells differentiate into adipogenic and osteogenic lineages. Exp. Dermatol. 2003, 12, 849–859. [Google Scholar] [CrossRef]
- Wang, M.; Wang, H.; Zheng, H. A mini review of node centrality metrics in biological networks. Int. J. Netw. Inf. Dyn. 2022, 1, 99–110. [Google Scholar] [CrossRef]
- da Silva, P.F.L.; Ogrodnik, M.; Kucheryavenko, O.; Glibert, J.; et al. Bystander effect contributes to senescent cell accumulation. Aging Cell 2019, 18, e12848. [Google Scholar] [CrossRef]
- Najafi, M.; Fardid, R.; Hadadi, G.; Fardid, M. Mechanisms of radiation-induced bystander effect. J. Biomed. Phys. Eng. 2014, 4, 163–172. [Google Scholar]
- Mariotti, L.G.; Bertolotti, A.; Ranza, E.; Babini, G.; Ottolenghi, A. Mechanisms underpinning IL-6 release in bystander responses. Int. J. Radiat. Biol. 2012, 88, 751–762. [Google Scholar] [CrossRef]
- Mahmoudi, S.; Mancini, E.; Xu, L.; Moore, A.; et al. Heterogeneity in old fibroblasts and wound healing variability. Nature 2019, 574, 553–558. [Google Scholar] [CrossRef]
- Higgins, C.A.; Chen, J.C.; Cerise, J.E.; Jahoda, C.A.; Christiano, A.M. Microenvironmental reprogramming enables de novo human hair follicle growth. Proc. Natl. Acad. Sci. USA 2013, 110, 19679–19688. [Google Scholar] [CrossRef] [PubMed]
Figure 1.
Global transcriptomic changes in cultured dermal papilla (DP) cells as a function of wound healing responses and senescence programmes. A) Light microscopy photographs of Explant (Expl), passage 3 (p3) and passage 5 (p5) DP samples showing changes in cellular morphology. B) Differentially expressed genes in serum-restimulated young and aged DP cells compared to DP Explant in microarray analysis. C&D) Scatter plot and hierarchical clustering of the biomarkers from TAC analysis.
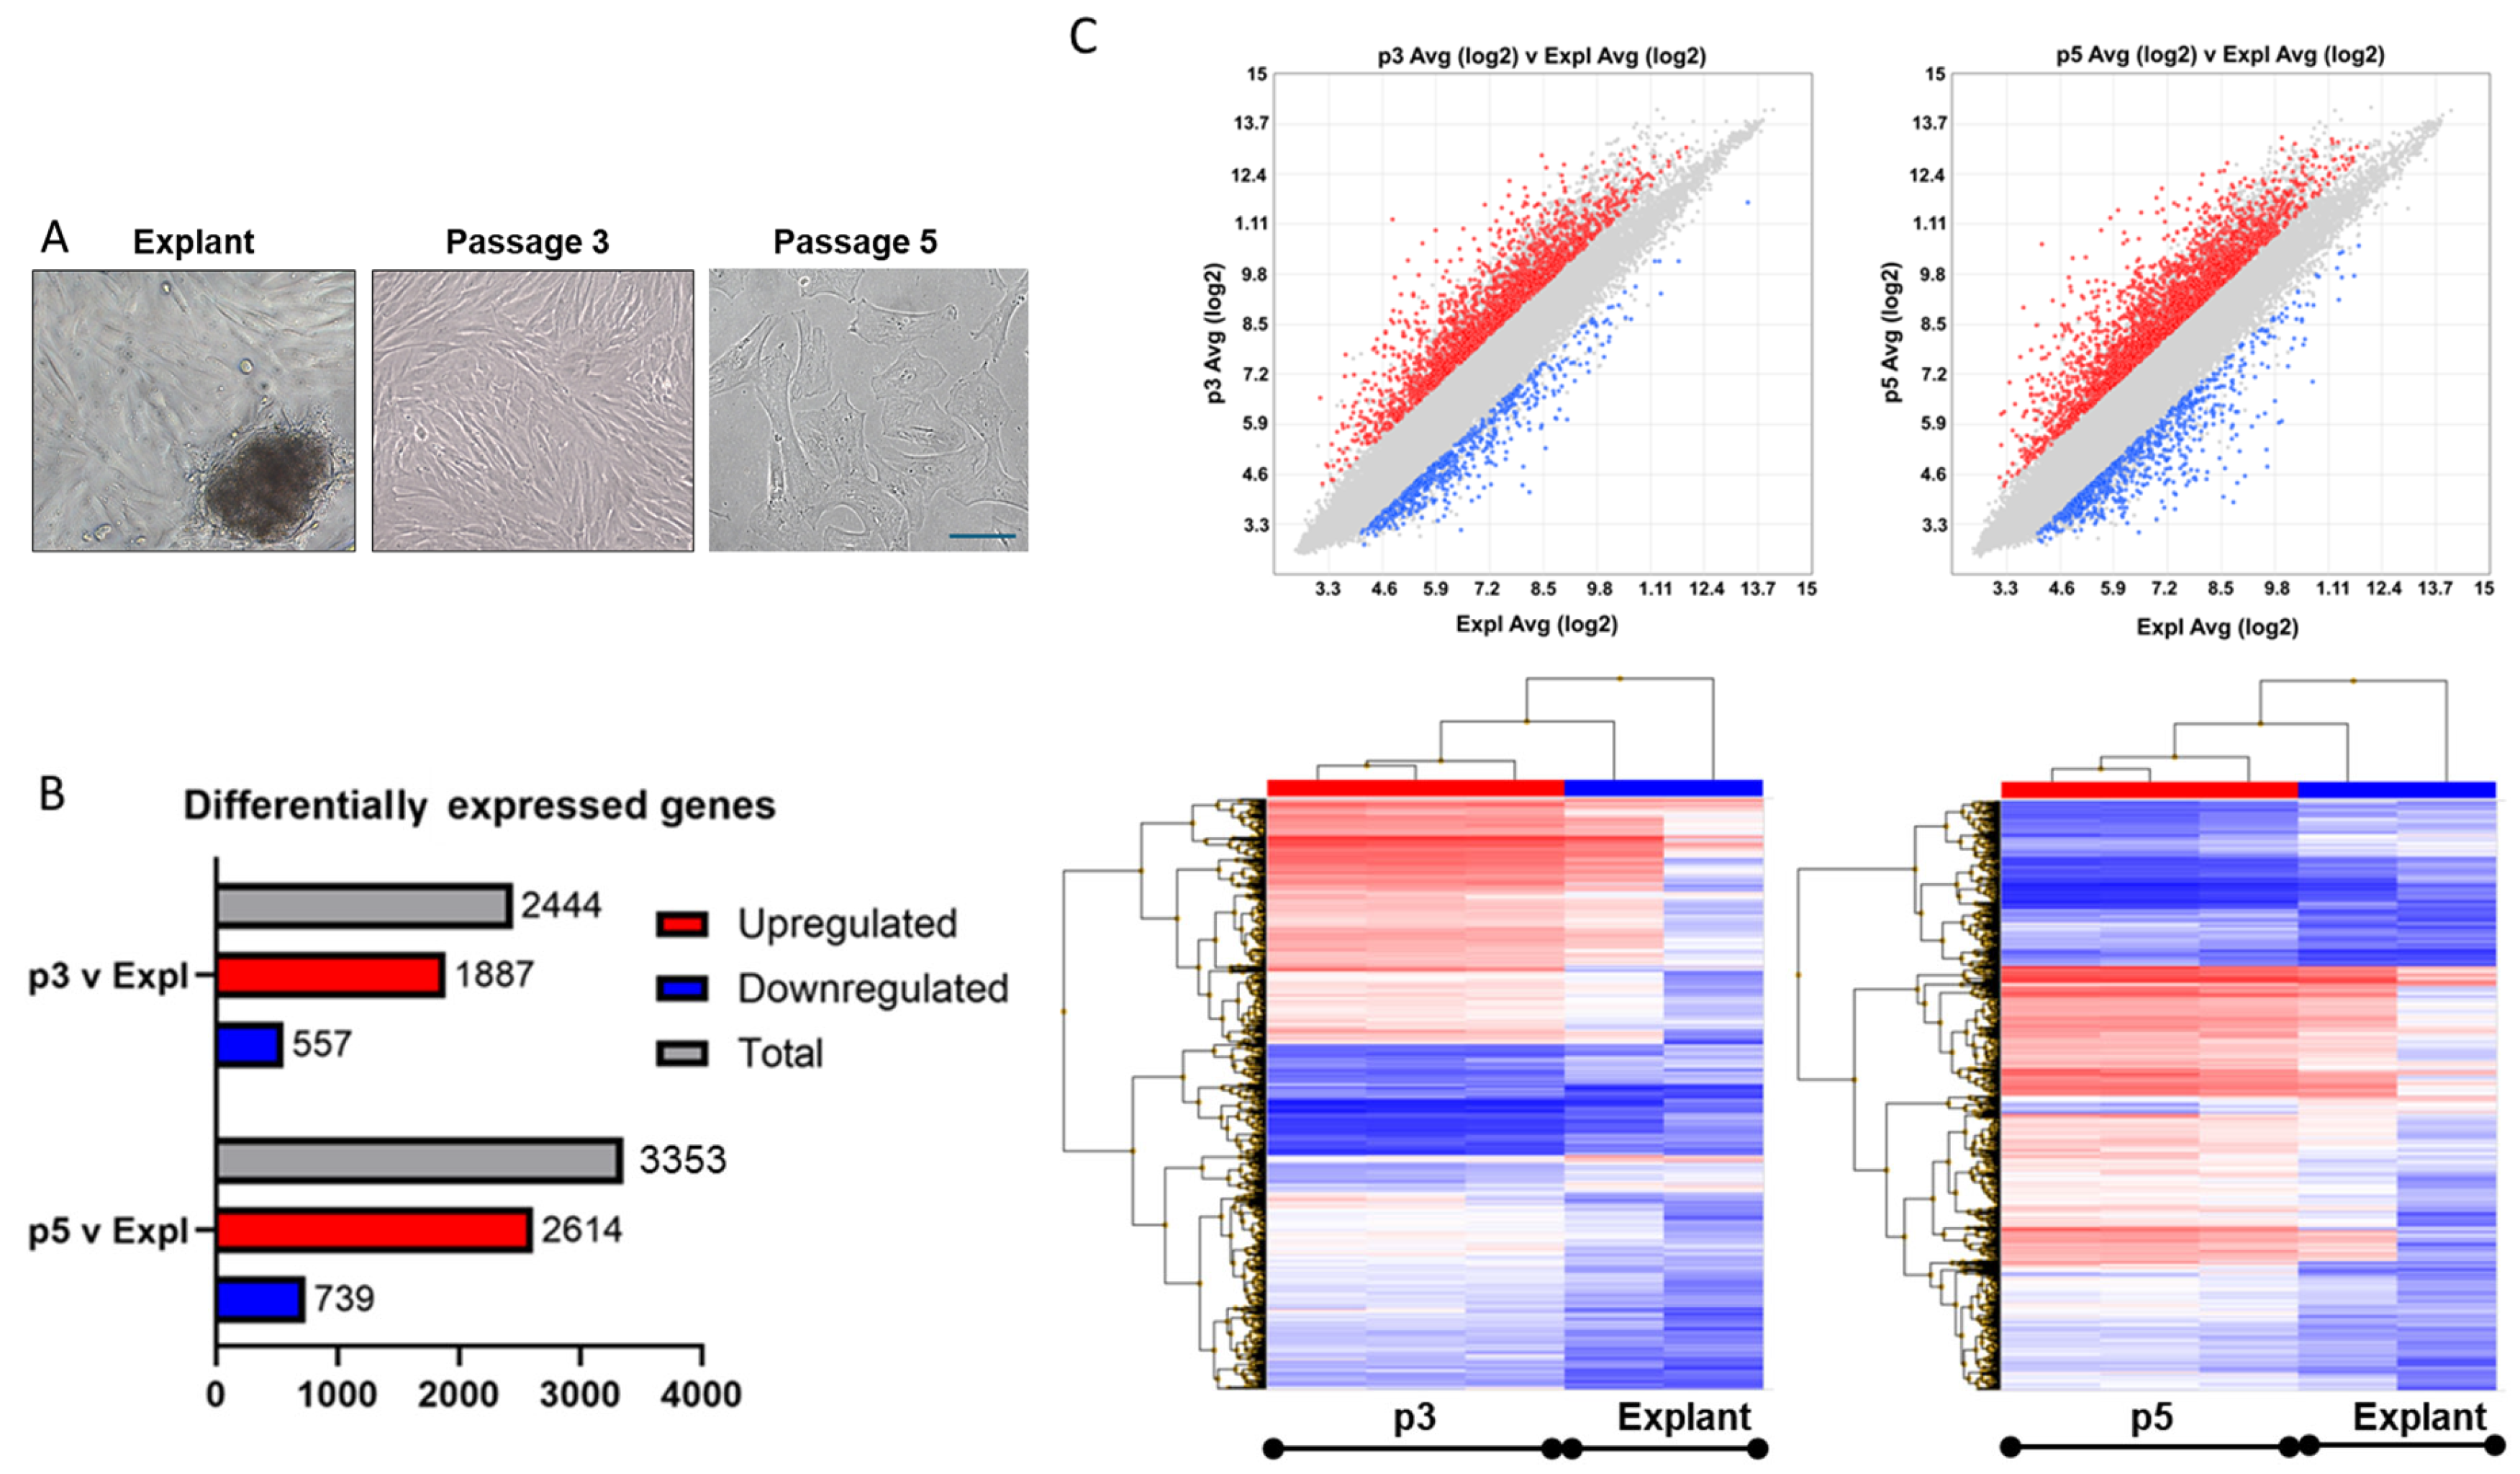
Figure 2.
The transition of DP from the explant to cell culture is accompanied by the expression of gene clusters associated with wound healing responses. A) Gene enrichment clusters in p3 v Expl samples upon re-stimulation with serum. The k-means clustering was performed on the gene network assembled in STRING. B) Reactome pathways and gene distribution in the clusters.
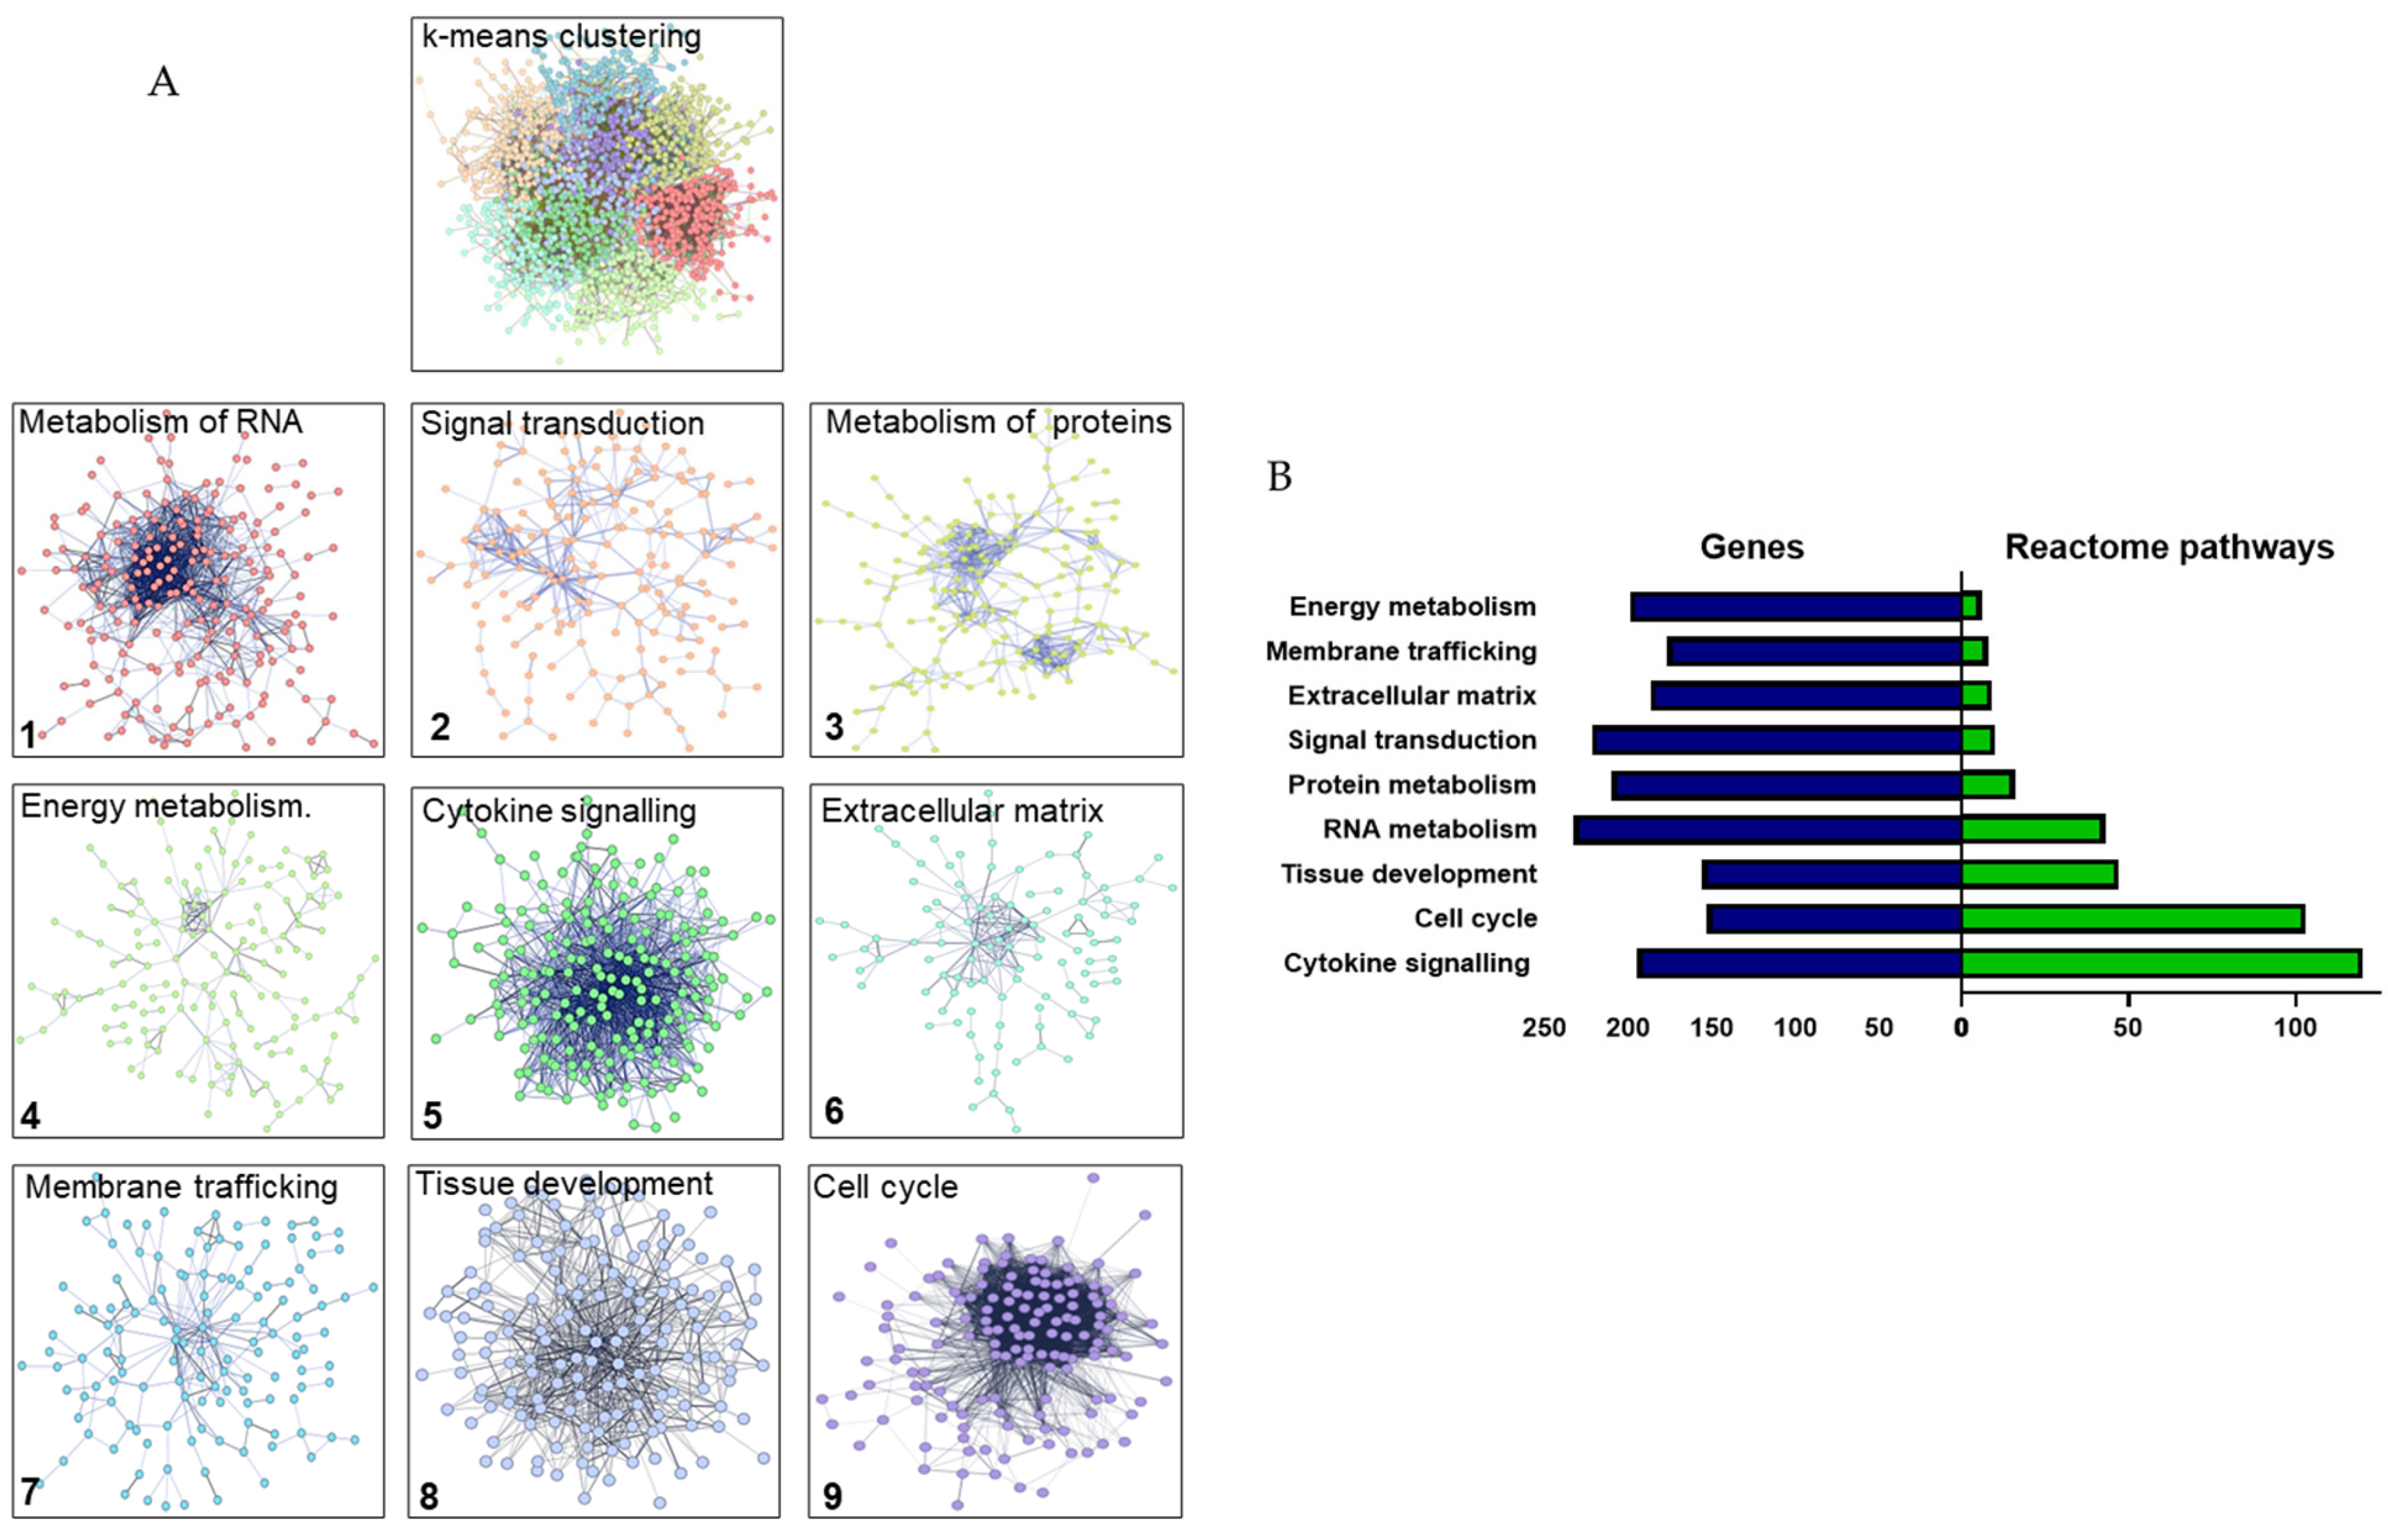
Figure 3.
The organisation of wound healing-relevant clusters within the DP gene networks. A&B) Four clusters present within the p3 v Expl and p5 v Expl networks, 1) Development, 2) Proliferation, 3) Inflammation, and 4) Extracellular matrix were overlayed with node tables with gene fold change expression in Cytoscape. Continuous mapping labels from -5 to 5 were applied to visualise the changes in expression levels, with red representing up-regulated genes and blue representing down-regulated genes.
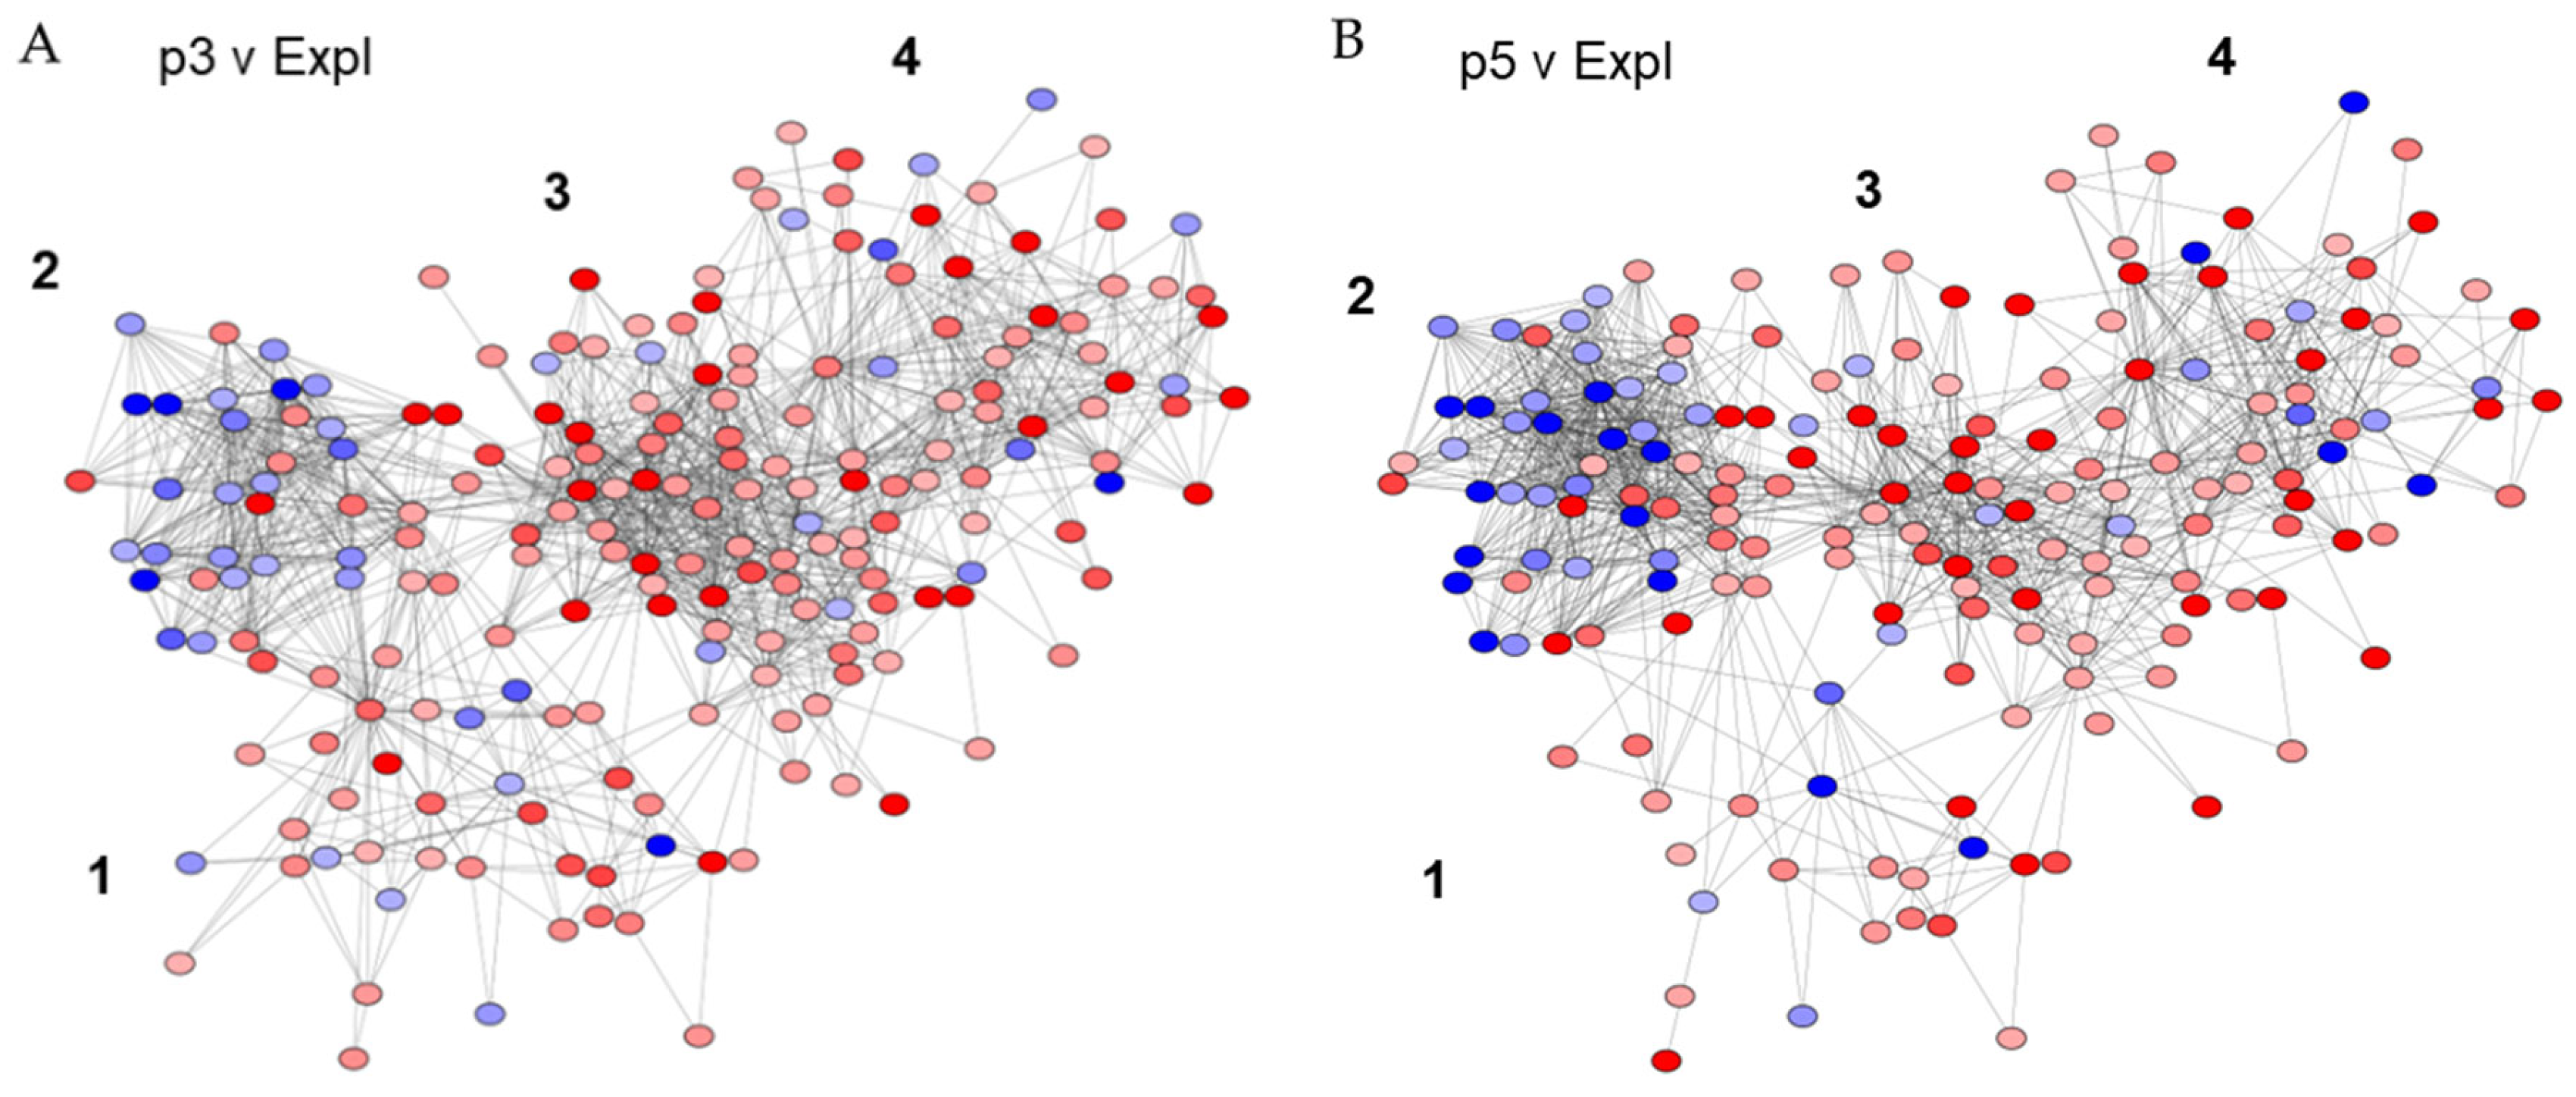
Figure 4.
Changes in the organisation of biomarkers linked to tissue regeneration in young and aged DP cells. The p3 v Expl and p5 v Expl DP networks were constructed in Cytoscape, with red and blue nodes representing upregulated and downregulated genes, respectively. A) Hair follicle development networks and B) Stem cell networks are significantly less enriched in aged DP cells.
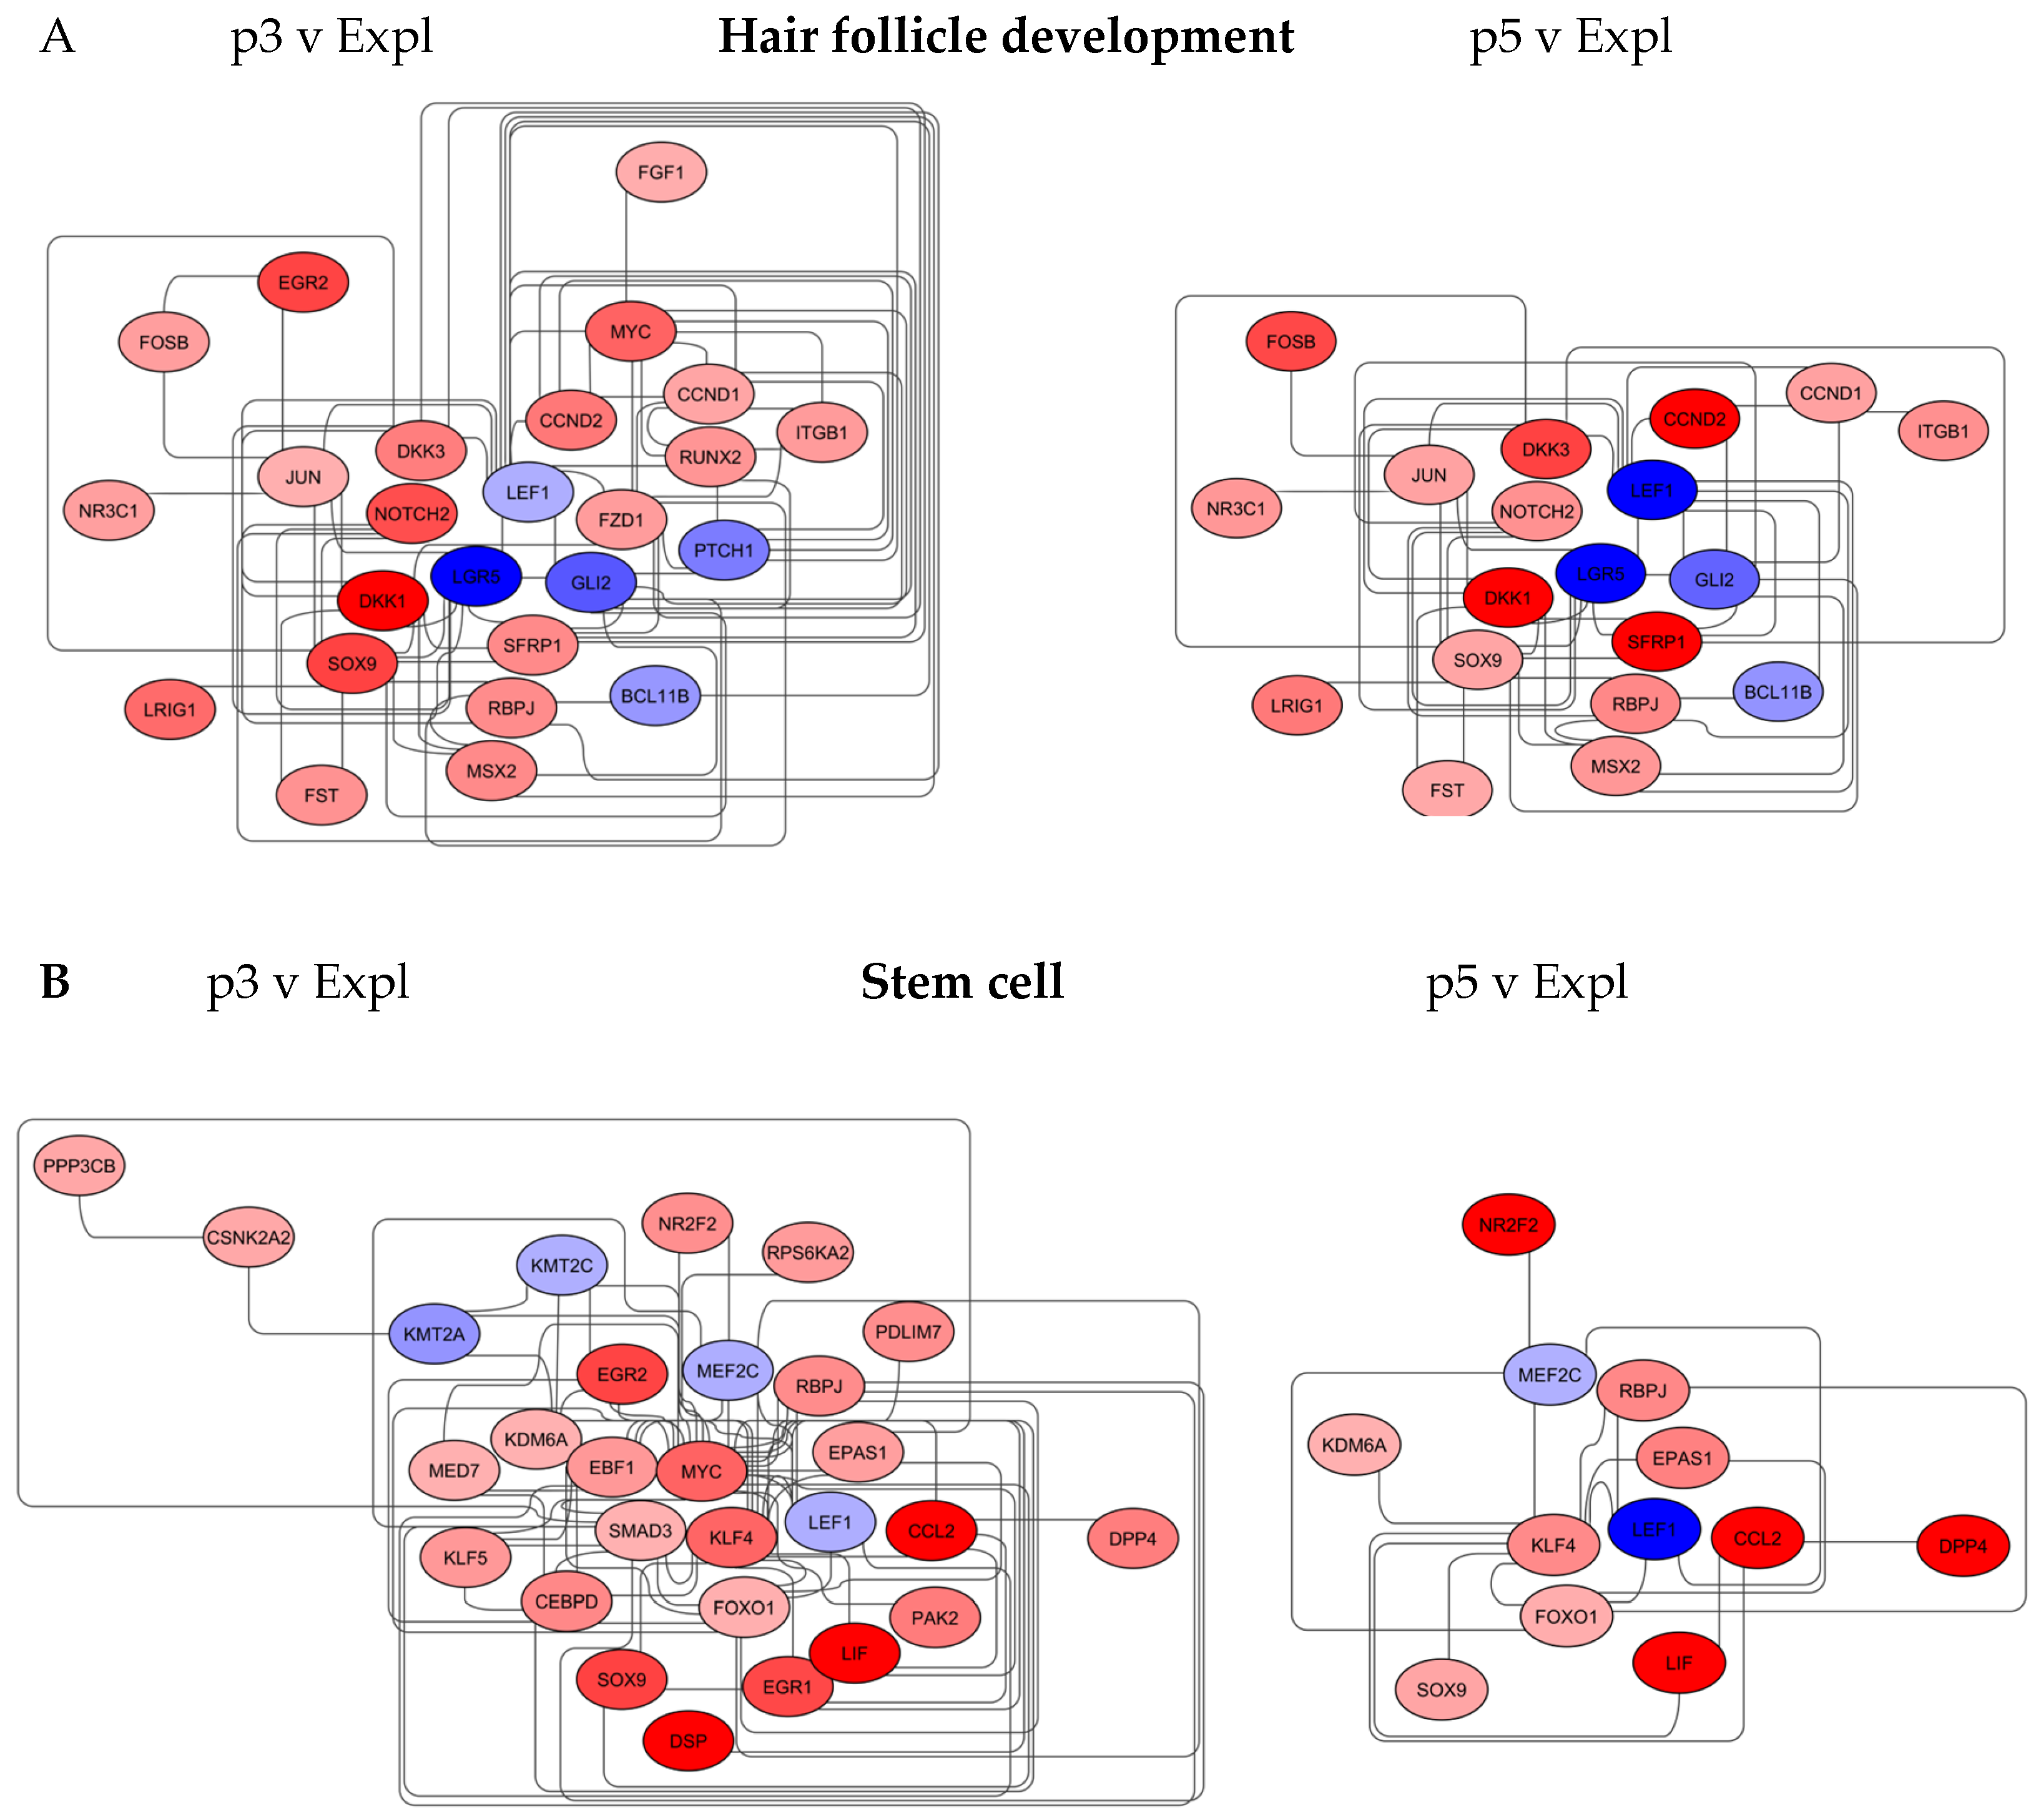
Figure 5.
Changes in the organisation of biomarkers linked to wound healing in young and aged DP cells. The inflammation networks were constructed in Cytoscape, with red and blue nodes representing upregulated and downregulated genes, respectively. The p3 v Expl and p5 v Expl networks indicate changes in the inflammatory signalling that precede the downregulation in cell cycle and ECM-remodelling genes.
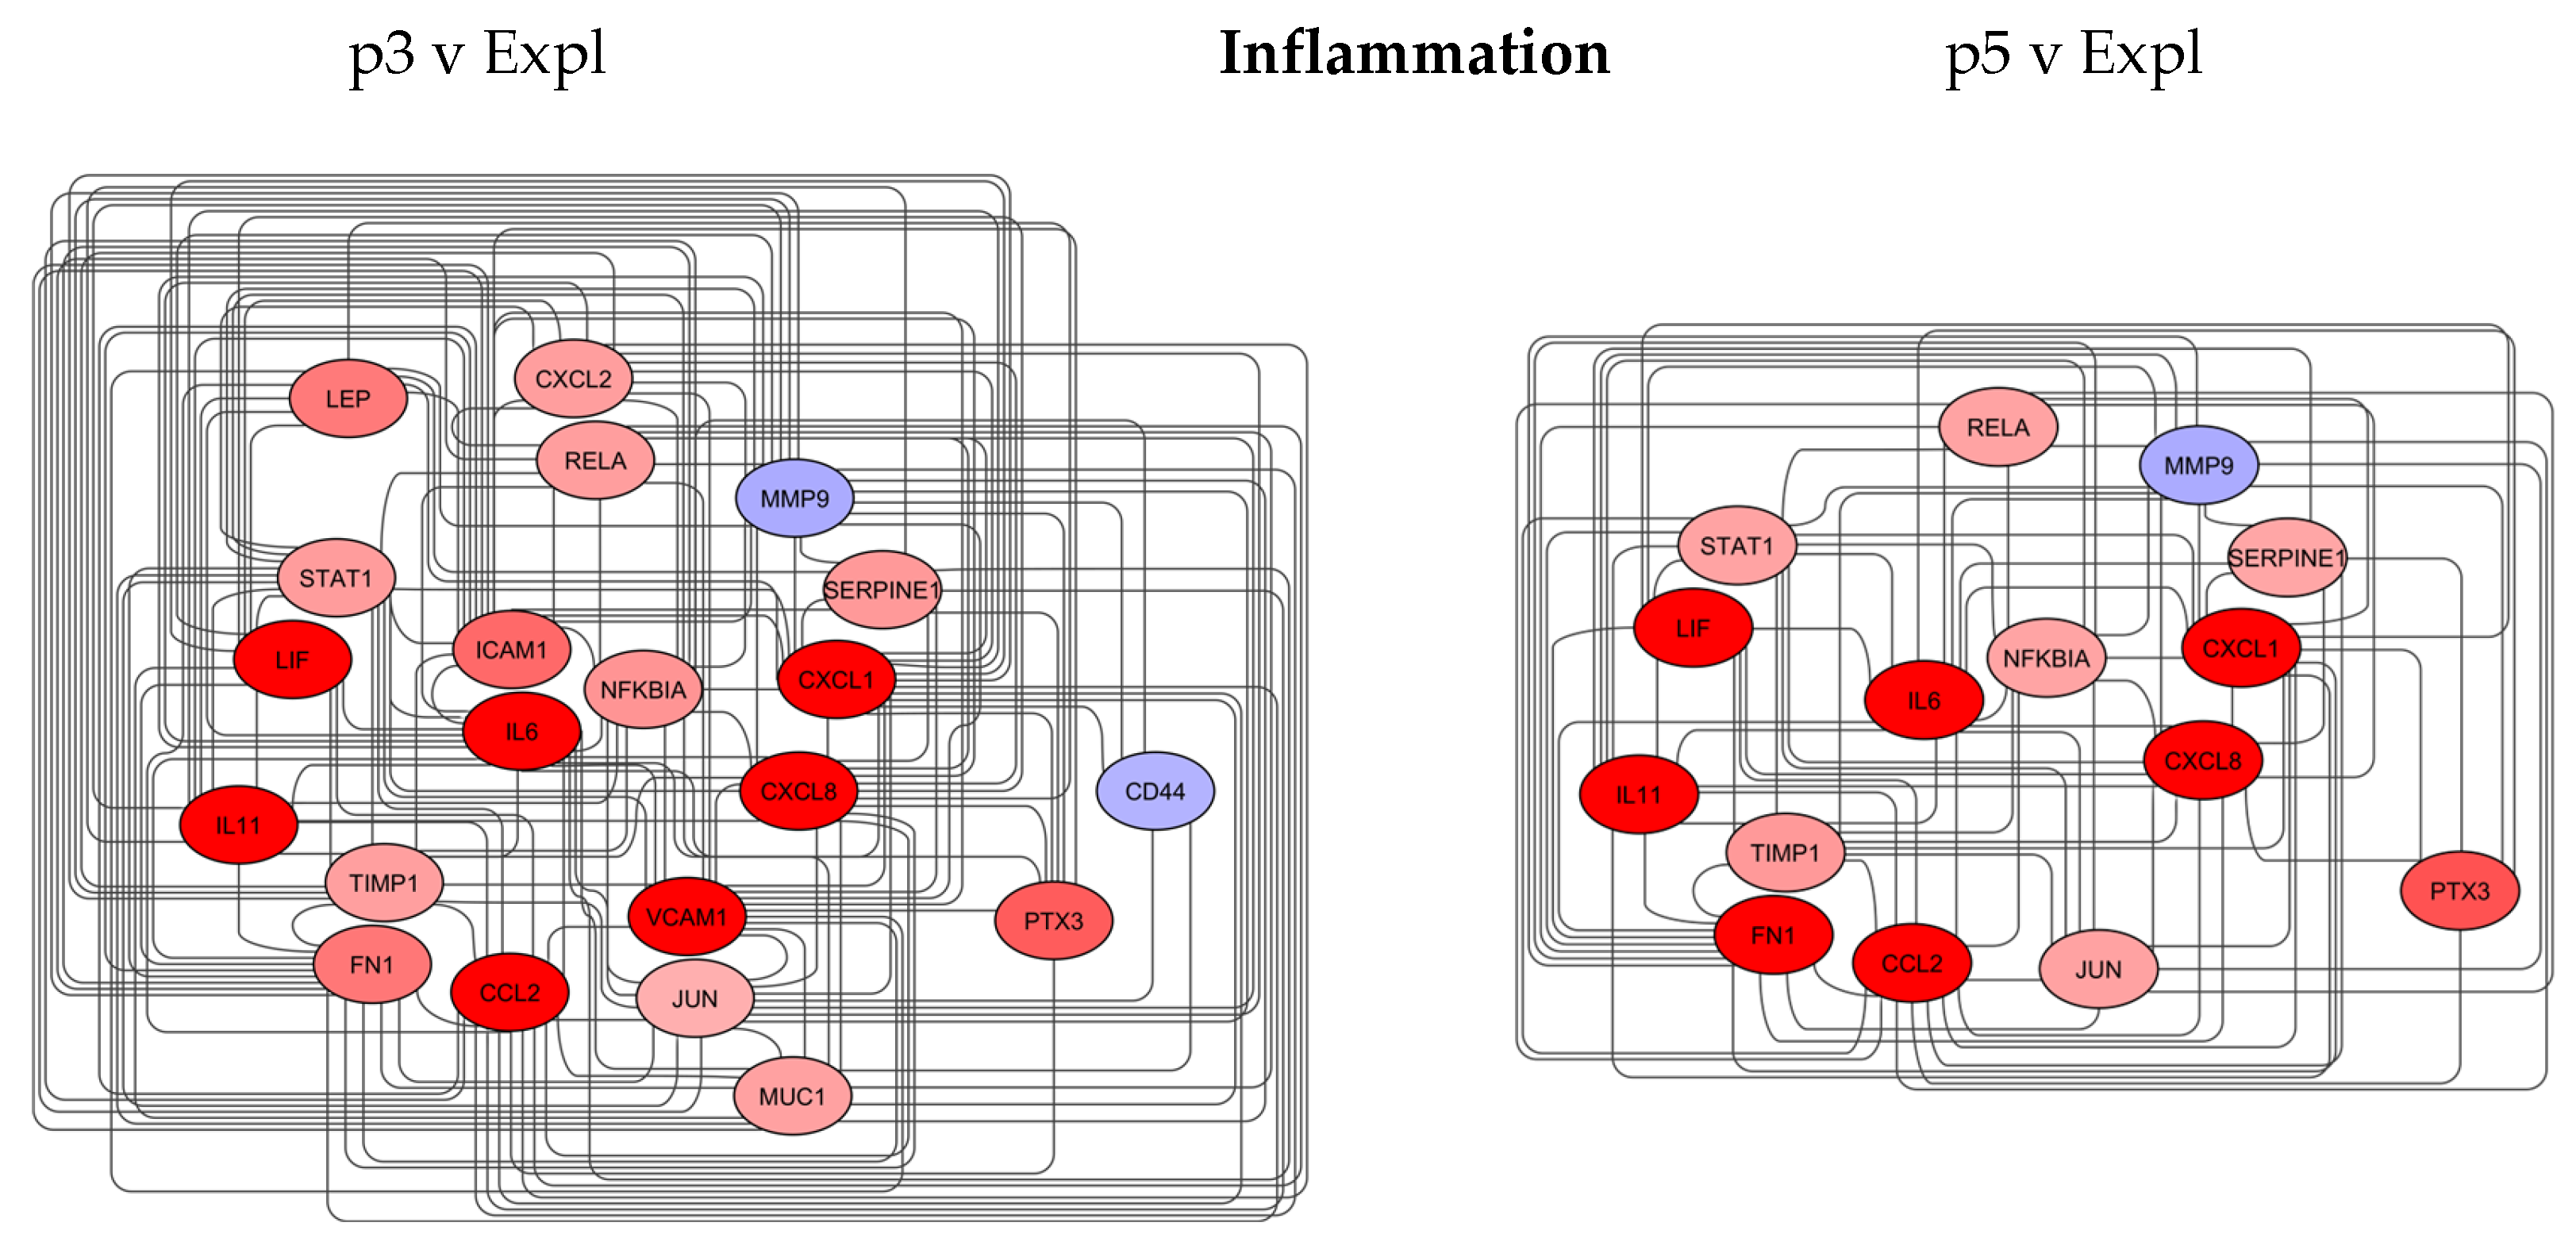
Figure 6.
Changes in the organisation of biomarkers linked to wound healing in young and aged DP cells. A&B) The proliferation and ECM remodelling DP networks were constructed in Cytoscape, with red and blue nodes representing upregulated and downregulated genes, respectively.
Figure 6.
Changes in the organisation of biomarkers linked to wound healing in young and aged DP cells. A&B) The proliferation and ECM remodelling DP networks were constructed in Cytoscape, with red and blue nodes representing upregulated and downregulated genes, respectively.
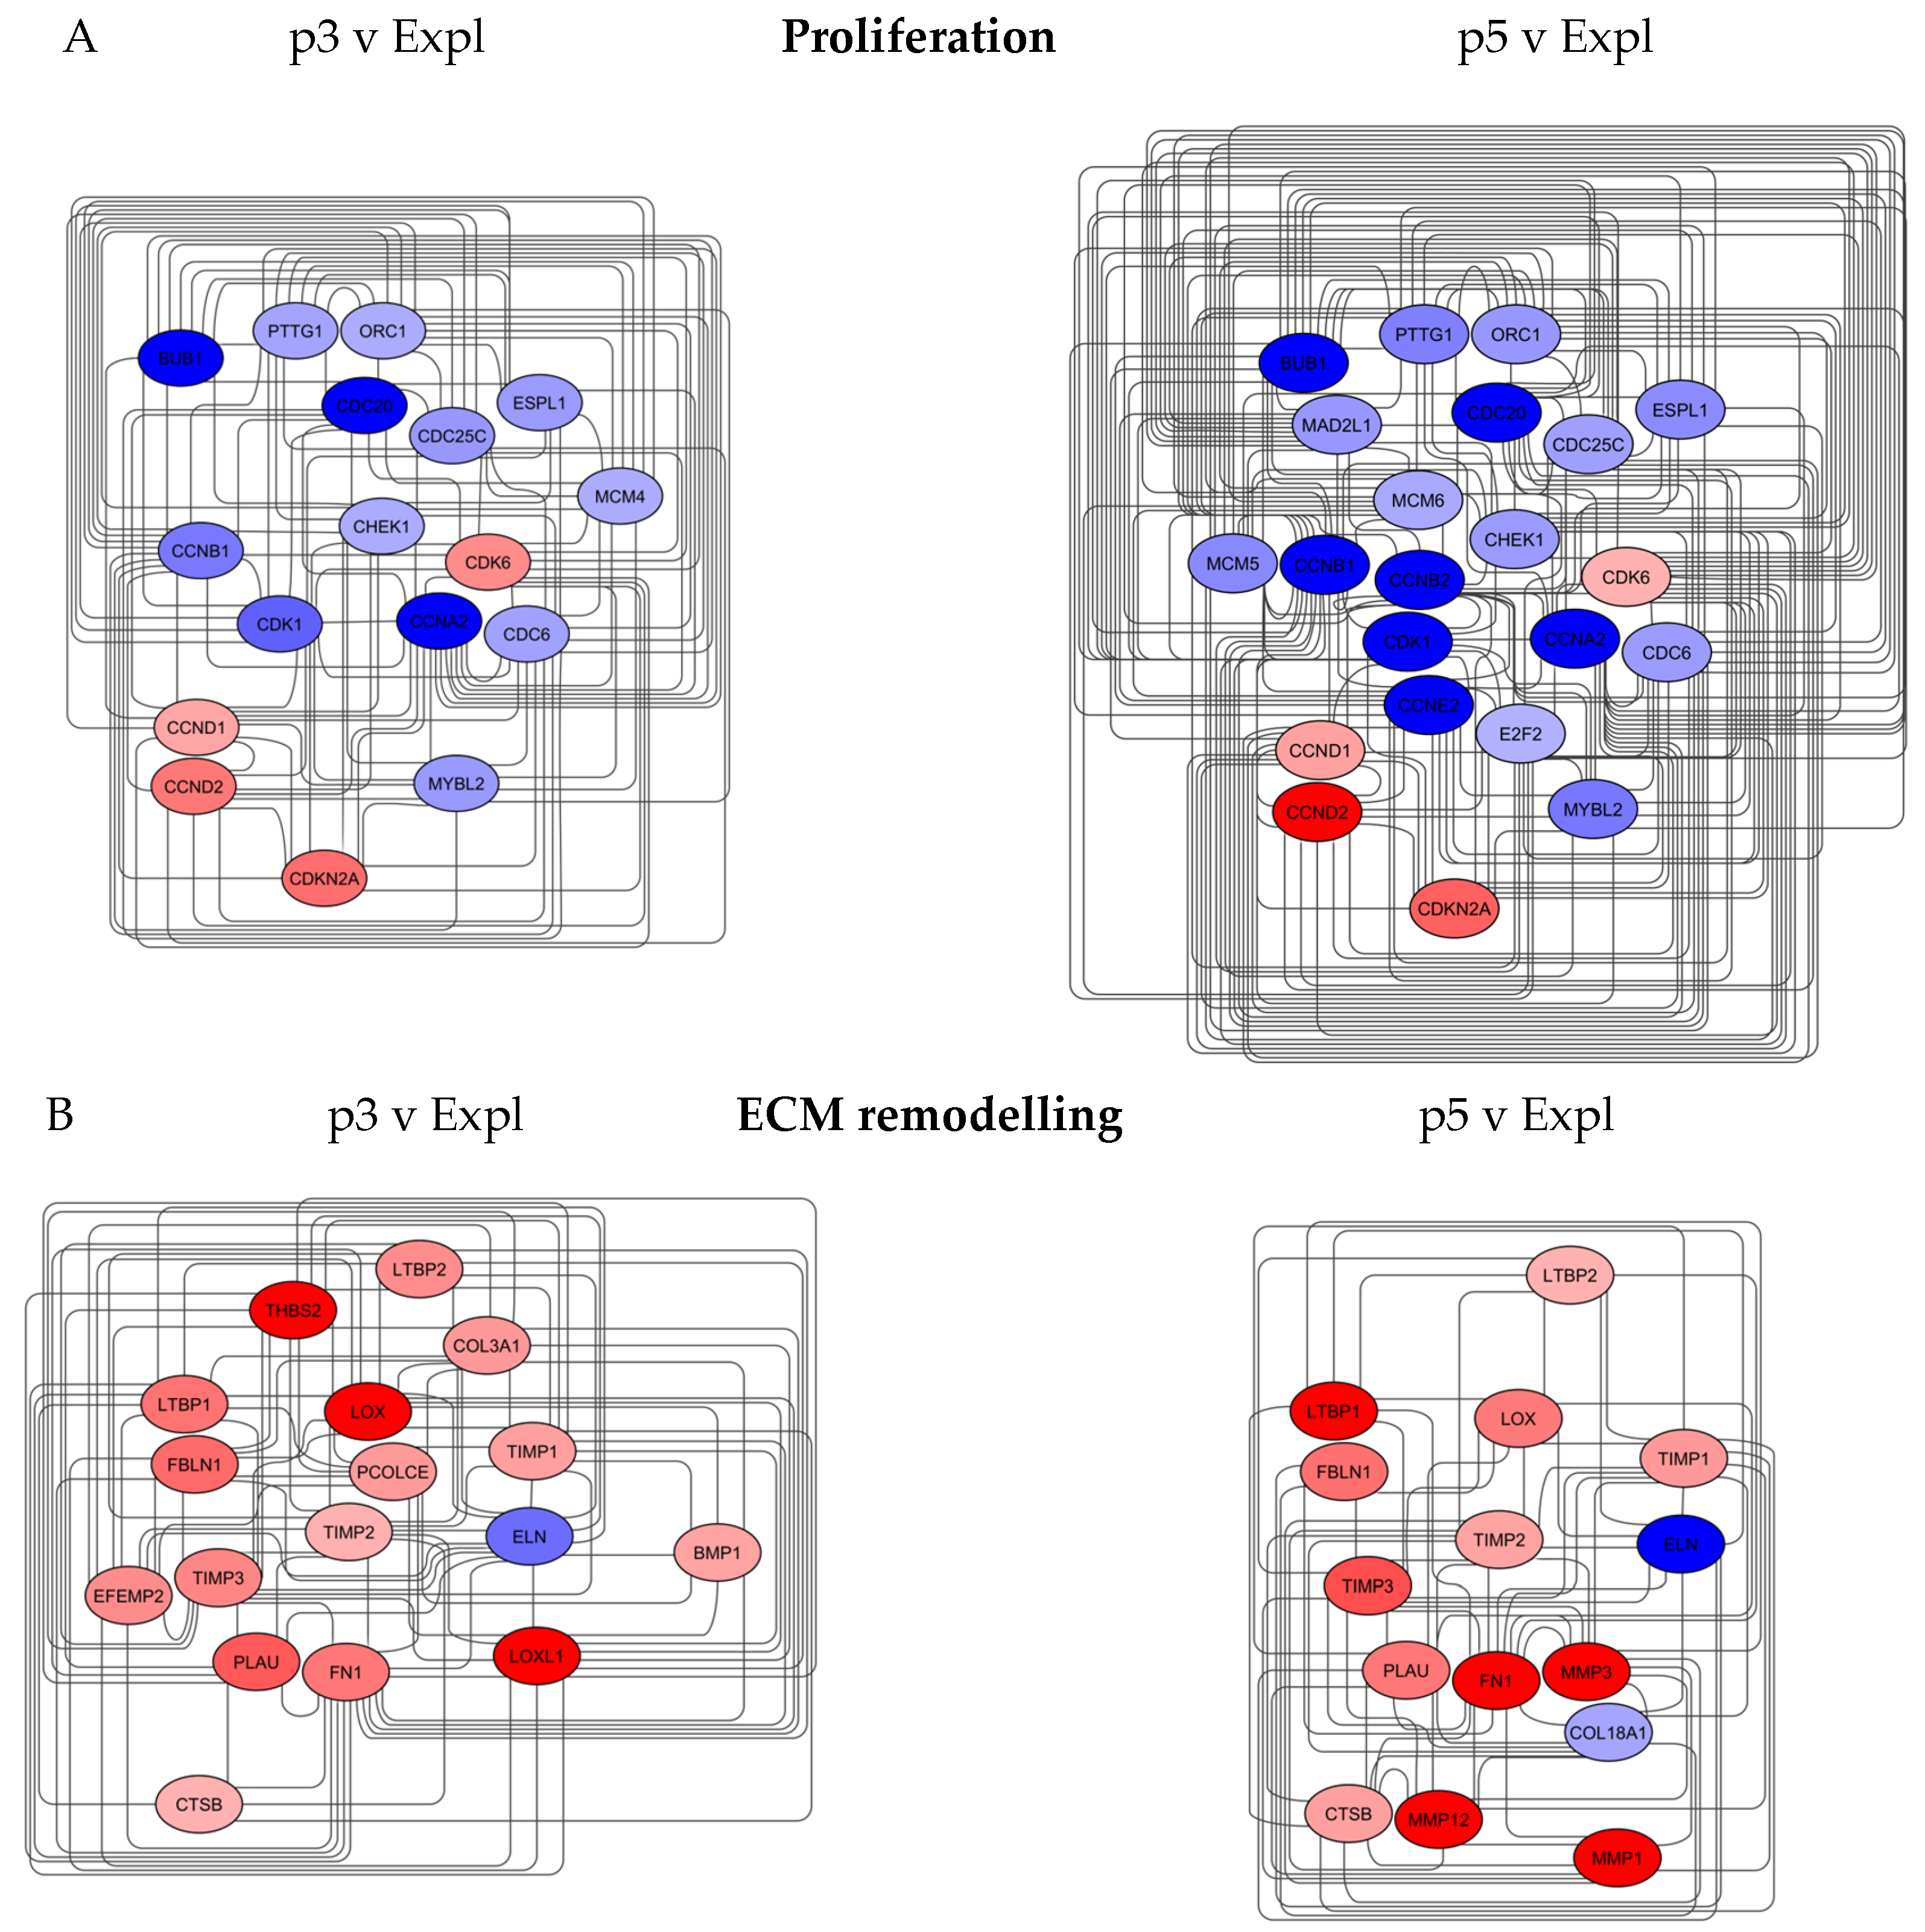
Figure 7.
Network topology and the expression of the significant nodes linked to reprogramming and inflammation in the proliferating and senescent DP cells. A&B) High-confidence functional protein networks were assembled in STRING following k-means clustering, and the significance of the nodes was identified by the average shortest path length (ASPL) algorithm in both p3 v Expl and p5 v Expl networks. C) Expression of central node MYC, the biomarker with the most significant ASPL value (1.72) in p3 v Expl network, alongside the proliferation marker Ki67, by PCR. The graphs are representative of the average signals of MYC and Ki67 band densities from triplicate samples; GAPDH is an internal control. Error bars are SE, p-values: * <0.05.
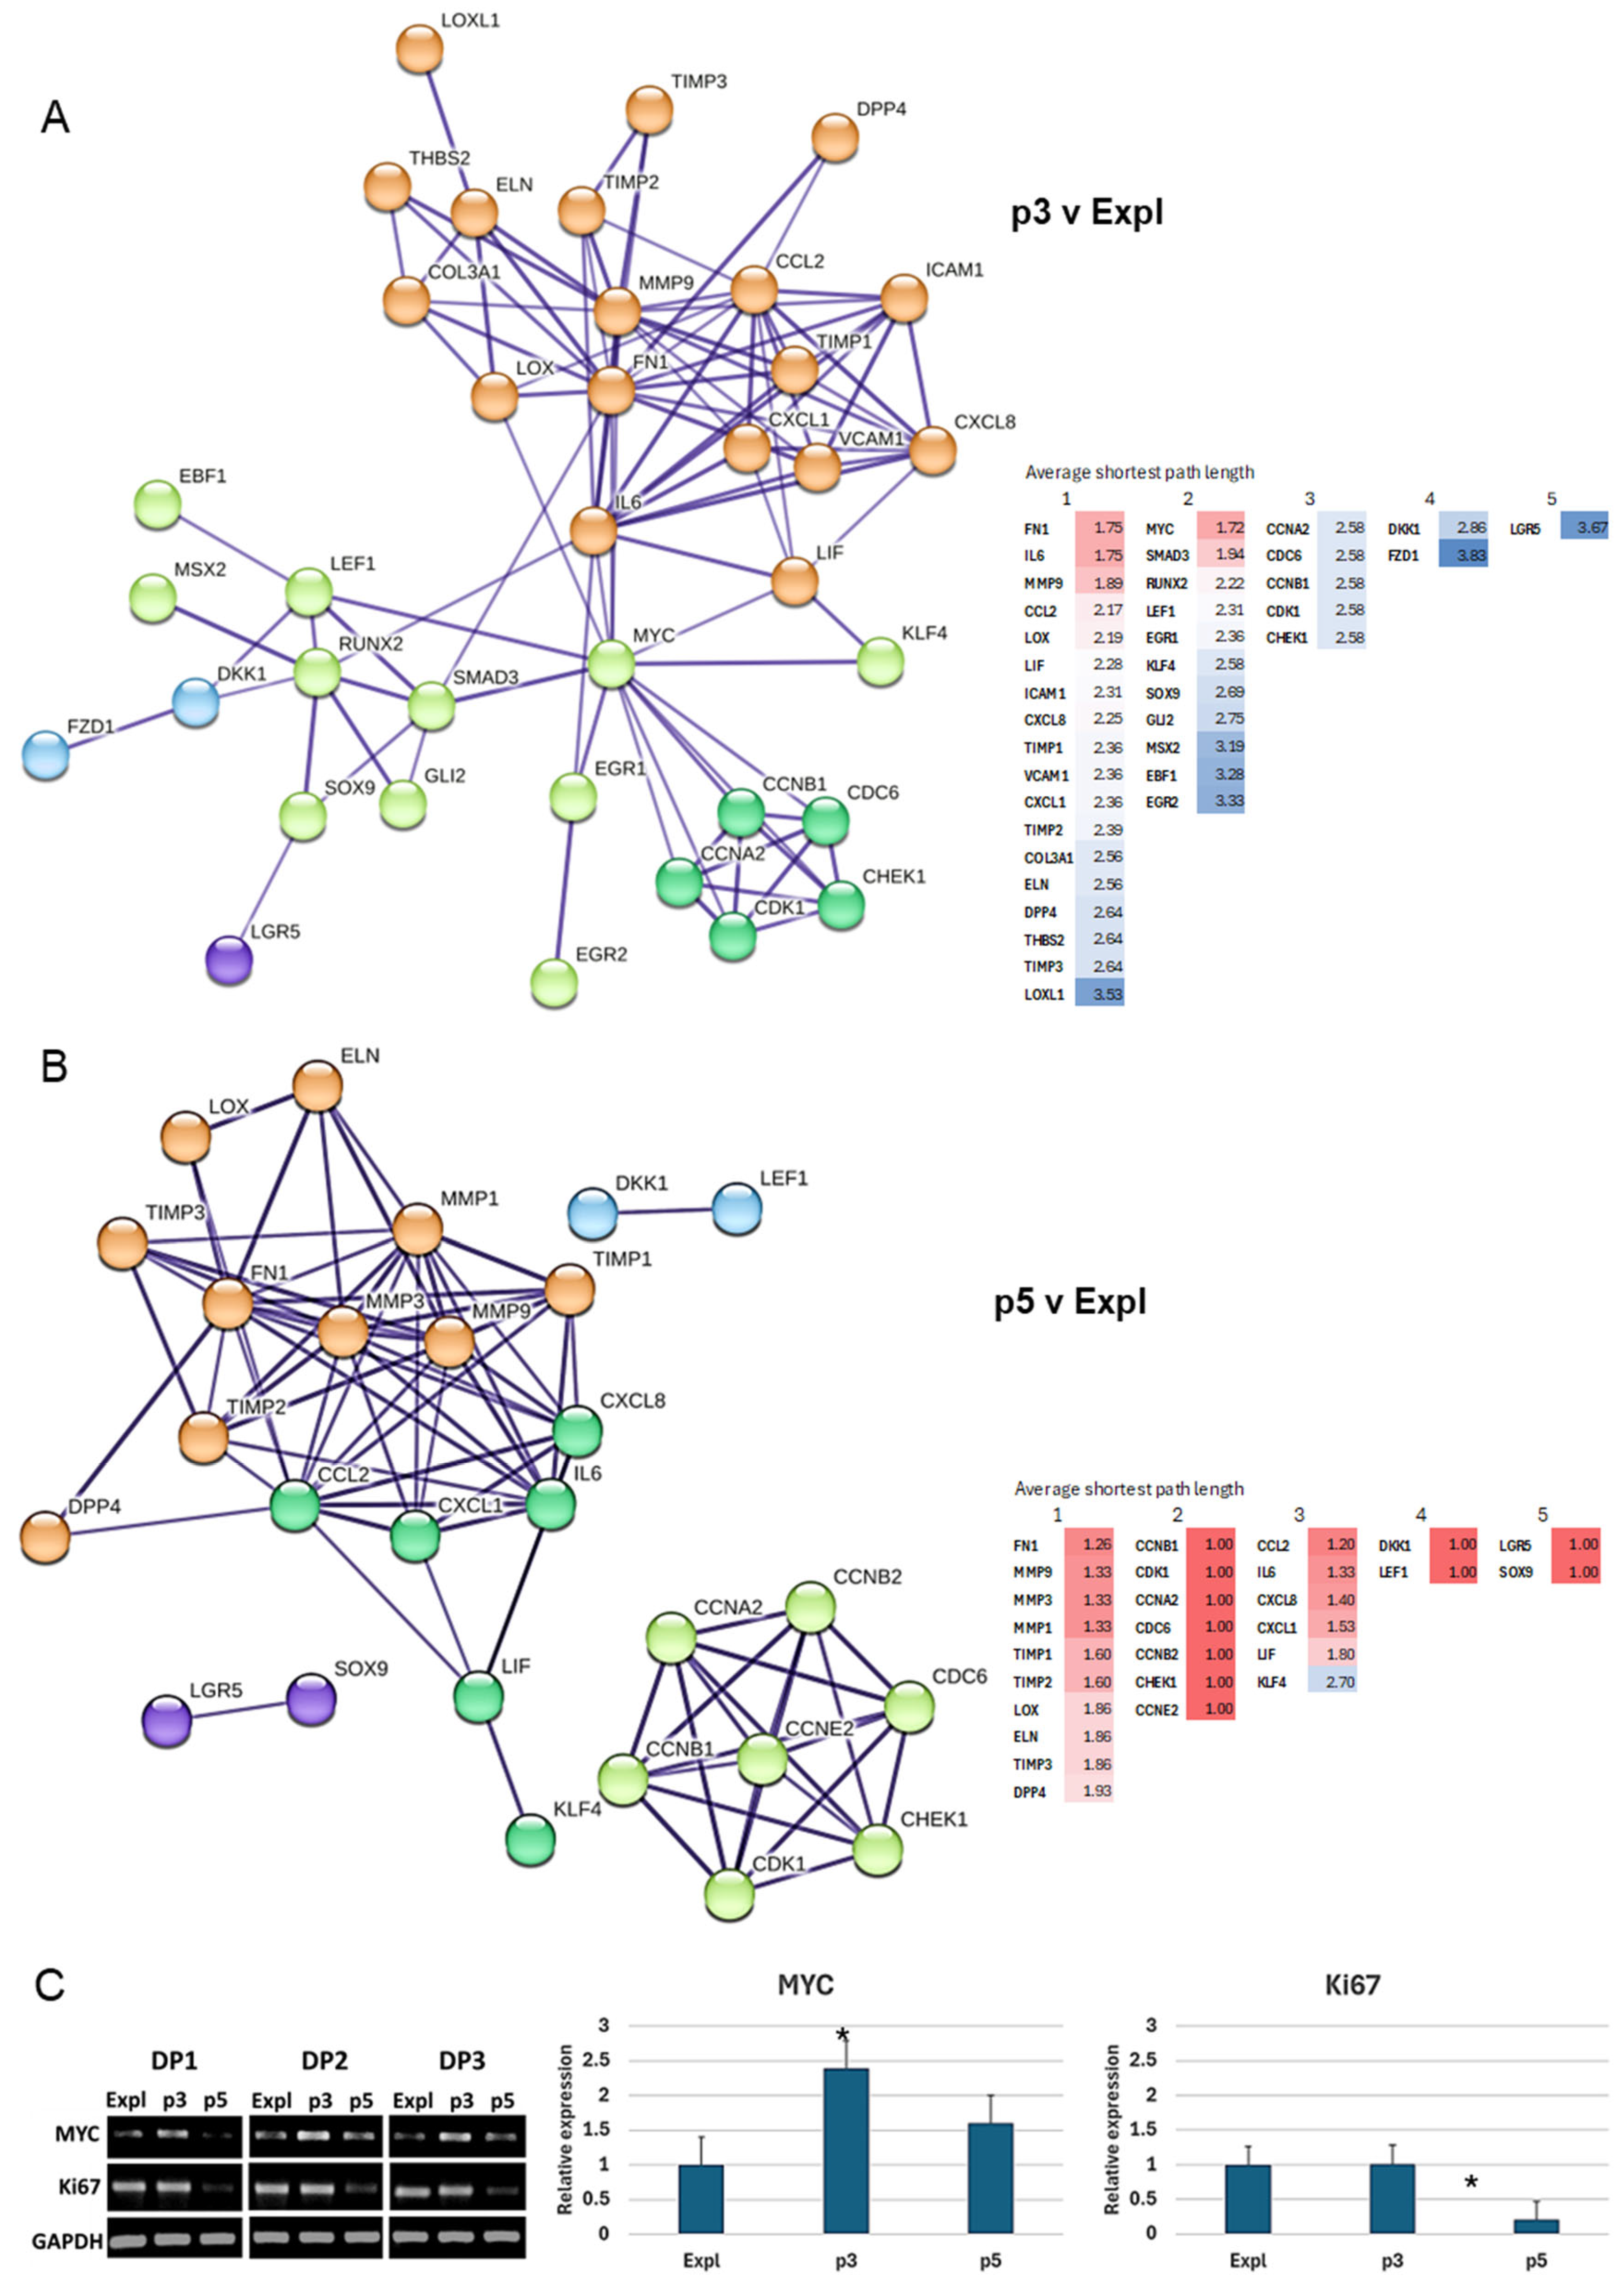
Figure 8.
Working model of the association between regenerative capacity and ageing programmes of DP cells. The pre-senescent DP cells are characterised by proliferation, migration, and molecular changes associated with the catagen phase of the hair growth cycle. The cells are highly susceptible to wound healing responses and express stem cell markers linked to cellular reprogramming. This transient activated state, characterised by the upregulation of the inflammatory markers, indicates a stress response to injury in a highly regenerative system. Such stress response may invoke tissue-repair processes involving the activation of stem cell and hair follicle regeneration markers or ultimately lead to the irreversible, senescent phase and scarring linked to alopecia.
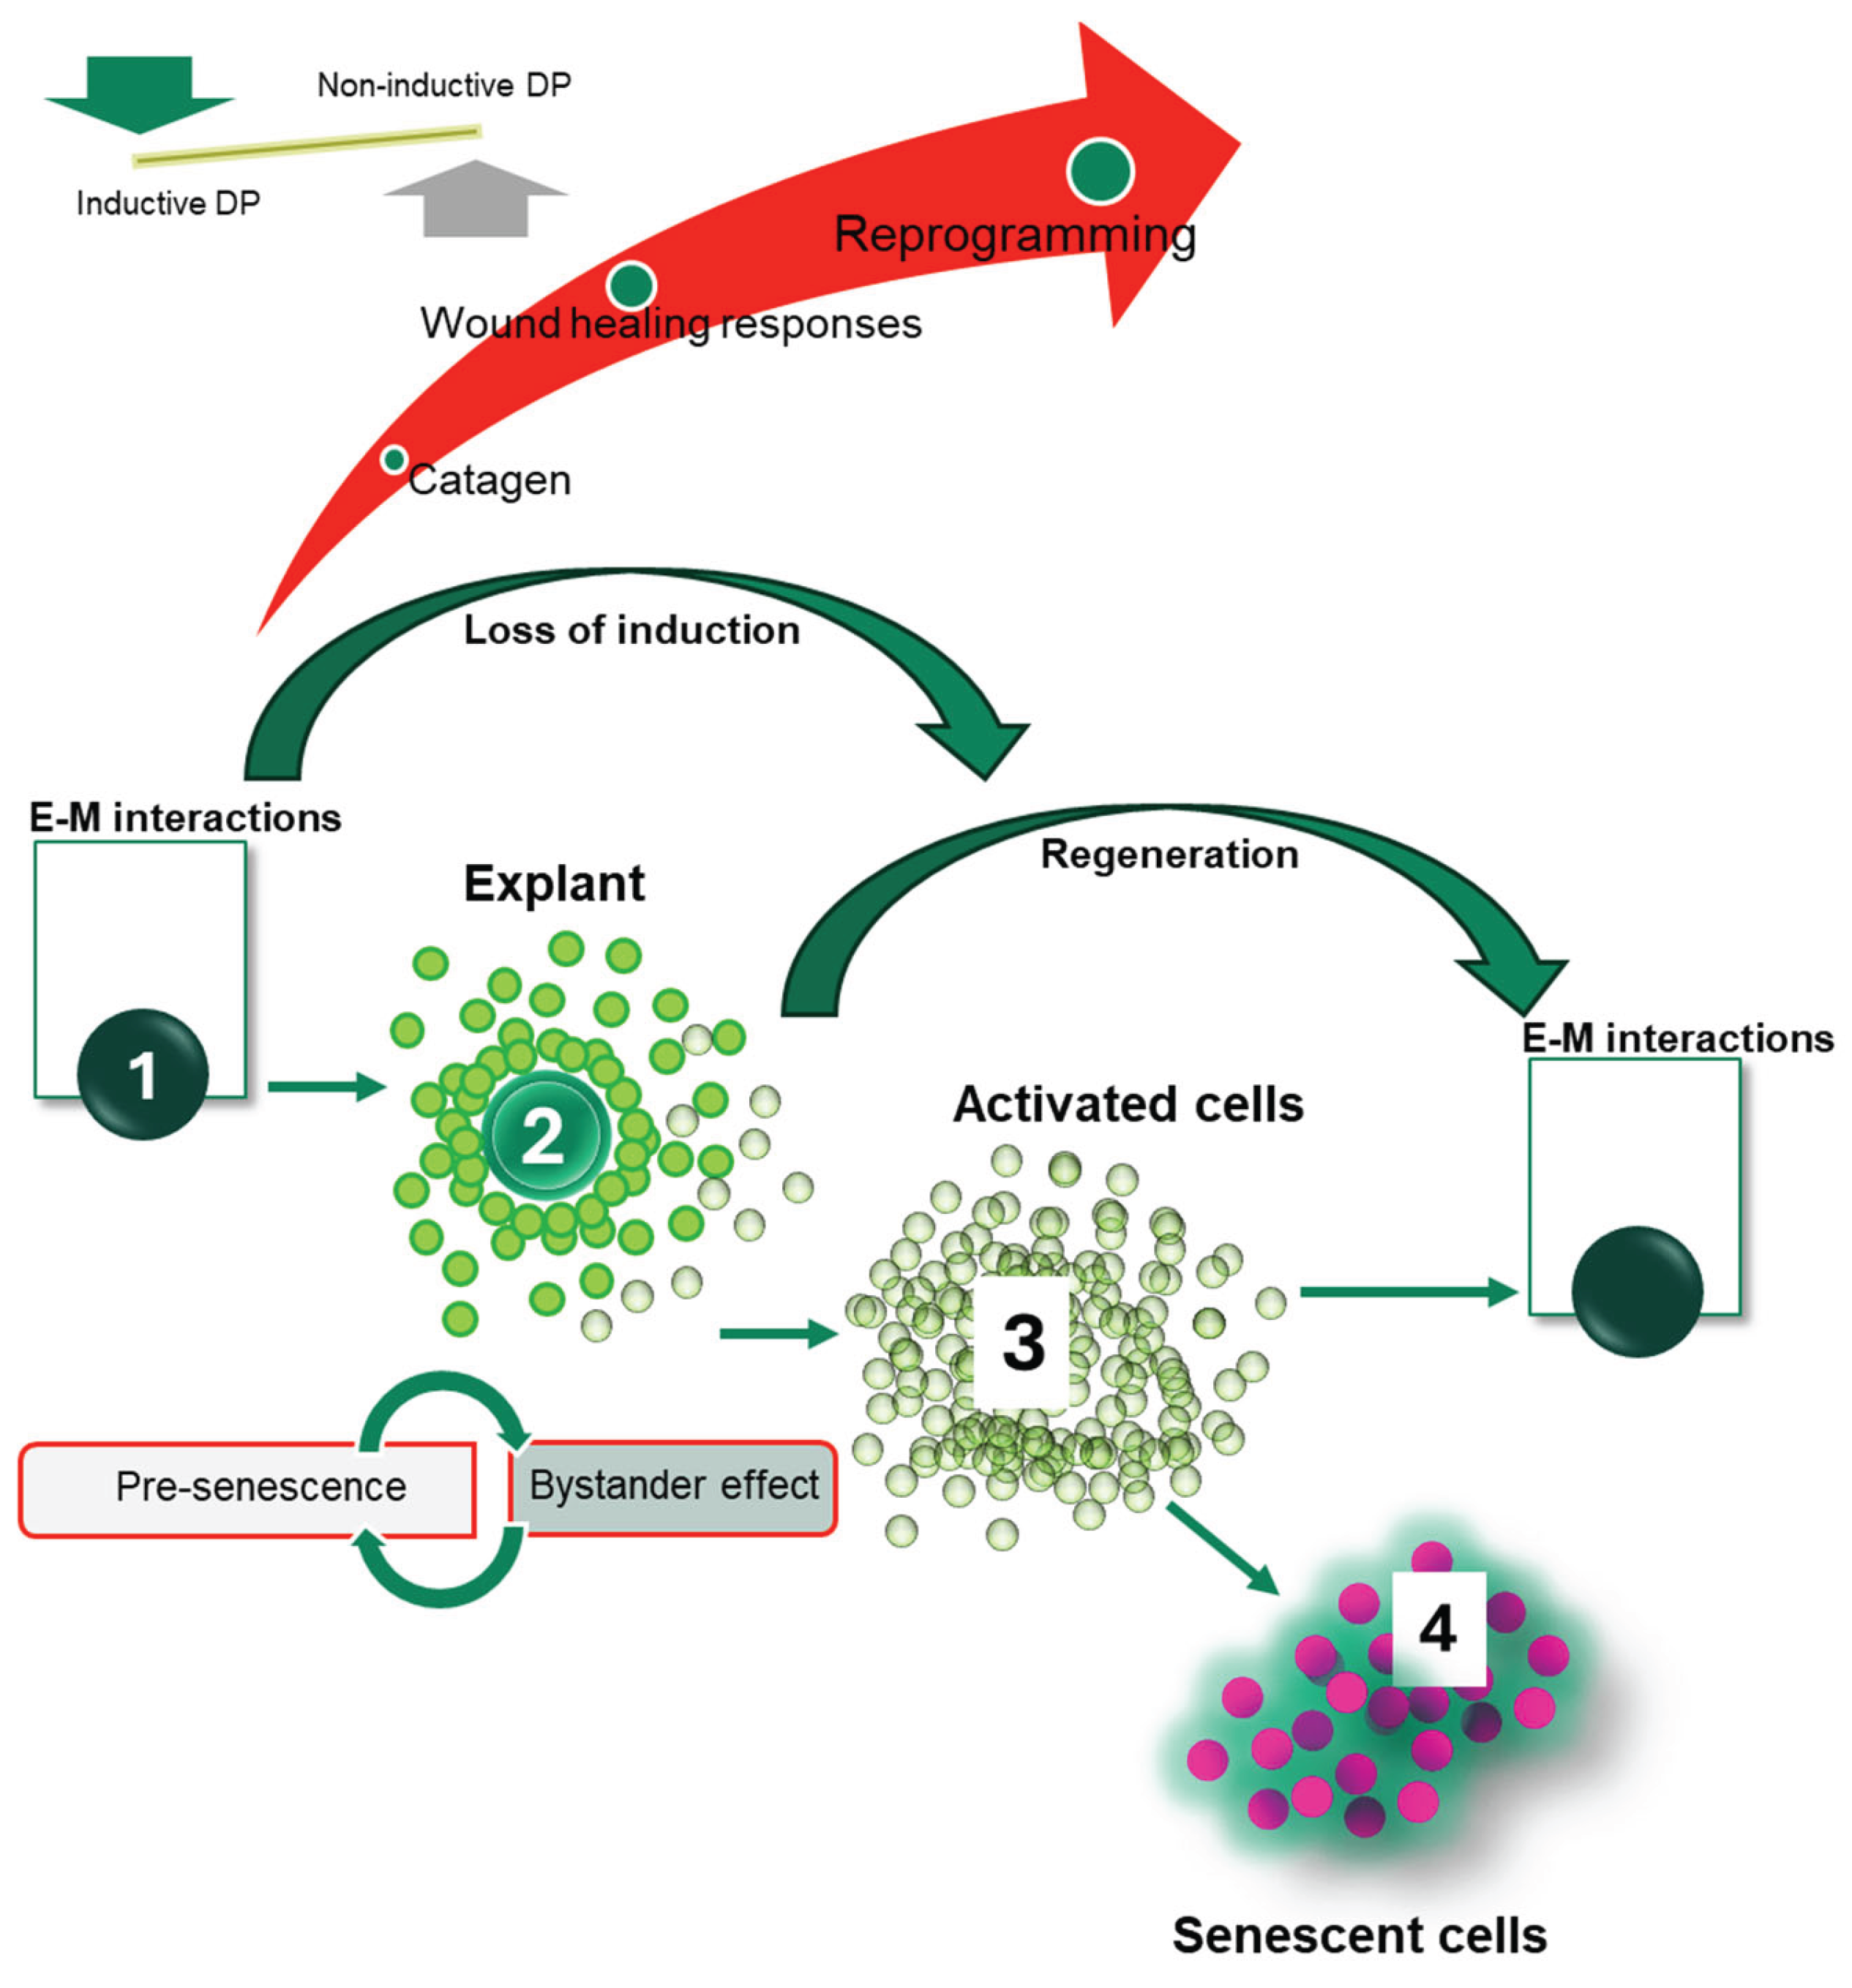

Table 1.
The biomarkers of the Hair Follicle Development and Stem Cell networks.
| Gene symbol | Gene name | UniProt |
|---|---|---|
| LEF1 | Lymphoid enhancer-binding factor 1 | Q9UJU2 |
| GLI2 | Glioma-associated oncogene family zinc finger 2 | P10070 |
| LGR5 | Leucine-rich repeat-containing G protein-coupled receptor 5) | O75473 |
| DKK1 | Dickkopf WNT signalling pathway inhibitor 1 | O94907 |
| SFRP1 | Secreted frizzled-related protein 1 | Q8N474 |
| SOX9 | SRY-Box transcription factor 9 | P48436 |
| NOTCH2 | Notch receptor 2 | Q04721 |
| FZD1 | Frizzled class receptor 1 | Q9UP38 |
| RUNX1 | Runt-related transcription factor 2 | Q13950 |
| MSX2 | Msh homeobox 2, transcription factor) | P35548 |
| MYC | Myelocytomatosis oncogene, transcription factor) | P01106 |
| EGR2 | Early growth response 2, transcription regulatory factor | P11151 |
| KLF4 | Kruppel-like factor 4, transcription factor) | O43474 |
| PAK2 | p21-activated kinase 2 | Q13177 |
| EGR1 | Early growth response 1 | P18146 |
| SMAD3 | Mothers against decapentaplegic homolog 3 | P84022 |
| EBF1 | Early B-cell factor 1 | Q9UH73 |
| KLF5 | Kruppel-like factor 5, transcription factor | Q13887 |
| CCL2 | C-C motif chemokine ligand 2 | P13500 |
| LIF | Leukaemia inhibitory factor, Interleukin 6-class cytokine | P15018 |
| DPP4 | Dipeptyl peptidase 4, T-cell activation antigen CD26 | P27487 |
Table 2.
The biomarkers with dual roles in tissue repair/regeneration and hair follicle function.
| Gene symbol | Stem cell markers | |
| LEF1 | Hair follicle development, the anagen phase of the hair follicle cycle [29] | |
| LGR5 | Marker of stem cells, crucial for hair follicle morphogenesis and maintenance[31] | |
| SOX9 | Maintenance of hair follicle stem cells and growth [34] | |
| NOTCH2 | Maintenance of hair follicle structure and morphogenesis [35] | |
| FZD1 | Maintenance of hair follicle structure and morphogenesis [36] | |
| MSX2 | Hair follicle morphogenesis [41] | |
| MYC | Functions in hair follicle development [43] | |
| EGR2 | Dermal cell fate during hair follicle development [45] | |
| LIF | Reduces hair follicle development and growth [54] | |
| EGR1 | Proliferation of dermal papilla cells and control of hair follicle development [55] | |
| SMAD3 | Promotes transition from telogen and anagen and hair follicle regeneration [56] | |
| EBF1 | Supports the anagen phase of the hair follicle cycle [57] | |
| CCL2 | Immune regulation and enhancement of hair follicle regeneration [58] | |
| KLF4 | Inhibition of hair follicle regeneration, arrest in telogen and early anagen [59] | |
| DPP4 | Pro-fibrotic factor linked to hair follicle growth arrest and alopecia [60] | |
| Gene symbol | Inflammation markers | |
| CXCL1 | Inhibition of the growth and maintenance of the hair follicle [67] | |
| CXCL8 | Inhibition of the growth and maintenance of the hair follicle [68] | |
| MMP9 | A possible role in ECM remodelling during the anagen phase [69] | |
| IL6 | Inhibition of hair growth and promotion of hair follicle regression [70] | |
| ICAM1 | A role in late anagen and catagen of hair follicle cycle, hair follicle regression [71] | |
| Gene symbol | Proliferation and senescence markers | |
| CDC6 | Role in prolongation of the telogen phase of hair follicle cycle [76] | |
| CCNA2 | Positive role in the development of hair follicles and hair density [77] | |
| CCNB1 | May be associated with the promotion of anagen signalling [78] | |
| CCNB2 | Increased expression in the anagen phase and downregulated in resting phase[79] | |
| CDK1 | Increased expression in the anagen phase and downregulated in resting phase[79] | |
| Symbol | Extracellular matrix markers | |
| FN1 | Likely co-operation with other genes to control the hair thickness [88] | |
| LOXL | Hair follicle regeneration linked to the expression of elastin and collagen[89] | |
| MMP2 | Expression and activity increased in anagen and decreased in resting phase [69] | |
| TIMP1 | Expression and activity decreased in anagen [69] | |
| TIMP2 | Expression and activity decreased in anagen [69] | |
| TIMP3 | Expression increased at the beginning of anagen and decreased in catagen [90] | |
Table 3.
The biomarkers of the Inflammation networks.
| Gene symbol | Gene name | UniProt |
|---|---|---|
| CXCL1 | C-X-C chemokine motif ligand 1 | P09341 |
| CXCL8 | C-X-C chemokine motif ligand 8, Interleukin 8) | P10145 |
| MMP9 | Matrix metalloproteinase 9, collagenase | P14780 |
| IL6 | Interleukin 6 | P05231 |
| ICAM1 | Intercellular adhesion molecule 1 | P05362 |
| VCAM1 | Vascular adhesion molecule 1 | P19320 |
Table 4.
The biomarkers of the Proliferation and ECM remodelling networks.
| Gene symbol | Gene name | UniProt |
|---|---|---|
| CDC6 | Cell division cycle 6 | Q99741 |
| CCNA2 | Cyclin A2 | P20248 |
| CCNB1 | Cyclin B1 | P14635 |
| CCNB2 | Cyclin B2 | O95067 |
| CDK1 | Cyclin-dependent kinase 1 | P06493 |
| CCNE2 | Cyclin E2 | O96020 |
| FN1 | Fibronectin 1 | P02751 |
| ELN | Elastin | P15502 |
| COL3A1 | Collagen 3A1 | P02461 |
| LOX | Lysyl oxidase | P28300 |
| LOXL1 | Lysyl oxidase-like gene 1 | Q08397 |
| THBS2 | Thrombospondin 2 | P35442 |
| TIMP1 | Tissue inhibitor of metalloproteinases 1 | P01033 |
| TIMP2 | Tissue inhibitors of metalloproteinases 2 | P16035 |
| TIMP3 | Tissue inhibitors of metalloproteinases 3 | P35625 |
| MMP1 | Matrix metalloproteinase, Interstitial collagenase | P03956 |
| MMP3 | Matrix metalloproteinase, Stromelysin-1 | P08254 |
| MMP12 | Matrix metalloproteinase, Macrophage metalloelastase | P39900 |
Disclaimer/Publisher’s Note: The statements, opinions and data contained in all publications are solely those of the individual author(s) and contributor(s) and not of MDPI and/or the editor(s). MDPI and/or the editor(s) disclaim responsibility for any injury to people or property resulting from any ideas, methods, instructions or products referred to in the content. |
© 2025 by the authors. Licensee MDPI, Basel, Switzerland. This article is an open access article distributed under the terms and conditions of the Creative Commons Attribution (CC BY) license (http://creativecommons.org/licenses/by/4.0/).
Copyright: This open access article is published under a Creative Commons CC BY 4.0 license, which permit the free download, distribution, and reuse, provided that the author and preprint are cited in any reuse.


