Submitted:
23 December 2025
Posted:
24 December 2025
You are already at the latest version
Abstract
An optical fiber chemical sensor using a molecularly imprinted chitosan membrane coated on the surface of a bent optical fiber probe was developed for selectively analyzing 4-nitrophenol (4-NP) in water samples. When the sensor probe was exposed to a water sample, the chitosan MIP membrane extracts/concentrates 4-NP from water sample into the membrane. The 4-NP extracted into the membrane was detected by passing a light beam through the optical fiber, and the interaction of 4-NP in the membrane with evanescent wave of light guided through the optical fiber was detected as a sensing signal. This sensor detects the intrinsic optical absorption signal of 4-NP itself as a sensing signal. No chemical reagent was needed in analyzing this compound in a sample. The sensor is reversible, can be used for continuous monitoring of 4-NP in a sample, and has quick response with a response time of 5 min. The sensor has high sensitivity and selectivity because the MIP membrane selectively concentrates 4-NP by 1.4*104 times into the membrane from a sample solution, but blocks out interference species, including its isomers and derivatives, from entering the membrane. The sensor achieved a detection limit of 2.5 ng/mL (0.018 µM), which is lower than most reported analytical techniques for analyzing this compound in water sample. This sensor can discriminate 4-NP from its isomers and derivatives, such as 2-NP, 3-NP, 2-Cl-4-NP, 2,4-di-NP with a selectivity factor ranging from 104 to 1922. The sensor has been used for analyzing 4-NP in a standard addition sample. The obtained recovery rate ranged from 93% to 101%, demonstrating the application potential of this sensor in water quality analysis.
Keywords:
optical fiber chemical sensor
; molecularly imprinted polymer
; 4-nitrophenol
; solid phase microextraction
; bent optical fiber probe
1. Introduction
4-nitrophenol (4-NP) is a powerful carcinogen which is in the US Environmental Protection Agency’s priority toxic pollutant list [1,2]. The sources of 4-NP contamination include leather process, synthesis of many industrial products such as explosives, herbicides, pesticides, petrochemicals, pharmaceuticals, synthetic dyes [3,4]. In addition, the degradation of pesticides such as parathion and nitrofen also generates 4-NP in the environment [5,6,7]. It is difficult to remove this compound once entered into environment, such as ground/underground water, due to its high solubility in water and stability in the environment. Remediation methods to remove this compound include electrochemical reduction, adsorption onto biochars, microwave irradiation, chemical reduction, and bioremediation [8,9,10]. Analytical technologies capable of quick analyzing or continuous monitoring 4-NP concentration in environmental samples are needed for cost-effective removal of this pollutant.
4-NP is an oxidant, and it can be reduced on an electrode with appropriately applied potential. Therefore, electrochemical analytical techniques have been developed for analyzing this compound in environmental samples. Electrochemical detection techniques such as cyclic voltammetry, linear sweeping voltammetry, and differential pulse voltammetry have been reported with different electrodes for 4-NP analysis [8,11,12,13]. However, redox reaction of other compounds co-existing with 4-NP in sample solution causes interference to most of these electrochemical methods. Intensive efforts have been devoted to modifying electrodes with organic polymers, noble metal nanomaterials, carbon nanotube (single wall or multiwall), and reduced graphene oxide in order to increase the selectivity, but with only limited success.
4-NP absorbs light with peak absorption wavelength at 320 nm [14,15]. However, it is almost impossible to use this intrinsic optical absorption property to directly analyze this compound in environmental samples due to the co-existence of interference species. A separation technique must be applied to separate this compound from the sample matrix before detecting with optical absorption spectrometry. Solvent extraction, solid phase microextraction (SPME), HPLC, and capillary electrophoresis have been reported for separating 4-NP from environmental sample, followed by UV/Vis absorption spectrometric detection [14,15,16,17]. There are also other analysis techniques, such as fluorescence spectrometry and mass spectrometry, which having been reported for detecting 4-NP after separating the analyte from sample matrix [18,19,20]. These traditional analytical techniques involve sophisticated instruments (HPLC, mass spectrometer) which have to be installed in an environment well controlled laboratory and operated by well-trained scientists or tedious procedures (such as extraction separation, adsorption/desorption). More convenient, quick and field-deployable techniques are desired for monitoring environmental remediation process of removing this pollutant.
Molecularly-imprinted polymer (MIP) is a recently developed material used for separation in environmental remediation as well as in analytical chemistry [21,22]. An MIP is synthesized by cross-linking a monomer in the existence of a template molecule. The template compound is enclosed in the formed polymer after polymerization with specific bonding (covalent bond, hydrogen bond, ionic attraction) with the polymer’s side chain. The template molecules can be washed out of the formed polymer with an appropriate reagent. After removing the template, a polymer with pores which are geometrically complementary to the shape of the template molecule, and with specific bonding site to bond the template molecule, was formed. Therefore, an MIP made from such a process will be highly selective in extracting the template molecules from a sample solution. This material can be used for separating an analyte, which has been used as a template for synthesizing the MIP, from the sample matrix before applying an appropriate technique to detect the compound.
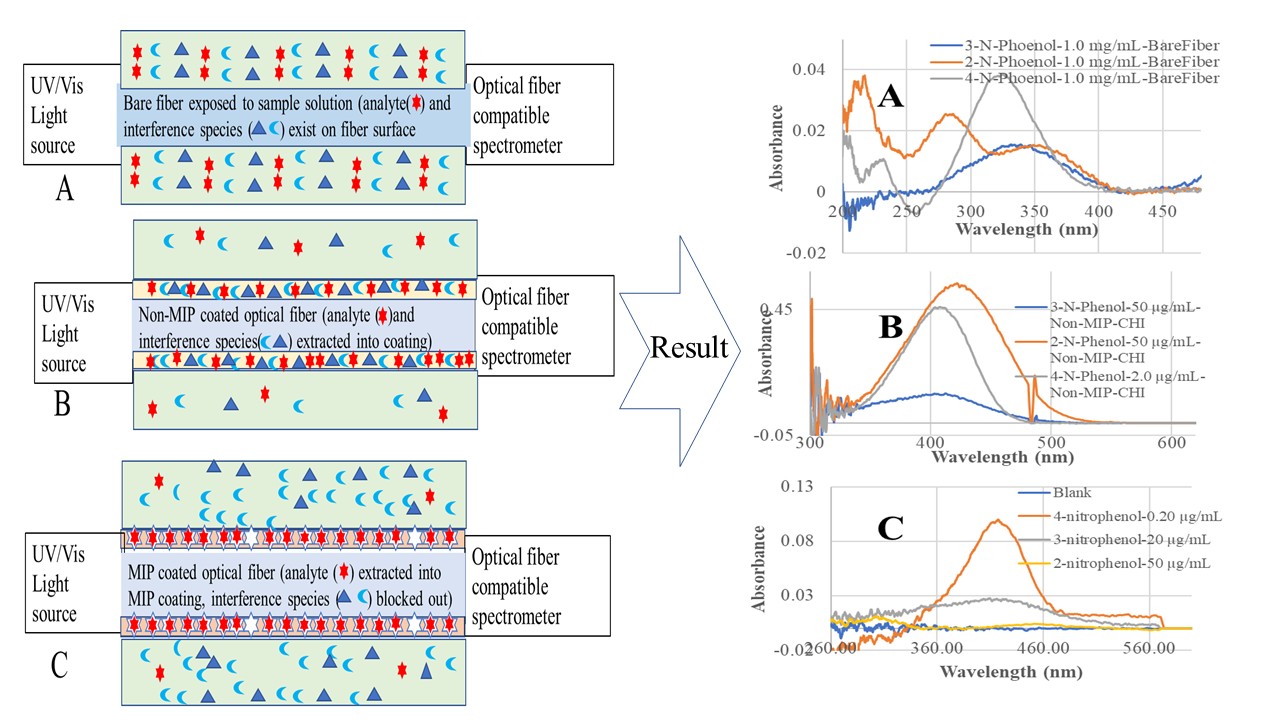
In recent developments, we integrated MIP-SPME with our previously developed evanescent wave optical fiber chemical sensor (EW-OFCS) technique using a bent optical fiber probe (BOFP) as an optical waveguide [23,24,25,26,27,28]. The advantages of this MIP-SPME-EW-OFCS technique are diagrammatically demonstrated in Figure 1. MIP-SPME selectively concentrates analyte from a sample solution, and in the same time blocks out interference species from entering the membrane. Although optical fiber EW absorption spectrometry is a technique with limited sensitivity due to limited interaction pass-length [29,30], our MIP-SPME-EW-OFCSs achieved high sensitivity with detection limits in sub-µg/mL range, due to MIP-SPME’s high concentration factor. Compared with a non-MIP membrane, a MIP membrane is highly selective in extracting target analyte due to MIP’s selective adsorption nature. Our reported MIP-SPME-EW-OFCSs have been successfully used to analyze trace organic acids and caffeine in complex food and pharmaceutical products [23,24,25,26,27,28].
In this work, we integrated the MIP-SPME with EW-OFCS technique in an effort to develop a chemical sensor for quick analysis of 4-NP in environmental samples. A chitosan MIP membrane was synthesized with 4-NP as a template and was coated on the surface of a BOFP. After washing out 4-NP template from the membrane, the BOFP can be used for analyzing 4-NP by simply inserting the bent probe into a water sample, and monitoring 4-NP’s intrinsic optical absorption signal at 410 nm by passing a light beam through the BOFP.
2. Experimental
2.1. Chemicals
Deionized (DI) water was used for preparing aqueous solutions in this work. 2-nitrophenol, 3-nitrophenol and 4-nitrophenol were all purchased from Sigma-Aldrich (C6H5NO3, >98%, Sigma-Aldrich, St. Louis, MO, USA). These reagents were directly used for preparing standard NP solutions without further purification. In preparing a NP standard solution, a solid reagent powder was weighted with an analytical balance and directly dissolved in DI water of appropriate volume.
A chitosan solution of 10 mg/mL in 2% of acetic acid solution was prepared by mixing 0.50 grams chitosan powder (chitosan from shrimp shells, practical grade, Sigma-Aldrich,) with 49 mL DI water and 1.0 mL glacial acetic acid (CH3CO2H, ReagentPlus, >99%, Sigma-Aldrich) with magnetic stirring at room temperature for 12 hours.
A 4-NP templated chitosan MIP coating solution was prepared by mixing 1 mL of the chitosan solution, 0.10 mL of a 5 mg/mL 4-NP solution and 50 µl of 25% glutaraldehyde (GTA, OHC(CH2)3CHO, grade II, 25% solution in water, Sigma-Aldrich) solution. The mixture was vigorously shacked for 1 minute before coating. The coating solution was prepared immediately before coating the solution on the surface of a BOFP. 2-NP and 3-NP templated chitosan MIP coating solutions were also prepared using the same volumes of chitosan, GTA and template solutions, but the concentrations of 2-NP and 3-NP were 1 mg/mL.
All other chemical reagents used in this work were analytical reagent grade and were used without further purification.
2.2. Instruments
An optical fiber compatible UV/Vis spectrometer (USB4000, OceanOptics, Dunedin, FL, USA) was used together with computer software (OceanView, OceanOptics) for recording fiber optic spectrum (intensity, absorbance, time response at selected wavelength, etc). An optical fiber compatible deuterium/tungsten light source (DH2000, OceanOptics) was used as the light source for the fiber optic spectrometric measurement. A Nicolet iS5 FTIR spectrometer (Thermo Fisher Scientific, Madison, WI, USA) was used to study a pure 4-NP powder sample, membranes of chitosan, GTA-crosslinked chitosan, and 4-NP-templated chitosan MIP polymer. This instrument comes with a diamond crystal attenuated total reflection (ATR) accessory. ATR-FTIR spectra of the 4-NP and polymer membranes were recorded by placing the powder sample or a polymer membrane on the ATR sample adaptor and pressing the sample tightly in attached with the diamond crystal, and then recording the transmittance spectrum with air as reference sample.
2.3. Prepare a BOFP and Coat the BOFP with GTA Cross Linked Chitosan, 2-NP, 3-NP, 4-NP Templated Chitosan MIP Membranes
A deep UV transmittance-enhanced optical fiber (FG200AEA, fiber core/cladding diameter = 200/220 µm, Thorlabs, Newtown, NJ, USA) was used to prepare a “U” shaped BOFP, because some of the compounds tested in this work absorb light below 350 nm. The center part of a 30 cm strait fiber was inserted into a small butane flame. About 1 cm of the fiber’s jacket and cladding (both are organic polymers) was burnt off in the butane flame. The optical fiber core was further forced to bent in the high temperature flame to for a “U” shaped structure. After cooling down to room temperature, the “U” shaped optical fiber core was inserted into a K2Cr2O7/H2SO4 wash solution (caution: this wash solution is very corrosive, and should be used with caution) to wash off any organic species from optical fiber core surface. The “U” shaped part of the BOFP was then inserted into a concentrated hydrofluoric acid solution (caution: concentrated hydrofluoric acid is poisonous and should be handled with caution) for 20 minutes in order to reduce the fiber core’s diameter of the “U” shaped part to increase EW-OFCS’s sensitivity [31,32]. Due to the limited availability of microscope, the diameter of the “U” shaped part was not precisely measured in this work. The optical fiber probe was then rinsed with DI water and inserted into a 1 M NaOH solution for >20 min to activate the -OH groups on optical fiber core surface. The BOFP was rinsed with water again and air-dried before coating a chitosan membrane on it.
In coating a chitosan MIP membrane on the BOFP surface, the “U” shaped probe was inserted into the corresponding chitosan MIP coating solution and moved out slowly. The coated BOFP was letting to gelation in air overnight before use.
A single BOFP was used in this work to prepare different chitosan membrane coatings (non-MIP chitosan, 2-NP templated MIP, 3-NP templated MIP, and 4-NP templated MIP) on its surface. It is possible to compare the sensitivity of SPME-EW-OFCS sensors of different membranes using a single BOFP because the sensitivity of BOFP-EW-OFCS depends on BOFP’s structure (“U” shaped fiber core diameter and bending diameter) [29,30]. In order to use a single BOFP to prepare different chitosan membrane coatings, the K2Cr2O7/H2SO4 wash solution was used to remove a non-MIP chitosan membrane or a chitosan MIP membrane from the BOFP surface by inserting the bent part of the BOFP into the wash solution for >12 hours. This polymer-removed BOFP was then activated by using the 1 M NaOH solution and rinsed with DI water before next coating operation.
2.4. ATR-FTIR Studies Membranes of Chitosan, GTA-Crosslinked Chitosan, 4-NP-Templated Chitosan and a Pure 4-NP Powder Sample
ATR-FTIR was used to study pure 4-NP and membranes of the polymers involved in this work, including chitosan, GTA cross linked chitosan, and 4-NP-templated chitosan MIP in order to verify 4-NP’s immobilization in chitosan MIP. The 4-NP reagent sample was grinded with ceramic pestle and mortar before placing the reagent sample onto iS5’s ATR adaptor for recording its FTIR spectrum. The polymer membranes were made by delivering the following polymer solutions onto glass microscopic slides and letting the solution to gelation/drying for >24 hours: a 1 mL of the 10 mg/mL chitosan in 2% acetic acid solution, a mixture of 1 mL of the 10 mg/mL chitosan solution plus 50 µL of the 25% GTA solution, a mixture of 1 mL of the 10 mg/mL chitosan solution, 50 µL of the 25% GTA solution, and 100 µL of a 5 mg/mL 4-NP solution. The formed membranes were removed carefully from the glass slides with a sharp blade and placed onto the ATR adaptor for recording their FTIR spectra.
2.5. Fiber Optic EW Spectrometry Monitors the Washing Out of Template Molecules from Chitosan MIP Membrane
The two ends of a chitosan MIP membrane coated BOFP were connected to the USB 4000 optical fiber compatible spectrometer and the DH2000 combo light source with SMA connectors, respectively. When the BOFP was just inserted into water in a small reagent bottle, the light intensity spectrum was recorded as a reference intensity spectrum for measuring fiber optic EW absorption spectrum. During the time the BOPF was inserted in DI water to wash out template molecules from the membrane, the optical fiber EW absorption spectrum was monitored and recorded at different time intervals.
2.6. Analyze 4-NP in Aqueous Sample Solutions with the Chitosan MIP Coated BOFP
After washing out 4-NP template molecules from the chitosan membrane, a new reference light intensity spectrum was recorded for measuring fiber optic EW absorption spectrum of a 4-NP sample solution. The “U” shaped probe was then inserted into a 4-NP sample solution, and the fiber optic EW absorption spectrum was recorded 6 minutes after the probe was inserted into the sample solution.
3. Results and Discussion
3.1. FTIR Spectra Indicting the Immobilization of 4-NP in Chitosan MIP Membrane
FTIR is a useful optical spectrometric method in identifying chemical species. In this work, FTIR spectra of three polymer membranes, chitosan, GTA cross linked chitosan, 4-NP templated chitosan MIP, and pure 4-nitrophenol were recorded as shown in Figure 2. The peak at 1109 cm-1 in FTIR spectra of 4-NP templated chitosan MIP membrane and pure 4-NP powder sample was originated from nitrophenol’s C-NO2 vibration. This peak was also observed in the FTIR spectra of a previously published work which uses chitosan MIP to remove 4-NP from contaminated waterbody [33]. The peak at 940 cm-1 was from 4-NP’s aromatic C-H out of plane bending vibration. This peak was also reported in published FTIR spectra of 4-NP templated chitosan MIP and a pure 4-NP sample [33,34]. These two FTIR peaks appeared in FTIR spectrum of both pure 4-NP and 4-NP templated chitosan MIP membrane, but absent from the FTIR spectra of chitosan membrane and GTA cross linked chitosan membrane, indicating that the 4-NP molecules were immobilized in the chitosan MIP membrane. When compared with FTIR spectra of pure chitosan and GTA cross linked chitosan membranes, the existence of the 940 cm-1 and 1109 cm-1 peaks in 4-NP templated chitosan’s FTIR spectrum changed the appearance of chitosan’s C-O-C vibration peak at 1024 cm-1 [33,35], but which is still visible in the recorded FTIR spectrum of 4-NP templated chitosan MIP membrane.
3.2. Negative Fiber Optic EW Absorption Spectra Confirming the Washing Out of 4-NP Template Molecules from the Chitosan MIP Membrane
Figure 3 shows the fiber optic EW absorption spectra recorded at different times after a newly prepared chitosan MIP coated BOFP was first exposed to DI water. The light intensity at the moment the BOFP was just inserted into DI water was recorded and used as reference for recording these optical fiber EW absorption spectra. The negative absorption spectra with peak absorption wavelengths indicate that 4-NP was gradually washed out of the chitosan MIP membrane with time after deploying the sensor probe into DI water. Comparing the absorption spectrum recorded at 5 minutes after the probes was inserted into DI water and the spectra recorded at later times, it was noticed that the EW absorption spectrum at early times have two peak absorption wavelengths, 350 nm and 440 nm. However, with more time in DI water, the absorption peak at 350 nm disappeared, and the absorption peak at longer wavelength shifted to 420 nm. The difference in behavior of these two absorption peaks indicate that 4-NP exists in the chitosan membrane in more than one forms. 4-NP in aqueous solution absorbs light with peak absorption wavelength at around 330 nm as shown in Figure 4 (spectrum C). The observed change of absorption spectrum during the washing out process indicates that part of 4-NP in the chitosan membrane were not in the molecularly imprinted vacancy, but distributed randomly among the chitosan chains. These 4-NP molecules can be washed out of the membrane quickly. The negative absorption peak at 420 nm was caused by slowly washing out the 4-NP molecules in the molecularly imprinted vacancy. From the spectrum intensity, it was believed that the majority of 4-NP in the chitosan membrane were in the molecularly imprinted vacancy. Similar washing out behavior was also observed in washing out 2-NP and 3-NP from corresponding MIP membranes.
For 4-NP templated chitosan MIP membrane, the recorded fiber optic EW absorption spectrum stabilized after 70 minutes the probe was inserted into DI water, which indicates that all the 4-NP template molecules were washed out of the membrane.
3.3. GTA Cross Linked Chitosan Membrane Extracts NPs And improves BOFP-EW-OFCS’s Sensitivity for Analyzing NPs
In order to compare the sensitivity of BOFP-EW-OFCS for analyzing the NPs with/without chitosan membrane SPME, a bare fiber BOFP without any coating was first deployed to 1.0 mg/mL standard solutions of 2-NP, 3-NP and 4-NP, and a fiber optic EW absorption spectrum was recorded for each of the sample solutions. The BFOP was then coated with a GTA cross linked chitosan membrane (non-MIP) according to the procedure described in the Experimental section. This non-MIP chitosan membrane coated BOPF was then deployed to standard solutions of 2-NP (50 µg/mL), 3-NP (50 µg/mL), and 4-NP (2.0 µg/mL), and an optical fiber EW absorption spectrum was recorded for each standard solution.
Figure 4 shows the recorded fiber optic EW absorption spectra of the bare fiber BOFP exposed to 1.0 mg/mL standard solutions of 2-NP, 3-NP and 4-NP. These compounds showed absorption spectra with peak absorption wavelengths at around 350 nm and shorter wavelengths. Figure 5 shows the recorded spectra of the non-MIP chitosan membrane coated BOFP exposed to NP standard solutions. Compared with bare fiber BOFP’s absorption spectra, two facts about the spectra recorded with the non-MIP chitosan membrane coated BOFP were noticed: 1, the peak absorption wavelengths of these NPs were red-shifted to above 400 nm (410 nm to 425 nm); 2, it is much more sensitive in detecting these compounds. The peak absorption wavelength’s red-shifting by NPs extracted into the chitosan MIP membrane compared with NPs’ absorption spectra obtained with the bare fiber BOFPO was caused by difference of environment the NPs exposed. In the case of bare fiber BOFP test, the NPs were in almost pH neutral aqueous solution. When extracted into the non-MIP chitosan membrane, the NPs were in a weak basic environment due to the existence of amine groups in chitosan’s side chain. The red-shifting of peak absorption wavelength of organic acids extracted into chitosan membranes were also observed from our previous works [23,24,25,26,27].
The non-MIP chitosan membrane coated BOFP showed much higher sensitivity when compared with the bare fiber BOFP in detecting the NPs, but the sensitivity improvement is different for each individual NPs. A sensitivity improvement factor (SIF) was calculated by using following equation to quantitatively compare the sensitivity improvement for each NP:
SIF = 3-1
Table 1 lists the used peak absorption wavelengths (λmax) and calculated SIF value for each individual NPs. 4-NP has the highest SIF value, and 3-NP has the lowest SIF value. The sensitivity improvement for a BOFP coated with a non-MIP chitosan membrane is a SPME result as diagrammatically shown in Figure 1. The cross-linked chitosan membrane on surface of BOPF extracts and concentrates NPs into the membrane. The chitosan membrane has a basic microenvironment and the acidic property of the NPs benefits this equilibrium toward concentrating the NPs into the non-MIP chitosan membrane. The nitro group (-NO2) on the ortho (2) and para (4) positions improves phenol group’s acidity much stronger than the nitro group on the meta (3) position, as indicated by the pKa values listed in Table 1. Therefore, the chitosan membrane extracts 2-NP and 4-NP more effectively than extracting 3-NP. Among the 2-NP and 4-NP, a steric factor affects the extraction of these compounds into the chitosan membrane. The nitro group in the orthro position is too close to the phenol group, which sterically blocks the attraction of 2-NP to the amine group in chitosan, which resulted in smaller SIF value when compared with 4-NP, which does not have this steric block-out issue.
3.4. A 4-NP Templated Chitosan MIP Membrane Coated on BOFP Improves the Sensitivity of BOFP-EW-OFCS for Analyzing 4-NP
In this work, the same BOFP used in the bare fiber test and non-MIP membrane test was used to coat different chitosan MIP membranes with 2-NP, 3-NP and 4-NP as template. The BOFP coated with different MIP membranes were tested for analyzing corresponding template compound. In a such test, the coated BOFP was deployed to analyte’s standard solutions of different concentrations and an EW absorption spectrum was recorded for each standard solution. Figure 6Figure 7Figure 8 show the recorded absorption spectra of the chitosan MIP membrane coated BOFP for analyzing 2-NP, 3-NP and 4-NP. The inserted graph in each of these figures shows the quantitative relationship of sensor’s absorbance value with analyte’s concentration in the standard solutions.
In MIP based sensor techniques, a parameter called imprinting factor (IF) was used to describe the sensitivity improvement by comparing the sensitivity of a transducer coated with a MIP membrane and the same transducer coated with a non-MIP membrane [24,26]. The IF values for the three chitosan MIP membrane coated BOFP with 2-NP, 3-NP and 4-NP as template were calculated by using following equation:
IF = 3-2
The calculated IF values for the three NP templated chitosan MIP membranes are listed in Table 1. It was noticed that the 4-NP templated chitosan MIP membrane coated on the BOFP improved the sensitivity of MIP-SPME-EW-OFCS toward 4-NP with a 2.3 IF value. However, the BOFP coated with a 2-NP or a 3-NP templated MIP membrane did not improve the sensor’s sensitivity (IF value <1) in analyzing 2-NP and 3-NP, respectively. It was believed that 3-NP is a very weak acid. Its interaction with amine group on chitosan’s side chain is not strong enough for imprinting the molecule with amine group in the formed polymer. In the case of 2-NP, it was believed that the steric factor prevented the effective bonding of its phenol group with amine in chitosan’s side chain, and thus can not form a MIP membrane.
In considering the acidity, steric factor, and IF value, it was concluded that a BOFP coated with a 4-NP templated chitosan MIP membrane can achieve a highly sensitivity improvement (SIF=1.4*104 when compared with bare fiber BOFP) for analyzing 4-NP, but BOFP coated with a 2-NP templated chitosan MIP membrane or a 3-NP templated chitosan MIP membrane does not have much advantage of sensitivity improvement in analyzing respective compound. Therefore, this work was focused on the development of a MIP-SPME-EW- OFCS for analyzing 4-NP.
3.5. Reversibility, Response Time and Stability of the MIP-SPME-EW-OFCS for Monitoring 4-NP
The reversibility and time response of this sensor for monitoring 4-NP in a standard solution was investigated by alternatively exposing the sensing probe to DI water and a 0.20 µg/mL 4-NP standard solution, and continuously monitoring the BOFP’s EW absorbance at 410 nm with time. Figure 9 shows the test result. This test result demonstrates the reversible response nature of this sensor. A reversible response is necessary for using a sensor for continuously monitoring a sample in process line, such as environmental remediation to remove a water contaminate from polluted waterbody. This sensor’s reversible response is originated from the sensor’s response mechanism, MIP membrane SPME, which is a reversible process and does not involve any chemical reaction.
The response time of the sensor is defined as the time needed for the sensing signal reaches to 90% of its full response after deploying the sensor probe to a sample solution. From the time response test result shown in Figure 9, the response time of this sensor was calculated to be 5 min.
The transducer of this 4-NP sensor is a BOFP coated with GTA cross linked chitosan membrane with special pore structure (4-NP imprinted MIP). The GTA cross linked chitosan is a stable polymer even in long term exposure to water or a weak basic solution [36,37]. However, this polymer can be dissolved in acidic solution. This sensor is expected to be stable in long-term use as long as the sensing probe is not exposed to a strong acidic solution. During this research work, a single 4-NP templated chitosan MIP coated BOFP was used to collect all the experimental data involving testing the sensor’s response to 4-NP and interference species, sample analysis. During the three months’ experiments, the sensor demonstrated stable response to 4-NP, which verified the long-term stability prediction.
3.6. Calibration Curve and Detection Limit
Data from spectral response of the 4-NP templated chitosan MIP membrane coated BOFP to 4-NP in standard solutions were used to establish calibration curves for quantitatively analyzing 4-NP in aqueous sample solution. The inserted graph in Figure 7 shows that the sensor’s absorbance signal at 410 nm has a logarithm relationship with 4-NP concentration in standard solutions. This relationship agrees with the fact that the chitosan MIP membrane is a porous material. The distribution equilibrium of 4-NP between the sample solution and the chitosan MIP membrane follows the Langmuir isotherm, which describes the equilibrium of adsorbing a compound onto the pore surface of a porous material to form a single molecular layer of adsorbed compound. In this work, 4-NP concentration in the tested standard solutions is in µg/mL range, and a single layer of adsorbed 4-NP on chitosan MIP pore surface was expected. In a narrow 4-NP concentration range from blank to 0.20 µg/mL, the sensor’s absorbance value at peak absorption wavelength can be approximated to have a linear relationship with 4-NP concentration in standard solutions, as shown in Figure 10, with good correlation coefficient (R2 = 0.974).
The detection limit of the sensor is defined as 4-NP concentration in a sample solution which causes a sensing signal that is three times of standard deviation (STDV) of blank signal above blank sample’s sensing signal. Blank sample signal’s STDV was calculated from time response test result in Figure 9 to be 0.00042. The detection limit calculated from the STDV value and slope of the linear calibration shown in Figure 10 is 2.5 ng/mL. Although optical fiber EW absorption spectrometry has limited sensitivity in detecting a light-absorbing compound in the fiber’s cladding layer due to a limited interaction pass-length (µm range), the sensor of this work achieved a detection limit which is lower than that of traditional UV/Vis absorption spectrometry coupled with HPLC [14,38]. The high concentration factor (1.4*104) of extracting 4-NP from a sample solution into the chitosan MIP membrane improved the sensor’s sensitivity, and to achieve the low detection limit.
3.7. Compare the Responses of the MIP-SPME-EW-OFCS to 4-NP and Other Compounds
The sensor’s response to 4-NP, its isomers (2-NP, 3-NP), and two randomly selected derivatives (2,4-di-NP and 2-chloro-4-NP) were investigated. In such a test, the sensor probe was deployed to a standard solution of a selected compound and the resulting EW absorption spectrum was recorded. Figure 11 shows the recorded absorption spectra. A selectivity factor (SF), which describes the ratio of the sensor’s absorbance at 410 nm caused by 4-NP of unit concentration to the absorbance at same wavelength caused by an interference species of unit concentration, is calculated by using following equation:
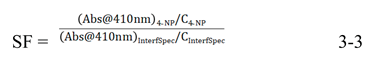
The calculated SF values for tested compounds are listed in Table 2. These SF values indicate that this sensor’s response to 4-NP is > 100 times more sensitive than its response to the tested isomers, derivatives. This ensured that the existence of other NP isomers and derivatives will not cause interference to the sensor’s function of analyzing 4-NP, if 4-NP, the isomers, and derivatives co-exist in a sample solution in the same concentration magnitude. The SF value for a 4-NP sensor using a non-MIP membrane coated BOFP were also calculated using data shown in Figure 4 and calculated SF values are listed in Table 2. A selectivity improvement factor (SLIF) was calculated by dividing MIP-based sensor’s SF value by the non-MIP-based sensor’s SF value. The calculated results listed in Table 2 indicate that compared with the non-MIP membrane based 4-NP sensor, the MIP-based 4-NP sensor’s selectivity toward its isomers increased by 18-20 times. The chitosan MIP membrane based sensor has a IF value of 2.3 when compared with the non-MIP chitosan membrane based sensor for analyzing 4-NP. It is reasonable that this IF factor contributed to the SLIF values. However, the SLIF values are much larger than this IF value, and there should be other factors contributed to the improved SLIF values. One considerable factor that contributed to the large SLIF value is that in a 4-NP templated chitosan MIP membrane, the vacancy inside the membrane were imprinted for 4-NP. When compared with a non-MIP based membrane, there are much less sites available for 2-NP or 3-NP to compete to bond in this MIP membrane, and less chance the 2-NP and 3-NP being extracted into the MIP membrane.
The sensor’s responses to several other substances were also investigated. The existence of following tested compounds existing in a sample solution in concentration indicated in the bracket following the compound’s name was found not to interfere with the sensor’s function of analyzing 4-NP in an aqueous solution sample: Na2CO3 (50 mM), urea (1.0 mg/mL), cane sugar (1.0 mg/mL), KCl (1.0 mg/mL), citric acid (100 µg/mL), and acetylsalicylic acid (50 µg/mL).
3.8. Analyzing 4-NP in a Standard Addition Sample
A bottled drink water product purchased from a local grocery store was used as a sample. 1.0 mL of 2.0 µg/mL 4-NP standard solution was added to 19.0 mL of bottled water to make a test standard addition sample with 4-NP concentration of 0.10 µg/mL. This sample was analyzed with the sensor of this work using calibration curve established with 4-NP standard solutions for quantitation. The analytical result listed in Table 3 with recovery rate ranged from 93% to 101% indicates the feasibility of using the developed sensor for analyzing 4-NP in the water sample.
4. Conclusions
An OFCS for selective analyzing 4-NP in aqueous solution samples was developed by integrating MIP-SPME with BOFP EW absorption spectrometry. The chitosan MIP membrane with 4-NP as template fabricated on the surface of a BOFP selectively extracts 4-NP and concentrates the analyte by 1.4*104 times into the membrane for fiber optic EW absorption spectrometric detection. Although chitosan MIP membranes using 2-NP or 3-NP as template were also fabricated and coated on the surface of the same BOFP, these MIP membranes did not demonstrate specific improvement in extracting respective template molecules into the membranes. It was believed that template molecule’s acidity and molecular structure played critical roles in deciding a MIP membrane’s capability of concentrating the analyte into the membrane for detection. The sensor of this work for analyzing 4-NP achieved a detection limit of 2.5 ng/mL, which is lower than the detection limit of reported traditional UV/Vis spectrometric method for analyzing this compound in aqueous sample solution. The sensor also demonstrated high selectivity. The existence of 4-NP’s isomers and derivatives does not cause interference to the sensor’s function of analyzing 4-NP in aqueous solution sample. The results from analyzing 4-NP in a standard addition sample illustrates the feasibility of using this sensor for analyzing 4-NP in water samples.
References
- Eichenbaum, G.; Johnson, M.; Kirkland, D.; O’neill, P.; Stellar, S.; Bielawne, J.; DeWire, R.; Areia, D.; Bryant, S.; Weiner, S.; Desai-Krieger, D. Assessment of the genotoxic and carcinogenic risks of p-nitrophenol when it is present as an impurity in a drug product. Regul Toxicol Pharmacol. 2009, 55, 33–42. [Google Scholar] [CrossRef]
- Buser, M.; Klein, R.; Haire, K.; Balachandran, R.; Roney, N.; Derrick, H.; Hall, S.; Gao, A. Toxicological profile for nitrophenols: 2-nitrophenol 4-nitrophenol; Public Health Service, Agency for Toxic Substances and Disease Registry, U.S. Department of Health and Human Service, 1992. [Google Scholar]
- Ikeda, R.M; Reh, C.M. Toxicological Profile for Nitrophenols; USA National Center for Environmental Health and Agency for Toxic Substances and Disease Registry, 2023. [Google Scholar]
- Ghosh, A.; Khurana, M.; Chauhan, A.; Takeo, M.; Chakraborti, A.K.; Jain, R.K. Degradation of 4-nitrophenol, 2-chloro-4-nitrophenol, and 2, 4-dinitrophenol by Rhodococcus imtechensis strain RKJ300. Environ. Sci. Technol. 2010, 44, 1069–1077. [Google Scholar] [CrossRef]
- Pakala, S.B.; Gorla, P.; Pinjari, A.B.; Krovidi, R.K.; Baru, R.; Yanamandra, M.; Merrick, M.; Siddavattam, D. Biodegradation of methyl parathion and p-nitrophenol: evidence for the presence of ap-nitrophenol 2-hydroxylase in a Gram-negative Serratia sp. strain DS001. Appl. Microbiol. Biotechnol. 2007, 73, 1452–1462. [Google Scholar] [CrossRef]
- Misra, D.; Bhuyan, S.; Adhya, T.K.; Sethunathan, N. Accelerated degradation of methyl parathion, parathion and fenitrothion by suspensions from methyl parathion-and p-nitrophenol-treated soils. Soil Biol. Biochem. 1992, 24, 1035–1042. [Google Scholar] [CrossRef]
- Nakagawa, M.; Crosby, D.G. Photodecomposition of nitrofen. J. Agric. Food Chem. 1974, 22, 849–853. [Google Scholar] [CrossRef] [PubMed]
- Cardoso Juarez, A.O.; Ivan Ocampo Lopez, E.; Kesarla, M.K.; Bogireddy, N.K. Advances in 4-nitrophenol detection and reduction methods and mechanisms: an updated review. ACS Omega 2024, 9, 33335–33350. [Google Scholar] [CrossRef] [PubMed]
- Rangappa, H.S.; Mon, P.P.; Jayaraman, B.; Madras, G.; Lin, C.; Challapalli, S. Industrial waste-derived biochar composites for the removal of water-borne 4-nitrophenol: assessing cost-effectiveness and sustainability. ESPR. 2025, 25, 1–6. [Google Scholar] [CrossRef] [PubMed]
- Meiyazhagan, S.; Kavitha, E.R.; Yugeswaran, S.; Santhanamoorthi, N.; Jiang, G.; Suresh, K. Accelerated degradation of 4-nitrophenol using microplasma discharge: Processes and mechanisms. J. Water Process Eng. 2023, 55, 104190. [Google Scholar] [CrossRef]
- Madhu, R.; Karuppiah, C.; Chen, S.M.; Veerakumar, P.; Liu, S.B. Electrochemical detection of 4-nitrophenol based on biomass derived activated carbons. Anal. Methods 2014, 26, 5274–5280. [Google Scholar] [CrossRef]
- Zhang, C.; Govindaraju, S.; Giribabu, K.; Huh, Y.S.; Yun, K. AgNWs-PANI nanocomposite based electrochemical sensor for detection of 4-nitrophenol. Sens. Actuators B: Chem. 2017, 252, 616–623. [Google Scholar]
- Yang, C. Electrochemical determination of 4-nitrophenol using a single-wall carbon nanotube film-coated glassy carbon electrode. Microchim. Acta 2004, 148, 87–92. [Google Scholar] [CrossRef]
- Almási, A.; Fischer, E.; Perjési, P. A simple and rapid ion-pair HPLC method for simultaneous quantitation of 4-nitrophenol and its glucuronide and sulfate conjugates. J. Biochem. Biophys. Methods 2006, 69, 43–50. [Google Scholar] [CrossRef] [PubMed]
- Mei, M.; Huang, X.; Yu, J.; Yuan, D. Sensitive monitoring of trace nitrophenols in water samples using multiple monolithic fiber solid phase microextraction and liquid chromatographic analysis. Talanta 2015, 134, 89–97. [Google Scholar] [CrossRef]
- Nguyen, M.H.; Nguyen, T.D.; Duong, H.A.; Pham, H.V. Dual optical detection approach for capillary electrophoresis following two-step liquid-liquid extraction to determine ten phenols in water samples. J. Chromatogr. A 2024, 1715, 464609. [Google Scholar] [CrossRef]
- Boddu, V.; Kim, S.; Adkins, J.; Weimer, E.; Paul, T.; Damavarapu, R. Sensitive determination of nitrophenol isomers by reverse-phase high-performance liquid chromatography in conjunction with liquid–liquid extraction. Int. J. Environ. Anal. Chem. 2017, 97, 1053–1064. [Google Scholar] [CrossRef]
- Khan, K.O.; Assiri, M.A.; Irshad, H.; Rafique, S.; Khan, A.M.; Khan, A.K.; Imran, M.; Shahzad, S.A. Fluorescence based detection of industrially important and hazardous 4-nitrophenol in real samples: A combination of extensive optical and theoretical studies. J. Photochem. Photobiol. A: Chem. 2023, 442, 114805. [Google Scholar] [CrossRef]
- Hofmann, D.; Hartmann, F.; Herrmann, H. Analysis of nitrophenols in cloud water with a miniaturized light-phase rotary perforator and HPLC-MS. Anal. Bioanal. Chem. 2008, 391, 161–169. [Google Scholar] [CrossRef]
- Sengupta, K.; Alam, M.; Pailan, S.; Saha, P. Biodegradation of 4-nitrophenol by a Rhodococcus species and a preliminary insight into its toxicoproteome based on mass spectrometry analysis. J. Environ. Biol. 2019, 40, 356–362. [Google Scholar] [CrossRef]
- Kapase, S.A.; Jadhav, S.A.; Peralta, M.E.; Carlos, L. Molecularly imprinted polymers (MIPs): synthesis, applications and recent advances in water remediation. ACS Appl. Polym. Mater. 2025, 7, 10358–10394. [Google Scholar] [CrossRef]
- Pichon, V.; Chapuis-Hugon, F. Role of molecularly imprinted polymers for selective determination of environmental pollutants—a review. Anal. Chim. Acta 2008, 622, 48–61. [Google Scholar] [CrossRef] [PubMed]
- Miller, J.W.; Tao, S. The development of an optical fiber gallic acid sensor with a molecularly imprinted chitosan membrane coated on an optical fiber surface as a transducer for analyzing gallic acid in food products. J. Food Meas. Charact.
- Mendoza, R.; Tao, S. An optical fiber chemical sensor using a molecularly imprinted polymer membrane as a transducer for analyzing chlorogenic acid in coffee products. Food Anal. Methods 2026, 19, 46. [Google Scholar] [CrossRef]
- McCaslin, J.D.; Tao, S. An optical fiber aspirin sensor with molecularly-imprinted polymer coating on fiber core surface as transducer. Microchem. J. 2025, 212, 113422. [Google Scholar] [CrossRef]
- Arana, M.; Tao, S. An optical fiber caffeic acid sensor using a molecularly-imprinted chitosan membrane as a transducer. Food Chem. 2025, 492, 145414. [Google Scholar] [CrossRef]
- Mendoza, R.; Tao, S. A Folic Acid Sensor with a molecularly imprinted chitosan polymer membrane coated on an optical core surface as a transducer. J. Food Nutr. 2025, 11, 202. [Google Scholar]
- Miller, J.W.; McCaslin, J.D.; Tao, S. An optical fiber caffeine sensor using a molecularly imprinted polymethacrylic acid membrane coated on optical fiber surface as a transducer. J. Food Drug Anal. in press. [Google Scholar]
- Gupta, B.D.; Sharma, N.K. Fabrication and characterization of U-shaped fiber-optic pH probes. Sens. Actuators B Chem. 2002, 82, 89–93. [Google Scholar] [CrossRef]
- Gupta, B.D. A novel probe for a fiber optic humidity sensor. Sens. Actuators B Chem. 2001, 80, 132–135. [Google Scholar] [CrossRef]
- Tao, S. Fiber optic chemical sensors for environmental monitoring. In Encyclopedia of Sensors; Grimes, C.A., Dickey, E.C., Pishko, M.V., Eds.; American Scientific Publishers: Stevenson Ranch, CA, USA, 2006; Volume 3, pp. 449–473. [Google Scholar]
- McDonald, S.R.; Tao, S. An optical fiber chlorogenic acid sensor using a chitosan membrane coated bent optical fiber probe as a transducer. Anal. Chim. Acta 2024, 1288, 342142. [Google Scholar] [CrossRef]
- Di Bello, M.P.; Mergola, L.; Scorrano, S.; Del Sole, R. Towards a new strategy of a chitosan-based molecularly imprinted membrane for removal of 4-nitrophenol in real water samples. Polym. Int. 2017, 66, 1055–1063. [Google Scholar] [CrossRef]
- Gandhimathi, R.; Dhanasekaran, R. Third order nonlinear studies and other characterization of 4-nitrophenol (4-NP) single crystals. IOP Conf. Ser.: Mater. Sci. Eng. 2013, 43, 012004. [Google Scholar] [CrossRef]
- Chen, G.; Mi, J.; Wu, X.; Luo, C.; Li, J.; Tang, Y.; Li, J. Structural features and bioactivities of the chitosan. Int. J. Biol. Macromol. 2011, 49, 543–547. [Google Scholar] [CrossRef]
- Woźniak, A.; Biernat, M. Methods for crosslinking and stabilization of chitosan structures for potential medical applications. J Bioact. Compat. Polym. 2022, 37, 151–167. [Google Scholar] [CrossRef]
- Kildeeva, N.R.; Perminov, P.A.; Vladimirov, L.V.; Novikov, V.V.; Mikhailov, S.N. About mechanism of chitosan cross-linking with glutaraldehyde. Russ. J. Bioorg. Chem. 2009, 35, 360–369. [Google Scholar] [CrossRef]
- Almási, A.; Fischer, E.; Perjési, P. HPLC quantification of 4-nitrophenol and its conjugated metabolites from bile. Sci. Pharm. 2011, 79, 837–847. [Google Scholar] [CrossRef] [PubMed]
Figure 1.
Diagrammatic graphs (left) show a non-MIP membrane extracts/concentrates compounds, and a MIP-membrane selectively extracts/concentrates an analyte into membranes coated on optical fiber surface. The absorption spectra in the right side demonstrate sensitivity and selectivity improvement resulted from non-MIP/MIP membrane extraction.
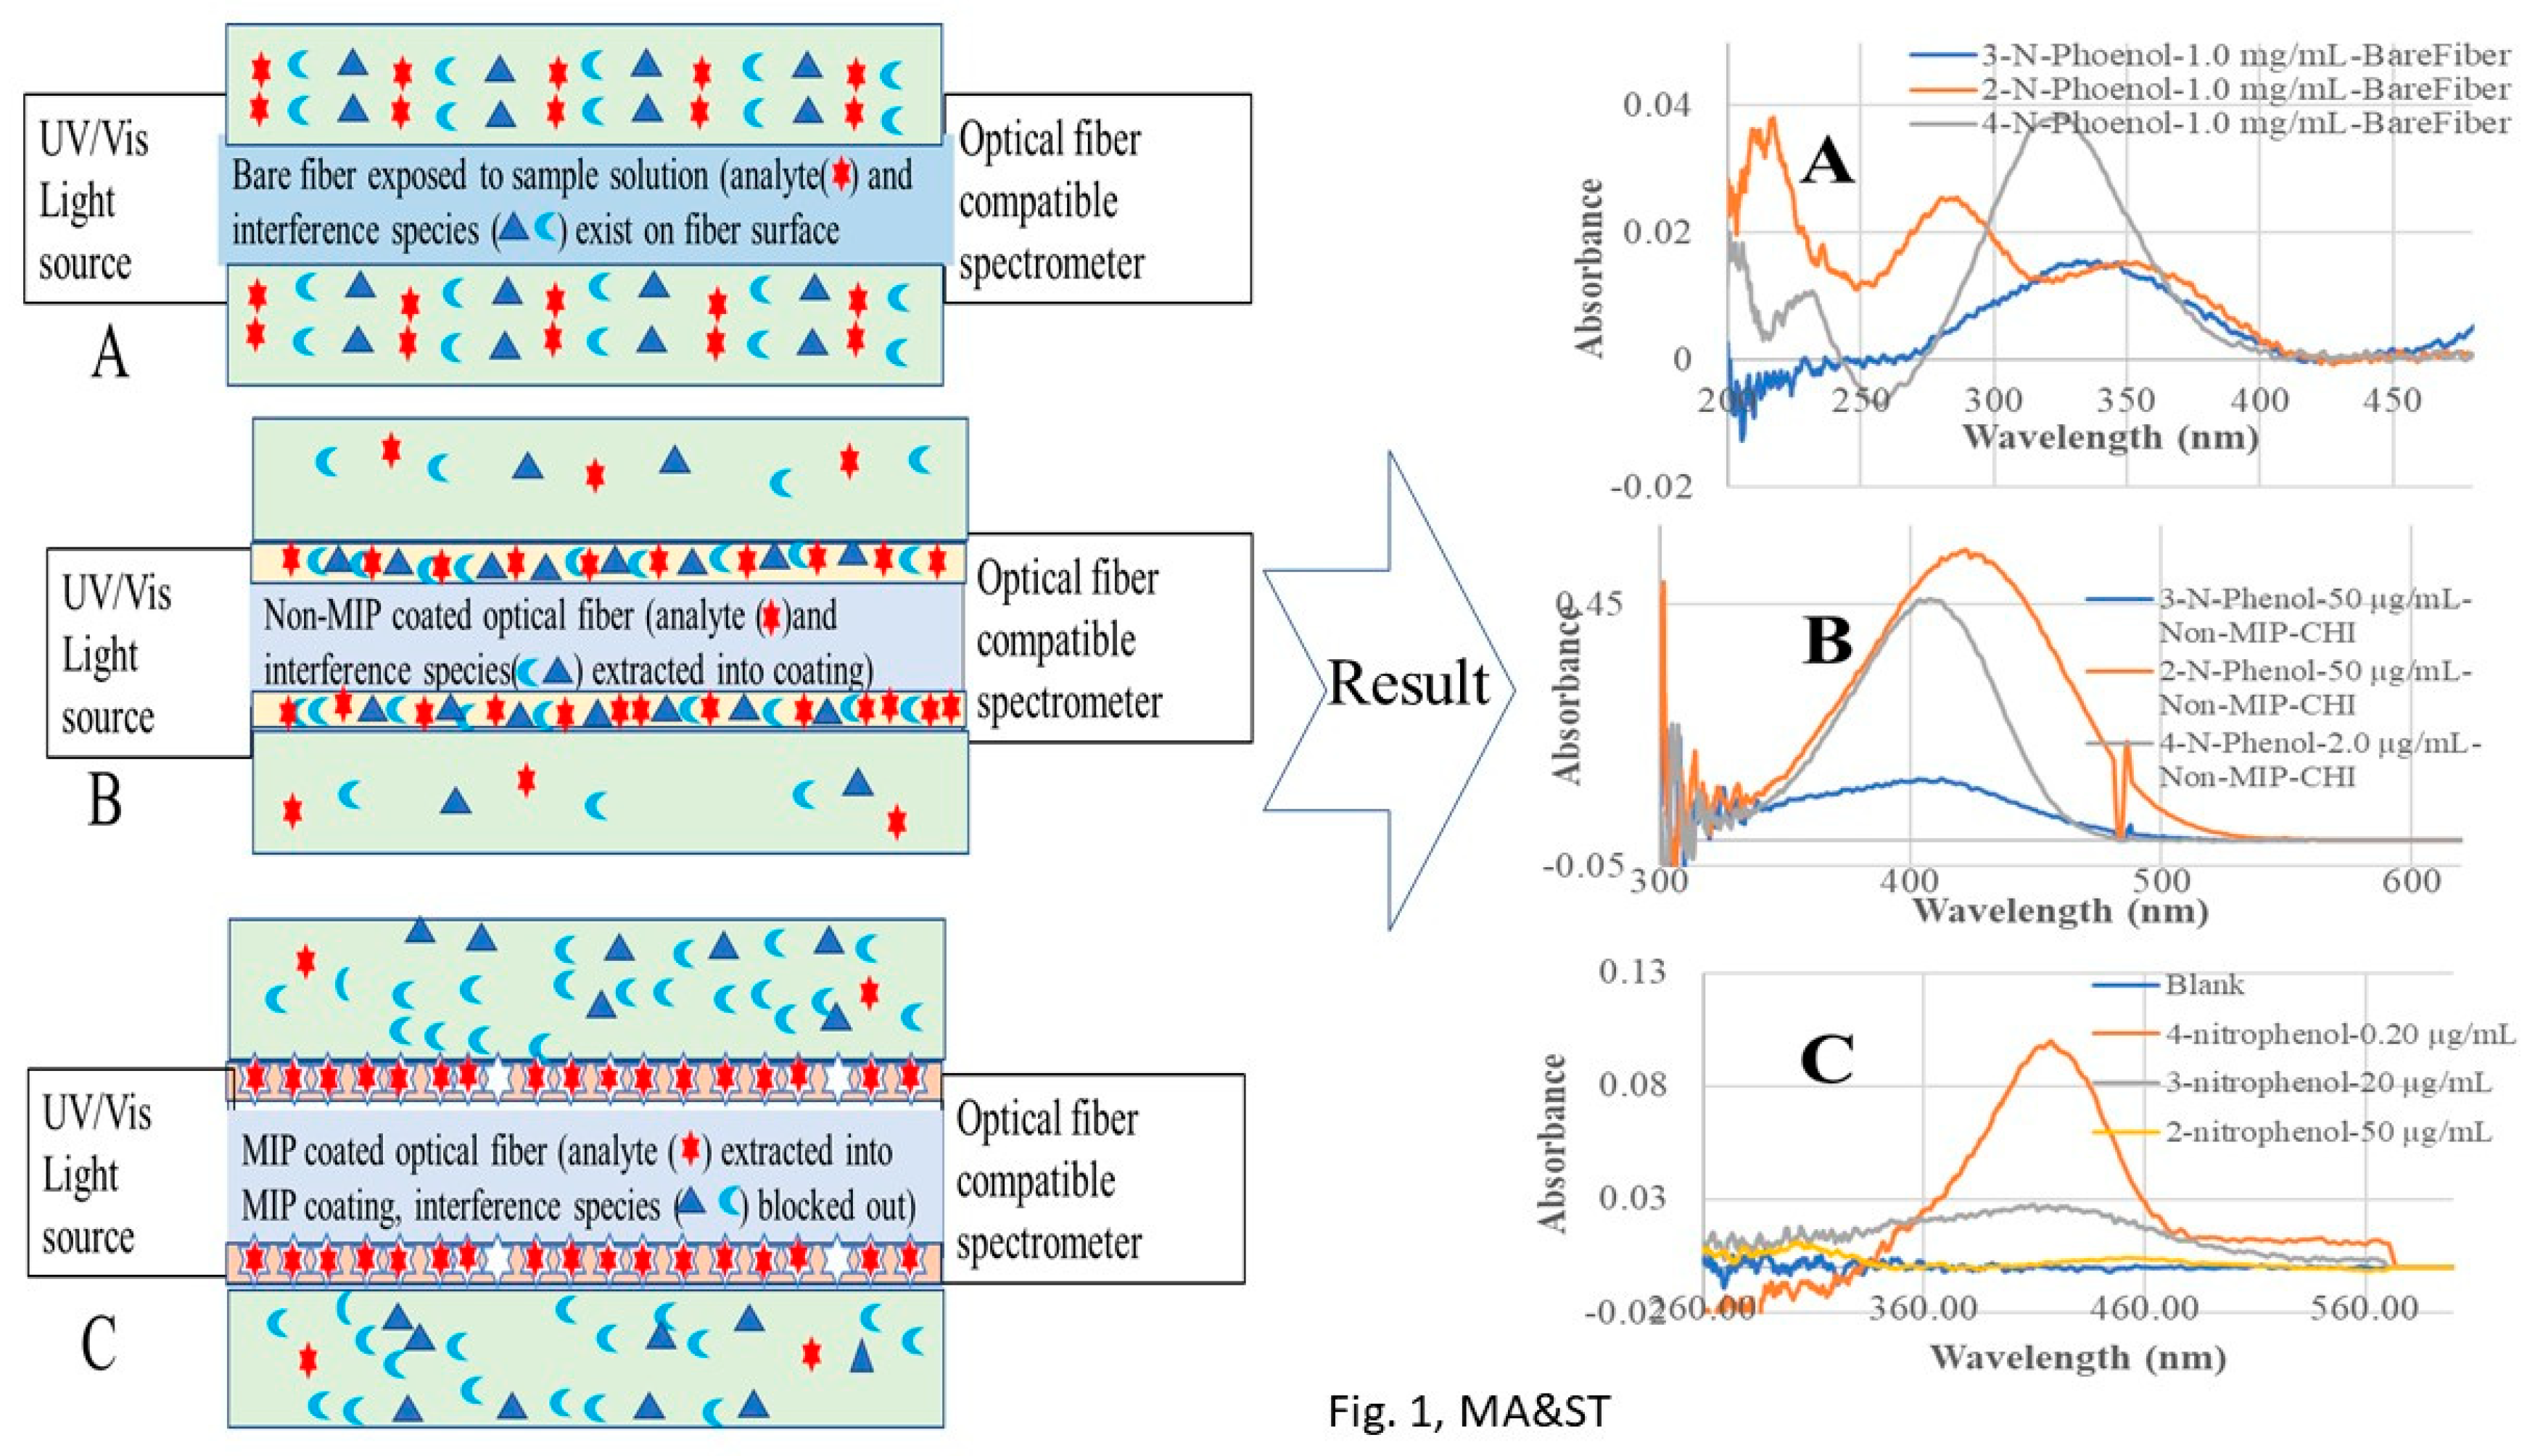
Figure 2.
FTIR spectra of three polymer membranes, pure chitosan, GTA cross linked chitosan, 4-NP templated chitosan MIP, and a pure 4-NP sample. These FTIR spectra clearly indicates that 4-NP was immobilized in the 4-NP templated MIP membrane.
Figure 2.
FTIR spectra of three polymer membranes, pure chitosan, GTA cross linked chitosan, 4-NP templated chitosan MIP, and a pure 4-NP sample. These FTIR spectra clearly indicates that 4-NP was immobilized in the 4-NP templated MIP membrane.
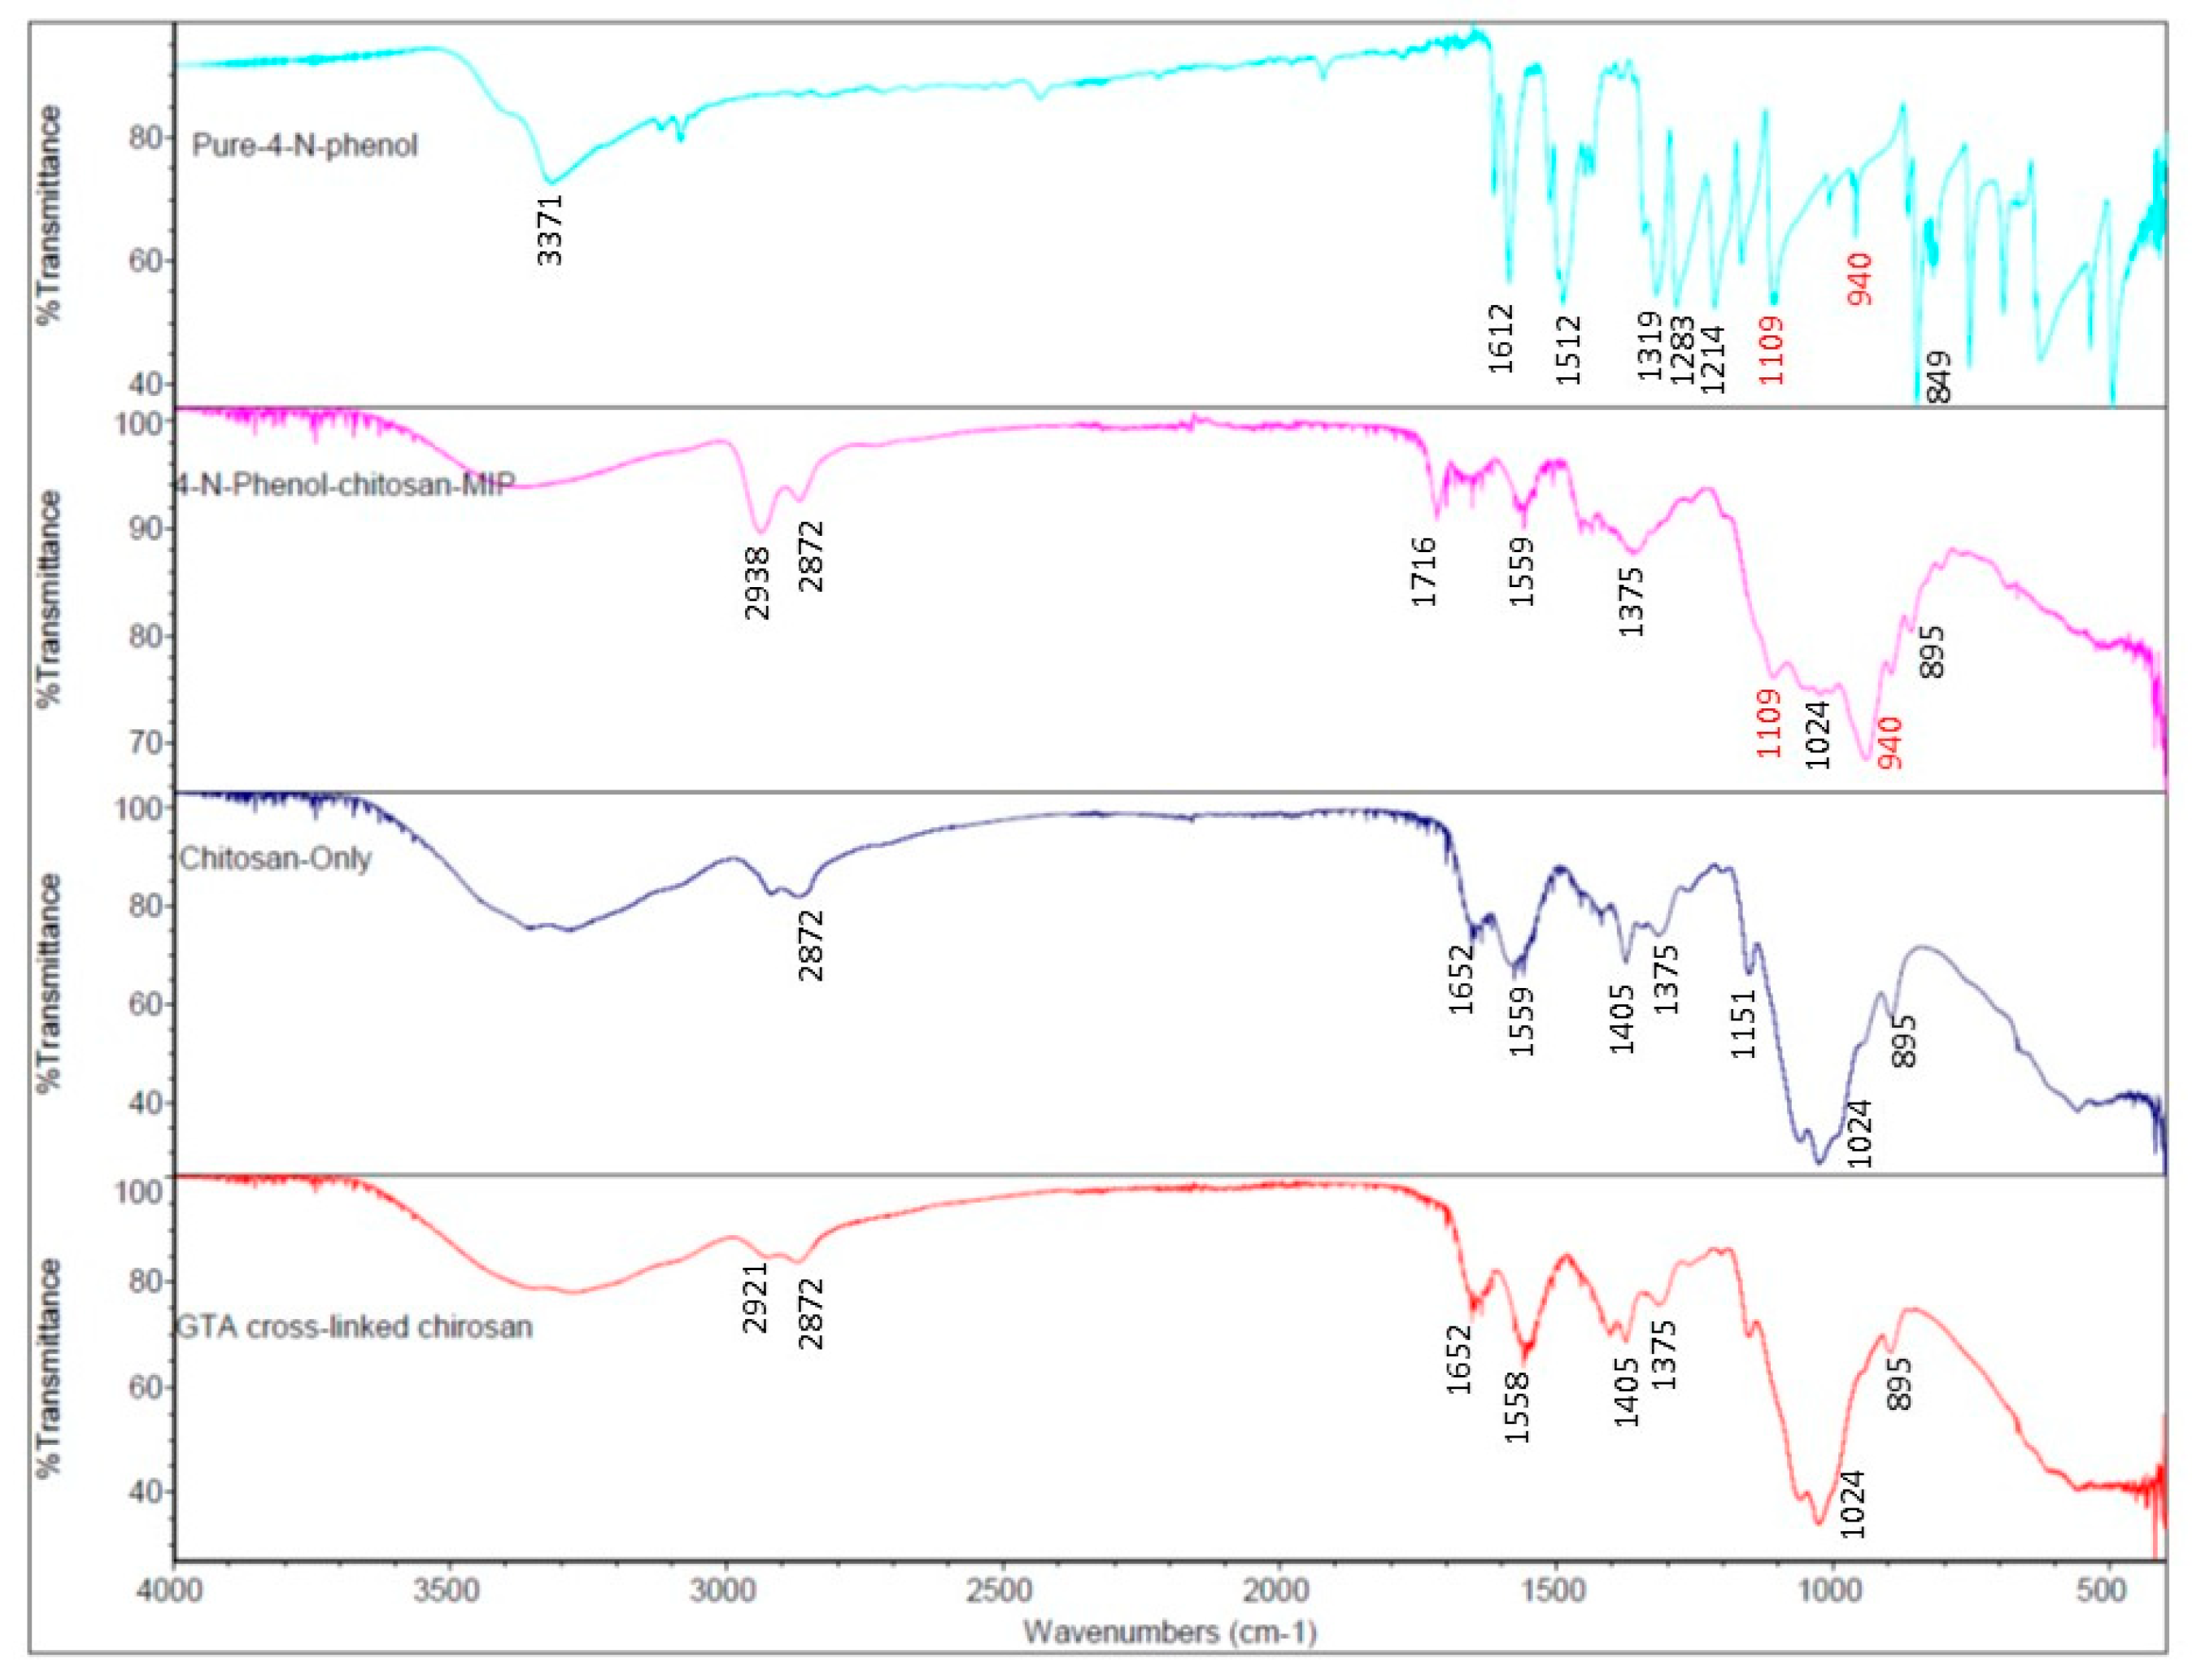
Figure 3.
Optical fiber EW absorption spectra demonstrate the washing out of 4-NP template molecules from the chitosan MIP membrane coated on a BOFP surface.
Figure 3.
Optical fiber EW absorption spectra demonstrate the washing out of 4-NP template molecules from the chitosan MIP membrane coated on a BOFP surface.
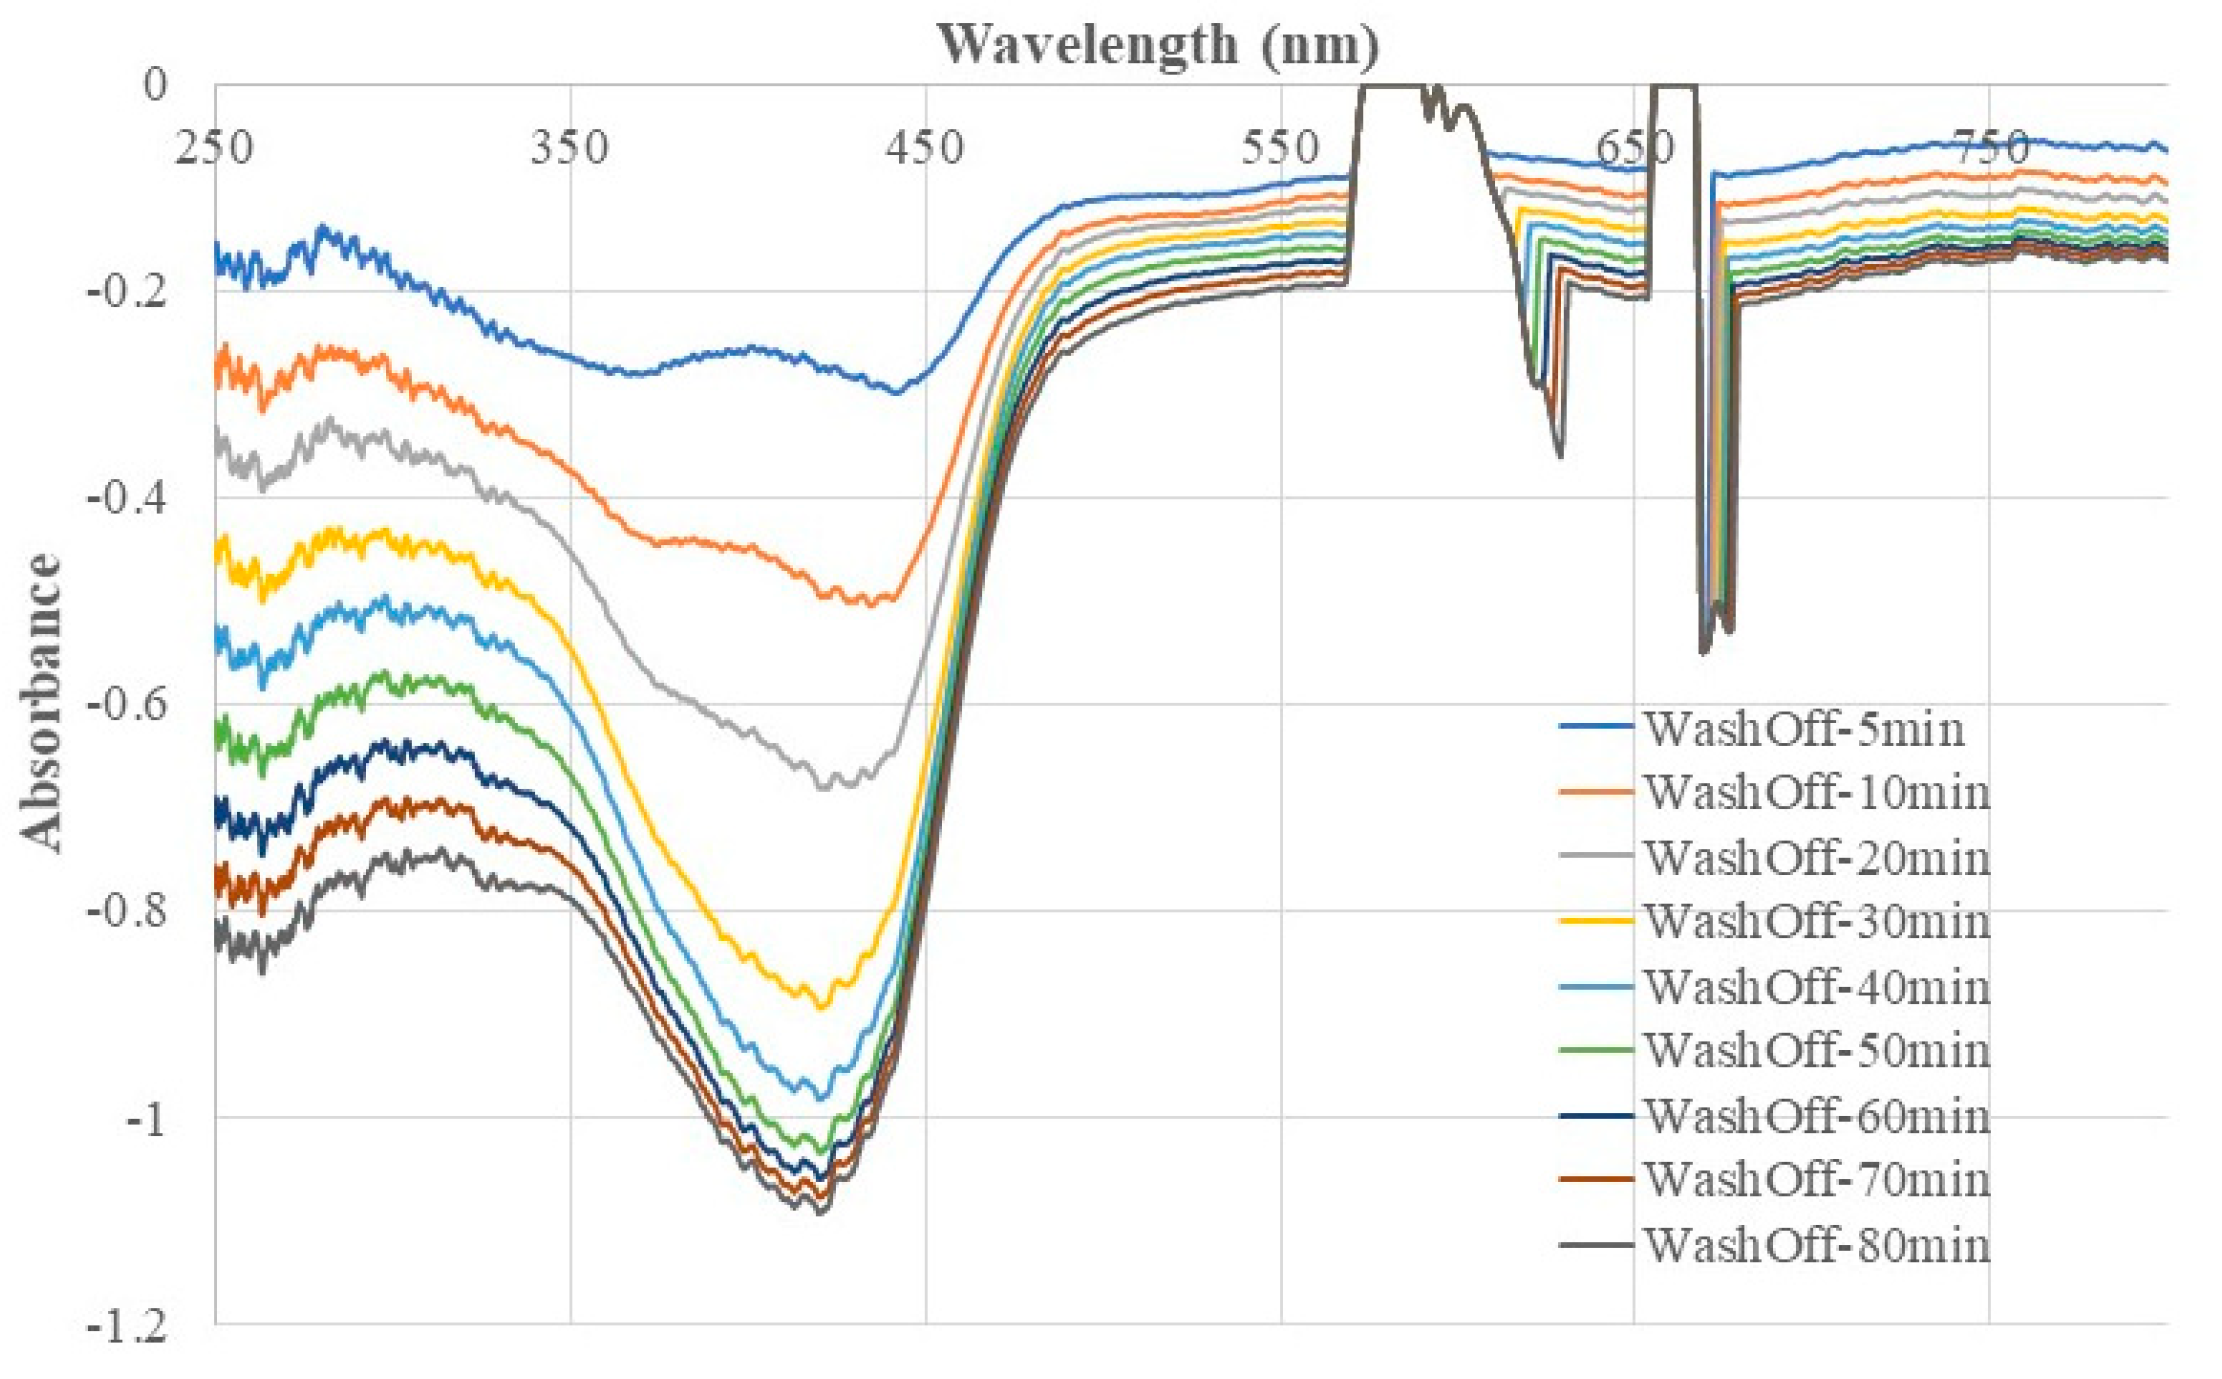
Figure 4.
Optical fiber EW absorption spectra of 2-NP (spectrum A), 3-NP (spectrum B) and 4-NP (spectrum C) recorded with a bare BOFP probe (without any coating) exposed to 1.0 mg/mL standard solution of individual NPs.
Figure 4.
Optical fiber EW absorption spectra of 2-NP (spectrum A), 3-NP (spectrum B) and 4-NP (spectrum C) recorded with a bare BOFP probe (without any coating) exposed to 1.0 mg/mL standard solution of individual NPs.
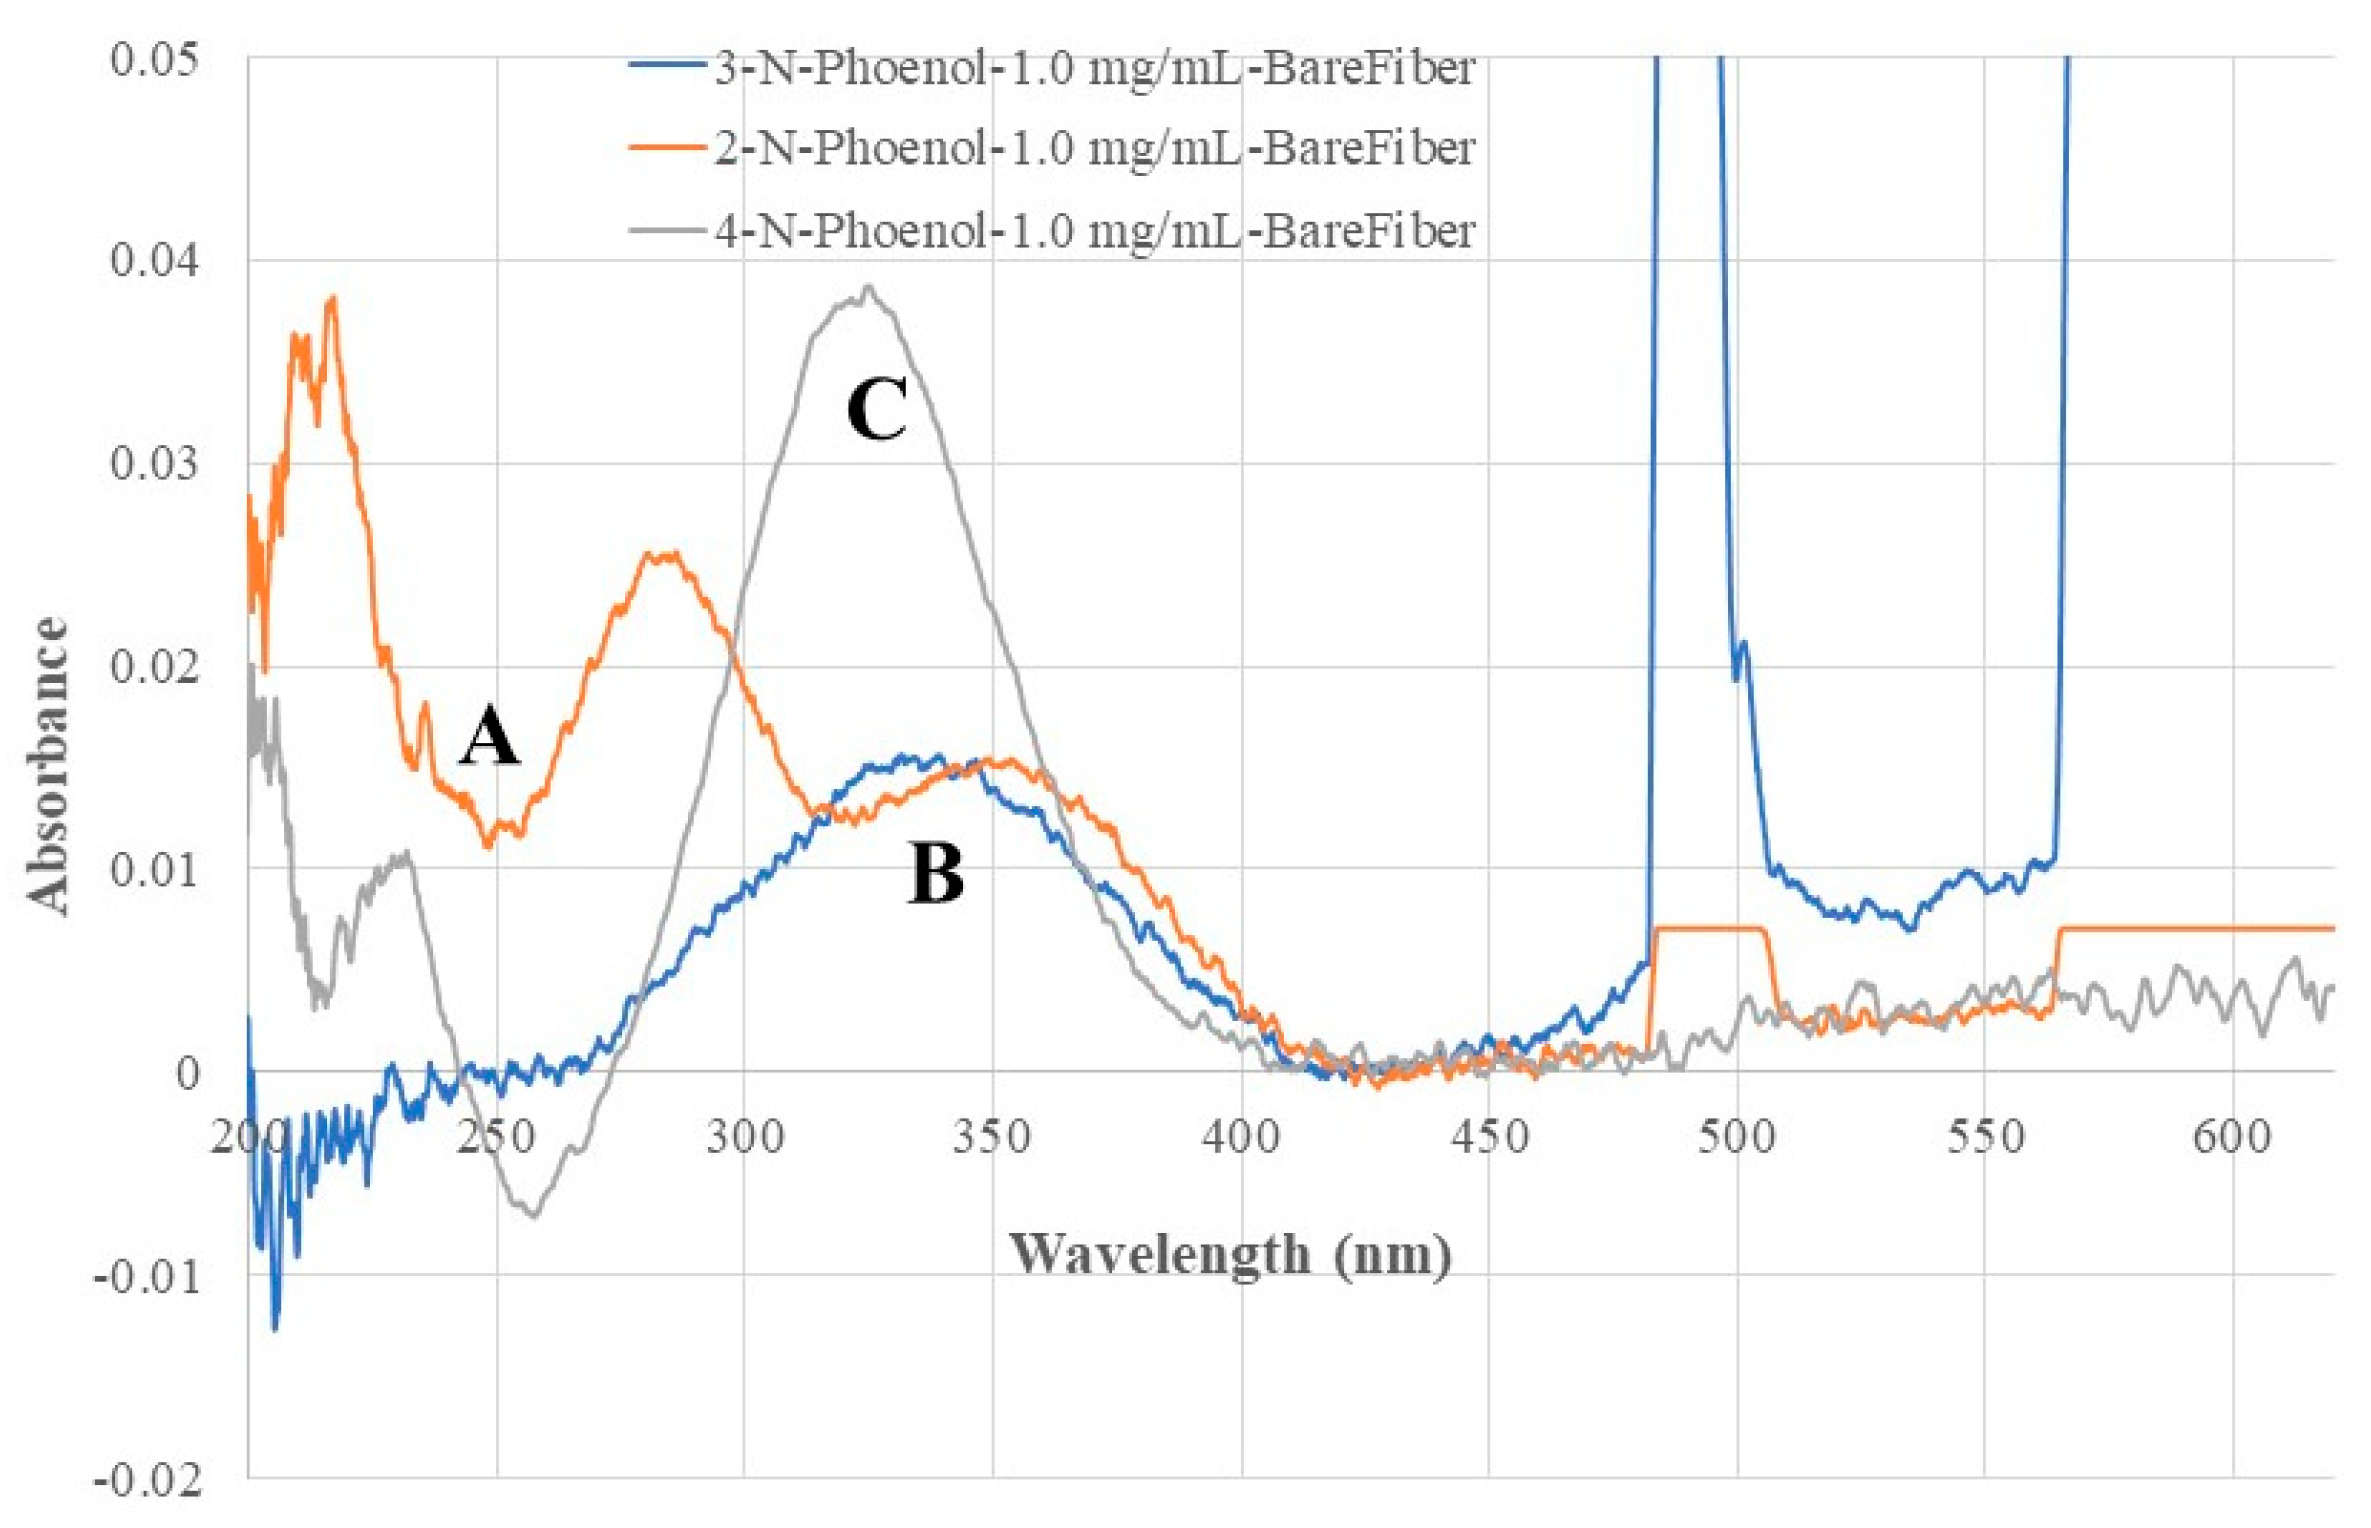
Figure 5.
Optical fiber EW absorption spectra of 2-NP (50 µg/mL, spectrum A), 3-NP (50 µg/mL, spectrum B), and 4-NP (2.0 µg/mL, spectrum C) recorded with the same BOFP as that used in Figure 4, but coated with a non-MIP chitosan membrane.
Figure 5.
Optical fiber EW absorption spectra of 2-NP (50 µg/mL, spectrum A), 3-NP (50 µg/mL, spectrum B), and 4-NP (2.0 µg/mL, spectrum C) recorded with the same BOFP as that used in Figure 4, but coated with a non-MIP chitosan membrane.
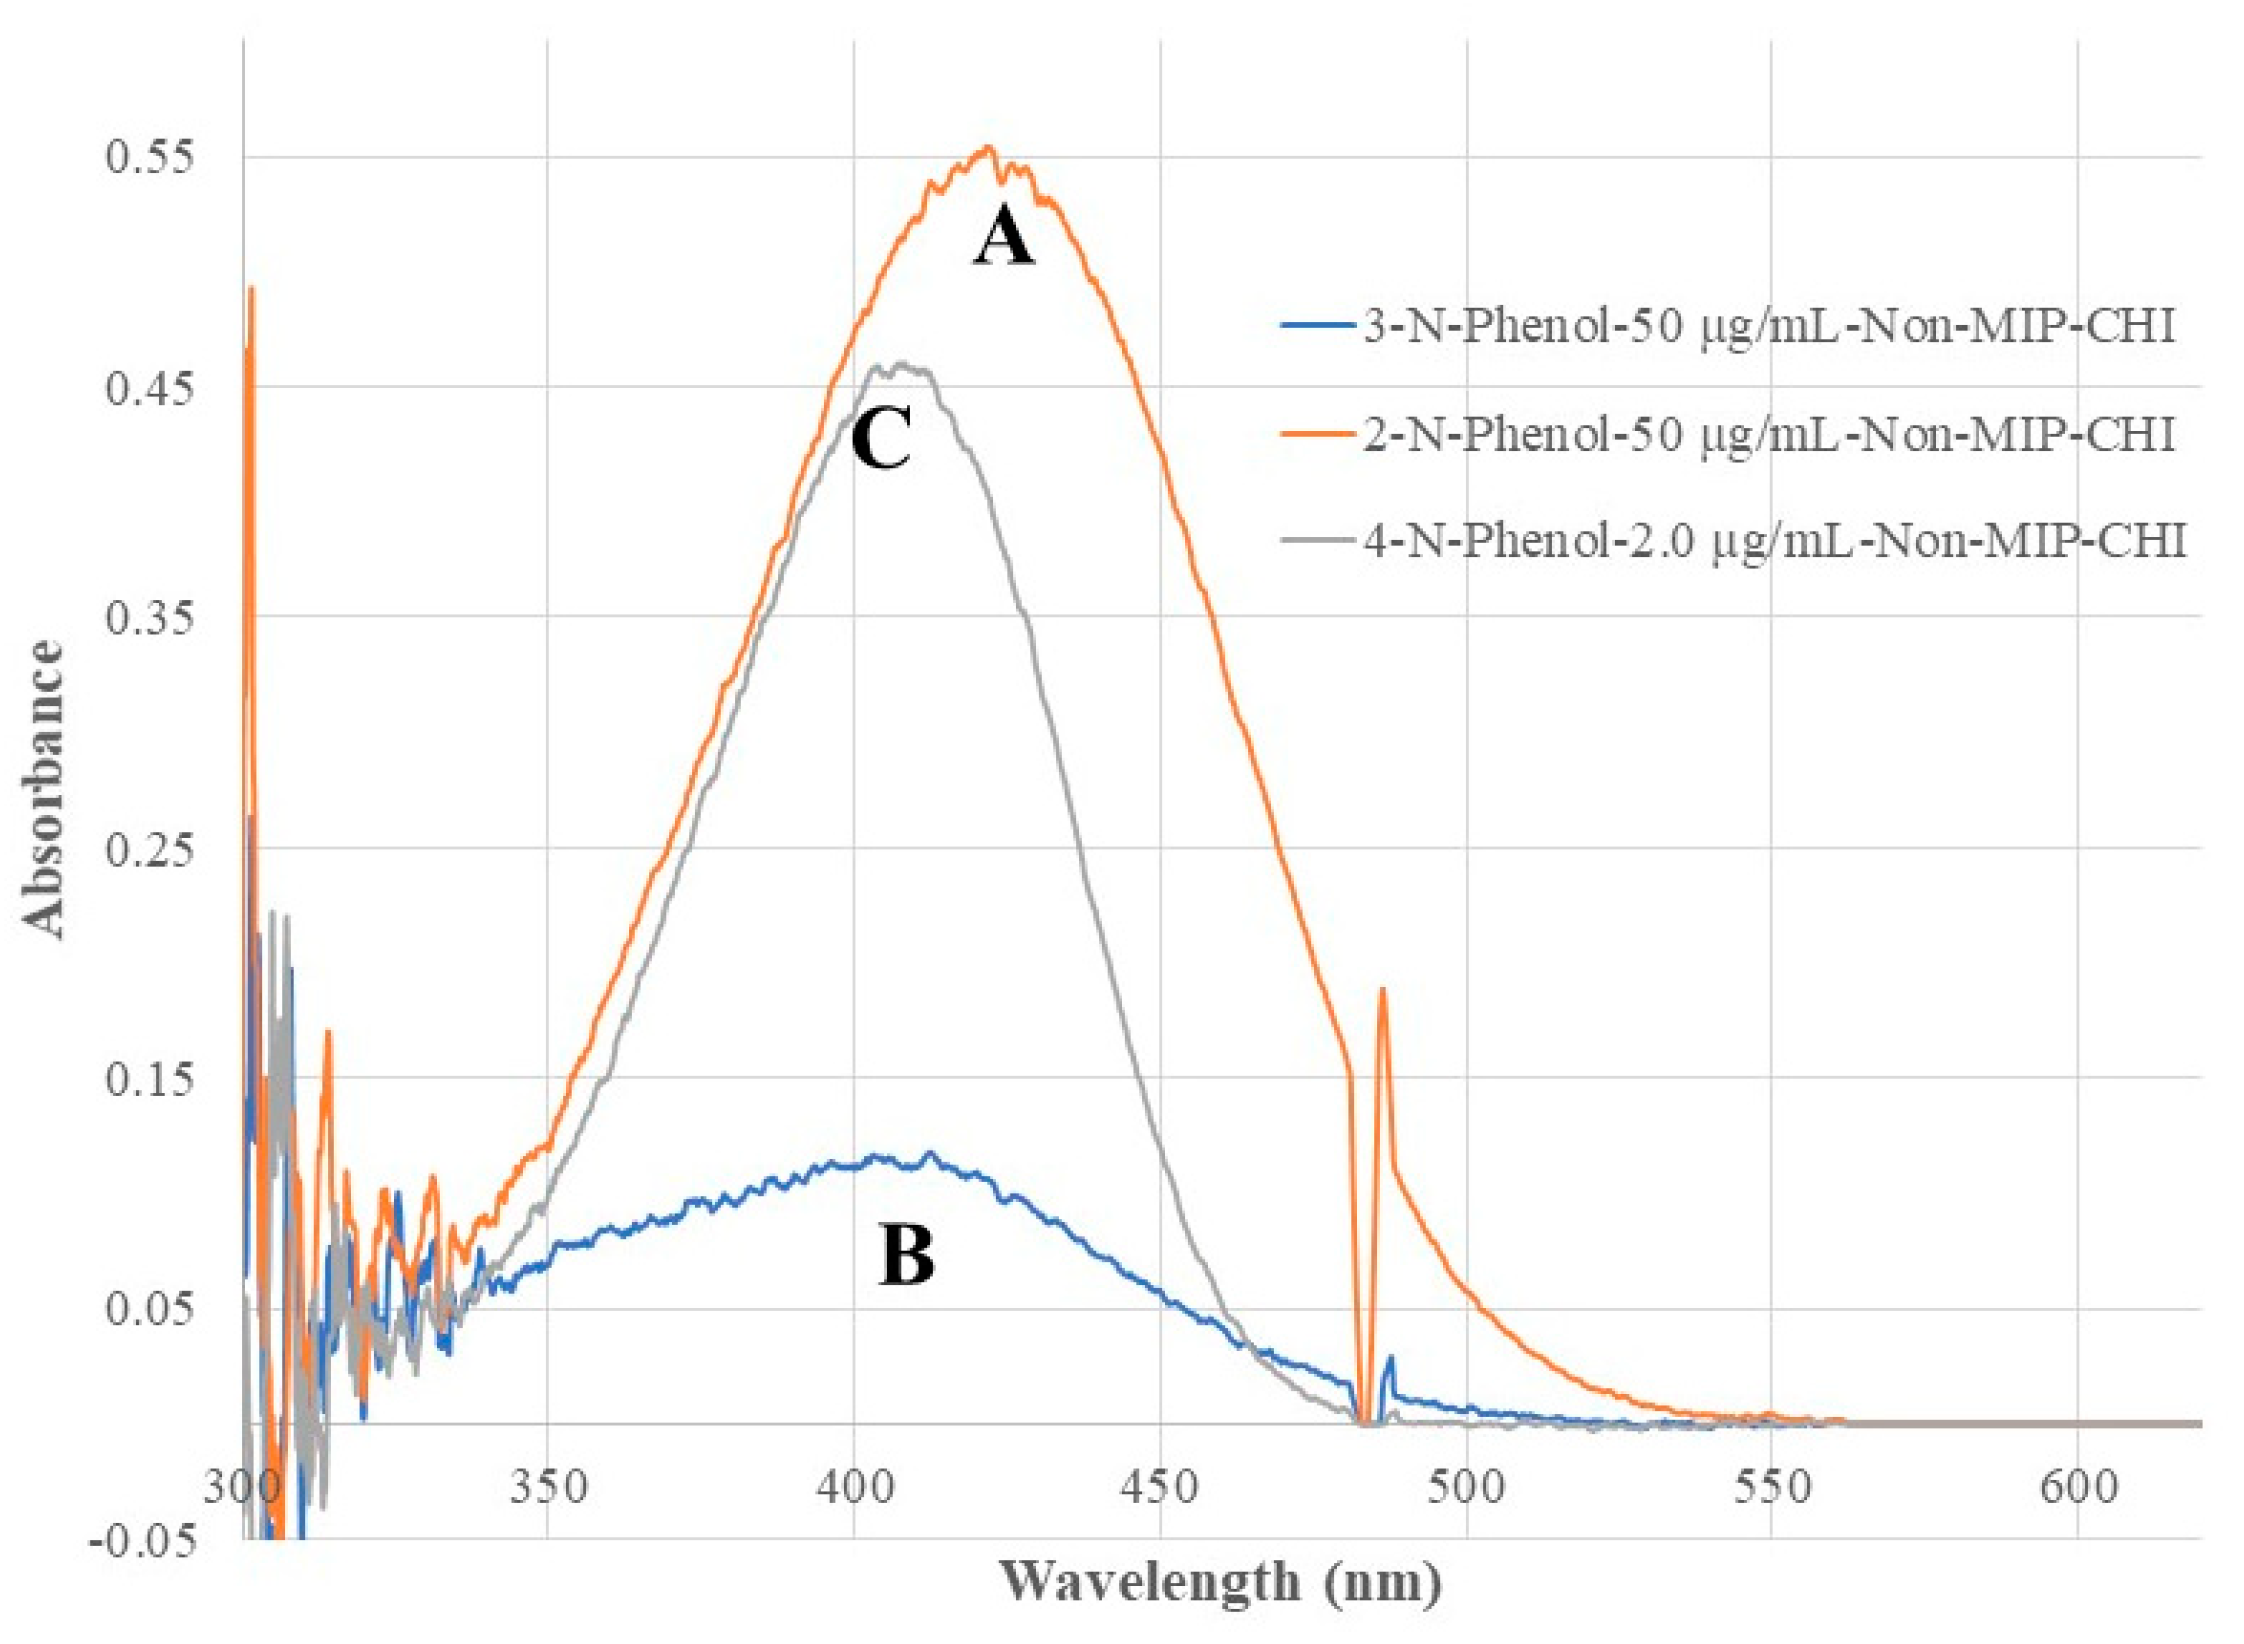
Figure 6.
Optical fiber EW absorption spectra of 4-NP standard solutions of different concentrations recorded using the same BOFP but coated with a 4-NP templated chitosan membrane. The inserted graph shows the relationship of recorded spectrum’s peak wavelength (410 nm) absorbance with 4-NP concentration in the standard solutions.
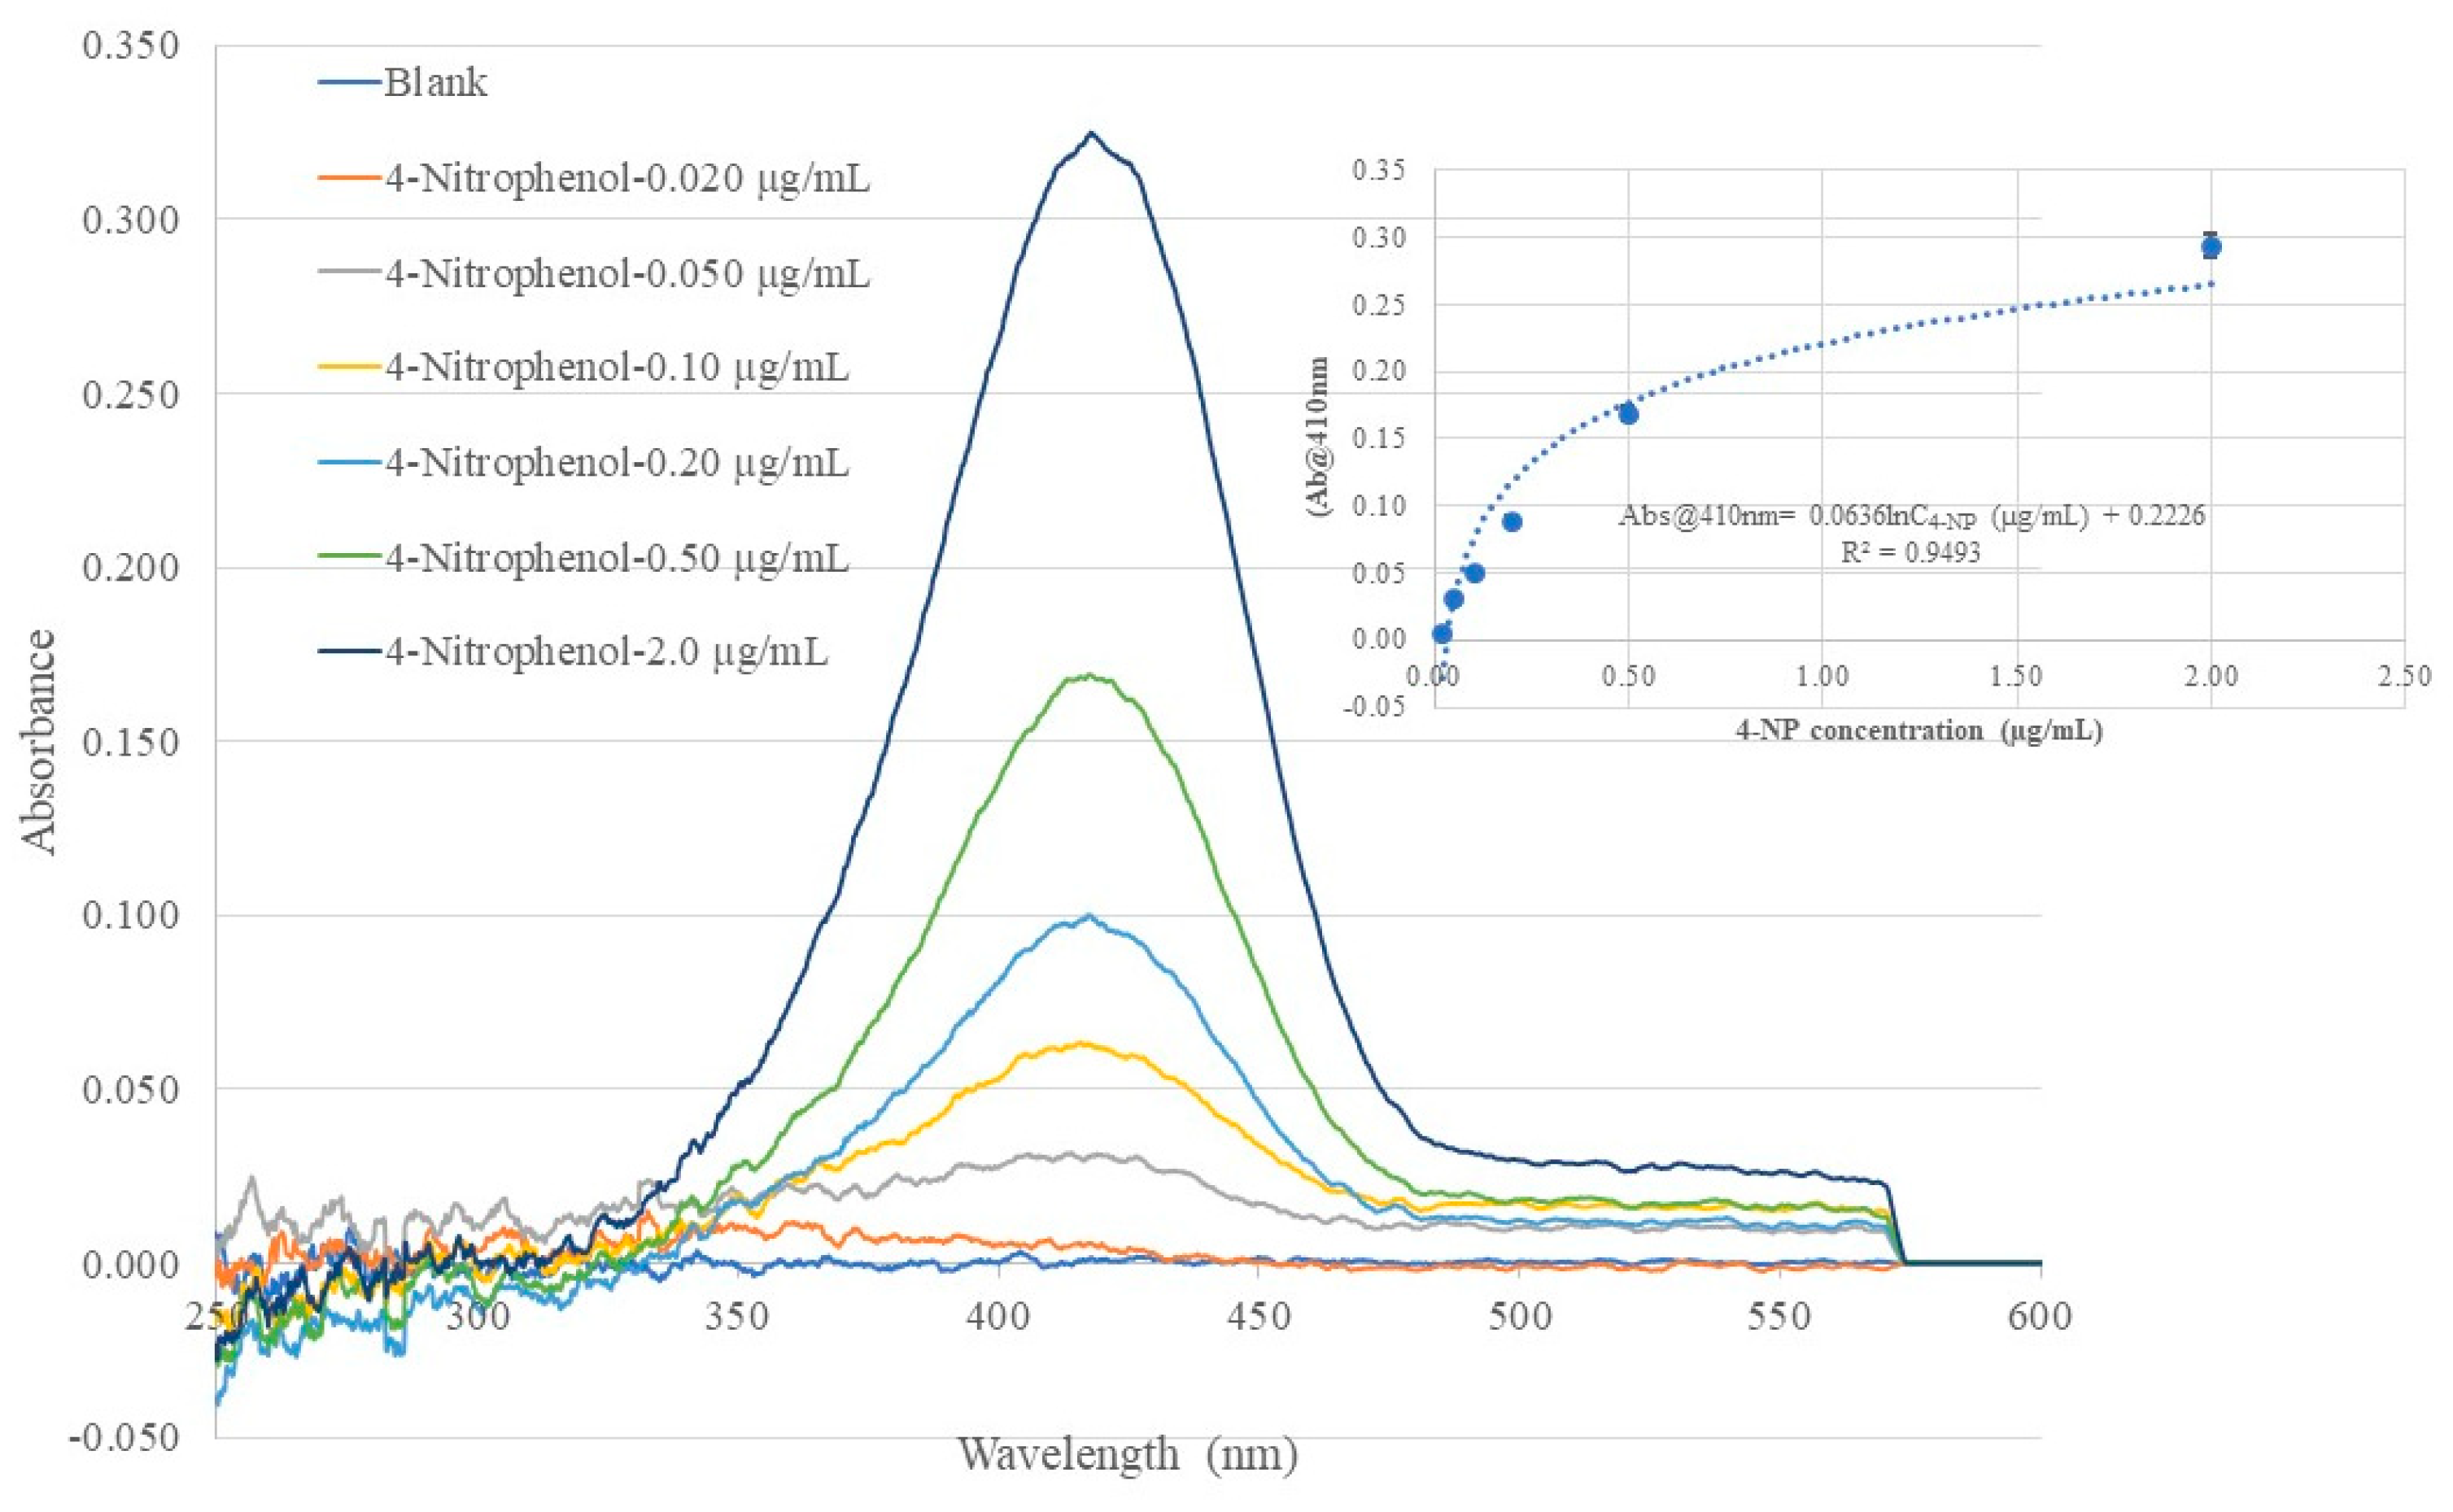
Figure 7.
Optical fiber EW absorption spectra of 3-NP standard solutions of different concentrations recorded using the same BOFP but coated with a 3-NP templated chitosan membrane. The inserted graph shows the relationship of recorded spectrum’s peak wavelength (410 nm) absorbance with 3-NP concentration in the standard solutions.
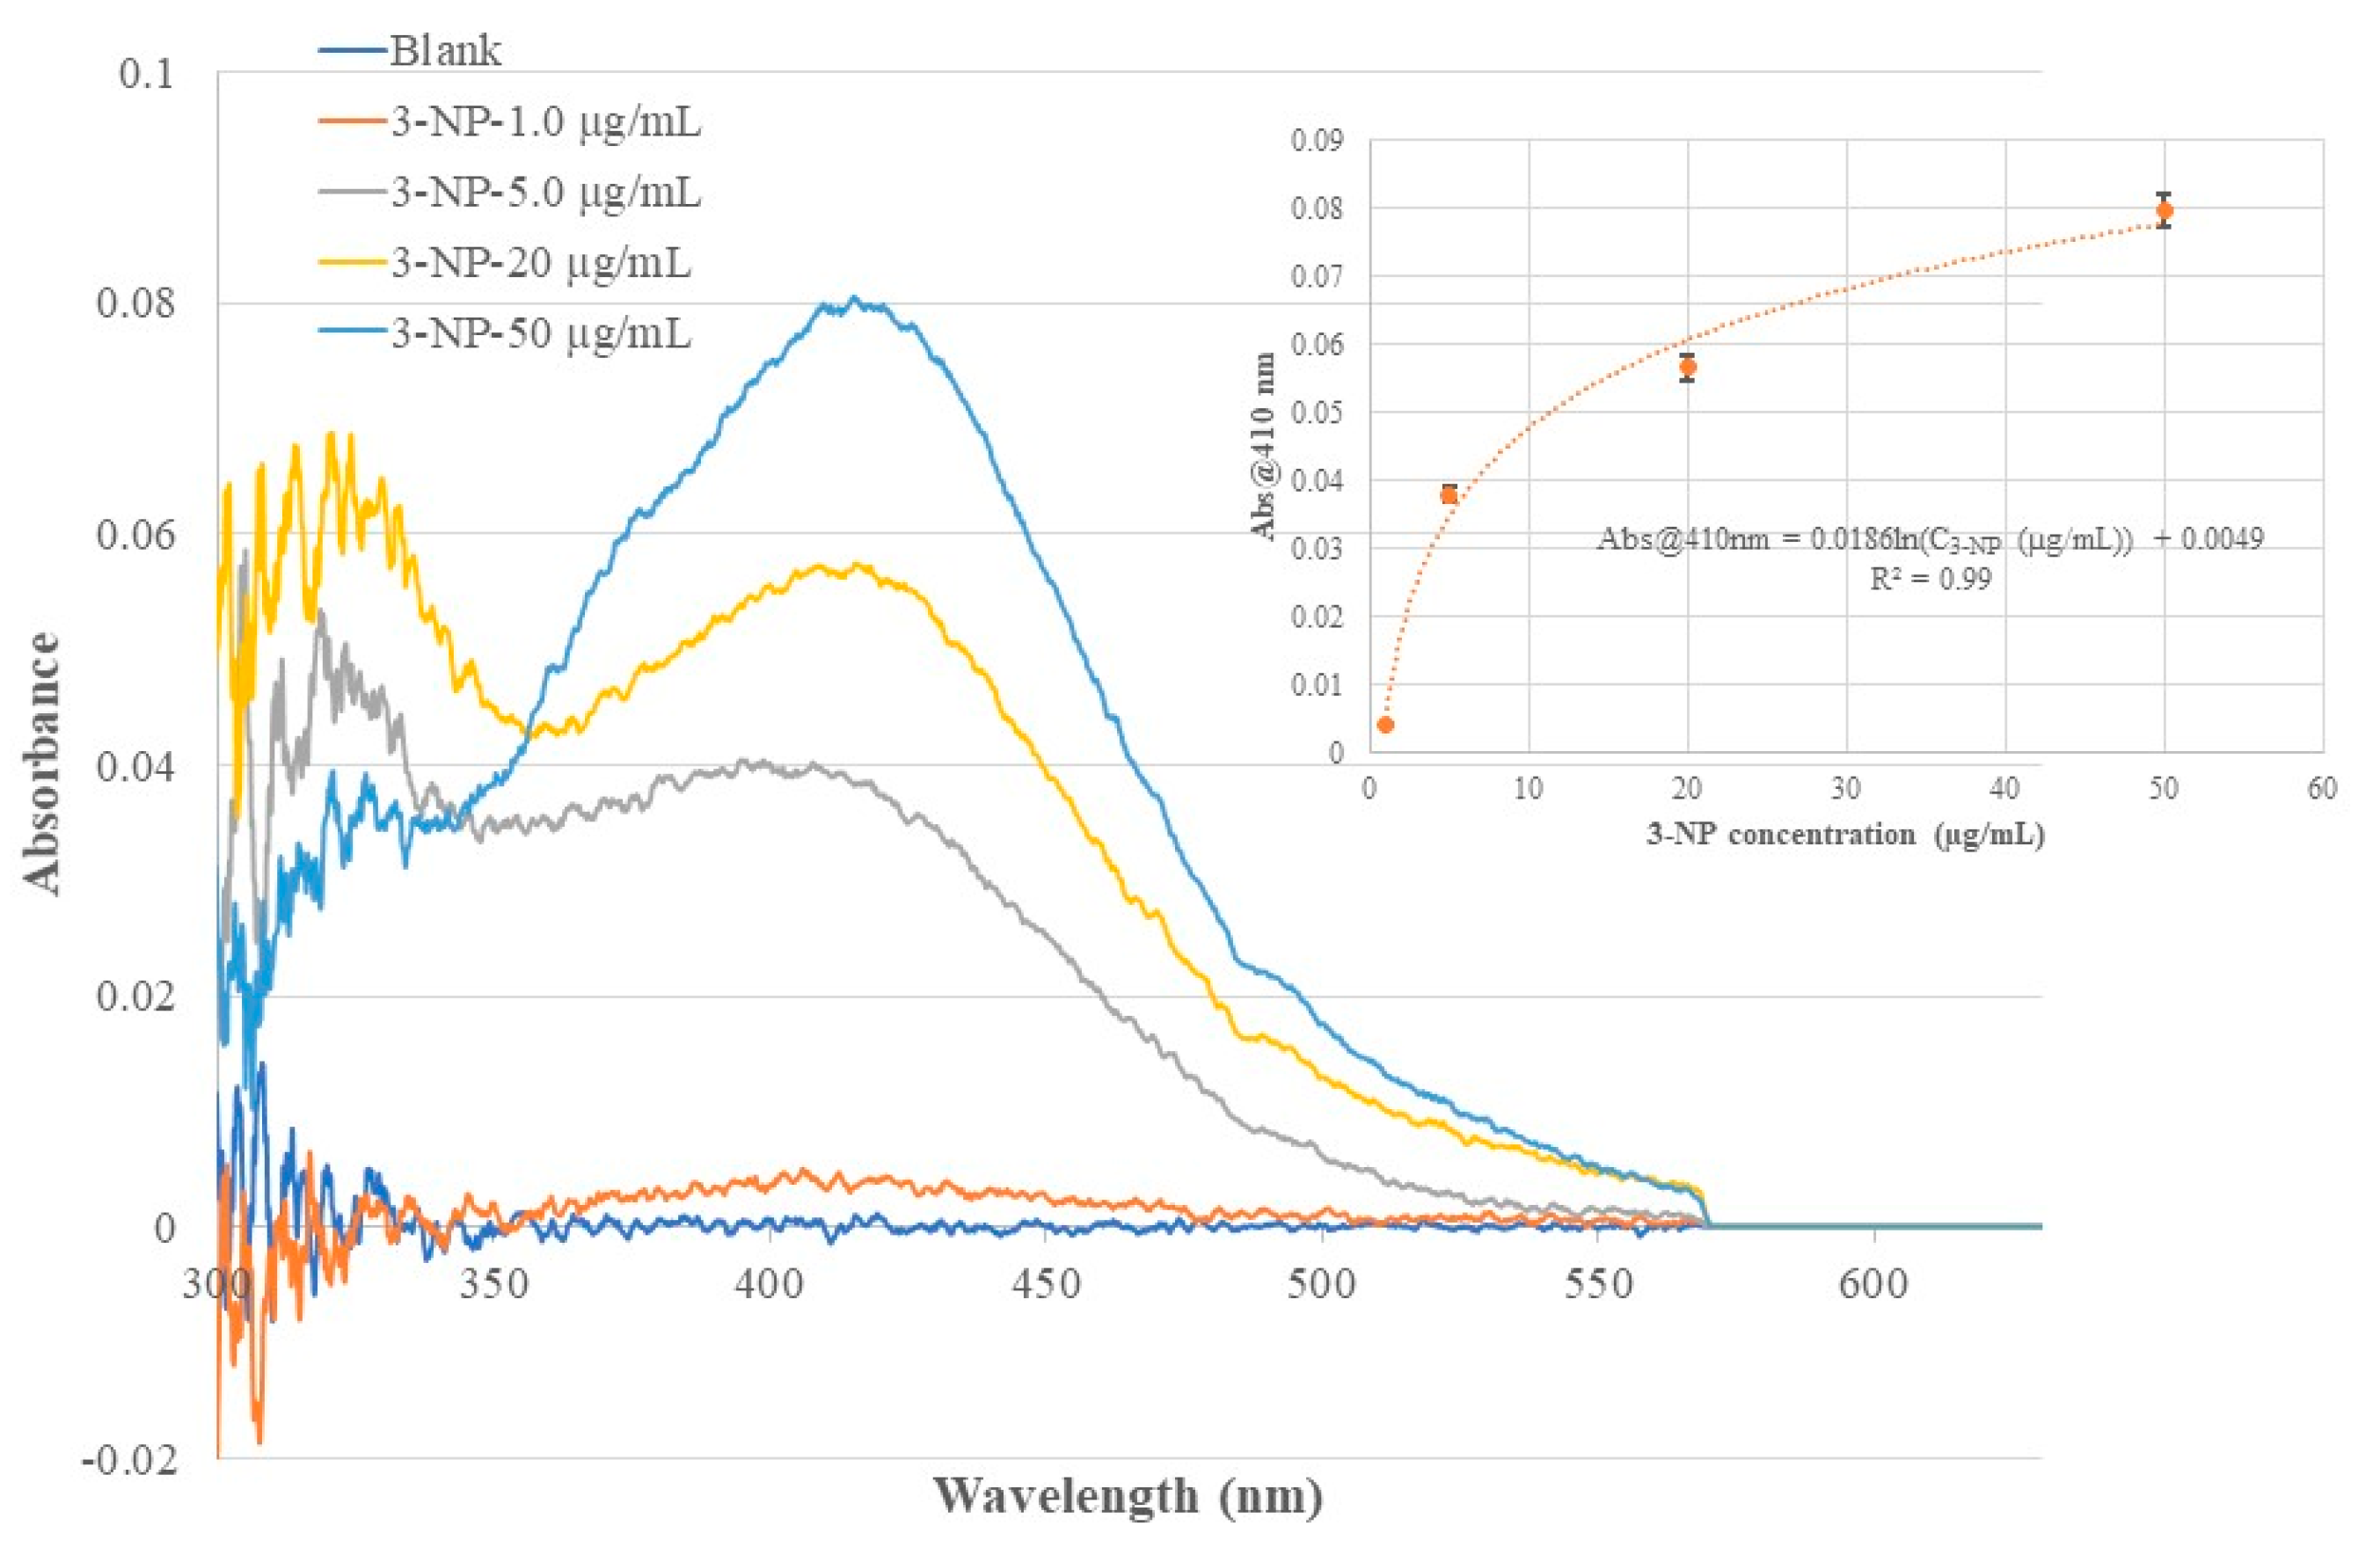
Figure 8.
Optical fiber EW absorption spectra of 2-NP standard solutions of different concentrations recorded using the same BOFP but coated with a 2-NP templated chitosan membrane. The inserted graph shows the relationship of recorded spectrum’s peak wavelength (425 nm) absorbance with 2-NP concentration in the standard solutions.
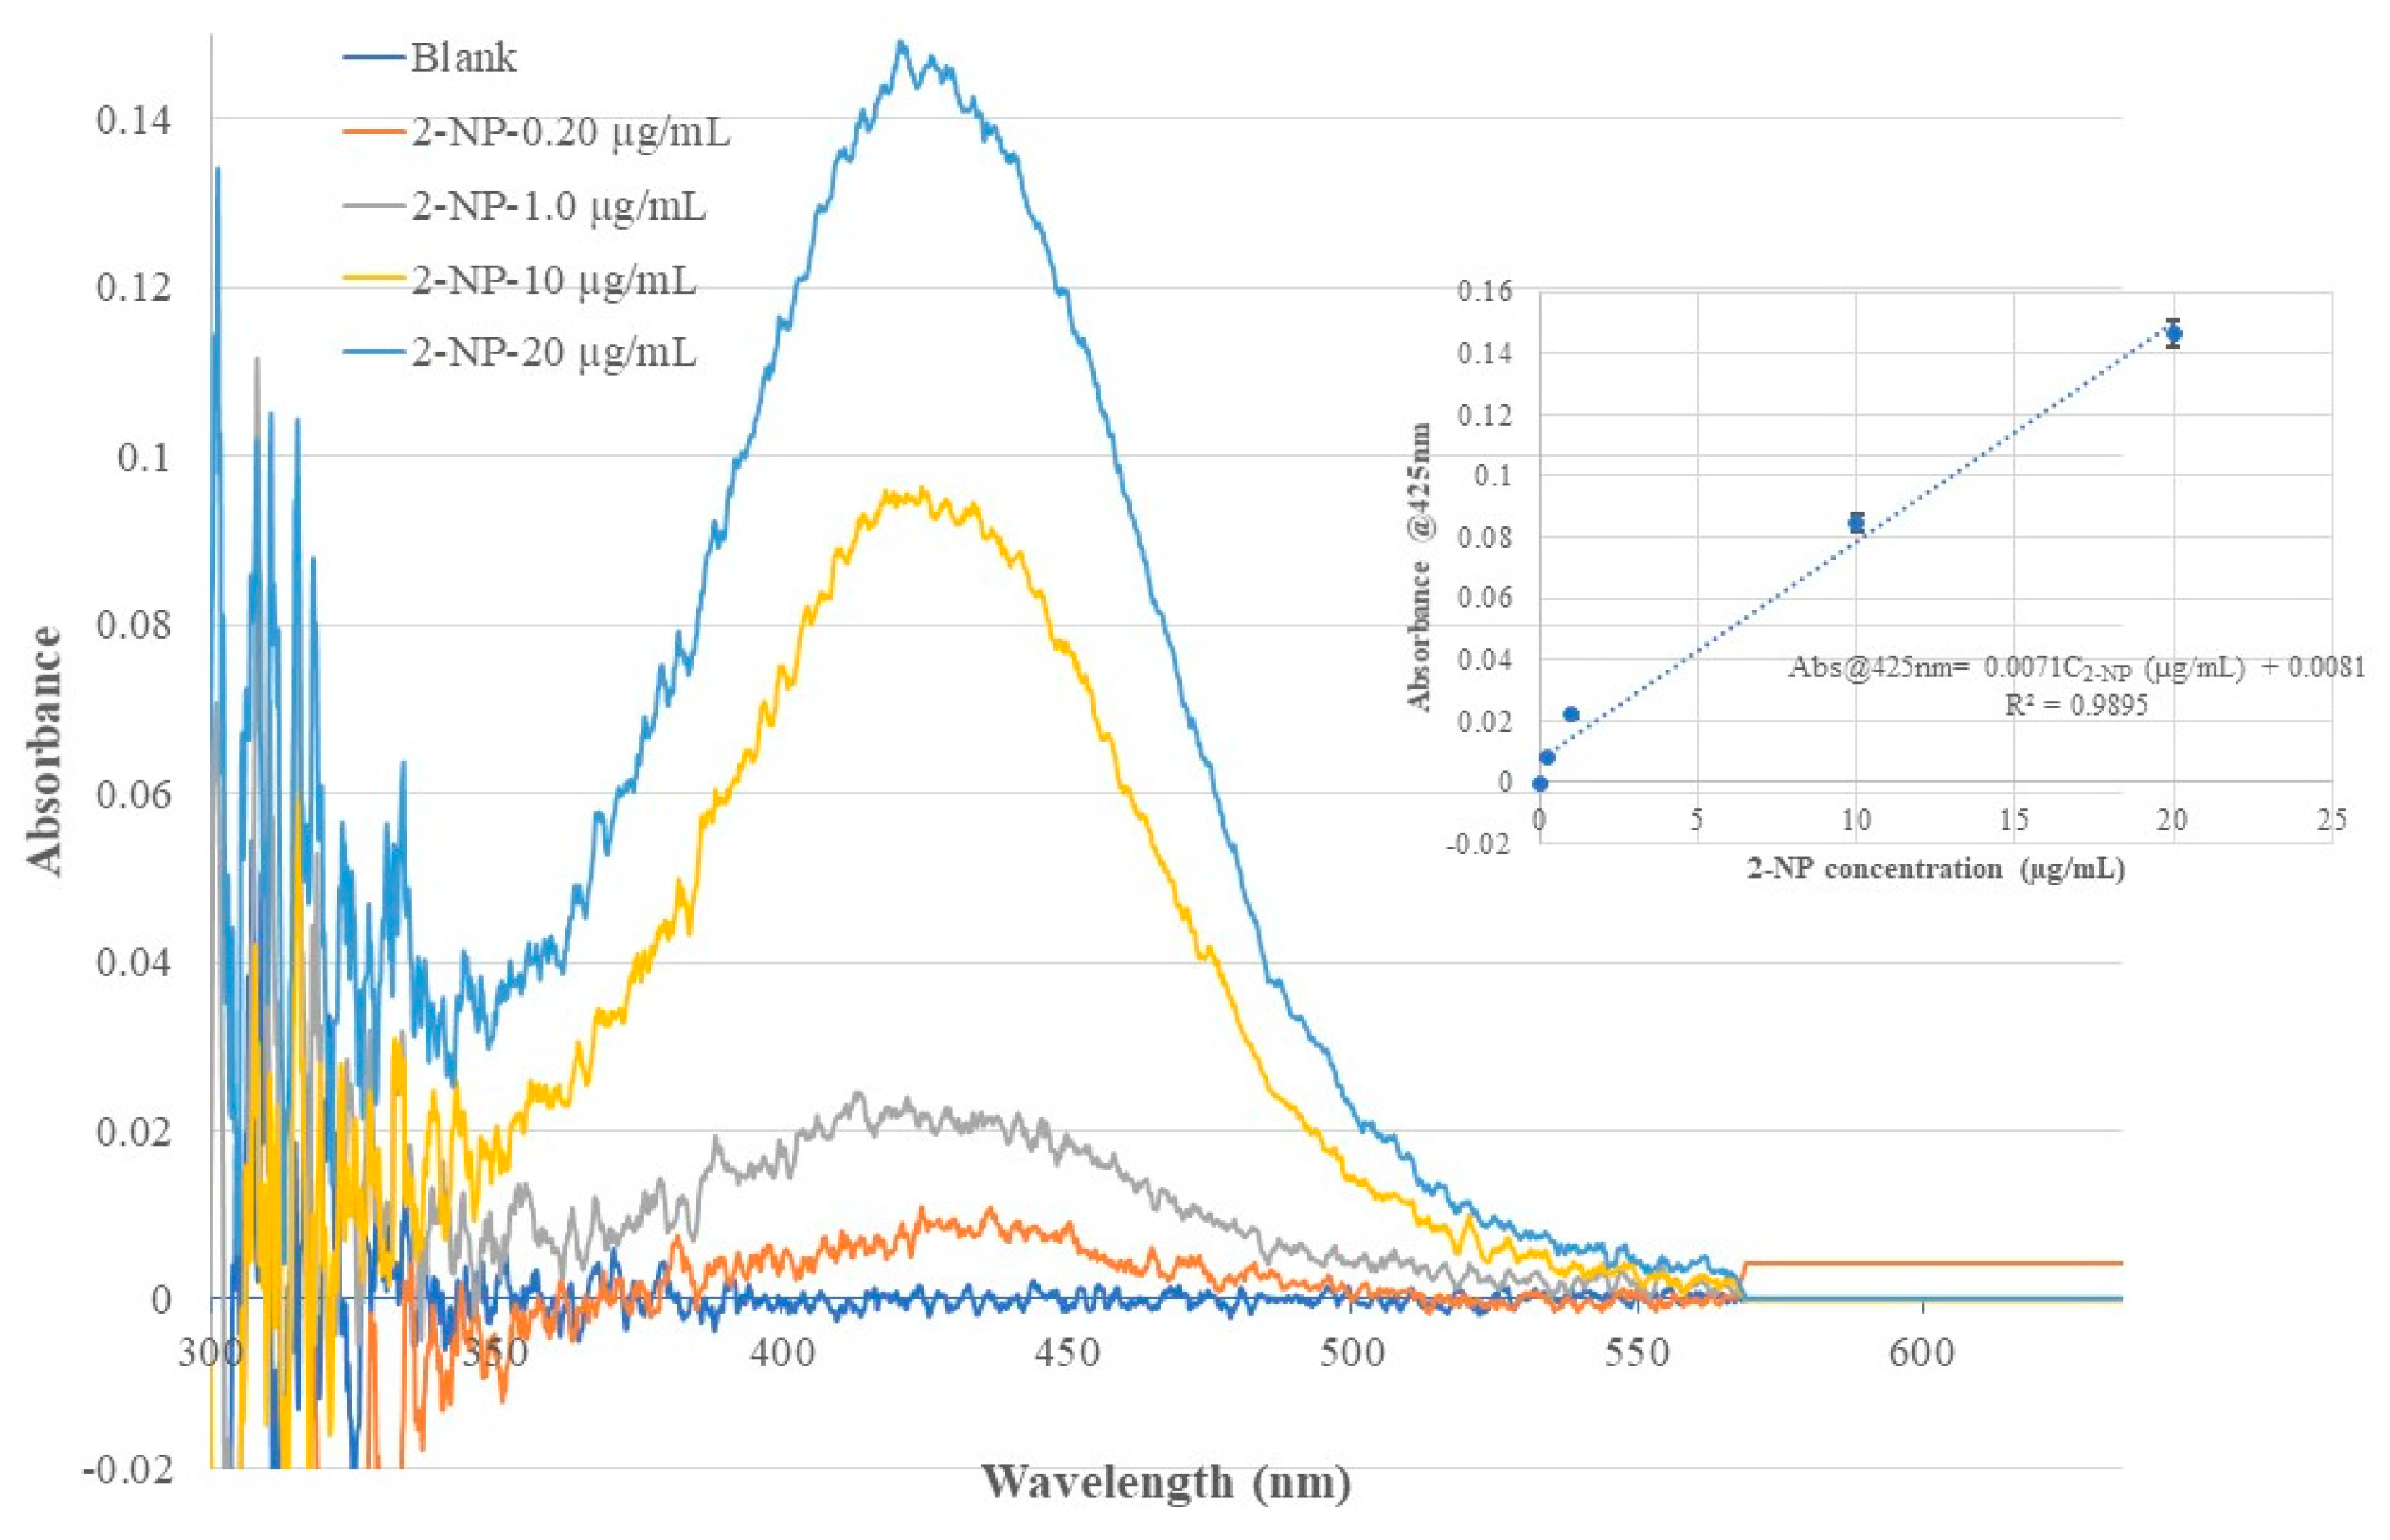
Figure 9.
Time response of a 4-NP templated chitosan MIP membrane coated BOFP alternatively exposed to DI water and a 0.20 µg/mL 4-NP standard solution. The spikes in the time profile were caused by changing sample solution between DI water and the 4-NP standard solution.
Figure 9.
Time response of a 4-NP templated chitosan MIP membrane coated BOFP alternatively exposed to DI water and a 0.20 µg/mL 4-NP standard solution. The spikes in the time profile were caused by changing sample solution between DI water and the 4-NP standard solution.
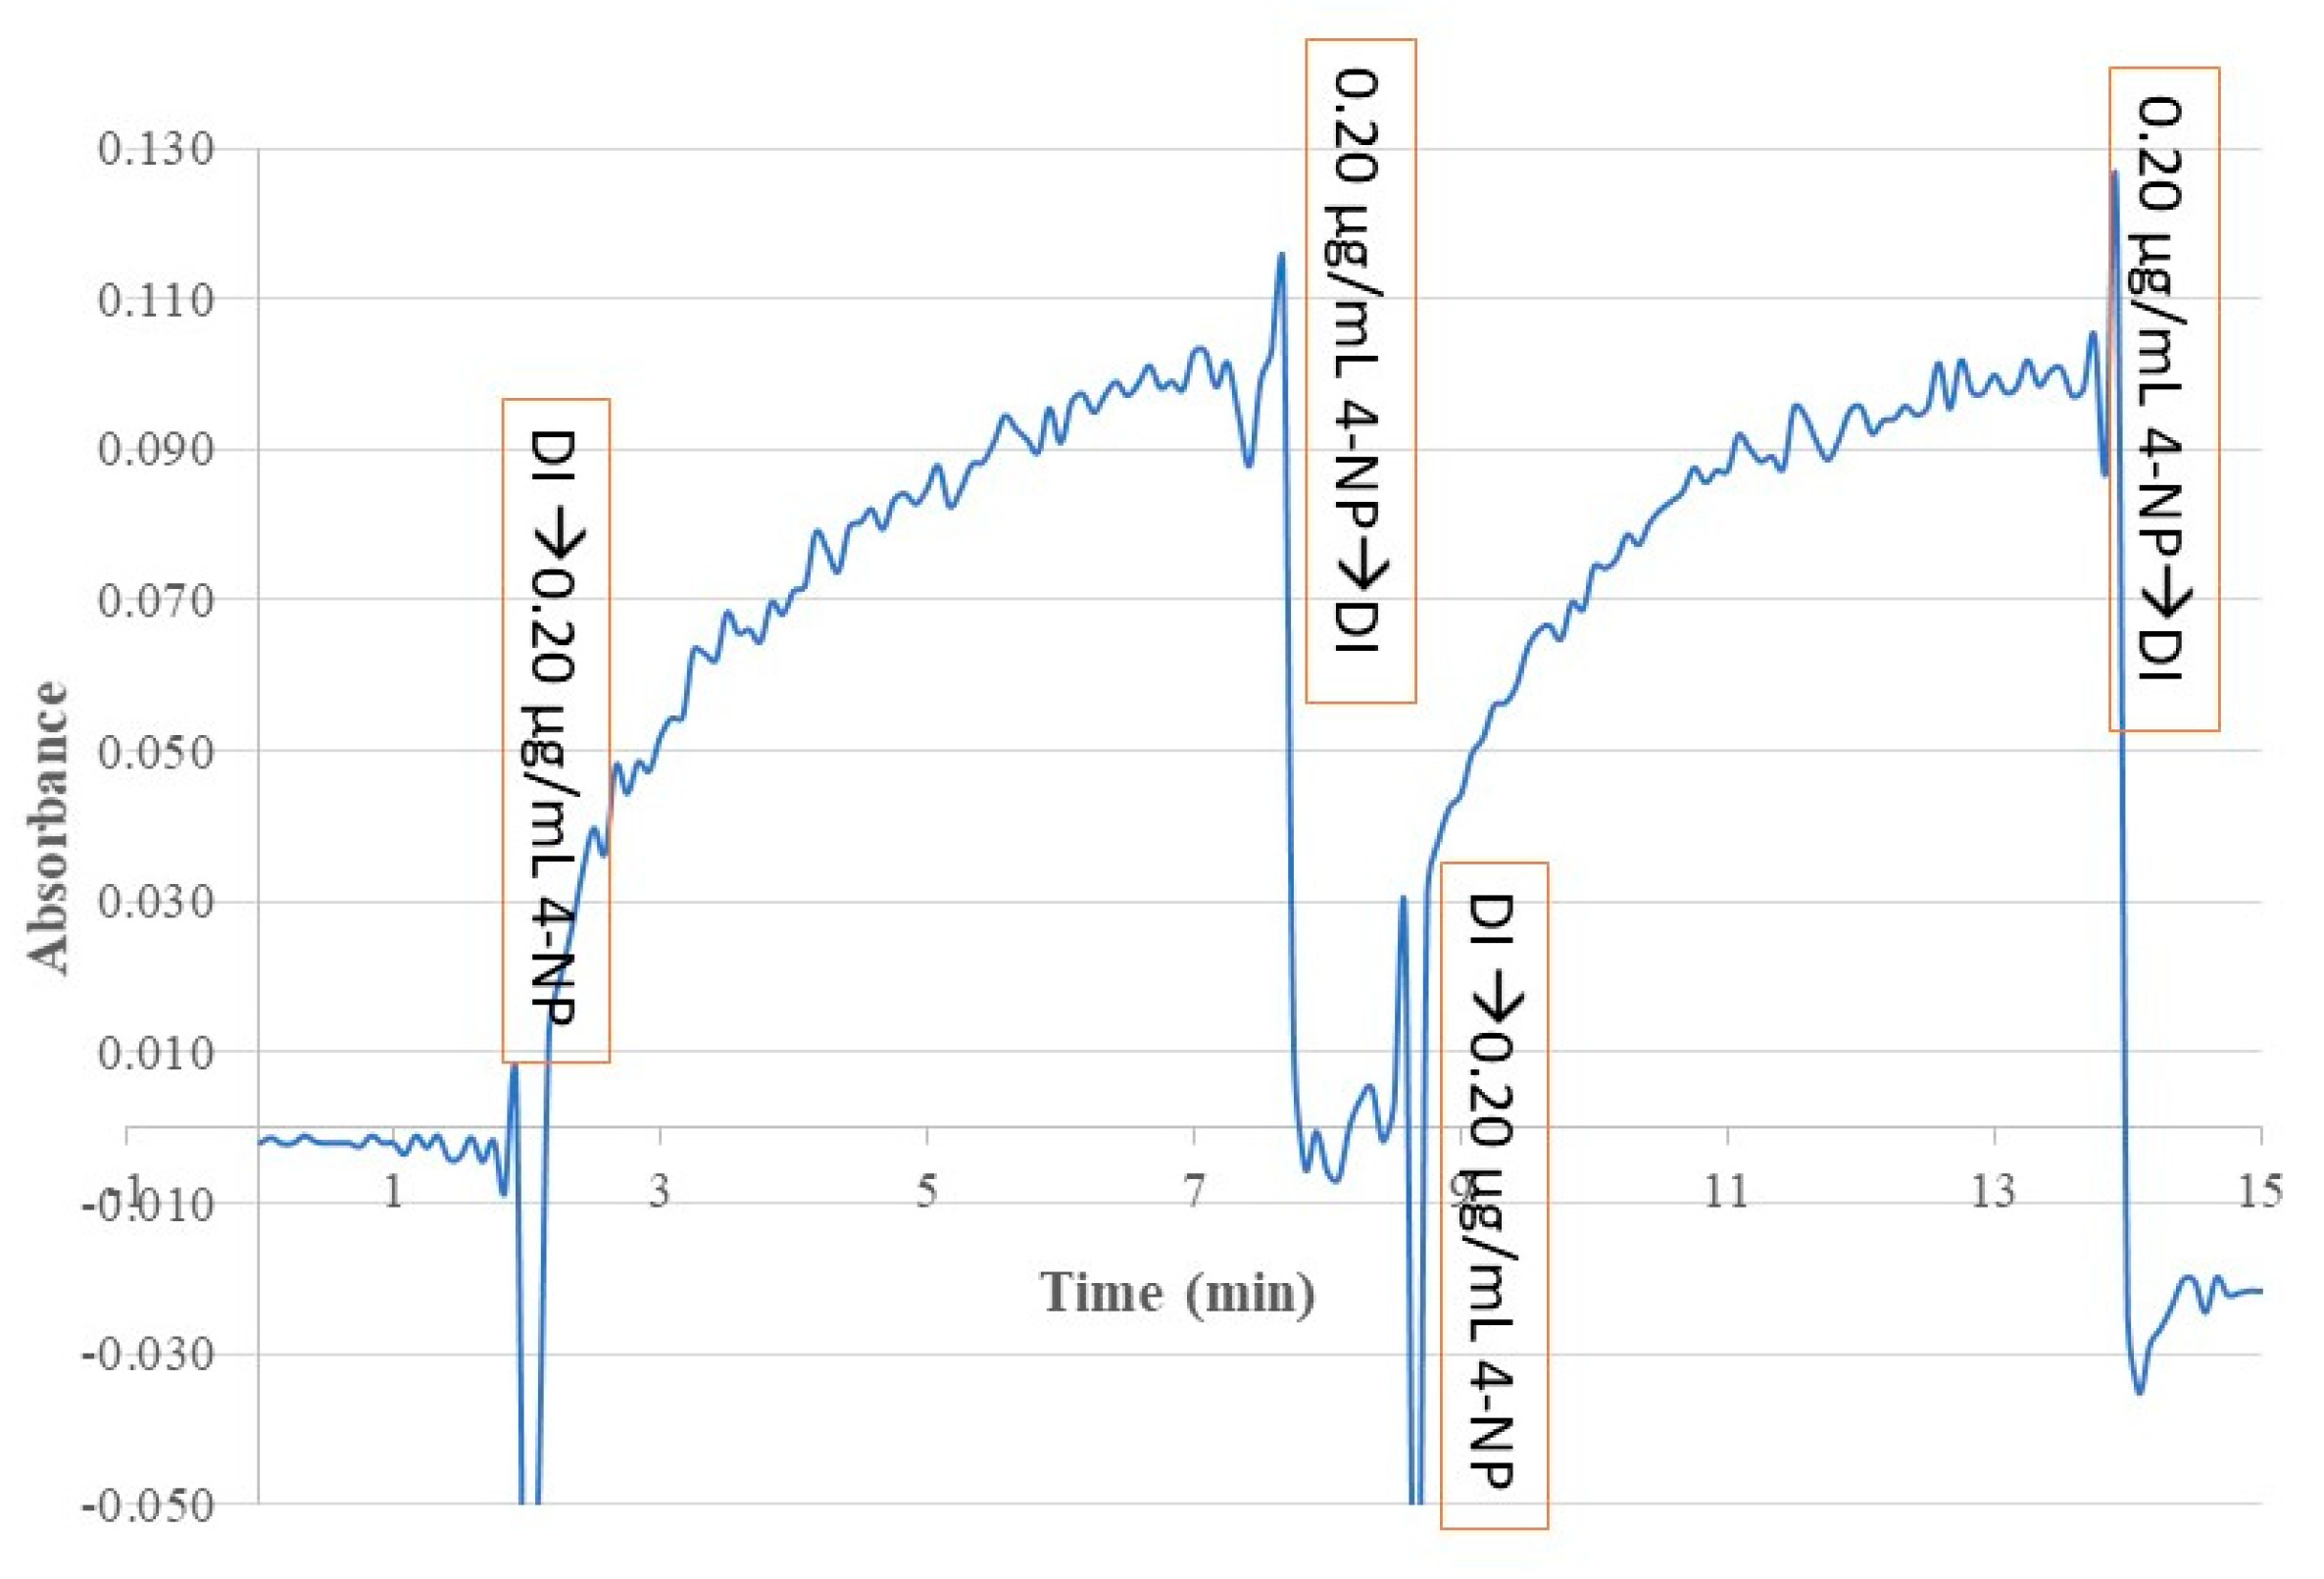
Figure 10.
A linear calibration curve describes the relationship of the 4-NP sensor’s absorbance at 410 nm with 4-NP concentration in standard solutions in a narrow concentration range from blank to 0.20 µg/mL.
Figure 10.
A linear calibration curve describes the relationship of the 4-NP sensor’s absorbance at 410 nm with 4-NP concentration in standard solutions in a narrow concentration range from blank to 0.20 µg/mL.
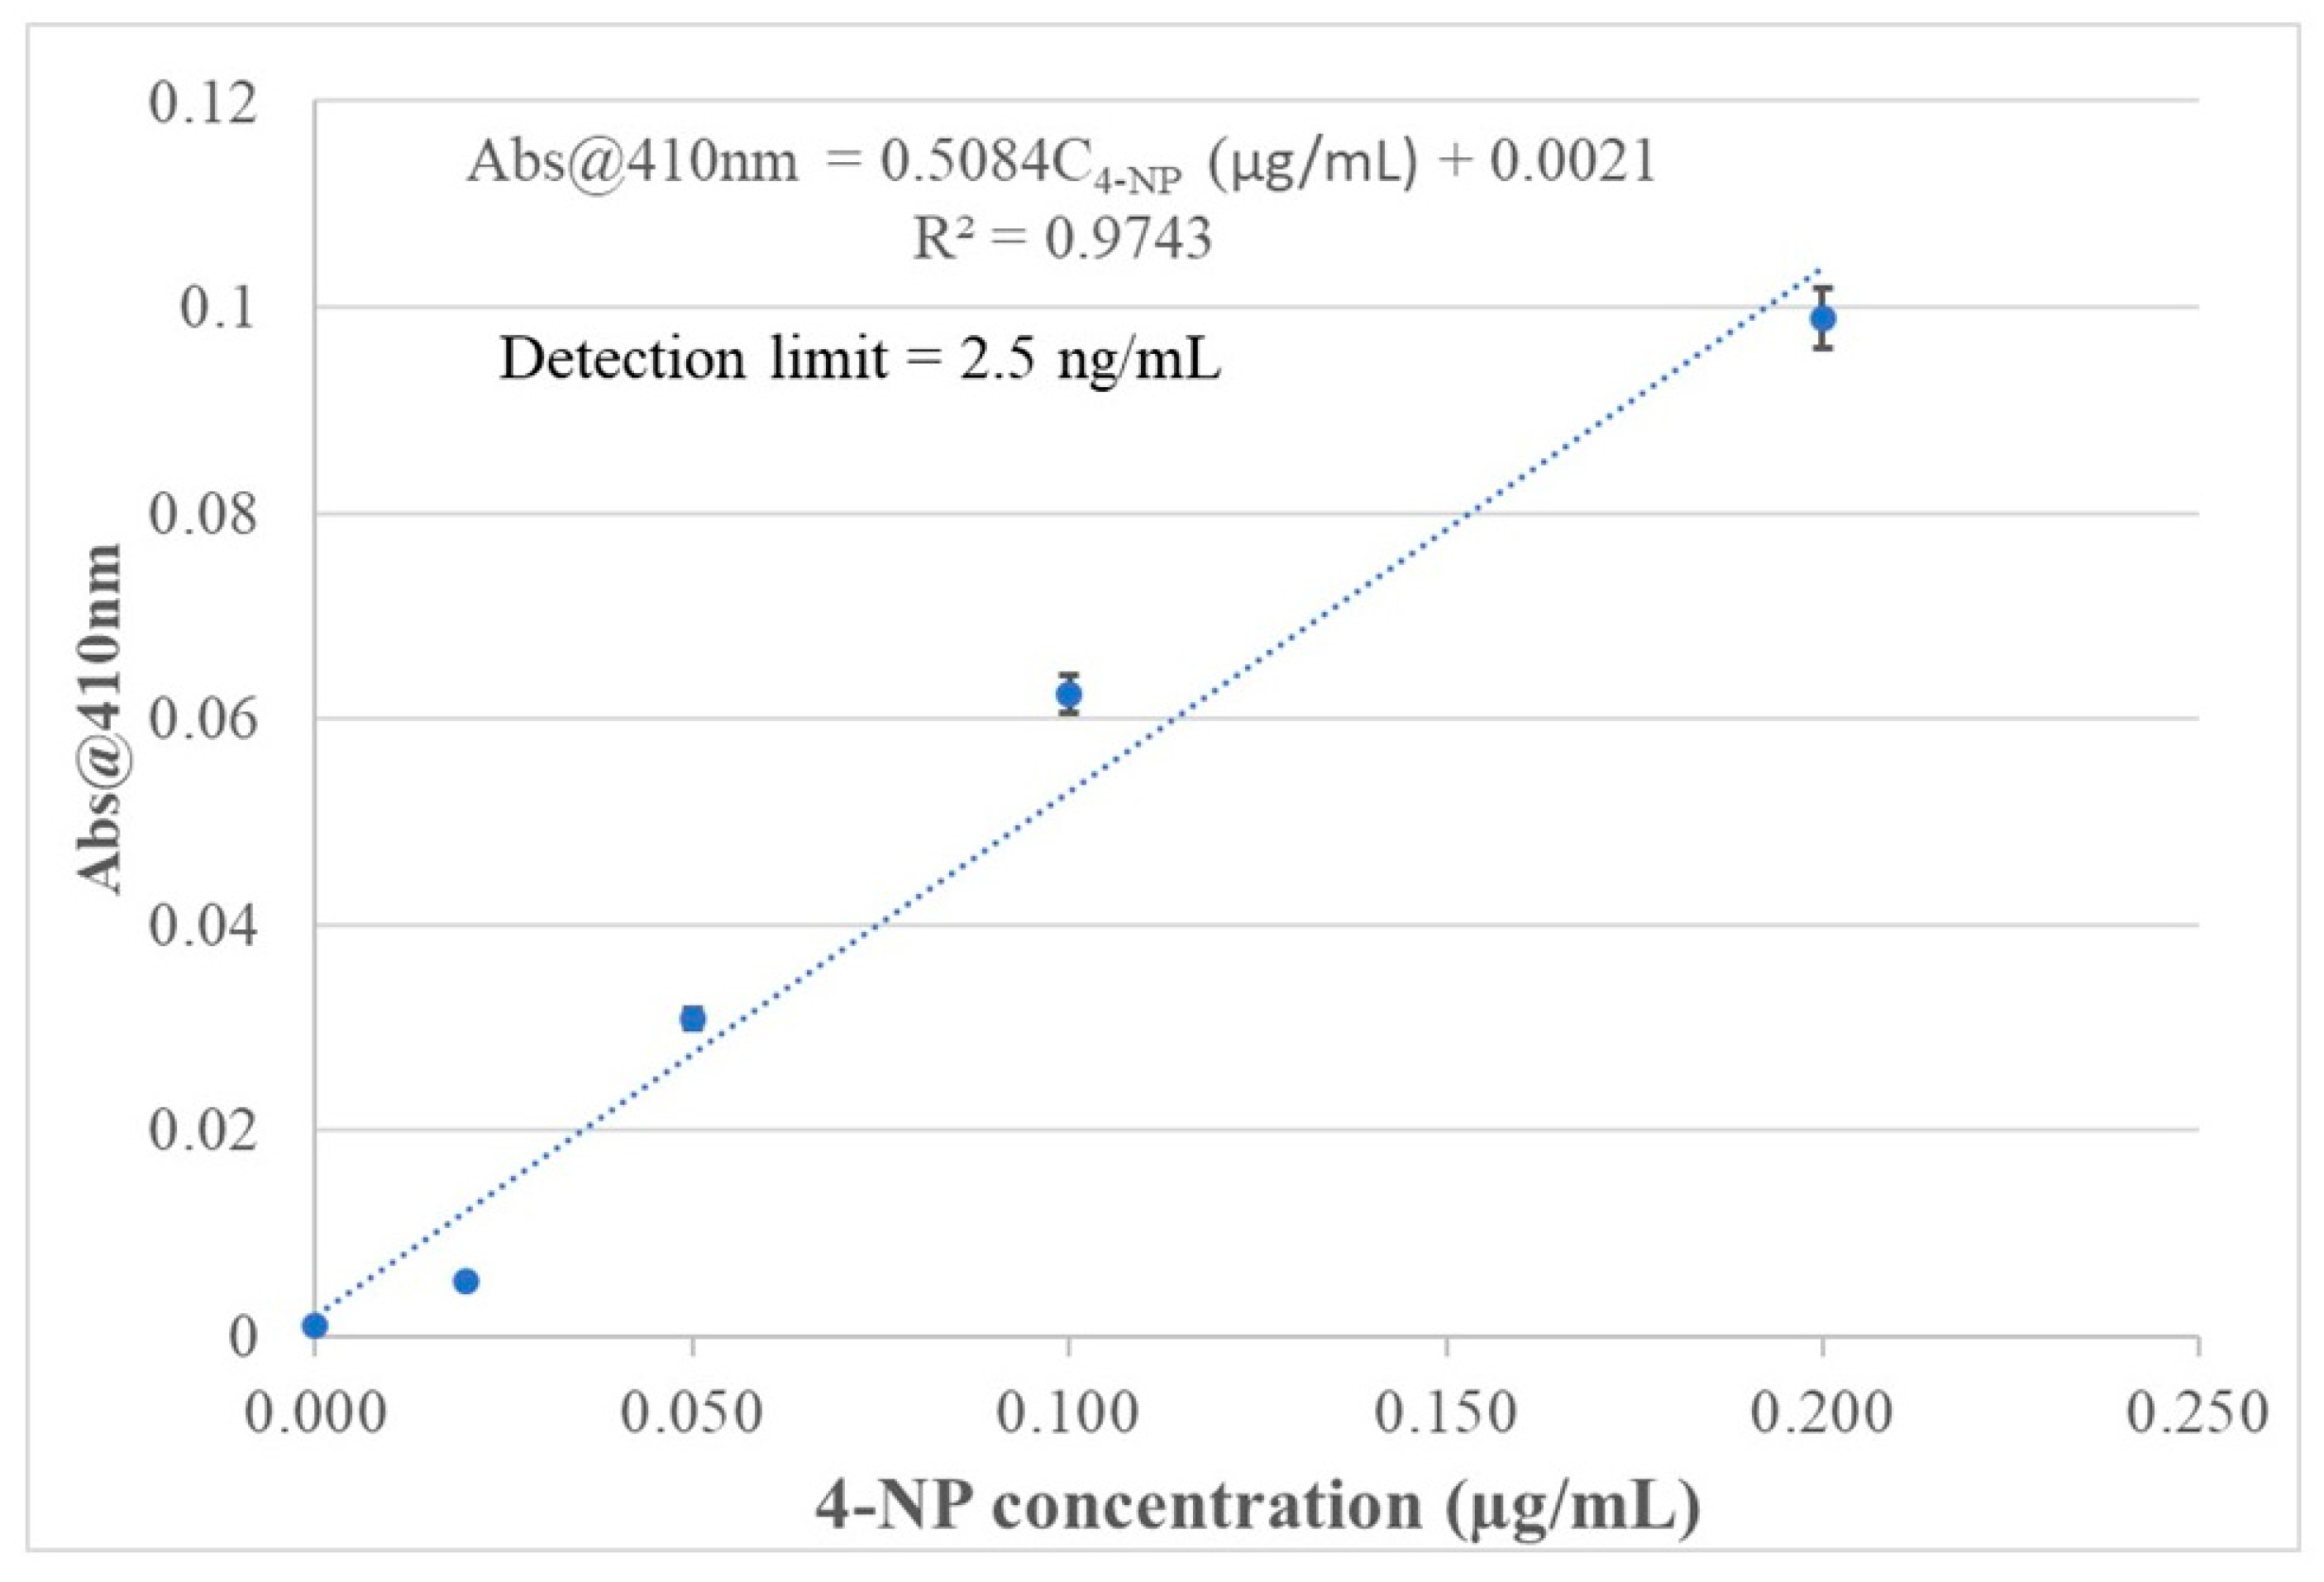
Figure 11.
Optical fiber EW absorption spectra of a 4-NP templated chitosan MIP coated BOFP exposed to standard solutions of 4-NP, its isomers (2-NP, 3-NP) and derivatives (2,4-di-NP, 2-chloro-4NP).
Figure 11.
Optical fiber EW absorption spectra of a 4-NP templated chitosan MIP coated BOFP exposed to standard solutions of 4-NP, its isomers (2-NP, 3-NP) and derivatives (2,4-di-NP, 2-chloro-4NP).
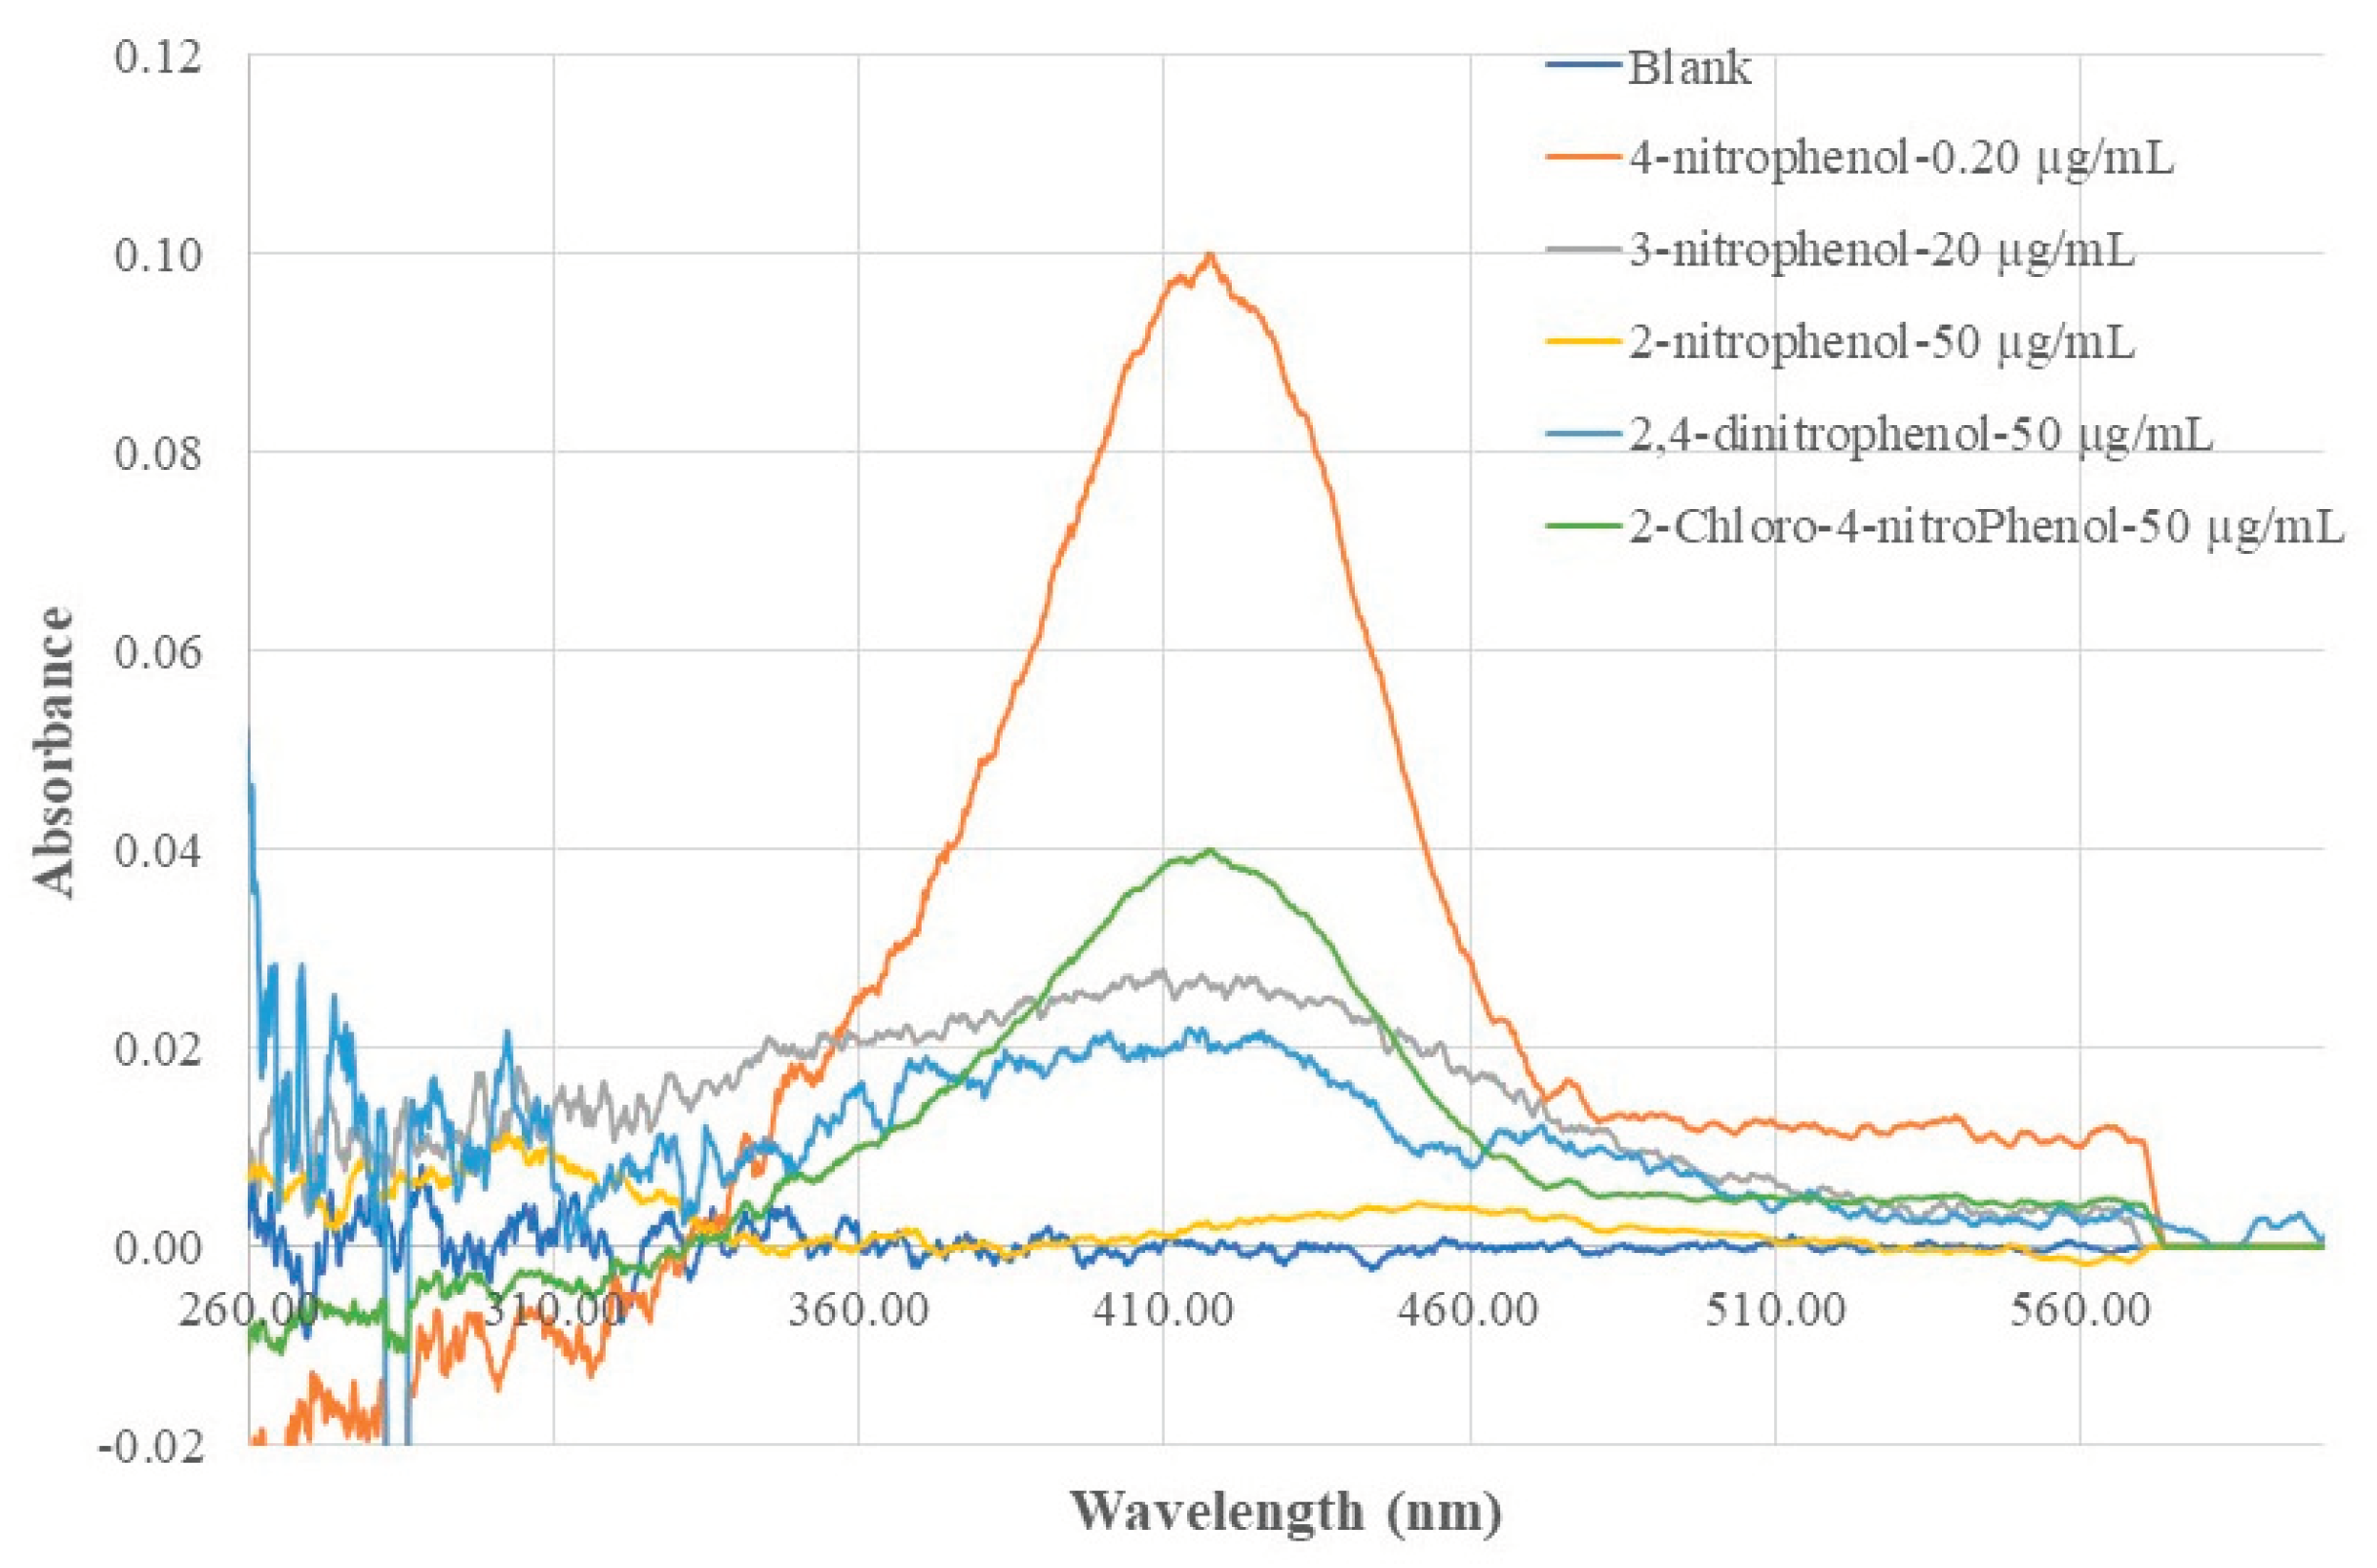

Table 1.
SIF values comparing non-MIP chitosan membrane and MIP chitosan membrane coated BOFP with a bare fiber BOFP for EW-OFCS analyzing NPs, and IF values compare a chitosan membrane with a non-MIP MIP chitosan membrane coated BOFP for analyzing NPs.
Table 1.
SIF values comparing non-MIP chitosan membrane and MIP chitosan membrane coated BOFP with a bare fiber BOFP for EW-OFCS analyzing NPs, and IF values compare a chitosan membrane with a non-MIP MIP chitosan membrane coated BOFP for analyzing NPs.
| compound | λmax | SIF (non-MIP/BareFiber | pKa | IF of MIP membrane | SIF (MIP/BareFiber) |
|---|---|---|---|---|---|
| 2-NP | 350 nm (bare fiber) 425 nm (non-MIP chitosan membrane) |
7.4*102 | 7.2 | 0.66 | 4.9*102 |
| 3-NP | 335 nm (bare fiber) 410 nm (non-MIP chitosan membrane) |
1.5*102 | 8.4 | 0.71 | 1.2*102 |
| 4-NP | 325 nm (bare fiber) 410 nm (non-MIP chitosan membrane) |
6.0*103 | 7.1 | 2.3 | 1.4*104 |
Table 2.
SF and SLIF values for NP isomers and selected 4-NP’s derivatives.
| Compound | SF-MIP | SF-non-MIP | SLIF |
| 4-NP | 1 | 1 | 1 |
| 2-NP | 1922 | 97 | 20 |
| 3-NP | 372 | 21 | 18 |
| 2-Cl-4-NP | 104 | NA | NA |
| 2,4-di-NP | 140 | NA | NA |
Table 3.
Analytical results of using this sensor for analyzing 4-NP in a standard addition sample with a bottled drink water product as sample matrix.
Table 3.
Analytical results of using this sensor for analyzing 4-NP in a standard addition sample with a bottled drink water product as sample matrix.
| Test number | 4-NP concentration added to test sample (µg/mL) | 4-NP concentration measured with this sensor (µg/mL) | Recovery rate |
| Test 1 | 0.10 | 0.093 | 93% |
| Test 2 | 0.10 | 0.101 | 101% |
| Test 3 | 0.10 | 0.101 | 101% |
| Average | 0.10 | 0.098 | 98% |
| STDV/RSD% | 0.0046/4.7% |
Disclaimer/Publisher’s Note: The statements, opinions and data contained in all publications are solely those of the individual author(s) and contributor(s) and not of MDPI and/or the editor(s). MDPI and/or the editor(s) disclaim responsibility for any injury to people or property resulting from any ideas, methods, instructions or products referred to in the content. |
© 2025 by the authors. Licensee MDPI, Basel, Switzerland. This article is an open access article distributed under the terms and conditions of the Creative Commons Attribution (CC BY) license (http://creativecommons.org/licenses/by/4.0/).
Copyright: This open access article is published under a Creative Commons CC BY 4.0 license, which permit the free download, distribution, and reuse, provided that the author and preprint are cited in any reuse.


