
Submitted:
23 December 2025
Posted:
24 December 2025
You are already at the latest version
Abstract
Although particulate matter has been associated with sleep problems, the effects of PM2.5-bound organophosphate esters (OPEs) on children’s sleep remain unclear. In this study, we examined the relationship between OPEs in PM2.5 and sleep disorders in children. This cross-sectional study included 110,169 children aged 6–18 years from primary and secondary schools in the Pearl River Delta (PRD), China. Sleep disorders were evaluated using the validated Sleep Disturbance Scale for Children (SDSC). Concentrations of OPEs were measured through school-based sampling and chemical analysis. Elastic net regression identified key OPE exposures, binomial generalized linear mixed models estimated individual OPE effects with the city as a random effect, and weighted quantile sum regression assessed the combined effects of OPE mixtures. All odds ratios indicate the change in likelihood of sleep disorders per interquartile range (IQR) increase in OPE concentrations. Although all components showed significant associations, the highest odds were observed with TDCIPP for short sleep duration (OR: 1.56–1.61), TEHP for short sleep duration (OR: 1.59–1.64), and TPHP for overall sleep disorder (OR: 1.32–1.42). Combine OPE exposure was positively associated with all childhood sleep disorders, with odds ratios ranging from 2.02 to 2.85 across various sleep outcomes. These findings highlight how OPE mixtures in PM2.5 affect child sleep health, emphasizing the need for comprehensive analytical methods.
Keywords:
PM2.5
; OPEs
; Pearl River Delta
; children sleep disorder
1. Introduction
Organophosphate esters (OPEs) are high-volume chemicals that gained prominence in the early 2000s as replacements for polybrominated diphenyl ethers [1,2,3]. These substances are primarily flame retardants, plasticizers, and additives used in food packaging, furniture, clothing, polishes, electronics, toys, personal care, textiles, and building materials [1,2,3,4]. Global OPE consumption has increased from 0.68 million tons in 2016 to 0.9 million tons in 2019 [5]. China, as a major producer, increased output from 141,500 tons in 2014 to 294,200 tons in 2020 [6]. Biomonitoring studies suggest that children are likely more exposed by OPEs than adults. This may be due to increased hand-to-mouth activity and higher inhalation and metabolic rates [4,7,8,9]. Collectively, these trends highlight the growing importance of understanding OPE exposure in children, particularly in rapidly industrializing regions.
Human exposure to OPEs primarily occurs through inhalation, ingestion, and dermal absorption. Indoor dust and airborne particles are major sources of this exposure [10]. Various environmental and biological matrices have been utilized to evaluate OPE exposure. Although numerous methods and sample types, such as skin wipes [11], indoor air [12], silicone wristbands [13], silicone rubber brooches [9], floor and surface dust [1], blood and serum [14], urine [15], hair [16], and nails [17] . Most studies rely on limited matrices, which may not capture integrated exposure pathways. Beyond exposure assessment, focus has increased on OPE’s potential health effects. Epidemiological studies link OPEs to respiratory issues like asthma and allergies [15,18]. A study links occupational exposure to OPEs with self-reported depressive symptoms in aircraft maintenance workers [19]. Tricresyl phosphate, a form of OPE, has been linked to neurological effects such as sleep disturbances. This demonstrates the neurotoxic potential of organophosphate esters [20,21,22]. New research suggests neurotoxic effects, with studies like Kang et al. (2022) showing a connection between OPE metabolites and sleep disturbances in adults [23]. However, the association between OPE exposure and sleep disorders in children remains poorly studied, and the neurological effects of these compounds during key development periods remain poorly understood. Overall, these findings suggest that OPE exposure may influence multiple physiological systems, highlighting the need to explore its potential role in childhood sleep health.
Multiple biological mechanisms may explain the association between OPE exposure and sleep disorders. OPEs’ neurotoxic effects are similar to those of organophosphate pesticides [24]. These chemicals inhibit acetylcholinesterase (AChE), thereby disrupting neuronal function. Exposure often correlates with a higher risk of sleep problems [25]. An experimental study also found that the organophosphorus pesticide chlorpyrifos increases the sleep apnea index [26]. Sleep disorders are closely linked to the endocrine system, and hormonal imbalances can negatively impact sleep quality and sleep deprivation [27,28]. Hence, we hypothesize that OPE exposure may be associated with sleep disorders. These insights support epidemiological studies on OPE exposure and sleep disorders.
This study investigates the link between airborne PM₂.₅-bound OPEs and sleep disorders among children in China’s Pearl River Delta (PRD). Due to the region’s dense population and manufacturing activities, it is a major source of OPE emissions, especially through fine particulate matter that penetrates deep into the lungs. By examining this overlooked exposure pathway, the study aims to enhance understanding of the health impacts of airborne OPEs. It fills a knowledge gap by assessing PM₂.₅-bound OPE exposure and its connection to various sleep disorders in a large pediatric population, providing evidence for regional public health and regulatory strategies.
2. Methods
2.1. Study Participants
This study was conducted from May 2016 to May 2018 in the Pearl River Delta (PRD), China, involving strong collaboration with 105 elementary and middle schools across six cities in Guangdong province, including Guangzhou (37 schools), Foshan (18), Zhongshan (18), Shenzhen (11), Zhuhai (8), and Maoming (13). The geographical locations of all PM2.5 sampling sites in the PRD are presented visually in Figure S1 of the Supplementary Material. A total of 144,409 participants and their caring parents were invited to share insights through a standardized questionnaire. The guardians’ responses provided valuable information on socio-demographic factors, lifestyle habits, health outcomes, living environments, and family history of asthma. We received 131,412 valid responses from participants, reflecting a 91% participation rate, which demonstrates significant community engagement. Unfortunately, data from Maoming city (n = 21,243) were excluded due to sample loss. The final sample included 110,169 children aged 6–18 from five PRD cities. Further participant characteristics are described elsewhere [29]. We are grateful for the approval from the Ethics Committee of Sun Yat-sen University (Approval Number: 2018057) and sincerely thank all guardians for their informed consent and support.
2.2. Measurement of Sleep Disorders
Over the past six months, sleep disorders in children have been assessed using the Sleep Disturbance Scale for Children (SDSC), based on reports from parents or guardians. This scale is commonly employed in clinical and epidemiological studies to screen for sleep issues in school-aged children [30,31]. We have used the validated Chinese version of the SDSC, culturally and contextually adapted for use in China [32]. The SDSC assesses six areas of sleep disorders: disorders of initiating and maintaining sleep (DIMS), sleep-wake transition disorders (SWTD), sleep hyperhidrosis (SHY), SBD, disorders of arousal (DA), and disorders of excessive somnolence (DOES), using a 24-item, 5-point scale. Domain scores are derived from relevant items, producing a total score that indicates overall sleep quality, which is then transformed into t-scores [33]. Higher scores signify more sleep issues, and a t-score above 70 points to a sleep disorder. Two additional questions assess total sleep duration and sleep latency, with short sleep defined as less than 7 hours and long latency as more than 45 minutes, based on expert consensus [34,35]. In order to assess sleep disorders, a binary variable for total sleep disorder was created. It was defined as present (1) if a child exhibited one or more of nine specific sleep issues, and absent (0) if none were present. The same methodology and sleep disorder outcomes have been utilized in previous research [36].
2.3. Measurement of Organophosphate Esters in PM2.5
PM2.5 samples were taken from elementary and middle schools within 1 km of air-monitoring stations in six Pearl River Delta (PRD) cities. Sampling occurred in summer (May–July 2018) and winter (October–December 2018). All sites were in open areas without obstructions like high buildings or dense vegetation. Sample collection followed established protocols [37], and additional methodological details for this sampling technique are provided in previous study [29].
In this study, we examined 10 OPEs present in PM2.5 samples, including: triethyl phosphate (TEP), tris(2-chloroethyl) phosphate (TCEP), tris(1-chloro-2-propyl) phosphate (TCIPP), tris(1,3-dichloroisopropyl) phosphate (TDCIPP), triphenyl phosphate (TPHP), 2-ethylhexyl diphenyl phosphate (EHDPHP), tris(2-butoxyethyl) phosphate (TBOEP), tris(2-isopropylphenyl) phosphate (T2IPPP), tris(2-ethylhexyl) phosphate (TEHP), and tris(3,4-dimethylphenyl) phosphate (T34DMPP). OPE concentrations were measured in both summer and winter. The annual mean OPE level was calculated as the average of these seasonal concentrations.
For extraction, about one-eighth of each filter was ultrasonically extracted with acetonitrile, then centrifuged. The supernatant was concentrated under a nitrogen stream, exchanged into methanol, and filtered through a 0.22 µm membrane. Internal standards were added to the extracts before analysis. OPEs were quantified using UPLC–MS/MS in MRM mode, following Liu et al. (2020) [38]. Validation included procedural blanks, with surrogate standards (TPHP-d15, TCEP-d12) used to monitor recoveries. The method detection limits (MDLs) are the average of field blanks plus 3 times the standard deviation or a signal of 10 times the noise level for non-detectable compounds in blanks [39]. Detection frequencies for all OPEs exceeded 95%, indicating their widespread presence in PM2.5 and environmental significance.
2.4. Covariates
The covariates were chosen based on previous epidemiological studies related to child sleep health and environmental exposures. The variables analyzed included age (years), sex (boys/girls), low birth weight (<2.5 kg), preterm delivery (<37 weeks), cesarean section (No/Yes), exclusive breastfeeding for at least 3 months (No/Yes), passive smoking exposure (No/Yes), pet ownership (No/Yes), home renovation within the last two years (No/Yes), visible household mold (No/Yes), daily physical activity exceeding one hour (Yes/No) and city included (Foshan, Guangzhou, Shenzhen, Zhonshang, Zhuhai). Environmental factors considered were proximity to factories (no factory nearby; factory >100 m away; within 100 m), and per capita living space (<20 m², 20–30 m², >30 m²). Socioeconomic indicators included parental education (low, medium, and high) and household income (<10,000; 10,000–30,000; 30,001–100,000; >100,000 RMB). More details about variable definitions and questionnaire structure are available in our prior study [29].
2.5. Statistical Analysis
Descriptive statistics summarized the characteristics of participants based on total sleep disorder. Continuous variables were presented as means with standard deviations and compared using Student’s t-tests, while categorical variables were shown as frequencies and percentages and compared with Pearson’s chi-squared tests. OPE concentrations in PM2.5 were summarized using percentiles and detection rates. Because exposures were right-skewed, they were standardized with IQR scaling, and regression effects were reported per IQR increase. Pairwise correlations among OPE concentrations were assessed with Pearson correlation coefficients and visualized via a heat map to evaluate interrelationships and collinearity. To identify OPEs linked to sleep disorders while managing collinearity among exposures, elastic net regression was used with adjustments of all covariates. This combines LASSO and ridge penalties for variable selection and coefficient shrinkage with correlated pollutants. Separate models were fitted for total sleep disorder and adjusting for covariates.
Associations between individual OPEs and sleep disorders were analyzed using mixed-effects logistic regression models, estimating odds ratios (ORs) and 95% confidence intervals (CIs) per IQR increase in each OPE. The models were adjusted for all covariates included in the analysis, and city was included as a random effect to account for spatial clustering. To evaluate OPE mixture effects, weighted quantile sum (WQS) regression was used. OPE levels were divided into quartiles to create a weighted index assessing the overall impact on sleep disorders. Covariates were included, and mixture-specific ORs and contribution weights of individual OPEs were reported in the Supplementary Material.
Two sensitivity analyses evaluated the robustness of findings. Sensitivity Analysis 1) used single-OPE mixed-effects models without scaled PM2.5-bound OPE concentrations, without IQR standardization. Sensitivity Analysis 2) used multi-OPE models with all OPEs included to assess mutually adjusted associations. Both analyses were consistent with primary results and are shown in the Supplementary Material. All two-sided tests with P < 0.05, and analyses used R software (version 4.4.3).
3. Results
Table 1 provides a summary of participant characteristics based on their total sleep disorder status. Children diagnosed with sleep disorders tend to be older than those without such disorders, with average ages of 12.0 and 11.3 years, respectively. Children with sleep disorders had higher rates of preterm birth (6.6% vs. 5.0%) and low birth weight (7.1% vs. 4.1%). They were less physically active (29.9% vs. 31.8%) and more likely to have parents with at least a high school education. Children with sleep disorders more often faced exposures like secondhand smoke (37.5% vs. 33.2%), household mold (45.9% vs. 40.0%), pets (20.2% vs. 17.8%), and living near factories. Conversely, recent home renovation was less common among them. Significant differences in housing conditions were observed, with more children with sleep disorders living in smaller households. Sleep disorder prevalence also varied across cities in the Pearl River Delta.
Table 2 summarizes the concentrations of individual OPEs in PM₂.₅. These concentrations varied widely, reflecting significant exposure heterogeneity. Higher median and third-quartile concentrations were observed for TEHP, TCEP, TBOEP, TPHP, and TCIPP, indicating these compounds are more prevalent in PM2.5- bound OPE mixtures. In contrast, T2IPPP, EHDPH, and T34DMPP had lower median values, though some samples showed high maximum levels, pointing to localized high-exposure areas. Additionally, several OPEs such as TEP, TCEP, TBOEP, and TEHP had wide interquartile ranges and right-skewed distributions, highlighting considerable spatial or temporal variability in ambient concentrations. The MDLs for the ten target OPEs ranged from 0.039 pg/m³ (T34DMPP) to 41.529 pg/m³ (TEP), showing high sensitivity, especially for aryl-substituted OPEs like T34DMPP and T2IPPP.
Figure 1 shows the Pearson correlation matrix of OPEs in PM₂.₅. TDCIPP, TCIPP, TEHP, TCEP, and TEP showed strong positive correlations and formed a tight cluster, indicating co-exposure and multicollinearity. Elastic net regression was used to identify and rank OPEs linked to children’s sleep problems (Table 3) based on these correlation patterns.
Table 3 shows elastic net regression results linking OPEs to children’s sleep problems. TDCIPP and TEHP were the strongest, with high coefficients (β=0.465 and 0.481) for shorter sleep and longer latency respectively. TCIPP and TPHP also had consistent associations, while EHDPH and TBOEP had little effect. This analysis highlights the OPEs most related to adverse sleep outcomes.
Table 4 shows the overall association between organophosphate esters (OPEs) in PM2.5 and sleep disorders, based on generalized linear mixed models with binomial distributions that are adjusted for covariates and city-level clustering. The strongest links are for TEHP (OR: 1.22–1.61) and TDCIPP (OR: 1.24–1.59), with increased risks also seen for TCIPP (OR: 1.12–1.31) and TPHP (OR: 1.28–1.38). There are modest but significant associations for TEP (OR: 1.04–1.10), T2IPPP (OR: 1.06–1.15), TCEP (OR: 1.08–1.13), and EHDPH (1.02). TBOEP shows weak positive links (OR: 1.03–1.07) and no connection to short sleep duration (OR: 0.99). Figure S2 visually summarizes these associations between OPEs and sleep outcomes.
Table 5 shows the link between log-transformed PM2.5 bound OPE mixtures and pediatric sleep disorders using WQS regression. The OPE mixture was positively associated with all sleep outcomes. The strongest link was for short sleep (OR = 2.85), followed by total sleep disorder (OR = 2.74), excessive somnolence (OR = 2.54), sleep disorder (OR = 2.50), and long sleep latency (OR = 2.46). Higher odds were also found for sleep initiation and maintenance disorder (OR = 2.28), sleep breathing disorder (OR = 2.21), sleep–wake transition disorder (OR = 2.17), sleep hyperhidrosis (OR = 2.07), and arousal disorder (OR = 2.02). The contribution weights of individual OPEs to these effects vary by outcome and are shown in Supplementary Table S1.
Table S2 in sensitivity analysis confirms associations are due to OPE exposure, not scaling artifacts. Per-unit increases in unscaled OPEs analysis produced consistent, significant, and similarly ranked results.This consistency across metrics supports the robustness of primary associations. Table S3 reveals mutual adjustment tests retain strong links for TDCIPP and TEHP, especially regarding sleep issues. Despite weaker effects from some OPEs, these two stand out, highlighting multicollinearity and that high-risk compounds primarily drive population risk.
4. Discussion
This large-scale population study, conducted across five major cities in the Pearl River Delta (PRD), provides evidence linking ambient organophosphate esters (OPEs) in PM2.5 to childhood sleep disorders. We found significant associations between ten OPEs and various sleep problems. Using different analytical methods such as mixed-effects models, elastic net, and WQS regression, the study demonstrated that both individual OPEs and the mixture increased the risk of sleep disturbances, with TCEP, TCIPP, TDCIPP, TPHP, TEHP, and T34DMPP showing the strongest effects. These findings indicate that airborne OPEs, common flame retardants, could be an under-recognized environmental risk factor for childhood sleep and neurodevelopment issues.
Our findings build on prior research linking OPE exposure to sleep disorders in adults [23] , by demonstrating similar or even stronger connections during childhood, a critical developmental period. Kang et al. (2022) [23] analyzed NHANES data to explore relationships between urinary OPE metabolites and sleep issues in adults, identifying positive association, mixture effects, and sex differences. Compared to Kang et al. (2022) [23], our research extends the evidence by concentrating on children and adolescents, a group that may be more vulnerable. We measured ambient exposure to ten PM2.5-bound OPEs through school-based environmental sampling, which captures source-specific inhalation pathways rather than relying on internal biomarkers. Sleep was assessed with the validated Sleep Disturbance Scale for Children, allowing us to examine multiple specific sleep disorders instead of just general self-reported sleep outcomes. These features collectively offer more detailed, environmentally relevant insights into how real-world OPE mixtures impact sleep health in children. Children are a particularly vulnerable group due to higher susceptibility to airborne pollutants, which may be attributed to greater inhalation rates per body weight, increased hand-to-mouth activity, and developing metabolic and neurological systems [8,9].
Several biological mechanisms support our findings. First, OPEs are known to disrupt thyroid endocrine regulation, affecting TSH and thyroid hormone balance [41,42,43]. Thyroid hormones regulate circadian rhythms, sleep duration, latency, and respiratory control [27,28]. Studies associate thyroid dysfunction with sleep apnea, daytime sleepiness, fragmented sleep, and delayed sleep [44,45,46,47].
Second, the neurotoxic effects of OPEs, similar to those of organophosphate pesticides, could play a role in causing sleep disturbances. Research has demonstrated that OPEs can affect cholinergic neurotransmission and potentially inhibit acetylcholinesterase activity [24,25,26,48,49]. Since cholinergic pathways play a key role in regulating sleep–wake cycles, these neurotoxic effects align with our observed increased risks of sleep initiation and maintenance disorders, sleep-wake transition issues, and overall sleep disturbance.
Third, OPE exposure has been associated with metabolic issues and obesity in adolescents [50,51] , both known risk factors for sleep problems such as snoring, disrupted sleep, and daytime fatigue [52,53]. While our study didn’t assess metabolic biomarkers, these pathways suggest future research could explore how metabolic changes mediate OPEs’ impact on sleep.
Importantly, our analyses indicated that exposure to combined OPEs increased the risk of sleep disorders, highlighting the importance of considering chemical mixtures instead of individual compounds. Similar effects of combined OPE metabolites, associated with sleep issues, appeared sex-dependent in adults using Bayesian kernel machine regression [23]. Since children are exposed to multiple OPEs through inhalation of PM₂.₅, dust, and products [1,7], evaluating mixture effects is essential for environmental health risk assessment.
Sleep is crucial for children’s neurodevelopment, cognition, and emotional regulation. Chronic disturbances can cause long-term academic and mental health issues [54,55,56]. Our findings suggest ambient organophosphate esters (OPEs) may significantly contribute to sleep problems in children, emphasizing the need for increased public health and regulation of these pollutants.
Our study has several limitations. First, the cross-sectional design prevents drawing causal conclusions, and OPE exposure was estimated using ambient PM₂.₅ levels, which risks misclassification, especially where indoor pollution is significant. Second, sleep outcomes depended on parent reports rather than clinical assessments, which could introduce bias. Third, unmeasured confounders such as diet, screen time, noise, ventilation or psychosocial factors might influence the results. Fourth, exposure estimates were based on two seasonal samples, which may not fully capture long-term or cumulative exposure, though seasonal averages may serve as reasonable proxies. Fifth, some city–compound groups had small sample sizes, potentially inflating effects. Despite these limitations, the study provides important evidence on the health risks of ambient OPEs and highlights the need for regional actions.
5. Conclusions
PM₂.₅-bound OPEs are an emerging concern for child sleep health. This study provides epidemiological evidence that PM2.5-bound OPEs are linked to childhood sleep disturbances in the PRD. Both individual and combined compounds were positively associated with sleep disorders in children, with TEHP, TDCIPP, TCIPP, and TPHP identified as the most significant contributors. Positive associations across OPEs and sleep disorders that OPEs may harm children’s sleep and neurodevelopment. Despite limitations such as its cross-sectional design, reliance on parent reports, and possible exposure misclassification, this study fills a critical knowledge gap by identifying OPEs as an emerging environmental threat. The findings underscore the need for stricter regulations on OPE emissions and increased monitoring of exposure levels. Additionally, targeted actions in high-risk areas, such as controlling sources and improving indoor air quality in schools, are needed to protect children’s sleep and overall health.
Supplementary Materials
The following supporting information can be downloaded at the website of this paper posted on Preprints.org.
Acknowledgments
This work was supported by the National Key Research and Development Program of China (2023YFC3709203), Guangxi Key Research and Development Plan (GUIKEAB24010219), National Natural Science Foundation of China (U24A20766; 82411530062), Zhongnanshan Medical Foundation of Guangdong Province (ZNSXS-20230012).
References
- Hoffman, K.; Lorenzo, A.; Butt, C.M.; Adair, L.; Herring, A.H.; Stapleton, H.M.; Daniels, J.L. Predictors of urinary flame retardants in pregnancy. Environ. Int. 2017, 98, 96–101. [Google Scholar] [CrossRef]
- Poma, G.; Glynn, A.; Malarvannan, G.; Covaci, A.; Darnerud, P.O. Dietary intake of phosphorus flame retardants. Food Chem. Toxicol. 2017, 100, 1–7. [Google Scholar] [CrossRef]
- Romano, M.E.; Hawley, N.L.; Eliot, M.; Calafat, A.M.; Jayatilaka, N.K.; Kelsey, K.; McGarvey, S.; Phipps, M.G.; Savitz, D.A.; Werner, E.F.; Braun, J.M. Variability and predictors of urinary concentrations of organophosphate flame retardant metabolites among pregnant women in Rhode Island. Environ. Health 2017, 16, 40. [Google Scholar] [CrossRef] [PubMed]
- Hoffman, K.; Butt, C.M.; Chen, A.; Limkakeng, A.T.; Stapleton, H.M. High exposure to organophosphate flame retardants in infants: Associations with baby products. Environ. Sci. Technol. 2015, 49, 14554–14559. [Google Scholar] [CrossRef]
- Jia, T.; Gao, L.; Liu, W.; Guo, B.; He, Y.; Xu, X.; Mao, T.; Deng, J.; Li, D.; Tao, F.; Wang, W. Screening of organophosphate esters in different indoor environments: Distribution, diffusion, and risk assessment. Environ. Pollut. 2023, 327, 121576. [Google Scholar] [CrossRef] [PubMed]
- Gu, L.; Hu, B.; Fu, Y.; Zhou, W.; Li, X.; Huang, K.; Zhang, Q.; Fu, J.; Zhang, H.; Zhang, A.; Fu, J.; Jiang, G. Occurrence and risk assessment of organophosphate esters in global aquatic products. Water Res. 2023, 240, 120083. [Google Scholar] [CrossRef] [PubMed]
- Van der Veen, I.; de Boer, J. Phosphorus flame retardants: Properties, production, environmental occurrence, toxicity and analysis. Chemosphere 2012, 88, 1119–1153. [Google Scholar] [CrossRef]
- Ospina, M.; Jayatilaka, N.K.; Wong, L.Y.; Restrepo, P.; Calafat, A.M. Exposure to organophosphate flame retardant chemicals in the U.S. general population. Environ. Int. 2018, 110, 32–41. [Google Scholar] [CrossRef]
- Doherty, B.T.; Hammel, S.C.; Daniels, J.L.; Stapleton, H.M.; Hoffman, K. Organophosphate esters: Are these flame retardants and plasticizers affecting children’s health? Curr. Environ. Health Rep. 2019, 6, 201–213. [Google Scholar] [CrossRef]
- Van den Eede, N.; Heffernan, A.L.; Aylward, L.L.; Hobson, P.; Neels, H.; Mueller, J.F.; Covaci, A. Age as a determinant of phosphate flame retardant exposure of the Australian population. Environ. Int. 2015, 74, 1–8. [Google Scholar] [CrossRef]
- Sugeng, E.J.; Leonards, P.E.G.; van de Bor, M. Brominated and organophosphorus flame retardants in body wipes and house dust of Dutch toddlers. Environ. Res. 2017, 158, 789–797. [Google Scholar] [CrossRef]
- Langer, S.; de Wit, C.A.; Giovanoulis, G.; Fäldt, J.; Karlson, L. The effect of reduction measures on concentrations of hazardous semivolatile organic compounds in indoor air and dust of Swedish preschools. Indoor Air 2021, 31, 1673–1682. [Google Scholar] [CrossRef]
- Cequier, E.; Sakhi, A.K.; Marcé, R.M.; Becher, G.; Thomsen, C. Human exposure pathways to organophosphate triesters—A biomonitoring study of mother–child pairs. Environ. Int. 2015, 75, 159–165. [Google Scholar] [CrossRef]
- Araki, A.; Bastiaensen, M.; Ait Bamai, Y.; Van den Eede, N.; Kawai, T.; Tsuboi, T.; Ketema, R.M.; Covaci, A.; Kishi, R. Associations between allergic symptoms and phosphate flame retardants in dust and their urinary metabolites among school children. Environ. Int. 2018, 119, 438–446. [Google Scholar] [CrossRef]
- Araki, A.; Ait Bamai, Y.; Bastiaensen, M.; Van den Eede, N.; Kawai, T.; Tsuboi, T.; Miyashita, C.; Itoh, S.; Goudarzi, H.; Konno, S.; Covaci, A.; Kishi, R. Combined exposure to phthalate esters and phosphate flame retardants and plasticizers and their associations with wheeze and allergy symptoms among school children. Environ. Res. 2020, 183, 109212. [Google Scholar] [CrossRef]
- Canbaz, D.; Logiantara, A.; van Ree, R.; van Rijt, L.S. Immunotoxicity of organophosphate flame retardants TPHP and TDCIPP on murine dendritic cells in vitro. Chemosphere 2017, 177, 56–64. [Google Scholar] [CrossRef]
- Yanagisawa, R.; Koike, E.; Win-Shwe, T.T.; Kawaguchi, M.; Takano, H. Impact of dietary exposure to low-dose tris(1,3-dichloro-2-propyl) phosphate in allergic asthmatic mice. Immunotoxicol. 2021, 43, 599–610. [Google Scholar] [CrossRef]
- Araki, A.; Saito, I.; Kanazawa, A.; Morimoto, K.; Nakayama, K.; Shibata, E.; Tanaka, M.; Takigawa, T.; Yoshimura, T.; Chikara, H.; Saijo, Y.; Kishi, R. Phosphorus flame retardants in indoor dust and their relation to asthma and allergies of inhabitants. Indoor Air 2014, 24, 3–15. [Google Scholar] [CrossRef] [PubMed]
- Hardos, J.E.; Whitehead, L.W.; Han, I.; Ott, D.K.; Waller, D.K. Depression prevalence and exposure to organophosphate esters in aircraft maintenance workers. Aerosp. Med. Hum. Perform. 2016, 87, 712–717. [Google Scholar] [CrossRef] [PubMed]
- Yin, J.; Jin, X.; Shan, Z.; Li, S.; Huang, H.; Li, P.; Peng, X.; Peng, Z.; Yu, K.; Bao, W.; Yang, W.; Chen, X.; Liu, L. Relationship of sleep duration with all-cause mortality and cardiovascular events. J. Am. Heart Assoc. 2017, 6, e005947. [Google Scholar] [CrossRef] [PubMed]
- Lao, X.Q.; Liu, X.; Deng, H.B.; Chan, T.C.; Ho, K.F.; Wang, F.; Vermeulen, R.; Tam, T.; Wong, M.C.S.; Tse, L.A.; Chang, L.Y.; Yeoh, E.K. Sleep quality, sleep duration, and the risk of coronary heart disease: A prospective cohort study. J. Clin. Sleep Med. 2018, 14, 109–117. [Google Scholar] [CrossRef]
- Reeve, S.; Sheaves, B.; Freeman, D. Sleep disorders in early psychosis: Incidence, severity, and association with clinical symptoms. Schizophr. Bull. 2019, 45, 287–295. [Google Scholar] [CrossRef]
- Kang, X.; Li, J.; Luo, J.; Zhang, D. Associations between organophosphate ester metabolites and sleep disorder and trouble sleeping in adults: A machine-learning approach. Environ. Sci. Pollut. Res. 2022, 29, 67287–67300. [Google Scholar] [CrossRef]
- Bekele, T.G.; Zhao, H.; Yang, J.; Chegen, R.G.; Chen, J.; Mekonen, S.; Qadeer, A. Environmental occurrence, analysis, bioaccumulation, and toxicity of organophosphate esters: A review. Environ. Sci. Pollut. Res. 2021, 28, 49507–49528. [Google Scholar] [CrossRef] [PubMed]
- Fuhrimann, S.; van den Brenk, I.; Atuhaire, A.; Mubeezi, R.; Staudacher, P.; Huss, A.; Kromhout, H. Recent pesticide exposure affects sleep: A cross-sectional study among smallholder farmers in Uganda. Environ. Int. 2022, 158, 106878. [Google Scholar] [CrossRef]
- Darwiche, W.; Gay-Quéheillard, J.; Delanaud, S.; El Khayat El Sabbouri, H.; Khachfe, H.; Joumaa, W.; Bach, V.; Ramadan, W. Impact of chronic exposure to chlorpyrifos on respiratory parameters and sleep apnea in juvenile and adult rats. PLoS ONE 2018, 13, e0191237. [Google Scholar] [CrossRef]
- Morgan, D.; Tsai, S.C. Sleep and the endocrine system. Crit. Care Clin. 2015, 31, 403–418. [Google Scholar] [CrossRef] [PubMed]
- Smith, P.C.; Mong, J.A. Neuroendocrine control of sleep. Curr. Top. Behav. Neurosci. 2019, 43, 353–378. [Google Scholar] [PubMed]
- Wu, L.Y.; He, W.T.; Zeeshan, M.; Zhou, Y.; Zhang, Y.T.; Liang, L.X.; Huang, J.W.; Zhou, J.X.; Zhao, K.; Bao, W.W.; Lin, L.Z.; Gui, Z.H.; Liu, R.Q.; Hu, L.W.; Wang, Z.; Dong, G.H. Incidence of respiratory diseases associated with per- and polyfluoroalkyl substances in PM2.5. J. Hazard. Mater. 2025, 494, 138485. [Google Scholar] [CrossRef]
- Taylor, R.W.; Haszard, J.J.; Jackson, R.; Morrison, S.; Beebe, D.W.; Meredith-Jones, K.A.; Elder, D.E.; Galland, B.C. Effect of sleep changes on health-related quality of life in healthy children. JAMA Netw. Open 2023, 6, e233005. [Google Scholar] [CrossRef]
- Cooper, R.; Di Biase, M.A.; Bei, B.; Quach, J.; Cropley, V. Associations of changes in sleep and emotional and behavioral problems from late childhood to early adolescence. JAMA Psychiatry 2023, 80, 585–596. [Google Scholar] [CrossRef] [PubMed]
- Huang, M.M.; Qian, Z.; Wang, J.; Vaughn, M.G.; Lee, Y.L.; Dong, G.H. Validation of the sleep disturbance scale for children and prevalence of parent-reported sleep disorder symptoms in Chinese children. Sleep Med. 2014, 15, 923–928. [Google Scholar] [CrossRef]
- Bruni, O.; Ottaviano, S.; Guidetti, V.; Romoli, M.; Innocenzi, M.; Cortesi, F.; Giannotti, F. The Sleep Disturbance Scale for Children (SDSC): Construction and validation of an instrument to evaluate sleep disturbances in childhood and adolescence. J. Sleep Res. 1996, 5, 251–261. [Google Scholar] [CrossRef]
- Hirshkowitz, M.; Whiton, K.; Albert, S.M.; Alessi, C.; Bruni, O.; DonCarlos, L.; Hazen, N.; Herman, J.; Katz, E.S.; Kheirandish-Gozal, L.; Neubauer, D.N.; O’Donnell, A.E.; Ohayon, M.; Peever, J.; Rawding, R.; Sachdeva, R.C.; Setters, B.; Vitiello, M.V.; Ware, J.C.; Adams Hillard, P.J. National Sleep Foundation’s sleep time duration recommendations: Methodology and results summary. Sleep Health 2015, 1, 40–43. [Google Scholar] [CrossRef]
- Ohayon, M.; Wickwire, E.M.; Hirshkowitz, M.; Albert, S.M.; Avidan, A.; Daly, F.J.; Dauvilliers, Y.; Ferri, R.; Fung, C.; Gozal, D.; Hazen, N.; Krystal, A.; Lichstein, K.; Mallampalli, M.; Plazzi, G.; Rawding, R.; Scheer, F.A.; Somers, V.; Vitiello, M.V. National Sleep Foundation’s sleep quality recommendations: First report. Sleep Health 2017, 3, 6–19. [Google Scholar] [CrossRef]
- Gui, Z.H.; Heinrich, J.; Morawska, L.; Zhao, T.Y.; Yim, S.H.; Lao, X.Q.; Gao, M.; Chen, D.H.; Ma, H.M.; Lin, L.Z.; Liu, R.Q.; Dong, G.H. Long-term exposure to ozone and sleep disorders in children: A multicity study in China. Environ. Res. 2024, 260, 119553. [Google Scholar] [CrossRef]
- Liu, L.S.; Guo, Y.T.; Wu, Q.Z.; Zeeshan, M.; Qin, S.J.; Zeng, H.X.; Lin, L.Z.; Chou, W.C.; Yu, Y.J.; Dong, G.H.; Zeng, X.W. Per- and polyfluoroalkyl substances in ambient fine particulate matter in the Pearl River Delta, China. Environ. Pollut. 2023, 334, 122138. [Google Scholar] [CrossRef] [PubMed]
- Liu, X.; Chen, D.; Yu, Y.; Zeng, X.; Li, L.; Xie, Q.; Yang, M.; Wu, Q.; Dong, G. Novel organophosphate esters in airborne particulate matter. Environ. Sci. Technol. 2020, 54, 13771–13777. [Google Scholar] [CrossRef]
- Zeng, Y.; Chen, S.J.; Liang, Y.H.; Zhu, C.Y.; Liu, Z.; Guan, Y.F.; Ma, H.M.; Mai, B.X. Traditional and novel organophosphate esters in PM2.5 of a megacity, southern China. Environ. Pollut. 2021, 284, 117208. [Google Scholar] [CrossRef]
- Liu, X.; Cai, Y.; Wang, Y.; Xu, S.; Ji, K.; Choi, K. Effects of TDCPP and TPP on sex-dependent alterations of thyroid hormones in adult zebrafish. Ecotoxicol. Environ. Saf. 2019, 170, 25–32. [Google Scholar] [CrossRef] [PubMed]
- Percy, Z.; Vuong, A.M.; Xu, Y.; Xie, C.; Ospina, M.; Calafat, A.M.; Hoofnagle, A.; Lanphear, B.P.; Braun, J.M.; Cecil, K.M.; Dietrich, K.N.; Yolton, K.; Chen, A. Maternal urinary organophosphate esters and alterations in maternal and neonatal thyroid hormones. Am. J. Epidemiol. 2021, 190, 1793–1802. [Google Scholar] [CrossRef]
- Ren, X.; Cao, L.; Yang, Y.; Wan, B.; Wang, S.; Guo, L. In vitro assessment of thyroid hormone receptor activity of four organophosphate esters. J. Environ. Sci. 2016, 45, 185–190. [Google Scholar] [CrossRef]
- Yao, Y.; Li, M.; Pan, L.; Duan, Y.; Duan, X.; Li, Y.; Sun, H. Exposure to organophosphate ester flame retardants and plasticizers during pregnancy. Environ. Int. 2021, 146, 106215. [Google Scholar] [CrossRef]
- Zhang, M.; Zhang, W.; Tan, J.; Zhao, M.; Zhang, Q.; Lei, P. Role of hypothyroidism in obstructive sleep apnea: A meta-analysis. Curr. Med. Res. Opin. 2016, 32, 1059–1064. [Google Scholar] [CrossRef] [PubMed]
- Takeuchi, S.; Kitamura, T.; Ohbuchi, T.; Koizumi, H.; Takahashi, R.; Hohchi, N.; Suzuki, H. Relationship between sleep apnea and thyroid function. Sleep Breath. 2015, 19, 85–89. [Google Scholar] [CrossRef] [PubMed]
- Thavaraputta, S.; Dennis, J.A.; Laoveeravat, P.; Nugent, K.; Rivas, A.M. Hypothyroidism and its association with sleep apnea among adults in the United States. J. Clin. Endocrinol. Metab. 2019, 104, 4990–4997. [Google Scholar] [CrossRef] [PubMed]
- Shinno, H.; Inami, Y.; Inagaki, T.; Kawamukai, T.; Utani, E.; Nakamura, Y.; Horiguchi, J. Successful treatment with levothyroxine for idiopathic hypersomnia patients with subclinical hypothyroidism. Gen. Hosp. Psychiatry 2009, 31, 190–193. [Google Scholar] [CrossRef]
- Colović, M.B.; Krstić, D.Z.; Lazarević-Pašti, T.D.; Bondžić, A.M.; Vasić, V.M. Acetylcholinesterase inhibitors: Pharmacology and toxicology. Curr. Neuropharmacol. 2013, 11, 315–335. [Google Scholar] [CrossRef]
- Dishaw, L.V.; Powers, C.M.; Ryde, I.T.; Roberts, S.C.; Seidler, F.J.; Slotkin, T.A.; Stapleton, H.M. Is the PentaBDE replacement, tris(1,3-dichloro-2-propyl) phosphate (TDCPP), a developmental neurotoxicant? Studies in PC12 cells. Toxicol. Appl. Pharmacol. 2011, 256, 281–289. [Google Scholar] [CrossRef]
- Boyle, M.; Buckley, J.P.; Quirós-Alcalá, L. Associations between urinary organophosphate ester metabolites and measures of adiposity among U.S. children and adults: NHANES 2013–2014. Environ. Int. 2019, 127, 754–763. [Google Scholar] [CrossRef]
- Luo, K.; Aimuzi, R.; Wang, Y.; Nian, M.; Zhang, J. Urinary organophosphate ester metabolites, glucose homeostasis and prediabetes in adolescents. Environ. Pollut. 2020, 267, 115607. [Google Scholar] [CrossRef]
- Ma, Y.; Peng, L.; Kou, C.; Hua, S.; Yuan, H. Associations of overweight, obesity and related factors with sleep-related breathing disorders and snoring in adolescents. Int. J. Environ. Res. Public Health 2017, 14, 194. [Google Scholar] [CrossRef] [PubMed]
- Muscogiuri, G.; Barrea, L.; Annunziata, G.; Di Somma, C.; Laudisio, D.; Colao, A.; Savastano, S. Obesity and sleep disturbance: The chicken or the egg? Crit. Rev. Food Sci. Nutr. 2019, 59, 2158–2165. [Google Scholar] [CrossRef] [PubMed]
- Parisi, P.; Bruni, O.; Villa, M.P.; Verrotti, A.; Miano, S.; Luchetti, A.; Curatolo, P. The relationship between sleep and epilepsy: The effect on cognitive functioning in children. Dev. Med. Child Neurol. 2010, 52, 805–810. [Google Scholar] [CrossRef] [PubMed]
- Rey, A.E.; Guignard-Perret, A.; Imler-Weber, F.; Garcia-Larrea, L.; Mazza, S. Improving sleep, cognitive functioning and academic performance with sleep education at school in children. Learn. Instr. 2020, 65, 101270. [Google Scholar] [CrossRef]
- Short, M.A.; Bartel, K.; Carskadon, M.A. Sleep and mental health in children and adolescents. In Sleep and Health; Academic Press: London, UK, 2019; pp. 435–445. [Google Scholar]
Figure 1.
Heat map of OPEs network correlation in PM2.5.
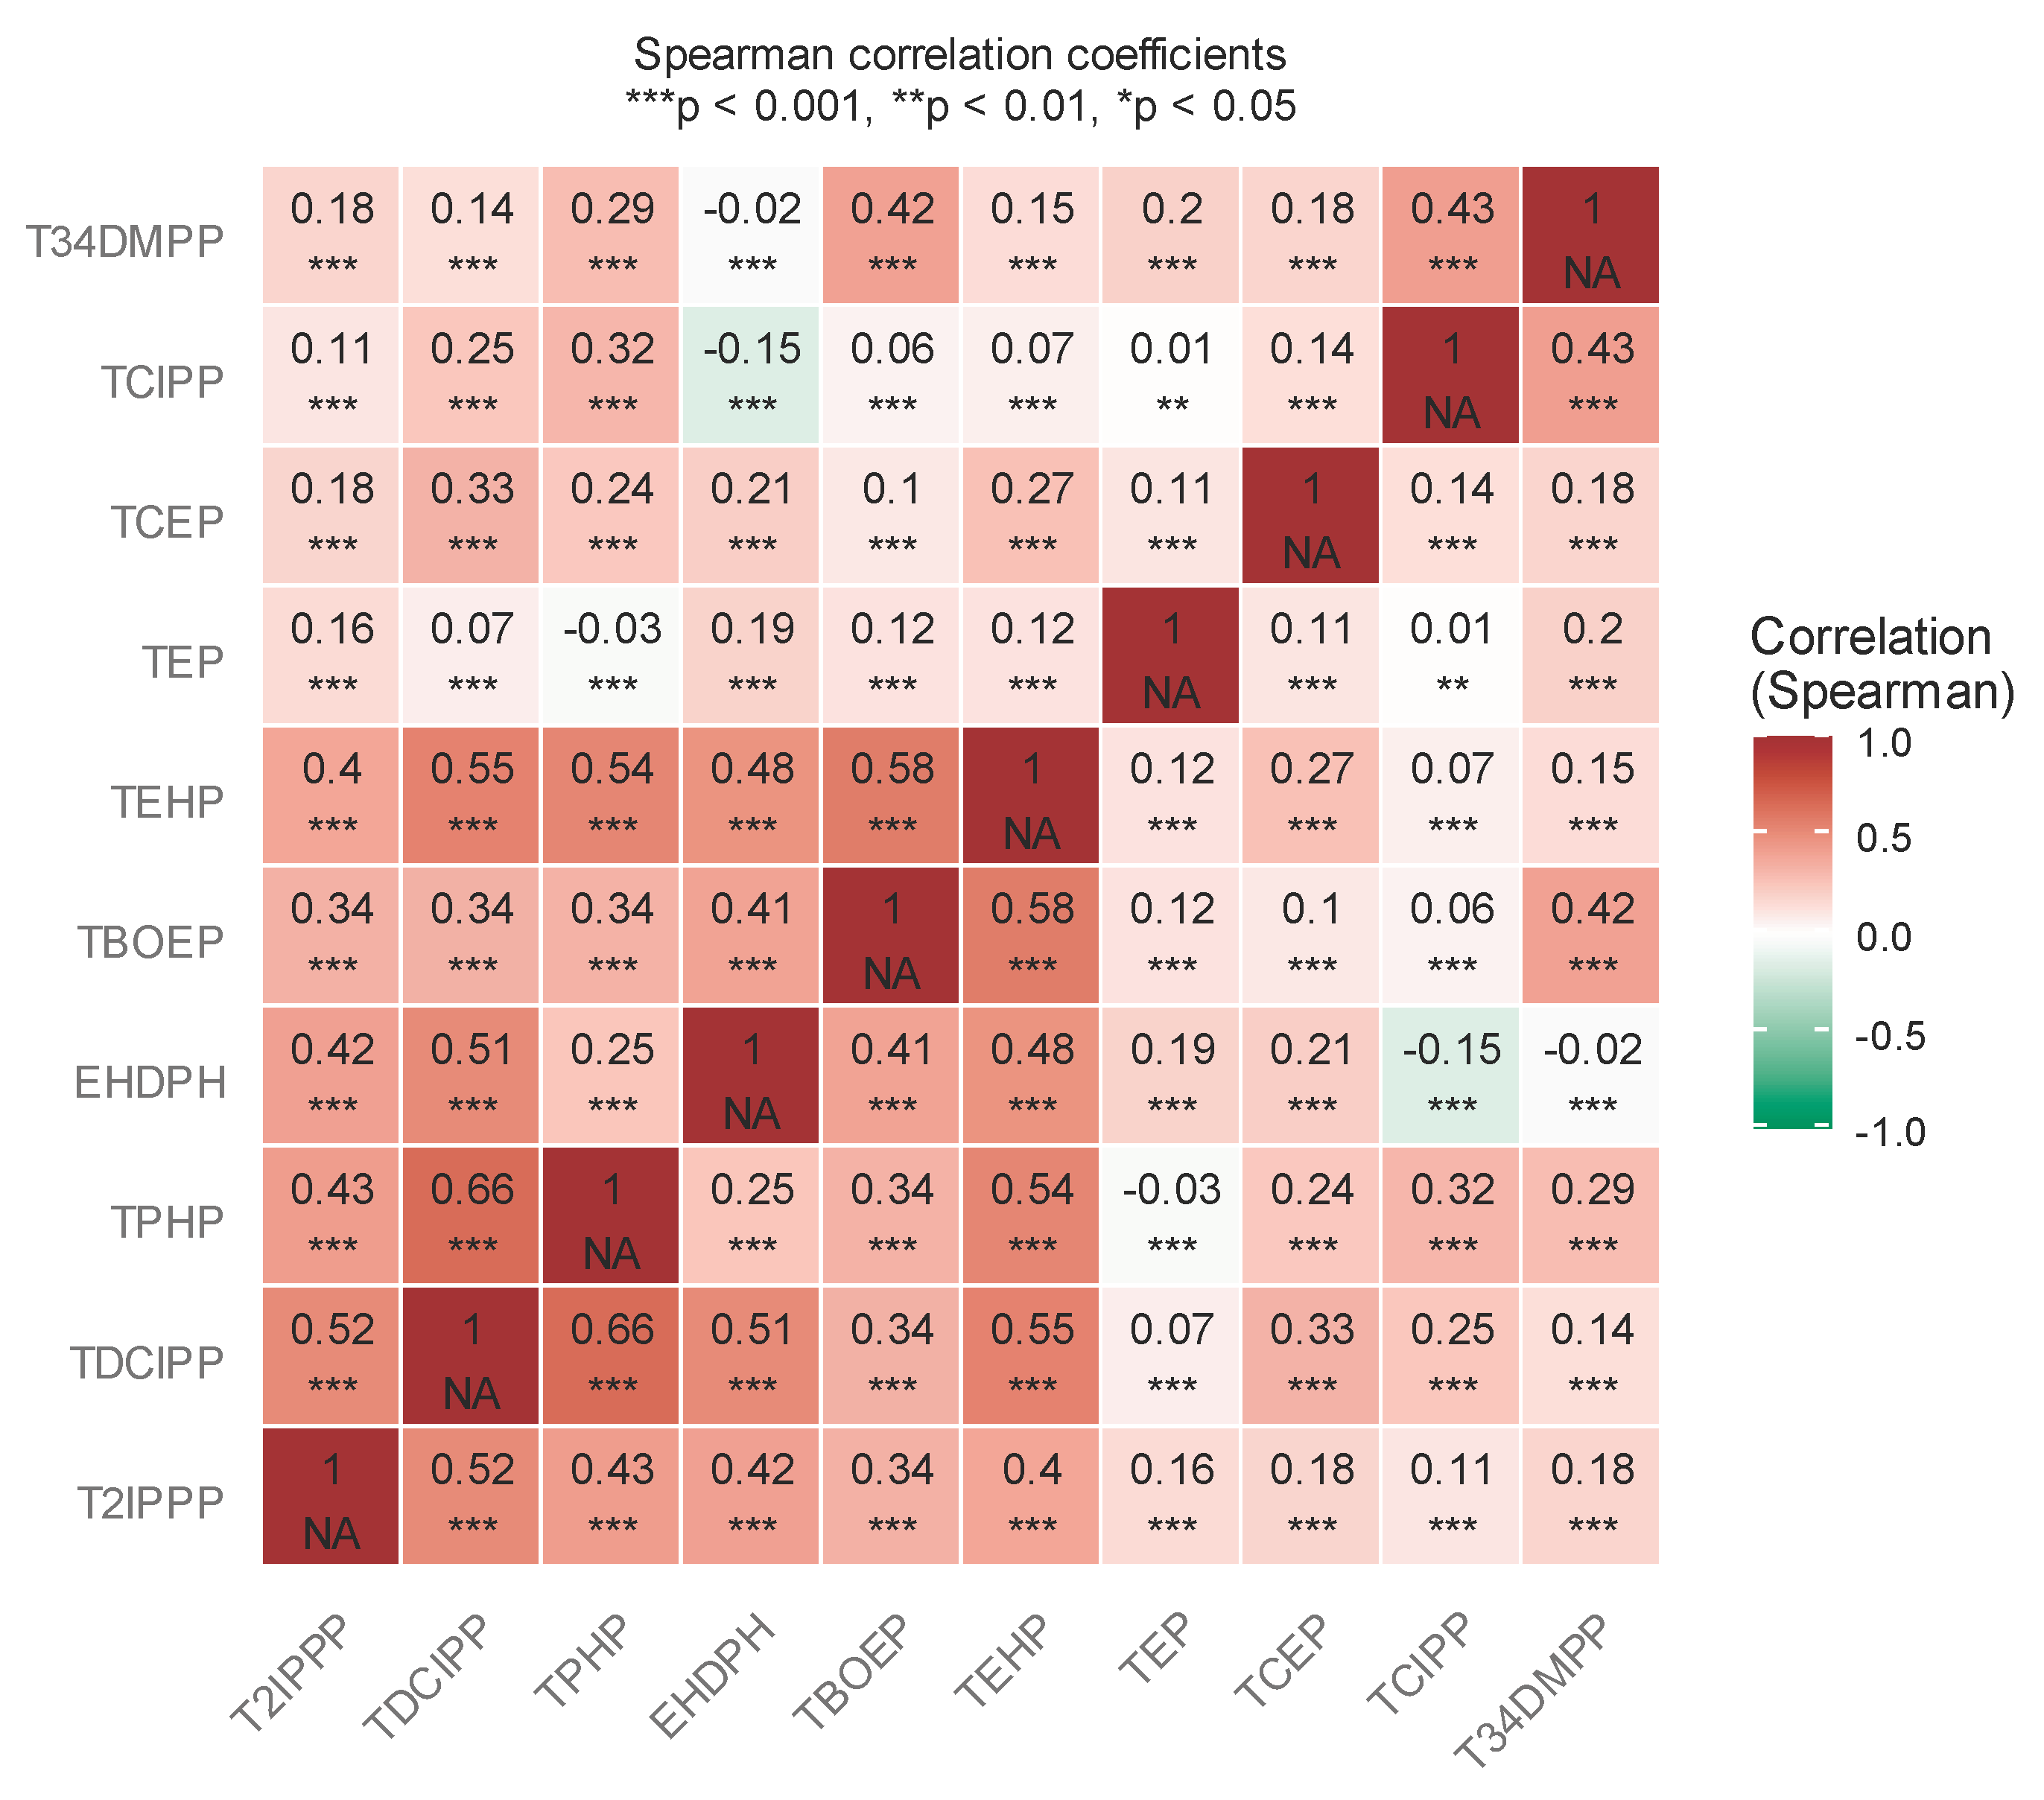

Table 1.
Characteristics of participants.
| Variables | Total sleep disorder (yes) (n=36,824) |
Total sleep disorder (No) (n=73,345) | Total population (n=110,169) |
P-value |
|---|---|---|---|---|
| Age, mean (SD), years | 12.0 (2.9) | 11.3 (2.8) | 11.6 (2.8) | < 0.01 |
| Sex | 0.370 | |||
| Boys, N(%) | 19,543(53.1) | 39,136 (53.4) | 58,679 (53.3) | |
| Girls, N(%) | 17,281 (46.9) | 34,209 (46.6) | 51,490 (46.7) | |
| Preterm birth, N(%) | 2,415 (6.6) | 3,677 (5.0) | 6,092 (5.5) | < 0.01 |
| Breastfeeding, N(%) | 21,450 (58.3) | 42,500 (57.9) | 63,950 (58.0) | 0.337 |
| Physical activity, N(%) | 10,791 (29.9) | 23,347 (31.8) | 34,138 (31.0) | < 0.01 |
| Parental education ≥ high school, N(%) | 17,437 (47.4) | 33,504 (45.7) | 50,941 (46.2) | < 0.01 |
| Annual household income, N (%), Yuan | 0.073 | |||
| 2,937 (8.0) | 6,159 (8.4) | 9,096 (8.3) | ||
| 10,001-30,000 | 4,107 (11.2) | 8,281 (11.3) | 12,388 (11.2) | |
| 30,001-100,000 | 5,859 (15.9) | 11,807 (16.1) | 17,666 (16.0) | |
| 100,001-200,000 | 12,121 (32.9) | 23,775 (32.4) | 35,896 (32.6) | |
| >200,000 | 11,800(32.0) | 23,323(31.8) | 35,123(31.9) | |
| Secondhand smoke exposure, N(%) | 13,795 (37.5) | 24,360 (33.2) | 38,155 (34.6) | < 0.01 |
| Home renovation exposure in past 2 years, N (%) | 17,170 (46.6) | 37,183 (50.7) | 54,355 (49.3) | < 0.01 |
| Pets at home, N (%) | 7,423 (20.2) | 13,091 (17.8) | 20,514 (18.6) | < 0.01 |
| Factory location, N(%) | < 0.01 | |||
| No factory | 27,302(74.1) | 56,928 (77.6) | 84,230 (76.5) | |
| Nearby | 6,634 (18.0) | 11,785(16.1) | 18,419(16.7) | |
| Far away | 2,888 (7.8) | 4,632 (6.3) | 7,520 (6.8) | |
| Low Birth Weight, N(%) | 2619(7.1) | 3026(4.1) | 5,645(5.1) | < 0.01 |
| Caesarian, N(%) | 13,998(38.0) | 27,659(37.7) | 41,657(37.8) | 0.332 |
| Per Capita Living Area, N(%) | < 0.01 | |||
| Small | 13,645 (37.1) | 26,996 (36.8) | 40,641 (36.9) | |
| Medium | 14,758 (40.1) | 31,658 (43.2) | 46,416 (42.1) | |
| High | 8,421 (22.9) | 14,691 (20.0) | 23,112 (21.0) | |
| Mold Exposure,N(%) | 16,903 (45.9) | 29,324 (40.0) | 46,227 (42.0) | < 0.01 |
| City,N(%) | < 0.01 | |||
| Foshan | 6,006(16.3) | 13,500(18.4) | 19,506(17.7) | |
| Guangzhou | 13,997(38.0) | 22,309(30.4) | 36,306(33.0) | |
| Shenzhen | 7,495(20.4) | 12,223(16.7) | 19,718(17.9) | |
| Zhonshang | 6,665(18.1) | 17,972(24.5) | 24,637(22.4) | |
| Zhuhai | 2,661(7.2) | 7,341(10.0) | 10,002(9.1) |
Abbreviations: SD, standard deviation; P values are calculated for categorical variable using Pearson Chi-squared test.
Table 2.
The concentrations of OPEs in PM2.5.
| OPEs | Min (pg/m3 ) |
Q1 (pg/m3 ) |
Median (pg/m3 ) |
Q3 (pg/m3 ) |
Max (pg/m3 ) |
MDLs (pg/m3) |
|---|---|---|---|---|---|---|
| TEP | 12.302 | 59.949 | 104.498 | 195.435 | 4531.727 | 41.529 |
| TCEP | 0.122 | 209.281 | 362.057 | 569.729 | 5140.226 | 10.991 |
| TCIPP | 18.868 | 80.818 | 111.915 | 172.158 | 747.656 | 10.914 |
| TDCIPP | 7.944 | 35.914 | 57.237 | 96.068 | 384.575 | 1.490 |
| TPHP | 0.003 | 122.303 | 323.737 | 573.984 | 2473.357 | 3.653 |
| EHDPH | 1.393 | 20.713 | 34.662 | 66.828 | 1379.108 | 5.148 |
| TBOEP | 6.738 | 202.701 | 303.260 | 447.972 | 5592.327 | 1.218 |
| T2IPPP | 0.474 | 5.954 | 10.378 | 20.876 | 237.297 | 0.219 |
| TEHP | 9.510 | 230.330 | 364.495 | 548.267 | 2415.413 | 1.817 |
| T34DMPP | 0.007 | 0.010 | 0.015 | 10.714 | 47.464 | 0.039 |
Abbreviations: Min, Minimum; Q1, 25th percentile; Q3, 75th percentile; Max, Maximum; MDLs, method detection limits; OPEs, Organophosphate Esters TEP,Triethyl phosphate; TCEP, Tris(2-chloroethyl) phosphate; TCIPP, Tris(1-chloro-2-propyl) phosphate; TDCIPP,Tris(1,3-dichloroisopropyl) phosphate; TPHP,Triphenyl phosphate;EHDPH,2-ethylhexyl diphenyl phosphate, TBOEP ,Tris(2-butoxyethyl) phosphate; T2IPPP, Tris (2-isopropylphenyl) phosphate; TEHP,Tris-(2-ethylhexyl) phosphate; T34DMPP,Tris(3,4-dimethylphenyl) phosphate.
Table 3.
Identification of OPEs associated with children’s sleep problems based on elastic network model a.
Table 3.
Identification of OPEs associated with children’s sleep problems based on elastic network model a.
| β | Total sleep problem | GSD | DIMS | SBD | DA | SHY | DOES | SWTD | Shorter sleep duration | Longer sleep latency |
|---|---|---|---|---|---|---|---|---|---|---|
| TEP | 0.086 | 0.048 | 0.051 | 0.040 | 0.044 | 0.049 | 0.057 | 0.047 | 0.097 | 0.060 |
| TCEP | 0.127 | 0.102 | 0.107 | 0.076 | 0.114 | 0.087 | 0.103 | 0.101 | 0.113 | 0.110 |
| TCIPP | 0.272 | 0.245 | 0.215 | 0.230 | 0.214 | 0.186 | 0.262 | 0.219 | 0.230 | 0.193 |
| TDCIPP | 0.410 | 0.275 | 0.277 | 0.238 | 0.233 | 0.243 | 0.295 | 0.217 | 0.465 | 0.382 |
| TPHP) | 0.324 | 0.321 | 0.292 | 0.302 | 0.248 | 0.257 | 0.318 | 0.294 | 0.307 | 0.268 |
| EHDPH | 0.022 | 0.029 | 0.022 | 0.023 | 0.002 | 0.024 | 0.036 | 0.024 | 0.025 | 0.012 |
| TBOEP | 0.035 | 0.050 | 0.046 | 0.063 | 0.040 | 0.061 | 0.035 | 0.070 | -0.002 | 0.028 |
| T2IPPP | 0.116 | 0.097 | 0.092 | 0.083 | 0.079 | 0.070 | 0.122 | 0.067 | 0.147 | 0.109 |
| TEHP | 0.421 | 0.281 | 0.282 | 0.279 | 0.258 | 0.203 | 0.307 | 0.217 | 0.481 | 0.389 |
| T34DMPP | 0.213 | 0.181 | 0.158 | 0.203 | 0.145 | 0.198 | 0.209 | 0.219 | 0.202 | 0.134 |
Abbreviations: GSD, global sleep disorder; DIMS, Disorder of initiating and maintaining sleep; SBD,Sleep breathing disorder; DA, Disorder of arousal; SWTD,Sleep-wake transition disorder; DOES,Disorder of excessive somnolence;SHY, Sleep hyperhidrosis. a The model was adjusted for city, age, sex, parental education level, annual household income, Physical activity, secondhand smoke exposure, home renovation exposure in past 2 years, pets at home, live near factory, premature birth, breastfeeding, low birth weight, caesarian, per capita living area, and mold exposure.
Table 4.
Association between Organophosphate esters (OPE) in PM2.5 and odds of sleep disorders ab.
| Sleep Disorders | Organophosphate esters (OPE) in PM2.5 | |||||||||
|---|---|---|---|---|---|---|---|---|---|---|
| TEP | TCEP | TCIPP | TDCIPP | TPHP | EHDPH | TBOEP | T2IPPP | TEHP | T34DMPP | |
| OR(95% CI) | OR(95% CI) | OR(95% CI) | OR(95% CI) | OR(95% CI) | OR(95% CI) | OR(95% CI) | OR(95% CI) | OR(95% CI) | OR(95% CI) | |
| Total SD | 1.09(1.08-1.09) | 1.13(1.12-1.14) | 1.31(1.29-1.33) | 1.50(1.48-1.52) | 1.38(1.35-1.40) | 1.02(1.01-1.03) | 1.03(1.02-1.04) | 1.12(1.11-1.13) | 1.52(1.50-1.54) | 1.23(1.21-1.26) |
| GSD | 1.05(1.03-1.06) | 1.11(1.09-1.12) | 1.12(1.10-1.14) | 1.31(1.28-1.35) | 1.37(1.32-1.42) | 1.02(1.02-1.0) | 1.05(1.03-1.06) | 1.10(1.08-1.11) | 1.32(1.28-1.35) | 1.19(1.15-1.24) |
| DIMS | 1.05(1.04-1.06) | 1.11(1.09-1.12) | 1.23(1.21-1.26) | 1.31(1.28-1.34) | 1.33(1.29-1.37) | 1.02(1.01-1.03) | 1.04(1.03-1.05) | 1.09(1.08-1.10) | 1.32(1.29-1.35) | 1.16(1.13-1.20) |
| SBD | 1.04(1.02-1.05) | 1.08(1.06-1.09) | 1.25(1.22-1.28) | 1.26(1.23-1.30) | 1.34(1.30-1.39) | 1.02(1.01-1.03) | 1.06(1.05-1.07) | 1.08(1.06-1.10) | 1.31(1.28-1.35) | 1.22(1.17-1.26) |
| DA | 1.04(1.03-1.05) | 1.12(1.10-1.13) | 1.23(1.20-1.27) | 1.26(1.22-1.30) | 1.28(1.22-1.33) | 1.00(0.99-1.01) | 1.04(1.02-1.05) | 1.08(1.06-1.09) | 1.29(1.25-1.33) | 1.15(1.11-1.20) |
| SWTD | 1.04(1.03-1.06) | 1.10(1.09-1.12) | 1.24(1.21-1.27) | 1.24(1.20-1.27) | 1.33(1.28-1.39) | 1.02(1.01-1.03) | 1.07(1.05-1.08) | 1.06(1.05-1.08) | 1.23(1.20-1.27) | 1.24(1.19-1.29) |
| DOES | 1.05(1.04-1.07) | 1.10(1.09-1.12) | 1.29(1.36-1.32) | 1.34(1.31-1.37) | 1.37(1.32-1.42) | 1.03(1.02-1.04) | 1.03(1.02-1.04) | 1.12(1.11-1.14) | 1.35(1.32-1.39) | 1.23(1.18-1.27) |
| SHY | 1.05(1.04-1.06) | 1.09(1.07-1.10) | 1.20(1.17-1.22) | 1.27(1.24-1.30) | 1.28(1.24-1.33) | 1.02(1.01-1.03) | 1.06(1.05-1.07) | 1.07(1.05-1.08) | 1.22(1.19-1.25) | 1.21(1.17-1.25) |
| SSD | 1.10(1.09-1.11) | 1.12(1.10-1.13) | 1.25(1.23-1.27) | 1.59(1.56-1.61) | 1.35(1.32-1.38) | 1.02(1.01-1.03) | 0.99(0.98-1.00) | 1.15(1.14-1.16) | 1.61(1.59-1.64) | 1.22(1.19-1.25) |
| LSS | 1.06(1.04-1.07) | 1.11(1.09-1.13) | 1.21(1.17-1.24) | 1.46(1.42-1.50) | 1.30(1.25-1.35) | 1.01(1.00-1.02) | 1.02(1.01-1.04) | 1.11(1.09-1.13) | 1.47(1.43-1.51) | 1.14(1.10-1.19) |
Abbreviations: OR, Odds Ratio; CI, confidence interval, ,TEP,Triethyl phosphate; TCEP, Tris(2-chloroethyl) phosphate; TCIPP, Tris(1-chloro-2-propyl) phosphate; TDCIPP,Tris(1,3-dichloroisopropyl) phosphate; TPHP,Triphenyl phosphate;EHDPH,2-ethylhexyl diphenyl phosphate, TBOEP,Tris(2-butoxyethyl) phosphate; T2IPPP, Tris (2-isopropylphenyl) phosphate; TEHP,Tris-(2-ethylhexyl) phosphate; T34DMPP,Tris(3,4-dimethylphenyl) phosphate; Total SD, Total sleep disorder; GSD, global sleep disorder; DIMS, Disorder of initiating and maintaining sleep; SBD,Sleep breathing disorder; DA, Disorder of arousal; SWTD,Sleep-wake transition disorder; DOES,Disorder of excessive somnolence;SHY, Sleep hyperhidrosis; SSD, Short sleep duration; LSS, Long sleep Latency a Models were adjusted for child’s age, sex, parental education, household income, birth weight, preterm birth, cesarean delivery, breastfeeding history, second hand, smoke exposure, physical activity, presence of pets, mold exposure, nearby factory exposure, and recent home renovation and city as random and city as random effect. Each model included one Organophosphate esters compound as the main exposure, expressed per unit increase in transformed concentration in PM2.5 compounds . b All P- value <0.05.
Table 5.
Associations between Organophosphate Ester (OPE) Mixtures and Sleep Disorders Using Weighted Quantile Sum Regression ab.
Table 5.
Associations between Organophosphate Ester (OPE) Mixtures and Sleep Disorders Using Weighted Quantile Sum Regression ab.
| Sleep disorder outcome | OR (95% CI) | Top three contributing OPEs |
|---|---|---|
| Total SD | 2.74(2.68-2.80) | TEHP, TEP, TCIPP |
| GSD | 2.50(2.38-2.63) | TCIPP, TEP,EHDPH |
| DIMS | 2.28(2.18-2.37) | TCIPP, TEP,EHDPH |
| SBD | 2.21(2.11-2.32) | T34DMPP, TCEP, EHDPH |
| DA | 2.02(1.91-2.12) | TEHP,TCIPP, TCEP |
| SWTD | 2.17(2.06-2.29) | T34DMPP, TCIPP, TEP |
| DOES | 2.54(2.42-2.64) | TCIPP,TCEP,TEP |
| SHY | 2.07(1.98-2.16) | T34DMPP,TCEP,TEP |
| SSD | 2.85(2.77-2.92) | TEHP,TEP,TDCIPP |
| LSS | 2.46(2.34-2.59) | TEHP,TEP,TCIPP |
Abbreviations: OR, Odds Ratio; CI, confidence interval, ,TEP,Triethyl phosphate; TCEP, Tris(2-chloroethyl) phosphate; TCIPP, Tris(1-chloro-2-propyl) phosphate; TDCIPP,Tris(1,3-dichloroisopropyl) phosphate; EHDPH,2-ethylhexyl diphenyl phosphate, TEHP,Tris-(2-ethylhexyl) phosphate; T34DMPP,Tris(3,4-dimethylphenyl) phosphate; Total SD, Total sleep disorder; GSD, global sleep disorder; DIMS, Disorder of initiating and maintaining sleep; SBD,Sleep breathing disorder; DA, Disorder of arousal; SWTD,Sleep-wake transition disorder; DOES,Disorder of excessive somnolence;SHY, Sleep hyperhidrosis; SSD, Short sleep duration; LSS, Long sleep Latency. a Models were adjusted for child’s age, sex, city, parental education, household income, birth weight, preterm birth, cesarean delivery, breastfeeding history, second hand, smoke exposure, physical activity, presence of pets, mold exposure, nearby factory exposure, and recent home renovation. b All P- value <0.05 .
Disclaimer/Publisher’s Note: The statements, opinions and data contained in all publications are solely those of the individual author(s) and contributor(s) and not of MDPI and/or the editor(s). MDPI and/or the editor(s) disclaim responsibility for any injury to people or property resulting from any ideas, methods, instructions or products referred to in the content. |
© 2025 by the authors. Licensee MDPI, Basel, Switzerland. This article is an open access article distributed under the terms and conditions of the Creative Commons Attribution (CC BY) license (http://creativecommons.org/licenses/by/4.0/).
Copyright: This open access article is published under a Creative Commons CC BY 4.0 license, which permit the free download, distribution, and reuse, provided that the author and preprint are cited in any reuse.


