
Submitted:
23 December 2025
Posted:
25 December 2025
You are already at the latest version
Abstract
In urban environments, the accuracy of traditional Global Navigation Satellite System (GNSS) could be compromised due to signal occlusion and multipath interference, particularly during critical operational phases such as drone take-off and landing. This study seeks to enhance drone positioning accuracy by integrating 4G and 5G communication antennas and applying multilateration (MLAT) techniques based on Time-Difference-of-Arrival (TDOA) and Angle of Arrival (AOA) measurements. The research focuses on a real-world case study in the metropolitan area of Valencia, Spain, where extensive mobile network data were analysed using the Cramér-Rao Lower Bound (CRLB) to identify zones with minimal positioning errors and, separately, optimal coverage for connectivity. The results suggest that integrating terrestrial antennas could enhance drone navigation; however, its current applicability remains limited to urban areas.
Keywords:
drone positioning
; 4G and 5G antennas
; Multilateration (MLAT)
; Time-Difference-ofArrival (TDOA)
; urban planning
; signal coverage
; geospatial analysis
; Cramér-Rao Lower Bound(CRLB)
; Dilution of Precision (DOP)
1. Introduction
The use of Unmanned Aerial Vehicles (UAVs), commonly known as “drones,” is rapidly expanding, finding new applications such as the transportation of goods and people [1,2] that led to the concept of Innovative Aerial Services (IAS) and Mobility (IAM) in Europe [3] and Advanced Air Mobility (AAM) in the United States [4]. Most of the envisaged business models will fly Beyond Visual Line of Sight (BVLOS) over urban areas [5] in what is commonly known as the Very Low-Level Airspace (VLL), which is usually defined as the level below which regular manned flights are not authorised unless for taking off and landing [6]. However, aircraft intended to transporting people will fly according to manned Visual Flight Rules (VFR) using new-generation aircraft like Vertical Take Off and Landing Capable Aircraft (CVA) above the VLL, usually in F Class uncontrolled airspace [7]. UAVs flying for non-carrying people purposes will be required to make their position and identity available to authorised users both by means of direct broadcast (the so-called broadcast Remote Identification [8]) or through a network connection (Network Remote Identification, a.k.a. Net-RID [8]). Global Navigation Satellite Systems (GNSS) receivers are envisaged as the most common source for position data for both broadcast and Net-RID in most jurisdictions [9,10]. Moreover, manned aircraft flying VFR in the so-called U-space airspaces [11] are requested to make their position known to U-space service providers using the conspicuity mechanisms defined in [12]. All practically available electronic conspicuity means (i.e., Automatic Dependent Surveillance – Broadcast, a.k.a. ADS-B [13] and Automatic Dependent Surveillance – Light SDR-860, a.k.a. ADS-L SRD-860 [14]) defined in [12] obtain the reported positions from a GNSS receiver. The ADS-L MOBILE (based on 4G/5G mobile telecommunication networks), still under development by the European Union Aviation Safety Agency (EASA) also considers GNSS as the source of data for electronic conspicuity applications. Despite of its potentially high accuracy, GNSS at low altitudes, where most IAS and IAM operations are envisaged, has been reported to be affected by phenomena like satellite shading and multipath, leading to poor performance requiring rather sophisticated mitigations [15,16].
A growing concern for GNSS-based aviation is the rise of intentional interference, notably jamming—characterized by the transmission of high-power signals within GNSS frequency bands that compromise the decoding of navigation data—and spoofing, involving the generation of counterfeit GNSS signals that induce receivers to compute erroneous position solutions [17]. UAVs using GNSS for navigation and position reporting are specially exposed to jamming and spoofing because of the lower flight altitude (i.e., short distance to potential sources of interference). Moreover, jamming and spoofing are usually mitigated by using redundant ground-based navigation and surveillance systems like Very-High Frequency (VHF) Omnidirectional Range (VOR), Distance Measurement Equipment (DME) and radars [17]. However, such systems are seldom available in the environments where UAVs typically operate, which renders the mitigation of jamming and spoofing particularly challenging for unmanned aerial platforms [18]. The scientific community has strived in the recent years to fix this problem, either pursuing autonomous, onboard solutions or leveraging the positioning capabilities enabled by 4G/5G networks [19,20,21,22,23,24]. In particular, the later seems to be especially promising, since it can provide the ground-based back up to ensure the integrity of the surveillance services for UAVs flying at low altitudes, mainly over urban areas and provide a secondary, independent stream of surveillance data.
The standard 3GPP TS 38.305 (v18.3.0, Sept. 2024) [25] defines the stage-2 architecture and procedures for User Equipment (UE) positioning in 5G NR, covering methods such as Time Difference of Arrival (TDOA), Angle of Arrival (AOA) and Round-Trip Time. Although less accurate, 4G networks also feature time of arrival and angle of arrival measurements [26] Multilateration (MLAT) techniques using TDOA, AOA, and RTT have been extensively used in aviation for aircraft surveillance in airports and Control Traffic Regions (CTR) around them since the beginning of the 20th century [27].
In its basic formulation [28], MLAT systems consist of a set of synchronized receiving stations distributed across the coverage area and a central processing station (CPS). The receiving stations measure the ToA of signals transmitted by aircraft, typically ADS-B or Traffic Alert and Collision Avoidance System (TCAS) squitters, and forward timestamped messages to the central processing unit. The CPS computes TDOA values and solves a system of hyperbolic equations to estimate the aircraft position. AoA measurements can be combined with ToA to improve the accuracy of the vertical component of the position, particularly at low altitudes. These techniques provide a well-established reference framework for the design of surveillance systems based on TDOA and AoA capabilities in 4G/5G networks. In this context, TDOA and AoA can be derived either at the user equipment (UE) side (DL-TDOA, AoD) or at the base station (gNodeB, or gNB) side (UL-TDOA, AoA). In both cases, the final UE position estimate is computed by the Location Management Function (LMF) in the core network.
The design of MLAT systems for aeronautical surveillance has been traditionally based on the Cramér-Rao Lower-Bound (CRLB) [29]. The CRLB is a theoretical lower limit on the variance of any unbiased estimator, indicating the best achievable estimation accuracy given a parameter’s statistical model. In other words: the CLRB represents the best possible performance in terms of position estimation accuracy that any practical implementation of a MLAT system can provide [28]. In [30], the authors derive analytical expressions for the CRLB considering several combinations of TDOA, AoA and RTT and conducted a thorough assessment of the performance of those combinations in different conditions. For airport environments, where the main issues affecting performance are shadowing and multipath (as in urban environments), the combination of TDOA and AoA proved to be the most effective solution. In [31], the authors proposed a method for designing airport MLAT systems applying the CLRB formulations from [30 to airport environments and using a Genetic Algorithm approach. The method in [31] allows the identification of the minimum number or receiving stations and their position on the airport layout considering a set of constraints derived from frangibility requirements according to [32] and other practical considerations (e.g., distribution of terminal buildings, control tower and hangars or access to airport energy or communication networks).
Despite relying on the same theoretical foundations, the design of MLAT system in airports has essential differences compared to 4G/5G-based implementations. Airport MLAT systems are deployed on purpose for aircraft surveillance upon request of the airport operator, who has all the data needed for the system design. On the other hand, 4G/5G surveillance solutions for UAVs shall rely on existing networks deployed according to design criteria that do not take into consideration the needs of UAVs but those of users on the ground, which represent the market’s share of the lion. In [33], the authors extended the method described in [31] for airports to the design of city-wide 4G/5B based MLAT system to provide coverage to specific corridors in the city of Valencia (Spain). The horizontal location of the base station was obtained from [34] and the height uniformly distributed between 20 and 50 meters. All stations in visual line of sight were considered for the assessment, which does not necessarily maximise positioning accuracy, as the receivers’ geometric distribution highly impacts the result [28].
In this paper we present a further more realistic extension of the work published in [33] addressing three main challenges: (1) integrating the information into a GIS file apt for processing, verifying the correct positioning of the gNBs and incorporating realistic height data derived from other sources; (2) developing a clustering criteria pursuing the selection of the best subset of available gNBS for computing the position based on the bi-directional link budget and the effect or the geometry; and (3) producing two GIS layers: one detailing coverage and the other showing the minimum achievable error based on the current antenna infrastructure. These layers were developed using the CRLB formulation from used by the UPV in [33], within a framework elaborated by the University of Genoa (UniGe) team [35]. The ultimate purpose of those layers is to enable urban planners to identify suitable locations of vertiports and corridors in urban areas applying a Multi Criteria Assessment (MCA) as the one presented in [36].
The rest of the paper is structured as follows: in the Section we provide a methodological overview detailing the processes involved in data extraction and pre-processing prior. In Section 3, we describe the algorithms developed to estimate the coverage in terms of link budget and CRLB. Finally, we present the results in Section 4, followed by the conclusions of our work in Section 5.
2. Methodology
This section presents the methodology developed to assess the feasibility of using urban 4G/5G mobile networks as a secondary positioning layer alongside GNSS for UAVs. Without loss of generality, the methodology is applied to the metropolitan area of Valencia as a case study.
The objective is to evaluate two key performance indicators for urban drone operations: positioning accuracy, quantified through the CRLB, and communication coverage, determined by the availability of 4G/5G gNBs. These assessments are conducted over a large urban area using a raster grid-based simulation, where each grid cell represents a discrete UAV position at a fixed flight altitude relative to the terrain. The focus is placed on en-route segments of UAVs operations; take-off and landing phases are not considered here, as they would require localized analyses similar to traditional airport assessment methodologies.
The methodological workflow, summarized in Figure 1, includes a series of pre-processing and analysis steps:
- Data acquisition and preparation: Data were retrieved from the relevant source platform and converted into a GIS-compatible format for further processing in Python. This enabled the application of data manipulation techniques to correct inconsistencies and standardize the dataset.
- Obstacle analysis: A critical step involved identifying base stations (gNBs) obstructed by surrounding buildings or terrain. This was achieved by overlaying a Digital Surface Model (DSM) onto a resampled Digital Terrain Model (DTM) with a resolution of 50 meters. An altitude offset of 150 meters was applied to simulate flight conditions.
- Coverage calculation: For each pixel in the raster grid, the number of visible gNBs with a viable bidirectional link budget was calculated. Visibility was determined by analysing signal propagation paths and identifying obstructions via the DSM overlay.
- CRLB computation: Based on the visibility information, the CRLB was computed for each UAV position. The specific characteristics of each antenna were preserved in the calculation. The results were stored as GIS layers representing spatial variations in positioning accuracy and communication availability.
The resulting data layers form the basis for identifying suitable regions for vertiport placement, when combined with additional criteria as discussed in [36].
We further detail the different steps of this methodology in the next sub-sections.
2.1. Extraction of Base Stations of Public Mobile Networks
Spanish authorities make data on the location of base stations of mobile networks and their technological characteristics publicly available to enable citizens to verify the level of electromagnetic radiation they are exposed to [34]. Since the work that we are presenting in this paper was carried out in the city of Valencia (Spain), we chose that city as a case study. This choice is absolutely arbitrary and does not compromise the validity of the methodology, that can be applied elsewhere (provided that the necessary information on the gNB location and characteristics is available).
Although the official source of information about mobile networks base station is [34], other private platforms, such as Antenas GSM [37], also provide this information in more user-friendly formats. We obtained from this website the identification codes, geographical coordinates (latitude and longitude), address (when available), frequency bands, and available technology (e.g., 5G) of all the base stations in the study area (see Figure 2). The antenna elevation data is only accessible to premium users, but we managed to approximate it as detailed in the following sub-sections. We converted this information into GIS format for processing with ArcGIS Pro and Python scripts.
2.3. Data Preprocessing
A preliminary assessment of the raw data revealed that our database contained over 13,000 antenna points, representing individual radiating elements. Notably, base stations from different mobile network operators were often located in small spatial clusters, with antennas slightly separated but positioned in close proximity. This reflects a common industry practice of site sharing to reduce infrastructure costs. We confirmed this assumption through selective on-site inspections and an extensive case-by-case validation using Google Maps satellite imagery.
For the purposes of this study, we aggregated each cluster of co-located antennas into a single representative point, as illustrated in Figure 3, which shows a zoomed view of the city centre around the main train station. To identify clusters based on spatial proximity, we employed the Density-Based Spatial Clustering of Applications with Noise (DBSCAN)algorithm [38], using a maximum distance of 40 meters. For each identified cluster, we calculated the geometric centroid to represent the aggregated antenna position, while preserving all relevant attributes of the original points. An exception was made in cases where base stations from different companies shared the same physical location. In these instances, the centroid was computed for the cluster, but company-specific information was maintained separately, even though the coordinates were identical. The cleaned and clustered database ultimately included antennas from four major operators: Orange, Telefónica, Vodafone, and Xfera.
To ensure spatial accuracy, we verified that aggregating clustered antennas did not significantly distort the base station’s real-world position. Additionally, we identified instances of apparent placement errors in the original data, potentially introduced for security reasons. In such cases, we applied a relocation protocol based on the assumption that antennas are typically placed at the highest available point in the area—most often on rooftops in urban zones, or on poles or towers in rural environments.
A key challenge was to distinguish between urban and rural contexts, as this classification directly affected how the antenna’s installation height was estimated relative to the building or structure. In urban areas, we analysed the surrounding environment—such as the density, size, and height of nearby buildings—to determine whether relocation was warranted. If so, the point was moved to the nearest highest building within a 10-meter radius, ensuring it remained at least 1 meter inside the building perimeter. In contrast, for rural areas—where buildings were generally absent or consisted only of small structures (e.g., sheds)—the antenna was left in its original position, assuming it was mounted on a mast.
To support this process, we used building footprint data from the Geoportal of the Valencian Community [39], which provides detailed building geometries, although without height attributes. Antenna heights, crucial for line-of-sight (LOS) calculations with UAVs, were estimated using a Digital Surface Model (DSM) from the same source, with a spatial resolution of 2 meters, capturing surface features including buildings and vegetation. Before integrating the building and DSM datasets, we converted both to the ETRS89 UTM Zone 30N coordinate system (EPSG:25830) to ensure consistency in metric spatial operations. Using the Zonal Statistics tool in GIS, we transferred DSM elevation values to each building polygon, computing the mean height within each footprint as an estimate of building height.
To determine the total antenna height above ground, we added the estimated building height to a characteristic offset: 3 meters for antennas located on buildings in urban areas and 9 meters for antennas on poles in rural areas.
Finally, a spatial join was performed to associate each base staion (stored in shapefile format) with the corresponding building geometry and height attributes derived from the DSM, completing the height estimation and correction phase of the pre-processing workflow.
We analysed the network of each of these companies separately, because the positioning service will be provided by a specific company using its own infrastructure.
2.4. Signal Coverage Computation
The initial step involved determining the coverage of the antennas and verifying the ones visible from specific points above the ground. Each point was identified as the centroid of pixels in a DTM, which, unlike the DSM, includes only terrain elevation, excluding any objects on it. The DTM was obtained, like the DSM, from the Geoportal of the Valencian Community. A simulated drone flight altitude was calculated by adding an offset of 150 meters to each pixel in the DTM. It is the maximum flight altitude allowed by U-Space regulations in Spain.
After several trials, it was established that a grid resolution of 50 meters, derived from the resampled DTM, was optimal for the study area in terms of computational efficiency. The calculation was not performed directly on the pixel; instead, the information was aggregated into a single point representing the centroid of each pixel of the raster grid (Figure 4). This approach was used to verify both the line of sight between pixels, simulating the drone flight altitude relative to the antennas, and to assess the actual coverage distance of the antennas.
To compute the coverage for the visible antennas, each point in the centroid grid of the raster was processed using the signal propagation equation (1) to determine whether it falls within the maximum range of the antenna.
In Equation (1), Pr is the received power (expressed in Watt, W), while Pt is the transmitted power. The gain of the transmitting and receiving antennas are indicated by Gt and Gr, respectively. The symbol refers to the wavelength of the signal. The wavelength of a signal is determined by dividing the speed of light by the frequency of the signal. Finally, the term d refers to the distance between the antenna and the mobile device, the drone in this case.
To facilitate the analysis, data simplification was necessary. For each antenna, the operating frequencies relevant to the technologies under consideration - specifically 5G and 4G - were carefully analyzed. Given that antennas supporting both technologies may transmit at varying frequencies, a conservative approach was adopted. For the purposes of this study, the highest typical frequency associated with each technology was selected for this analysis to ensure a comprehensive and conservative evaluation of coverage and performance. This step was repeated for each antenna, counting the number of visible antennas per pixel in the DTM-derived grid. The following parameters were used:
- -
- transmission power: 20 dBm,
- -
- antenna gain of the mobile device: 0 dBi,
- -
- antenna gain of the base station: 8 dBi,
- -
- minimum receiving power: −90 dBm.
To compute the coverage for the visible antennas, each point in the centroid grid of the raster was processed using the signal propagation equation (1) to determine whether it falls within the maximum range of the antenna.
At this stage, the algorithm checks each point to determine whether any antennas are within the possible transmission range. If antennas are present, it verifies that no obstacles block the line of sight between the target point and the antenna. This was done by extracting the height of points along the signal path from the DSM. If the DSM height exceeded the signal height at any point along the path, the target point was deemed not visible. This process was conducted separately for both 5G and 4G technologies, considering their different operating frequencies, as mentioned before.
It was then possible to convert from a point-based geometric format back to a raster, as a JSON file was simultaneously generated during the process. For each pixel in the DTM raster grid, this JSON file contains information about the visible antennas, including their identification codes (IDs), coordinates, frequencies, heights above sea level, maximum signal distance, and the distance to each antenna. Each piece of information is recorded for both 5G and 4G antennas. This JSON file was subsequently converted into a GeoPackage, creating, again, a grid of points based on the pixel centroids of the DTM, like shown in Figure 4. Each piece of previously mentioned information is represented in a separate column, maintaining a Python dictionary-like association between the data calculated for each drone position and the antenna IDs. This method not only facilitates the counting of the visible antennas per pixel but also enables the calculation of additional parameters, such as the maximum and minimum transmission and reception power values for each pixel, and the possibility to recalculate coverage with different parameters. Furthermore, this approach will be useful for identifying areas with lower positioning errors.
2.5. Calculation of Areas with Less Positioning Error
The following paragraph describes the calculations used to identify areas at a specific elevation above the ground - 150 meters, as in the coverage case - where optimal drone placement could be achieved using 5G antennas to minimize positioning error, as determined by the CRLB. For this analysis, only antennas with 5G technology are considered. For each pixel centroid, representing a simulated drone position, the IDs of visible antennas along with their information are collected using the Geopackage file produced from the coverage process.
If fewer than four antennas are visible, the code assigns predefined values of -9999 to the calculated metrics and proceeds to the next point. This ensures that points incapable of providing a valid 3D positioning are not processed further.
To minimize processing time and quickly determine the optimal antenna combinations, two intermediate steps were implemented to enable calculations over a large area. In the first step, visible antennas were filtered to exclude those with distances above the average distance of all antennas. In the second step, it was considered that higher SNR levels yield better accuracy (Figure 5 and Figure 6), as lower noise reduces the error contribution in the error covariance matrix used for the CRLB calculation. Based on this, the remaining visible antennas were divided into sectors, with the centroid of each pixel - previously used as the reference point for calculating antenna visibility during the simulated drone flight at 150 meters - serving as the origin of a Cartesian plane. Then the antennas were assigned to a sector according to an angle set by the user (Figure 7). The process iteratively selected the antenna with the best SNR in each sector, moving sequentially through the sectors in a clockwise manner. After selecting the first antenna in each sector, the CRLB was calculated to assess whether the configuration improved positioning accuracy. If no improvement was achieved, additional antennas with lower SNR were progressively tested, repeating the process across sectors until an optimal configuration was reached, or the threshold remained unchanged for a specified number of iterations (Figure 7).
The calculated metrics included both Target Horizontal Positioning Accuracy (THPA) and Target Vertical Positioning Accuracy (TVPA), which represent the contribution of system geometry to the error in estimating the target position. Additionally, Horizontal Dilution of Precision (HDOP) and Vertical Dilution of Precision (VDOP). While HDOP and VDOP reflect the precision of positioning based on system geometry, THPA and TVPA offer a more specific measurement of the target’s estimated position accuracy.
The calculated metrics are saved in a GeoPackage file, with points representing the centroids of the DTM grid and each column containing the calculated parameters. Each column is then transformed into a raster, with each raster representing a specific calculated metric (Figure 14, Figure 15, Figure 16 and Figure 17).
3. Results
As previously discussed, it was necessary to differentiate the antennas based on the available technology. For the calculation of coverage, both 4G and 5G antennas were utilized, being 5G the most recent technology available in Valencia according to the database. For the calculation of the CRLB, only 5G antennas were considered.
Despite its declining market position, in the Metropolitan area of Valencia, Vodafone still has the largest number of antennas overall, reflecting its former dominance (Table 1). Telefonica ranks second in terms of the number of antennas, following Orange, which has strong 5G coverage. As expected, both 4G (Figure 8 and Figure 9) and 5G antennas (Figure 10 and Figure 11) have their highest density in areas with greater population density, building concentration, and along major transportation infrastructures. The density of 5G antennas is generally lower compared to 4G antennas due to the use of more conservative factors in the coverage calculations for 5G, which results in a shorter signal range. Consequently, coverage is generally adequate for most areas, except in the mountainous regions surrounding the city, where the number of antennas per pixel is low, often approaching one.
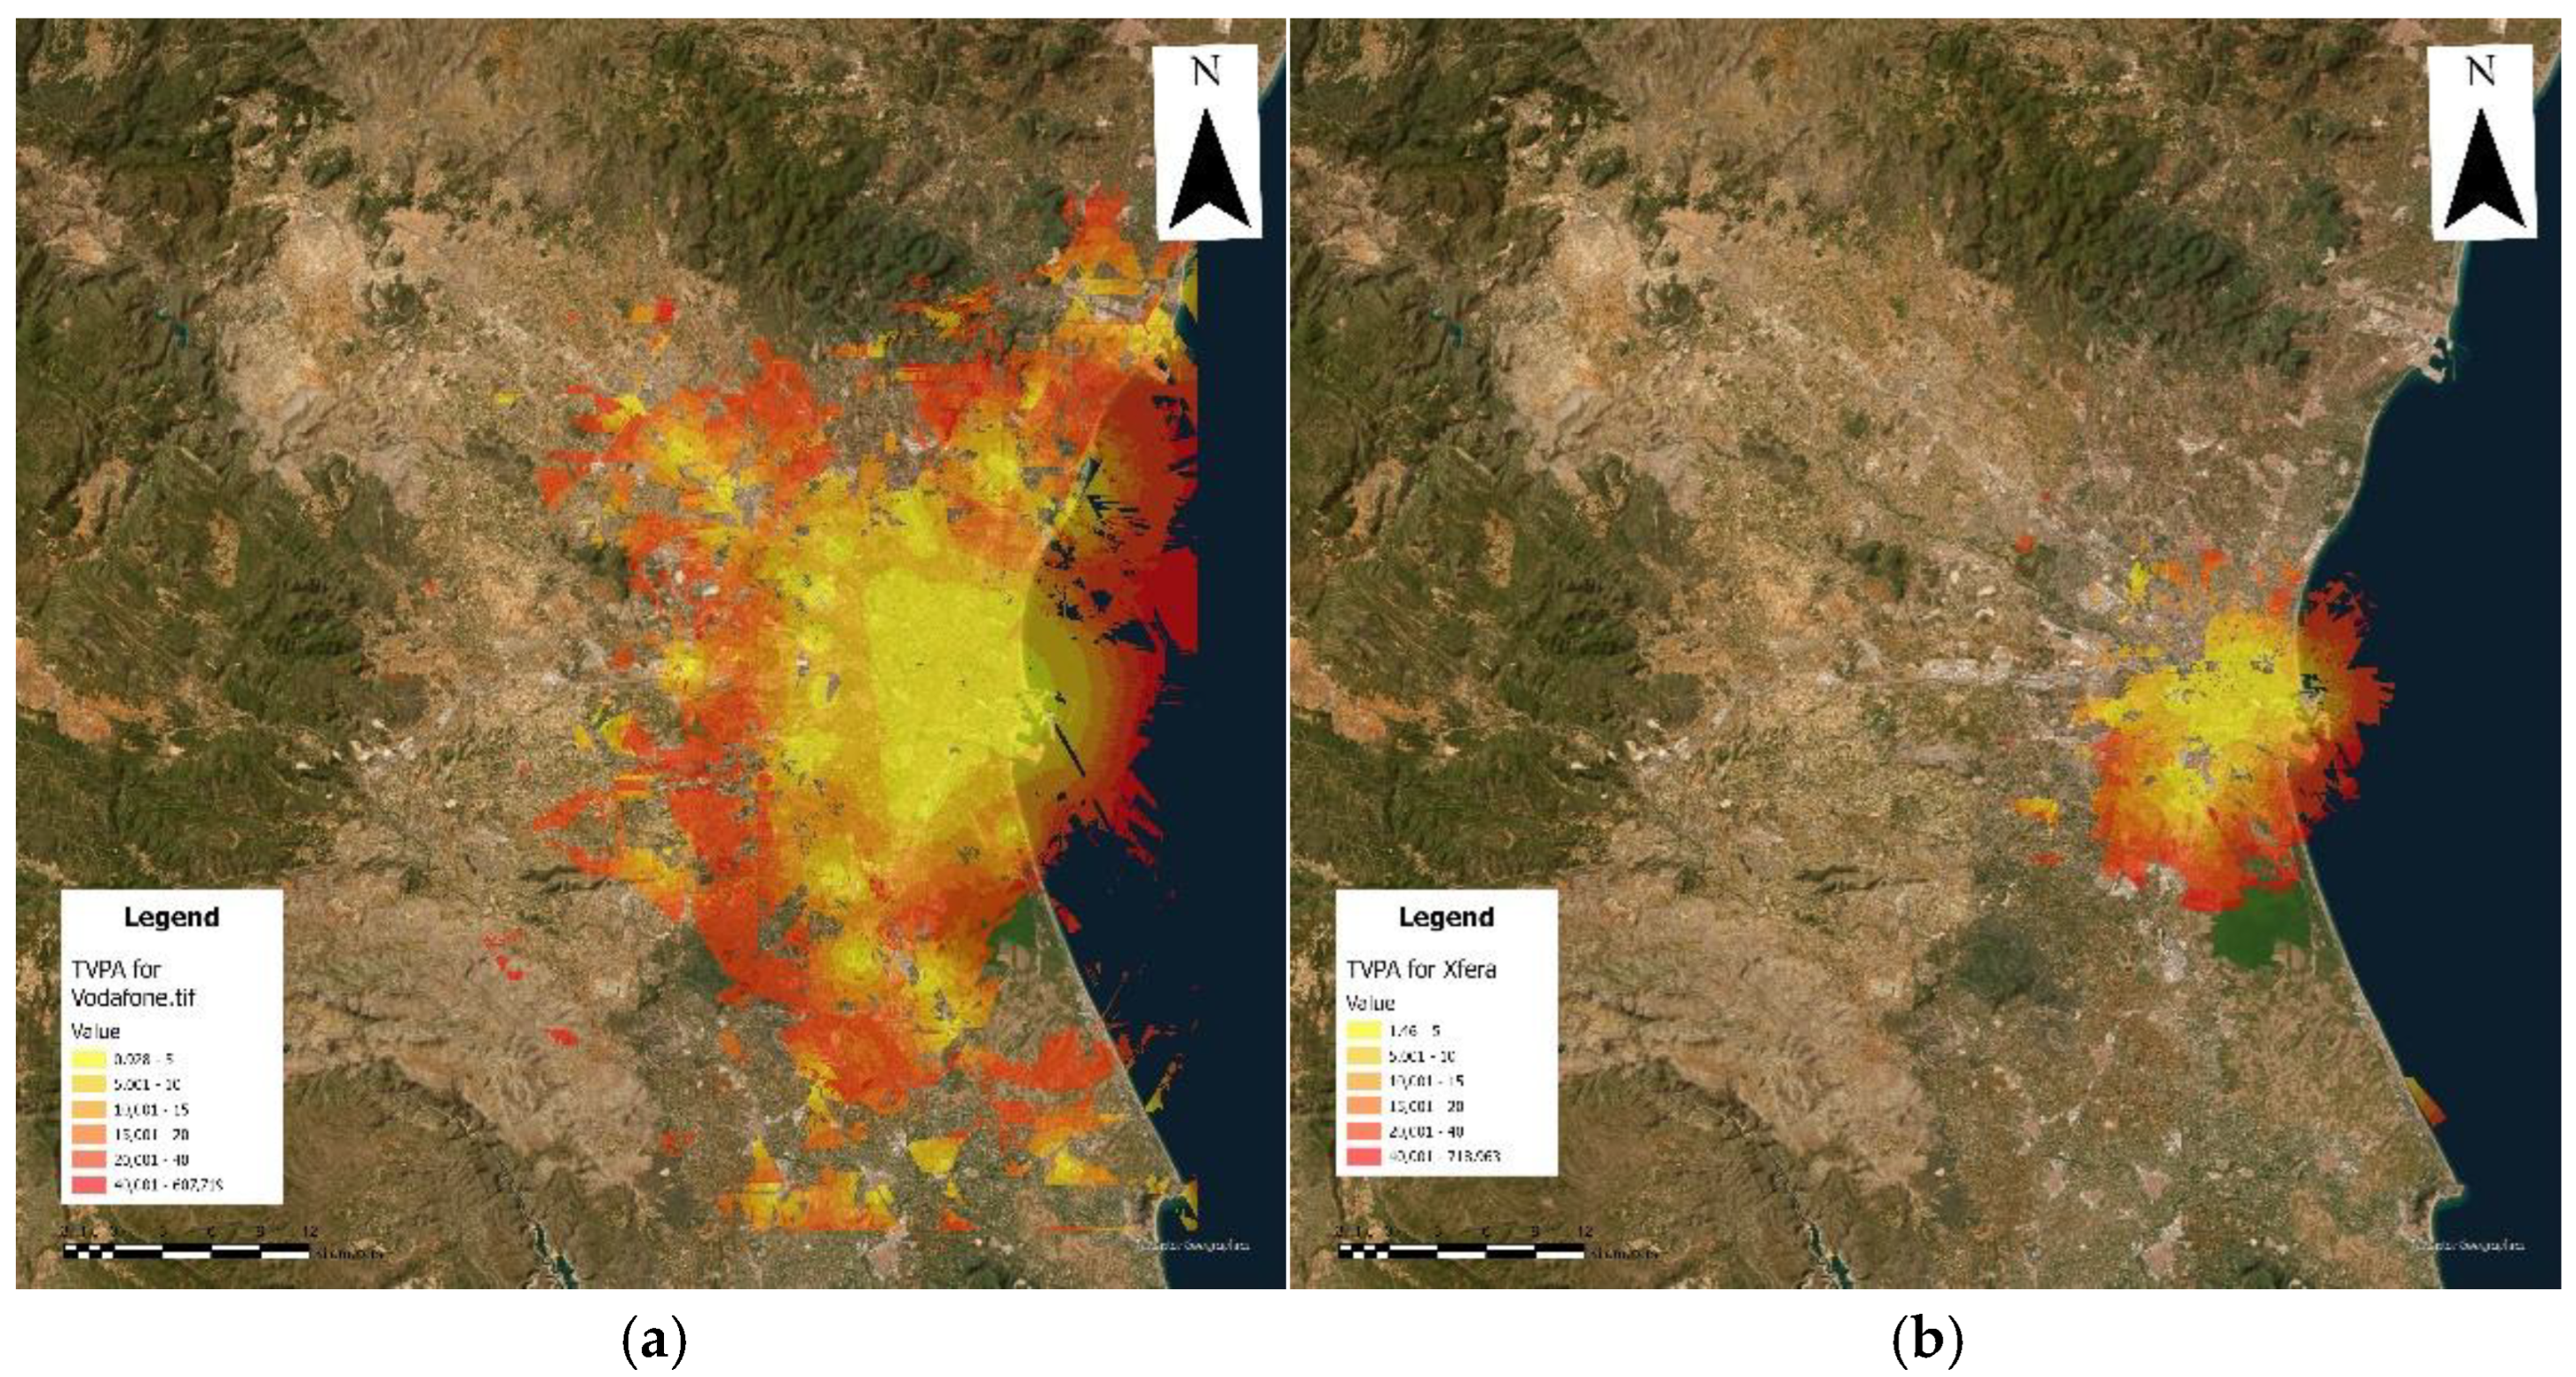
As highlighted in the previous paragraphs, the algorithm used to calculate the CRLB was applied separately to the four identified companies. CRLB has both a vertical (TVPA) and a horizontal component (THPA). Achieving accurate results for the vertical component is particularly challenging without antennas positioned at significantly varied heights. This component is especially relevant for landing and takeoff, although other instruments are available for calculating the position of the aerial vehicle. In contrast, the horizontal component is less critical to calculate. Therefore, the focus was placed on enhancing accuracy by applying AOA solely to the vertical component to improve the overall CRLB. There are various techniques available to mitigate the limitations of the TVPA, which largely depends on the heterogeneous distribution of antennas across the territory. Efforts were made to enhance the vertical component accuracy by imposing that at least one antenna between all the visible had the AOA calculated.
As mentioned, the CRLB metric is a synthesis of both a vertical and a horizontal component. Figure 12 and Figure 13 represent the error levels, with yellow indicating the minimum error level and red representing the highest error. Among the operators, Vodafone offers the most extensive coverage for all the city center (Figure 13a), with an acceptable error threshold, potentially under 10 meters, followed by Orange (Figure 12a). In contrast, the area covered by Xfera is too limited. However, it is important to consider that Xfera antennas might be integrated into Orange network in the future, which could improve Orange overall results. Additionally, there are plans to develop a telecommunications network specifically designed to serve drones, though this remains a distant project at this stage.
Figure 14.
THPA calculation by pixel for Orange (a) and for Telefonica (b).
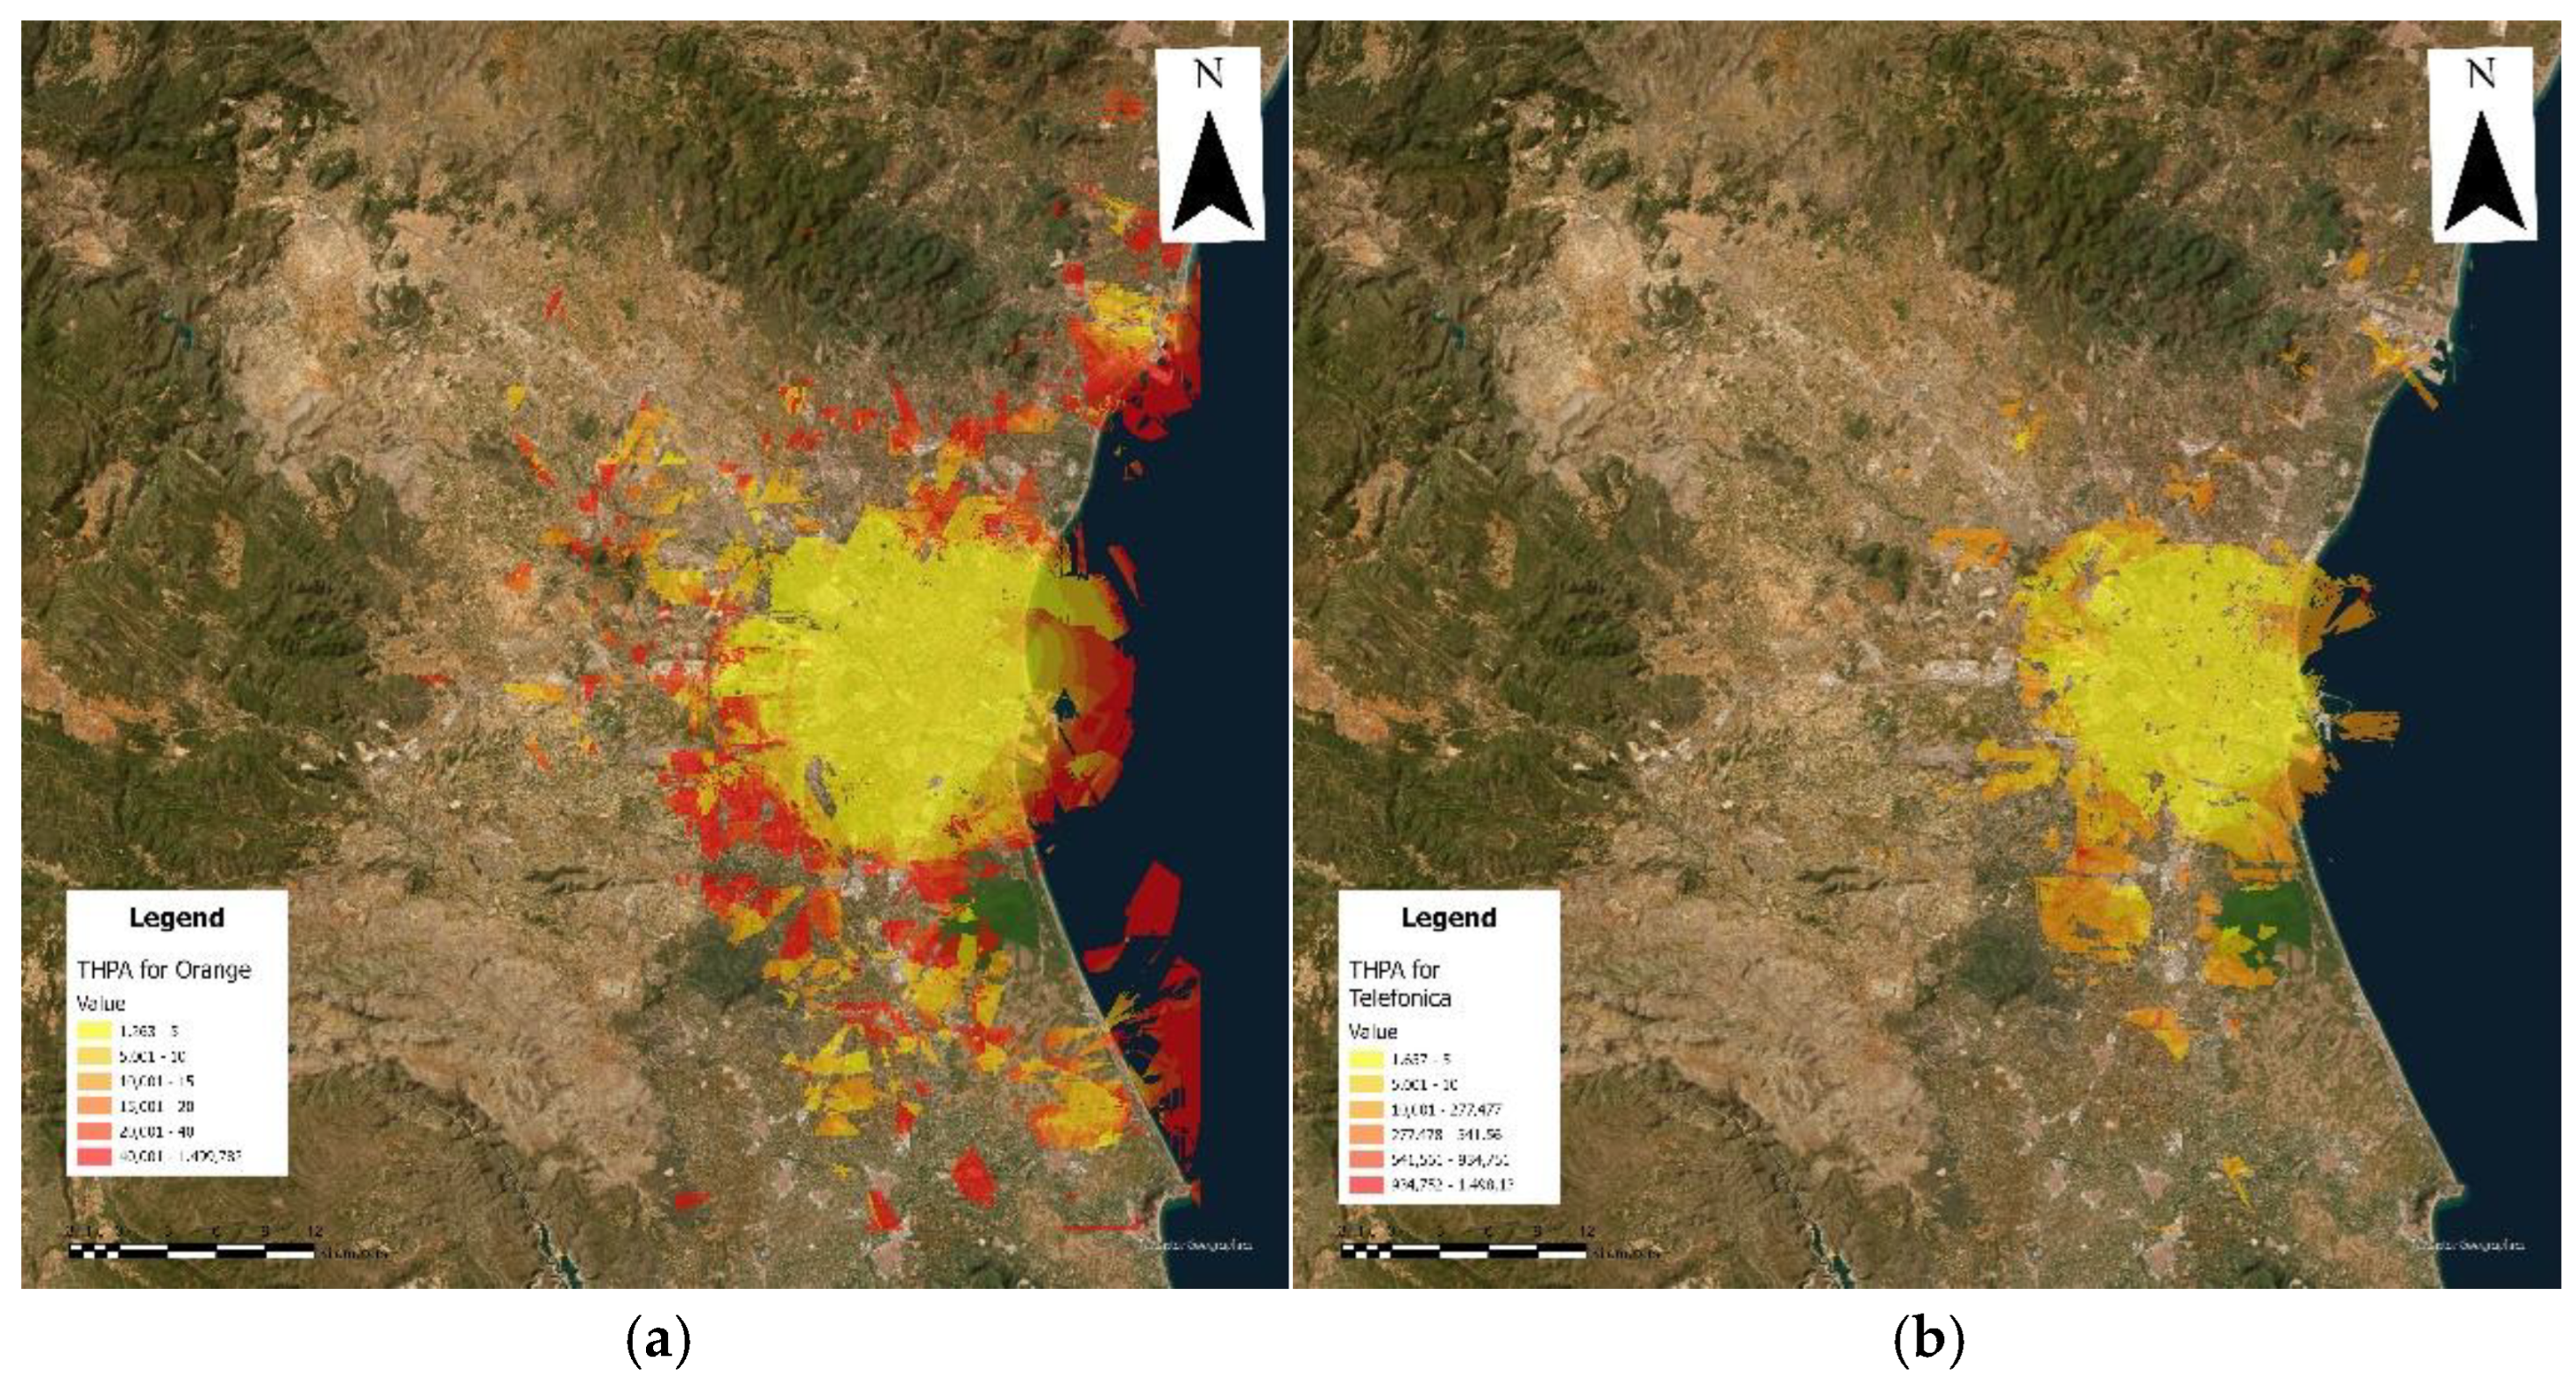
Figure 15.
THPA calculation by pixel for Vodafone (a) and for Xfera (b).
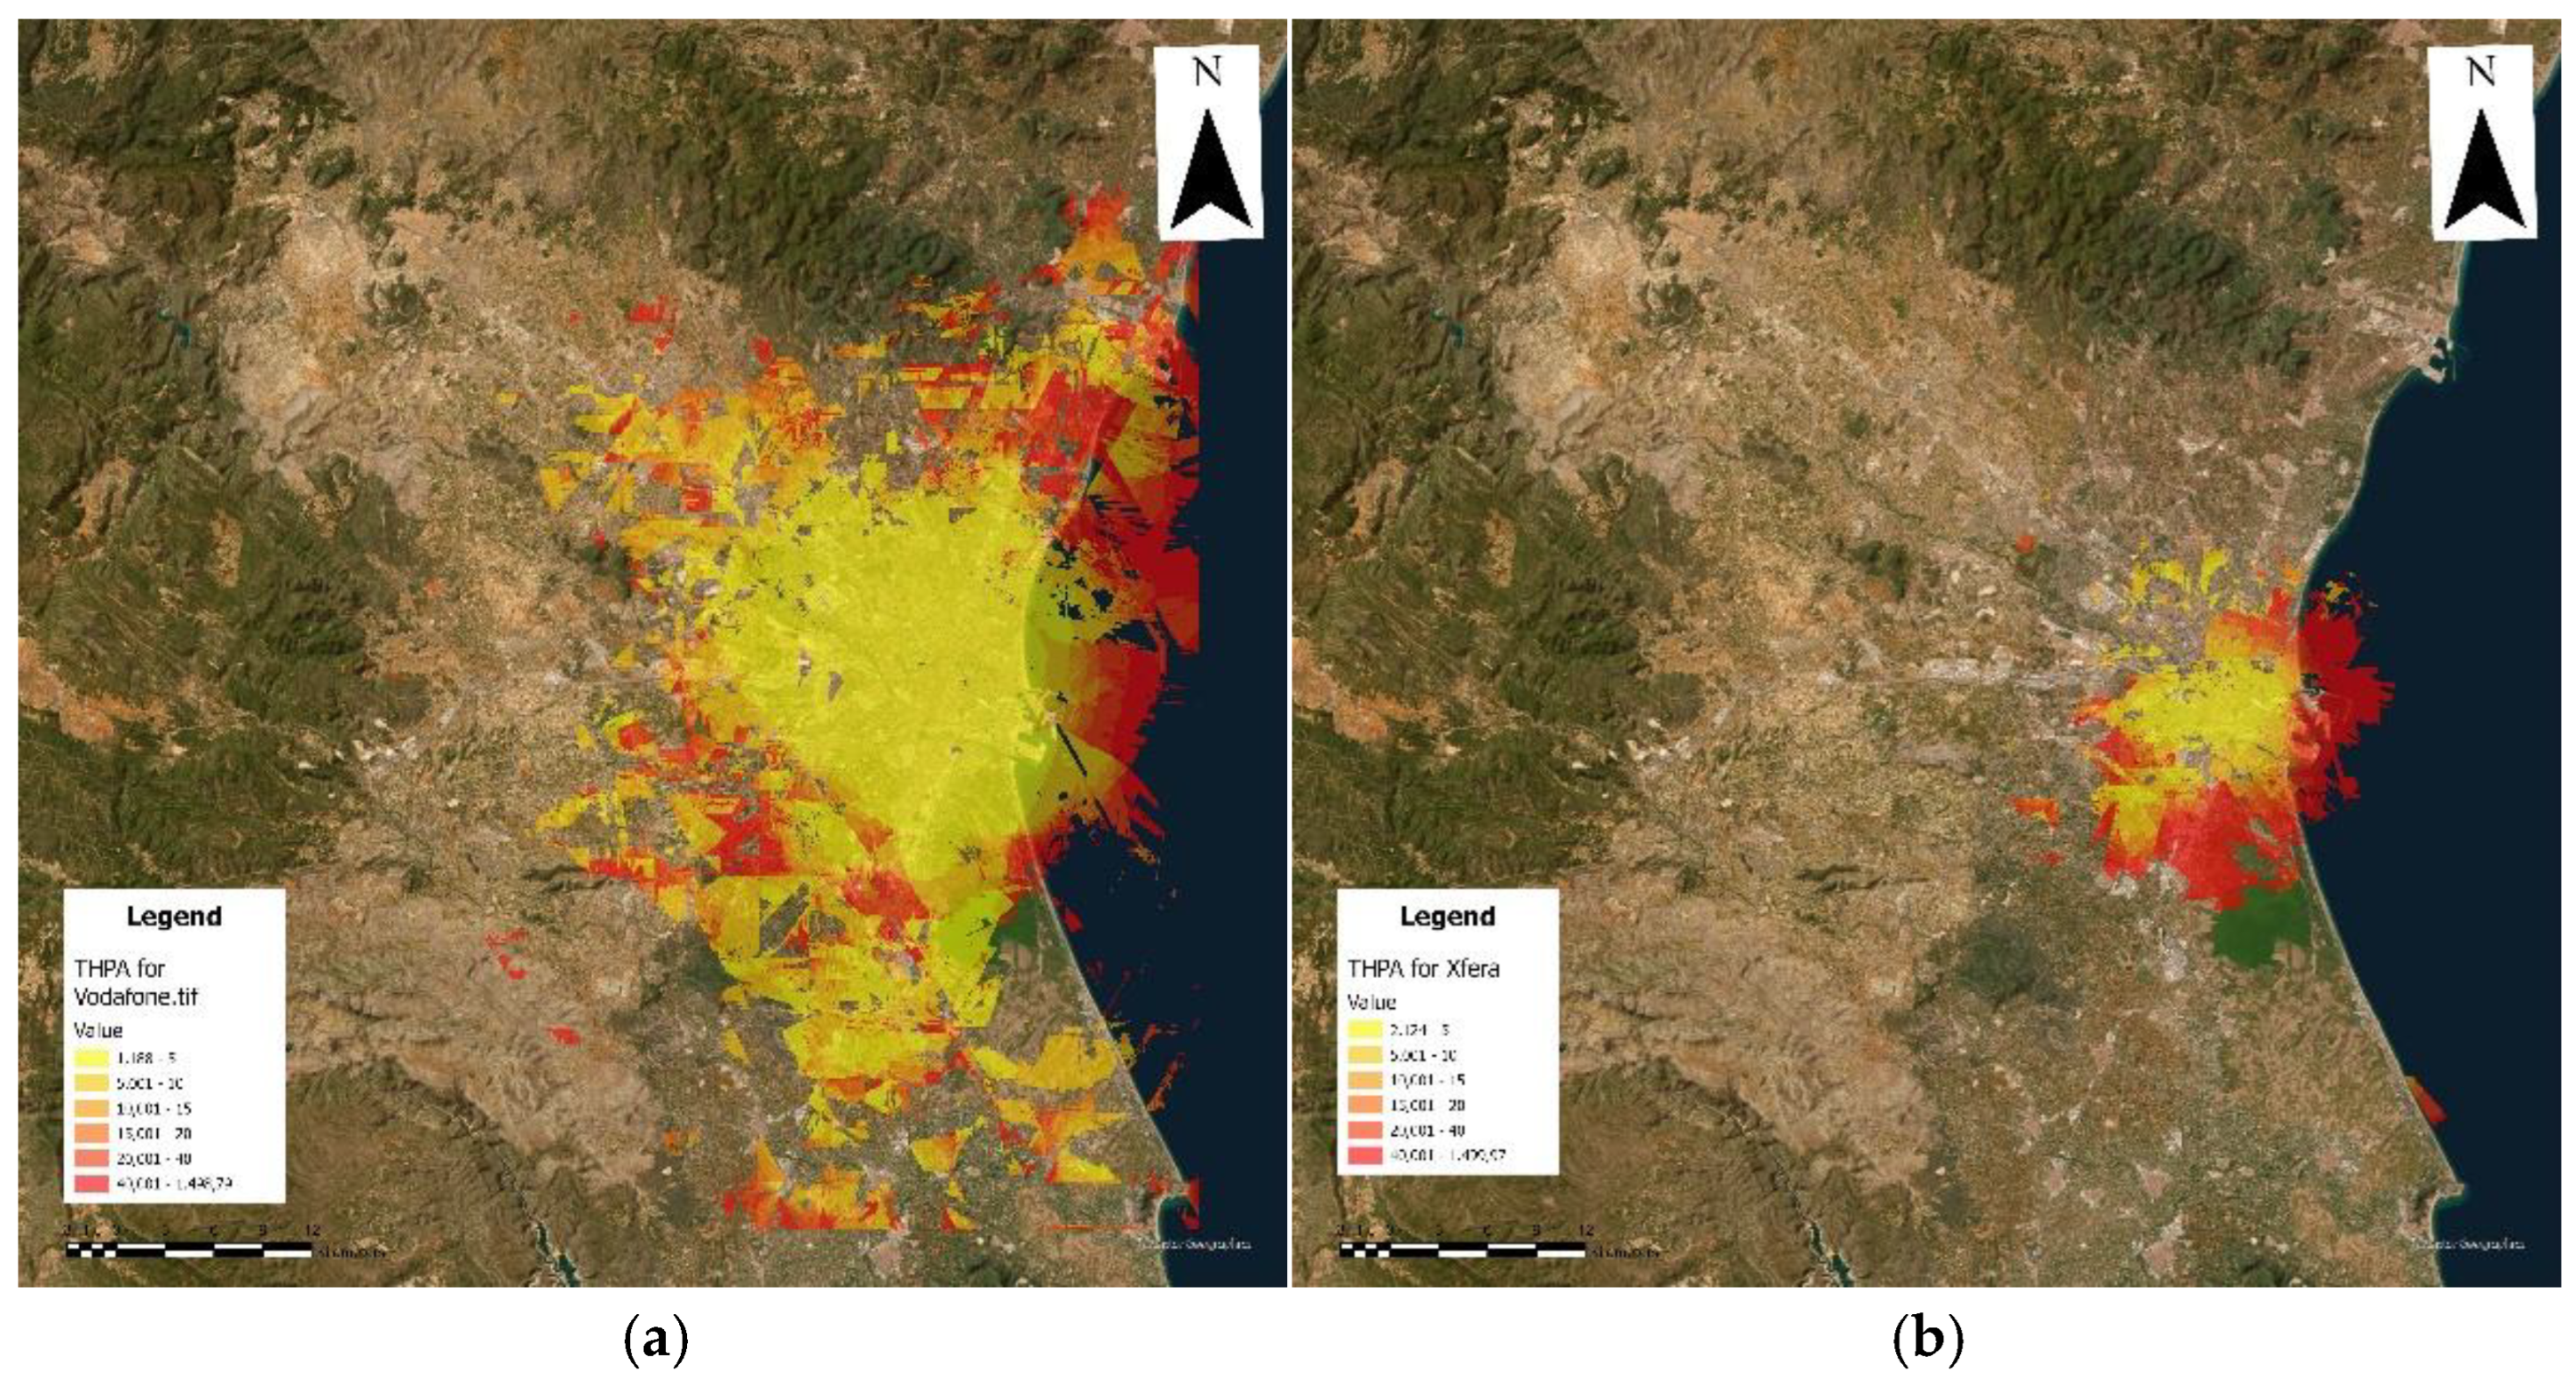
Figure 16.
TVPA calculation by pixel for Orange (a) and for Telefonica (b).
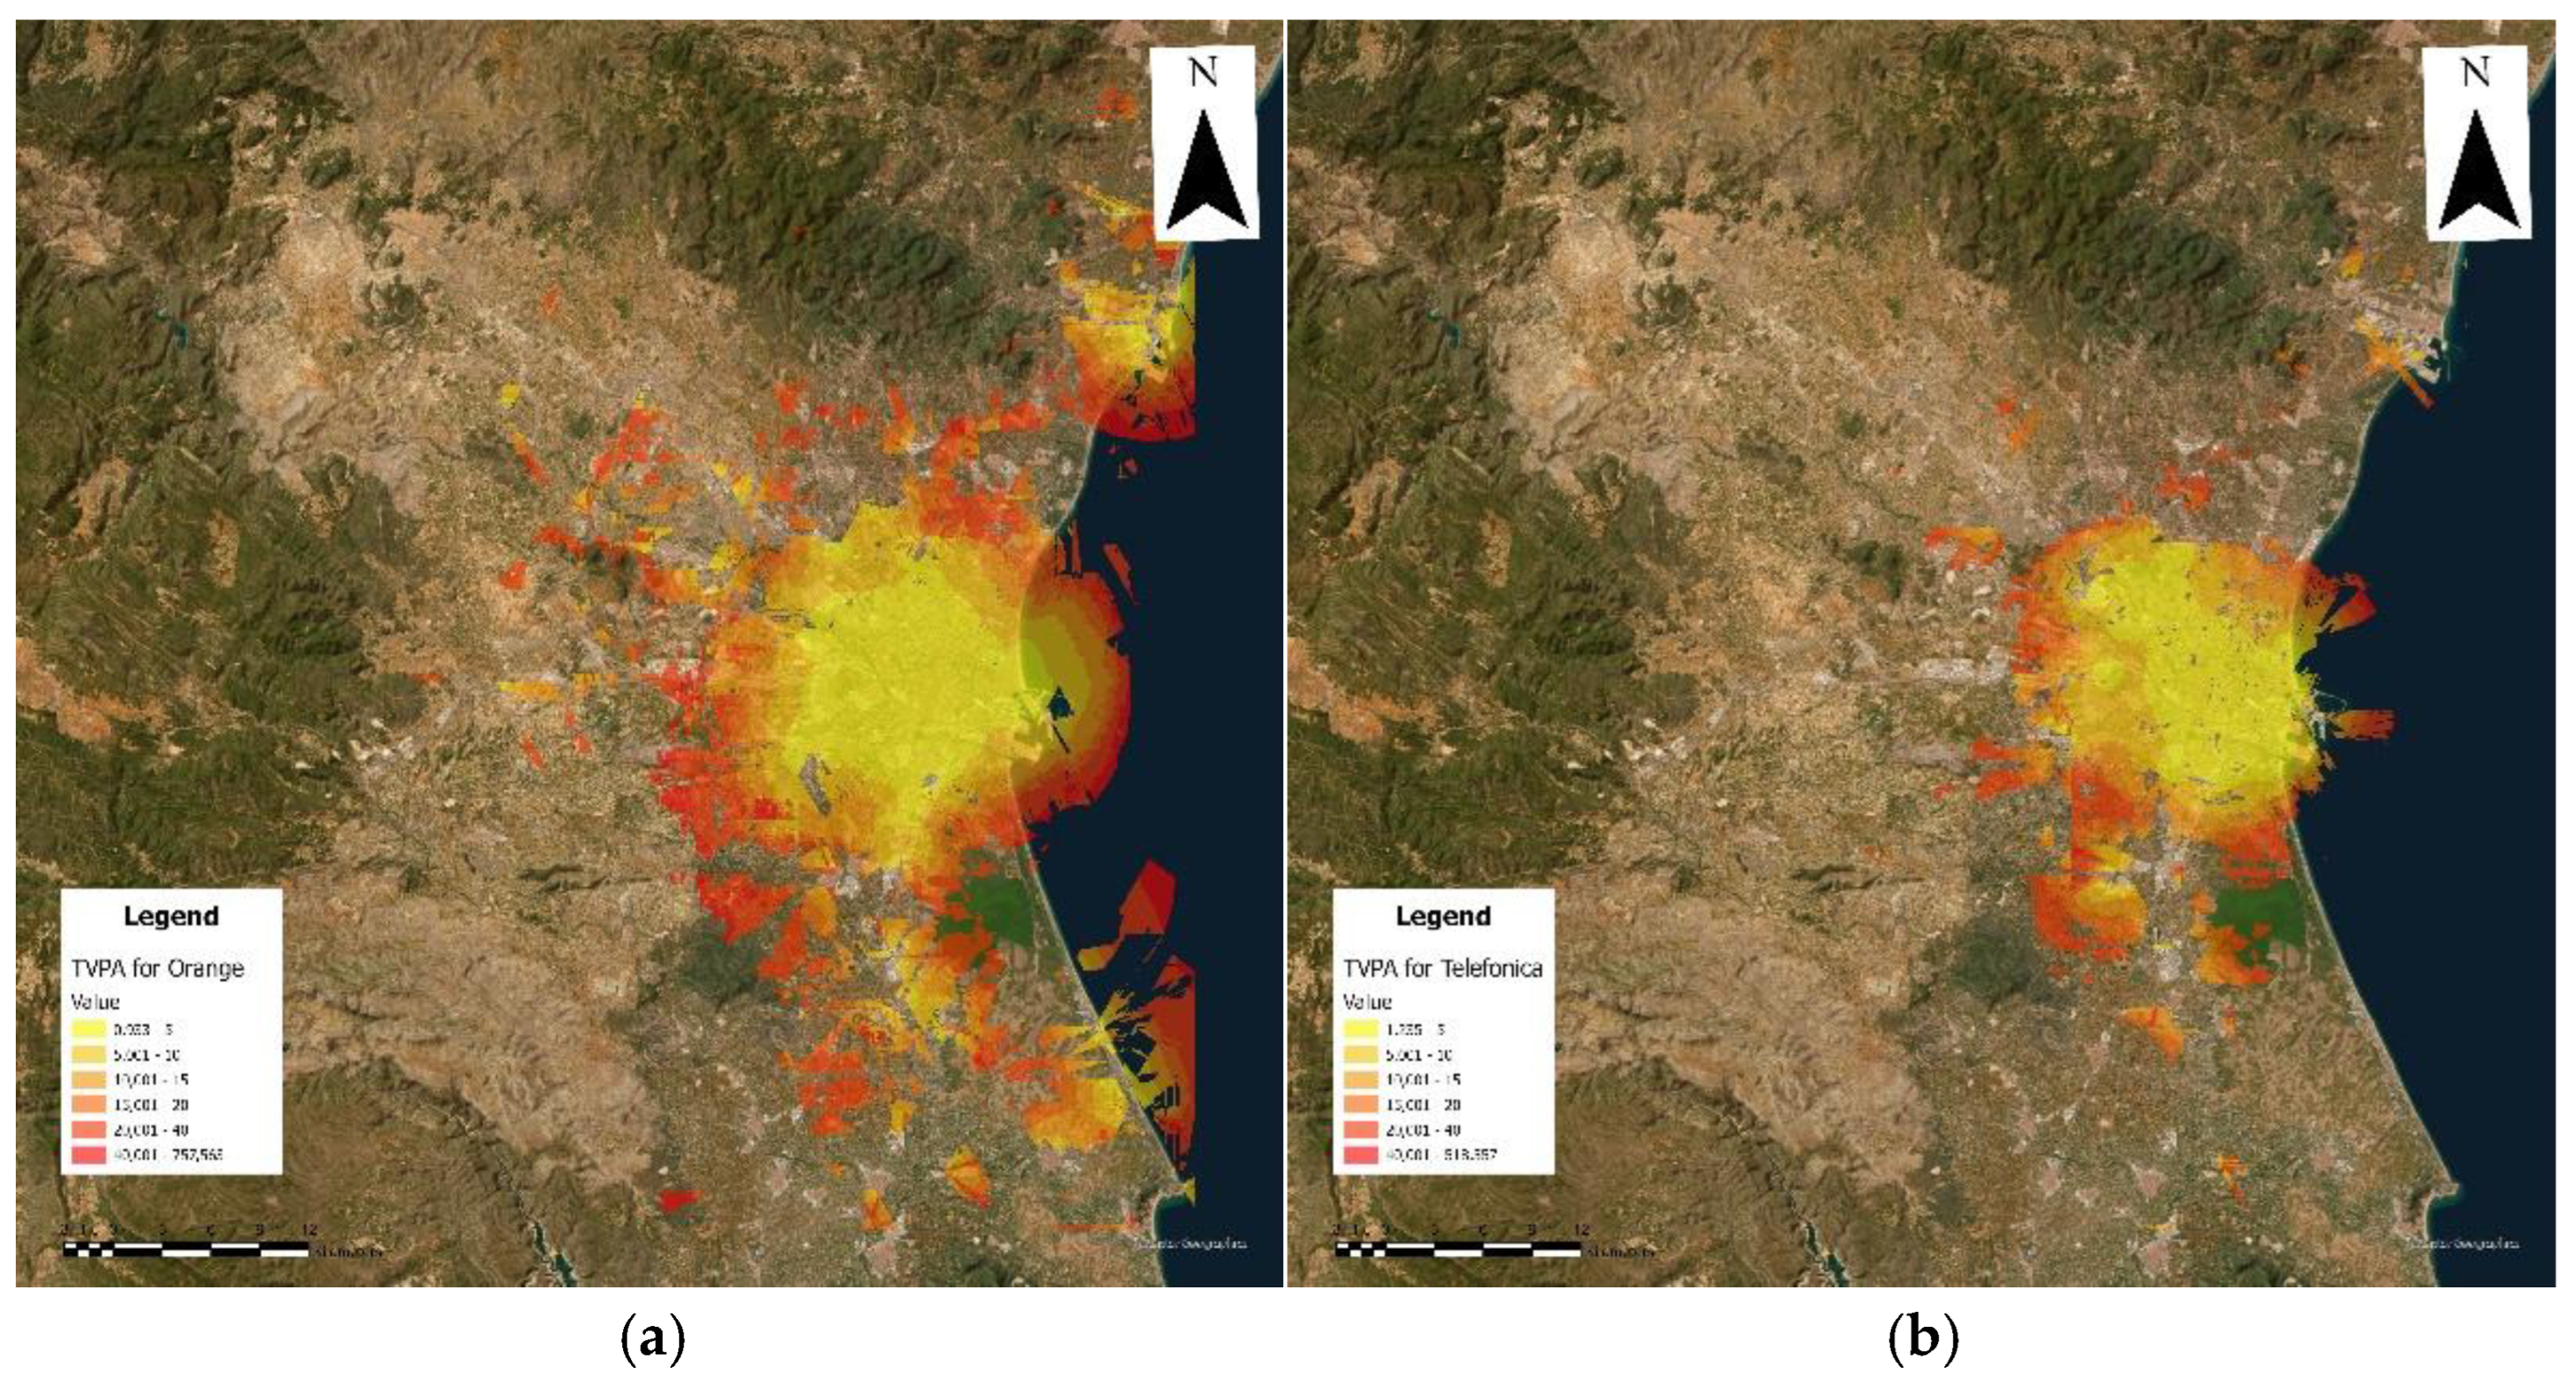
Figure 17.
TVPA calculation by pixel for Vodafone (a) and for Xfera (b).
4. Discussions and Conclusions
This work contributes to draw considerations on the potential developments of the drone market within the communication and security sectors. The algorithm developed in this study could be further optimized, both in terms of computational speed and the parameters considered, to achieve results that are as close to real-world conditions as possible. It is important to note that both the coverage calculation and the CRLB calculation were conducted by considering only the potential obstructions between the drone in flight and the antennas, which is particularly relevant for positioning, in addition to the maximum signal range. Expanding the analysis to include other factors, such as multipath effects, was not within the scope of this study. Instead, the objective was to approximate a real-world scenario as closely as possible and to assess whether, given the current infrastructure, it is feasible to achieve what is widely discussed in the literature - namely, using 5G antennas in conjunction with GNSS for drone positioning. In addition, it would have required further enhancement of the algorithm, significantly increasing computational time. Furthermore, under typical conditions - excluding specific adverse weather that may cause atmospheric attenuation - if the antenna is visible to the drone, it is expected to maintain optimal communication. However, the downtilt of base station antennas, which are generally directed towards the ground, may affect signal quality.
The value of this work lies in advancing the study of optimizing safety levels using existing infrastructure. To the knowledge of the authors, no large-scale study has yet verified whether areas with a high density of antennas can feasibly support their use for positioning. However, for achieving optimal vertical positioning, it was necessary to implement the capability for calculating the AOA. The AOA was calculated solely for the vertical component. As the number of available antennas decreases, the number of antennas requiring AOA increases to achieve satisfactory results. In the central area, approximately 10% of the antennas are using AOA, whereas this percentage rises to 34% in less densely served areas. The number of antennas could have been further reduced by considering the geography and area extension, but this would have required an optimization of the algorithm, necessitating additional computational time. Moreover, to achieve optimal results across the entire area, it would have been necessary to calculate the AOA for the horizontal component, as was done for the vertical component, and then recompute for the entire region. This would likely have enhanced the results across the board. However, the primary objective was to assess the feasibility of using fixed mobile communication antennas for drone operations. The issue is further compounded considering that 5G antennas are primarily installed in areas of high population density or high usage, such as along major communication routes. For instance, considering the road west of Valencia that crosses the mountains and leads to Madrid, following specific routes, the current number of available antennas may suffice. Along the road, 5G antennas are present throughout the entire route, within the boundaries from which we have extracted data.
One of the most interesting discussion points arises considering that, under current conditions, is not feasible to ensure a dual level of security for positioning using GNSS and ground-based antennas when deploying drones for inter-urban connections. This issue becomes even more significant considering that the CRLB was calculated under optimal conditions, while current antennas are not designed to disperse signals upwards.
To ensure better coverage, particularly to support the landing and take-off phases of a drone in an urban context, it will be necessary to increase the number of antennas in areas identified as suitable for the establishment of a vertiport. Indeed, the example assumes the drone is flying at an altitude of 150 meters, but once on the ground, there is generally an insufficient number of visible antennas.
However, other tools will also be available to ensure positioning. For example, the use of cameras for location recognition and subsequent drone localization, to identify ground symbols to facilitate a safe landing, and technologies such as radar and, in particular, Lidar, are being considered. Additionally, for interurban flights, planning optimal flight paths for drones is a key focus of the ongoing authors research project. This involves identifying the essential data required to develop suitability maps for the placement of corridors and vertiports. By concentrating investments in these specifically identified areas, costs can be reduced while results are maximized. This approach also ensures the highest level of safety in the most frequently used areas. This will lead to a significant increase in the density of antennas, although those installed for drone flights will need to be optimized to send the signal upwards, while current ones do so downwards. Consequently, a fundamental aspect of the design of 5G networks will be the compliance with electromagnetic field (EMF) exposure limits. Optimizing transmitted power and managing incident power density are essential to ensure safety and regulatory compliance [17].
Moreover, it is possible to consider a combination of positioning techniques, which can significantly improve accuracy and reliability. For example, [18] proposes an integrated methodology that utilizes both GNSS and 5G signals to achieve high-precision positioning, while [19] compares the performance of 3D positioning algorithms using 5G signals, demonstrating the effectiveness. These antennas will continue to serve their traditional function [20], such as facilitating communication between mobile phones, but in this case with drones [21]. Alternative solutions, such as satellite communication, also exist, with Starlink being one of the most widely discussed options [22].
Another important factor, as discussed at the beginning of section 3, is the understanding of the market structure for different operators. This understanding can be useful for assessing the potential for future interoperability among them. Currently, the systems of various operators do not always communicate seamlessly with each other. However, this knowledge could enable the strategic use of operators in areas where they perform better than others, thereby optimizing coverage and service quality by leveraging the strengths of each operator.
Author Contributions
Conceptualization, S.C. and C.S.; methodology, S.C, V.M.M and J.V.B.T.; software, S.C.; validation, V.M.M and J.V.B.T.; formal analysis, S.C.; investigation, S.C. and V.M.M; resources, S.C. and V.M.M; data curation, S.C.; writing - original draft preparation, S.C. and V.M.M; writing - review and editing J.V.B.T., C.S., I. F. and D.S.; supervision, J.V.B.T.; All authors have read and agreed to the published version of the manuscript.
Funding
this research was supported by the Italian Ministry of University and Research (MUR) under the PNRR Mission 4, Component 2 “From Research to Business” – Investment 3.3 “Introduction of innovative PhDs that respond to the innovation needs of companies and promote the recruitment of researchers by companies,” co-financed by Geodatalab Srls. The research also received support from the Universitat Politècnica de València as part of the cooperation agreement with the Università degli Studi di Genova.
Data Availability Statement
The data are partially available and referenced in the bibliography, while the remaining data can be requested from the authors due to legislative reasons.
Conflicts of Interest
The authors declare no conflicts of interest. One of the funders had a role in the design of the study and in the writing of the manuscript; but not in the collection, analyses, or interpretation of data; or in the decision to publish the results.
References
- Easy Access Rules for Unmanned Aircraft Systems (Regulations (EU) 2019/947 and 2019/945) - Revision from July 2024 - EASA. Available online: https://www.easa.europa.eu/en/document-library/easy-access-rules/easy-access-rules-unmanned-aircraft-systems-regulations-eu (accessed on 7 August 2024).
- U-SPACE Concept of Operation (ConOps).
- Monzonís Melero, V. Desarrollo de Una Prueba de Concepto de Un Sistema de Posicionamiento de Aeronaves No Tripulada Aplicando Técnicas de Multilateración a Señales de Sistemas 5G. 2022. [Google Scholar]
- Galati, G.; Leonardi, M.; Mantilla-Gaviria, I.A.; Tosti, M. Lower Bounds of Accuracy for Enhanced Mode-S Distributed Sensor Networks. IET Radar, Sonar and Navigation 2012, 6. [Google Scholar] [CrossRef]
- Melero, M.; Jiménez, C.; Alexander, C.; Tejedor, B.; Vicente, J. Assesment of a UAV Positioning System Based on MLAT Techniques to a 5G Network for Urban Air Mobility.
- Gao, H.; Su, Y.; Zhang, S.; Diao, M. Antenna Selection and Power Allocation Design for 5G Massive MIMO Uplink Networks. China Communications 2019, 16. [Google Scholar] [CrossRef]
- Al-Yasir, Y.I.A.; Abdulkhaleq, A.M.; Parchin, N.O.; Elfergani, I.T.; Rodriguez, J.; Noras, J.M.; Abd-Alhameed, R.A.; Rayit, A.; Qahwaji, R. Green and Highly Efficient MIMO Transceiver System for 5G Heterogenous Networks. IEEE Transactions on Green Communications and Networking 2022, 6. [Google Scholar] [CrossRef]
- Cunietti, S.; Sammarco, C.; Ferrando, I.; Sguerso, D. Urban Perspectives on UAVs Infrastructure Development. In Proceedings of the SESAR Innovation days, 2023. [Google Scholar]
- Plan Básico de Movilidad Del Área Metropolitana de València; 2018.
- Niveles de Exposición. Available online: https://geoportal.minetur.gob.es/VCTEL/vcne.do (accessed on 5 August 2024).
- Antenas GSM - Mapa de Antenas Telefonía Móvil Para Comprobar La Cobertura Móvil 2G, 3G, 4G y 5G Con Ubicaciones y Bandas. Available online: https://antenasgsm.com/ (accessed on 5 August 2024).
- DBSCAN — Scikit-Learn 1.5.1 Documentation. Available online: https://scikit-learn.org/stable/modules/generated/sklearn.cluster.DBSCAN.html (accessed on 9 August 2024).
- Yoigo - Wikipedia. La Enciclopedia Libre. Available online: https://es.wikipedia.org/wiki/Yoigo (accessed on 6 August 2024).
- La Nueva Teleco Orange-MásMóvil Se Compromete a Invertir 4.000 Millones En Tres Años: “Estaríamos En El Ibex 35” | Empresas | Cinco Días. Available online: https://cincodias.elpais.com/companias/2024-04-03/la-nueva-masorange-se-compromete-a-invertir-4000-millones-en-los-proximos-tres-anos.html (accessed on 6 August 2024).
- Geoportal IDEV - Generalitat Valenciana. Available online: https://idev.gva.es/es/geoportal-idev (accessed on 4 November 2024).
- El Fondo Zegona Confirma Conversaciones Para Comprar Vodafone España Por 5.000 Millones | Economía | EL PAÍS. Available online: https://elpais.com/economia/2023-09-22/el-fondo-zegona-confirma-conversaciones-para-comprar-vodafone-espana-por-5000-millones.html (accessed on 6 August 2024).
- Tornevik, C.; Wigren, T.; Guo, S.; Huisman, K. Time Averaged Power Control of a 4G or a 5G Radio Base Station for RF EMF Compliance. IEEE Access 2020, 8. [Google Scholar] [CrossRef]
- Yin, L.; Ni, Q.; Deng, Z. A GNSS/5G Integrated Positioning Methodology in D2D Communication Networks. IEEE Journal on Selected Areas in Communications 2018, 36. [Google Scholar] [CrossRef]
- Sun, B.; Tan, B.; Wang, W.; Lohan, E.S. A Comparative Study of 3d Ue Positioning in 5g New Radio with a Single Station. Sensors (Switzerland) 2021, 21. [Google Scholar] [CrossRef] [PubMed]
- Naqvi, S.A.R.; Hassan, S.A.; Pervaiz, H.; Ni, Q. Drone-Aided Communication as a Key Enabler for 5G and Resilient Public Safety Networks. IEEE Communications Magazine 2018, 56. [Google Scholar] [CrossRef]
- Liu, H.Y.; Tian, X.H.; Gu, C.; Fan, P.; Ni, X.; Yang, R.; Zhang, J.N.; Hu, M.; Guo, J.; Cao, X.; et al. Drone-Based Entanglement Distribution towards Mobile Quantum Networks. Natl Sci Rev 2020, 7. [Google Scholar] [CrossRef] [PubMed]
- Kassem, M.M.; Raman, A.; Perino, D.; Sastry, N. A Browser-Side View of Starlink Connectivity. In Proceedings of the Proceedings of the ACM SIGCOMM Internet Measurement Conference, IMC, 2022. [Google Scholar]
Figure 1.
Overview of the proposed methodology.
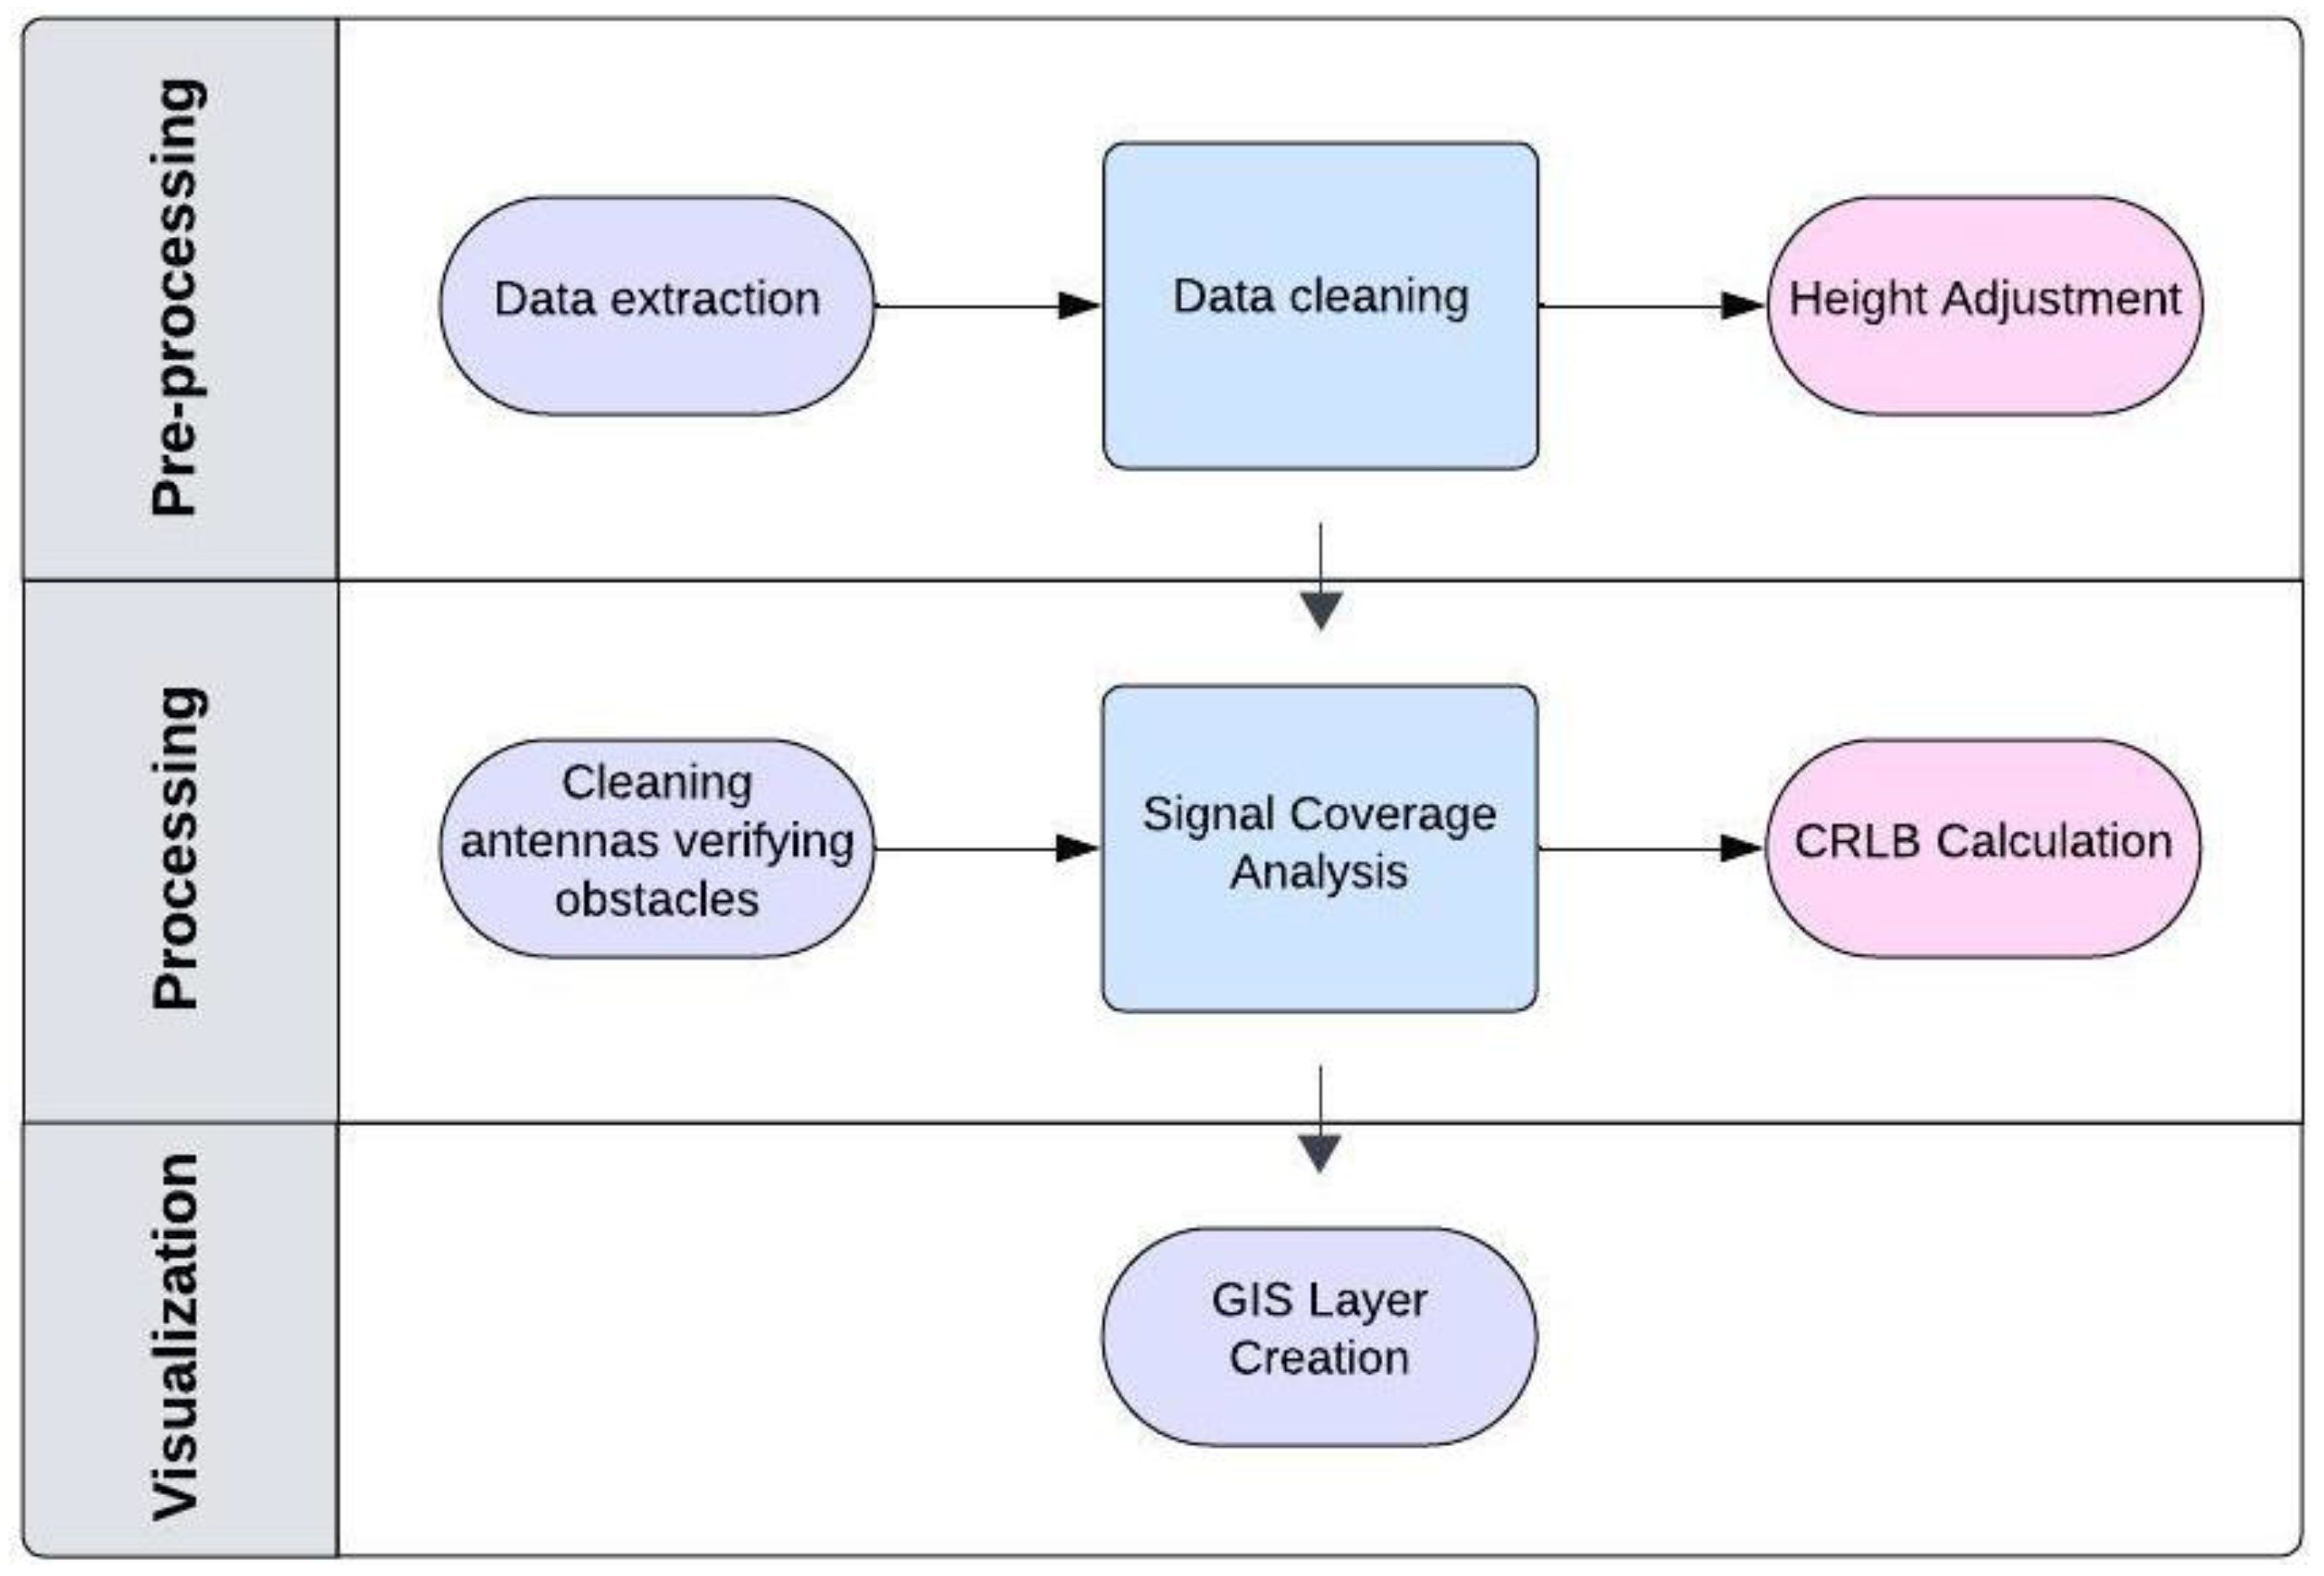
Figure 2.
Base station distribution on the study area.
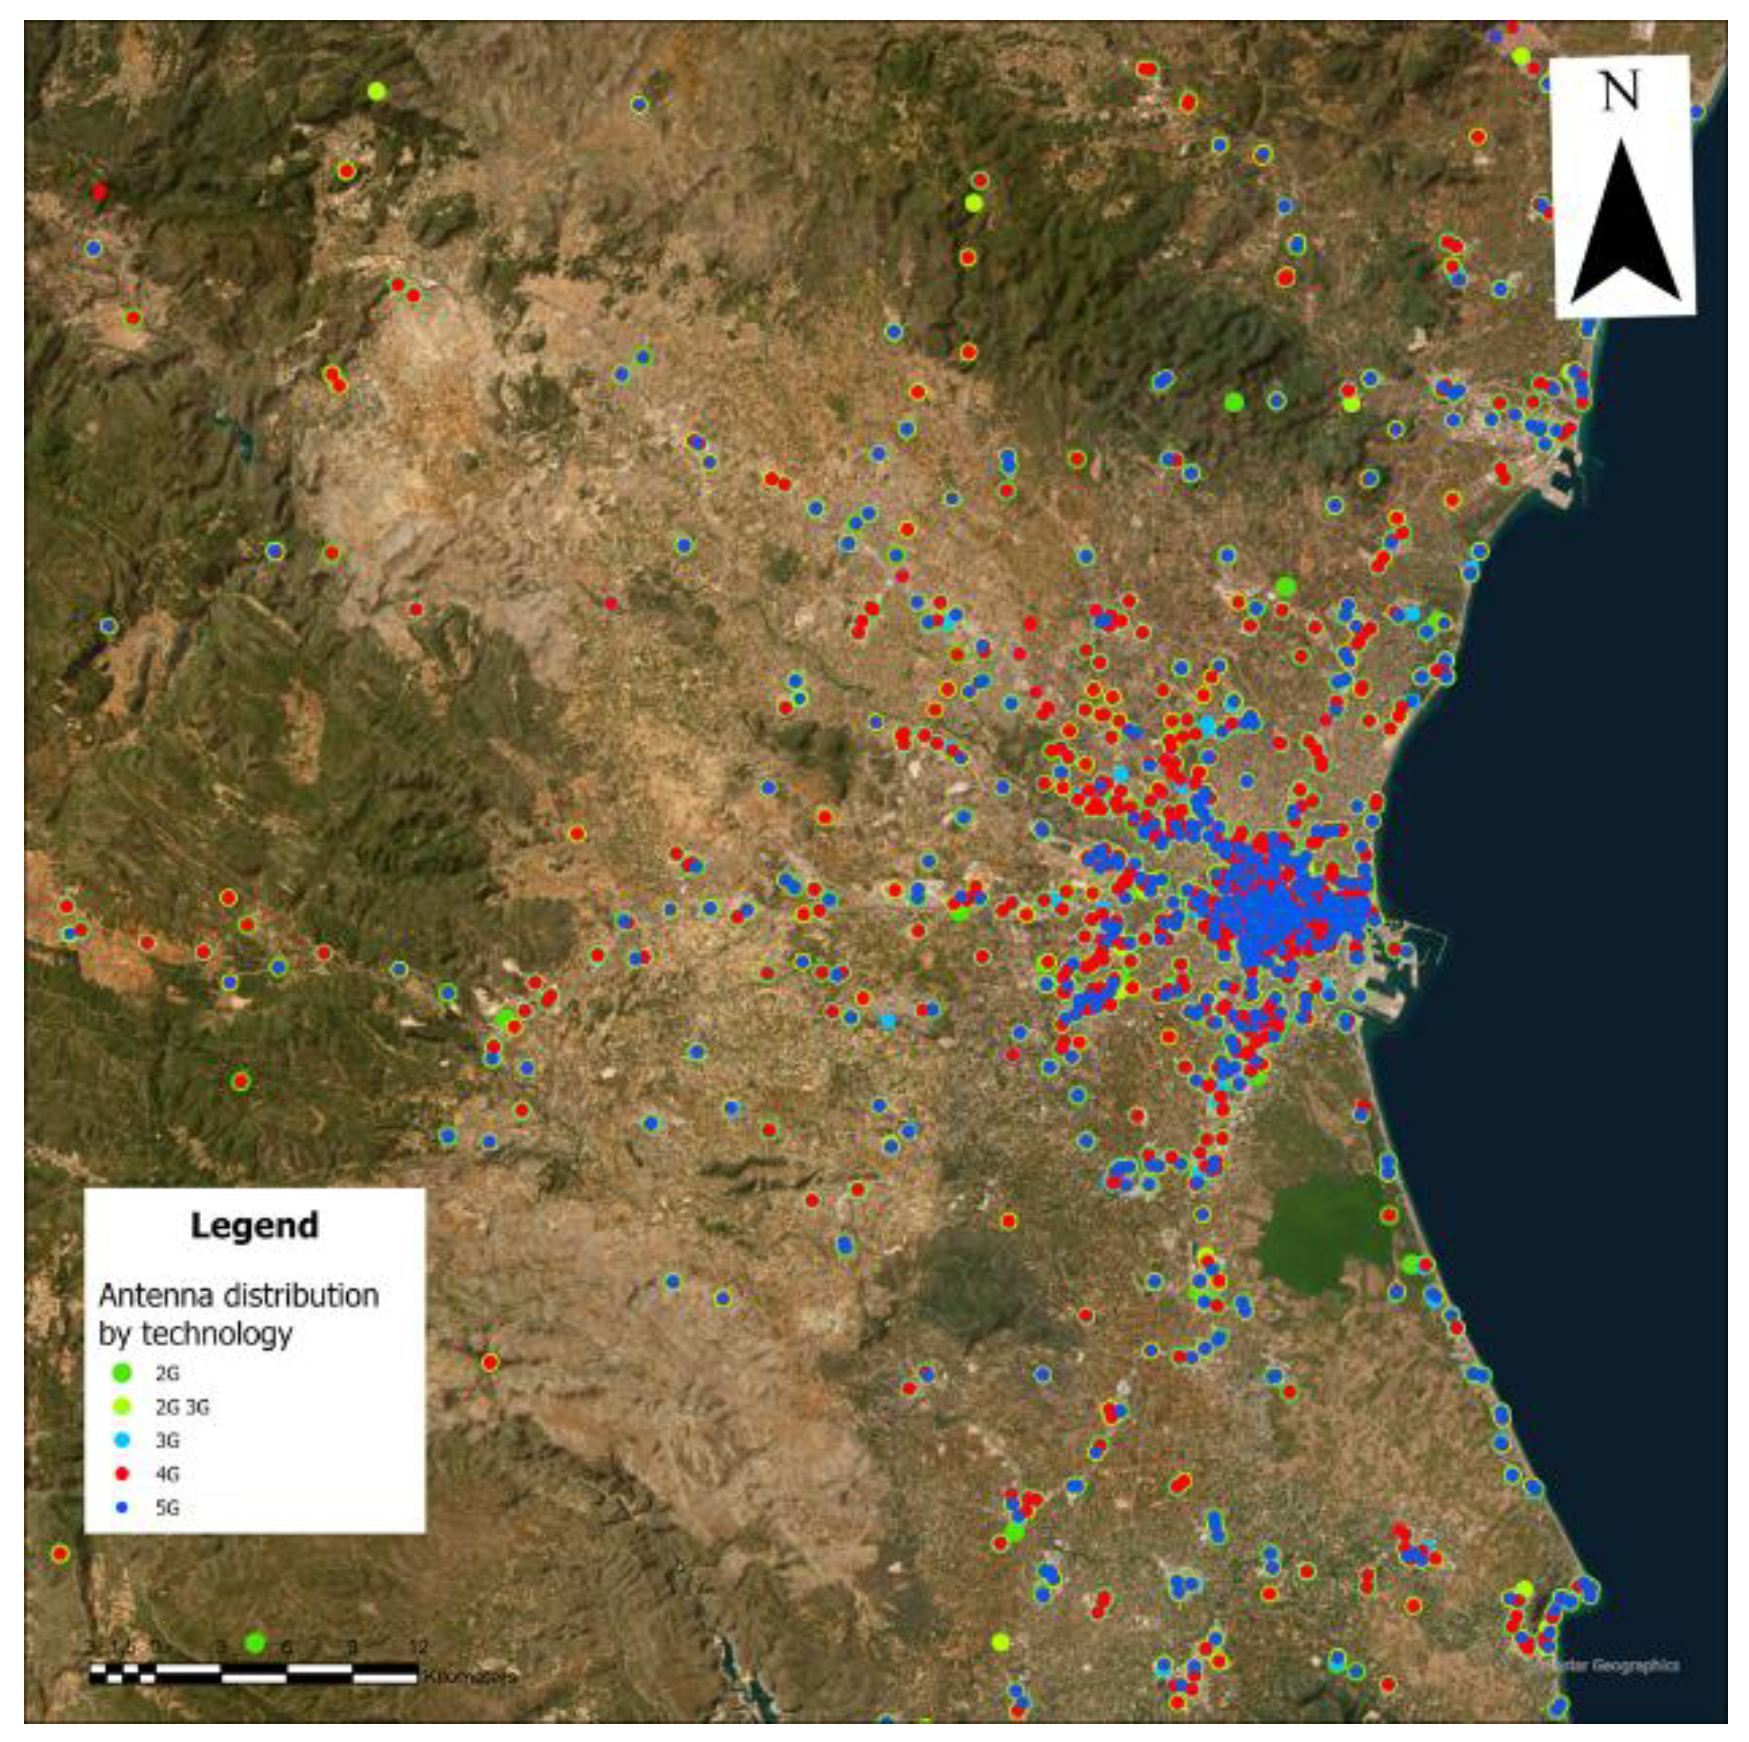
Figure 3.
Antenna distribution (a) by technology and not consolidated and (b) by company and consolidated (zoom on the area of the city’s main rail station).
Figure 3.
Antenna distribution (a) by technology and not consolidated and (b) by company and consolidated (zoom on the area of the city’s main rail station).
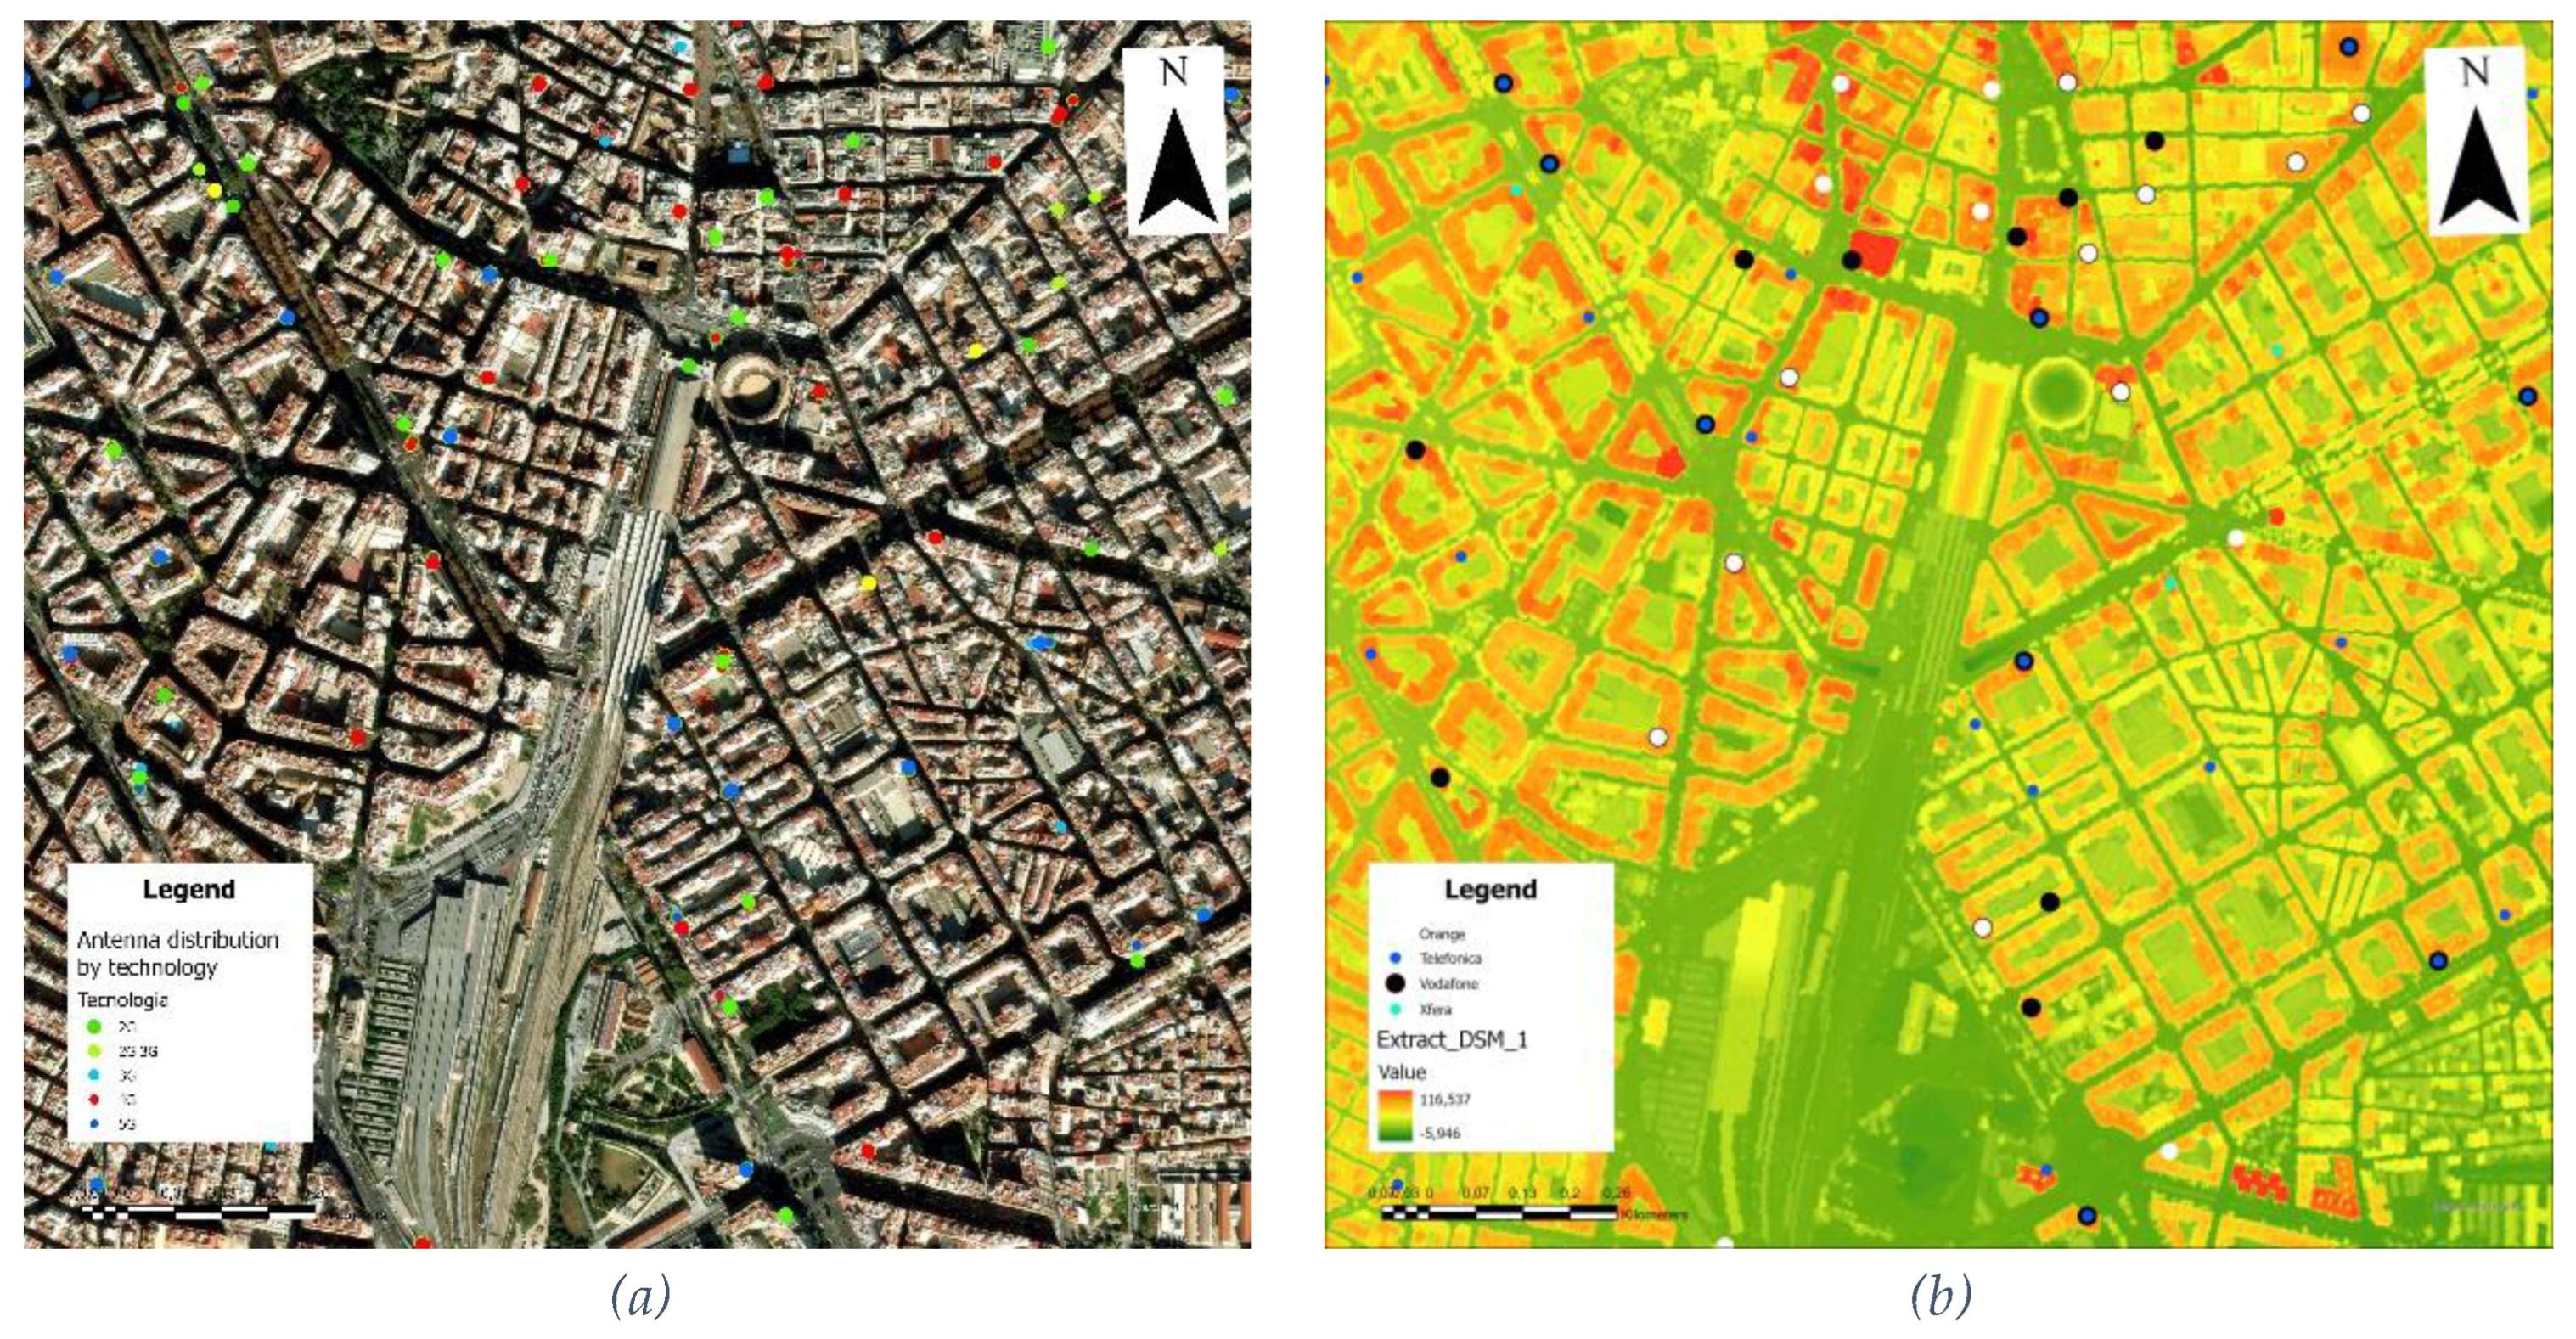
Figure 4.
Vector grid from pixel centroids.
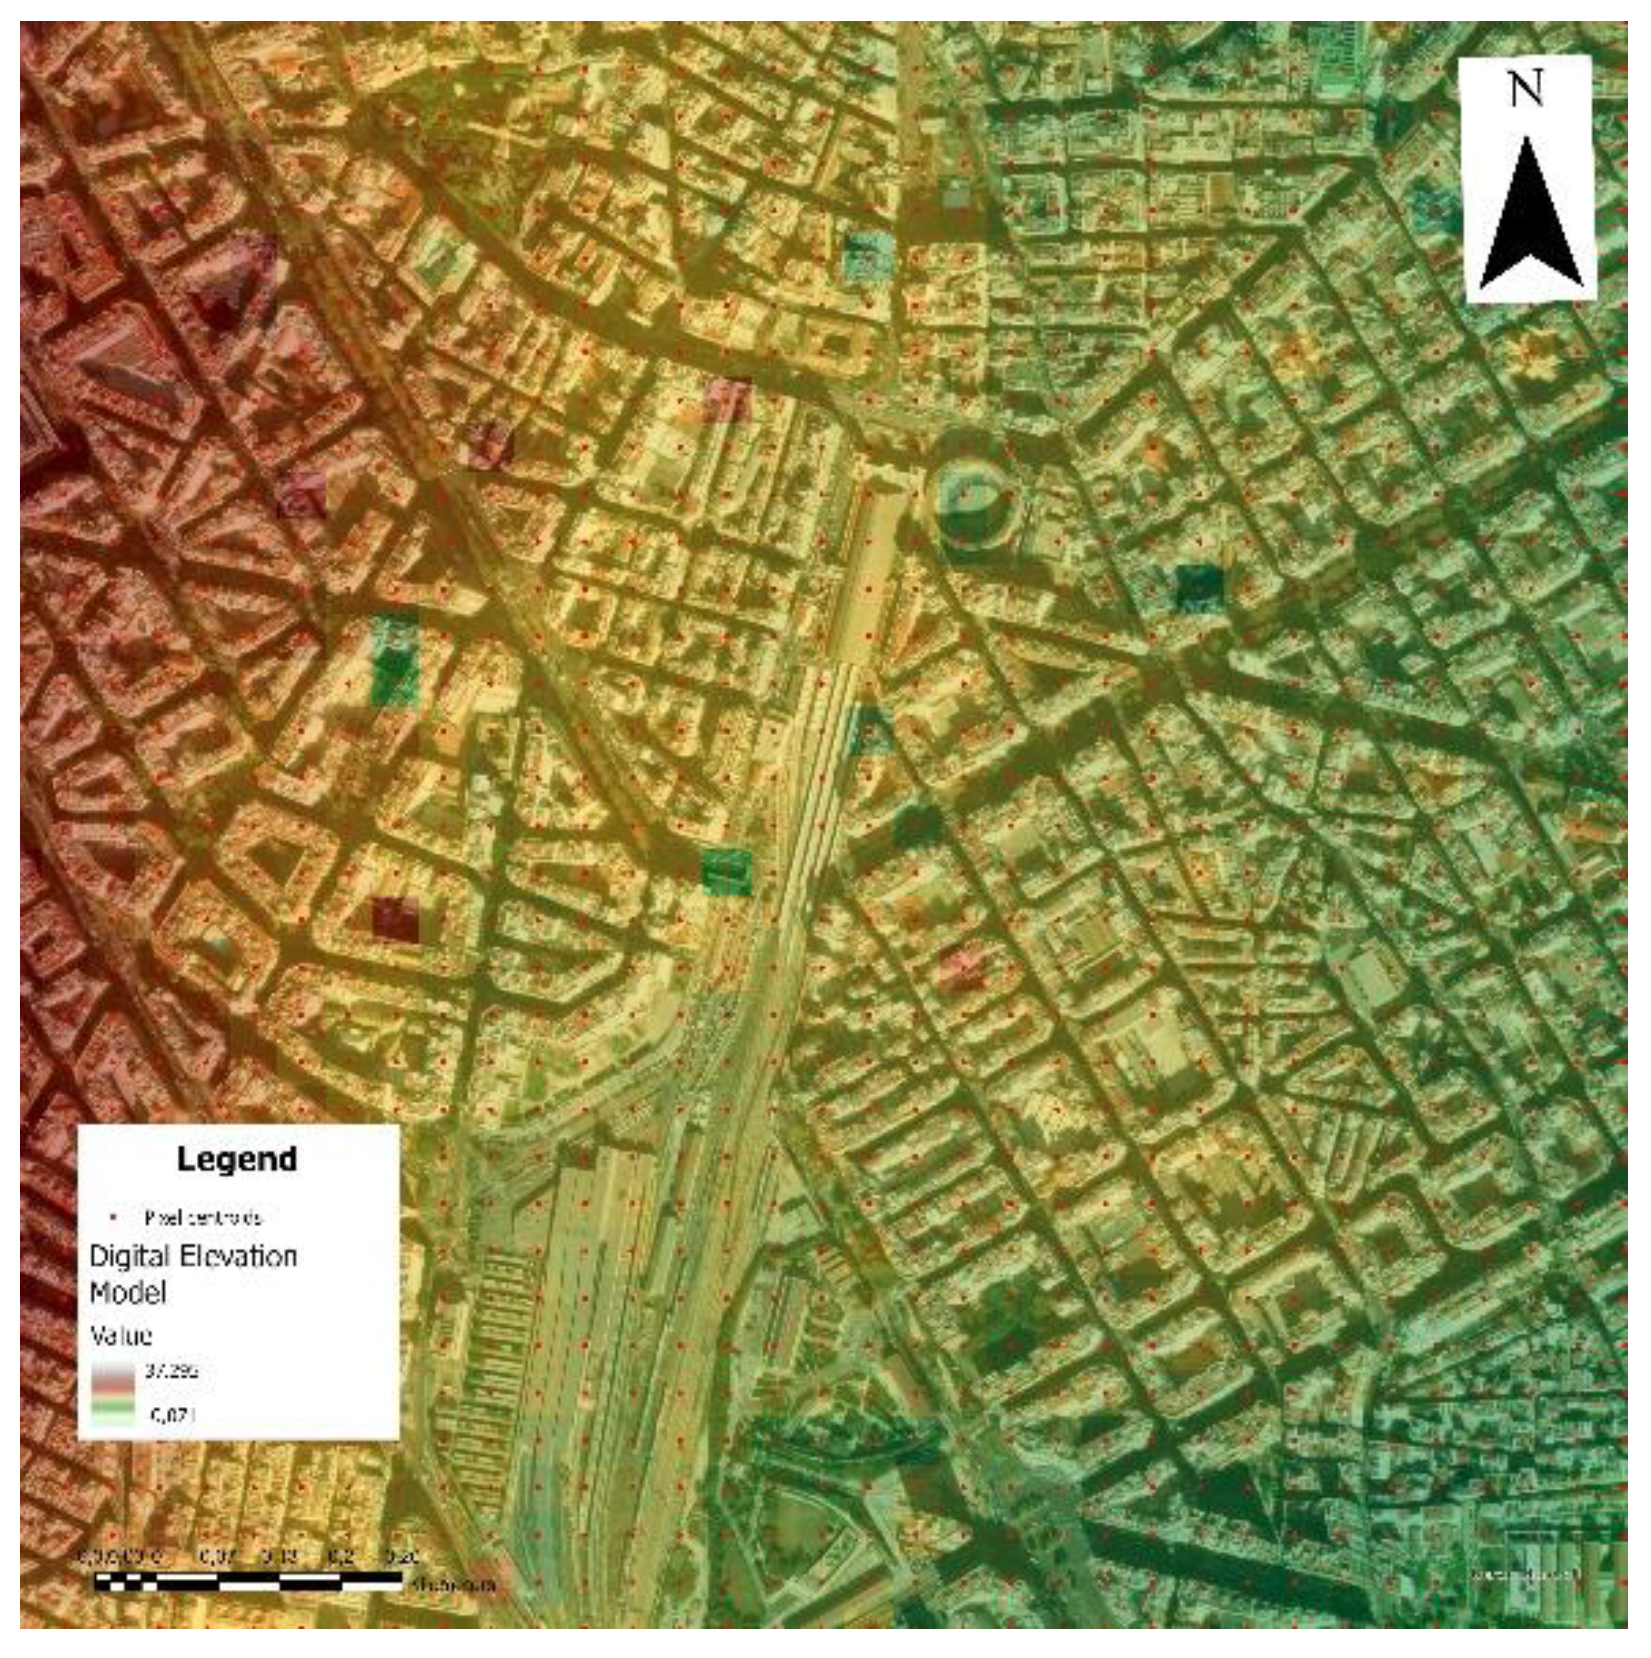
Figure 5.
Mean SNR by pixel for Orange (a) and Telefonica (b).
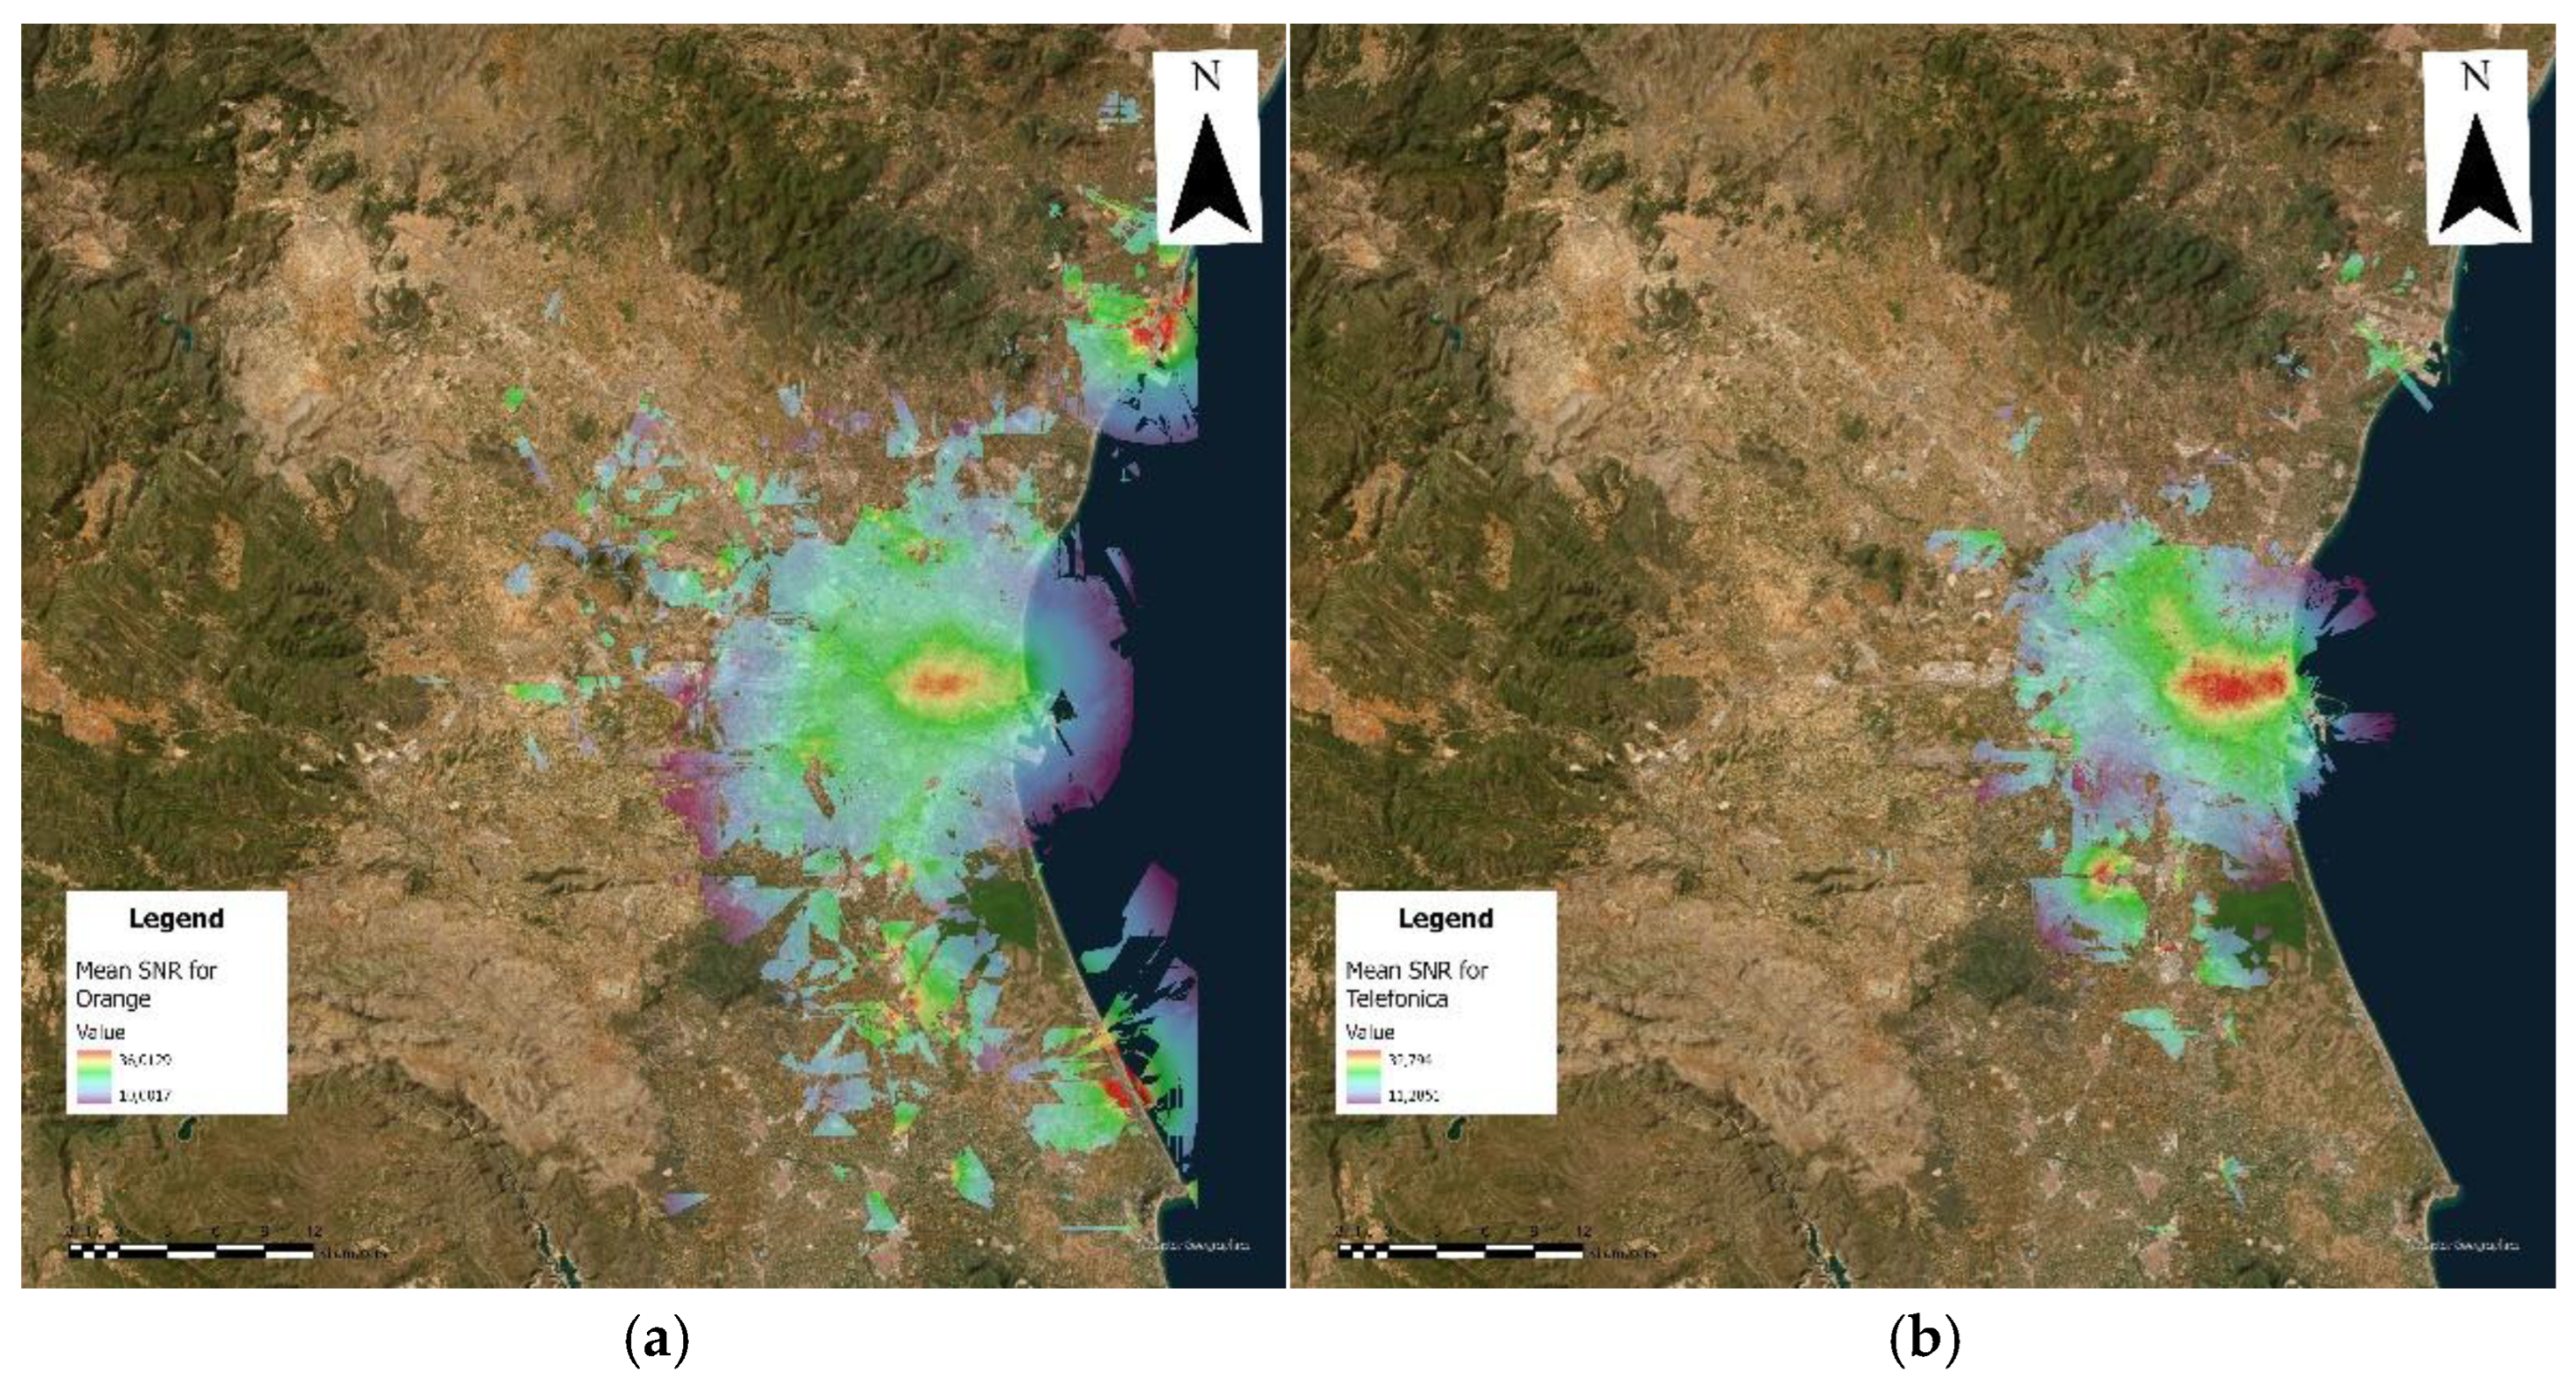
Figure 6.
Mean SNR by pixel for Vodafone (a) and Xfera (b).
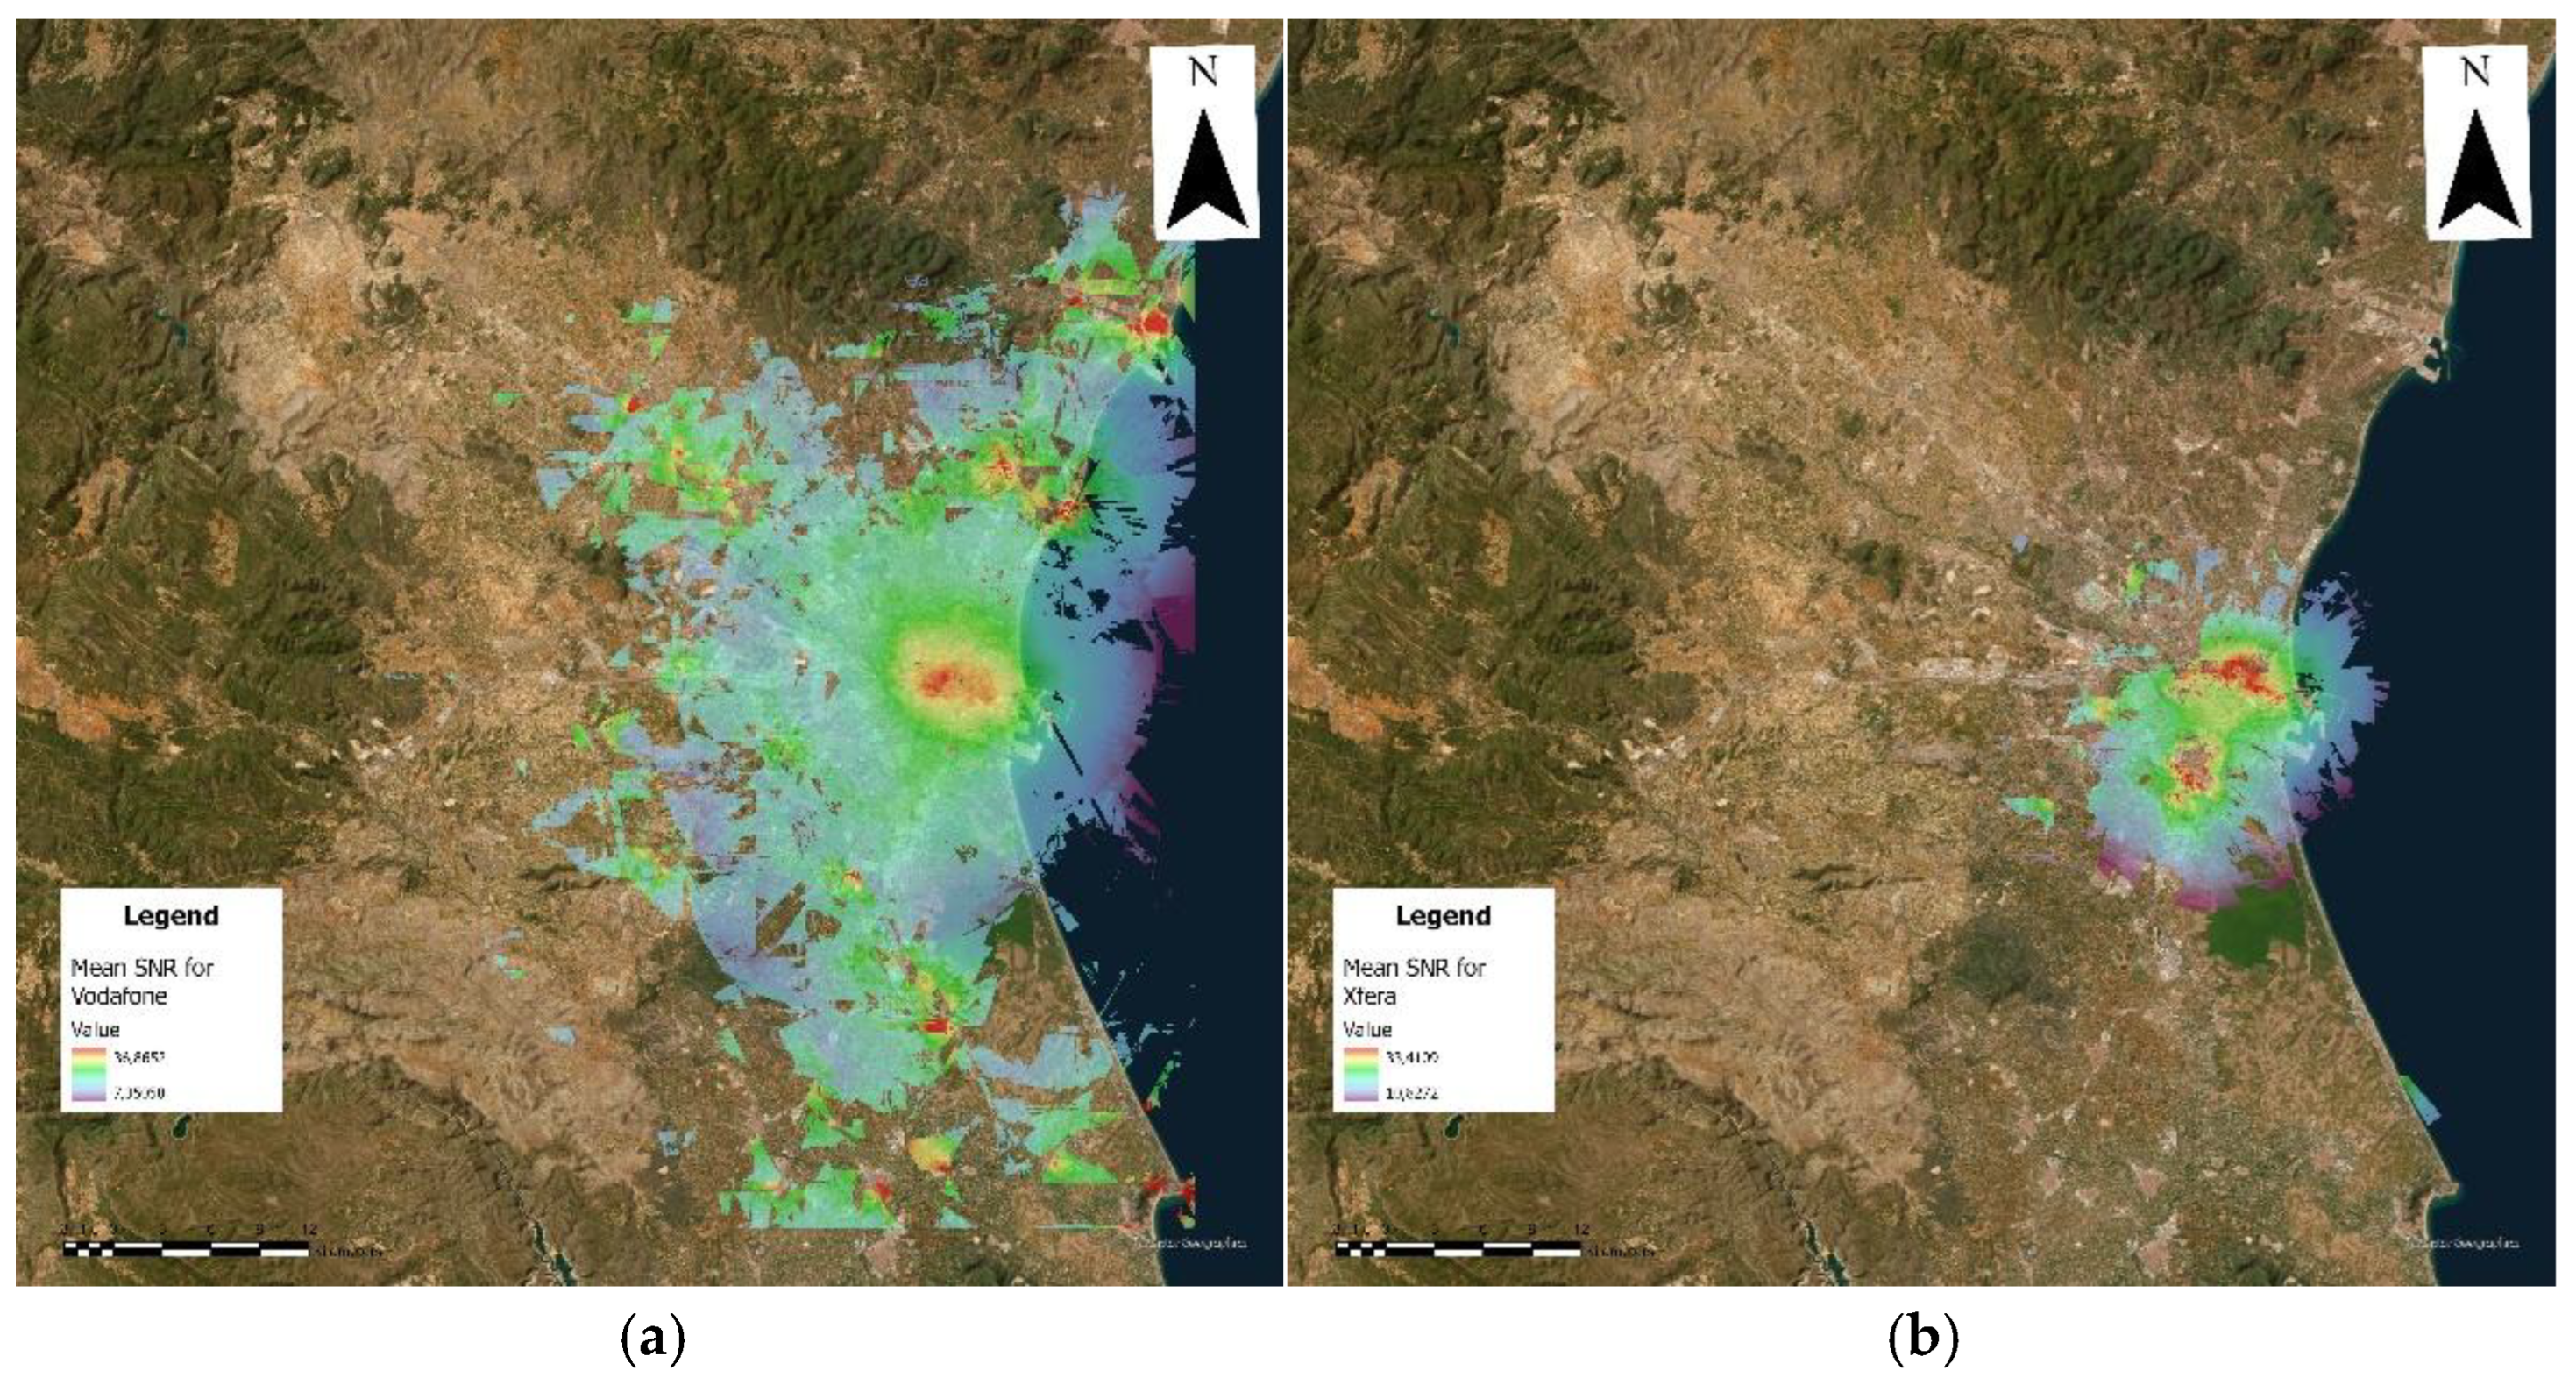
Figure 7.
The antenna selection process according to the developed algorithm.
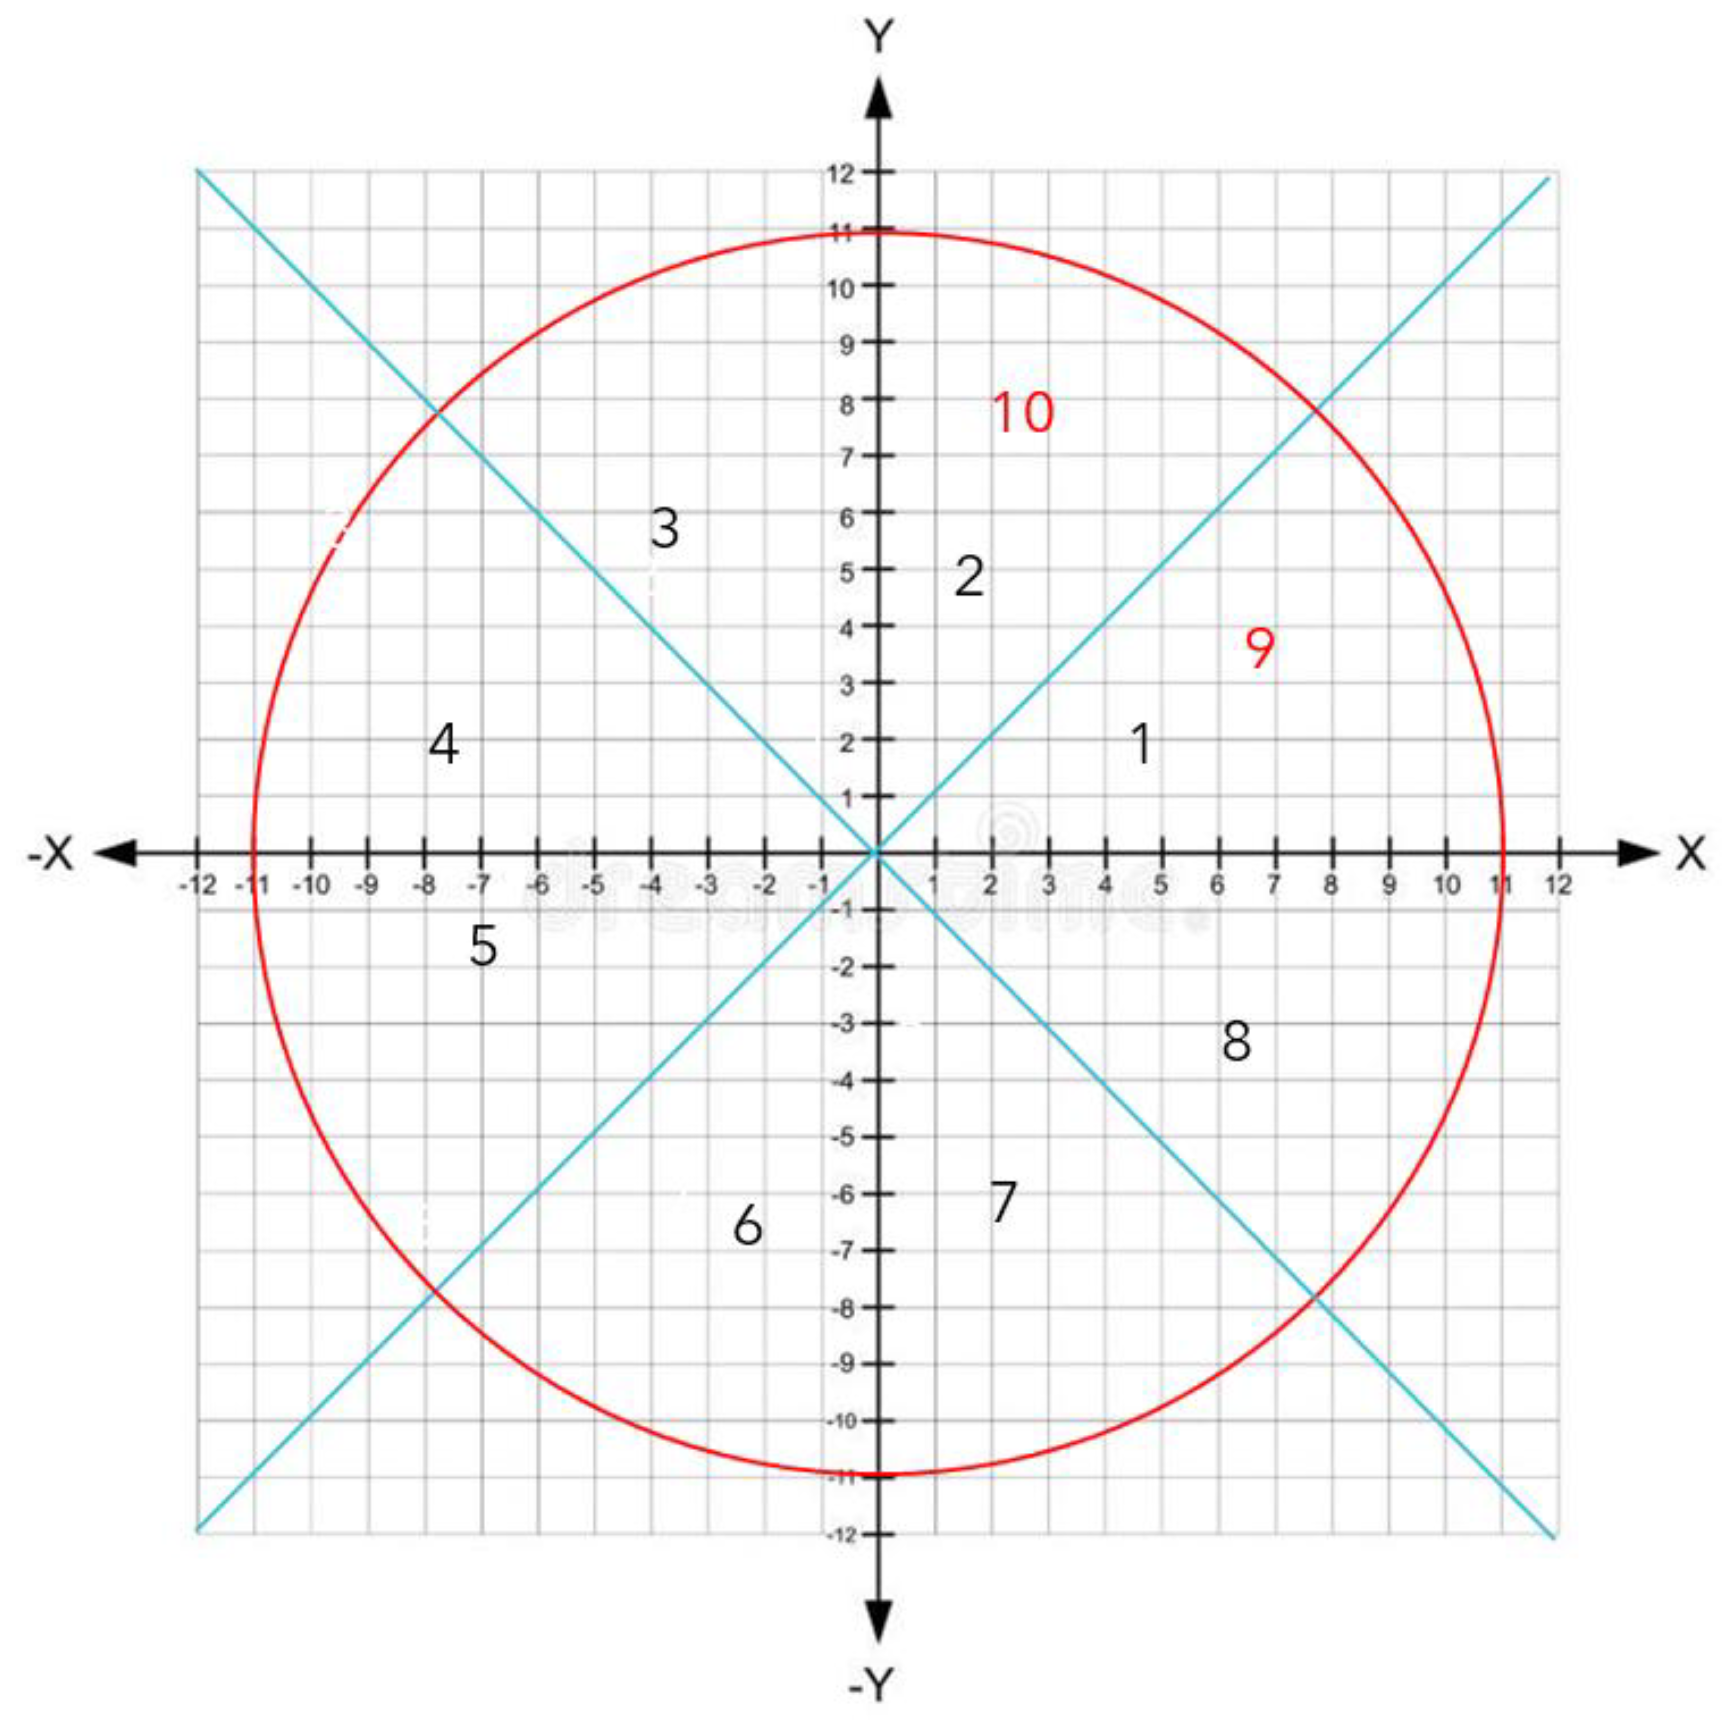
Figure 8.
Number of antennas visible for 4G by pixel for Orange (a) and for Telefonica (b).
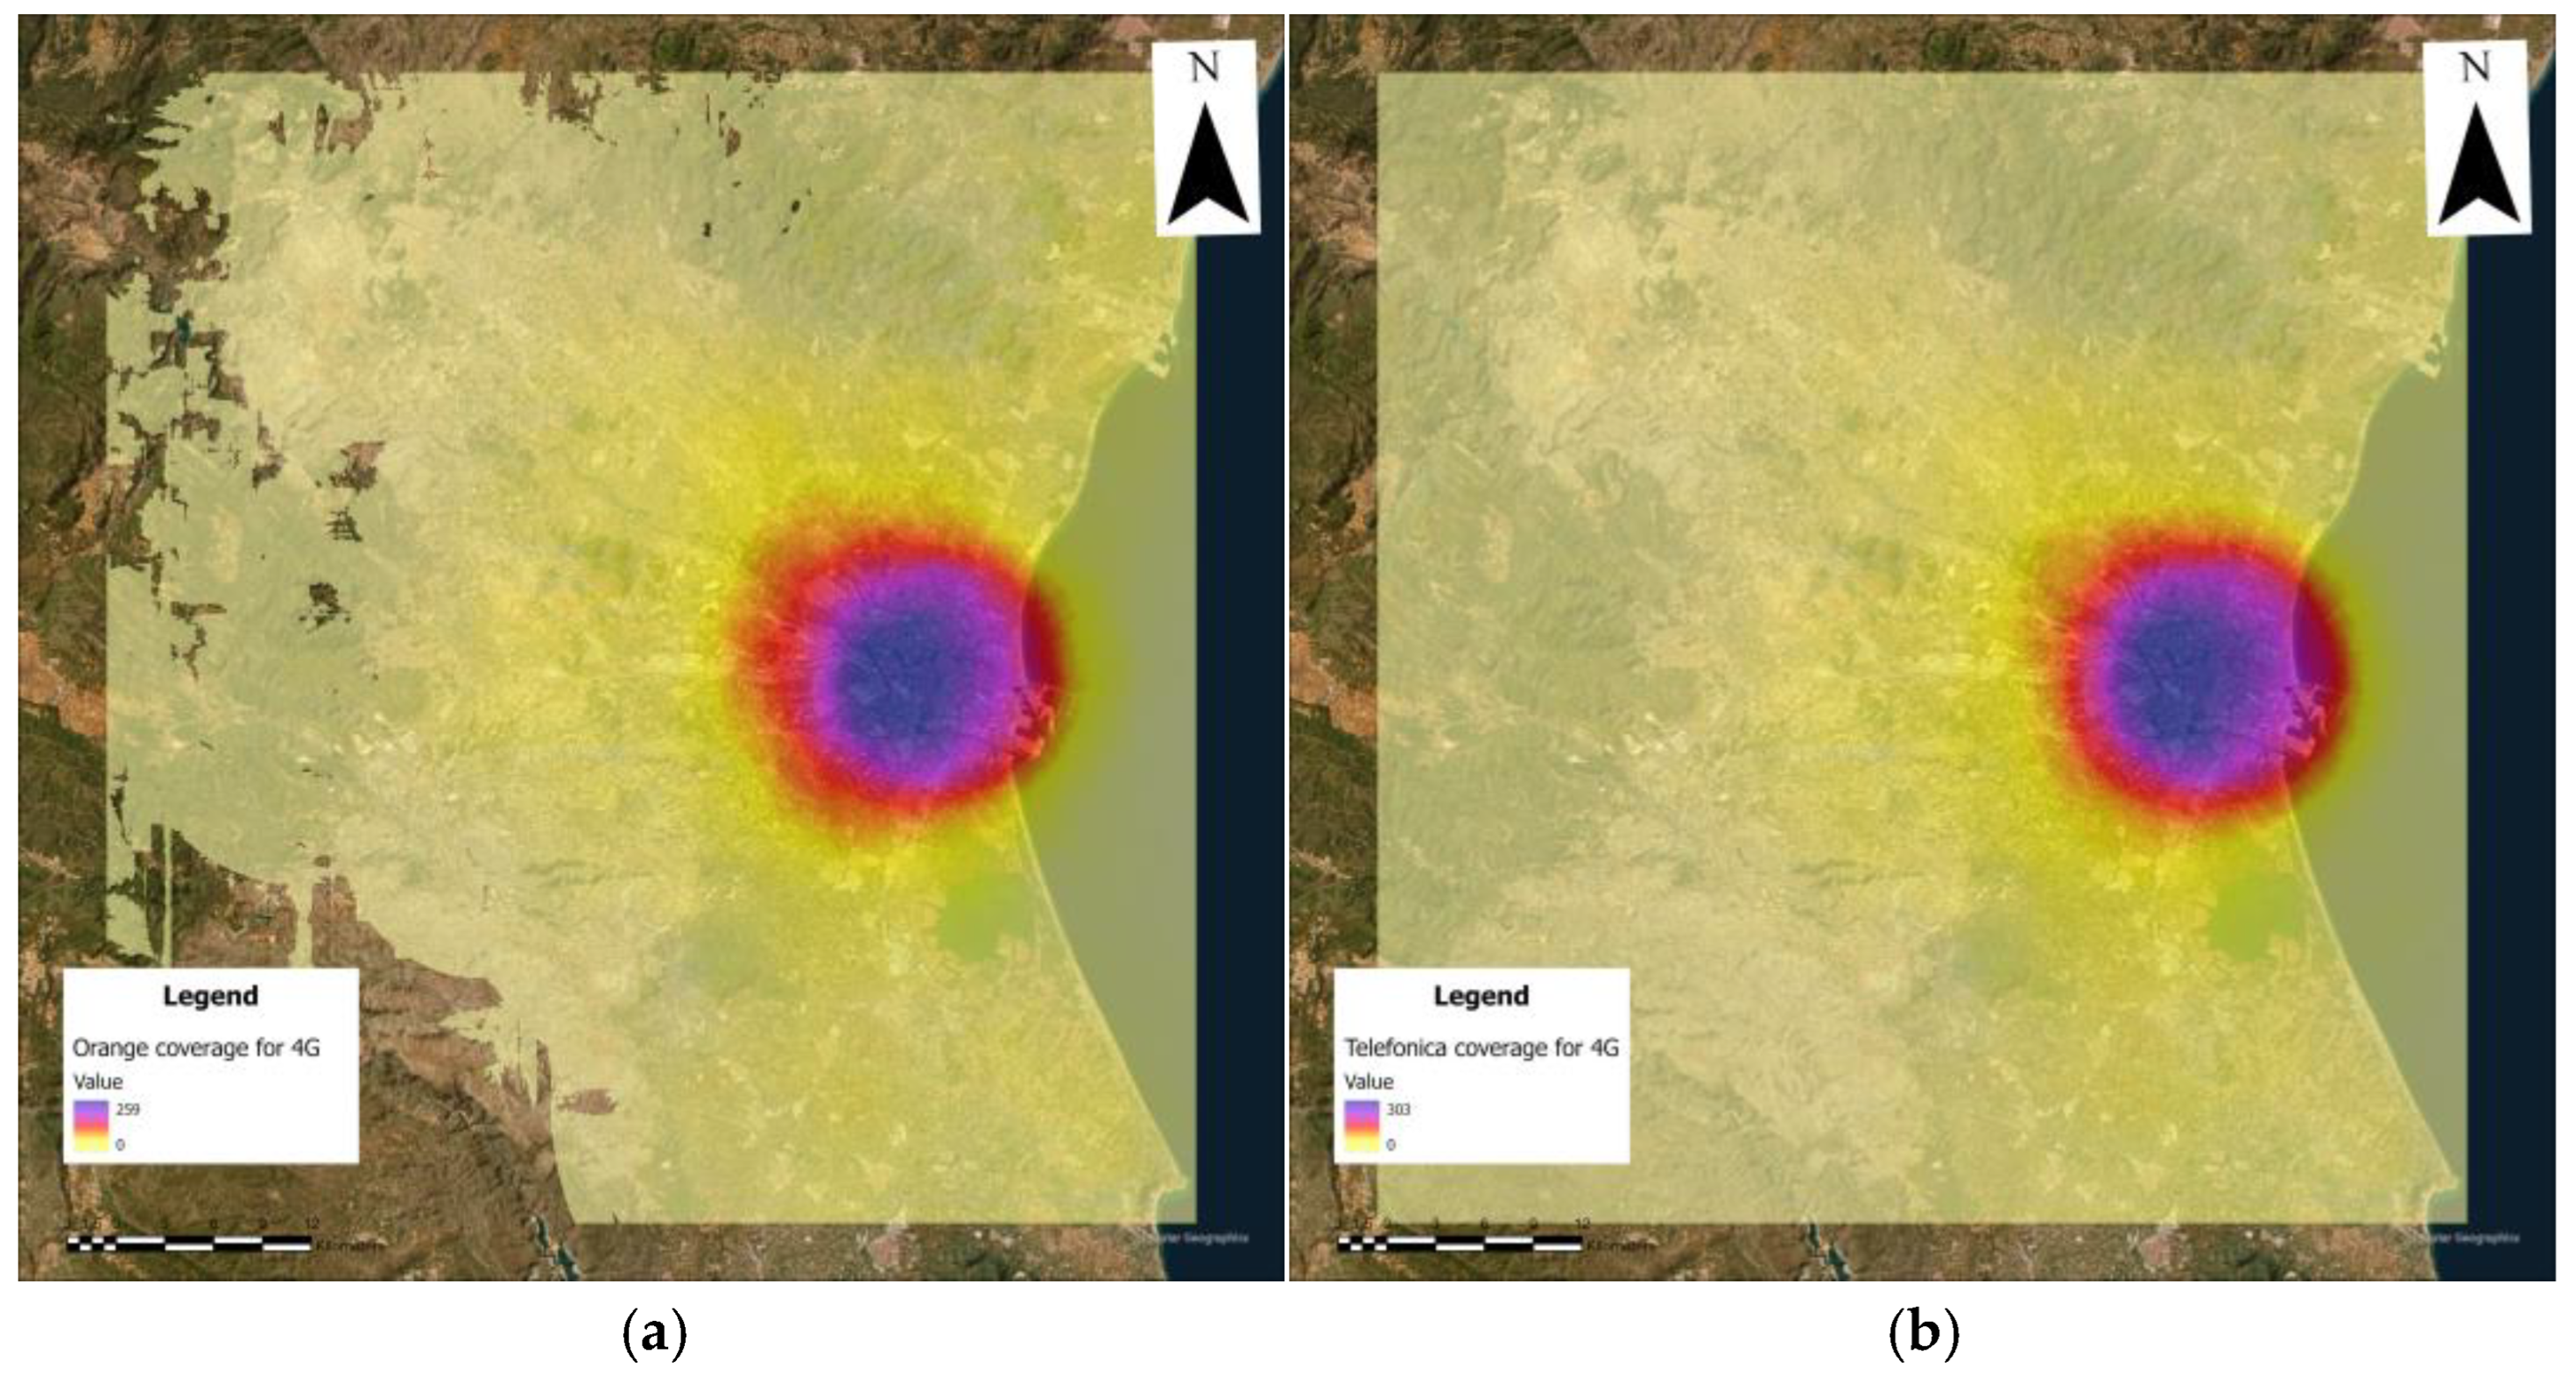
Figure 9.
Number of antennas visible for 4G by pixel for Vodafone (a) and for Xfera (b).
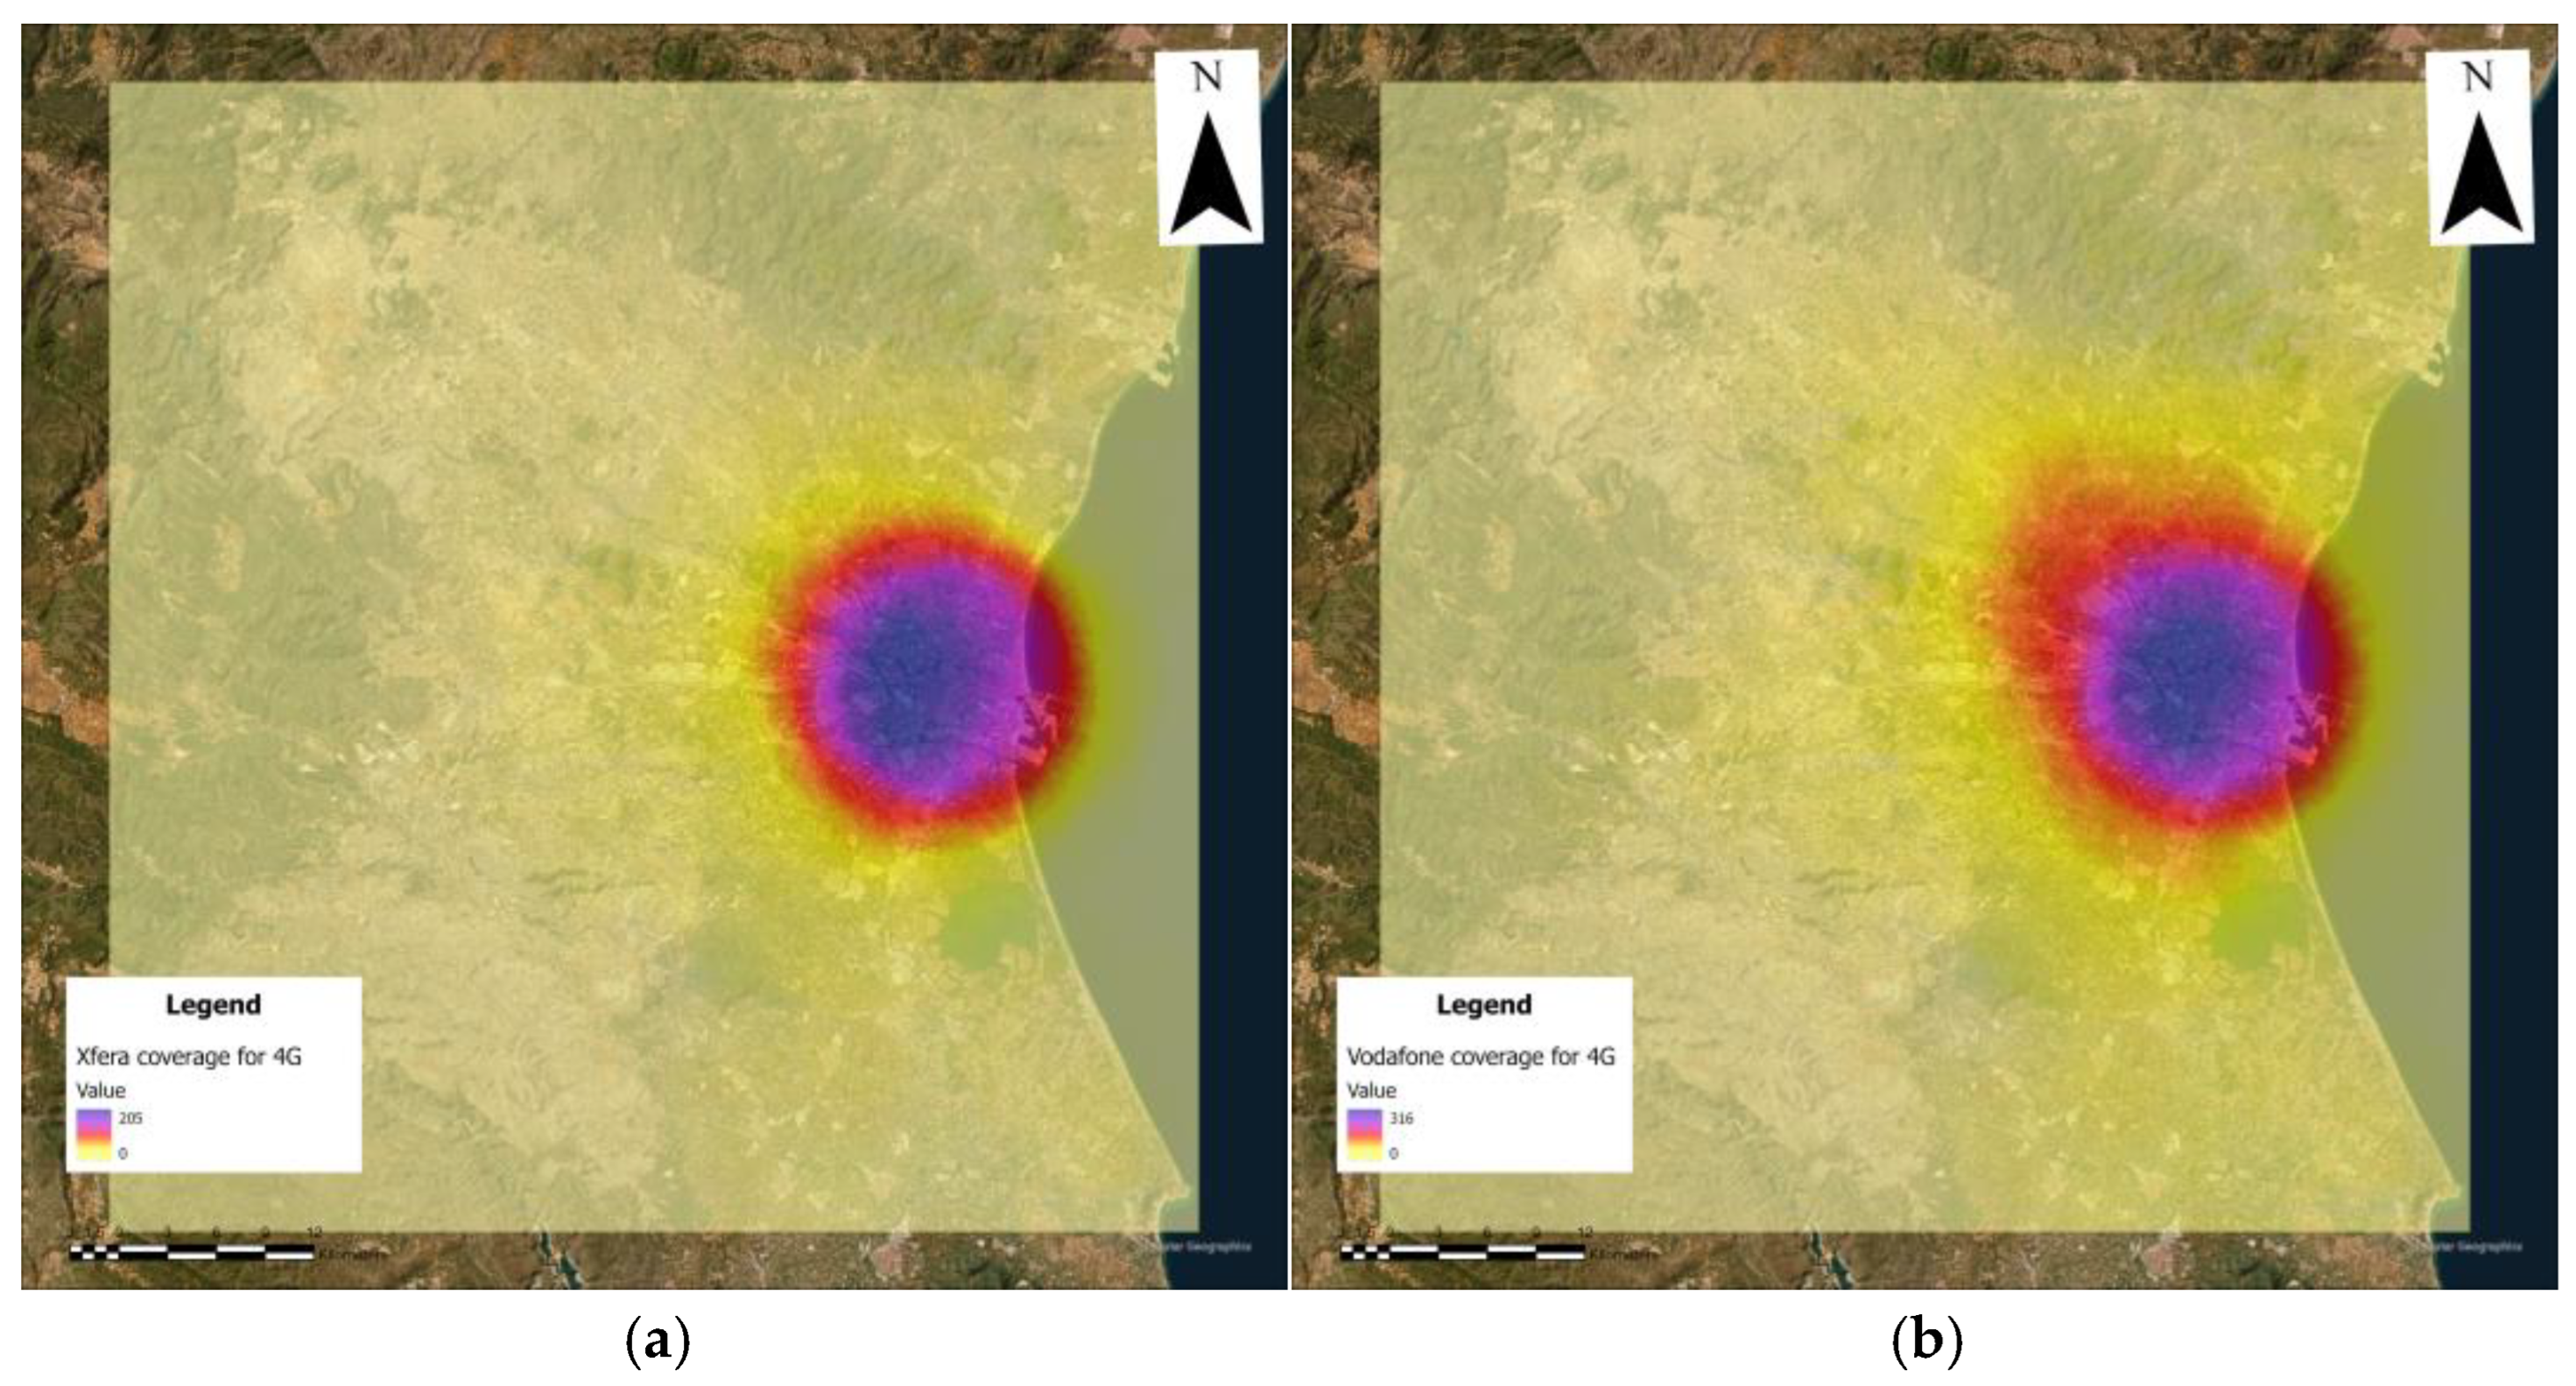
Figure 10.
Number of antennas visible for 5G by pixel for Orange (a) and for Telefonica (b).
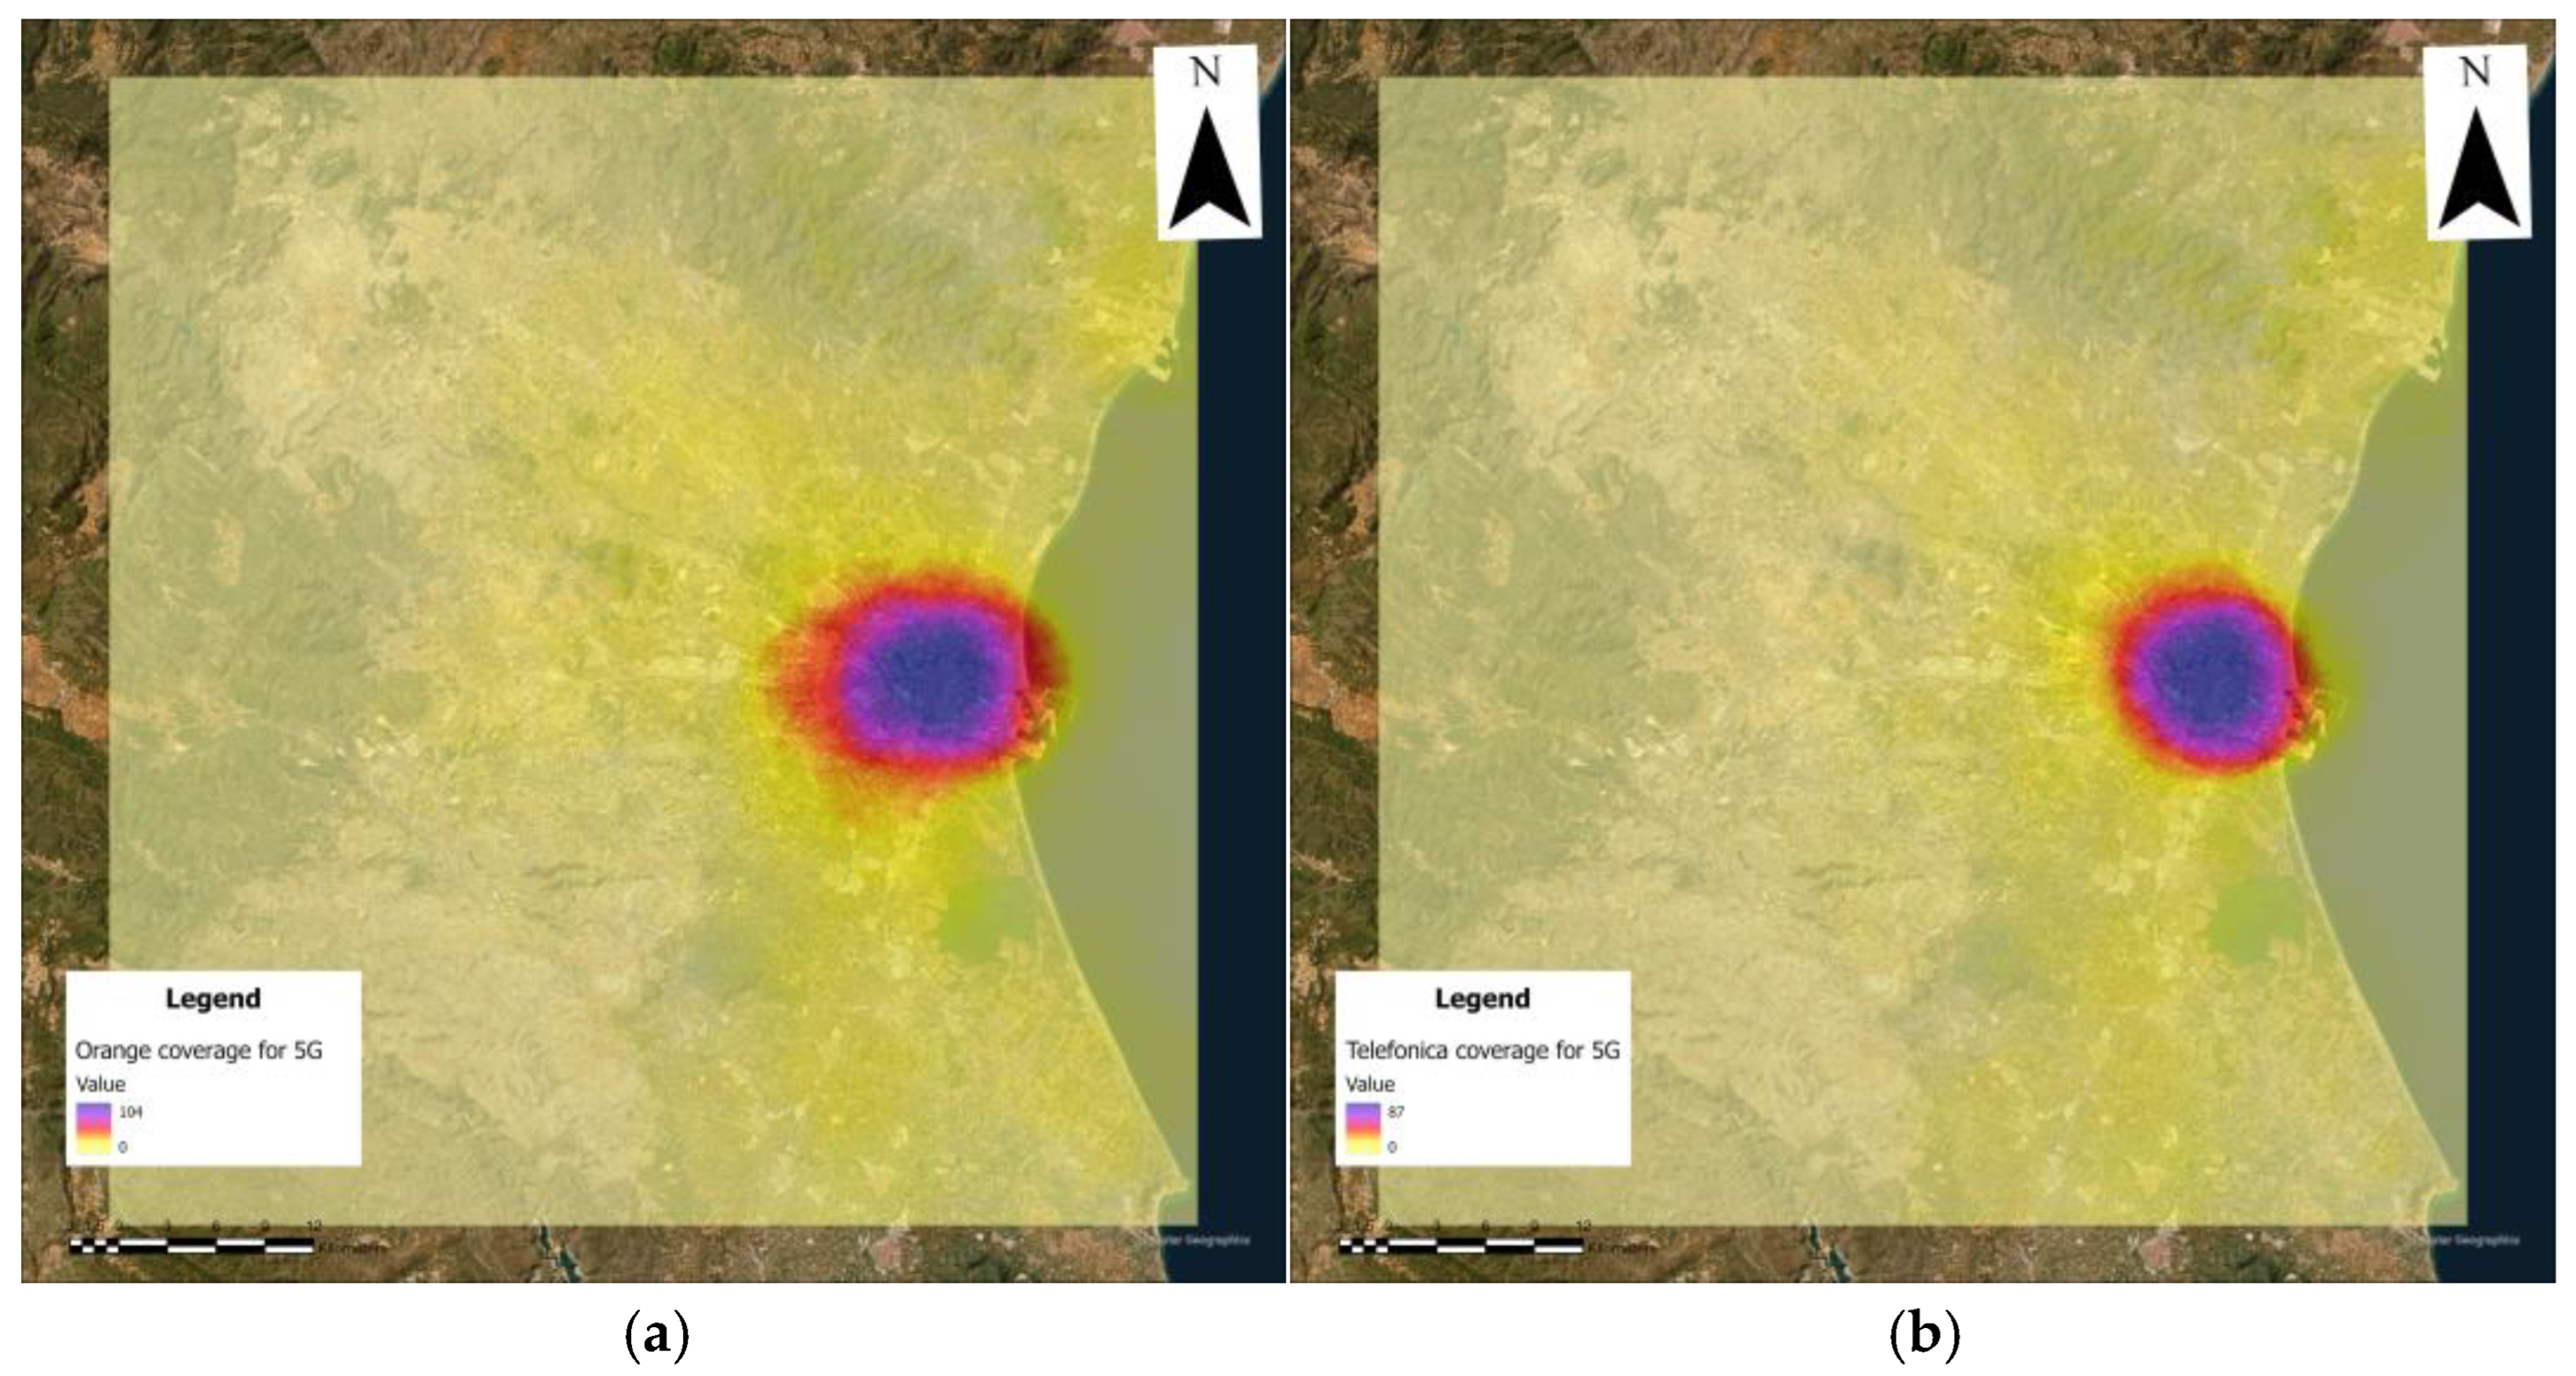
Figure 11.
Number of antennas visible for 5G by pixel for Vodafone (a) and for Xfera (b).
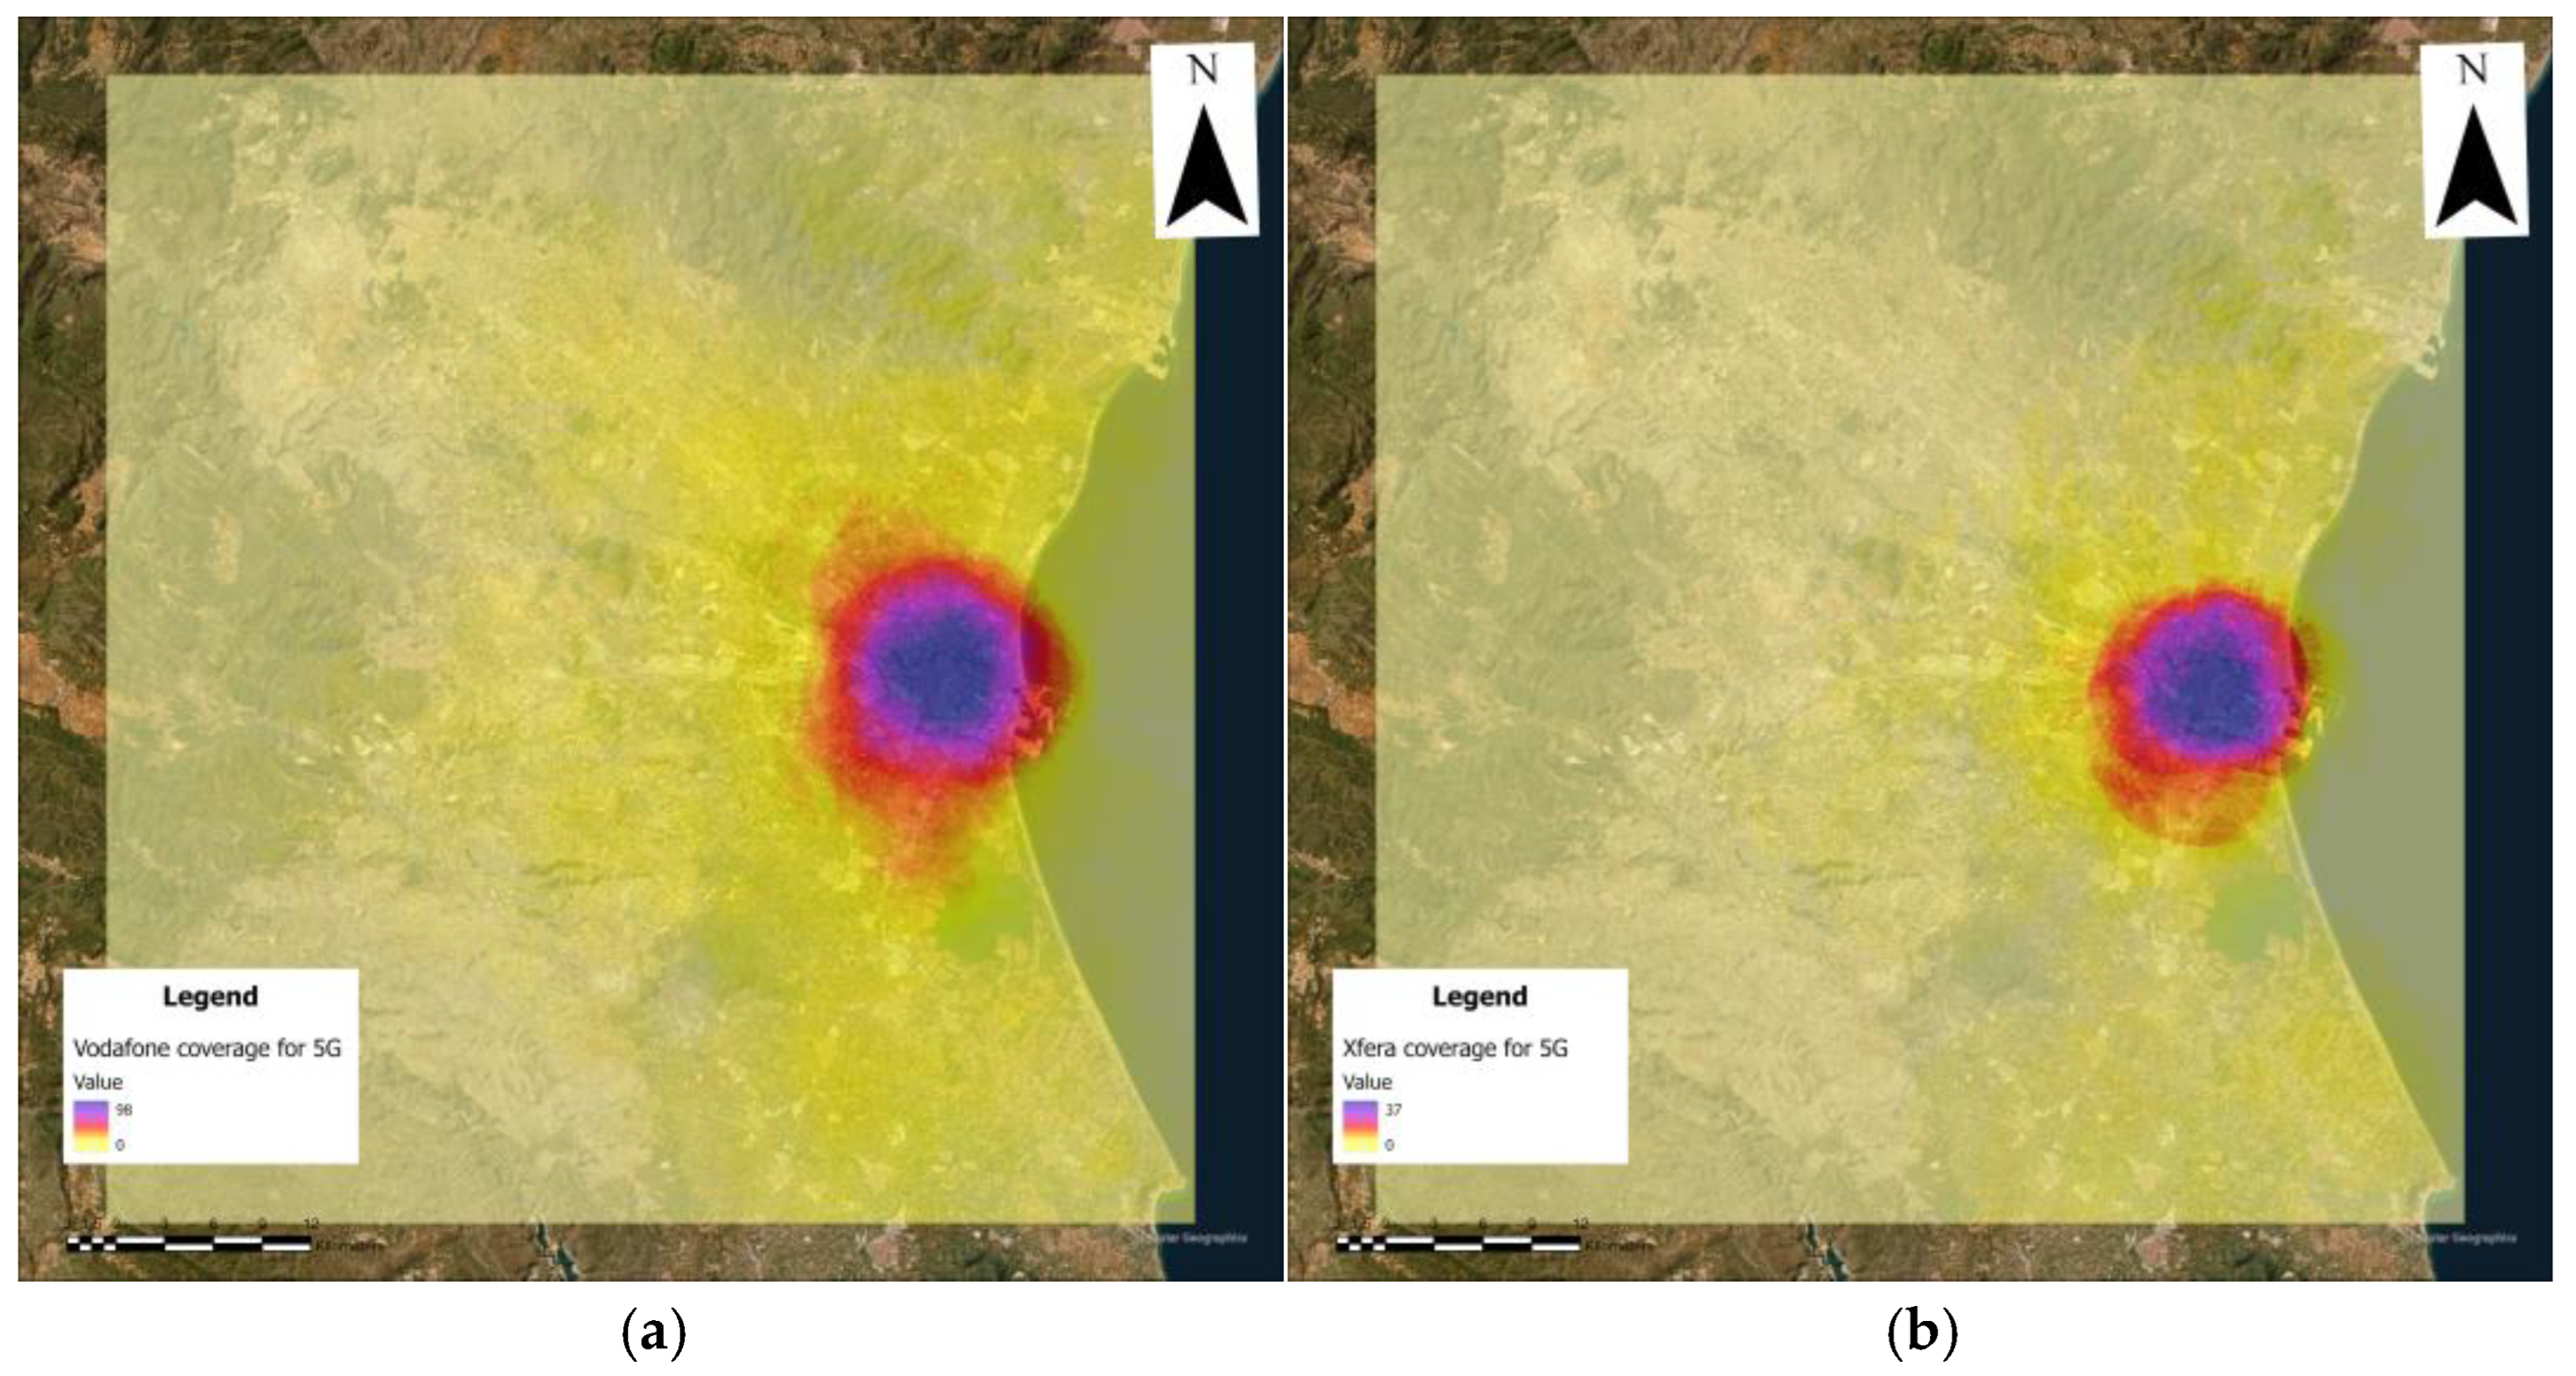
Figure 12.
CRLB calculation by pixel for Orange (a) and for Telefonica (b).
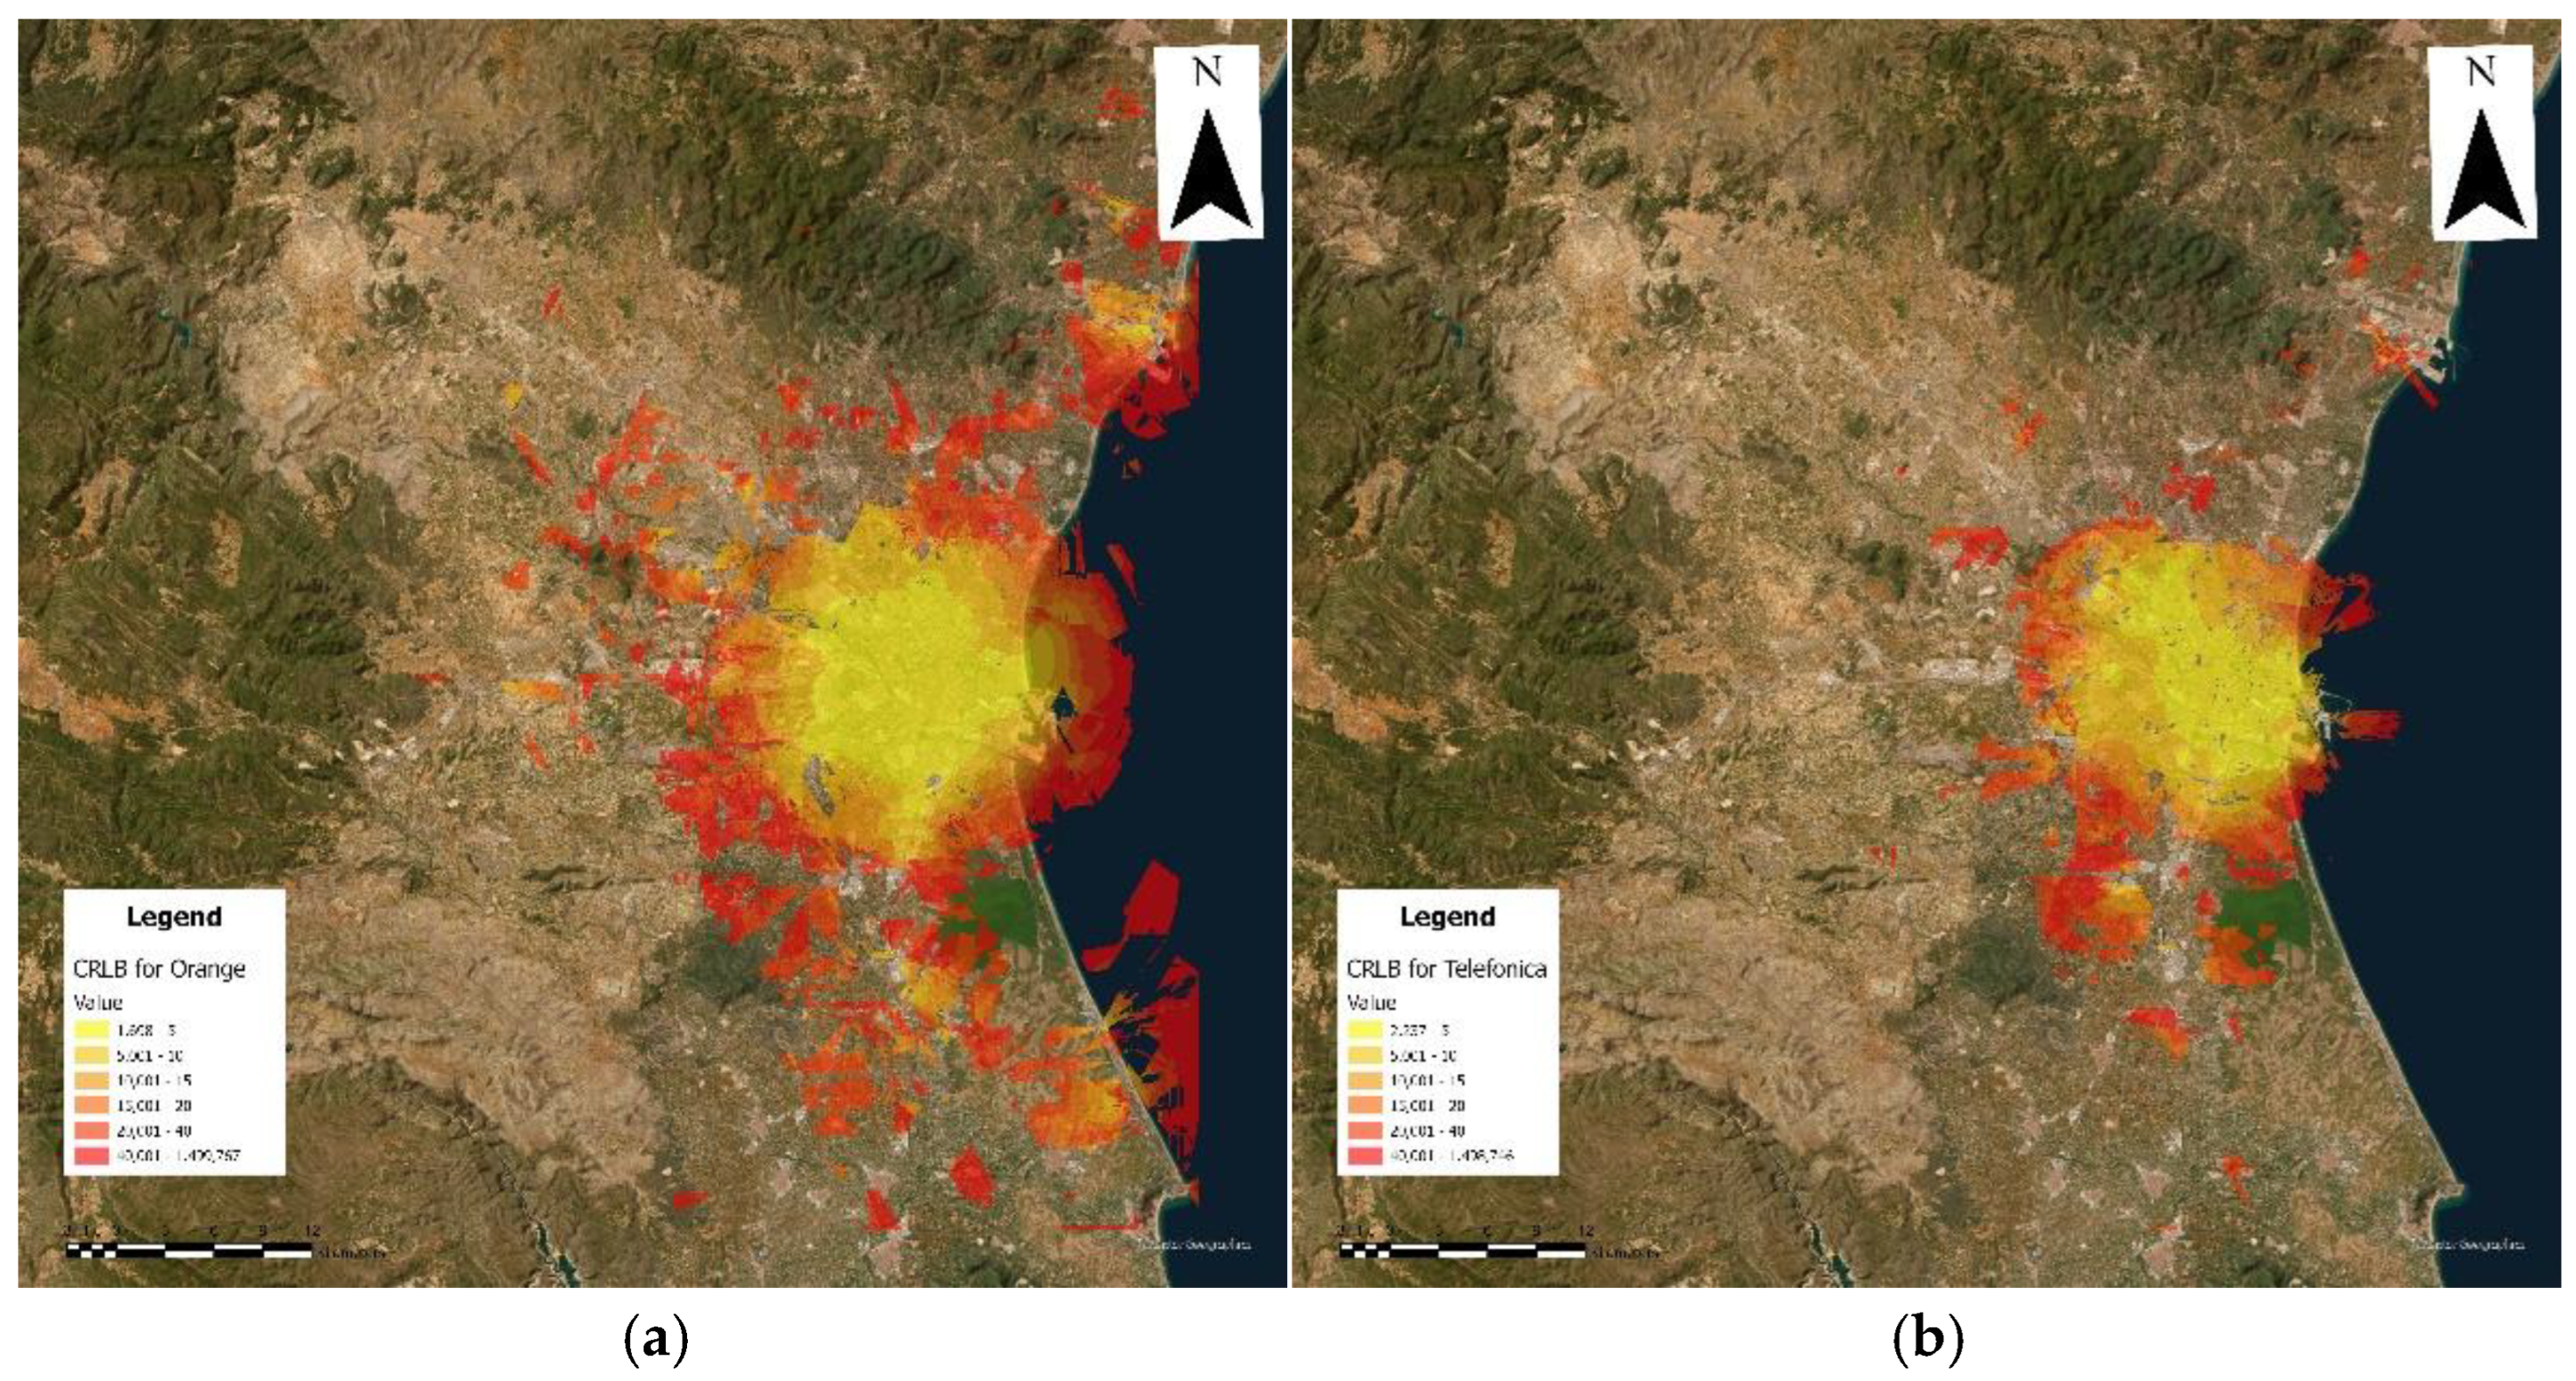
Figure 13.
CRLB calculation by pixel for Vodafone (a) and for Xfera (b).
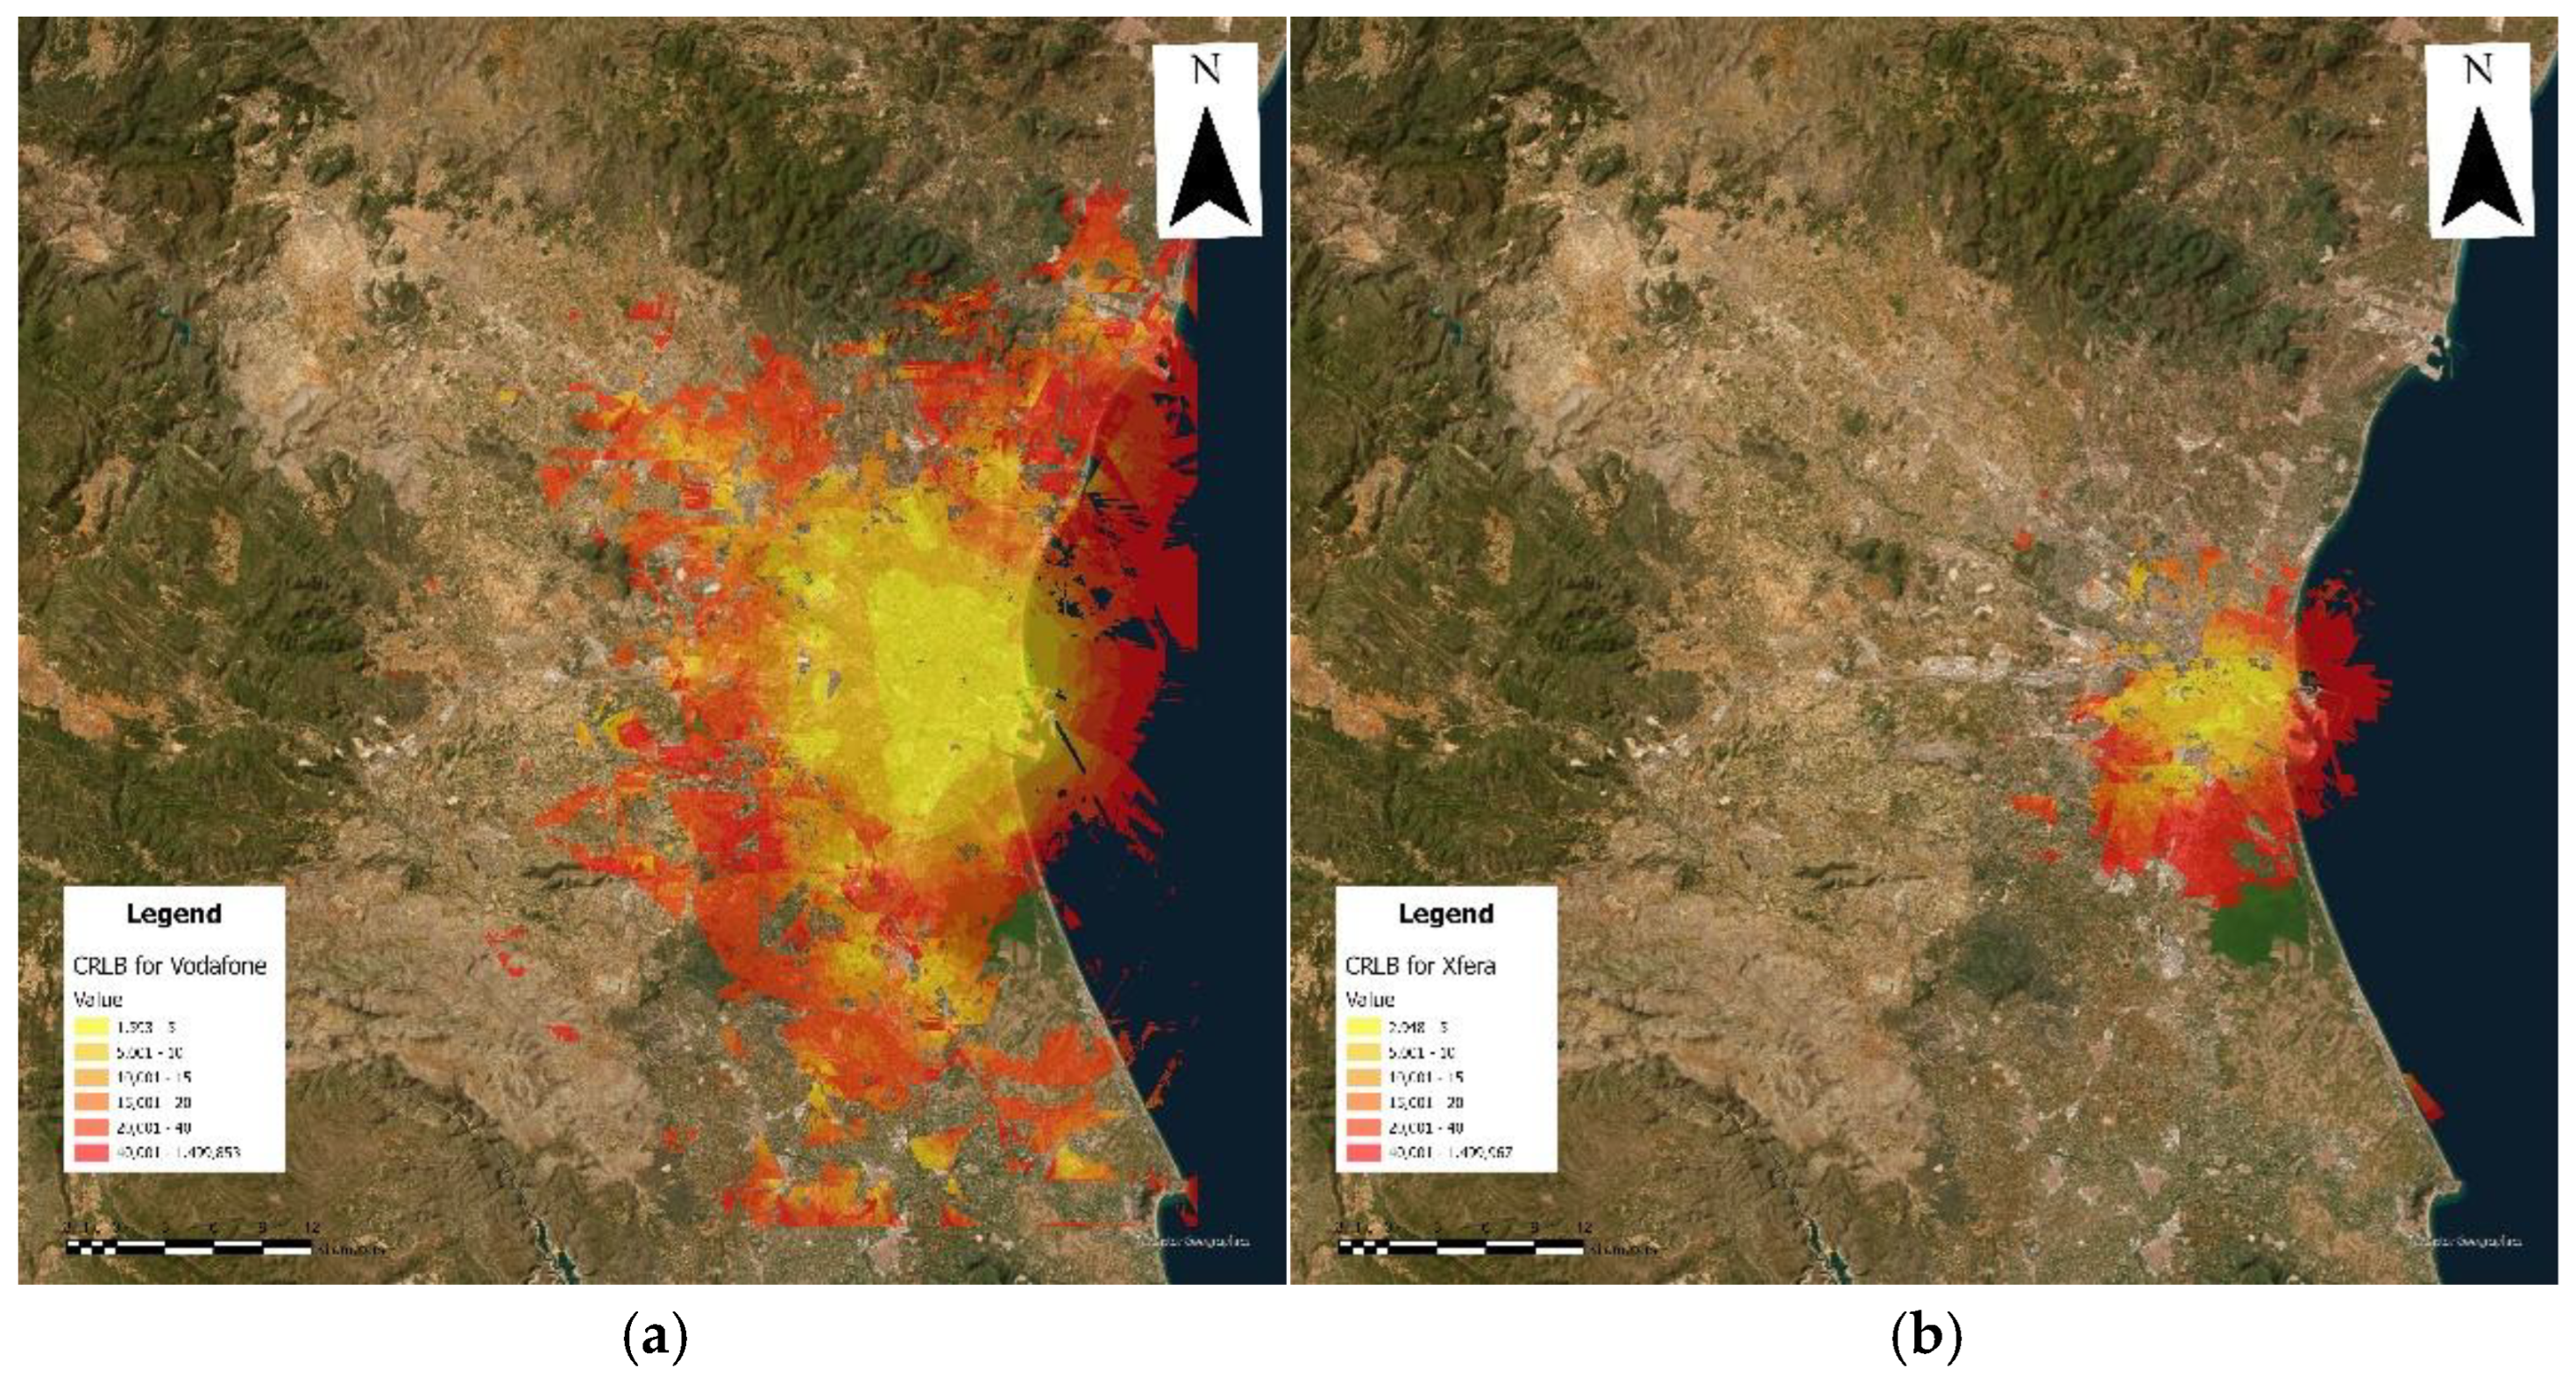

Table 1.
Summary of maximum antennas per pixel and distribution by company and technology.
| 4G max per pixel | 5G max per pixel | 4G Tot | 5G tot | |
|---|---|---|---|---|
| Orange | 259 | 104 | 493 | 222 |
| Telefonica | 303 | 87 | 501 | 182 |
| Vodafone | 316 | 98 | 597 | 223 |
| Xfera | 205 | 37 | 304 | 73 |
Disclaimer/Publisher’s Note: The statements, opinions and data contained in all publications are solely those of the individual author(s) and contributor(s) and not of MDPI and/or the editor(s). MDPI and/or the editor(s) disclaim responsibility for any injury to people or property resulting from any ideas, methods, instructions or products referred to in the content. |
© 2025 by the authors. Licensee MDPI, Basel, Switzerland. This article is an open access article distributed under the terms and conditions of the Creative Commons Attribution (CC BY) license (http://creativecommons.org/licenses/by/4.0/).
Copyright: This open access article is published under a Creative Commons CC BY 4.0 license, which permit the free download, distribution, and reuse, provided that the author and preprint are cited in any reuse.


