
Submitted:
22 December 2025
Posted:
23 December 2025
You are already at the latest version
Abstract
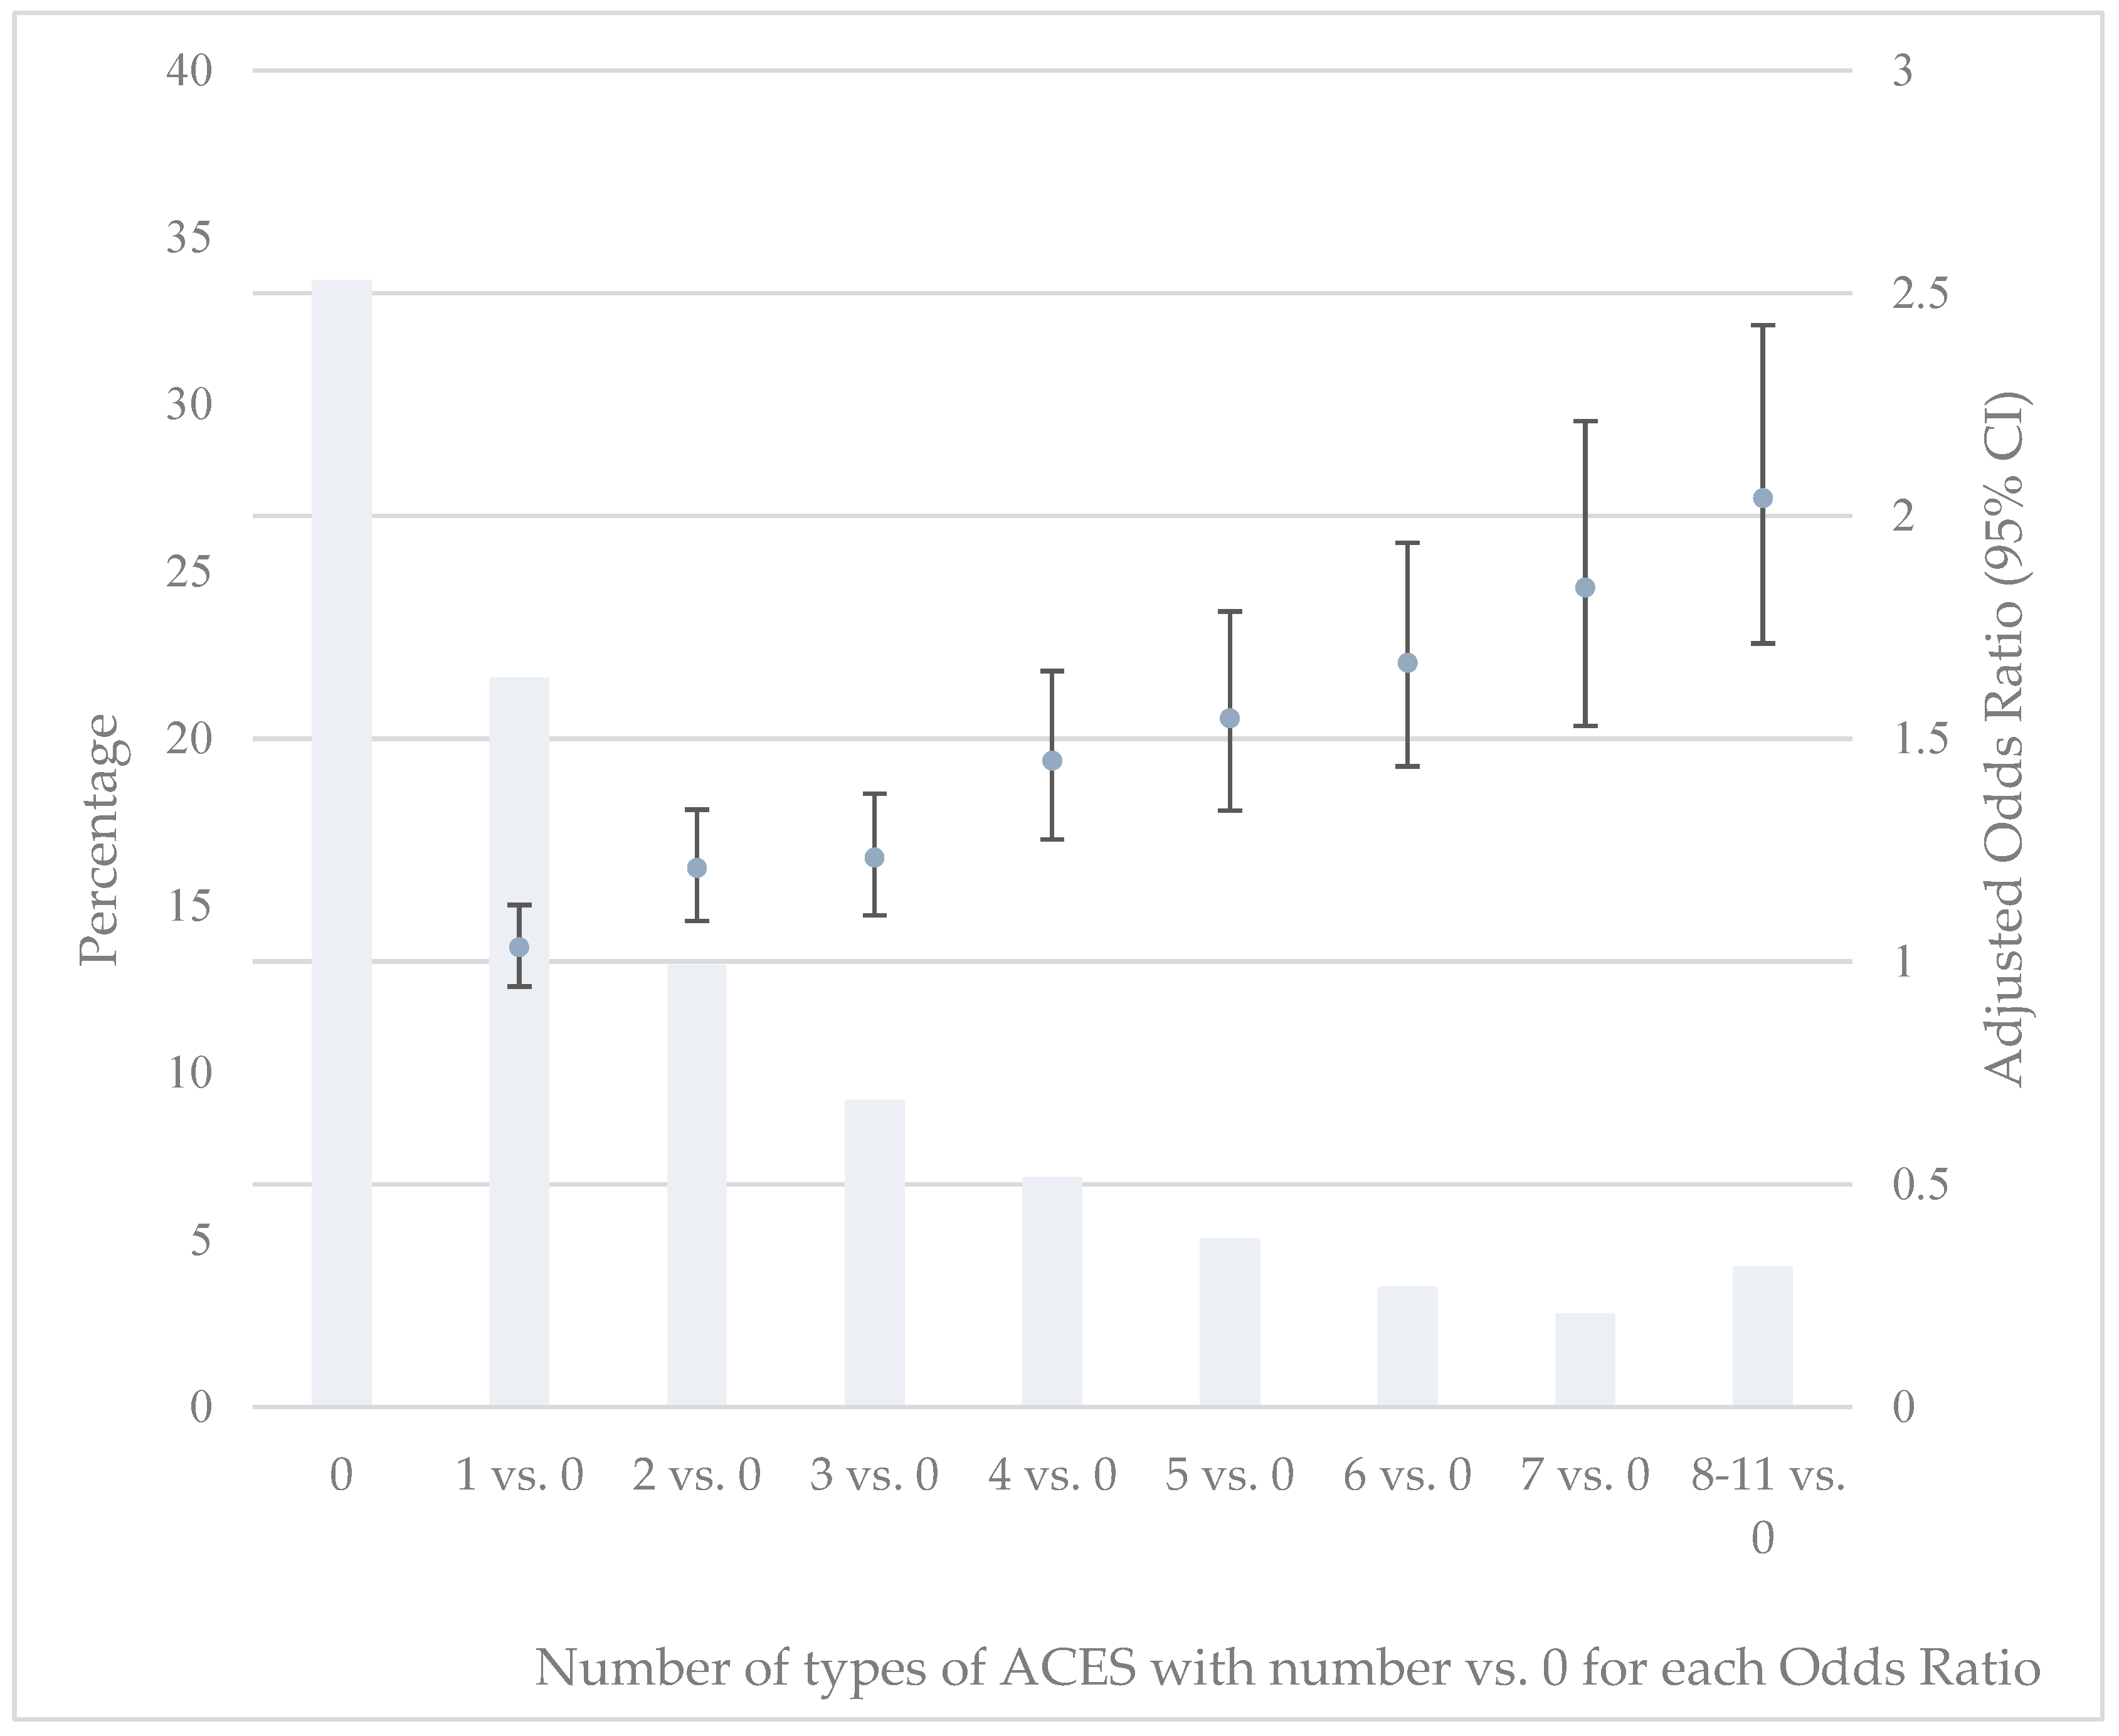
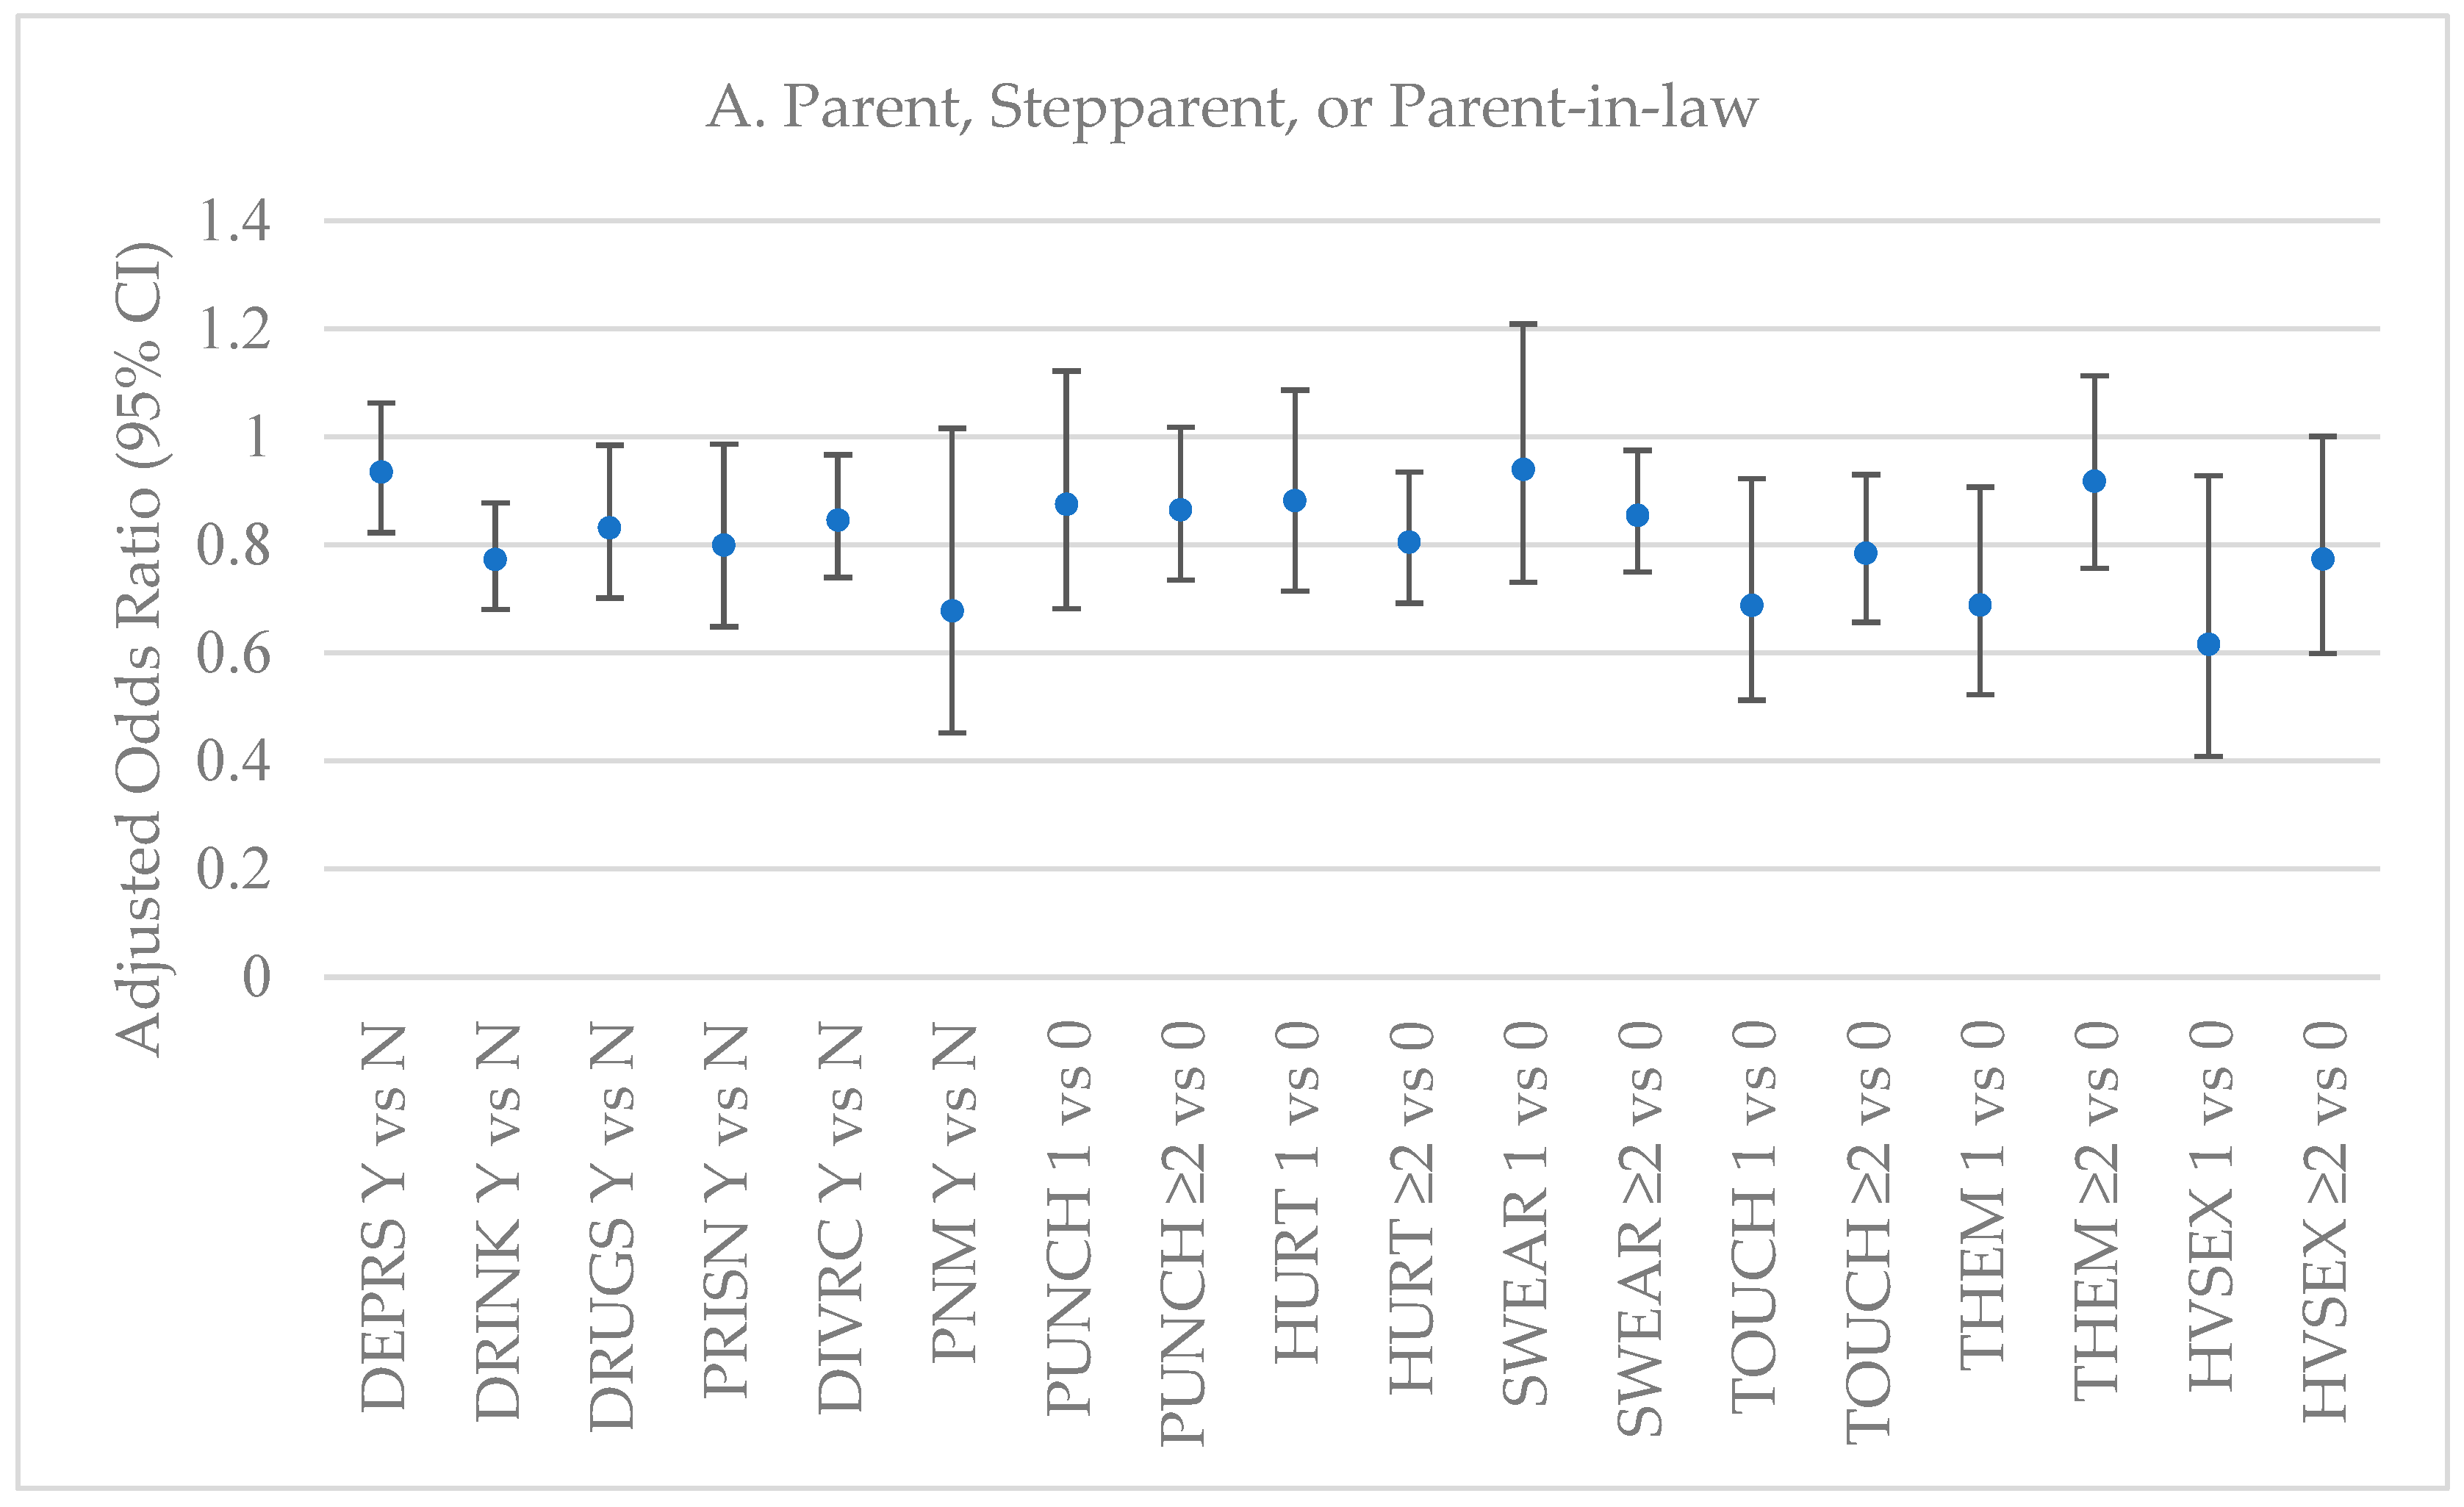
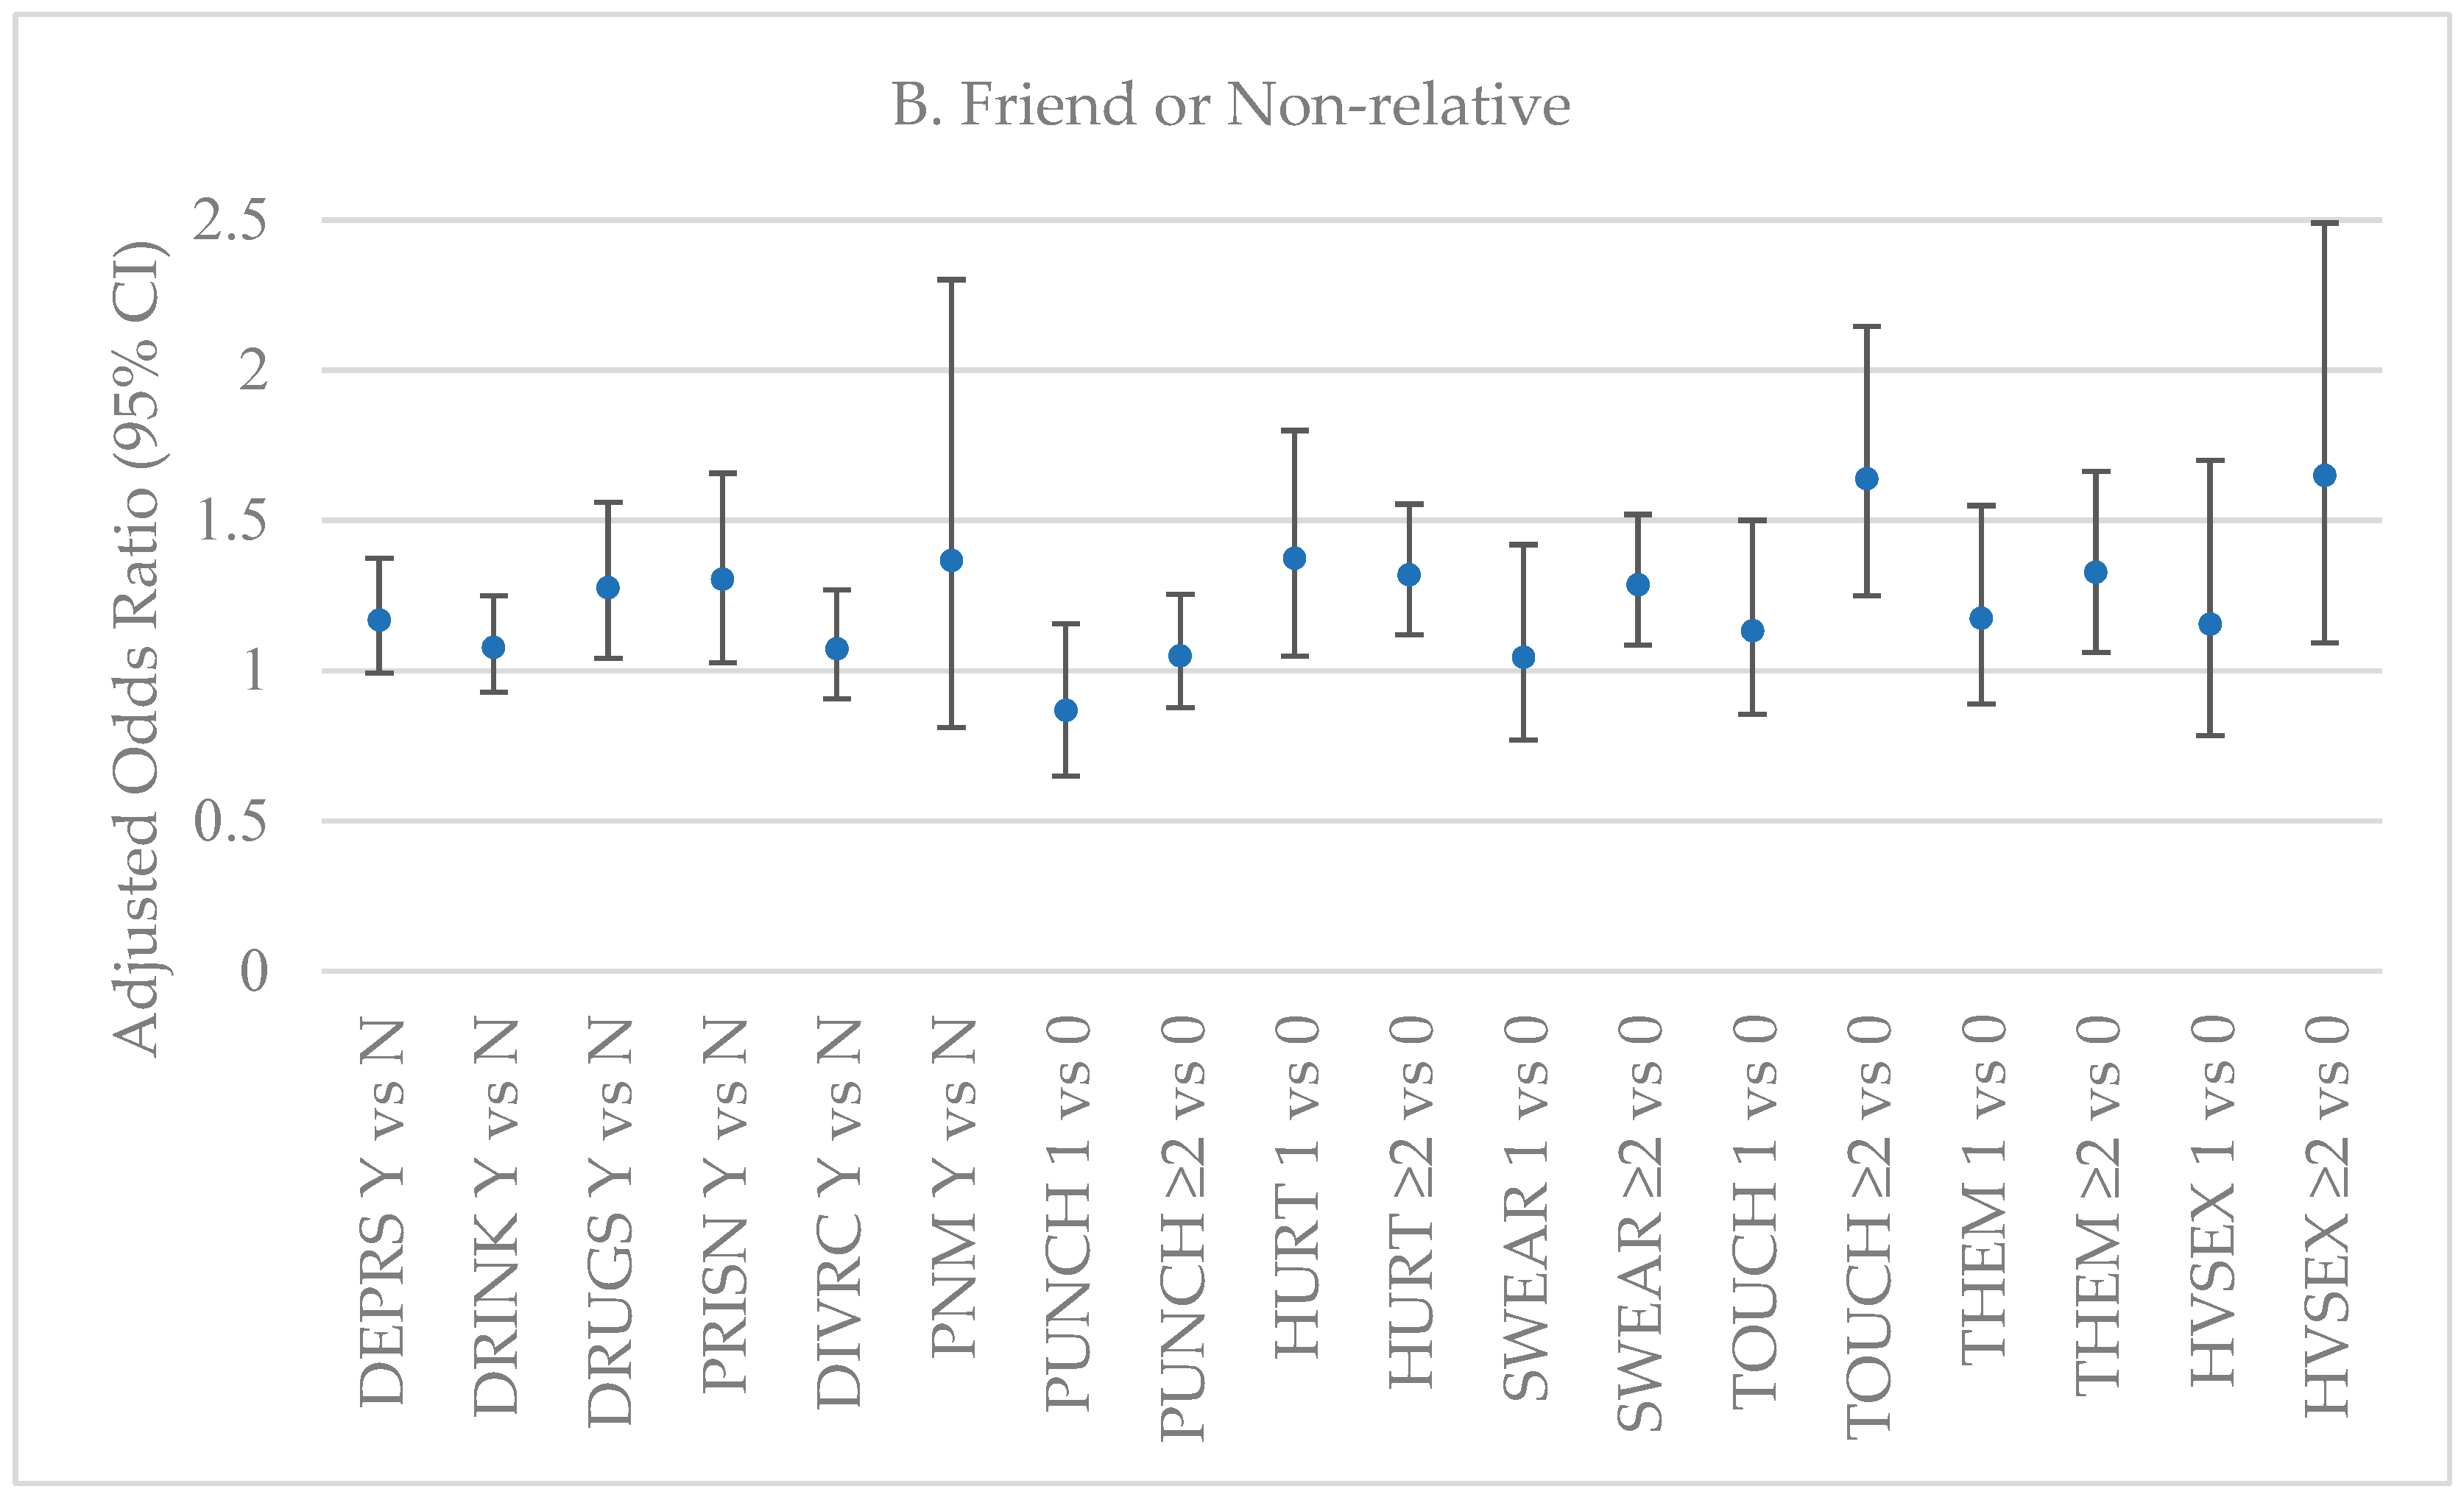
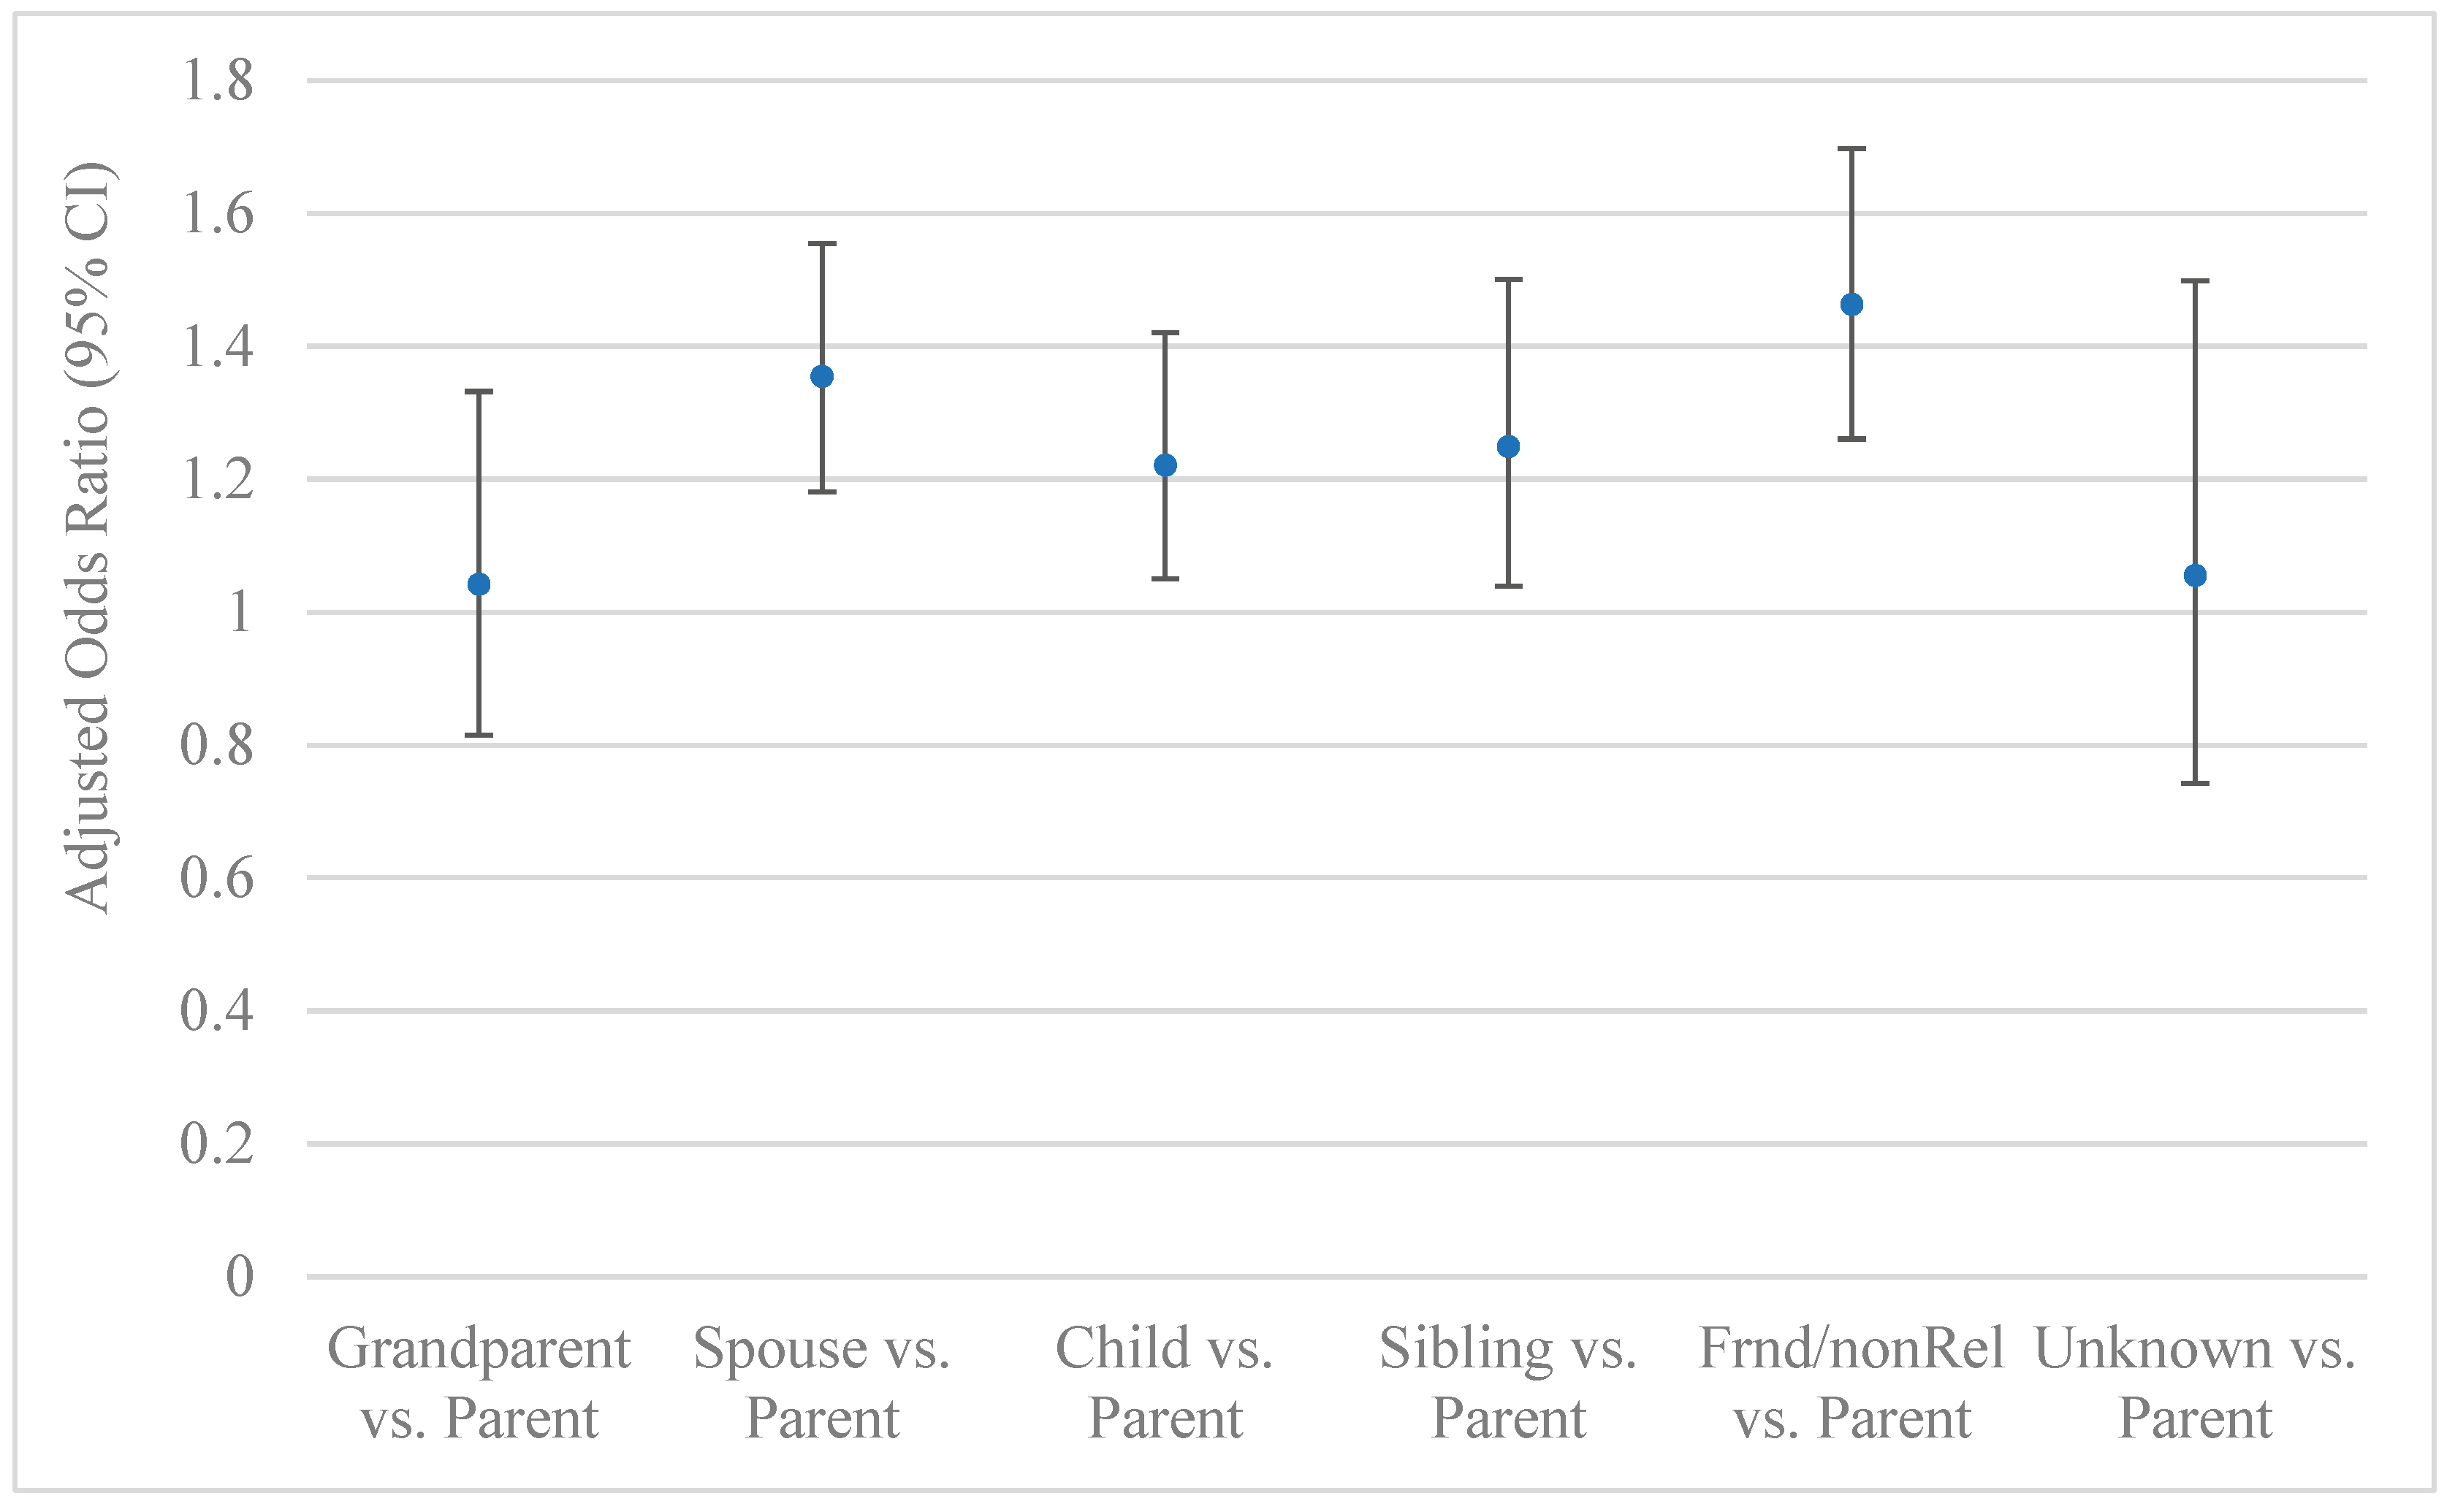
Adverse childhood experiences (ACEs) prompt parentification, which is related to providing regular caregiving as adults. This study examines the association between the number and types of ACEs and caregiving as adults, and to whom caregiving is extended. Analyses were based on 91,193 adults from 13 states in the U.S. in 2020-2024 and involved binomial and multinomial logistic regression, adjusted for selected covariates. Approximately 21% of participants provided regular care and 66% had ≥1 ACEs. Each of 11 ACEs considered was positively associated with providing regular care. As the number of ACEs increased, the odds of providing regular care increased. The strongest ACE predictor of providing regular care was living with a parent or adult who was depressed, mentally ill, or suicidal, and the weakest was when the parents were divorced, separated, or an unmarried couple. As the number of ACEs increased, providing regular care for a parent significantly decreased, whereas providing regular care for a friend/nonrelative significantly increased. Among those receiving regular care, if the caregiver had more ACEs versus less, they were significantly less likely to care for a parent or grandparent but more likely to care for a spouse, child, friend or non-relative.
Keywords:
1. Introduction
2. Materials and Methods
2.1. Data
2.2. Measures

| State | No. | % | Year |
| Alabama | 4007 | 4.39 | 2021 |
| Arkansas | 4459 | 4.89 | 2021 |
| Florida | 8616 | 9.45 | 2020 |
| Georgia | 7106 | 7.79 | 2020 |
| Iowa | 8081 | 8.86 | 2021 |
| Mississippi | 4044 | 4.43 | 2021 |
| Nevada | 4090 | 4.48 | 2021, 2024 |
| North Dakota | 5350 | 5.87 | 2021 |
| Oregon | 14783 | 16.21 | 2021, 2022, 2023 |
| South Carolina | 7335 | 8.04 | 2021 |
| Tennessee | 4642 | 5.09 | 2023 |
| Viginia | 13515 | 14.82 | 2022, 2024 |
| Wisconsin | 5165 | 5.66 | 2021 |
| Total | 91,193 |
2.3. Statistical Analysis
3. Results
| Regular Care or Assistance | ACEs | |||||
| No. | % (SE)* | % (SE)* | Odds Ratio (95% CI)*† | Mean (SE)* | Odds Ratio (95% CI)*† | |
| Age | ||||||
| 18-24 | 4811 | 10.87 (0.23) | 15.58 (0.98) | 1.00 | 2.64 (0.07) | 1.00 |
| 25-34 | 8389 | 15.12 (0.23) | 16.41 (0.62) | 1.01 (0.84-1.20) | 2.75 (0.04) | 1.05 (0.94-1.17) |
| 35-44 | 11064 | 15.89 (0.24) | 19.94 (0.63) | 1.32 (1.11-1.57) | 2.38 (0.04) | 0.79 (0.70-0.88) |
| 45-54 | 12970 | 15.77 (0.23) | 23.57 (0.67) | 1.67 (1.40-1.99) | 2.18 (0.04) | 0.69 (0.62-0.78) |
| 55-64 | 16745 | 16.98 (0.23) | 27.10 (0.72) | 1.94 (1.62-2.33) | 1.85 (0.03) | 0.51 (0.46-0.57) |
| ≥65 | 37214 | 25.37 (0.22) | 21.47 (0.39) | 1.38 (1.17-1.64) | 1.23 (0.02) | 0.29 (0.26-0.32) |
| Sex | ||||||
| Men | 41266 | 47.95 (0.31) | 17.90 (0.36) | 1.00 | 1.86 (0.02) | 1.00 |
| Women | 49927 | 52.05 (0.31) | 24.06 (0.37) | 1.44 (1.35-1.64) | 2.23 (0.02) | 1.27 (1.21-1.33) |
| Race/ethnicity | ||||||
| NH White | 69009 | 64.25 (0.30) | 22.15 (0.26) | 1.00 | 2.05 (0.02) | 1.00 |
| NH Black | 10160 | 15.13 (0.25) | 22.42 (0.76) | 1.03 (0.94-1.14) | 2.00 (0.04) | 0.91 (0.85-0.97) |
| NH Other | 4896 | 7.09 (0.16) | 18.94 (0.89) | 0.86 (0.77-0.98) | 2.27 (0.06) | 0.88 (0.80-0.97) |
| Hispanic | 5265 | 11.72 (0.25) | 15.55 (1.24) | 0.70 (0.58-0.86) | 2.04 (0.07) | 0.72 (0.65-0.80) |
| Unknown | 1863 | 1.81 (0.07) | 17.47 (1.26) | 0.81 (0.67-0.97) | 1.91 (0.09) | 0.96 (0.83-1.10) |
| Marital Status | ||||||
| Mar/Cohab | 50118 | 55.56 (0.31) | 22.50 (0.33) | 1.00 | 1.90 (0.02) | 1.00 |
| Previously M | 26008 | 21.46 (0.24) | 20.77 (0.53) | 0.75 (0.69-0.81) | 2.07 (0.03) | 1.23 (1.16-1.30) |
| Never M | 14358 | 22.22 (0.29) | 18.16 (0.64) | 0.90 (0.80-1.01) | 2.43 (0.04) | 1.01 (0.94-1.09) |
| Unknown | 709 | 0.76 (0.05) | 15.56 (1.95) | 0.73 (0.54-0.98) | 1.68 (0.17) | 0.81 (0.62-1.06) |
| Education | ||||||
| < HS | 6088 | 11.06 (0.24) | 18.18 (0.85) | 1.00 | 2.28 (0.06) | 1.00 |
| HS | 23487 | 28.20 (0.29) | 20.68 (0.52) | 1.15 (1.01-1.32) | 2.15 (0.03) | 0.83 (1.01-1.32) |
| Some college | 26139 | 32.05 (0.29) | 23.42 (0.50) | 1.32 (1.16-1.52) | 2.21 (0.03) | 0.89 (1.16-1.52) |
| College | 35159 | 28.33 (0.25) | 20.15 (0.36) | 1.13 (0.99-1.29) | 1.70 (0.02) | 0.62 (0.99-1.29) |
| Unknown | 320 | 0.34 (0.03) | 12.73 (2.41) | 0.81 (0.51-1.28) | 1.06 (0.13) | 0.38 (0.51-1.28) |
| Income | ||||||
| <50K | 34039 | 37.02 (0.30) | 23.76 (0.45) | 1.00 | 2.32 (0.03) | 1.00 |
| 50K-<100K | 24443 | 28.17 (0.29) | 21.16 (0.54) | 0.78 (0.71-0.85) | 2.03 (0.03) | 0.89 (0.84-0.95) |
| 100K-<200K | 12157 | 12.11 (0.15) | 19.82 (0.53) | 0.65 (0.59-0.72) | 2.01 (0.03) | 0.82 (0.77-0.88) |
| ≥200K | 3398 | 3.94 (0.09) | 17.19 (0.95) | 0.54 (0.46-0.62) | 1.75 (0.05) | 0.71 (0.64-0.79) |
| Unknown | 17156 | 18.76 (0.25) | 17.45 (0.55) | 0.65 (0.59-0.72) | 1.65 (0.03) | 0.60 (0.56-0.65) |
| Year | ||||||
| 2020 | 15722 | 27.48 (0.21) | 19.46 (0.71) | 1.00 | 1.86 (0.04) | 1.00 |
| 2021 | 45002 | 35.25 (0.17) | 21.32 (0.29) | 1.15 (1.05-1.26) | 2.02 (0.02) | 1.09 (1.02-1.17) |
| 2022 | 13182 | 13.53 (0.14) | 20.03 (0.49) | 1.13 (1.01-1.25) | 2.13 (0.03) | 1.30 (1.20-1.40) |
| 2023 | 9733 | 12.06 (0.11) | 24.62 (0.65) | 1.42 (1.27-1.59) | 2.35 (0.04) | 1.44 (1.33-1.56) |
| 2024 | 7554 | 11.67 (0.17) | 21.96 (0.72) | 1.29 (1.14-1.46) | 2.21 (0.05) | 1.44 (1.32-1.57) |
| Regular Care or Assistance | ACEs | |||||
| No. | % (SE)* | % (SE)* | Odds Ratio (95% CI)*† | Mean (SE)* | Odds Ratio (95% CI)*‡ | |
| Poor Mental Health Days | ||||||
| 0 days not Gd | 55814 | 57.51 (0.31) | 18.13 (0.33) | 1.00 | 1.47 (0.02) | 1.00 |
| 1-13 days not Gd | 21280 | 25.17 (0.27) | 23.85 (0.55) | 1.50 (1.39-1.62) | 2.52 (0.03) | 2.03 (1.92-2.14) |
| 14-30 days not Gd | 12355 | 15.35 (0.22) | 28.16 (0.66) | 1.83 (1.69-1.98) | 3.52 (0.05) | 3.52 (3.28-3.76) |
| Unknown | 1744 | 1.97 (0.09) | 18.20 (1.78) | 1.10 (0.87-1.40) | 1.85 (0.09) | 1.29 (1.09-1.53) |
| Poor Physical Health Days | ||||||
| 0 days not Gd | 56653 | 63.05 (0.30) | 19.13 (0.33) | 1.00 | 1.78 (0.02) | 1.00 |
| 1-13 days not Gd | 20230 | 22.66 (0.26) | 24.88 (0.57) | 1.35 (1.26-1.45) | 2.48 (0.04) | 1.60 (1.52-1.69) |
| 14-30 days not Gd | 12256 | 12.18 (0.19) | 24.69 (0.65) | 1.22 (1.12-1.32) | 2.70 (0.04) | 2.02 (1.88-2.16) |
| Unknown | 2054 | 2.12 (0.09) | 19.11 (1.62) | 1.01 (0.81-1.25) | 1.95 (0.09) | 1.21 (1.03-1.41) |
| Difficulty Making Decisions | ||||||
| Yes | 10907 | 13.36 (0.22) | 28.48 (0.83) | 1.64 (1.50-1.80) | 3.59 (0.06) | 2.88 (2.68-3.09) |
| No | 79605 | 85.91 (0.22) | 19.95 (0.27) | 1.00 | 1.81 (0.01) | 1.00 |
| Unknown | 681 | 0.72 (0.04) | 22.33 (2.50) | 1.32 (0.98-1.76) | 2.50 (0.16) | 1.68 (1.35-2.09) |
| Depression | ||||||
| Yes | 18603 | 20.77 (0.24) | 27.95 (0.62) | 1.53 (1.42-1.65) | 3.46 (0.04) | 3.06 (2.89-3.23) |
| No | 67485 | 78.62 (0.25) | 19.29 (0.28) | 1.00 | 1.68 (0.01) | 1.00 |
| Unknown | 502 | 0.62 (0.06) | 22.34 (5.82) | 1.37 (0.69-2.72) | 2.55 (0.19) | 2.13 (1.56-2.90) |
| Obesity | ||||||
| Yes | 29879 | 32.18 (0.29) | 23.84 (0.44) | 1.14 (1.07-1.22) | 2.29 (0.02) | 1.24 (1.18-1.30) |
| No | 55550 | 61.07 (0.30) | 20.33 (0.34) | 1.00 | 1.97 (0.02) | 1.00 |
| Unknown | 5764 | 6.74 (0.18) | 15.18 (0.83) | 0.68 (0.60-0.78) | 1.64 (0.06) | 0.68 (0.61-0.75) |
| Smoking | ||||||
| Current | 12068 | 14.60 (0.24) | 28.11 (0.83) | 1.62 (1.47-1.79) | 2.94 (0.05) | 2.25 (2.09-2.42) |
| Past | 25867 | 25.08 (0.25) | 21.50 (0.49) | 1.10 (1.02-1.18) | 2.24 (0.03) | 1.80 (1.71-1.90) |
| Never | 52566 | 59.59 (0.30) | 19.28 (0.32) | 1.00 | 1.77 (0.02) | 1.00 |
| Unknown | 692 | 0.73 (0.05) | 17.25 (2.39) | 0.92 (0.66-1.30) | 1.53 (0.15) | 0.94 (0.72-1.23) |
| Heavy Drinker | ||||||
| Yes | 5480 | 6.22 (0.15) | 21.54 (0.94) | 1.03 (0.92-1.15) | 2.67 (0.06) | 1.56 (1.44-1.70) |
| No | 83914 | 91.65 (0.18) | 21.21 (0.27) | 1.00 | 2.01 (0.02) | 1.00 |
| Unknown | 1799 | 2.14 (0.09) | 15.28 (1.45) | 0.76 (0.61-0.96) | 1.89 (0.10) | 0.92 (0.79-1.07) |
| Regular Care or Assistance | |||||||
| No. | % (SE)* | % (SE)* | Odds Ratio (95% CI)*† | Type 3 F, (Pr>F) | Odds Ratio (95% CI)*‡ | Type 3 F, (Pr>F) | |
| Did you live with anyone who was depressed, mentally ill, or suicidal? | |||||||
| Yes | 16624 | 19.79 (0.23) | 27.57 (0.57) | 1.66 (1.54-1.78) | 99.74, | 1.39 (1.28-1.50) | 34.07, |
| No | 72390 | 77.72 (0.24) | 19.47 (0.30) | 1.00 | <.0001 | 1.00 | <.0001 |
| Unknown | 2179 | 2.49 (0.08) | 20.92 (1.37) | 1.17 (0.98-1.38) | 1.14 (0.96-1.35) | ||
| Did you live with anyone who was a problem drinker or alcoholic? | |||||||
| Yes | 21815 | 24.62 (0.27) | 26.63 (0.57) | 1.48 (1.38-1.59) | 60.87, | 1.32 (1.23-1.42) | 35.57, |
| No | 67609 | 73.33 (0.27) | 19.33 (0.29) | 1.00 | <.0001 | 1.00 | <.0001 |
| Unknown | 1769 | 2.05 (0.08) | 18.51 (1.47) | 0.98 (0.80-1.20) | 0.98 (0.80-1.20) | ||
| Did you live with anyone who used illegal street drugs or who abused prescription medications? | |||||||
| Yes | 9316 | 12.69 (0.21) | 27.69 (0.86) | 1.63 (1.48-1.79) | 49.41, | 1.41 (1.28-1.55) | 23.65, |
| No | 79964 | 85.06 (0.22) | 20.14 (0.27) | 1.00 | <.0001 | 1.00 | <.0001 |
| Unknown | 1913 | 2.25 (0.08) | 20.43 (1.51) | 1.09 (0.90-1.32) | 1.10 (0.91-1.32) | ||
| Did you live with anyone who served time or was sentenced to serve time in a prison, jail, or other correctional facility? | |||||||
| Yes | 6828 | 10.16 (0.21) | 27.36 (1.06) | 1.65 (1.47-1.86) | 36.16, | 1.45 (1.29-1.63) | 20.00, |
| No | 82651 | 87.73 (0.22) | 20.46 (0.26) | 1.00 | <.0001 | 1.00 | <.0001 |
| Unknown | 1714 | 2.11 (0.08) | 17.87 (1.54) | 0.93 (0.75-1.15) | 0.95 (0.77-1.18) | ||
| Were your parents separated or divorced? | |||||||
| Yes | 23586 | 31.27 (0.30) | 22.63 (0.51) | 1.20 (1.12-1.29) | 11.05, | 1.10 (1.03-1.19) | 4.33, |
| No | 64068 | 63.82 (0.31) | 20.44 (0.30) | 1.00 | <.0001 | 1.00 | 0.0047 |
| P not M | 2148 | 2.74 (0.11) | 24.33 (2.19) | 1.32 (1.03-1.69) | 1.21 (0.95-1.55) | ||
| Unknown | 1391 | 2.17 (0.10) | 16.84 (1.37) | 0.85 (0.69-1.03) | 0.85 (0.69-1.04) | ||
| How often did your parents or adults in your home ever slap, hit, kick, punch or beat each other up? | |||||||
| 0 | 73398 | 78.50 (0.25) | 19.66 (0.28) | 1.00 | 44.00, | 1.00 | 24.77, |
| 1 | 3489 | 4.30 (0.12) | 24.16 (1.20) | 1.37 (1.20-1.57) | <.0001 | 1.27 (1.11-1.45) | <.0001 |
| ≥1 | 10916 | 13.05 (0.21) | 29.08 (0.83) | 1.65 (1.51-1.81) | 1.46 (1.33-1.60) | ||
| Unknown | 3390 | 4.14 (0.12) | 20.17 (1.17) | 1.09 (0.93-1.26) | 1.08 (0.93-1.26) | ||
| Not including spanking (before age 18), how often did a parent or adult in your home ever hit, beat, kick, or physically hurt you in any way? Was it— | |||||||
| 0 | 67630 | 72.18 (0.28) | 19.88 (0.30) | 1.00 | 25.36, | 1.00 | 9.14, |
| 1 | 5356 | 5.95 (0.14) | 21.86 (0.92) | 1.15 (1.02-1.28) | <.0001 | 1.05 (0.94-1.18) | <.0001 |
| ≥1 | 15303 | 18.31 (0.24) | 26.15 (0.67) | 1.43 (1.32-1.55) | 1.25 (1.15-1.36) | ||
| Unknown | 2904 | 3.56 (0.11) | 18.83 (1.23) | 1.01 (0.86-1.20) | 1.02 (0.86-1.21) | ||
| How often did a parent or adult in your home ever swear at you, insult you, or put you down? | |||||||
| 0 | 58108 | 60.63 (0.30) | 19.11 (0.31) | 1.00 | 45.77, | 1.00 | 18.82, |
| 1 | 4484 | 5.14 (0.14) | 19.52 (1.01) | 1.10 (0.96-1.26) | <.0001 | 1.02 (0.89-1.16) | <.0001 |
| ≥1 | 25210 | 30.24 (0.28) | 25.65 (0.52) | 1.52 (1.42-1.63) | 1.30 (1.22-1.40) | ||
| Unknown | 3391 | 3.99 (0.12) | 19.09 (1.13) | 1.07 (0.92-1.24) | 1.03 (0.88-1.20) | ||
| How often did anyone, at least 5 years older than you or an adult, ever touch you sexually? | |||||||
| 0 | 77396 | 83.77 (0.23) | 19.70 (0.27) | 1.00 | 43.28, | 1.00 | 19.48, |
| 1 | 3680 | 4.21 (0.14) | 28.89 (1.76) | 1.58 (1.32-1.90) | <.0001 | 1.38 (1.16-1.64) | <.0001 |
| ≥1 | 6889 | 8.14 (0.16) | 32.09 (0.98) | 1.74 (1.57-1.92) | 1.44 (1.30-1.60) | ||
| Unknown | 3228 | 3.88 (0.12) | 20.12 (1.14) | 1.05 (0.91-1.21) | 1.01 (0.88-1.18) | ||
| How often did anyone, at least 5 years older or an adult, try to make you touch them sexually? | |||||||
| 0 | 80139 | 86.55 (0.21) | 20.09 (0.28) | 1.00 | 40.25, | 1.00 | 14.96, <.0001 |
| 1 | 2783 | 3.37 (0.12) | 27.57 (1.48) | 1.45 (1.25-1.68) | <.0001 | 1.26 (1.25-1.47) | <.0001 |
| ≥1 | 5029 | 6.14 (0.14) | 32.28 (1.07) | 1.73 (1.56-1.93) | 1.43 (1.56-1.60) | ||
| Unknown | 3242 | 3.94 (0.13 | 20.62 (1.41) | 1.05 (0.88-1.26) | 1.01 (0.88-1.19) | ||
| How often did anyone at least 5 years older than you or an adult, force you to have sex? | |||||||
| 0 | 83326 | 90.26 (0.19) | 20.29 (0.26) | 1.00 | 30.06, | 1.00 | 15.03, |
| 1 | 1539 | 2.03 (0.11) | 32.61 (2.99) | 1.86 (1.38-2.50) | <.0001 | 1.54 (1.16-2.05) | <.0001 |
| ≥1 | 3066 | 3.69 (0.11) | 35.63 (1.61) | 1.96 (1.68-2.27) | 1.59 (1.37-1.85) | ||
| Unknown | 3262 | 4.02 (0.12) | 20.29 (1.22) | 1.02 (0.91-1.23) | 1.00 (0.85-1.17) | ||
4. Discussion
5. Conclusions
Funding
Institutional Review Board Statement
Informed Consent Statement
Data Availability Statement
Acknowledgments
Conflicts of Interest
Abbreviations
| ACE | Adverse Childhood Experiences |
| BRFSS | Behavior Risk Factor Surveillance System |
| CDC | Centers for Disease Control and Prevention |
| CI | Confidence Interval |
| NH | Non-Hispanic |
| SE | Standard Error |
| SAS | Statistical Analysis System |
References
- Dariotis, J.K.; Chen, F.R.; Park, Y.R.; Nowak, M.K.; French, K.M.; Codamon, A.M. Parentification vulnerability, reactivity, resilience, and thriving: A mixed methods systematic literature review. Int. J. Environ. Res. Public. Health 2023, 20(13), 6197. [CrossRef]
- Połomski, P.; Peplińska, A.; Lewandowska-Walter, A.; Borchet, J. Exploring resiliency and parentification in Polish adolescents. Int. J. Environ. Res. Public. Health 2021, 18(21), 11454. [CrossRef]
- Burton, L. Childhood adultification in economically disadvantaged families: A conceptual model. Fam. Relat. 2007, 56, 329–345. [CrossRef]
- Hooper, L.M. Parentification, in encyclopedia of adolescence. In Levesque R.J.R., editor. Springer; New York, NY, USA, 2011; 2023–2031.
- Hooper, L.M.; Wallace, S.A.; Doehler, K.; Dantzler, J. Parentification, ethnic identity, and psychological health in lack and White American college students: Implications of family-of-origin and cultural factors. J. Comp. Fam. Stud. 2012, 43, 811–835. [CrossRef]
- Hendricks, B.A.; B Vo, J.; Dionne-Odom, J.N.; Bakitas, M.A. Parentification among young carers: A concept analysis. Child Adolesc. Social Work J. 2021 38(5), 519-531. [CrossRef]
- Jones, R.A.; Wells. An empirical study of parentification and personality. Am. J. Fam. Ther. The, 1996, 24(2), 145–152. [CrossRef]
- McMahon, T.J.; Luthar, S.S. Defining characteristics and potential consequences of caretaking burden among children living in urban poverty. AJO, 2007, 77(2), 267–281. [CrossRef]
- Nuttall, A.K.; Coberly, B.; Diesel, S.J. Childhood caregiving roles, perceptions of benefits, and future caregiving intentions among typically developing adult siblings of individuals with autism spectrum disorder. J. Autism Dev. Disord. 2018, 48(4), 1199–1209. [CrossRef]
- Gupta, S. What is parentification? Available online: https://www.verywellmind.com/parentification0types-causes-and-effects-7090611 (accessed 15 Dec 25).
- Thompson, M. J.; Platts, C. R.; Davies, P. T. Parent–child boundary dissolution and children’s psychological difficulties: A meta-analytic review. Psych. Bull. 2024, 150(7), 873–919. [CrossRef]
- Chen, C.Y.; Panebianco, A. Physical and psychological conditions of parental chronic illness, parentification and adolescent psychological adjustment. Psychol. Health 2020, 35(9), 1075–1094. [CrossRef]
- Van Loon, L.M.; Van de Ven, M.O.; Van Doesum KT, Hosman CM, Witteman CL. Parentification, stress, and problem behavior of adolescents who have a parent with mental health problems. Fam. Process 2017, 56(1), 141–153. [CrossRef]
- Burnett, G.; Jones, R.A.; Bliwise, N.G.; Ross, L.T. Family unpredictability, parental alcoholism, and the development of parentification. Am. J. Fam. Ther. 2006, 34(3), 181–189. [CrossRef]
- Hicks, H.R. Experiences & long-term implications of childhood parentification & parental substance misuse: A scoping review. McNair Scholars Research Journal 2023, 26, 6 . [CrossRef]
- Fitzgerald, M.M.; Schneider, R.A.; Salstrom, S.; Zinzow, H.M.; Jackson, J.; Fossel, R.V. Child sexual abuse, early family risk, and childhood parentification: Pathways to current psychosocial adjustment. JFP, 2008, 22(2), 320–324. [CrossRef]
- Pedersen, S.; Revenson, T.A. Parental illness, family functioning, and adolescent well-being: A family ecology framework to guide research. JFP, 2005, 19(3), 404–419. [CrossRef]
- Peris, T.S.; Goeke-Morey, M.C.; Cummings, E.M.; Emery, R.E. Marital conflict and support seeking by parents in adolescence: empirical support for the parentification construct. JFP, 2008, 22(4), 633–642. [CrossRef]
- Jurkovic, G.J.; Thirkield, A.; Morrell, R. Parentification of adult children of divorce: A multidimensional analysis. J. Youth Adolesc. 2001, 30, 245–257. [CrossRef]
- Masiran, R.; Ibrahim, N.; Awang, H.; Lim, P.Y. The positive and negative aspects of parentification: An integrated review. Child. Youth Serv. Rev. 2023, 144, 1–10. [CrossRef]
- Blake-Holmes, K.; Maynard, E.; Brandon, M. The impact of acquiescence: a model of coping developed from children of parents with mental illness. Advances in Mental Health, 2023, 21(3), 199–217. [CrossRef]
- Centers for Disease Control and Prevention. (2013, August 15). The BRFSS user guide. Available online: https://www.cdc.gov/brfss/data_documentation/pdf/UserguideJune2013.pdf (accessed 15 Dec 2025).
- Centers for Disease Control and Prevention. (2021, August 2). The Behavioral Risk Factor Surveillance System's 2020 summary data quality report. Available online: https://www.cdc.gov/brfss/annual_data/2020/pdf/2020-sdqr-508.pdf (accessed 15 Dec 2025).
- Centers for Disease Control and Prevention. (2022, August 9). The Behavioral Risk Factor Surveillance System's 2021 summary data quality report. Available online: https://www.cdc.gov/brfss/annual_data/2021/pdf/2021-DQR-508.pdf (accessed 15 Dec 2025).
- Centers for Disease Control and Prevention. (2023, August 8). The Behavioral Risk Factor Surveillance System's 2022 summary data quality report. Available online: https://www.cdc.gov/brfss/annual_data/2022/pdf/2022-DQR-508.pdf (accessed 15 Dec 2025).
- Centers for Disease Control and Prevention. (2024, August 6). The Behavioral Risk Factor Surveillance System's 2023 summary data quality report. Available online: https://www.cdc.gov/brfss/annual_data/2023/pdf/2023-DQR-508.pdf (accessed 15 Dec 2025).
- Centers for Disease Control and Prevention. (2025, July 25). The Behavioral Risk Factor Surveillance System's 2024 summary data quality report. Available online: https://www.cdc.gov/brfss/annual_data/2024/pdf/2024-DQR-508.pdf (accessed 15 Dec 2025).
- Centers for Disease Control and Prevention. (2025). Behavioral Risk Factor Surveillance System survey data. Available online: https://www.cdc.gov/brfss/index.html (accessed 15 Dec 2025).
- Guy-Evans, O. Parentification effects: How growing up too fast impacts adulthood. Available online: Parentification Effects: How Growing Up Too Fast Impacts Adulthood (accessed 15 Dec 2025).
- Dragan, M., Hardt, J. Childhood adversities and risk for problematic alcohol use. Addict. Behav. 2016, 59, 65–71. [CrossRef]
| Model 1 | Model 2 | Model 3 | Model 4 | Model 5 | Model 6 | Model 7 | |
| Distinct ACEs Experienced | Parent, stepparent, or parent-in-law | Grandparent, step grandparent or grandparent-in-law (n=752, 6.71%*) | Spouse or partner | Child or stepchild; Grandchild or step grandchild | Sibling, stepsibling, or sibling-in-law, other relatives (n=2844, 14.18%*) | Friend or non-relative (n=3390, 15.27%*) | Unknown (n=209, 1.12%*) |
| (n=6066, 34.61%*) | (n=4233, 18.13%*) | (n=1985, 9.98%*) | |||||
| No. | Odds Ratio (95% CI) *† | Odds Ratio | Odds Ratio | Odds Ratio | Odds Ratio | Odds Ratio | Odds Ratio |
| (95% CI) *† | (95% CI) *† | (95% CI) *† | (95% CI) *† | (95% CI) *† | (95% CI) *† | ||
| 0 | 1.00 | 1.00 | 1.00 | 1.00 | 1.00 | 1.00 | |
| 1-2 | 0.85 | 1.19 | 1.14 | 1.12 | 0.92 | 1.1 | 0.52 |
| (0.73-0.99) | (0.84-1.68) | (0.98-1.33) | (0.92-1.38) | (0.75-1.15) | (0.93-1.31) | (0.33-0.82) | |
| 3-4 | 0.78 | 1.01 | 1.09 | 1.05 | 1.04 | 1.27 | 1.22 |
| (0.66-0.94) | (0.62-1.65) | (0.90-1.33) | (0.84-1.32) | (0.82-1.32) | (0.99-1.62) | (0.62-2.41) | |
| ≥5 | 0.66 | 0.98 | 1.34 | 1.1 | 1.09 | 1.48 | 0.67 |
| (055-0.79) | (0.68-1.41) | (1.07-1.68) | (0.88-1.37) | (0.83-1.42) | (1.21-1.83) | (0.37-1.19) | |
| Type 3 Pr > F | 0.0001 | 0.6342 | 0.0673 | 0.6752 | 0.5427 | 0.002 | 0.0228 |
Disclaimer/Publisher’s Note: The statements, opinions and data contained in all publications are solely those of the individual author(s) and contributor(s) and not of MDPI and/or the editor(s). MDPI and/or the editor(s) disclaim responsibility for any injury to people or property resulting from any ideas, methods, instructions or products referred to in the content. |
© 2025 by the authors. Licensee MDPI, Basel, Switzerland. This article is an open access article distributed under the terms and conditions of the Creative Commons Attribution (CC BY) license (http://creativecommons.org/licenses/by/4.0/).


