1. Introduction
In Europe, about 70% of the population lives in cities, and UN projections estimate that by 2050 this share will rise to 80% [
1]. The accelerated growth of urban populations confronts cities with major challenges related to improving mobility and transport systems, eliminating the negative impacts of traffic on society, health, and the environment, as well as reducing the number of road traffic casualties [
2]. The importance of timely addressing these challenges is emphasized in a number of documents adopted at the EU level (European Green Deal [
3], Sustainable and Smart Mobility Strategy [
4], Zero Pollution Action Plan [
5]).
Organizing efficient and sustainable mobility under such conditions represents a challenge for ensuring quality of life from different aspects, but above all regarding the impact of traffic on the environment, human health, and wellbeing. In analyses of the sustainability of urban transport systems, research has largely focused on the harmful effects of motor traffic on air quality, noise generation, and the reduction of traffic safety levels.
Even though Europe is among the safest regions in the world, in terms of road traffic safety (average fatality rate is about 5 deaths per 100.000 inhabitants), there are still significant differences between countries – while Norway has the lowest fatality rate, around 2/100,000, in Hungary it reaches 11/100.000 inhabitants [
6].
According to European Commission data, on average, 38% of traffic accidents occur in urban areas, and in some countries this share is considerably higher. For example, in Croatia more than 58% of all traffic accidents are recorded in cities, which indicates the need for additional safety measures in urban environments [
7].
Data from the CARE database clearly show that passenger cars are the dominant participants in urban traffic accidents, with the largest number of casualties being vulnerable road users – pedestrians and cyclists – who most often suffer in collisions with passenger cars [
8,
9]. At the same time, passengers and drivers of passenger cars are significantly affected in urban areas in accidents where no other vehicle is involved, pointing to the importance of a detailed analysis of factors such as speed, distraction, and infrastructure [
10].
Within the EU Road Safety Policy Framework 2021–2030 –
Next steps towards Vision Zero, key intervention areas have been defined to improve traffic safety, including safe infrastructure, safe vehicles, safe road user behavior, and fast and effective emergency response. Planned measures are based on analyses of accident causes, which show that one-third of accidents are linked to speeding [
11], while research confirms that the risk of being involved in a crash when speeding is 12.8 times higher compared to drivers who respect speed limits [
12]. In [
11], the responsibility of users for safe behavior is emphasized, as well as the importance of properly designed infrastructure that must be shaped to reduce the possibility of conflicts and mitigate the consequences of accidents. One of the most successful examples of good practice is the Dutch
Sustainable Safety program [
13], which is based on eliminating dangerous situations, minimizing exposure to risks, and mitigating consequences when accidents do occur.
Results of conducted before-and-after analyses have shown that measures such as roundabouts, separated cycling lanes, safe pedestrian crossings, and other interventions implemented in traffic infrastructure significantly reduce the number of accidents and the severity of consequences [
14,
15]. This integrated approach confirms that the combination of responsible user behavior, systematically designed infrastructure, and effective speed control measures represents the foundation for achieving the “Vision Zero” goal in the European transport system.
When new traffic solutions are implemented in urban areas, it is implied that traffic functioning is checked using tools for analyzing traffic flow quality, whereby traffic simulation methods, due to their stochastic nature, enable a very realistic assessment of infrastructural solutions since they not only respect designed elements but also take into account the traffic behavior of different road users. Traffic microsimulations allow testing of different scenarios before their actual implementation, thereby increasing the efficiency of traffic planning [
16]. One of the most widely used tools in this field is the PTV VISSIM software package, which is based on a microsimulation approach and modeling driver behavior through various algorithms, enabling detailed analysis of interactions between vehicles, pedestrians, and cyclists in complex urban conditions [
17].
However, even though there are available tools, checking traffic safety aspects is generally not a common step in the analysis of traffic solutions in urban environments. For safety assessment, it is possible to use tools compatible with traffic microsimulations that allow prediction of the number of conflicts between traffic participants. One of the widely used methodologies in this field is the Surrogate Safety Assessment Model (SSAM)
, developed to identify potential conflicts and quantify safety risks [
18]. Through various indicators (
Time-to-Collision,
Post-Encroachment Time, and
Deceleration Rate to Avoid Collision), the SSAM methodology enables assessment of the probability and severity of conflicts in traffic situations [
19]. Applying this methodology in combination with microsimulation tools such as VISSIM makes it possible to assess safety aspects of different infrastructural solutions already in the design phase, increasing the potential for preventive action [
20]. Research has shown that applying the SSAM methodology in traffic simulations significantly contributes to understanding the safety implications of different design solutions, especially in urban areas where there is a high level of interaction between vehicles, cyclists, and pedestrians [
21,
22]. In the case of roundabouts, applying the SSAM methodology in combination with microsimulation tools such as VISSIM has proven particularly useful, as it enables assessment of safety effects and identification of potential conflicts in situations where reliable accident data are lacking [
23,
24,
25]. This approach allows faster and more reliable evaluation of the effectiveness of new or reconstructed roundabouts and represents an important tool for preventive action in traffic planning.
In this study, the Surrogate Safety Assessment Measures (SSAM) method was applied to analyze a segment of the traffic network in which a roundabout and a signalized intersection interact, considering different location conditions (distances between intersections) and traffic conditions (traffic load and distribution). In such a complex segment of the traffic network, interactions between intersections can have a significant impact on both traffic flow and safety. The motivation for the research arises from the lack of concrete guidelines and instructions in existing regulations and practice regarding the positioning of roundabouts in close proximity to signalized intersections. In addition to the traffic flow aspect, which is predominantly represented in evaluations of traffic solution effectiveness, this study also emphasizes the safety aspect of traffic operations, since the combination of flow and safety represents a key criterion for sustainable planning of urban transport systems.
2. Materials and Methods
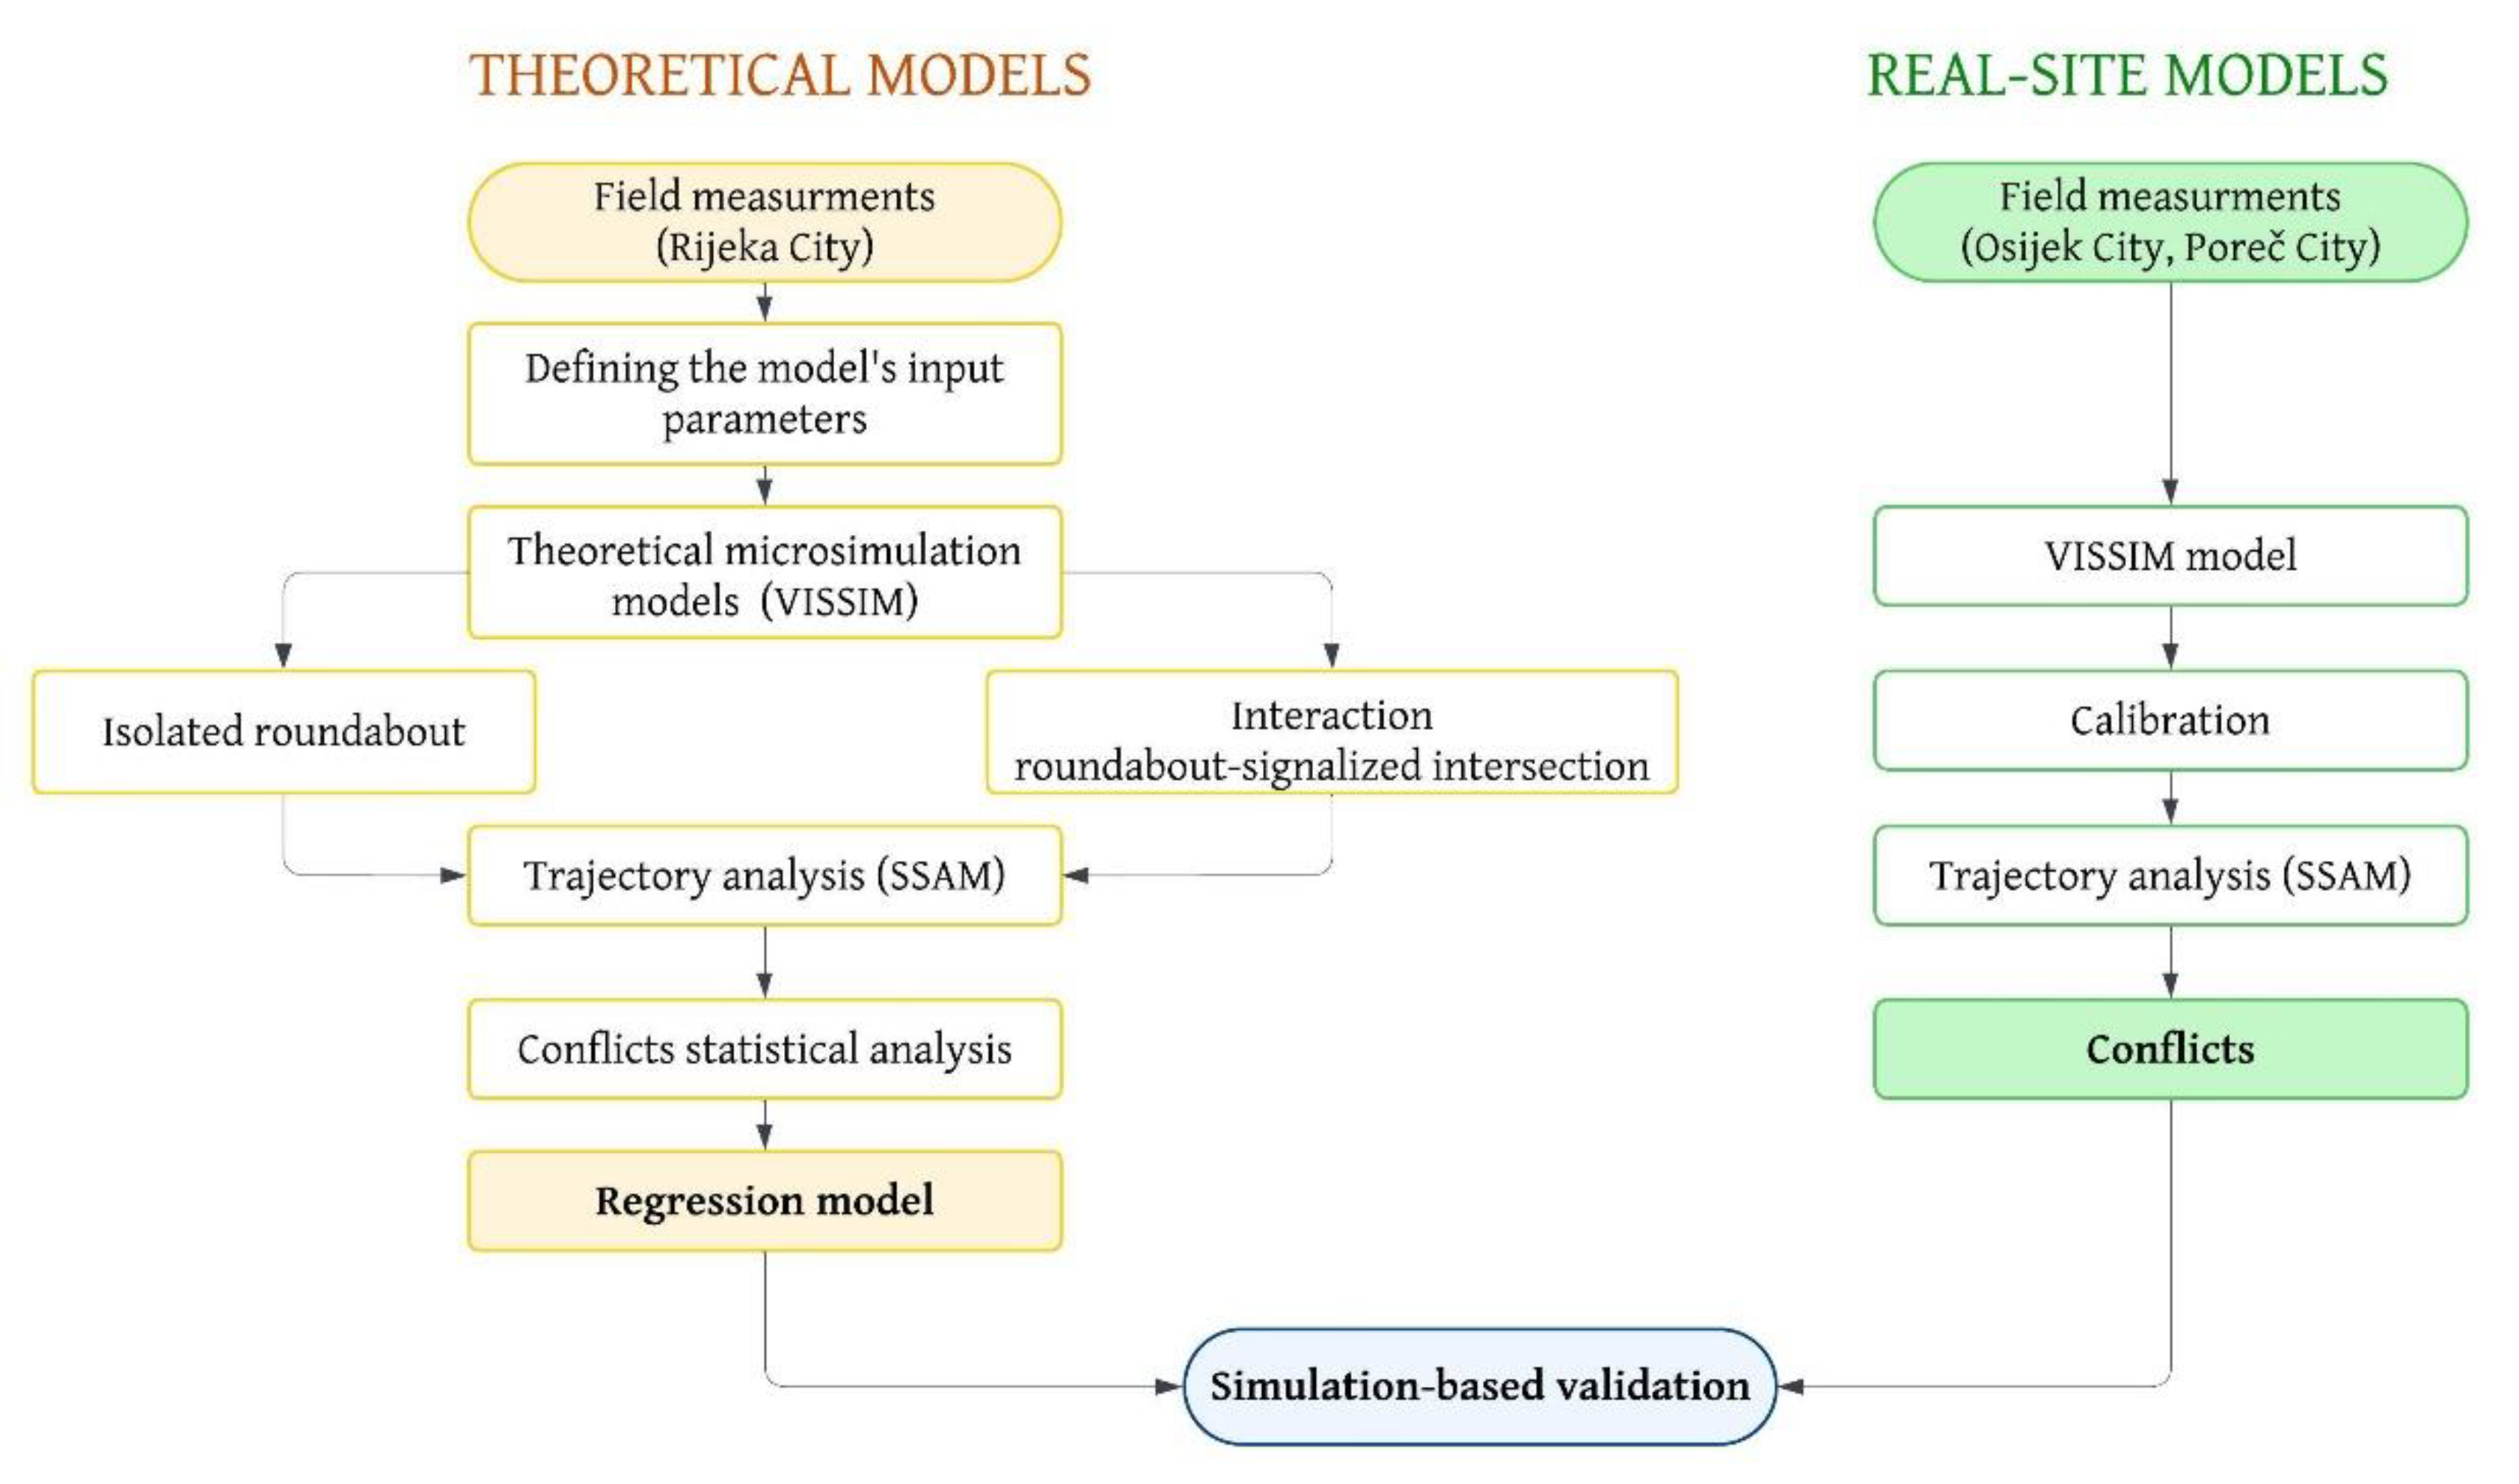
The research was conducted using a combination of experimental methods, the development of traffic microsimulation models, and statistical methods. Due to the significantly lower rates of severe crashes and fatalities at single-lane roundabouts, many crash participants in Croatia often opt not to report incidents to avoid potential penalties. Consequently, the official crash records for the roundabouts in question are notably underreported, failing to accurately represent the true situation. Therefore, official statistics were omitted from this analysis, and potential conflicts that could result in crashes were examined. The research plan is presented in the flowchart in
Figure 1, and key implementation steps can be summarized as follows.
Field measurements conducted in Rijeka City served as the basis for developing theoretical traffic microsimulation models across various scenarios. To maintain the quality and integrity of the database, field measurements were carried out using Datacollect SRD radar traffic counters, ensuring uninterrupted traffic flow. Data were recorded in continuation for 24 h on weekdays (Wednesday and Thursday).
The microsimulation models created in VISSIM were used to analyze various conditions, including both isolated roundabouts and roundabouts interacting with signalized intersections. To estimate the number of potential conflicts based on vehicle trajectories, the Surrogate Safety Assessment Model (SSAM) was employed.
VISSIM is a microsimulation program designed to analyze and optimize traffic flows and intersection capacity. Unlike other microsimulation models that focus primarily on intersections and connections, the VISSIM network model is organized through links and connections, enabling more complex intersection modeling. It utilizes a stochastic, discrete, time-adjusted approach that takes into account the psychophysical characteristics of car-following behavior, along with algorithms based on driving rules for vehicles merging from minor directions [
17].
SSAM is a software application designed to analyze trajectory files produced by microscopic simulation programs and compute surrogate safety measures. It automatically identifies, classifies, and evaluates traffic conflicts. This method removes the subjective nature linked to traditional conflict analysis techniques and enables the evaluation of a facility’s safety within a controlled environment prior to potential crashes [
26,
27].
From the dataset results generated by SSAM, a linear regression model was formulated to predict the daily total number of conflicts, based on the roundabout/signalized intersection distance, the outer radius of the roundabout, and the red-signal duration at the signalized intersection.
To evaluate the accuracy of the regression model, additional field measurements were conducted at four roundabouts in the cities of Osijek and Poreč. Based on the field data, microsimulation models were developed in VISSIM and calibrated using travel time. Vehicle trajectories exported from VISSIM were analyzed in SSAM to obtain the total number of conflicts. The analysis results were then compared with those from the previously established regression model.
2.1. Theoretical Models
This section describes the method for defining the input parameters of the model and the development of theoretical microsimulation models to analyze the influence of a signalized intersection on the adjacent roundabout.
2.1.1. Defining the Model’s Input Parameters
Field measurements were conducted at nine single-lane roundabouts located in Rijeka, Croatia. According to the Croatian guidelines for the design of roundabouts on state roads [
28], these roundabouts are classified as medium-sized urban roundabouts, with outer radii ranging from 15 to 20 meters. They are typically constructed in urban areas with relatively high traffic volumes, and their geometric elements are designed to accommodate speeds of up to 40 km/h, with an estimated daily capacity of approximately 20,000 vehicles. The results of these field measurements are detailed in the author’s previous studies [
29,
30].
Based on the collected field data, an analysis was carried out to evaluate the share of daily traffic during the peak hours, the distribution of traffic between major and minor directions, traffic composition, daily traffic volumes, applicable speed limits, and the geometric characteristics of the analyzed roundabouts. The findings of this analysis are presented in [
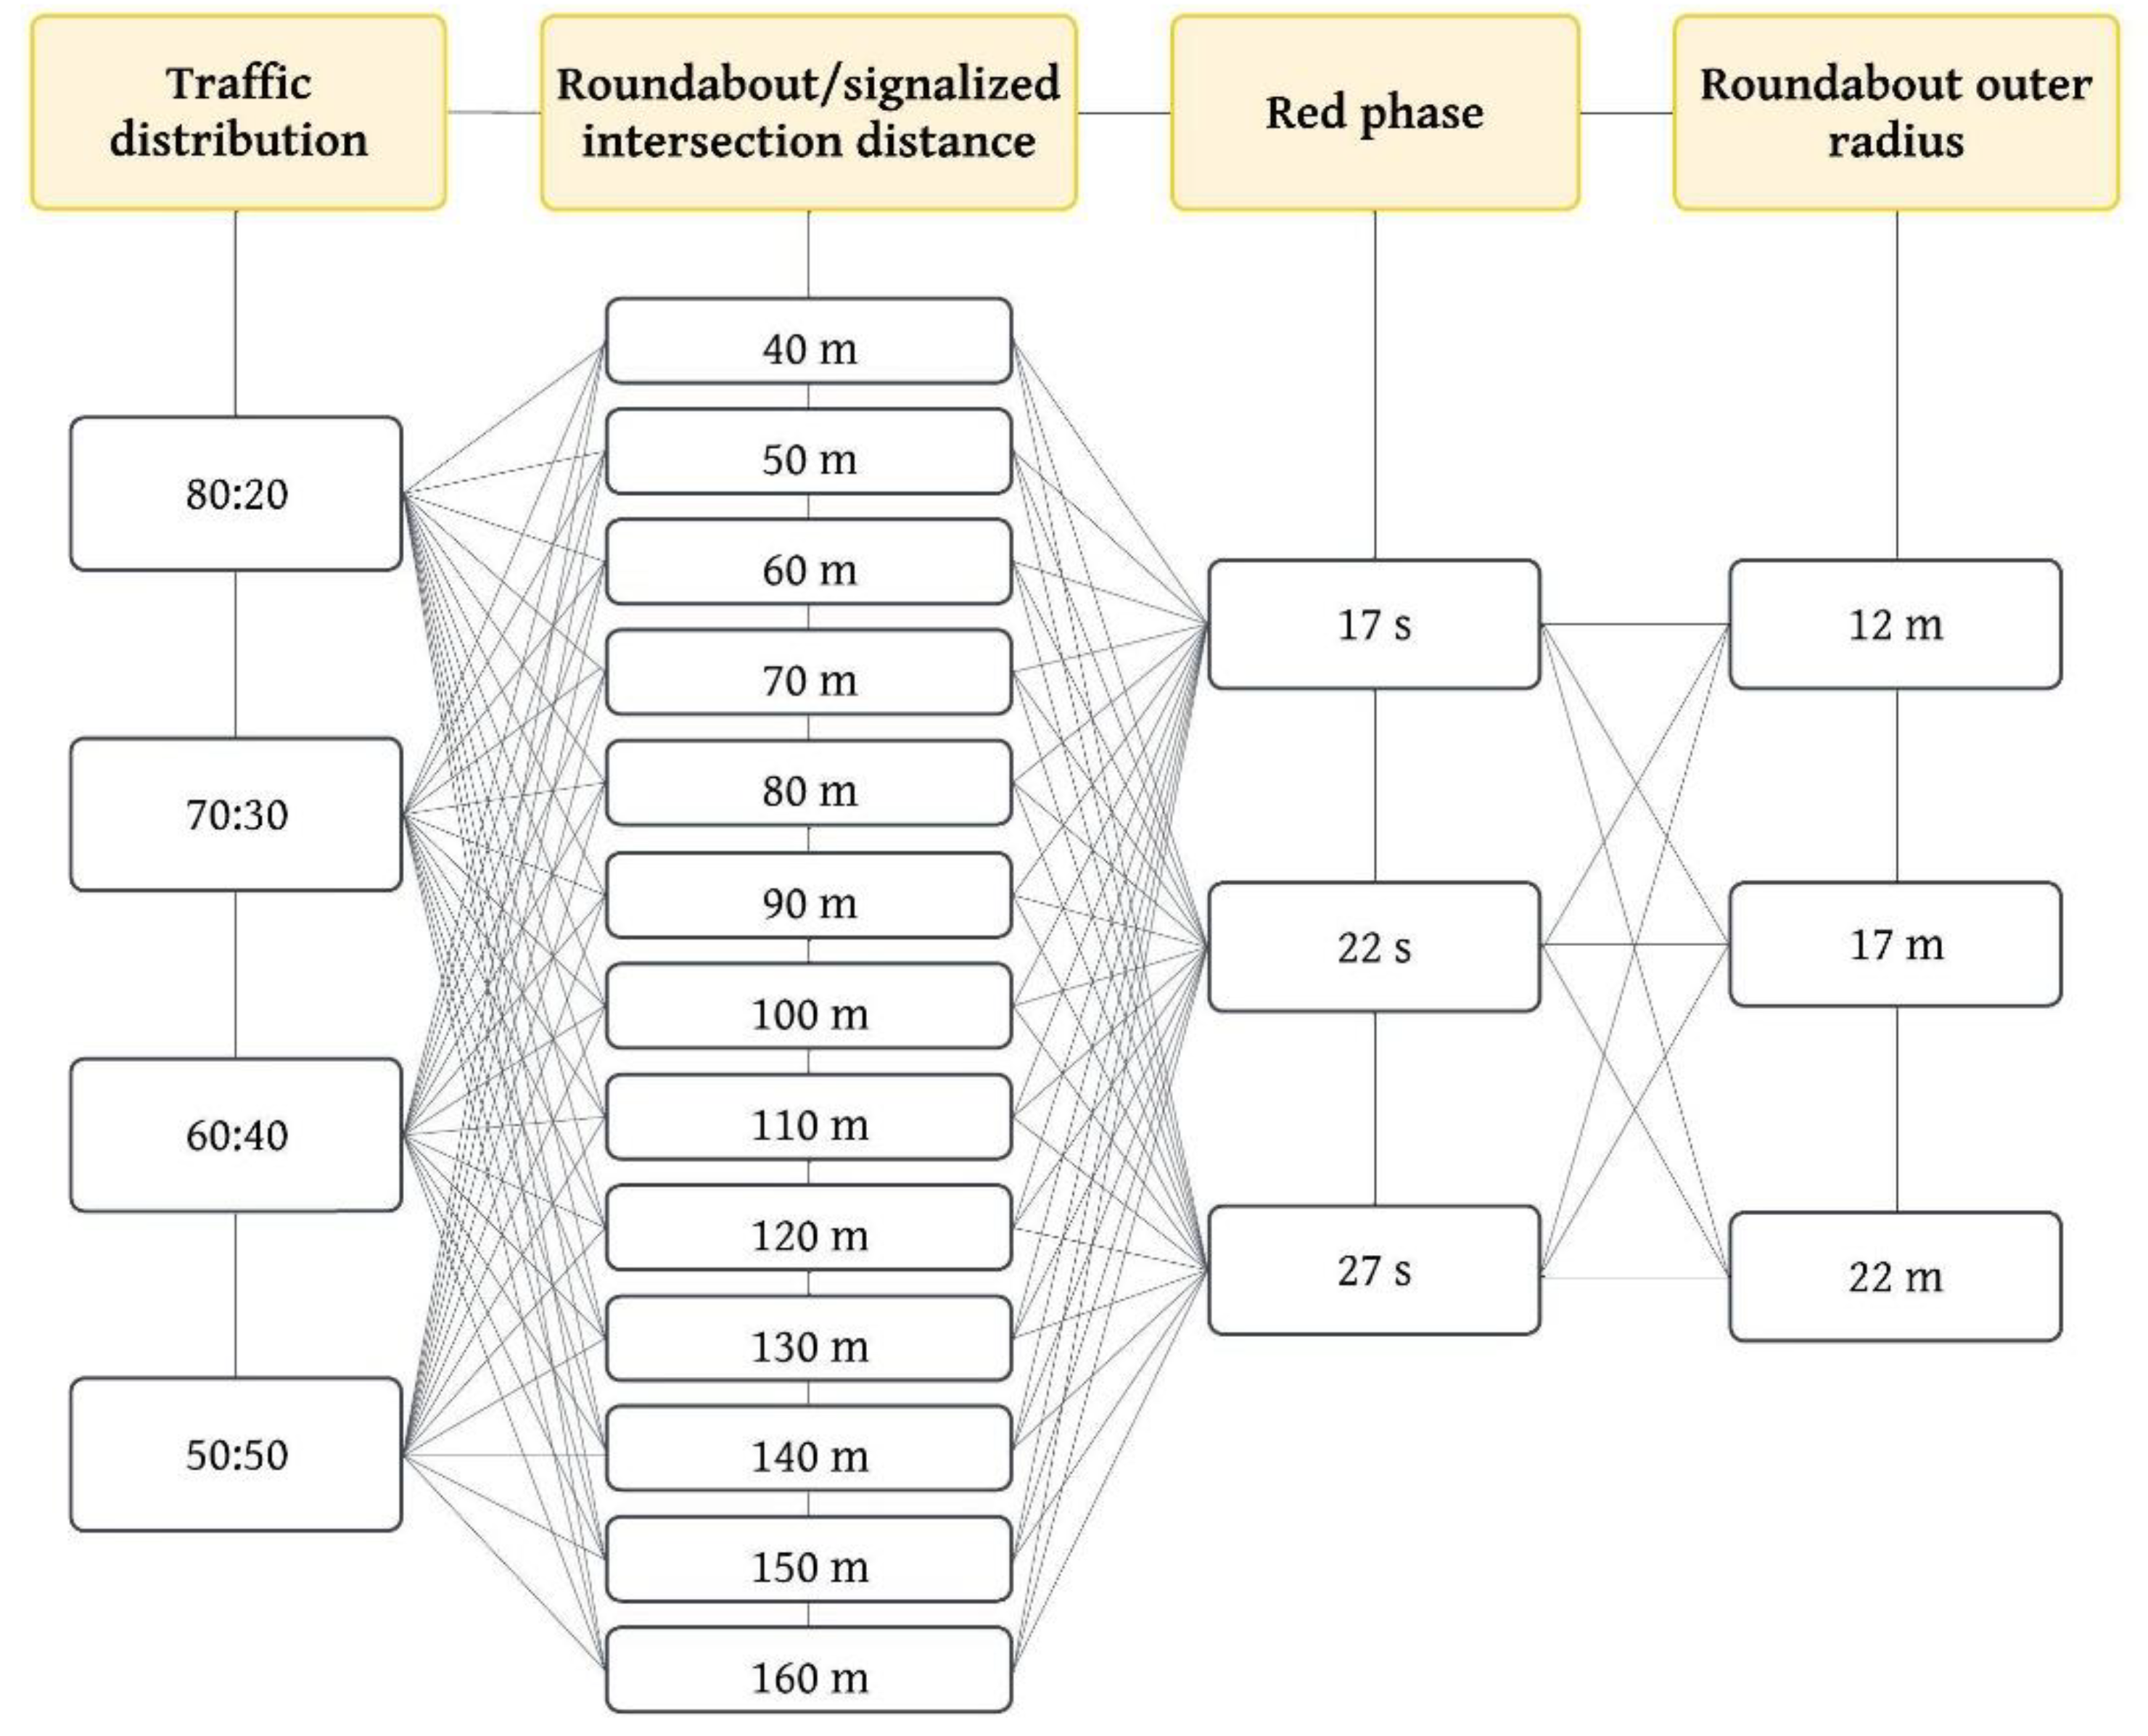
30]. It was revealed that certain analyzed intersections exhibit a highly uneven traffic distribution, with up to 80% of the total traffic volume in the main direction. Preliminary research established that the traffic distribution significantly affects vehicle travel time. Accordingly, the following traffic distributions between the major and minor directions were introduced into the model: 80:20, 70:30, 60:40, and 50:50.
Further analysis is outlined in [
29] showed that, in addition to traffic volume, the total number of conflicts is also significantly influenced by the outer radius of the roundabout, which is consistent with previous scientific findings [
31,
32,
33]. Consequently, this geometric parameter was included in the model, and roundabouts with outer radii of 12 m, 17 m, and 22 m were analyzed. The selected values of the outer radii were based on preliminary and experimental studies, as all analyzed roundabouts fall within this dimensional range. The inclusion of the outer radius as an input parameter allows the model to more effectively capture the influence of roundabout geometry on its capacity and safety performance.
Field observations highlighted the importance of the signal cycle length, particularly the duration of the red phase at the adjacent signalized intersection. It was observed that longer red phases may cause vehicle queues that can temporarily block traffic flow within the roundabout. Based on these observations, the red phase duration at the signalized intersection was incorporated into the research model through three scenarios: a 17-second red phase (total cycle length of 60 seconds), a 22-second red phase (total cycle length of 65 seconds), and a 27-second red phase (total cycle length of 70 seconds).
The distance between the roundabout and the signalized intersection was varied from 40 to 160 meters, with increments of 10 meters. In all models, the daily traffic volume was set at 20,000 vehicles per day, representing the maximum recommended capacity for roundabouts of this size according to the Croatian Guidelines [
28].
A graphical representation of the input parameters utilized is shown in
Figure 2, resulting in a total of 480 scenarios.
2.1.2. Theoretical Microsimulation Model
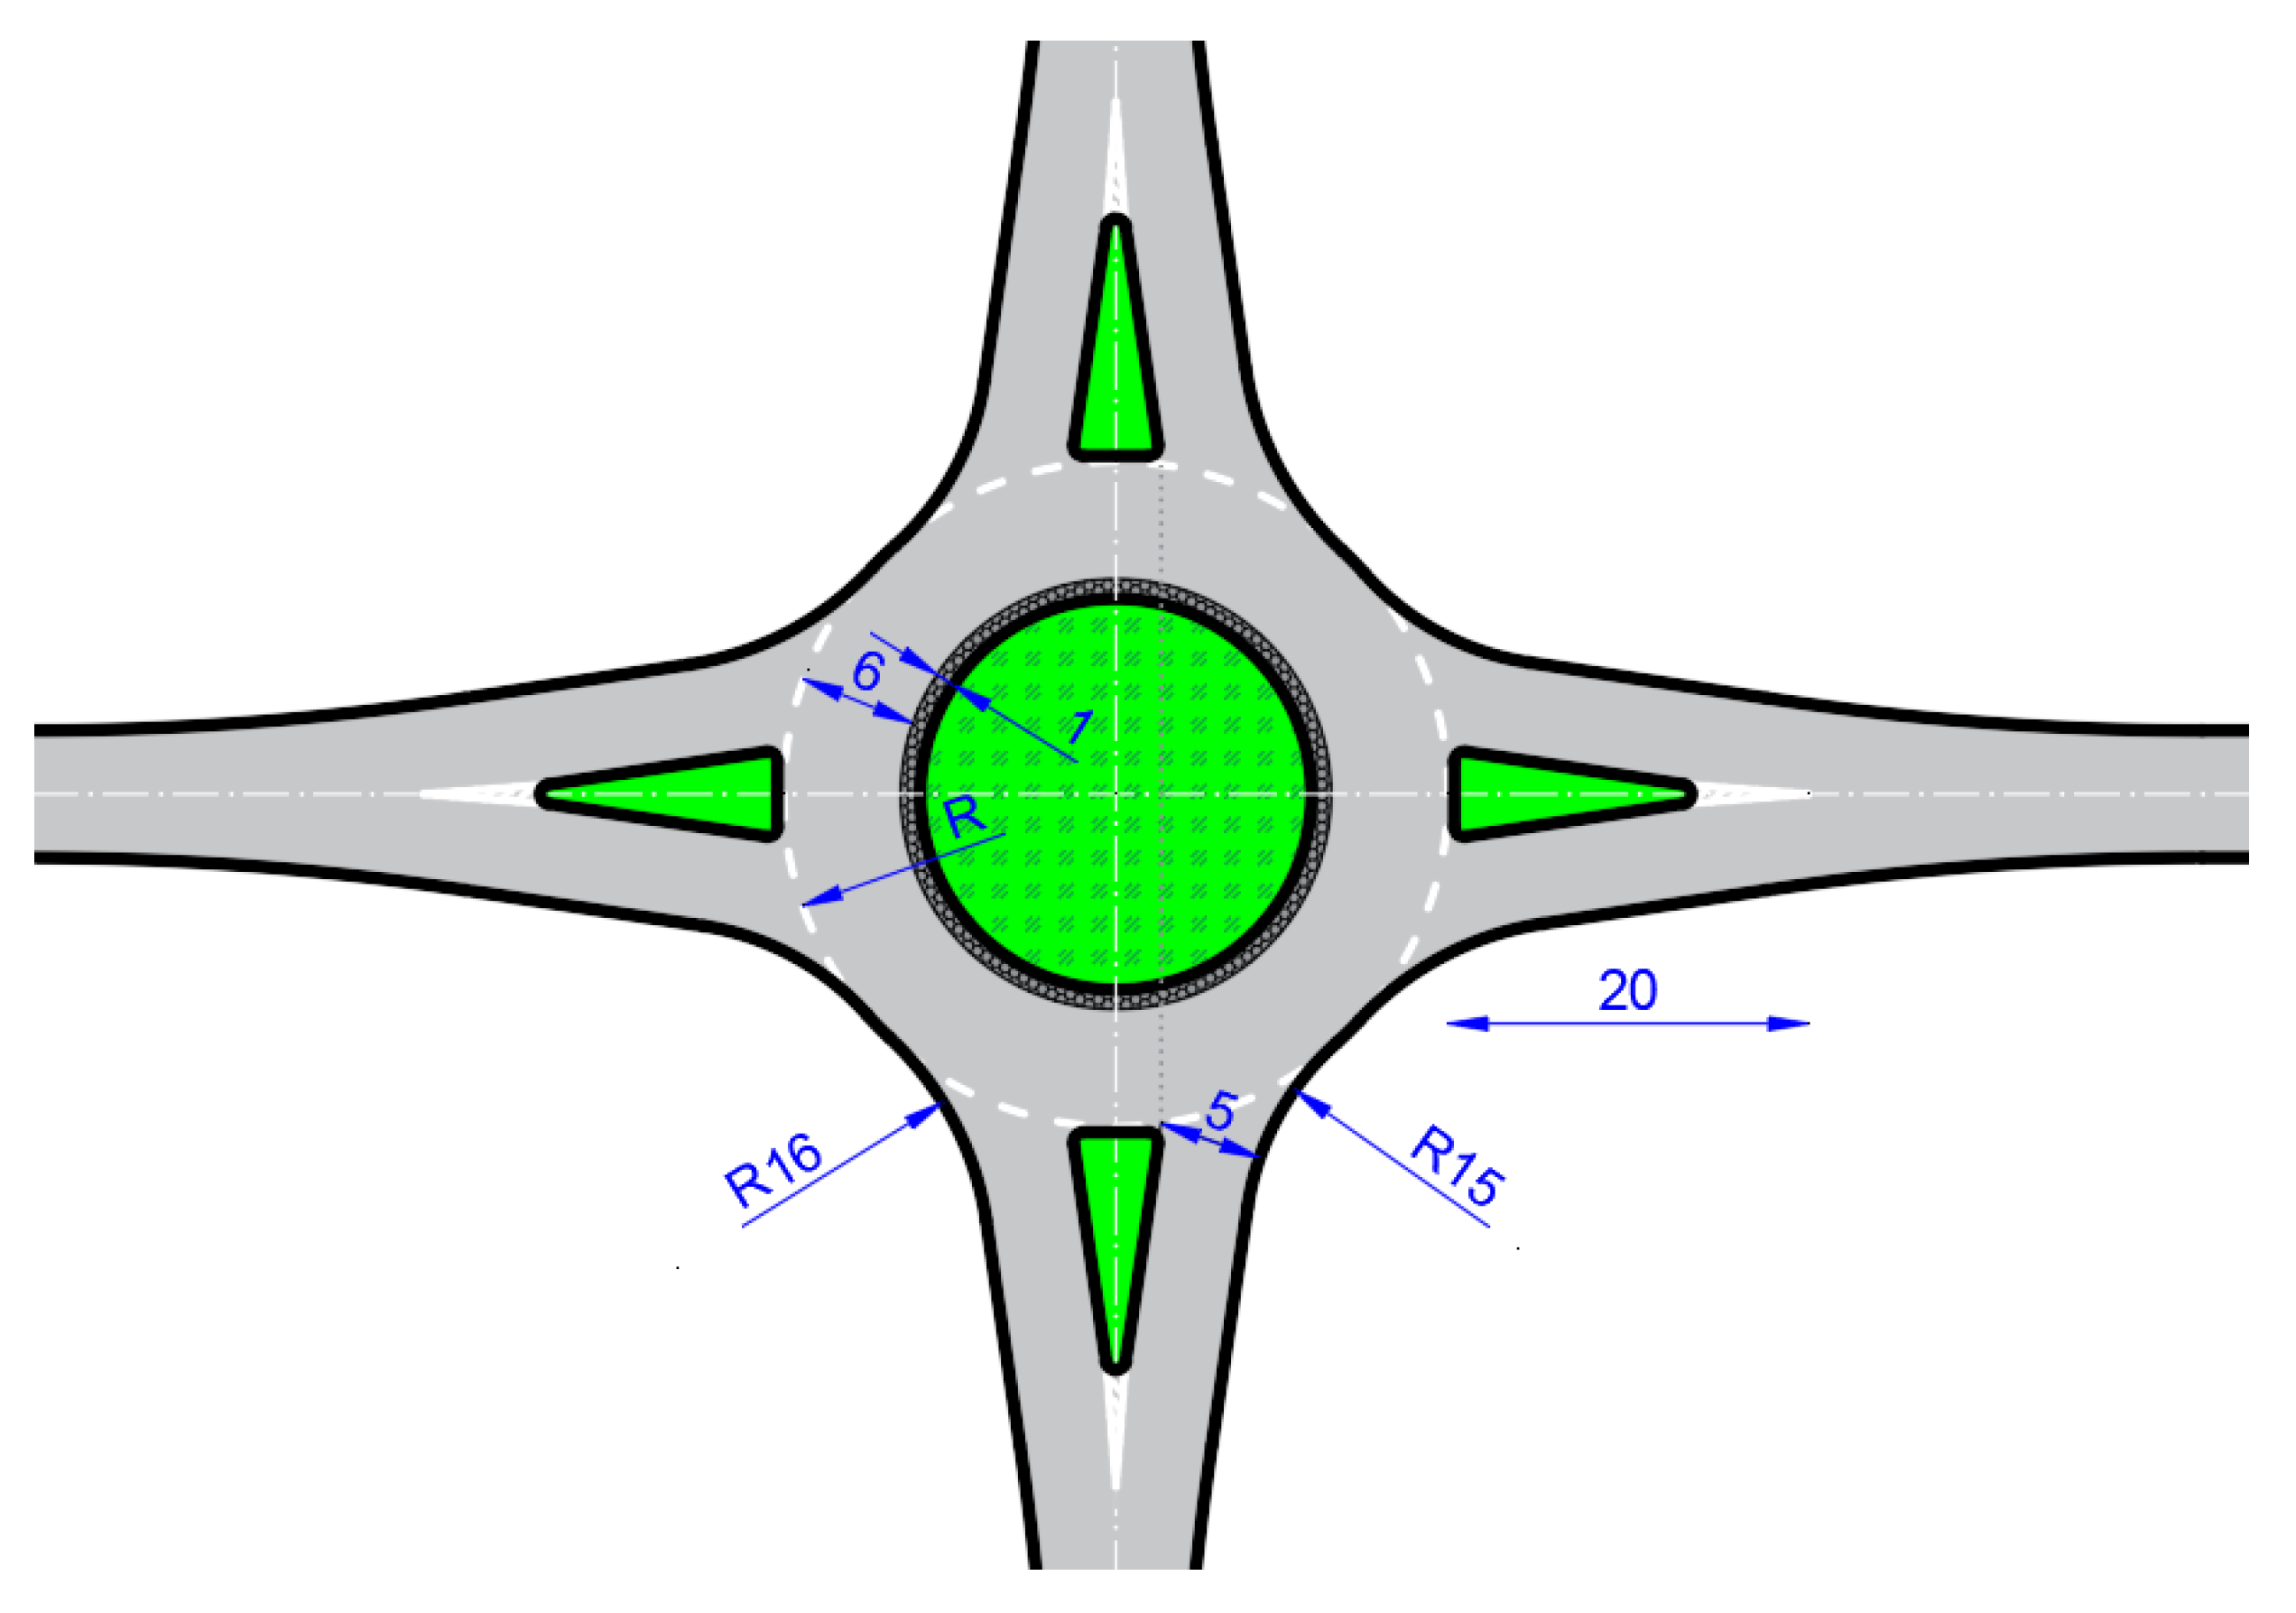
Based on traffic and geometric data collected, average input geometric elements (
Figure 3,
Table 1) were defined to establish a theoretical microsimulation model of an isolated roundabout. The speed limit within a roundabout of this size, as specified by the Guidelines [
28], is 40 km/h. The defined approach speed is 50 km/h, all approaches are two-way. To yield simpler and more relevant results, the approach axis is optimally aligned at a right angle, with no pedestrian crossings. The traffic structure was obtained by averaging the traffic counter data. A detailed description of the development of microsimulation models is provided in the author’s previous work [
30].
Although roundabout performance is frequently assessed under peak-hour conditions, preliminary findings indicated that this approach did not yield sufficient conflict data for a statistically robust analysis. As a result, each scenario was simulated over a full 24-hour period, ensuring an adequate number of conflicts for statistical analysis and capturing a wider range of driving behaviors. Employing daily traffic volumes rather than solely relying on peak-hour data is consistent with practices observed in several other SSAM-based roundabout studies [
25,
34]. This methodology also aligns with traditional safety prediction approaches that consider crashes on a daily or annual basis [
31,
35].
In accordance with recommendations from [
20], a total of ten simulations were conducted for each scenario. This encompassed 12 scenarios of an isolated roundabout and 468 scenarios examining the impact of a signalized intersection on an adjacent roundabout, resulting in a cumulative total of 4,800 microsimulations. The duration of the simulation was 24 hours and 15 minutes, which included a 15-minute warm-up period during which traffic was loaded into the road network. The remaining time was dedicated to the simulation.
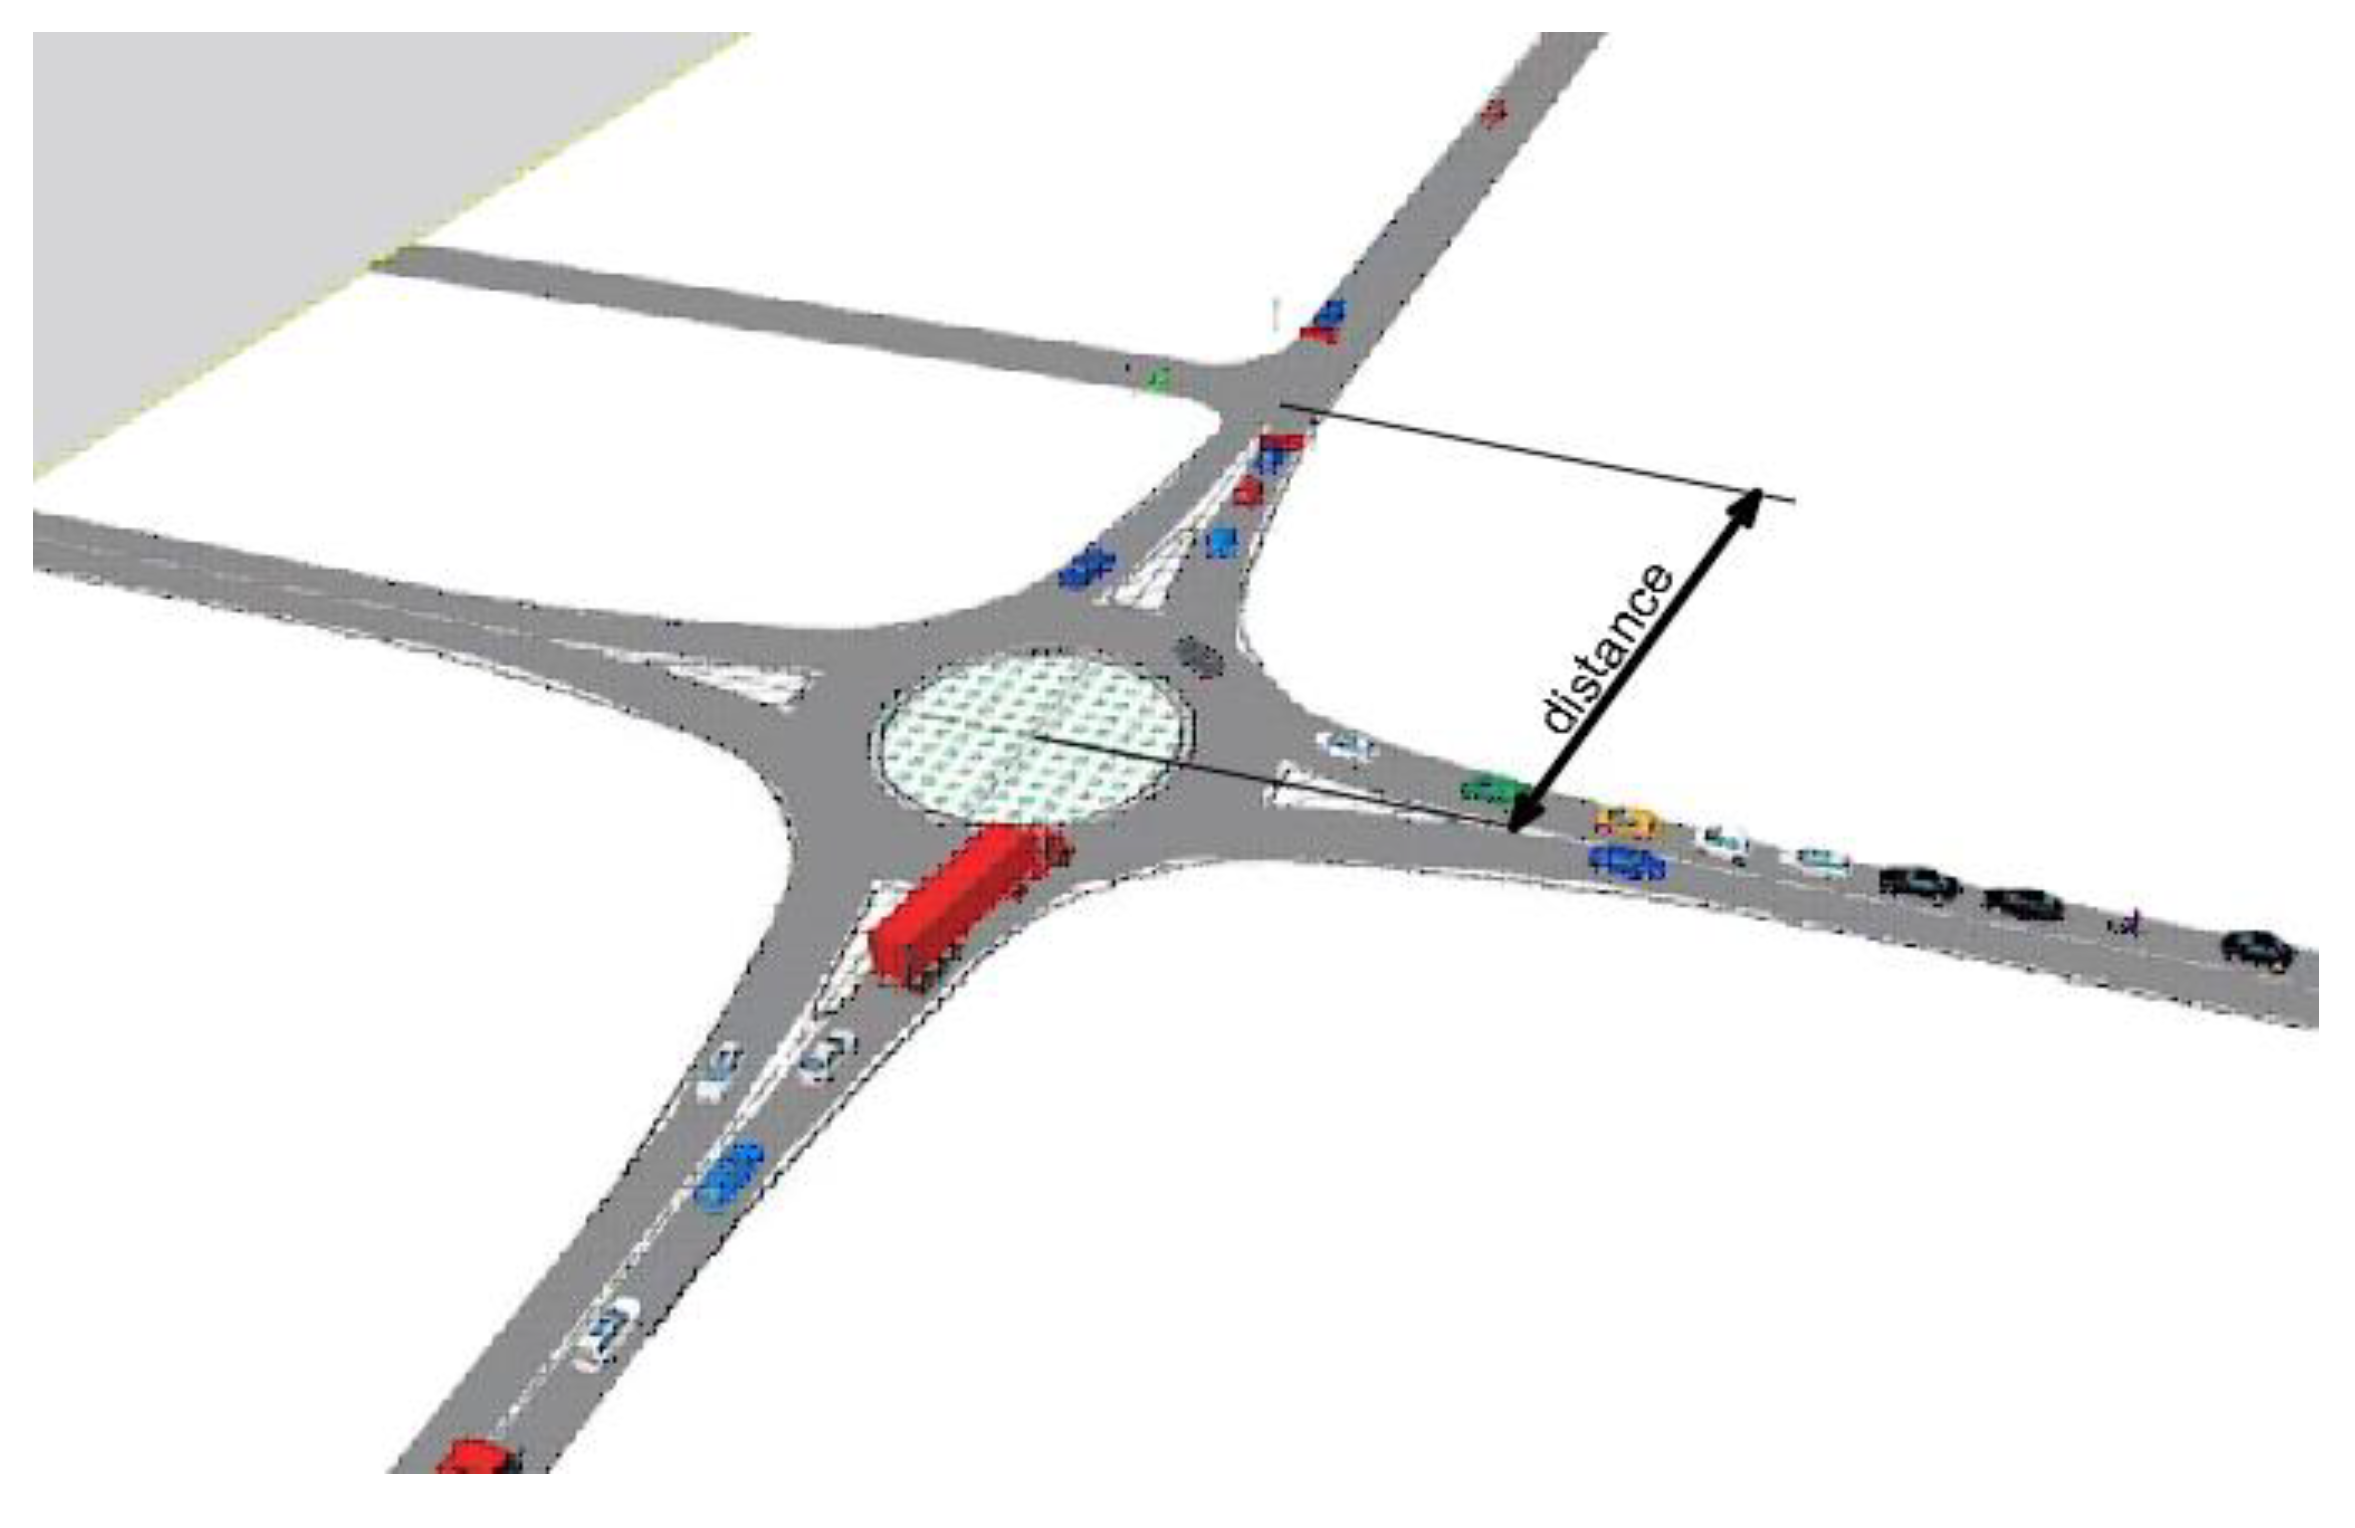
After successfully modelling the isolated roundabout, the next step was to conduct a microsimulation to assess the effect of a signalized intersection on the adjacent roundabout. A three-leg signalized intersection was incorporated into the network, with the distance from the roundabout’s central point to the signalized intersection ranging from 40 to 160 m, as shown in
Figure 4. The minimum distance of 40 m was defined as the threshold necessary to accommodate the geometric elements of both intersections.
Each microsimulation generated a separate *.trj file containing numerical vehicle-trajectory data (vehicle identity, position, speed, and timestamp at each simulation step). Each *.trj file was processed with SSAM, which automatically identified and classified traffic conflicts. A traffic conflict is defined as a situation in which a collision would occur in the absence of driver reaction, and its identification and classification are based on surrogate safety measures and the type of interaction, in accordance with the methodological framework of the tool [
18].
From the SSAM output, key metrics were extracted: the total number of conflicts and the number of conflicts by type—crossing, rear-end, and lane-change conflicts. This procedure yielded, for each scenario, a set of 10 numerical values for each conflict type as well as for the total number of conflicts, from which the average number of conflicts per scenario was calculated. Such an approach explicitly accounts for the stochastic nature of microsimulations and enables the quantification of within-scenario variability.
Conflict classification primarily hinges on the conflict angle, though link and lane information may also influence it. The conflict angle is utilized for classification as follows:
Crossing: A conflict angle greater than 85° poses the highest risk in terms of severity due to the angle of impact and the significant energy transfer involved.
Rear-end: A conflict angle of less than 30° typically results in lower severity, though it can still lead to substantial injuries, particularly in high-speed scenarios.
Lane-change: A conflict angle of 30° to 85° is moderate in severity but carries the risk of triggering cascading events, such as multi-vehicle collisions.
2.2. Real-Site Models
To assess the reliability and applicability of the regression model under real-world traffic conditions, experimental investigations were conducted at selected locations in the cities of Osijek and Poreč, Croatia, where a roundabout and a signalized intersection are positioned such that mutual interaction in traffic operations occurs.
Travel time data collected within the actual road network were used to calibrate the microsimulation models. All selected locations were analyzed during the summer months (July, August, and September).
2.2.1. Field Measurements
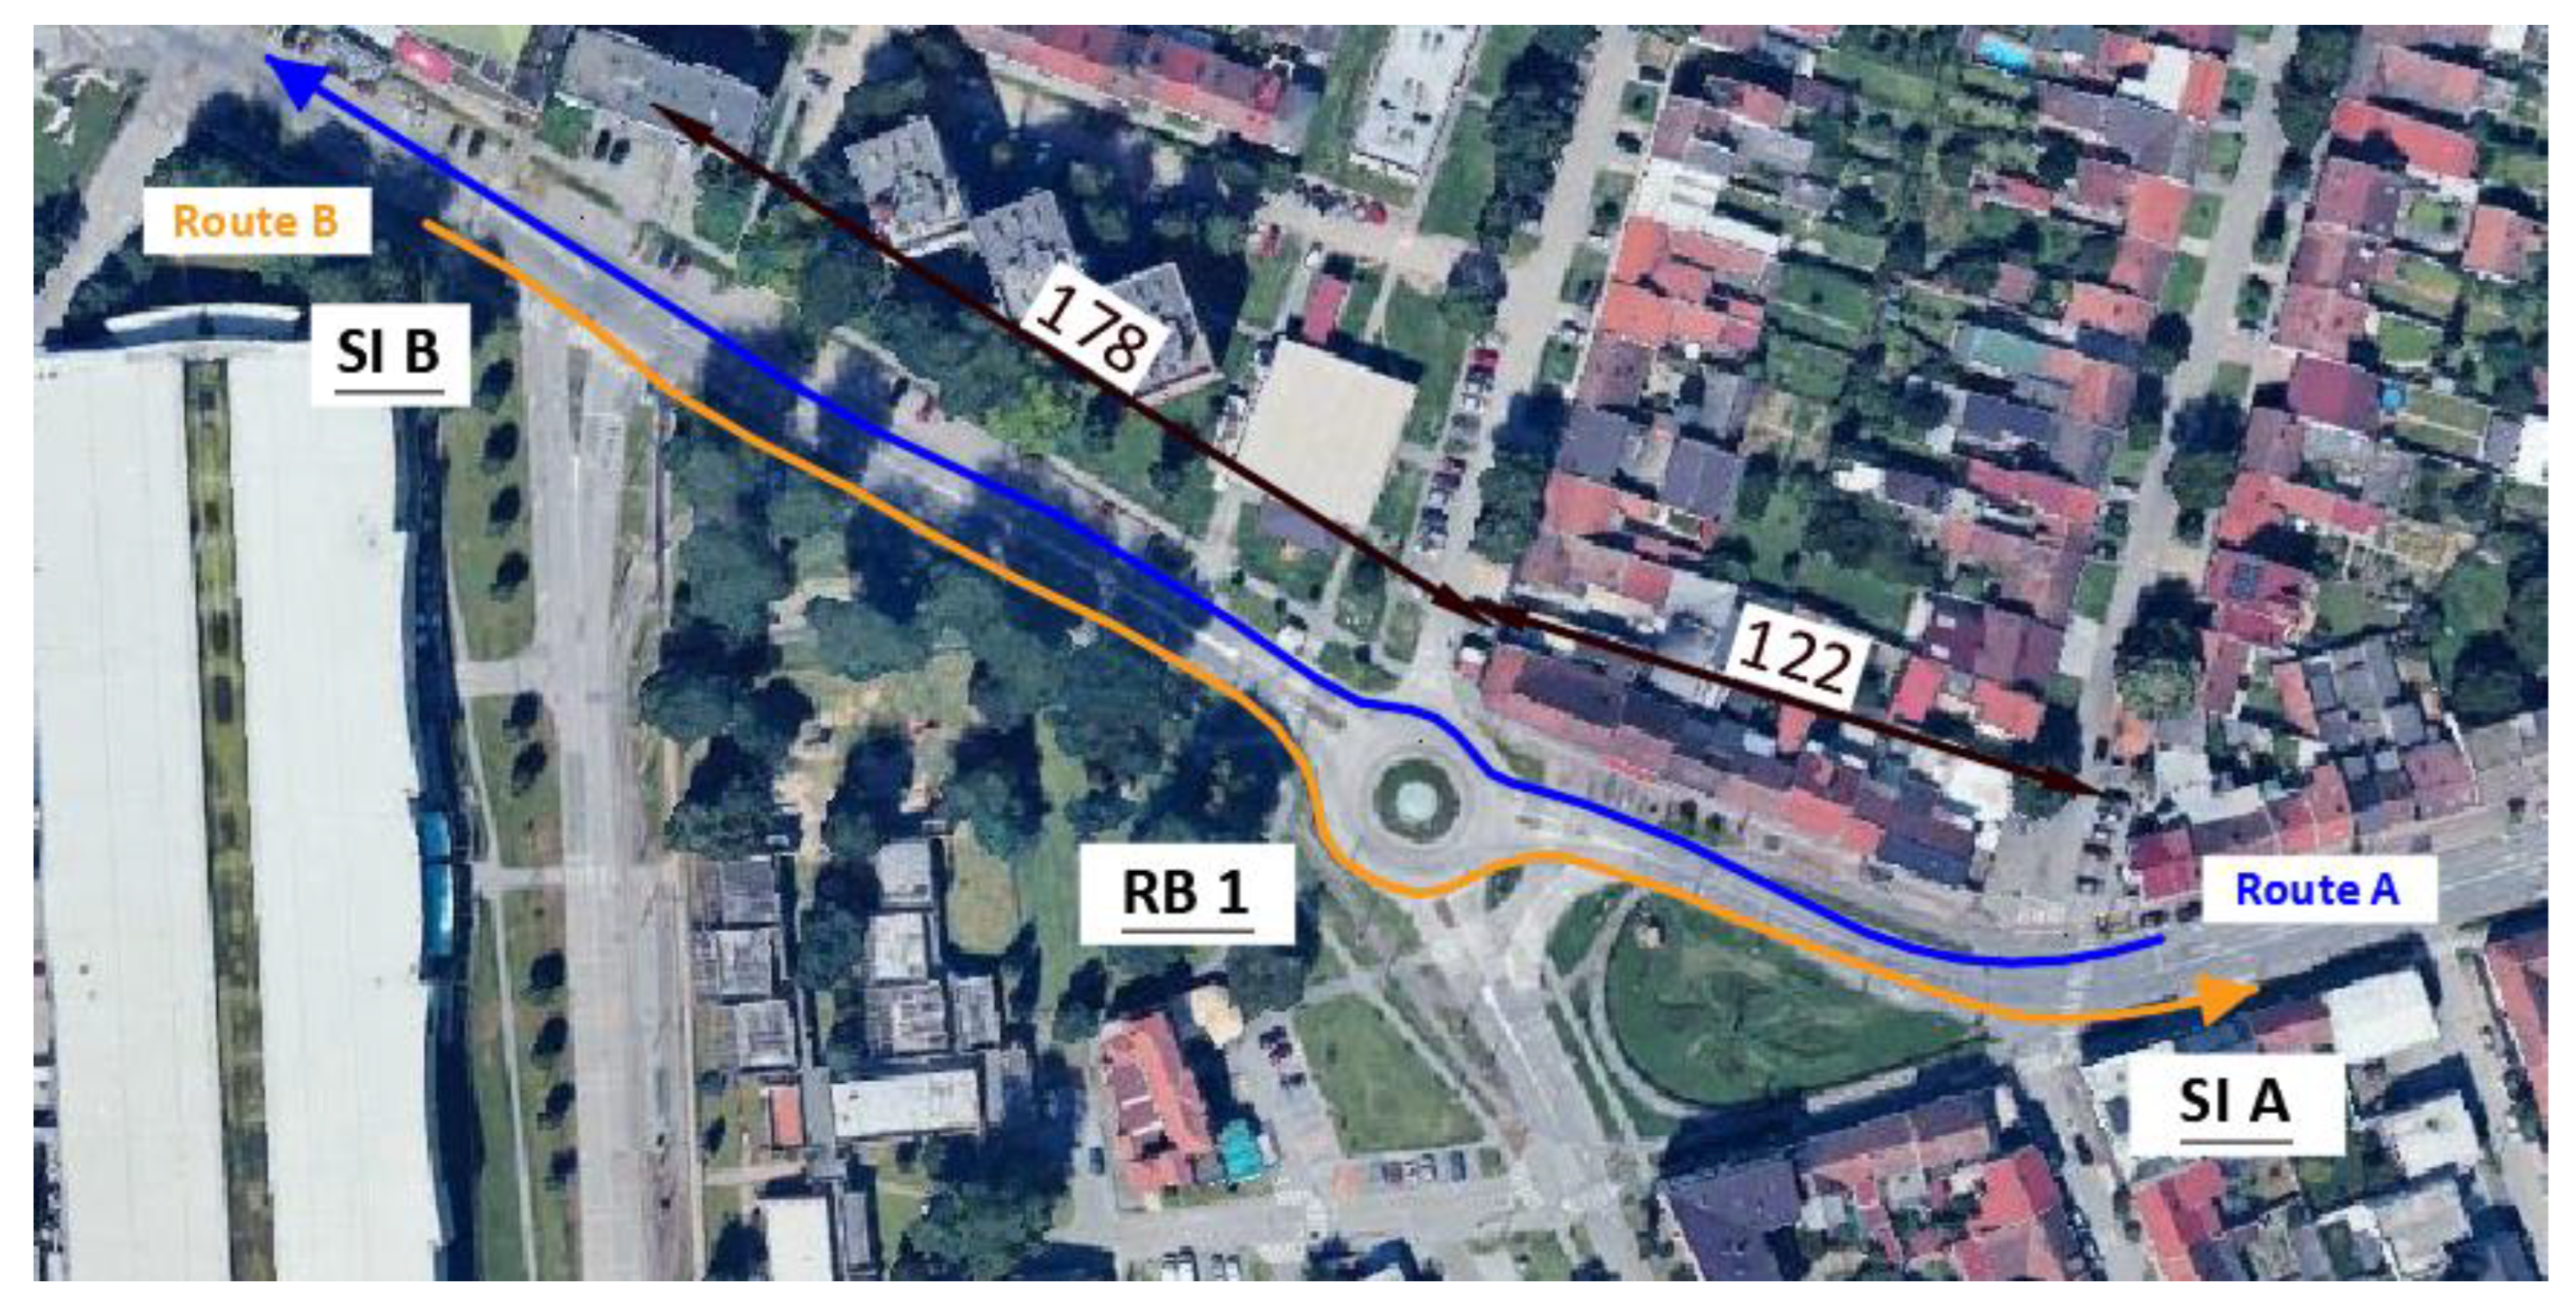
The location in the City of Osijek (Croatia) was used to validate the regression model at a roundabout (RB1) situated along a traffic corridor between two signalized intersections (SI A and SI B), where local traffic predominates (
Figure 5). This segment of the road network is located in an area predominantly designated for residential use, in the immediate vicinity of a school and a shopping center. The outer radius of the roundabout is 15 meters, which, according to Croatian guidelines [
28], classifies it as a medium-sized urban roundabout. Three intersections were analyzed:
Roundabout (four-leg) – RB1
Signalized intersection (four-leg) – SI A – located 122 m from the roundabout
Signalized intersection (three-leg) – SI B – located 178 m from the roundabout
The cycle length at Signalized Intersection A is 90 seconds, with the red interval of the first phase lasting 25 seconds. The cycle length at Signalized Intersection B is also 90 seconds, with the red interval of the first phase lasting 21 seconds.
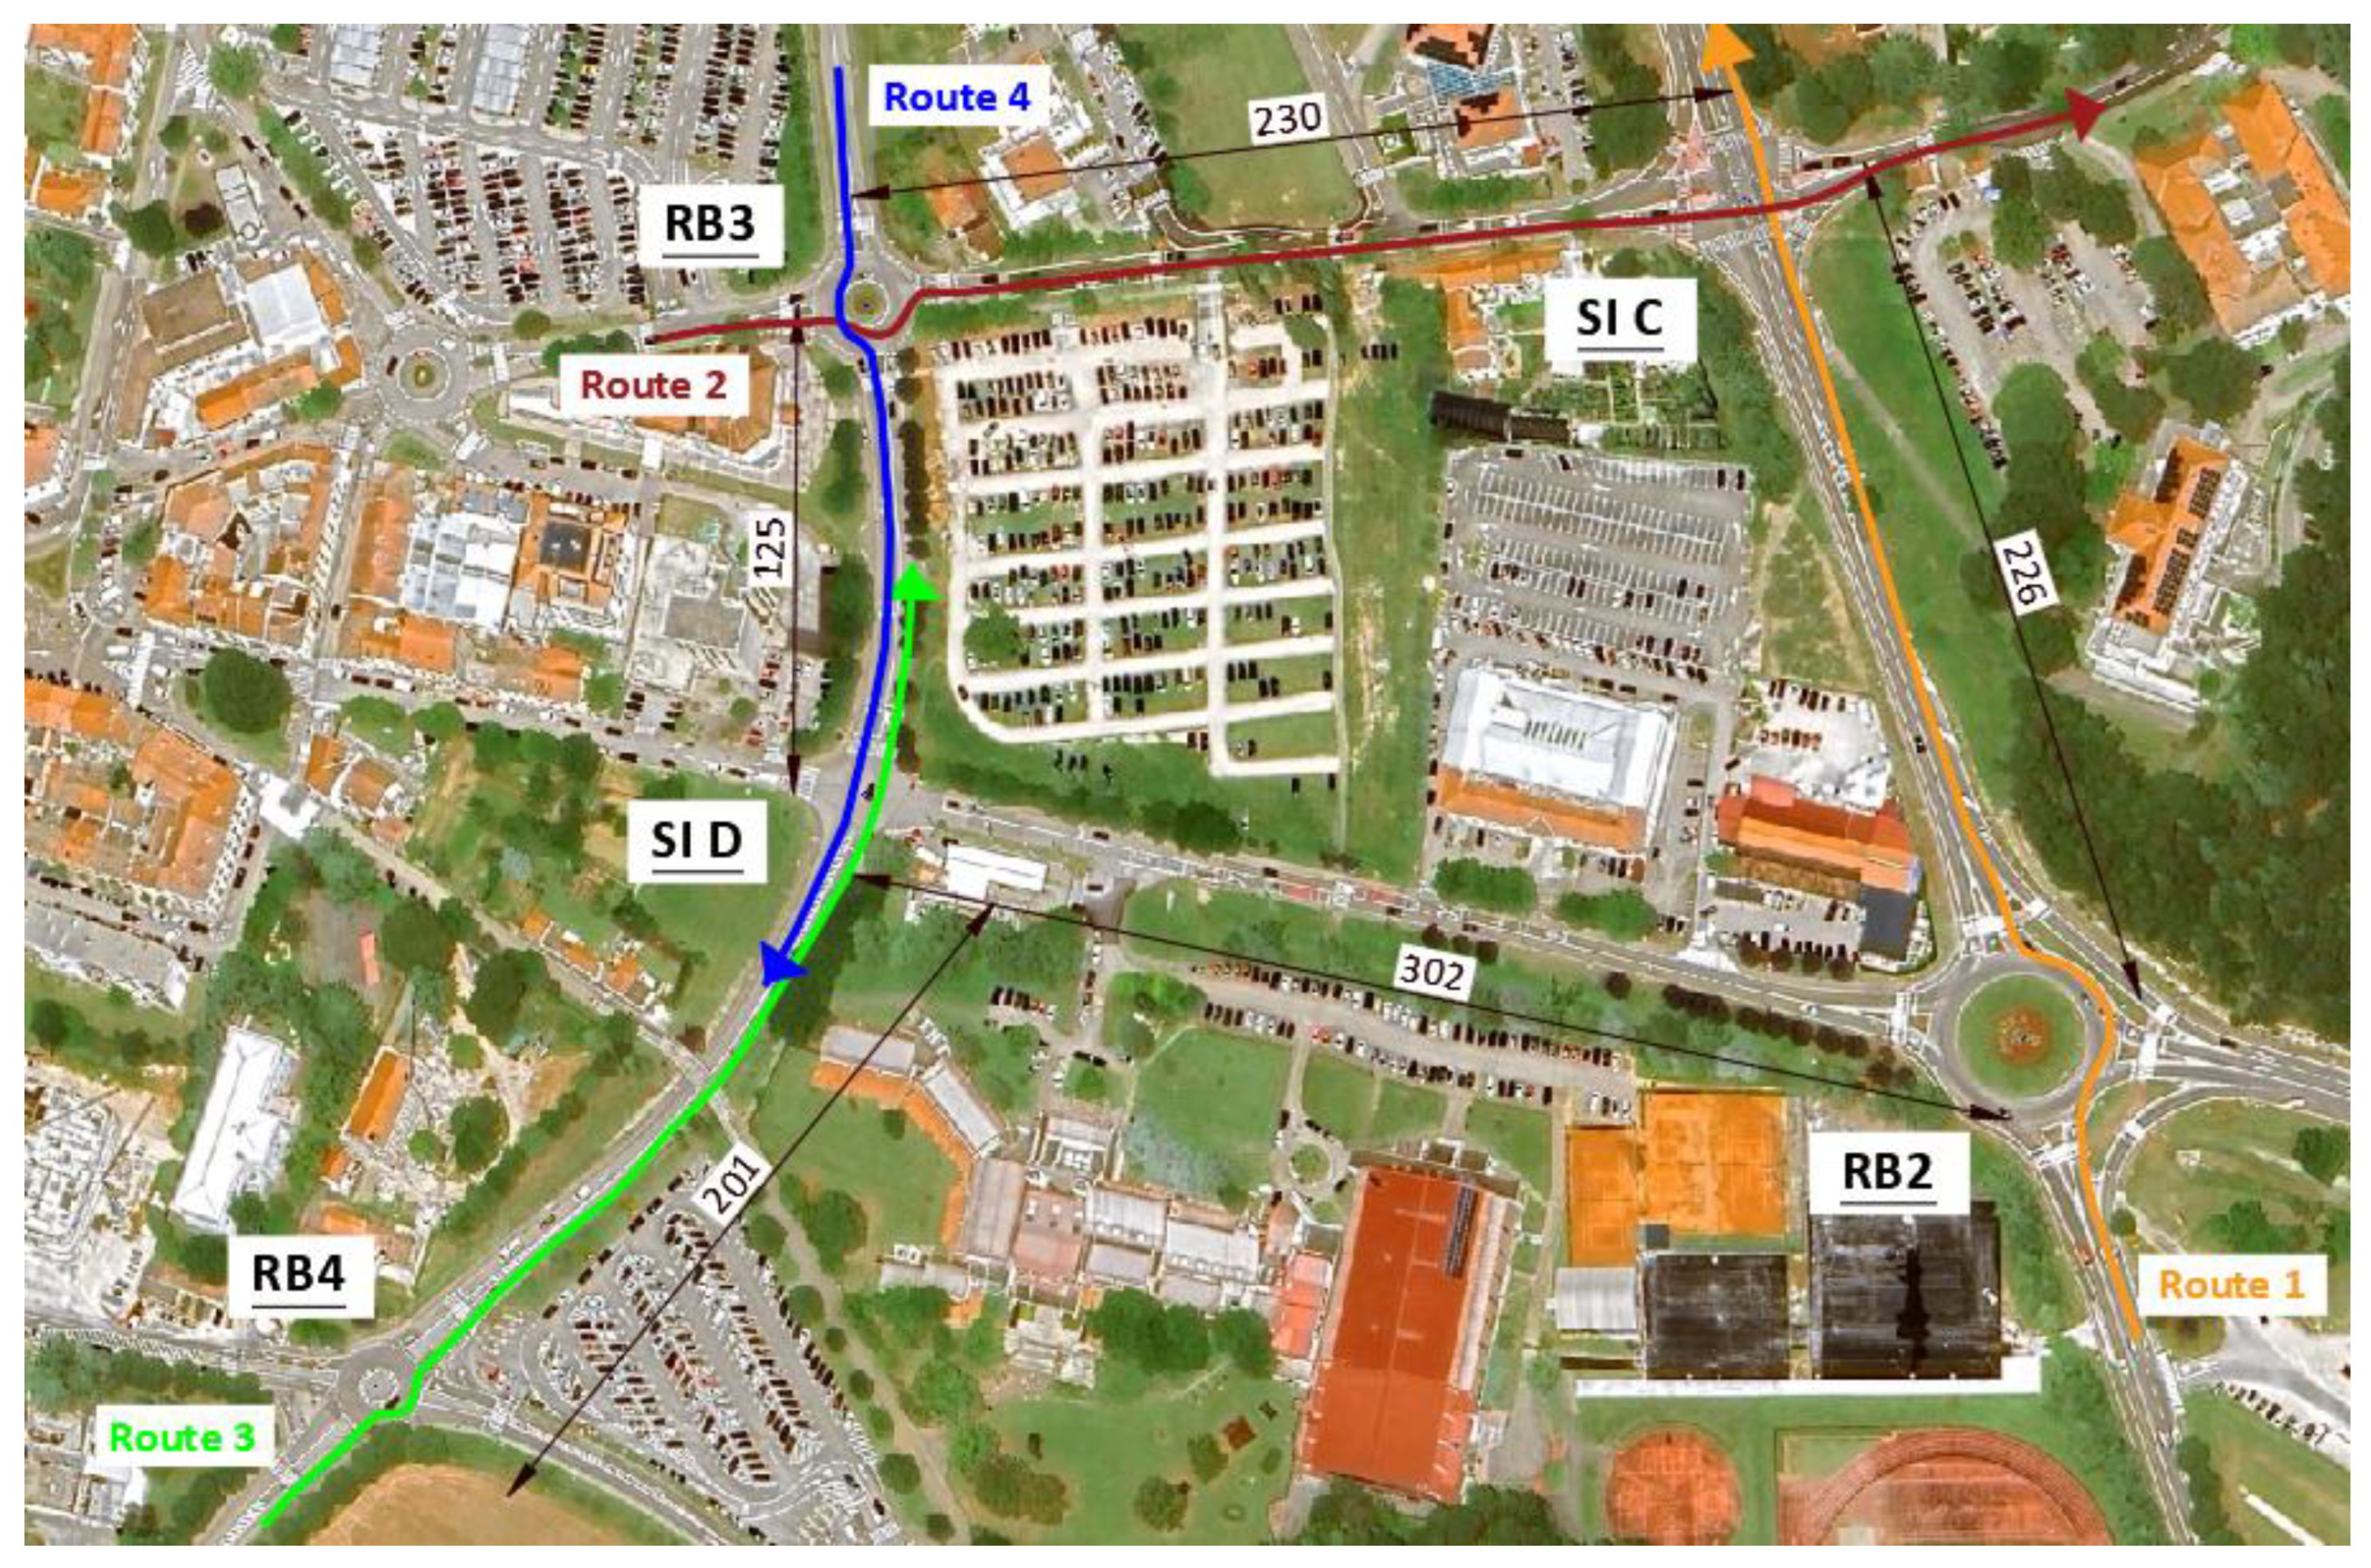
The second analyzed segment of the road network is situated in the City of Poreč (Croatia) and includes three roundabouts in close proximity to signalized intersections, as shown in
Figure 6. This network segment is located in a predominantly residential area, directly adjacent to the historic town center, a shipping plaza, and the primary municipal parking facility. Given that Poreč is a tourist destination, a significant portion of traffic at these roundabouts consists of tourists, leading to greater diversity in driver behavior.
Three roundabouts and two signalized intersections were analyzed:
Roundabout (four-leg) – RB2 – located 226 m from the SI C and 302 m from the SI D
Roundabout (four-leg) – RB3 – located 230 m from the SI C and 125 m from the SI D
Roundabout (four-leg) – RB4 – located 201 from the SI D
Signalized intersection (four-leg) – SI C
Signalized intersection (four-leg) – SI D
The cycle length at Signalized Intersection SR C is 60 seconds, with the red interval of the first phase lasting 25 seconds and that of the second phase lasting 35 seconds. The cycle length at Signalized Intersection SR D is 70 seconds, with the red interval of the first phase lasting 25 seconds.
During the afternoon peak hour, measurements were carried out to determine travel times on six routes between predefined control points (
Figure 4 and
Figure 5). All routes were 300 m long. Travel time is defined as the average travel time [s] of vehicles along the 300 m route. The length of the analyzed road segment was selected in order to comprehensively capture all relevant elements of vehicle movement under the combined influence of a roundabout and a signalized intersection. The chosen distance enables precise measurement of travel time, including the deceleration phase when approaching the roundabout, vehicle circulation through the roundabout, acceleration upon exiting, as well as the subsequent deceleration, stopping, and passage through the signalized intersection. Furthermore, the segment allows for an assessment of the effects of varying distances between intersections (40–160 m), while ensuring sufficient data variability for detailed statistical analysis. The vehicle travel time was assessed by recording 15 individual passes of a vehicle through both the roundabout and the signalized intersection for each route under analysis. The results are detailed in
Table 3. This table outlines the time intervals for the individual traffic signals at the signalized intersections corresponding to the signal phase during which traffic flows along the observed routes. It includes data on the total cycle length (C) as well as the specific durations of the green (g), red-amber (r-a), red (r), and amber (a) light intervals.
2.2.2. Calibration of the Real-Site Microsimulation Models
Based on the field measurements conducted in the cities of Osijek and Poreč, described in detail in
Section 2.2.1, microsimulation models of selected segments of the traffic network were developed in VISSIM. To obtain the most relevant data, the microsimulation models were calibrated using travel time data.
In the VISSIM software, two types of parameters—measurable and non-measurable (i.e., difficult to quantify)—significantly influence simulation outcomes. Measurable parameters include traffic volume, traffic distribution and composition, signal control, vehicle speeds, and the dynamic characteristics of traffic flow. The accuracy of these field-collected parameters is crucial, as they directly affect the reliability of the model.
For the purposes of this analysis, the following parameters were selected for calibration:
Random seed increment
Average standstill distance (m) – default value: 2
Additive part of the desired safety distance (m) – default value: 2
Multiplicative part of the desired safety distance (m) – default value: 3
The random seed increment determines the step size used to modify the value of the random number generator, thereby producing different values for the stochastic variables of the simulator’s mathematical models.
The remaining three parameters relate to driver behavior as defined by the Wiedemann 74 car-following model, which is well-suited for simulating urban traffic networks. The average standstill distance represents the gap that drivers maintain between their own vehicle and the one ahead under complete stop conditions, reflecting local driving habits. During calibration, this parameter was varied between 1 and 3 m.
The additive part of the desired safety distance corresponds to the constant component of the safety gap that drivers maintain regardless of vehicle speed and represents the minimum safety distance during driving. During calibration, this parameter was varied from 1 to 5 m.
The multiplicative part of the desired safety distance describes the speed-dependent component of the safety gap. Its value is multiplied by the vehicle speed, thereby determining the additional distance drivers maintain based on their speed. During calibration, this parameter was varied between 1 and 6.
These driver behavior parameters directly regulate the models governing vehicle spacing during driving and stopping. Previous research has demonstrated their high sensitivity— even small changes in their values can substantially affect simulation results [
36,
37]. Furthermore, studies focused on the calibration of urban traffic networks [
38,
39] indicate that the average standstill distance and the additive and multiplicative components of the desired safety distance have the greatest influence on queue lengths and vehicle waiting times.
Travel time was selected as the primary calibration indicator because it integrates a range of key elements of driver behavior, including desired speeds, reaction times, vehicle interactions, and queue formation, thereby providing a comprehensive representation of traffic flow dynamics. An additional advantage of this metric is its relative simplicity and the precision of its measurements. Existing research confirms the effectiveness of travel time as a calibration criterion under various traffic conditions, showing that this indicator clearly reflects the functional performance of the traffic system and allows reliable evaluation of the quality of the simulation model [
40,
41,
42].
The development of the traffic microsimulation models for the existing conditions was based on a digital orthophoto map and project documentation provided by the City of Osijek and the City of Poreč. Operating speed, traffic composition, and daily traffic volume were determined through field measurements and analysis of data obtained from traffic counters (
Section 2.2.1). The key input parameters used in developing the traffic microsimulation models are presented in Table 2, including the outer radius of the analyzed roundabouts, daily traffic volume, traffic distribution between major and minor directions, traffic composition, and daily operating speeds.
The calibration of the traffic microsimulation model is an iterative process focused on identifying the optimal values for the model’s input parameters. This calibration involved comparing the simulated travel times with the observed travel times recorded between the roundabout and the signalized intersection. The chosen route length of 300 meters aligns with that utilized in the development of the regression model (
Section 3.2).
The calibration criterion was defined by Equation 1 [
40]:
where
TMOD denotes the mean model-predicted travel time between reference points, and
TMEAS represents the mean measured travel time between the same points. The model is considered calibrated when the above condition is satisfied.
The results of the travel time comparison are shown in
Table 4, with relative deviations ranging from 0.50% to 4.79%, indicating strong agreement between the simulation model and field data.
The optimal values of driver behavior input parameters used for calibration are presented in
Table 5.
3. Results and Discussion
This section presents the results of the traffic conflict analysis and discusses their implications for the safety performance of roundabout–signalized intersection corridors. First, the influence of key geometric and traffic parameters—namely the distance between the roundabout and the signalized intersection, the outer roundabout radius, the red time duration at the signalized intersection, and the distribution of traffic between the major and minor directions—is examined using conflicts obtained from VISSIM and SSAM over a 24-hour period.
In the second part of the section, the results of a statistical analysis are presented, including descriptive statistics, correlation analyses, and the development of a multiple linear regression model to predict the total number of conflicts. The predictive performance of models of varying complexity is evaluated, and the final conflict prediction model is proposed together with its applicability bounds. Finally, the regression model is validated by comparing its predictions with conflicts derived from calibrated microsimulation models for corridors in the cities Osijek and Poreč.
3.1. Analysis and Interpretation of the Number of Conflicts over a 24-Hour Period
Analysis was conducted using data obtained from VISSIM and SSAM to evaluate the impact of observed parameters on the total number of conflicts in the analyzed scenarios.
The findings reveal a significant influence of the distance between the roundabout and the signalized intersection on conflict occurrences, particularly for roundabouts with a smaller outer radius (R = 12 m). Scenarios involving isolated roundabouts consistently recorded fewer conflicts compared to those with closely spaced intersections. At the minimum analyzed spacing of 40 m, the total number of conflicts surged by 40% to 60%, with the most pronounced effect noted for roundabouts with an external radius of 12 m. For larger roundabouts (outer radii of 17 m and 22 m), the adverse effects of reduced spacing were also evident, typically leading to increases in conflicts of 20% to 40%.
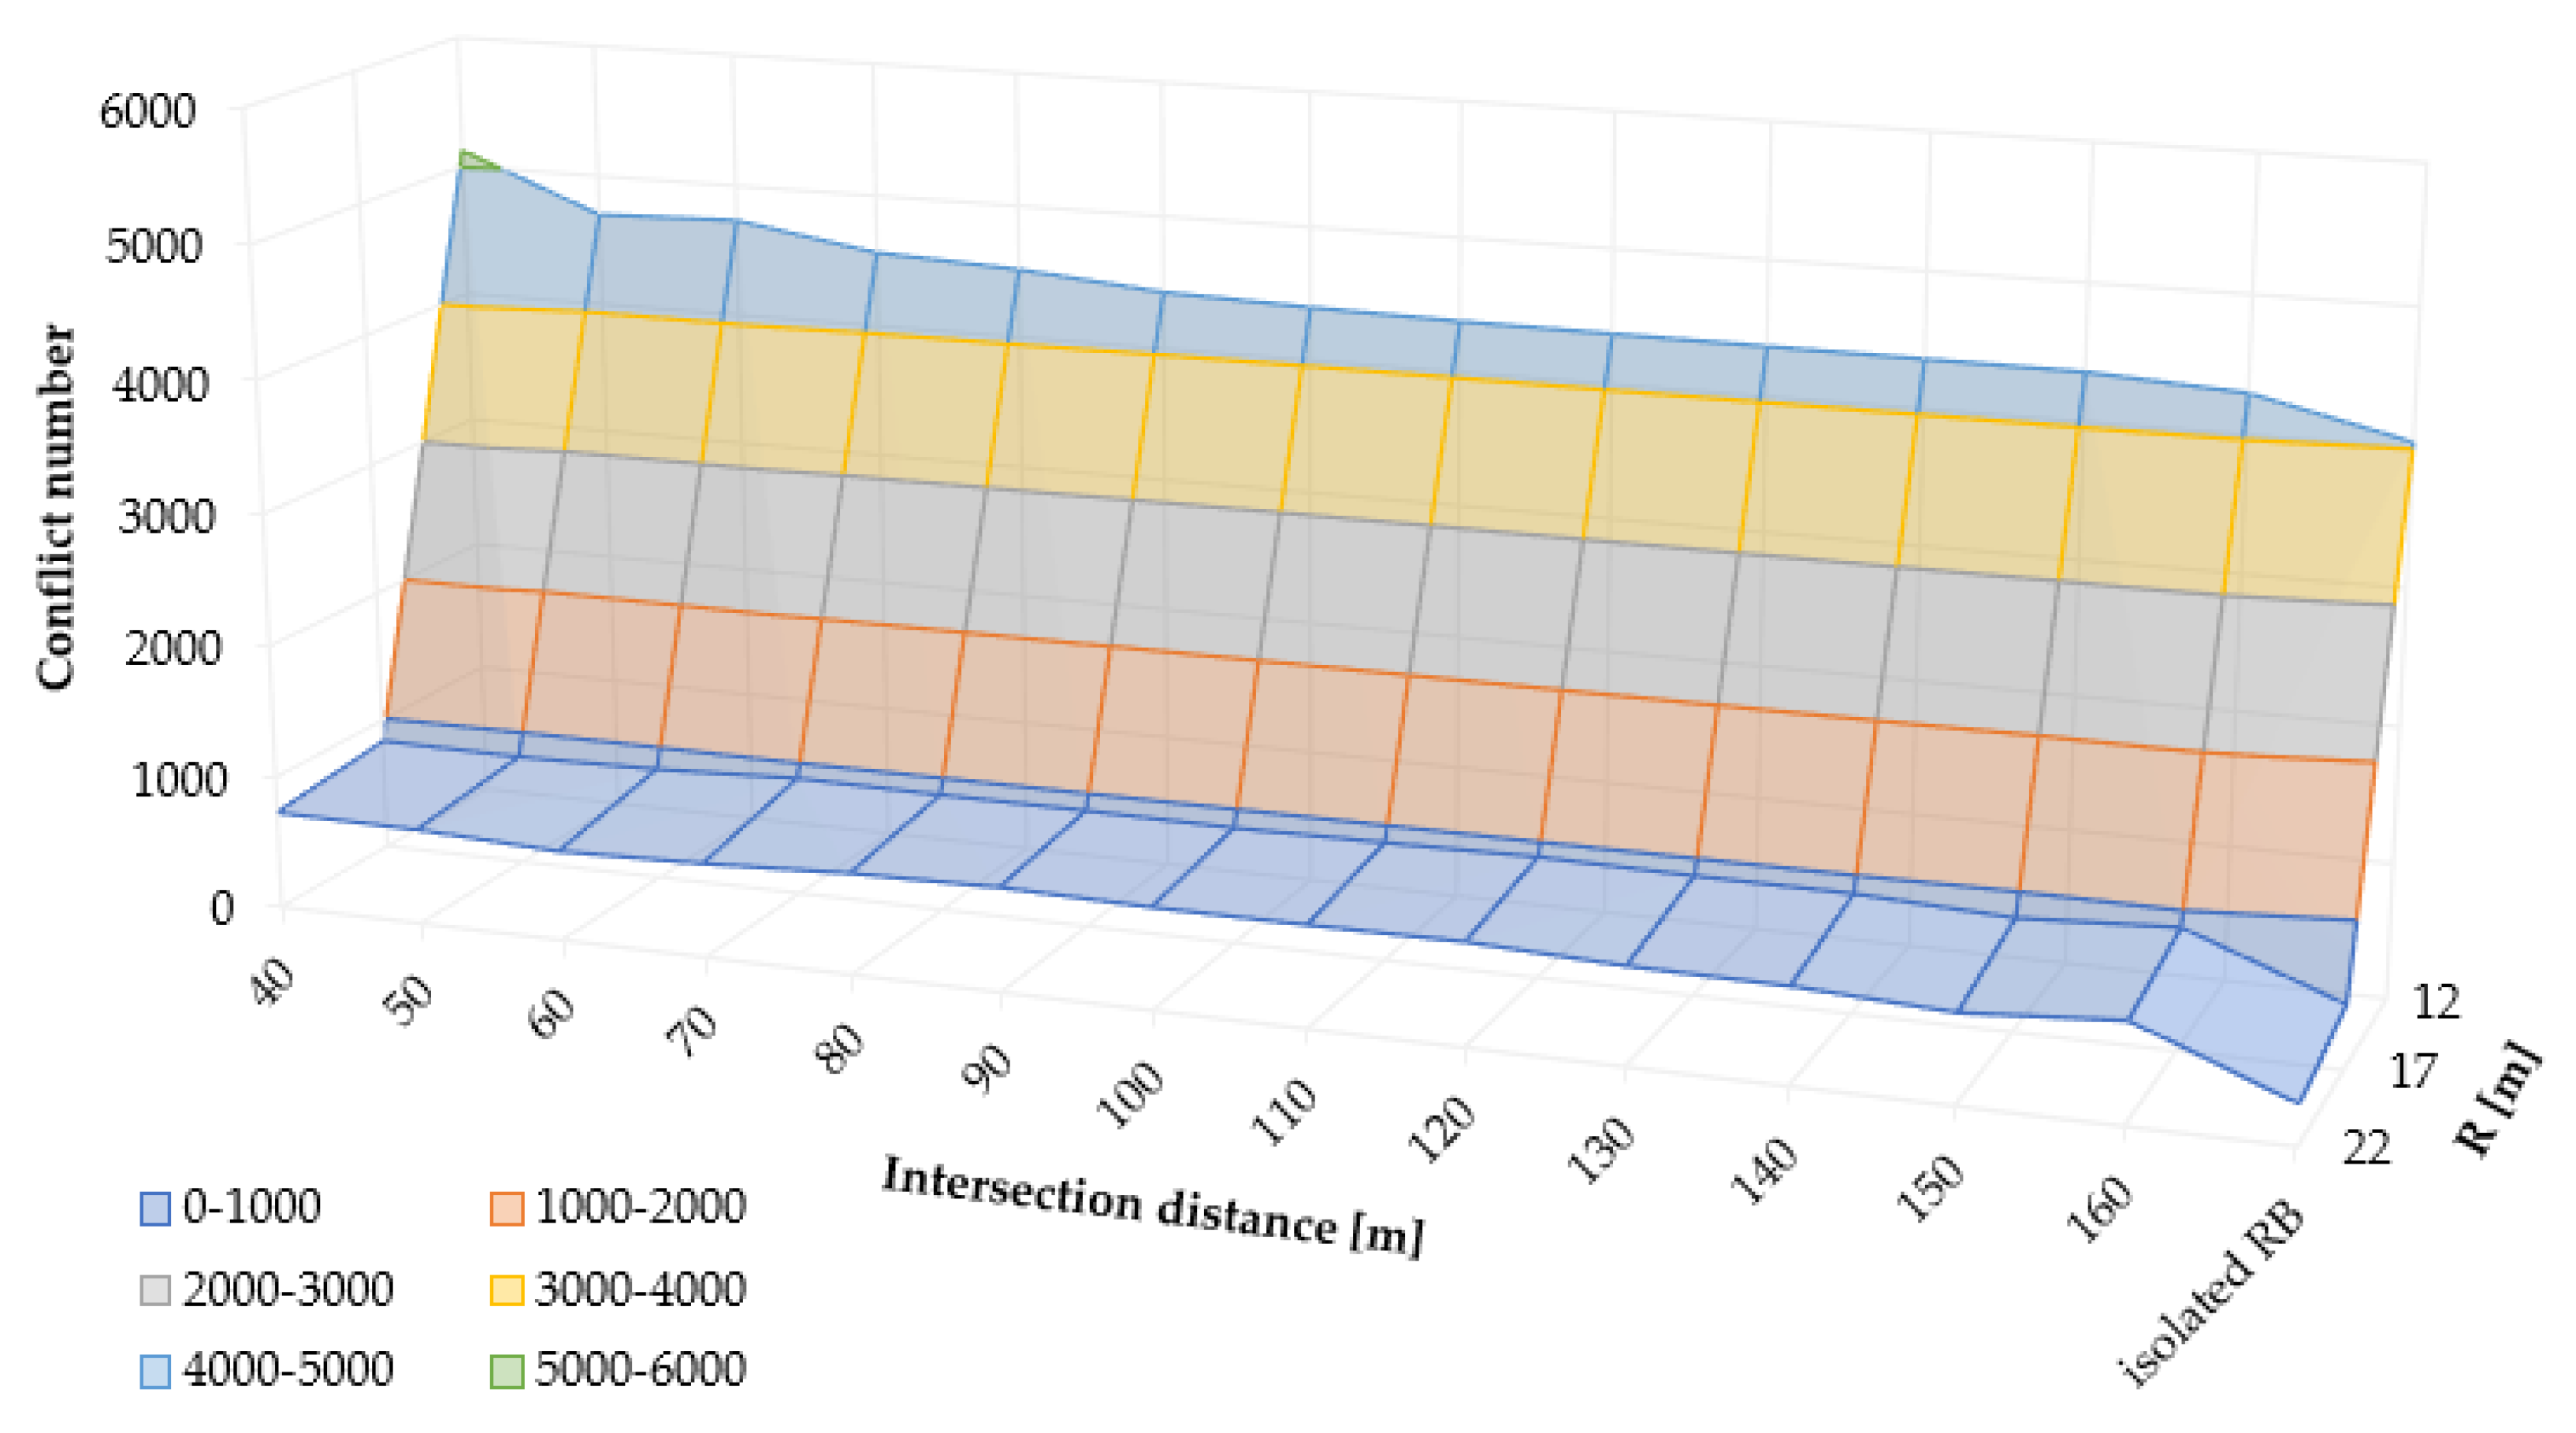
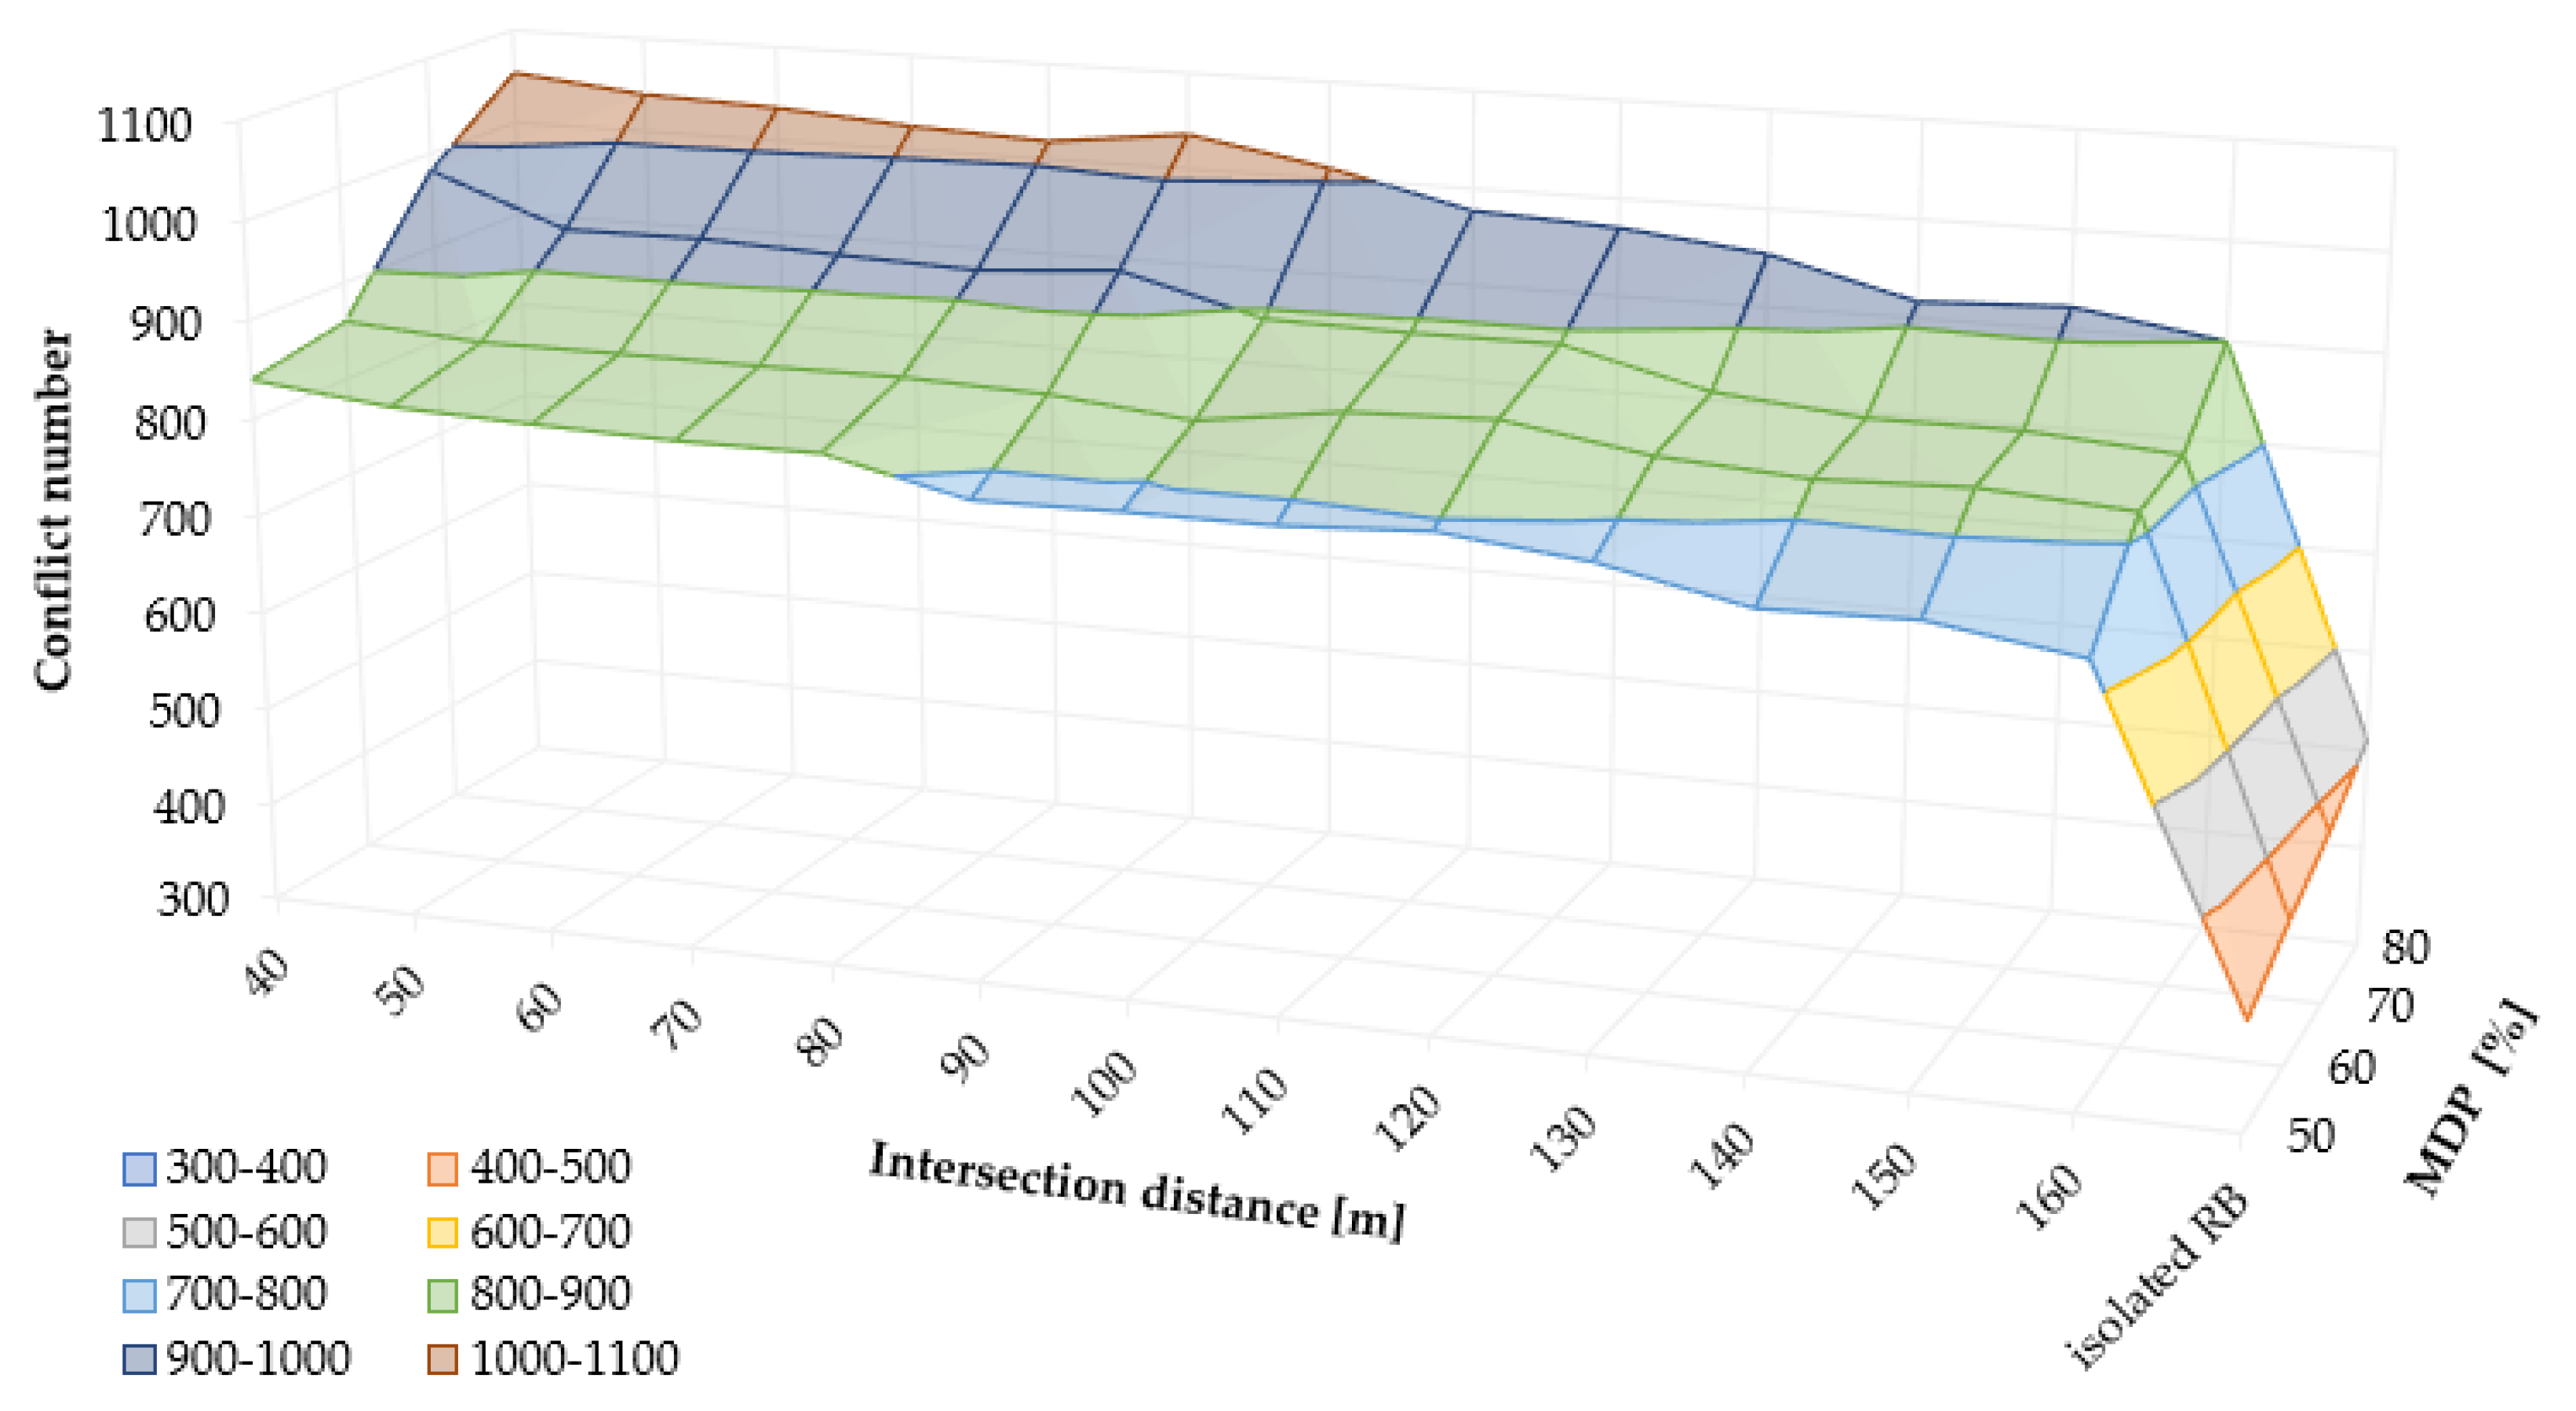
Figure 7 illustrates the combined effects of the outer roundabout radius (R) and the distance to the signalized intersection on the total number of conflicts. The results presented pertain to scenarios featuring a 70% traffic share on the main direction (MDP) and a 22-second red time (RT) at the signalized intersection.
For roundabouts with the smallest analyzed outer radius of 12 meters, increasing the distance between intersections from a minimum of 40 meters to a maximum of 160 meters leads to a reduction in the total number of conflicts, ranging from approximately 8% to 15%. For instance, in a scenario where the main traffic flow comprises 70% and the signal red time is 22 seconds, the number of conflicts decreases from 5,122 (at 40 meters) to 4,404 (at 160 meters), indicating a reduction of around 14%.
In the case of medium-sized roundabouts with an outer radius of 17 meters, the impact of increasing intersection spacing on the number of conflicts is less significant, typically varying from 5% to 10%. In this scenario, with a 70% share of the main traffic and a signal red time of 22 seconds, conflicts decrease from 904 (at 40 meters) to 834 (at 160 meters), reflecting a reduction of approximately 7%. A similar magnitude of conflict reduction is noted for larger roundabouts with an outer radius of 22 meters.
A more detailed analysis reveals that the outer radius of the roundabout plays a dominant role in influencing the number of conflicts. A precise quantification of this influence is provided through the correlation analysis in
Section 3.2. Increasing the outer radius from the minimum of 12 meters to a medium value of 17 meters results in a significant reduction in conflicts, ranging from 75% to 90%. In the case of an isolated roundabout with a 70% share of main traffic, the number of conflicts drops dramatically from 4,044 (R = 12 m) to 472 (R = 17 m), representing an approximate 88% reduction.
Moreover, increasing the outer radius from 17 meters to 22 meters further reduces conflicts by an additional 20% to 35%. However, this reduction is considerably less substantial than the previous step. With a spacing of 40 meters and a signal red time of 17 seconds, the number of conflicts decreases from 773 (R = 17 m) to 535 (R = 22 m), reflecting an additional 31% reduction.
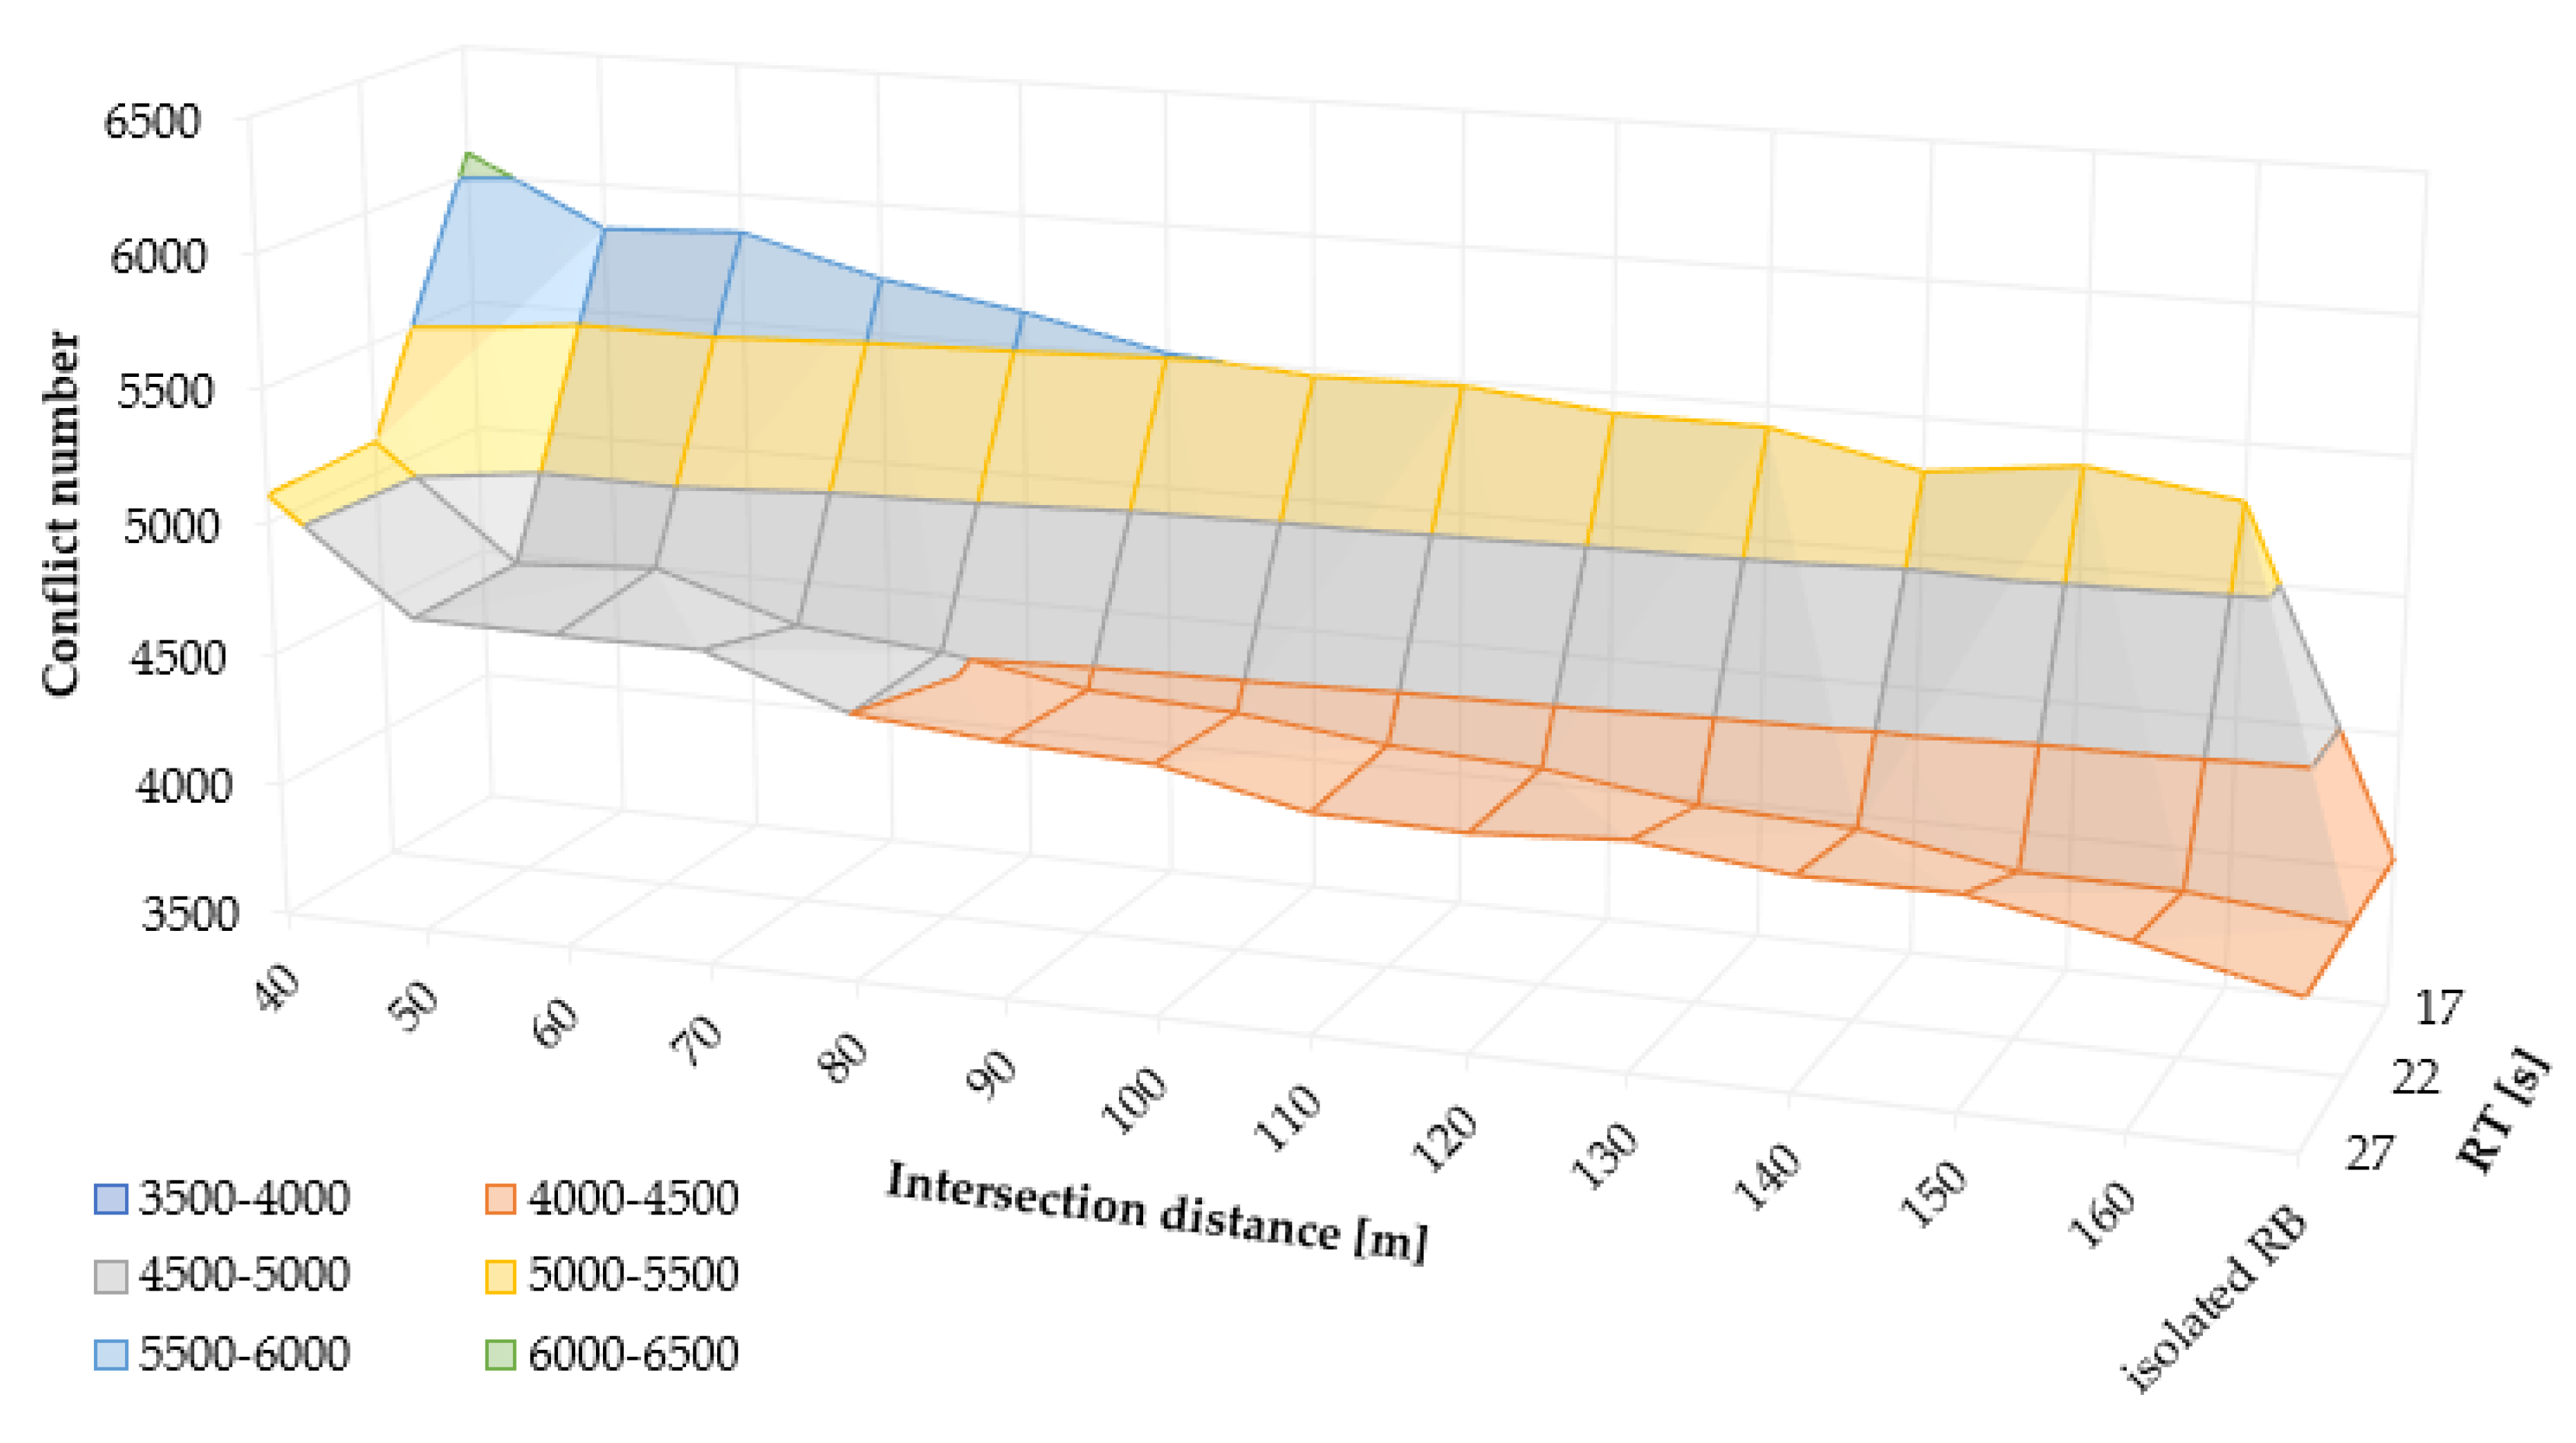
Figure 8 illustrates the combined effect of the signal red time (RT) and the distance between the roundabout and the signalized intersection on the total number of conflicts in scenarios where the main traffic flow (MDP) consists of 70% and the outer roundabout radius is set at 12 meters.
For small roundabouts with an outer radius of 12 meters, increasing the red time from 17 to 22 seconds leads to a notable reduction in the number of conflicts, ranging from 10% to 20%. For instance, at an intersection spacing of 40 meters, with 70% of traffic on the main direction, the number of conflicts decreases from 6,088 (with a red time of 17 seconds) to 5,122 (with a red time of 22 seconds), reflecting an approximate reduction of 16%. Further extending the red time from 22 to 27 seconds yields an additional decline in conflicts, albeit at a lower intensity, averaging around 10%.
In contrast, for larger roundabouts with outer radii of 17 meters and 22 meters, the impact of red time duration is significantly less pronounced, resulting in an average reduction in conflicts of about 5%.
Figure 9 illustrates the combined effect of the percentage of traffic on the main direction (MDP) and the distance between the roundabout and the signalized intersection on the total number of conflicts. The results pertain to scenarios featuring a red time duration of 17 seconds (RT) and an outer roundabout radius of 17 meters.
Reducing the share of traffic on the main direction from 80% to 50% in the case of smaller roundabouts (12 m) leads to an average increase in conflicts of 20–30%. For an isolated roundabout, the number of conflicts increases from 3,407 (with 80% of traffic on the main direction) to 4,329 (with 50% of traffic on the main direction), representing a 27% increase. At roundabouts with larger radii (17 and 22 m), a more even traffic distribution across approaches (50% on the main direction) results in an average reduction in conflicts of approximately 10%.
3.2. Statistical Analysis and Development of the Conflict Prediction Model
The development of the conflict prediction model is based on an analysis of the results obtained from a series of traffic scenarios described in the preceding section. The statistical processing of the data included the following methods:
Descriptive analysis was used to identify the characteristics of the variability in the occurrence of different conflict types and to determine the target variable for the regression model.
Pearson’s correlation test was applied to examine the interrelationships between the model’s input parameters for all conflict types.
Multiple linear regression was performed using a stepwise predictor selection method with the aim of identifying statistically significant model parameters that have a direct influence on the number of conflicts.
Descriptive statistical indicators for all analyzed conflict types are presented in
Table 6.
In all scenarios, rear-end conflicts account for more than 90% of the total number of potential conflicts. The greatest variability is observed in the total number of conflicts, as evidenced by the wide range of values (288 to 6,440) and the high standard deviation (2,020.42). The total number of conflicts encompasses all conflict types, providing a more comprehensive representation of traffic safety at the roundabout. Since different parameters may affect individual conflict types in different ways, focusing on the total number of conflicts enables identification of those that exert the strongest overall influence. Consequently, the further development of the model is directed towards the total number of conflicts within a 24-hour period.
Table 7 presents the correlation analysis between the model parameters and the individual conflict types.
Increasing the distance between the roundabout and the signalized intersection has a moderately negative effect on rear-end conflicts, whereas its influence on crossing and lane-change conflicts is almost negligible. Traffic distribution, i.e., an increased share of vehicles in the main direction, has a beneficial effect on reducing the number of rear-end conflicts. The duration of the red interval at the adjacent signalized intersection also has a moderately positive effect on the reduction of rear-end conflicts, while not exerting a significant influence on crossing or lane-change conflicts. The most important parameter contributing to improved traffic safety is the outer radius of the roundabout, which shows a distinct negative effect on all analyzed conflict types.
Based on the conducted analyses, a conflict prediction model was developed. Multiple linear regression was used to investigate the influence of the input parameters on the total number of conflicts. The analysis was carried out using a stepwise method, whereby the model was formed on the basis of the statistical significance of the input variables.
Four independent variables were examined: the distance between the roundabout and the signalized intersection, the distribution of traffic between the major and minor direction, the duration of the red interval at the signalized intersection, and the outer radius of the roundabout. The dependent variable was the total number of conflicts. The dataset used for the analysis was divided into a training set comprising 384 scenarios and a validation set comprising 96 scenarios.
The stepwise inclusion method resulted in a final model that incorporates three statistically significant input parameters: intersection spacing, red interval duration, and the outer radius. The parameter describing the distribution of traffic between the major and minor direction was excluded from the final model, as it did not make a significant contribution to explaining the variance of the total number of conflicts. The parameters of the resulting regression model are presented in
Table 8.
All three parameters have negative regression coefficients, indicating that an increase in any of these parameters leads to a reduction in the number of conflicts (under identical traffic conditions). The outer radius is quantitatively the strongest factor, while intersection spacing and red interval duration exhibit weaker, yet still statistically significant, negative effects. Three models of varying complexity (with one, two, and three input parameters) were analyzed, and their accuracy and complexity indicators are presented in Table 10.
Table 9.
Summary of variables selection.
Table 9.
Summary of variables selection.
| No. of variables |
Variable |
MSE |
R2 |
Adjusted R² |
Mallows’ Cp |
Akaike’s AIC |
| 1 |
Outer radius |
162365.094 |
0.787 |
0.787 |
26.019 |
4609.074 |
| 2 |
Intersection distance / Outer radius |
155878.772 |
0.796 |
0.795 |
10.779 |
4594.412 |
| 3 |
Intersection distance / Red time / Outer radius |
152708.505 |
0.801 |
0.799 |
3.872 |
4587.513 |
The three-parameter model (final model) exhibits the lowest mean squared error (MSE = 152,708.505) and the highest coefficient of determination (R² = 0.801), indicating that the included model parameters explain 80.1% of the variance in the total number of conflicts. The regression model does not account for the remaining 19.9% of the variance and can be attributed to other unmodelled influences or random error. The adjusted R² is 0.799, which is almost identical to R², suggesting that the inclusion of additional parameters did not impair the regression model’s efficiency relative to the number of predictors. The high coefficient of determination indicates that the model fits the data very well and that there is a strong linear relationship among the model parameters.
Moreover, Mallows’ Cp statistic for the final model is 3.872, which is almost equal to the number of parameters in the model, including the constant, indicating a good balance between goodness of fit and model parsimony. Compared with the simpler models, the Akaike Information Criterion (AIC = 4587.513) is the lowest precisely for this three-predictor model, thereby confirming the superior predictive power achieved by including all three variables.
To further evaluate the regression model’s accuracy and predictive performance, partial validation via the hold-out method was employed. The training set was used to estimate the model, while the validation set was used to assess its performance on unseen data. This approach provides a more realistic estimate of prediction error on future data and reduces the risk of overfitting the model to the training dataset. The goodness-of-fit indicators of the final regression model are presented in
Table 10.
The validation set yields an R² of 0.795 (adjusted R² = 0.739), which is almost as high as the R² in the training set. The mean squared prediction error on the validation set (MSE = 158.212) and the corresponding RMSE (397.758) are very close to the values obtained for the training set (MSE = 152,708.505; RMSE = 390.779). The mean absolute percentage error (MAPE) amounts to 36.1% on the validation set (compared to 34.5% on the training set). These results indicate that the regression model does not suffer from overfitting and that it generalizes well—the predictive relationships between the parameters retain a similar strength on the validation data.
In the context of traffic safety analysis, where the variability of conflicts can be extremely high (as evidenced by the high standard deviation of the total number of conflicts: 2,020.42, with a mean of 2,174.21), such a MAPE value is not unusual. For example, in the study by [
43], where machine learning was employed to predict the number of conflicts, a MAPE of 36.99% was achieved. In [
44], a linear regression model was developed to predict a composite risk index, with a reported MAPE of 25.9%.
Based on the conducted statistical analysis, a prediction model for the total number of conflicts was defined, expressed by equation (2).
where:
Conflicts – total number of conflicts along the traffic corridor, including the roundabout and the signalized intersection (model developed for an AADT of 20,000 veh/day)
D (m) – distance between the roundabout and the signalized intersection, in the range 40-160 m
RT (s) – duration of the red time at the signalized intersection, in the range 17-27 s
R (m) – outer radius of the roundabout, in the range 12-22 m
The model provides reliable results within the defined ranges of the input parameters, whereas for applications beyond these limits the validity of the results should be verified additionally.
3.3. Simulation-Based Validation of the Regression Model
In order to compare the results of the regression model for conflict prediction, described in
Section 3.2, with the results of the traffic microsimulation models developed for the cities of Osijek and Poreč, a calibration of the traffic microsimulation models was carried out based on the measured travel times presented in
Section 2.2.
The comparison of the predicted number of conflicts obtained from the regression model with the number of conflicts derived from calibrated traffic microsimulations was carried out in order to verify the reliability of the analytical approach and to identify differences between analytical and simulation-based modelling.
The regression model was developed for a traffic corridor comprising one roundabout and one signalized intersection, with a daily traffic volume of 20,000 vehicles. For this reason, it was necessary to adapt the calibrated microsimulation models for Osijek and Poreč to the regression model framework.
The comparison was conducted through the following steps:
Model segmentation – The calibrated microsimulation models of the traffic network in Poreč and the corridor in Osijek were divided into segments, each comprising one roundabout and one signalized intersection.
Adjustment of traffic volume – In all analyzed segments, the traffic volume was adjusted to 20,000 veh/day to conform to the assumptions of the regression model.
Prediction using the regression model – For each segment, the expected number of conflicts was calculated based on the regression model (Equation 2).
Computation of deviations – The differences between the analytically predicted number of conflicts and the number of conflicts obtained using the SSAM were determined.
Normality testing of differences – The normality of the distribution of the obtained differences was examined using the Shapiro–Wilk test.
Statistical analysis – Appropriate statistical tests were performed to compare the results and to assess the significance of the differences.
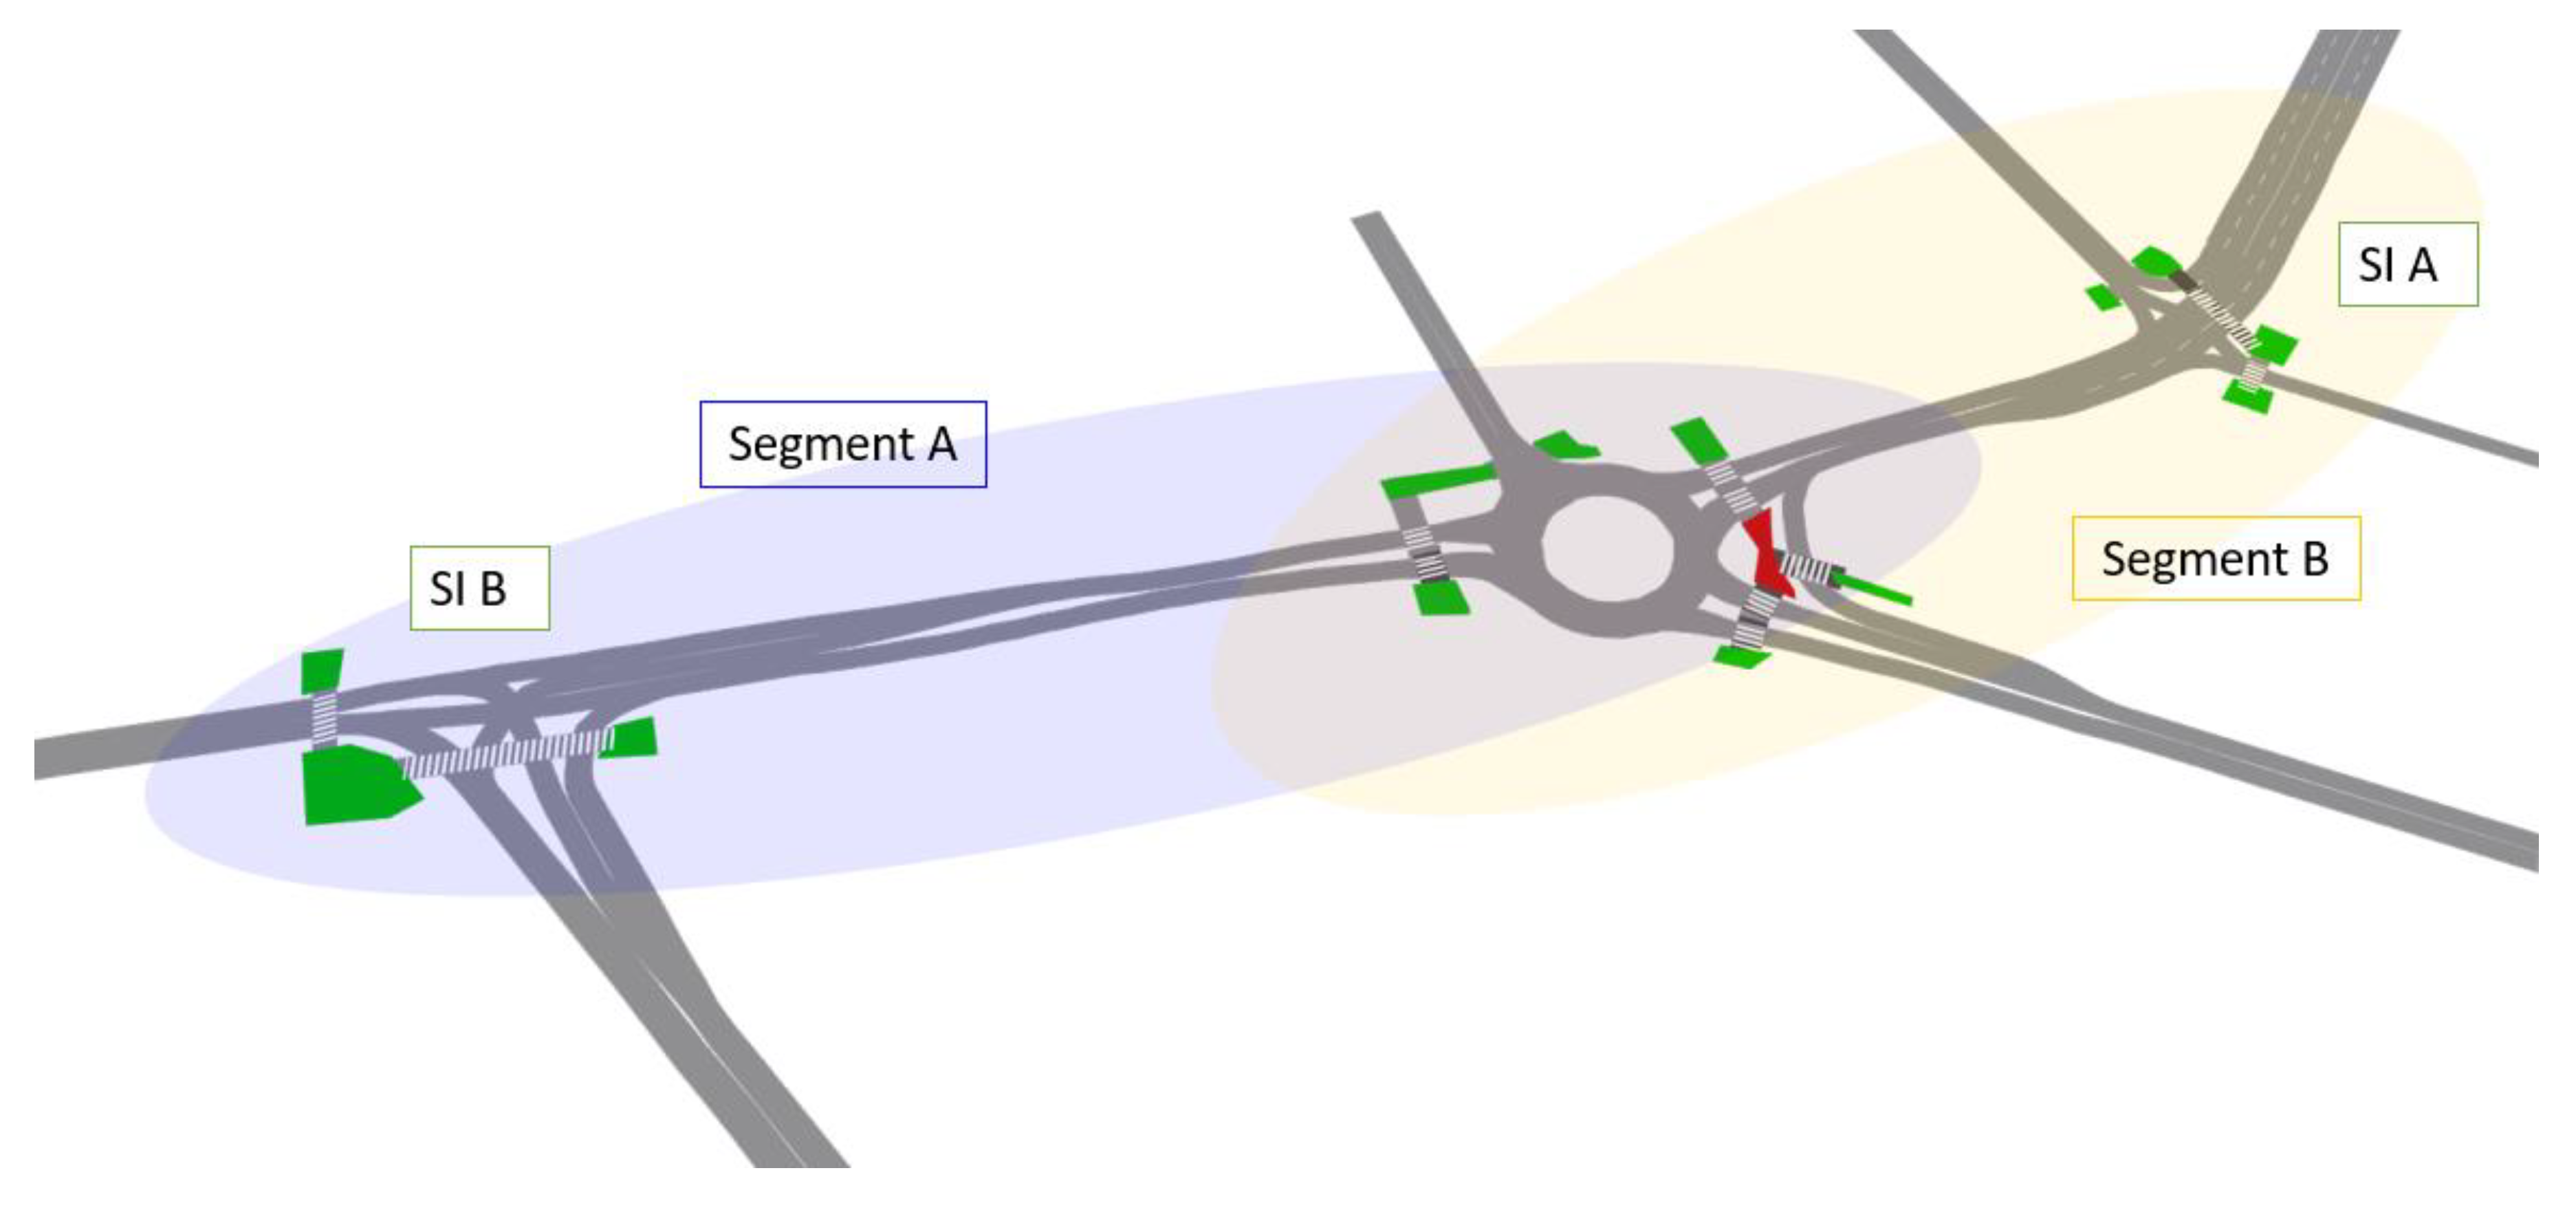
In the microsimulation traffic model of the corridor in Osijek, two segments were analyzed, as shown in
Figure 10. Segment A consists of a roundabout and the signalized intersection SI A, while Segment B comprises a roundabout and the signalized intersection SI B.
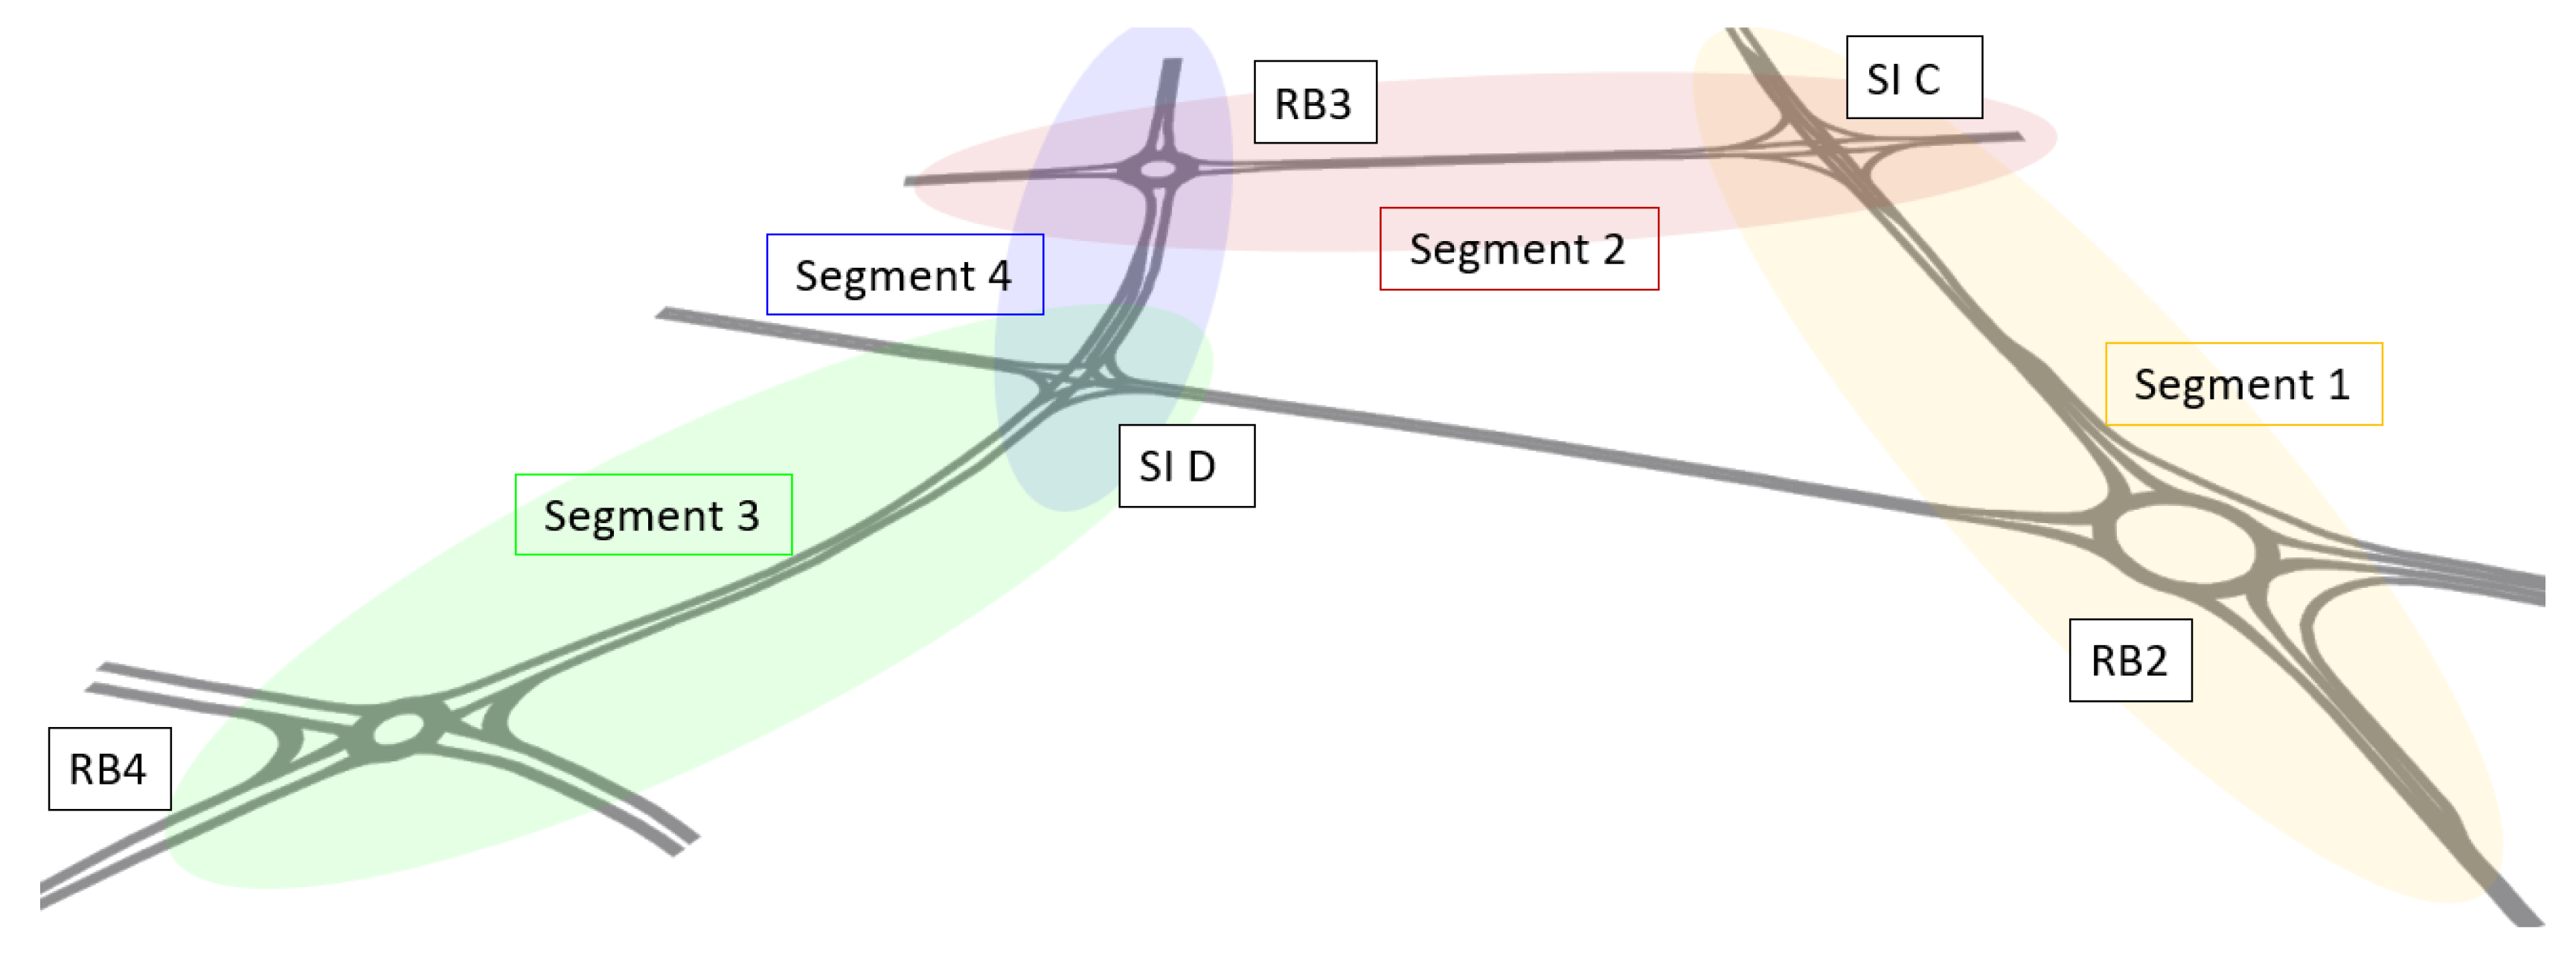
In the microsimulation traffic network of the City of Poreč, four segments were analyzed, as shown in
Figure 11. Segment 1 comprises roundabout RB2 and signalized intersection SI C, while Segment 2 includes roundabout RB3 and signalized intersection SI C. Segment 3 consists of roundabout RB4 and signalized intersection SI D, whereas Segment 4 connects roundabout RB3 with signalized intersection SI D.
Based on parameters measured under real-world conditions—including the geometric characteristics of the intersections, the duration of the red interval at the adjacent signalized intersection, and the distance between the roundabout and the signalized intersection—the expected number of conflicts was calculated (Equation 2).
Table 11 presents the input parameters used in the comparison between the regression model and the microsimulation results for the analyzed segments. Parameter values that fall outside the regression model’s applicability range are highlighted in bold.
The microsimulations conducted in VISSIM generated vehicle trajectories across the analyzed segments. These trajectories were then used to estimate conflicts using the SSAM software.
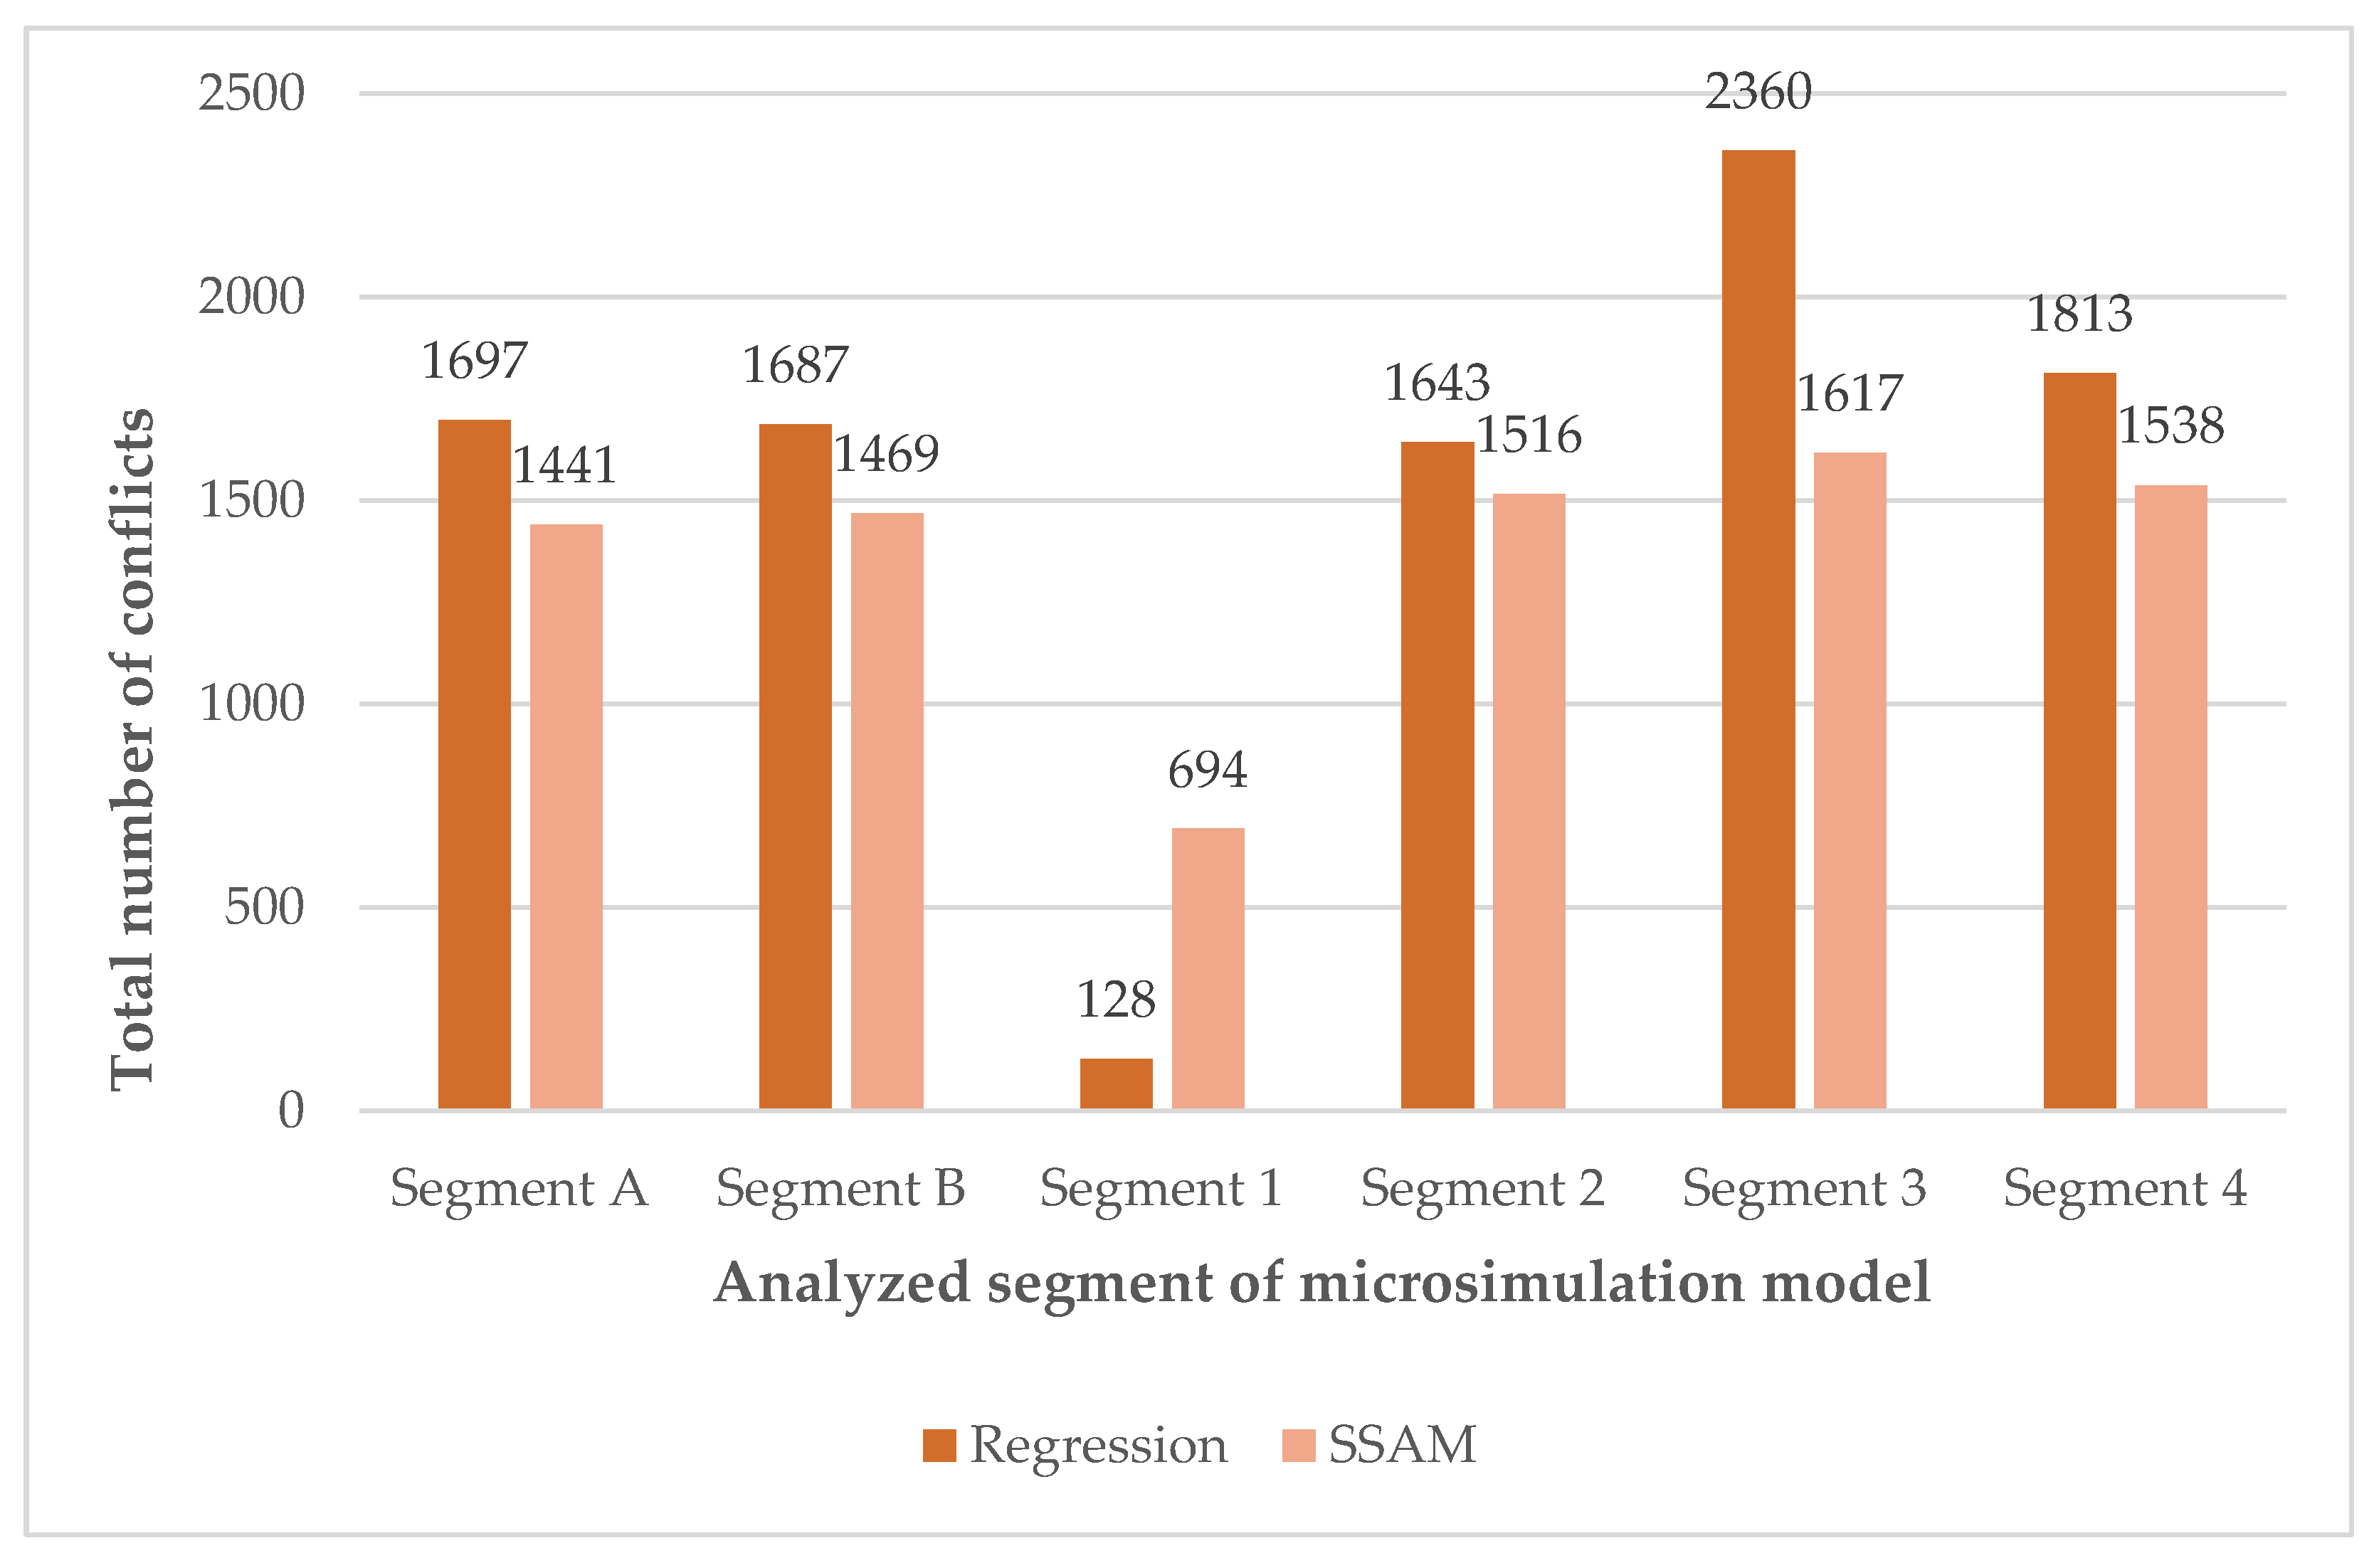
Figure 12 compares the analytically estimated number of conflicts obtained from the regression model with the number determined by applying the safety assessment model based on surrogate safety measures (SSAM).
Before comparing the results using statistical tests, the normality of the distribution of the total number of conflicts was examined for each segment. To assess normality, the Shapiro–Wilk test was applied, which tests the null hypothesis that the sample is drawn from a population with a normal distribution. The results of the Shapiro–Wilk test for all segments, including W statistics, p-values, and the conclusion regarding the normality of the data distribution, are presented in
Table 12.
The outcomes of the Shapiro–Wilk test indicated that the data distribution deviated significantly from normality for all analyzed segments (p < 0.05). As a result, a nonparametric approach was employed for all segments, specifically utilizing the one-sample Wilcoxon test.
The findings for each segment under examination are detailed in
Table 13, which includes the Wilcoxon test statistic V, the standardized test statistic Z, and the associated significance level (p-value).
The Wilcoxon test shows that, for Segments A, B, 2, and 4, there is no statistically significant difference between the number of traffic conflicts obtained using the safety assessment model based on surrogate safety measures (SSAM) and those predicted by the regression model.
Negative values of the Z statistic in these segments indicate that the SSAM model yields slightly lower estimates of the number of conflicts than the regression model; however, the observed differences are not statistically significant. The mean absolute percentage error (MAPE) between the SSAM and regression model results ranges from 7.97% to 15.22%, indicating a very good level of agreement between the two approaches.
Segments 1 and 3 lie outside the parametric bounds of the regression model with respect to the outer roundabout radius. Segment 1 includes roundabout RB1 with an outer radius of 24 m, whereas Segment 3 includes roundabout RB4 with an outer radius of 11.5 m. In these segments, statistically significant differences were observed between the number of conflicts based on SSAM and those derived from the regression model.
In Segment 1, the positive Z statistic (Z = 2.752) indicates that SSAM predicts a significantly higher number of conflicts than the regression model. Conversely, in Segment 3, the negative Z statistic (Z = −2.752) indicates that SSAM yields significantly lower conflict estimates than the regression model.
Since the outer roundabout radius was previously identified as the most influential parameter of the regression model (
Section 3.2), deviations of this parameter from the model’s applicability range in these segments result in an increased error in the predicted number of conflicts.
The comparison shows a high degree of consistency between the regression conflict prediction model and the calibrated microsimulation model outcomes for the cities of Osijek and Poreč, with an acceptable margin of deviation. The statistical analysis confirms that there is no significant difference between the regression model (analytical approach) and the SSAM model (microsimulation approach), provided the regression model’s applicability conditions are met.
5. Conclusions
A review of the existing research has shown that although the operational performance of roundabouts interacting with other intersections is recognized in available technical regulations and scientific studies, it has not been systematically investigated.
The aim of this study was to assess the influence of various traffic and design parameters on the safety of roundabouts located in the immediate vicinity of signalized intersections based on field data and traffic microsimulation models analyses.
Theoretical VISSIM traffic model was developed as the basis for conducting conflict analysis using SSAM methodology. Results were then compared with findings obtained through the same SSAM-based approach applied to real-site intersections at two distinctly different locations within the urban road network in Croatia. Applying the SSAM methodology enabled quantification of potential conflicts and assessment of the safety effects of different scenarios, thereby contributing to a better understanding of optimal positioning and design of roundabouts near signalized intersections.
The results show that the distance between the roundabout and the signalized intersection has a significant effect on the number of conflicts, particularly in the case of smaller roundabout radius - outer radii of 12 m and 16 m. Analysis of roundabouts and signalized intersections at spacings from 40 to 160 meters has shown that at the smallest analyzed distance of 40 m, an increase in the total number of conflicts was observed in the range of 40% to 60%, with the greatest impact recorded at intersections with the smallest analyzed outer radius of 12 m. For larger roundabouts (outer radii of 17 m and 22 m), the negative effect of a small spacing between intersections was also confirmed, although to a lesser extent. In these cases, the increase in the number of conflicts generally ranges between 20% and 40% compared with the isolated scenarios.
In conclusion, the study demonstrates that the outer roundabout radius plays a crucial role in reducing the total number of conflicts. Additionally, the duration of the red interval at the adjacent signalized intersection contributes to a further, albeit less significant, reduction in conflicts.
Based on the statistical analysis of the theoretic VISSIM model outputs, a regression model was developed for predicting the number of conflicts using three input parameters: the distance between the roundabout and the signalized intersection, the duration of the red interval at the traffic signal, and the external radius of the roundabout. The resulting regression model demonstrated high accuracy and good generalization capability on an independent validation set, with a coefficient of determination of 0.801 and a mean absolute percentage error of 34.538%.
The comparison of the regression model results with those of calibrated microsimulation models developed for the cities of Osijek and Poreč (Croatia) also confirmed the validity of the analytical approach. Statistical analysis showed that there are no significant differences between the traffic conflicts predicted by the regression model (theoretical) and those identified using SSAM tool based on data from real-site data, provided that the regression model’s applicability conditions are met.
Calibration of the model to local conditions in the two considered cases (Osijek and Poreč in Croatia) showed the necessity of this step in the application of the developed model in order to take into account local traffic conditions.
While these findings are encouraging, some limitations were noted. The analysis was limited to one adjacent intersection, potentially overlooking more complex interactions in corridors with multiple intersections. Also, the study could not develop a model based on actual traffic accidents due to the absence of a reliable accident database, so traffic safety was assessed through surrogate measures - traffic conflicts.
The practical value of the research is reflected in the development of a predictive model and three-dimensional diagrams, which can serve as tools for rapid evaluation of different road network planning variants. The model for predicting the number of conflicts enables assessing the safety implications of such interventions before the actual construction or reconstruction of an intersection. It complements the findings of the author’s previous study [
30], in which a model was proposed for estimating travel time between a roundabout and a signalized intersection. Together, these models provide concrete tools and quantitative criteria that support decision-making in the road network planning process from both the traffic efficiency and traffic safety perspectives.
In future research, the study input parameters will be expanded by using larger outer roundabout radii and increasing the distance between the roundabout and the signalized intersection. This will improve the applicability and reliability of the regression model. Future research should also include non-motorized users, such as pedestrians and cyclists, for a better understanding of intersection interactions and safety in urban environments.
Finally, the conclusion is that the research conducted in this study confirms that the design of roundabouts in close proximity to signalized intersections, from the perspective of traffic safety, can contribute to achieving the goals of sustainable mobility and the Vision Zero strategy. The developed regression model, as a practical tool in the planning phase, enables the design of infrastructure that forgives human error and minimizes the risk of severe accidents. In this sense, the findings of this research support the broader societal objective of creating safe, healthy, and sustainable cities in which transport infrastructure actively contributes to quality of life and the realization of the vision of zero traffic fatalities.
Author Contributions
Conceptualization, S.Š. and A.D.-T.; methodology, M.K., S.Š., A.D.-T, I.I.O.; software, M.K., I.I.O.; validation, M.K.; formal analysis, M.K.; writing—original draft preparation, M.K.; writing—review and editing, S.Š. and A.D.-T.; visualization, M.K.; supervision, S.Š. and A.D.-T, I.I.O. All authors have read and agreed to the published version of the manuscript.
Funding
This research was funded by the European Union – NextGenerationEU (“Optimizing Transport Infrastructure in the Function of Sustainable Mobility in the Cities, scientific project University of Rijeka uniri-iz-25-32 and “Safety aspects of urban transport infrastructure”, scientific project Josip Juraj Strossmayer University of Osijek).
Informed Consent Statement
Not applicable.
Data Availability Statement
The dataset presented in this study is a part of a research database created in a doctoral thesis research and is available upon request from the corresponding author. The results of the field measurements are reported in the author’s previous study [
29].
Acknowledgments
This research is the result of the projects “Optimizing Transport Infrastructure in the Function of Sustainable Mobility in the Cities” (scientific project University of Rijeka uniri-iz-25-32) and “Safety aspects of urban transport infrastructure” (scientific project Josip Juraj Strossmayer University of Osijek).
Conflicts of Interest
The authors declare no conflicts of interest.
References
- United Nations World Urbanization Prospects 2025 Summary of Results (UN DESA/POP/2025/TR/NO. 12); New York, NY, USA, 2025; Available online: https://population.un.org/wup/assets/Publications/undesa_pd_2025_wup2025_summary_of_results_final.pdf (accessed on 10 09 2025).
- European Commission The New EU Urban Mobility Framework (Communication from the Commission to the European Parliament, the Council, the European Economic and Social Committee and the Committee of the Regions, COM(2021) 811 Final); 2021. Available online: https://transport.ec.europa.eu/system/files/2021-12/com_2021_811_the-new-eu-urban-mobility.pdf (accessed on 15 09 2025).
- European Commission The European Green Deal (Communication from the Commission to the European Parliament, the European Council, the Council, the European Economic and Social Committee and the Committee of the Regions, COM(2019) 640 Final); 2019; Available online: https://eur-lex.europa.eu/legal-content/EN/TXT/?uri=COM%3A2019%3A640%3AFIN (accessed on 12 10 2025).
- European Commission Sustainable and Smart Mobility Strategy – Putting European Transport on Track for the Future (COM(2020) 789 Final) 2020. Available online: https://eur-lex.europa.eu/legal-content/EN/TXT/HTML/?uri=CELEX:52020DC0789 (accessed on 12 10 2025).
- European Commission Zero Pollution Action Plan - Environment - European Commission 2021. Available online: https://environment.ec.europa.eu/strategy/zero-pollution-action-plan_en (accessed on 15 10 2025).
- European Transport Safety Council (ETSC) 19th Annual Road Safety Performance Index (PIN Report) - ETSC; Brussels, 2025. Available online: https://etsc.eu/19th-annual-road-safety-performance-index-pin-report/ (accessed on 10 10 2025).
- European Commission Annual statistical report on road safety in the EU, 2024. European Road Safety Observatory. Brussels, European Commission, Directorate General for Transport. Available online: https://road-safety.transport.ec.europa.eu/document/download/b30e9840-4c22-4056-9dab-0231a98e7356_en?filename=ERSOnext_AnnualReport_20240229.pdf (accessed on 10 10 2025).
- Wegman, F. The future of road safety: A worldwide perspective. IATSS Research 2017, 40, 66–71. [CrossRef]
- Peden, M.; Scurfield, R.; Sleet, D.; Mohan, D.; Hyder. Adnan A.; Jarawan, E.; Mathers, C. World report on road traffic injury prevention; World Health Organization, Geneva, 2024. Available online: https://www.paho.org/sites/default/files/World%20Report%20on%20Road%20Traffic%20Injury%20Prevention.pdf (accessed on 10 03 2025).
- European Commission EU road fatalities drop by 3% in 2024, but progress remains slow - Mobility and Transport - CARE database; 2024. Available online: https://transport.ec.europa.eu/news-events/news/eu-road-fatalities-drop-3-2024-progress-remains-slow-2025-03-18_en (accessed 15 03 2025).
- European Commission EU Road Safety Policy Framework 2021-2023: Next steps towards ’Vision Zero’: EU road safety policy framework 2021-2030; Publications Office of the European Union, 2019. Available online: https://www.europarl.europa.eu/doceo/document/TA-9-2021-0407_EN.html (accessed 08 04 2025).
- Dingus, T.A.; Guo, F.; Lee, S.; Antin, J.F.; Perez, M.; Buchanan-King, M.; Hankey, J. Driver crash risk factors and prevalence evaluation using naturalistic driving data. Proceedings of the National Academy of Sciences of the United States of America 2016, 113, 2636–2641. [CrossRef]
- SWOV Institute for Road Safety Research Sustainable Safety - 3rd edition: The advanced vision for 2018-2030. Available online: https://swov.nl/system/files/publication-downloads/dv3_en_kort_rapport.pdf (accessed on 10 05 2025).
- Federal Highway Administration (FHWA) Observational Before-After Studies in Road Safety: Estimating the Effect of Highway and Traffic Engineering Measures on Road Safety; Elsevier Science Incorporated, UK, 2008.
- PIARC (World Road Association) Road Safety Manual; 2025; Available online: https://roadsafety.piarc.org/en (accessed on 22 05 2025).
- Barcelo, J. Fundamentals of Traffic Simulation; Barceló, J., Ed.; International Series in Operations Research & Management Science; Springer New York: New York, NY, 2010; Vol. 145.
- Fellendorf, M.; Vortisch, P. Microscopic Traffic Flow Simulator VISSIM. International Series in Operations Research and Management Science 2010, 145, 63–93. [CrossRef]
- Gettman, D.; Head, L. Surrogate Safety Measures from Traffic Simulation Models. Transp Res Rec 2003, 104–115. [CrossRef]
- Tarko, A.P. Surrogate Measures of Safety. In Safe Mobility: Challenges, Methodology and Solutions Transport and Sustainability; Emerald Publishing, 2018; Vol. 11, pp. 383–405.
- PTV GROUP PTV VISSIM 10: User Manual; 2022. Available online: https://pdfcoffee.com/manual-vissim-2022-4-pdf-free.html: (accessed on 25 March 2025).
- Saunier, N.; Sayed, T. Probabilistic framework for automated analysis of exposure to road collisions. Transp Res Rec 2008, 96–104. [CrossRef]
- Singh, D.; Das, P. A Review on Surrogate Safety Measures in Safety Evaluation and Analysis. In Proceedings of the 6th International Conference of Transportation Research Group of India. CTRG 2021. vol 273. Springer, Singapore. [CrossRef]
- Federal Highway Administration Surrogate Safety Assessment Model and Validation: Final Report; Georgetown Pike, 2008. Available online: https://www.fhwa.dot.gov/publications/research/safety/08051/ (accessed on 10 02 2023).
- Hasanvand, M.; Nasiri, A.S.A.; Rahmani, O.; Shaaban, K.; Samadi, H. A Conflict-Based Safety Diagnosis of SCI Roundabouts Using a Surrogate Safety Measure Model. Sustainability 2023, 15, Page 13166 2023, 15, 13166. [CrossRef]
- Giuffrè, O.; Granà, A.; Tumminello, M.L.; Giuffrè, T.; Trubia, S.; Sferlazza, A.; Rencelj, M. Evaluation of Roundabout Safety Performance through Surrogate Safety Measures from Microsimulation. J Adv Transp 2018, 2018, 4915970. [CrossRef]
- Kim, K.M.; Saito, M.; Schultz, G.G.; Eggett, D.L. Evaluating Safety Impacts of Access Management Alternatives with the Surrogate Safety Assessment Model. Transp Res Rec 2018, 2672, 120–128. [CrossRef]
- Vasconcelos, L.; Neto, L.; Seco, Á.M.; Silva, A.B. Validation of the Surrogate Safety Assessment Model for Assessment of Intersection Safety. Transportation Research Record Journal of the Transportation Research Board 2014, 2432, 1–9. [CrossRef]
- Hrvatske ceste Smjernice za projektiranje kružnih raskrižja na državnim cestama; Rijeka, Hrvatska, 2014. Available online: https://hrvatske-ceste.hr/uploads/documents/attachment_file/file/106/SMJERNICE_KRUZNA_RASKRIZJA-HRVATSKE_CESTE.pdf (accessed on 8 8 2024). (In Croatian).
- Klobučar, M.; Šurdonja, S.; Deluka-Tibljaš, A. Impact of Geometric Parameters and Operational Speed on Traffic Safety at Roundabouts: A Conflict Analysis Using Microsimulation Models. Journal of Road Safety 2025, 36, 36–49. [CrossRef]
- Klobučar, M.; Deluka-Tibljaš, A.; Šurdonja, S.; Ištoka Otković, I. A Theoretical Model for Optimizing Signalized Intersection and Roundabout Distance Using Microsimulations. Future Transportation 2025, 5, Page 28 2025, 5, 28. [CrossRef]
- Daniels, S.; Brijs, T.; Nuyts, E.; Wets, G. Extended prediction models for crashes at roundabouts. Saf Sci 2011, 49, 198–207. [CrossRef]
- Kennedy, J. V; Peirce, J.; Summersgill, I. International Comparison of Roundabout Design Guidelines; Crowthorne, UK, 2007. Available online: https://www.trl.co.uk/uploads/trl/documents/PPR206_secure.PDF (accessed on 12 03 2025).
- Mahdalova, I.; Krivda, V.; Skvain, V. Influence of Roundabout Inscribed Circle Diameter to the Traffic Safety. Applied Mechanics and Materials 2013, 409–410, 1122–1125. [CrossRef]
- Bulla-Cruz, L.A.; Laureshyn, A.; Lyons, L. Event-based road safety assessment: A novel approach towards risk microsimulation in roundabouts. Measurement 2020, 165. [CrossRef]
- Federal Highway Administration Roundabouts: An Informational Guide- Second Edition; Washington D.C., SAD, 2010. Available online: https://highways.dot.gov/safety/data-analysis-tools/rsdp/rsdp-tools/roundabouts-informational-guide-second-edition.
- Gunarathne, D.; Amarasingha, N.; Kulathunga, A.; Wickramasinghe, V. Optimization of VISSIM Driver Behavior Parameter Values Using Genetic Algorithm. Periodica Polytechnica Transportation Engineering 2023, 51, 117–125. [CrossRef]
- LuShou-feng; WangLi-yuan Applying a Macroscopic Calibration to a Wiedemann Driver Behavior Threshold Study. Journal of Highway and Transportation Research and Development (English Edition) 2015, 9, 88–92. [CrossRef]
- Park, B.; Won, J.; Yun, I. Application of Microscopic Simulation Model Calibration and Validation Procedure. Transp Res Rec 2006, 1978, 113–122. [CrossRef]
- Jayasooriya, N.; Bandara, S. Calibrating and Validating VISSIM Microscopic Simulation Software for the Context of Sri Lanka. In Proceedings of the MERCon 2018 - 4th International Multidisciplinary Moratuwa Engineering Research Conference, Moratuwa, Sri Lanka, 30 May – 01 June 2018. [CrossRef]
- Ištoka Otković, I.; Tollazzi, T.; Šraml, M. Calibration of microsimulation traffic model using neural network approach. Expert Syst Appl 2013, 40, 5965–5974. [CrossRef]
- Park, B.; Qi, H. Development and Evaluation of a Procedure for the Calibration of Simulation Models. Transp Res Rec 2005, 208, 208–217. [CrossRef]
- Toledo, T.; Ben-Akiva, M.E.; Darda, D.; Jha, M.; Koutsopoulos, H.N. Calibration of Microscopic Traffic Simulation Models with Aggregate Data. Transp Res Rec 2004, 1876, 10–19. [CrossRef]
- Li, D.; Fu, C.; Sayed, T.; Wang, W. An integrated approach of machine learning and Bayesian spatial Poisson model for large-scale real-time traffic conflict prediction. Accid Anal Prev 2023, 192, 107286. [CrossRef]
- Li, S.; Xiang, Q.; Ma, Y.; Gu, X.; Li, H. Crash Risk Prediction Modeling Based on the Traffic Conflict Technique and a Microscopic Simulation for Freeway Interchange Merging Areas. International Journal of Environmental Research and Public Health 2016, 13, Page 1157 2016, 13, 1157. [CrossRef]
Figure 1.
Research Methodology.
Figure 1.
Research Methodology.
Figure 2.
Input parameters.
Figure 2.
Input parameters.
Figure 3.
Geometry of the microsimulation models.
Figure 3.
Geometry of the microsimulation models.
Figure 4.
Roundabout and adjacent signalized intersection model in VISSIM.
Figure 4.
Roundabout and adjacent signalized intersection model in VISSIM.
Figure 5.
Traffic corridor in the City of Osijek.
Figure 5.
Traffic corridor in the City of Osijek.
Figure 6.
Traffic network in the City of Poreč.
Figure 6.
Traffic network in the City of Poreč.
Figure 7.
Influence of the outer radius and the distance between intersections on the total number of conflict (MDP=70%, RT=22 s).
Figure 7.
Influence of the outer radius and the distance between intersections on the total number of conflict (MDP=70%, RT=22 s).
Figure 8.
Influence of the red time duration and the distance between intersections on the total number of conflict (MDP=70%, R=12 m).
Figure 8.
Influence of the red time duration and the distance between intersections on the total number of conflict (MDP=70%, R=12 m).
Figure 9.
Influence of the traffic distribution (MDP) and the distance between intersections on the total number of conflict (RT=17s, R=17 m).
Figure 9.
Influence of the traffic distribution (MDP) and the distance between intersections on the total number of conflict (RT=17s, R=17 m).
Figure 10.
Analyzed segments of the traffic corridor in the Osijek City.
Figure 10.
Analyzed segments of the traffic corridor in the Osijek City.
Figure 11.
Analyzed segments of the traffic network in the Poreč City.
Figure 11.
Analyzed segments of the traffic network in the Poreč City.
Figure 12.
Comparison of traffic conflicts predicted by the regression model and those identified using SSAM tool.
Figure 12.
Comparison of traffic conflicts predicted by the regression model and those identified using SSAM tool.
Table 1.
Geometric and traffic parameters of the microsimulation model.
Table 1.
Geometric and traffic parameters of the microsimulation model.
| Model |
Approach |
Outer
Radius |
Circulary Roadway |
Entry
Radius |
Exit Radius |
PSL |
Vehicle Composition |
Veh
Num |
| m |
m |
m |
m |
km/h |
class |
major |
minor |
veh/day |
| 1 |
4
(two-way) |
12 |
6 |
15 |
16 |
50/40 |
Car
Truck
BUS
HGV 1
|
94.5%
3.5%
1%
1% |
95.3%
3.5%
0.7%
0.5% |
20,000 |
| 2 |
17 |
| 3 |
22 |
Table 3.
Route description and travel time based on the field measurements.
Table 3.
Route description and travel time based on the field measurements.
| Route |
Route length [m] |
RB-SI distance [m] |
Roundabout |
Signalized intersection |
Cycle length[s] |
Travel time [s] |
| C |
g |
r-a |
r |
a |
| A |
300 |
122 |
RB1 |
SI A |
90 |
60 |
2 |
25 |
2 |
56.40 |
| B |
300 |
178 |
RB1 |
SI B |
90 |
64 |
2 |
21 |
2 |
43.13 |
| 1 |
300 |
226 |
RB2 |
SI C |
60 |
30 |
2 |
25 |
2 |
68.06 |
| 2 |
300 |
230 |
RB3 |
60 |
20 |
2 |
35 |
2 |
81.60 |
| 3 |
300 |
201 |
RB3 |
SI D |
70 |
40 |
2 |
25 |
2 |
70.20 |
| 4 |
300 |
125 |
RB4 |
70 |
40 |
2 |
25 |
2 |
60.33 |
Table 4.
Comparison of travel time - VISSIM models and field measurements.
Table 4.
Comparison of travel time - VISSIM models and field measurements.
| |
Route A |
Route B |
Route 1 |
Route 2 |
Route 3 |
Route 4 |
| TMEAS (s) |
56.4 |
43.13 |
68.06 |
81.6 |
70.2 |
60.33 |
| TMOD (s) |
53.7 |
41.3 |
64.9 |
82.01 |
73.2 |
59.3 |
| Relative deviation |
4.79% |
4.24% |
4.64% |
0.50% |
4.27% |
1.71% |
Table 5.
Driver behavior input parameters.
Table 5.
Driver behavior input parameters.
| Parameter |
Default |
Calibrated - Osijek |
Calibrated - Poreč |
| Random seed increment |
1 |
9 |
6 |
| Average standstill distance (m) |
2 |
2.5 |
2.8 |
| Additive part of the desired safety distance (m) |
2 |
1.8 |
2.7 |
| Multiplicative part of the desired safety distance (m) |
3 |
3.7 |
3.5 |
Table 6.
Descriptive statistics of conflicts within a 24-hour period.
Table 6.
Descriptive statistics of conflicts within a 24-hour period.
| |
Intersection distance |
MDP |
Red time duration |
Outer radius |
Crossing |
Rear-end |
Lane-change |
Total conflict number |
| Sample |
480 |
480 |
480 |
480 |
480 |
480 |
480 |
480 |
| Minimum |
40.00 |
0.50 |
0.00 |
12.00 |
0.000 |
284 |
3 |
288 |
| Maximum |
1000.00 |
0.80 |
27.00 |
22.00 |
1915 |
1425 |
3619 |
6440 |
| Mean |
122.50 |
0.65 |
21.45 |
17.00 |
502.06 |
756 |
915.16 |
2174.21 |
| Standard deviation |
145.44 |
0.11 |
5.30 |
4.08 |
674.90 |
178.17 |
1275.12 |
2020.42 |
Table 7.
Correlation matrix.
Table 7.
Correlation matrix.
| Parameters |
Intersection distance |
MDP |
Red time |
Outer radius |
Crossing |
Rear-end |
Lane-change |
Total conflict number |
| Intersection distance |
1 |
0.00 |
-0.63 |
0.00 |
-0.01 |
-0.37 |
-0.02 |
-0.29 |
| MDP |
0.000 |
1 |
0.00 |
0.00 |
-0.05 |
0.19 |
-0.07 |
-0.10 |
| Red time |
-0.63 |
0.00 |
1 |
0.00 |
-0.04 |
0.24 |
-0.03 |
0.16 |
| Outer radius |
0.00 |
0.00 |
0.00 |
1 |
-0.85 |
-0.56 |
-0.85 |
-0.81 |
| Crossing |
-0.01 |
-0.05 |
-0.04 |
-0.85 |
1 |
0.36 |
0.99 |
0.90 |
| Rear-end |
-0.37 |
0.19 |
0.24 |
-0.56 |
0.36 |
1 |
0.38 |
0.74 |
| Lane-change |
-0.02 |
-0.07 |
-0.03 |
-0.85 |
0.99 |
0.38 |
1 |
1.00 |
| Total conflict number |
-0.29 |
-0.10 |
0.16 |
-0.81 |
0.90 |
0.74 |
1.00 |
1 |
Table 8.
Results of multiple linear regression for predicting the total number of conflicts.
Table 8.
Results of multiple linear regression for predicting the total number of conflicts.
| Source |
Value |
Standard error |
t |
p-value |
| Intercept |
5020.477 |
145.404 |
34.528 |
<0.0001 |
| Intersection distance (m) |
-0.942 |
0.184 |
-5.114 |
<0.0001 |
| MDP (%) |
0.000 |
0.000 |
|
|
| Red time (s) |
-14.260 |
4.777 |
-2.985 |
0.003 |
| Outer radius (m) |
-190.123 |
4.895 |
-38.841 |
<0.0001 |
Table 10.
Goodness-of-fit statistics of the regression model.
Table 10.
Goodness-of-fit statistics of the regression model.
| Statistics |
Training set |
Validation set |
| Sample |
384 |
96 |
| Sum of weights |
384 |
96 |
| DF |
380 |
92 |
| R² |
0.801 |
0.795 |
| Adjusted R² |
0.799 |
0.793 |
| MSE |
152708.505 |
158211.561 |
| RMSE |
390.779 |
397.758 |
| MAPE |
34.538 |
36.082 |
Table 11.
Input parameters for comparing the regression model and microsimulation results.
Table 11.
Input parameters for comparing the regression model and microsimulation results.
| |
Segment A |
Segment B |
Segment 1 |
Segment 2 |
Segment 3 |
Segment 4 |
| Regression model – Total conflict number |
1697 |
1687 |
128 |
1643 |
2360 |
1813 |
| Red time [s] |
25 |
22 |
25 |
35 |
25 |
25 |
| Outer radius [m] |
15 |
15 |
24 |
14 |
11,5 |
14 |
| Intersection distance [m] |
122 |
178 |
226 |
230 |
125 |
201 |
Table 12.
Results of the Shapiro-Wilk normality test.
Table 12.
Results of the Shapiro-Wilk normality test.
| Segment |
W |
p |
Normality criterion satisfied |
| Segment A |
0.831 |
0.035 |
NO |
| Segment B |
0.789 |
0.011 |
NO |
| Segment 1 |
0.644 |
0.000 |
NO |
| Segment 2 |
0.786 |
0.010 |
NO |
| Segment 3 |
0.642 |
0.000 |
NO |
| Segment 4 |
0.759 |
0.005 |
NO |
Table 13.
Results of the One-sample Wilcoxon nonparametric test.
Table 13.
Results of the One-sample Wilcoxon nonparametric test.
| Segment |
V |
Z |
p-value |
| Segment A |
12 |
-1.529 |
0.126 |
| Segment B |
9 |
-1.835 |
0.067 |
| Segment 1 |
55 |
2.752 |
0.006 |
| Segment 2 |
10 |
-1.735 |
0.083 |
| Segment 3 |
0 |
-2.752 |
0.006 |
| Segment 4 |
10 |
-1.734 |
0.083 |
|
Disclaimer/Publisher’s Note: The statements, opinions and data contained in all publications are solely those of the individual author(s) and contributor(s) and not of MDPI and/or the editor(s). MDPI and/or the editor(s) disclaim responsibility for any injury to people or property resulting from any ideas, methods, instructions or products referred to in the content. |