Preprint
Article

This version is not peer-reviewed.

Characterization of Genetic Diversity and Genomic Prediction of Secondary Metabolites in Pea Genetic Resources

Submitted:

22 December 2025

Posted:

23 December 2025

You are already at the latest version

Abstract

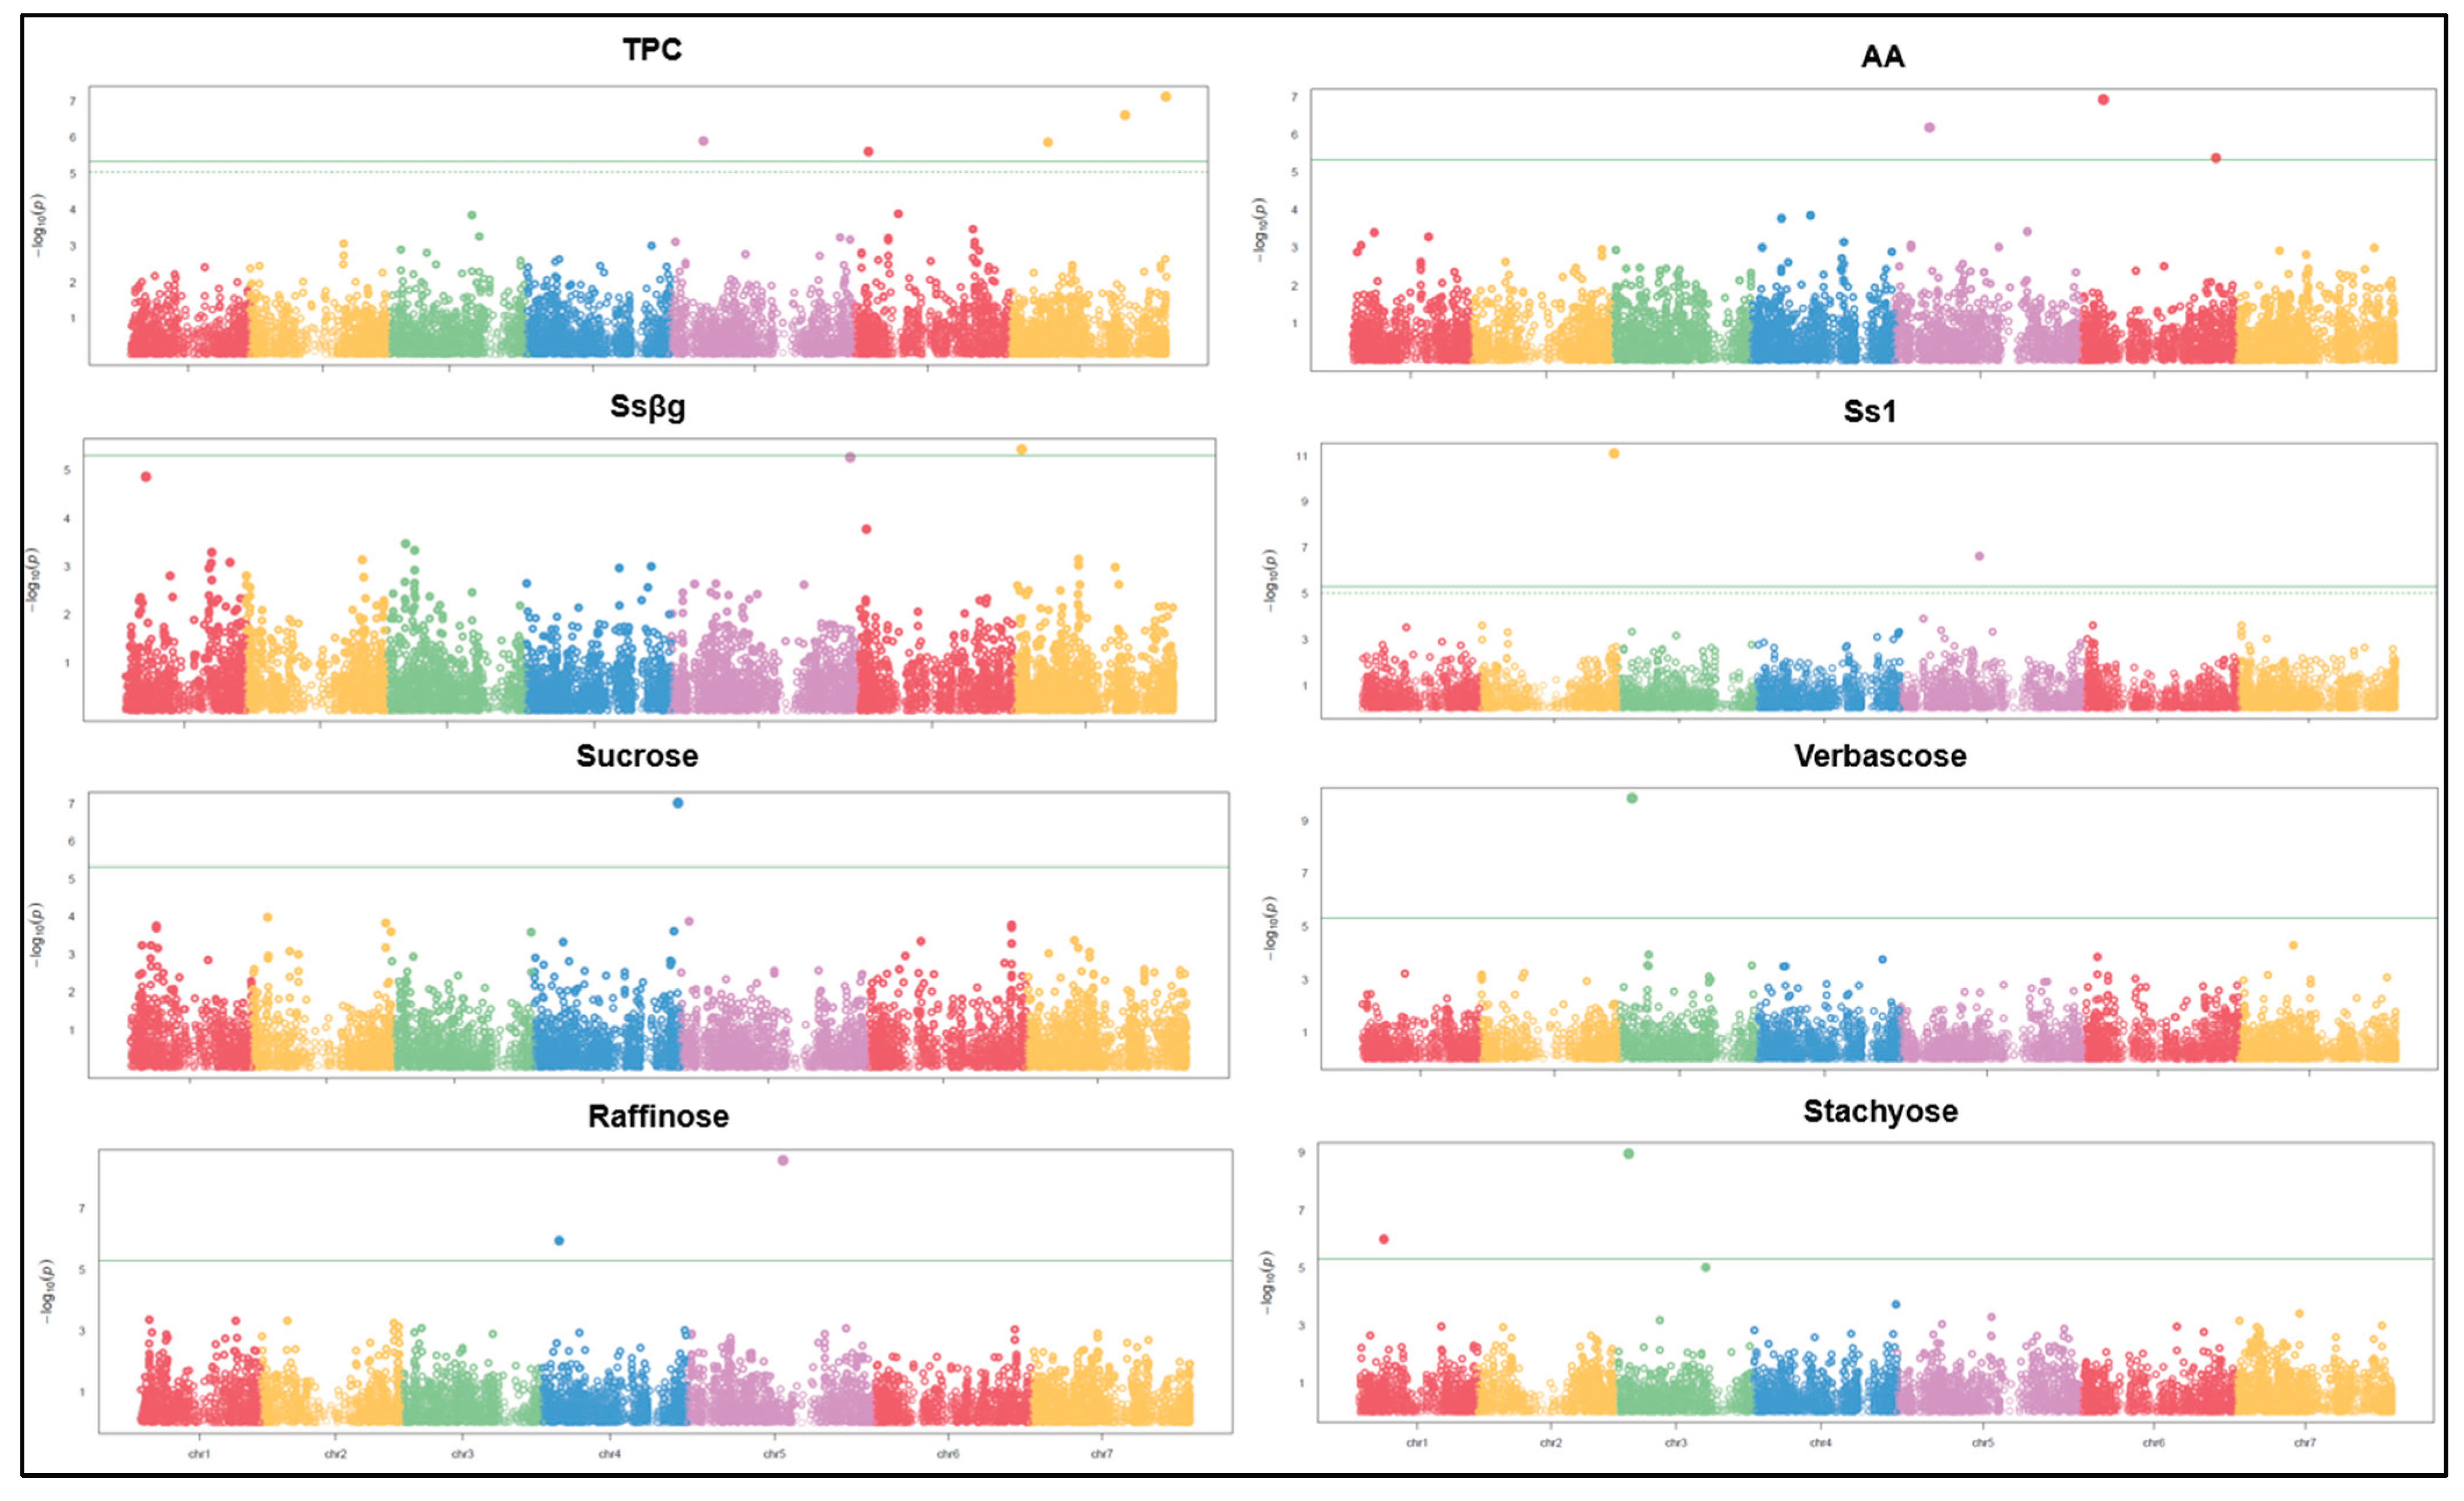
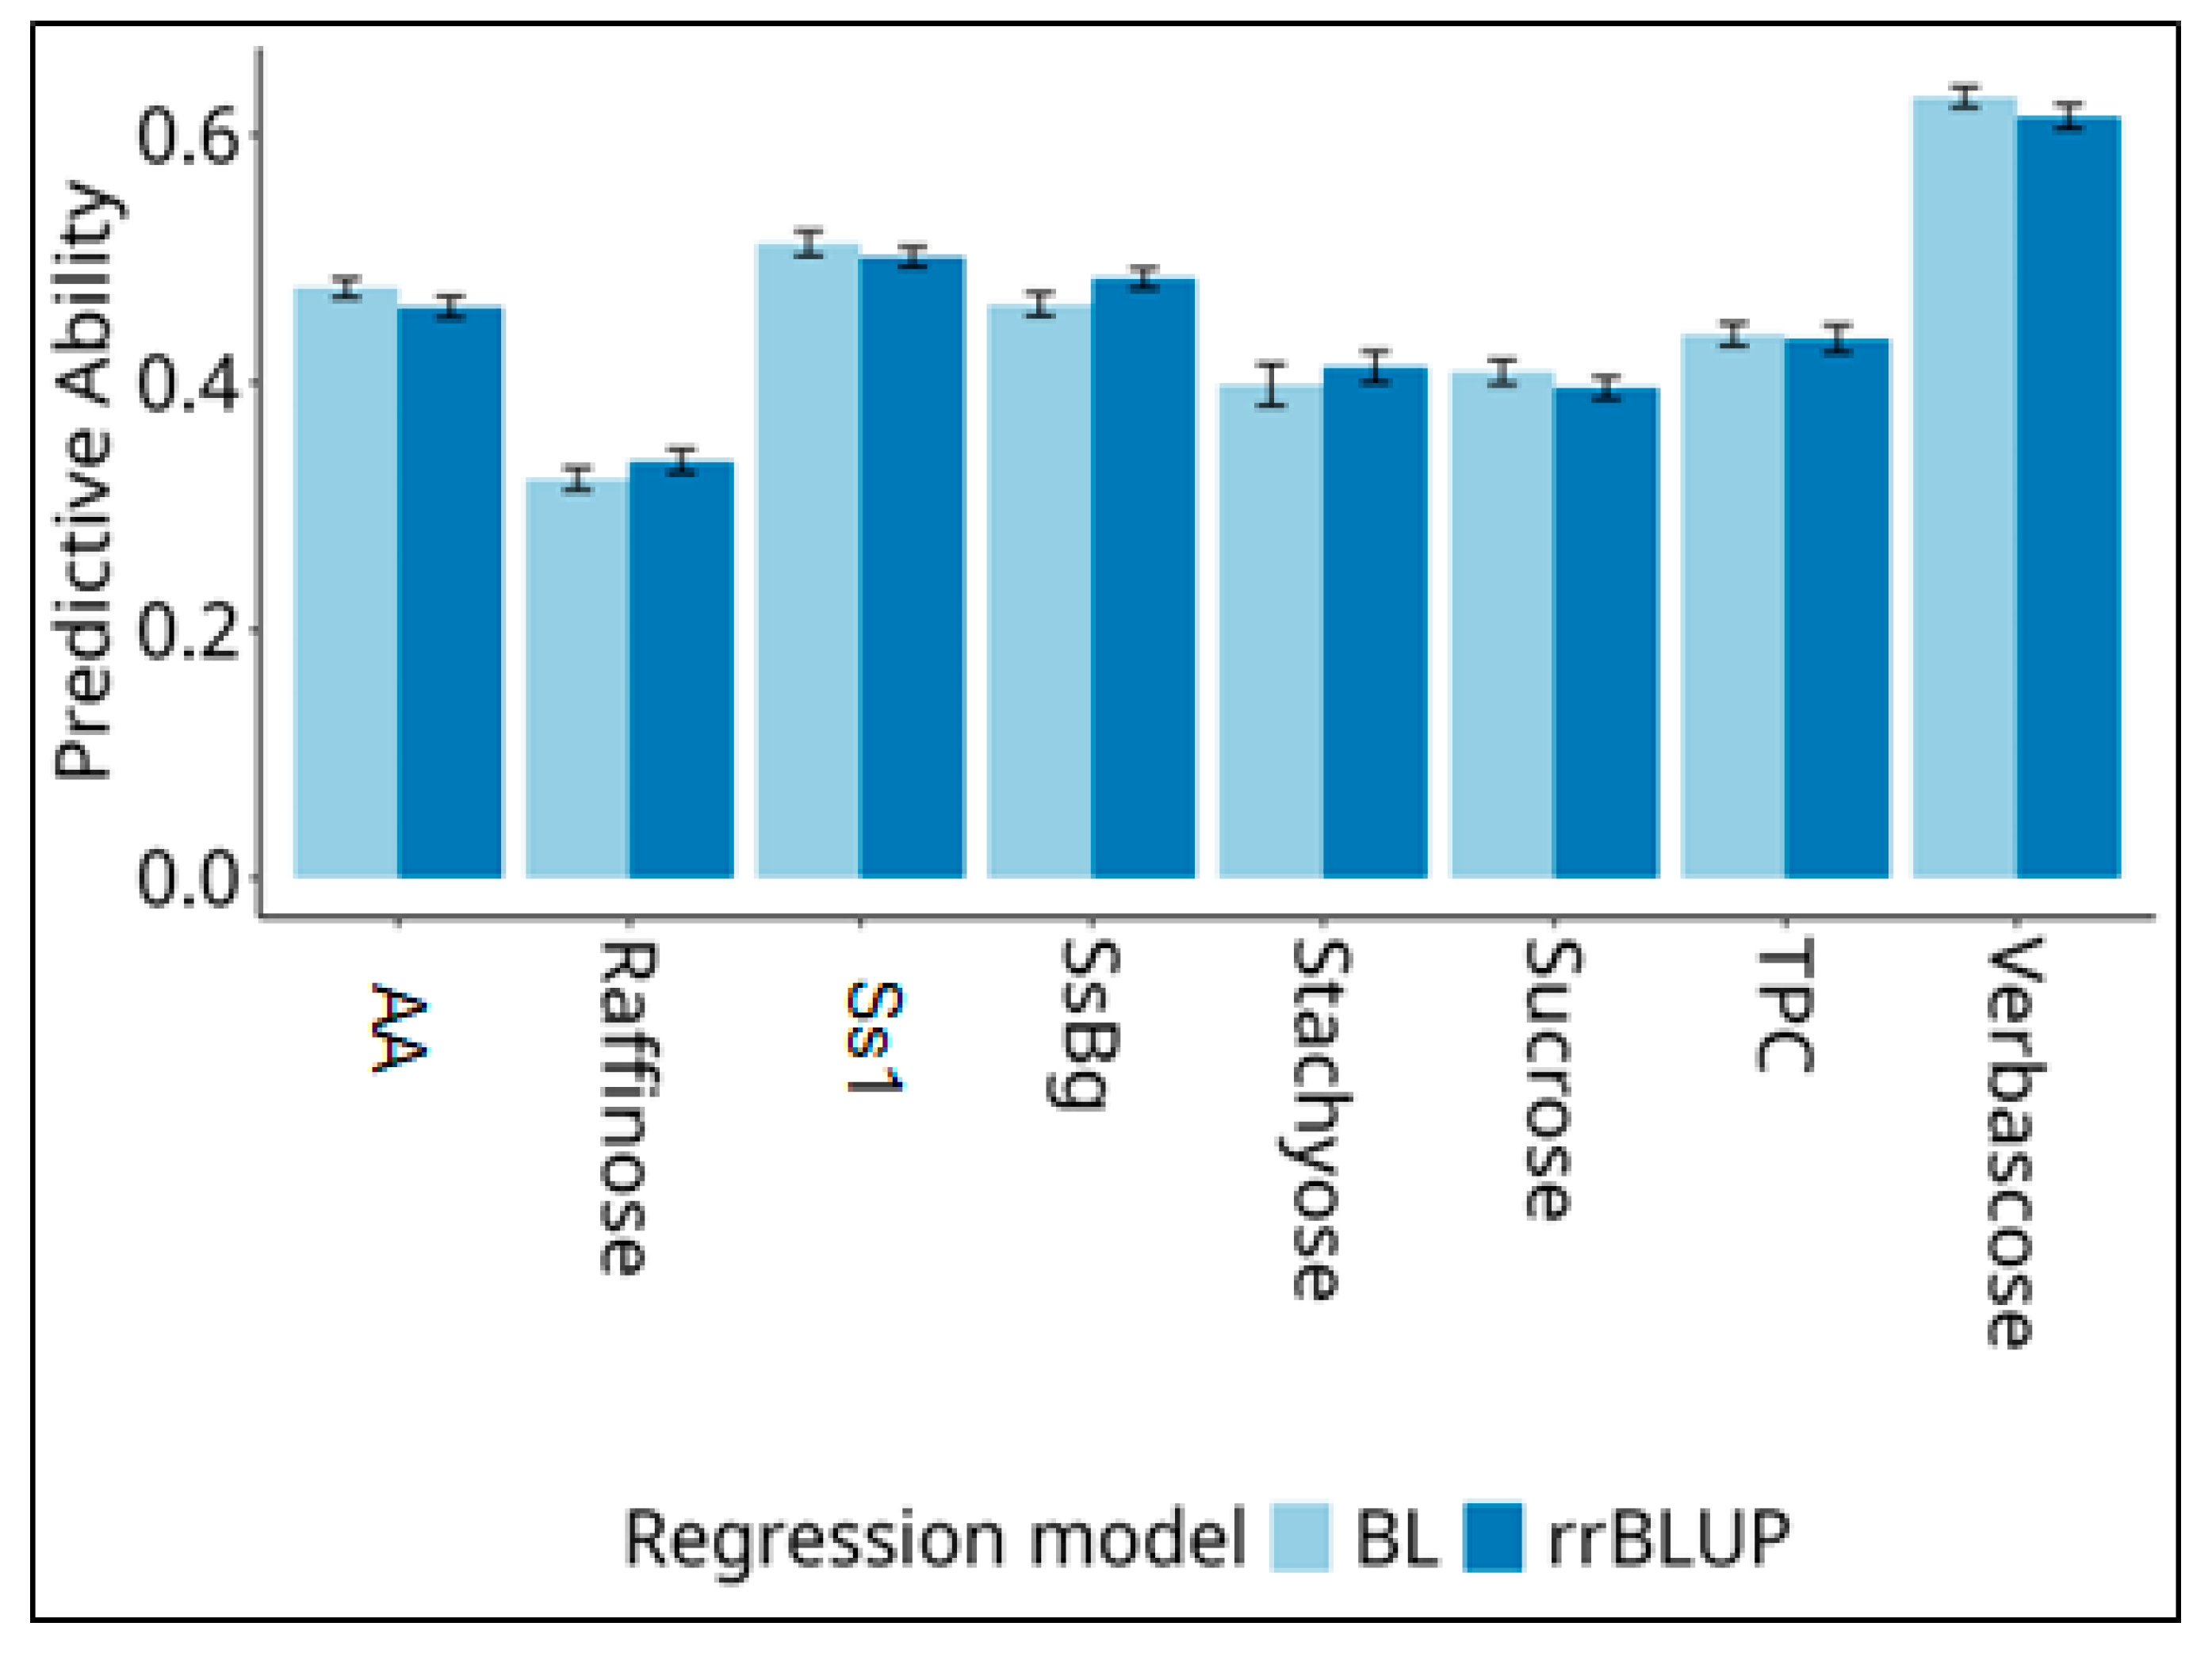
This study aimed to characterize the variation and genetic architecture of traits with nutritional and health relevance in 156 pea (Pisum sativum L.) accessions representing diverse geographic origins. The traits included total phenolic compounds (TPC), two saponins (Ssβg, Ss1), sucrose, three raffinose-family oligosaccharides (RFOs) and in vitro antioxidant activity (AA). Analysis of variance revealed significant effects of regional germplasm pools for all traits. Accessions from West Asia showed the highest TPC and AA levels, while those from the East Balkans and the UK displayed the lowest values. High saponin and RFO concentrations characterized accessions from Germany and the UK. Correlation and PCA analyses highlighted strong associations within compound classes and an overall negative relationship between TPC/AA and saponins/RFOs. Hierarchical clustering separated accessions into seven metabolically distinct groups partially reflecting their geographic origin. Linkage disequilibrium decayed rapidly (average 4.7 kb). GWAS with FarmCPU and BLINK identified 37 significant SNPs, 35 within annotated genes, associated with the metabolites. The polygenic genetic architecture supported the development of genomic prediction models, which showed moderately high predictive ability (> 0.40) for all traits except raffinose content. Our findings can support line selection and the identification of genetic resources with a desired level of secondary metabolites.

Keywords: 
;  ;  ;  ;  ;  

1. Introduction

Field pea (Pisum sativum L.) is a globally important cool season grain legume that is valued for its high yielding ability [1,2], a moderately high seed protein content reportedly in the range of 23-30% [3,4], and various agronomic benefits, such as nitrogen fixation, that enhance the sustainability of cropping systems [5,6]. An increasing interest for pea production in the European union has been driven by the demand for high-protein feedstuff to replace imported plant protein [7], and by the surge in demand for plant-based foods, driven by health, environmental, and ethical concerns [8,9,10].
Domesticated approximately 10,000 years ago in the Near East, pea gradually expanded its cultivation across the Mediterranean basin, China, Northern and Eastern Africa [11]. The genetic diversity of modern cultivars is very narrow [11]. Landraces and old cultivars, although largely available in germplasm collections, remain largely underutilized in plant breeding because of some unfavorable agronomic characteristics (e.g., the leafy trait) and the possibly high content of seed antinutritional factors (ANFs) [12,13]. Information on the diversity for seed quality traits of large pea germplasm collections focused largely on primary metabolites, especially protein content e.g. [14,15], whereas limited information is available for micronutrients and secondary metabolites. Among the various ANFs found in pea seeds, saponins, raffinose-family oligosaccharides (RFOs), and phenolic compounds are some of the most problematic, with negative effects on digestibility in monogastrics. However, some of these molecules have also been reviewed for their positive health-related effects for human diets [16].
Saponins are a diverse group of secondary metabolites that are widely spread in plant species [17]. Pea seeds contain triterpene saponins such as soyasaponin of the B class (of which Soyasaponin I is found in pea) and DDMP saponin (soyasaponin βg), which contribute to bitterness and astringency [18,19,20,21]. Saponins in pea and other grain legumes were also reported for their damaging effect on cell membranes [22]. Saponin content in different pea genotypes was found to be related to biotic stress response [23], confirming the role of these compounds in plant defense mechanisms. Variety differences in saponin content have been reported in pea, yet their variation across broader germplasm remains understudied. Several steps of DDMP saponin biosynthesis have been studied in different grain legumes, including pea [24]. [25] identified a major gene, BAS1, as being responsible for most of the DDMP saponin content in pea. In a recent work, [26] successfully developed a CRISPR/Cas9 protocol for the development of mutant lines with reduced DDMP saponin content in the seed.
The raffinose family of oligosaccharides (RFOs) includes α-D-galactosides of sucrose that are widely accumulated in pea seeds. The digestive tract of humans and monogastric animals lacks the α-D galactosidase, an enzyme that hydrolyzes the α-D (1 -> 6)-glycosidic bonds between molecules of galactose moieties present in the oligosaccharides. Therefore, RFOs are digested with the involvement of the bacterial microflora homing further sections of the intestine. Excessive amounts of carbon dioxide and hydrogen are produced as a result of sugar decomposition and fermentation of the released monosaccharides, causing flatulence and discomfort [27]. Therefore, RFOs are widely regarded as antinutritional factors causing flatulence in humans and monogastric animals [28]. In extreme cases, the increased content of RFOs in feed ratios for monogastric livestock can provoke diarrhea and reduce energy use.
Pea seeds are rich in polyphenols, a group of secondary metabolites primarily localized in the seed coat that has potential health benefits for humans. Polyphenols are known for their antioxidant activity and are involved in plant defense mechanisms [29]. Despite the positive health effects associated with polyphenols consumption, these secondary metabolites are also known as ANFs. In particular, condensed tannins hinder the digestibility of pea in monogastric animals [12] and decrease the iron absorption through chelation [30]. The core of the polyphenol biosynthetic pathway is well conserved across plant species [31]. The phenolic profiling of pea and other pulses was recently performed through liquid-chromatography and mass spectroscopy (LC-MS) [30,32]. The variation in pea seed coat polyphenols is associated with flower color, with purple color genotypes having specific classes of polyphenols, known as tannins, that are lacking in white flower genotypes, thus resulting in higher total polyphenols content in the former group [33]. The genetic regulation of flower color has been widely studied, notably as a character used by Mendel in the study of inheritance in pea, with two major genes being identified in the pea genome as responsible for the white color mutation [34].
The rapid development of next-generation sequencing technologies has revolutionized the study of genetic diversity, with genotyping-by-sequencing (GBS) emerging as a cost-effective and efficient approach for large-scale SNP discovery and genome-wide association studies (GWAS). Quantitative trait loci (QTL) and candidate genes were identified for pea seed quality traits relative to concentrations of crude proteins, amino acids, minerals and fibers, as well as protein digestibility [15,35,36,37,38,39,40,41]. Genomic prediction models, which integrate phenotypic and genotypic data to estimate the breeding values of untested genotypes [42], have also been envisaged for selection of traits, such as protein content, that exhibited a polygenic control [38,39,43], given the higher efficiency of genomic selection relative to marker-assisted selection for such traits [44].
While genome-wide association analysis (GWAS) and genomics have been applied extensively for the study of agronomic traits in pea, secondary metabolite traits remain underexplored within those frameworks. To address these gaps, this study was designed to (i) characterize for seed saponin, RFOs, and total phenolic compounds (TPC) and antioxidant activity (AA) of 156 pea accessions belonging to a collection previously described by [14], (ii) conduct GWAS to unveil the genetic architecture of these traits and identify associated genomic loci and potential candidate genes, and (iii) assess the scope and predictive ability of genomic prediction models for these traits.

2. Results

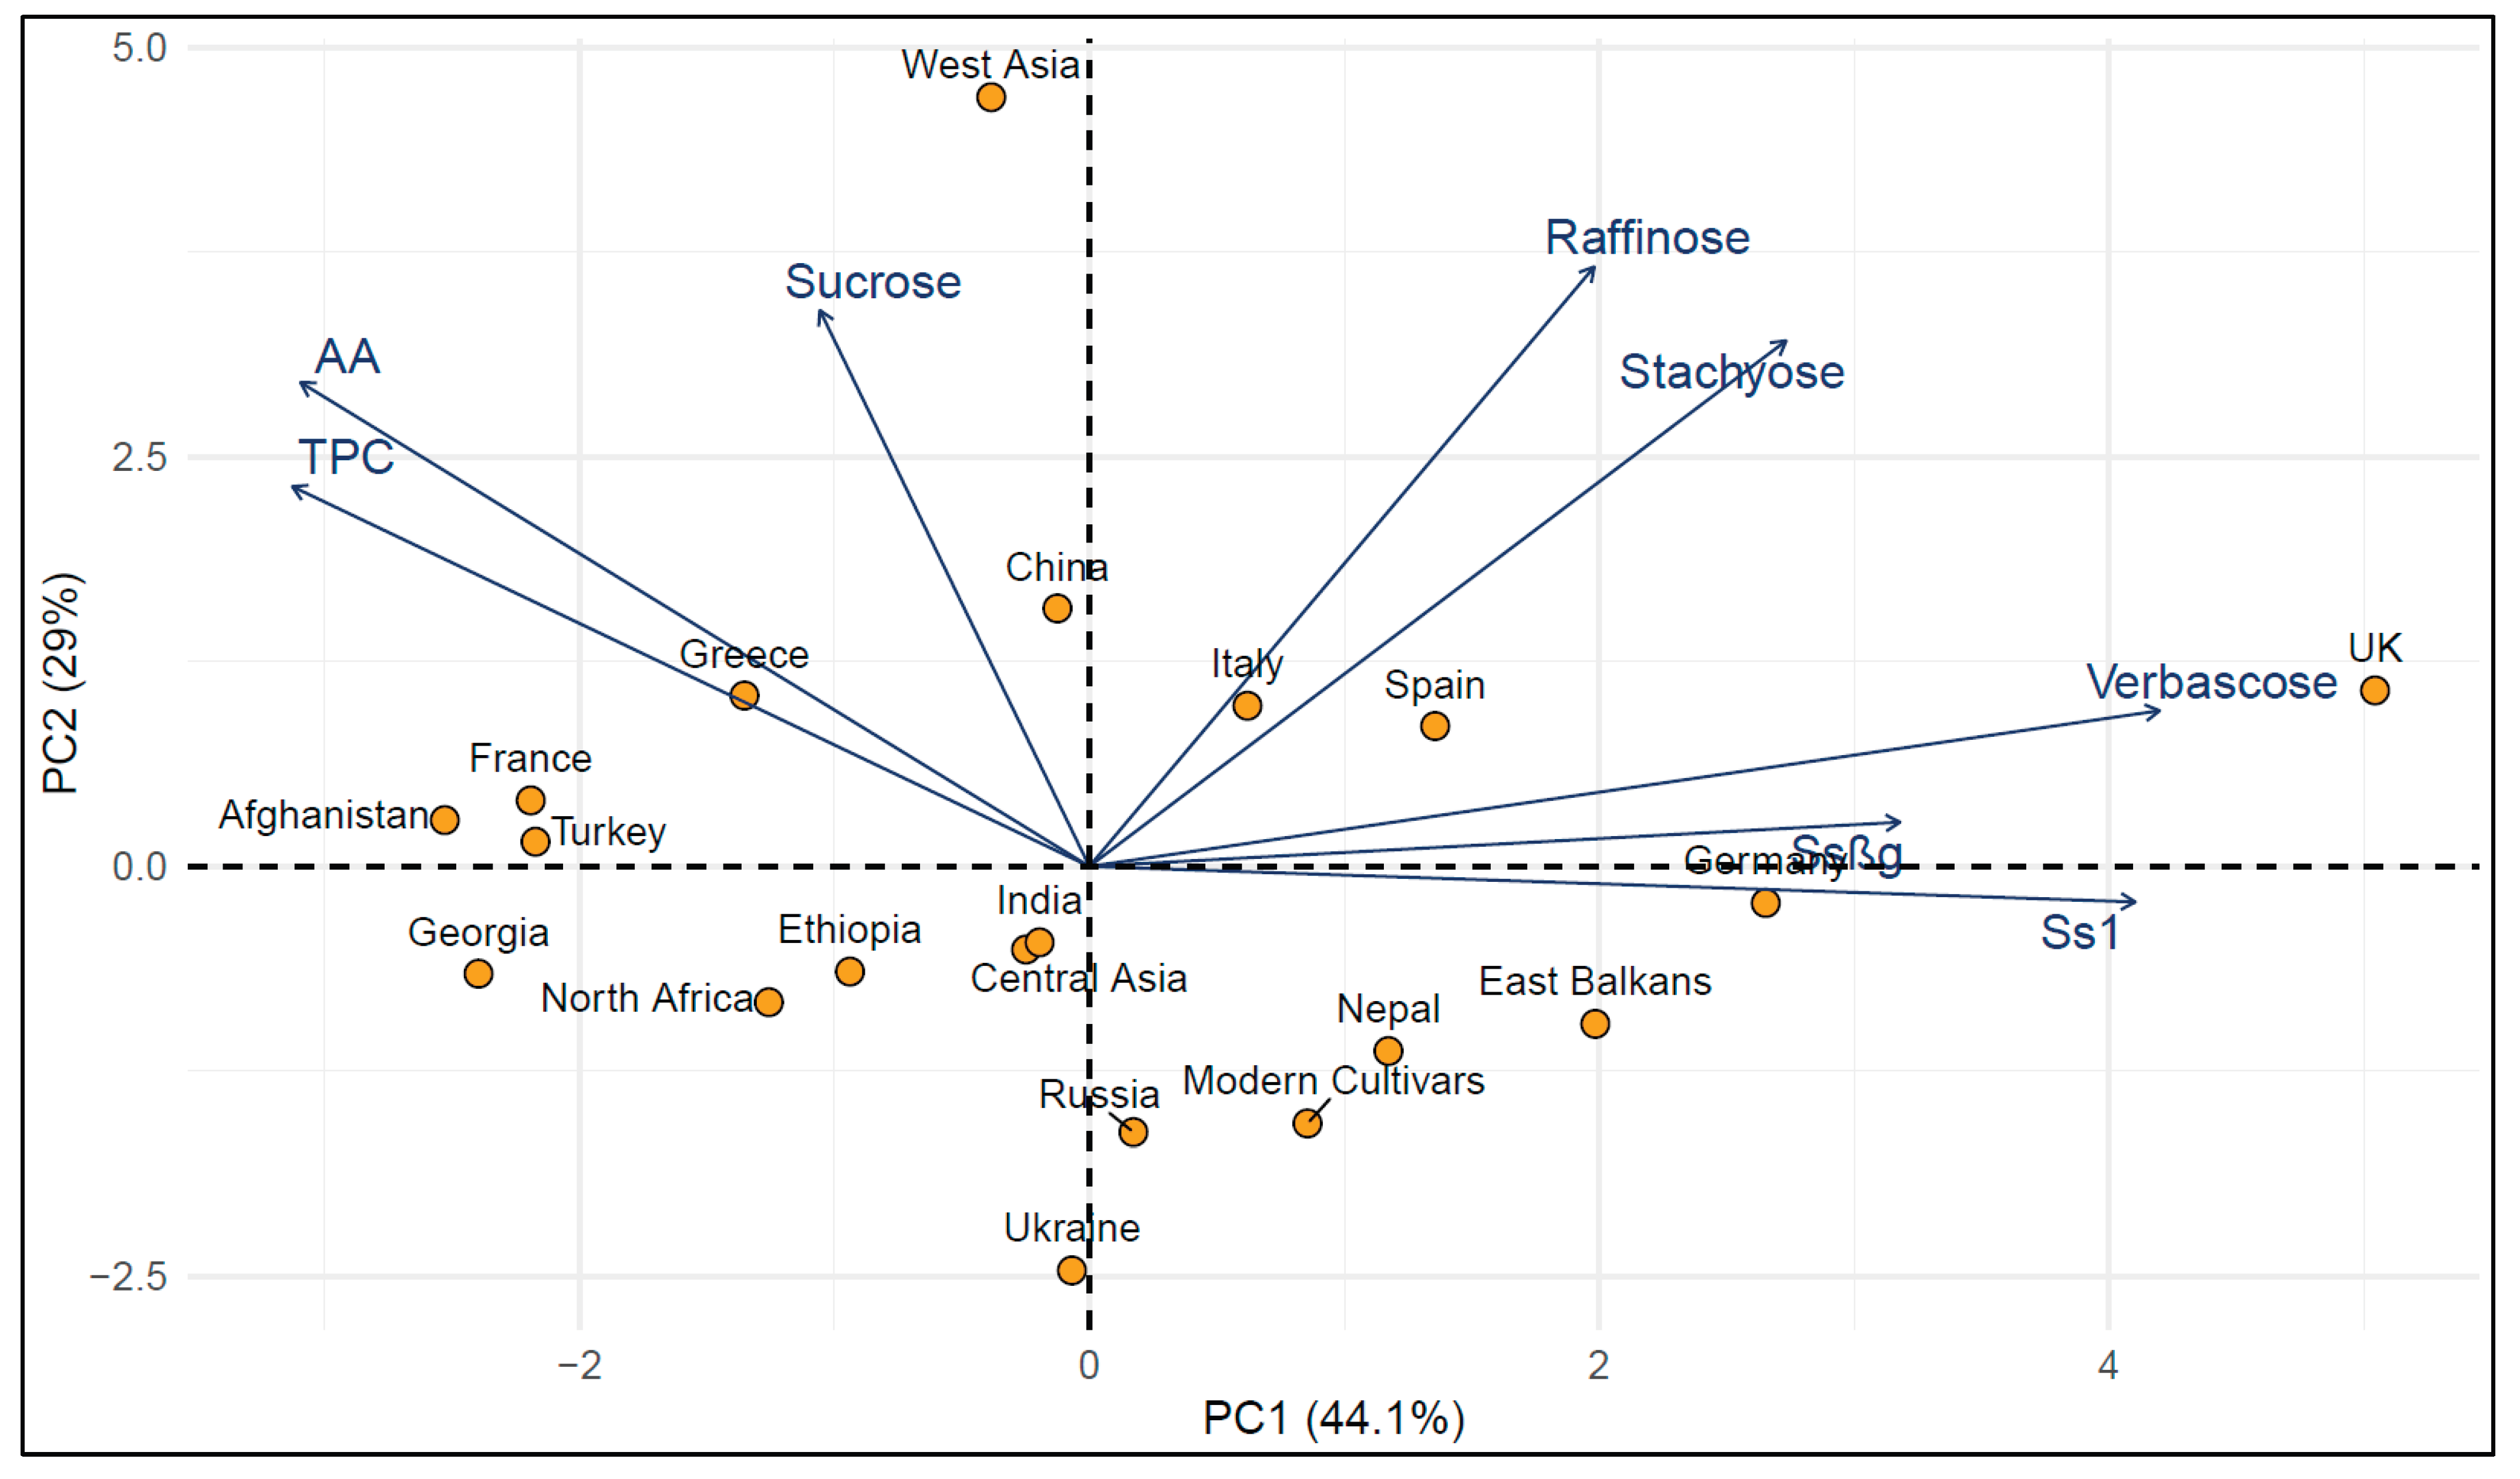
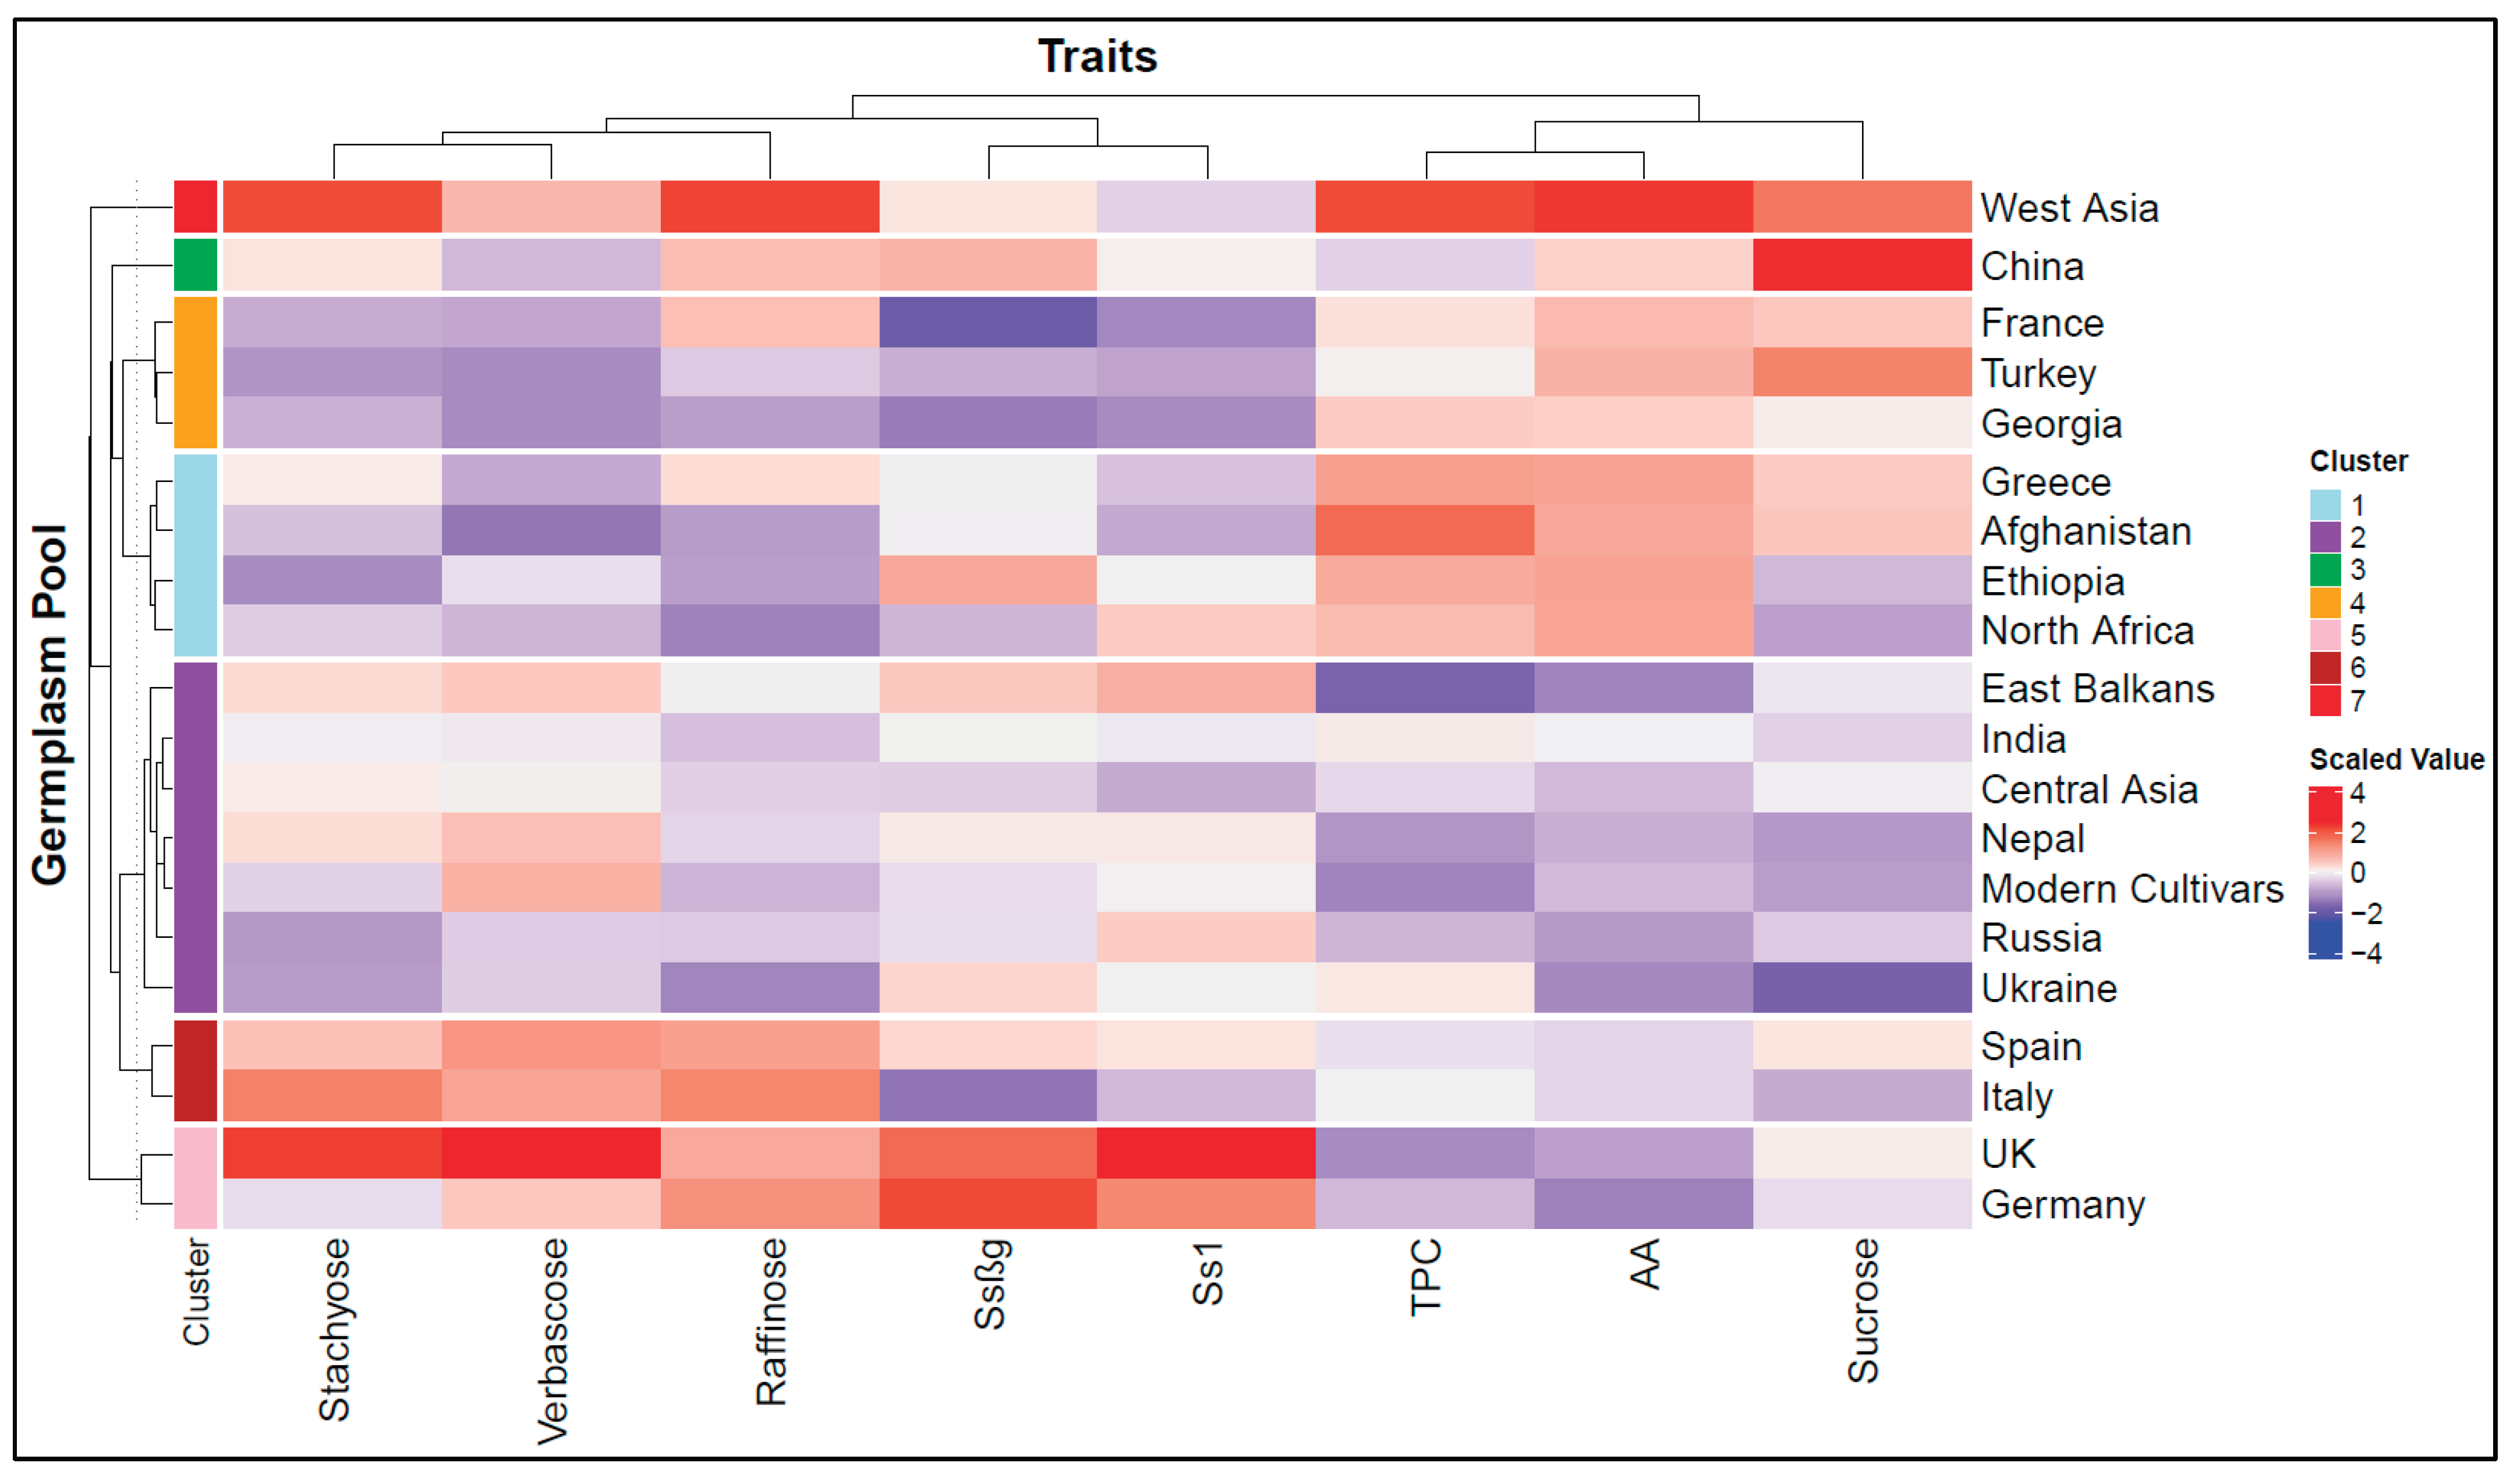
2.1. Phenotypic Trait Variation

The 156 pea accessions were grouped into 20 germplasm pools that included 19 regional landrace/old cultivar pools and one modern cultivar pool (Supplementary Table S1). The mean and range values of the germplasm pools for the seed content of eight secondary metabolites is shown in Table 1. The analysis of variance (ANOVA) showed significant variation among germplasm pools for the content of all traits (Table 1). The results of Tukey HSD mean comparisons are provided in Supplementary Table S2. On average, the highest and lowest contents of TPC were observed in accessions from West Asia and East Balkans, respectively. High TPC values also occurred in accessions from Greece and Afghanistan, whereas low values were also a feature of modern cultivars and accessions from the UK and Nepal. Highest and lowest values in vitro antioxidant activity (AA) featured the accessions from West Asia and Germany, respectively. On average, the soyasaponin βg saponin (hereafter referred to as Ssβg) displayed about 20-fold higher content than the soyasaponin I saponin (hereafter referred to as Ss1). The accessions from Germany and the UK had particularly high values of the former saponin, while those from France exhibited the lowest values. Materials from the UK had by far the highest content of the Ss1 saponin, while those from Georgia and France had the lowest values. Within RFOs, verbascose showed the highest mean value in the data set (8.52 mg/g), followed by stachyose (6.74 mg/g) and raffinose (2.47 mg/g). The mean value for sucrose was 5.90 mg/g. On average, UK accessions had the highest verbascose and stachyose contents, while those from Georgia and Ethiopia had the lowest content of these compounds. The accessions from China and Ukraine showed the highest and lowest content, respectively, of sucrose. Finally, the accessions from West Asia and North Africa had the highest and lowest content, respectively, of raffinose. Besides showing low TPC values, the germplasm pool including the modern cultivars was characterized by fairly low AA, intermediate content of saponin compounds, and fairly low levels of all RFOs (Table 1).
Several landrace/old cultivar germplasm pools (Turkey, Spain, France, UK, Italy, Greece) exhibited large within-pool variation across traits as indicated by the mean value of genetic coefficient of variation (CVg) values; in contrast, generally low within-pool variation was observed for a few landrace/old cultivar germplasm pools (Germany, Russia), as well as for the modern cultivar pool (Supplementary Table S3). On average, the within-pool genetic variation was particularly high for AA and the two saponins (Supplementary Table S3).
The association among traits was investigated through correlation analysis and principal components analysis (PCA). The highest correlations were found between metabolites belonging to the same category. In particular, high correlations (≥ 0.63; P < 0.01) were observed between the two saponin traits, between TPC and AA, and between the RFO compounds stachyose and verbascose or stachyose and raffinose (Table 2).
The first 2 axes of the PCA accounted for about 73% of the overall trait variation (Figure 1). The first axis tended to represent a contrast between germplasm pools with high saponin and verbascose contents (featuring with high score values) versus pools with high phenolic content and high antioxidant activity (featuring low score values) (Figure 1). The second PCA axis tended to represent a contrast between material with high values of the three soluble sugars (sucrose, raffinose, and stachyose) and, to a lesser extent, high phenolic content and antioxidant activity, featuring high score value and represented especially by the germplasm pool from West Asia, versus material with the opposite characteristics (featuring low score values; Figure 1). The PCA plot indicated the similarity of a few landrace/old cultivar germplasm pools with close geographical origin, such as those from Central Asia and India, or from Russia and Ukraine, or from Italy and Spain. On the whole, however, the ordination of the germplasm pools in the space of the first two PCA axes was not closely related to their region of origin. The accessions from UK and, to a lesser extent, those from Germany featured high score values on the first axis, whereas those from Afghanistan, Georgia, Turkey and France had low score values on this axis (Figure 1). The accessions from West Asia were strongly distinct along the second PCA axis.
To further explore the similarity of the germplasm pools based on their metabolic profile, we conducted a hierarchical cluster analysis that resulted in the optimal grouping of the pools into seven groups, partly reflecting the geographic similarity of the pools. The heatmap reported in Figure 2 simultaneously visualizes the seven groups and their association with their variation in metabolite contents. One group included German and UK accessions, featuring high saponin and RFO contents and low TPC and AA. A second, contrasting group included only the material from West Asia, characterized by high TPC and AA and relatively low saponin content. Two other groups (indicated by orange and light blue colours in Figure 2) tended to include germplasm pools of various origins having high TPC and AA and low RFO and saponins contents. A fifth group included only the germplasm from China, featuring very high sucrose content. A sixth group included the accessions from Spain and Italy, of which the main characteristic was a higher-than-average RFO content. One last group included the modern germplasm along with landrace/old cultivar groups from various regions of Eastern Europe (Ukraine, East Balkans), Russia, Central Asia, India, and Nepal (Figure 2). Most of this material featured average or below-average content of all secondary metabolites.

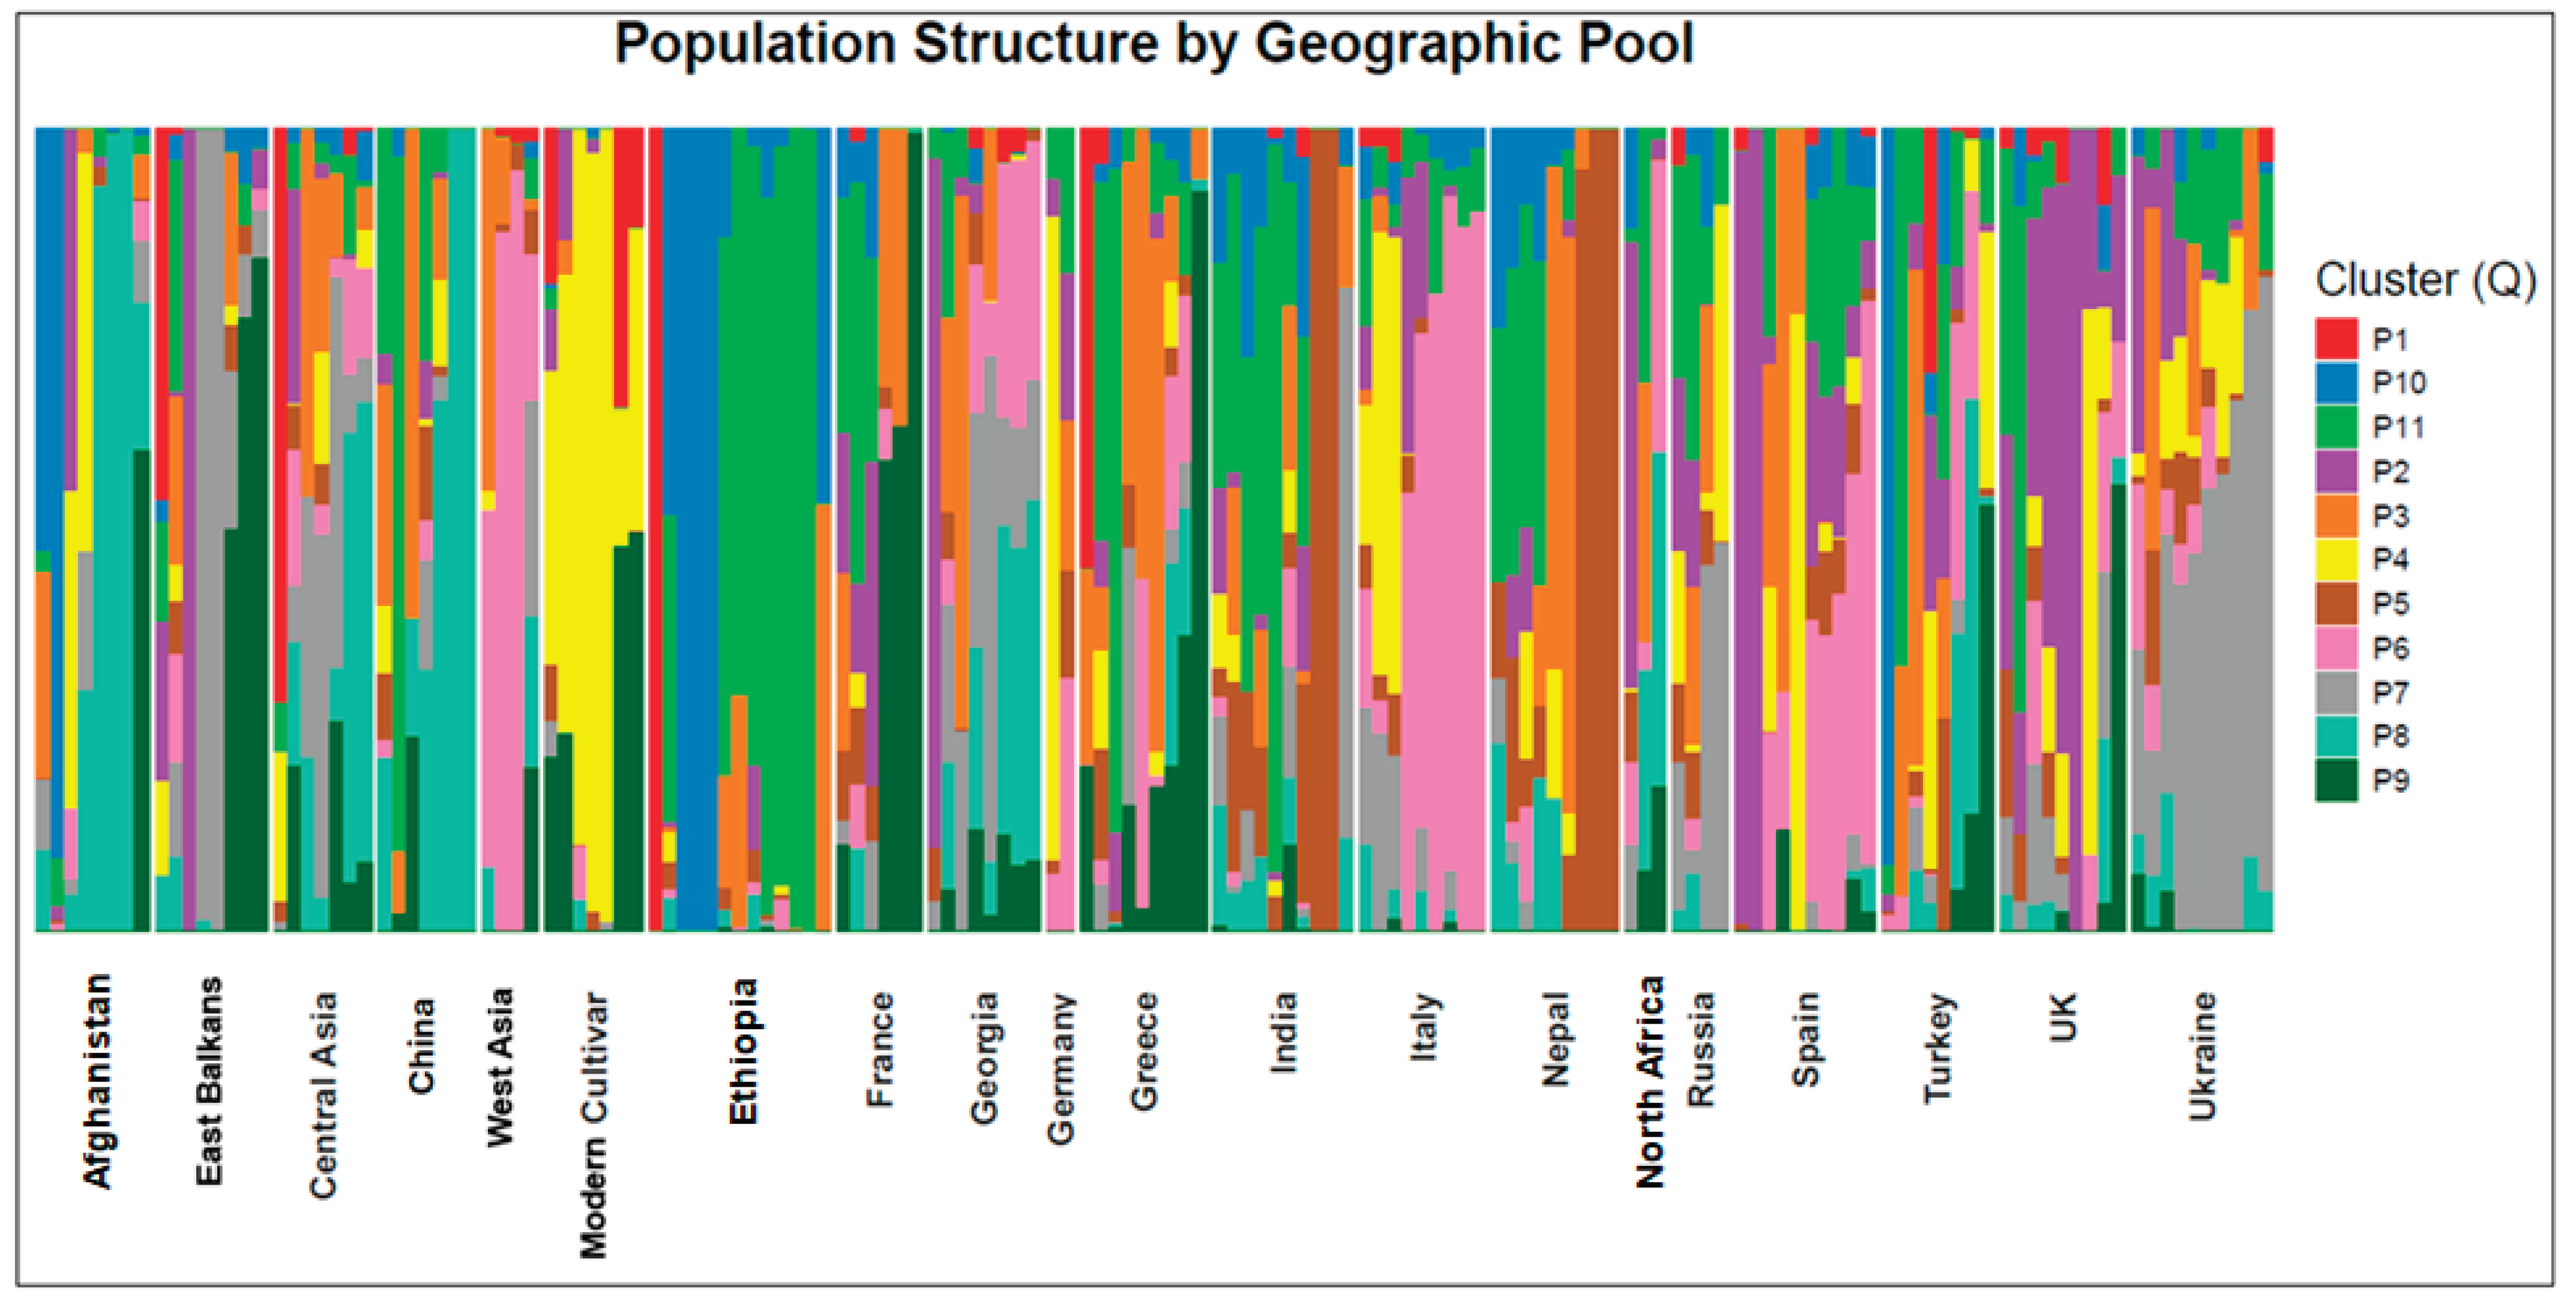
2.2. Analysis of Population Structure

Genomic data were available for only 151 of the 156 accessions characterized with phenotypic analyses. The structure analysis, which was based on 10,249 SNPs of the 151 pea accessions, indicated an optimal number of 11 clusters (Supplementary Figure S1; Figure 3). On the whole, the classification of the individual accessions partly reflected the origin and the type (old cultivar/landrace or modern cultivar) of the accessions. The cluster with the highest number of accessions (light green in Figure 3) comprised most of the accessions from Ethiopia and several from India. The second most numerous cluster (dark green in Figure 3) included several accessions from France and East Balkans and other single accessions from other pools. Most of the accessions from Italy, several from Spain and two from West Asia belonged to the same cluster (pink in Figure 3). Most of the accessions from Ukraine, two from Russia, and two from East Balkans belonged to the same cluster (gray in Figure 3). Also, most of the accessions from China and Afghanistan, as well as two from Central Asia, were classified in the same cluster (light blue in Figure 3). Three accessions from India and two from Nepal were assigned to the same cluster (brown in Figure 3). Finally, most of the modern cultivars were grouped in the same cluster (yellow in Figure 3), which also included an accession from Spain, one from the UK, and one from Germany. A total of 62 accessions were classified as admixed.

2.3. Linkage Disequilibrium Decay and Genome-Wide Association Study

The linkage disequilibrium (LD) decay was very fast in all chromosomes (Supplementary Figure S2). The distance at which the LD was likely due to physical linkage averaged 4669 bp with a range from 3390 to 5846 bp.
A GWAS was carried out for each traits according to two models, namely, BLINK and FarmCPU, selecting the significant SNPs according to the Bonferroni threshold at P = 0.05. Figure 4 reports the Manhattan plot results for BLINK, while those for FarmCPU are reported in Supplementary Figure S3. At least one significant SNP was identified for any trait. Three SNPs on chromosome 7, one on chromosome 6, and one of chromosome 5, were identified for TPC by the BLINK model. One SNP on chromosome 5 was found for antioxidant activity by both BLINK and FarmCPU. For this trait, BLINK identified two additional SNPs on chromosome 6, whereas FarmCPU identified four additional SNPs, of which two on chromosome 4, one on chromosome 3, and one in chromosome 7. For Ssβg, BLINK identified one SNP on chromosome 7 and a second one on chromosome 5 just below the threshold of significance, whereas FarmCPU identified one SNP in each of the chromosomes 1, 3, 5, 6 and 7. For Ss1, BLINK and FarmCPU identified the same two SNPs on chromosomes 2 and 5, while FarmCPU identified two additional SNPs in chromosomes 1 and 2. For verbascose, FarmCPU identified six SNPs (one in chromosomes 1, and three and two in chromosomes 5 and 7, respectively), while BLINK identified one SNP on chromosome 3. Interestingly, the same SNP was also significant for stachyose according to both BLINK and FARMCPU. For the same trait, FarmCPU identified one additional SNP on chromosome 3 (found just below the threshold of significance from BLINK), one in chromosome 1 and two in chromosome 7. For raffinose, BLINK identified two SNPs on chromosomes 4 and 5. Finally, for sucrose, one SNP was identified by the BLINK model on chromosome 4. Out of a total of 37 different significant SNPs identified by the GWAS, 35 were located within annotated genes, one was within the threshold of LD decay performed in our analysis, and one was not in the vicinity of any annotated gene in the pea genome. The list of the significant SNPs and their putative associated candidate genes are provided in Supplementary Table S4.

2.4. Genome-Enabled Prediction

The predictive ability of two statistical models (rrBLUP; Bayesian Lasso) envisaged for genome-enabled prediction is reported in Figure 5 for each of the eight traits. Bayesian Lasso exhibited greater predictive than rrBLUP for five traits out of eight, but the difference between models was always modest. Considering the best-predicting model, we observed high predictive ability (> 0.6) for verbascose content, and moderately high predictive ability (> 0.4) for all other traits except raffinose amount.

3. Discussion

Our study provided an assessment of the extent of pea genetic variation for eight important quality related traits that is unprecedented with respect to the number and the diversity of origin of the germplasm under study. Its results indicated a significant and considerably large variation for all traits, which was partially associated with the geographic origin of the accessions.
The range of TPC was between 0.35 and 1.07 mg GAE/g (Table 1), aligned with the values reported by [45] for 100 pea accessions (0.49-1.28 mg GAE/g) but lower than the range reported by [46] for ten pea varieties from China (0.66-2.66 mg GAE/g). The AA results, ranging from 0.16 to 2.40 µmol TE/g, were lower than those reported by [47], who found 0.19–3.97 µmol TE/g in 81 pea genotypes. Furthermore, the results were significantly inferior to the range of 6.06–12.49 µmol TE/g found by [46] in 10 pea varieties. Interestingly AA was the trait with the highest average CVg across germplasm pools, suggesting wide margins for its improvement through breeding.
Phenolic compounds, which include phenolic acids and flavonoids, stand out as extensively studied functional components of pea seeds [48]. These compounds and particularly the condensed tannins were traditionally considered ANFs because of their negative effects on protein digestibility in monogastric animals [49], but they have lately been reconsidered as valuable antioxidants able to effectively inhibit free radicals and to prevent oxidative reactions at cellular level. In addition, phenolic compounds play a pivotal role in modulating the gut microbiota by promoting the growth of beneficial species and inhibiting harmful bacteria [50], and exhibit a range of biological activities, including anti-diabetic, anticarcinogenic, cardioprotective and anti-neurodegenerative effects [51,52]. Hence, the consumption of phenolics-rich pea goes beyond a merely nutritional function, offering various potential health benefits [48,50,51]. A highly positive correlation was observed between TPC and AA, as known [53]. However, a previous study including pea and other pulses [30] highlighted a different contribution to the antioxidant activity of different types of polyphenols, suggesting to target specific types rather than general TPC by breeding work. Indeed, the increase of these compounds may result in negative effects such as iron chelation and protein precipitation. The complexity of the phenolic compounds biosynthetic pathway in grain legumes was recently highlighted by a study in faba bean [54]. This study indicated how different genotypes with the same genetic background at the low tannin gene locus (zt) had very different phenolic profiles, and how this was partially affected by the environment, suggesting that several genes are regulating the secondary branches of this pathway. A qualitative characterization of phenolic compounds of the accessions would represent a useful follow-up of this study.
The current overall variation for RFOs agree substantially with previous studies by [55] and [27], which analyzed the content of sucrose and RFO in a set of Spanish breeding lines and a pea collection from the Polish gene bank, respectively. Stachyose and verbascose consistently accounted for the highest total amount of RFO, although the maximum absolute values that we found (up to 16.20 for verbascose and 10.30 mg/g for stachyose) were lower than those reported in those studies. We identified low variation in raffinose content across germplasm pools as well as among individual accessions. This result may partly depend on the generally low raffinose content, since FT-IR based models are less effective in detecting trait variation for metabolites with low concentration. The observed high correlation between stachyose and verbascose is consistent with earlier findings and the fact that these compounds are synthesized through the same biosynthetic pathway, although different enzymes are active in the biosynthesis of verbascose in different pea genotypes [28].
Using the information on seed morphology and seed color reported for our panel by [39], we verified through t tests that the variation in RFO content was significantly associated with major seed traits. The accessions with a transparent seed coat (recessive allele) showed higher RFO levels than those with a colored testa; those with a wrinkled seed (recessive allele) had higher RFO content compared with smooth-seeded lines; and those with a green cotyledon (recessive allele) accumulated more RFO than those with yellow or dark cotyledons. These findings are consistent with previous reports indicating that seed morphology and seed color are linked to variation in oligosaccharide composition in pea, with substantially lower RFO levels observed in lines carrying the dominant alleles controlling seed shape, seed coat color, and cotyledon color [27]. Similarly, [55] reported an association of seed coat with the concentration of soluble sugars.
The observed variation in saponin content was wide, both for Ssβg (often reported as DDMP saponin in pea; range of 0.04-1.0 mg/g), which represented the main compound, and Ss1. However, a wider range of total saponin concentration, namely, 0.8-2.5 mg/g, was previously reported [19]. Advances in gene editing such as CRISPR/Cas9 might help to quickly introduce the low-saponin mutation in elite pea germplasm [26], but regulation issues might be a limiting factor for practical applications of such technologies. Therefore, the identification of accessions, such as those from the French and Georgian pools, with considerably lower saponin content than that of modern cultivars is remarkable from a breeding perspective, encouraging the selection for reduced saponins through crossing of these genetic resources with elite lines.
The analysis of population structure based on SNP data indicated a partial association between genetic diversity and geographical origin of the material. Our results agree with those in [39] based largely on the same plant material. Modern cultivars tended to be genetically distinct from landrace germplasm pools in the structure analysis. Interestingly, the metabolic profile of the set of modern cultivars was characterized by an intermediate content of saponins and RFOs and a fairly low content of TPC and DPPH, indicating scope for an improvement of the nutritional profile of modern germplasm by introgression of useful variation from old varieties and landraces.
The GWAS identified various SNPs associated with each of the focus traits, a result that supported their polygenic control. The investigation of gene ontology (https://plants.ensembl.org/) suggested that most of the candidate genes containing or in LD with the significant SNPs seem to play a role in cell metabolism, general stress response or DNA transcription regulation. Among the genes that were characterized by more specific functions, Psat5g137080, associated with Ss1 saponin and identified by both the BLINK and FarmCPU models, encodes a Acetyl-CoA carboxylase protein that plays a role in the fatty acid biosynthetic process [56]. The Ss1 saponin is lipid-derived molecule to which a sugar moiety is added in a later stage of the biosynthetic pathway to give it both hydrophobic and hydrophilic properties. Psat7g192120, here associated with TPC, has an orthologue in Arabidopsis thaliana (NCRK) that is known to code for a cysteine-rich receptor-like kinase (RLK) that is involved in plant signaling pathways, including those responding to stress and pathogen attacks [57]. Phenolics compounds are well-known to be active in plant stress response and their accumulation in plant organs is often enhanced in response to both biotic and abiotic stresses. The Psat1g013760 gene was associated with verbascose and codes for a Histidyl-tRNA synthetase protein. The Arabidopsis thaliana orthologue of this gene (HRS1) encodes a transcription factor involved in integrating nitrate and phosphate signaling to regulate root development and seed germination [58]. RFOs were shown to contribute to the control of seed germination in Arabidopsis,[59] and were correlated with enhanced seed vigor in Zea mays [60]. Our inability to identify genes with a clear disruptive function in the biosynthetic pathways of the secondary metabolites, and the identification of several genes with broad metabolic roles, indirectly supported the conclusion that these traits are under polygenic control. Such a result would support the usefulness of genome-enabled prediction models for breeding line selection and/or the identification of useful genetic resources.
Although Bayesian Lasso is theoretically more suitable than rrBLUP for genomic prediction of traits that are not controlled by many genes [61], its advantage occurred only for five of the eight secondary metabolites and, anyway, in the presence of similar predictive ability of the two statistical models for all traits. A similar predictive ability of the two models was reported earlier for other pea traits which, although polygenic, might be less genetically complex than crop yield, such as protein content, onset of flowering, seed weight, frost resistance, and tolerance to rust [39,62,63,64]. The moderately high predictive ability (> 0.4) observed for all traits except raffinose content has high perspective interest for selection of breeding lines or identification of genetic resources with a desired level of secondary metabolites. On the other hand, raffinose could probably be seen as the least important of the eight secondary metabolites, as it was the RFO with lowest content in the seed. Our results, combined with earlier results for the same germplasm collection showing moderately predictive ability (0.55) also for protein content, would allow to envisage a multi-trait genome-enabled selection for a combination of primary and secondary traits. The predictive ability of the current models for reference populations other than the current global germplasm collection (and similar material) is pending verification. The prediction model for protein content constructed from data of the current germplasm collection displayed a moderate fall of predictive ability (from 0.55 to 0.28) when applied for prediction of a completely different, genetically narrow reference population of breeding lines evaluated under climate conditions quite different from those used for the germplasm collection [39].
In conclusion, the information provided by this study on the extent and geographical pattern of genetic variation, the genetic control, and the genome-enabled prediction of the eight focus traits can contribute to more targeted and efficient breeding efforts aimed to select breeding lines and identify genetic resources with a desired level of secondary metabolites, filling a research gap and meeting the growing demand for pea production with suitable traits.

4. Materials and Methods

4.1. Plant Material

The study included 156 ecotypes or old cultivars of P. sativum subsp. sativum subdivided into 19 regional pools, each represented by 4–14 entries, and 7 modern cultivars bred in France (Attika, Dove, Isard, Spirale), Spain (Cigarron, Viriato) or Germany (Santana) (Supplementary Table S1). This collection was previously described and characterized for agronomic traits by [14]. Plants were grown in 7.5L pots filled with peat soil in greenhouses at the Norwegian University of Life Sciences (NMBU) in 2023. Each accession was represented by two pots containing 4 seeds each. The pots were randomized in the greenhouse, setting the growing conditions to 16 h photoperiod, 300 μmol/ m-2 s-1 photosynthetic photon flux density (PPFD), and 21-16 °C day/night temperature. The plants were fertilized once during the experiment with 3 g/pot of NPK (19-4-12) fertilizer and watered regularly to maintain optimal growth. They were progressively harvested when they reached optimal maturation, pooling the seeds belonging to the same accession. Seeds were oven-dried at 60 °C for 24 h before sample preparation for the chemical analyses.

4.2. Chemical Analyses

A dried seed sample of 100 g from each accession was milled using Retsch Twister (Retsch GmbH, Germany). Flour from the same sample was used for all chemical analyses.

4.2.1. Total Phenolic Compounds and Antioxidant Activity

The extraction of TPC was carried out according to [65]. In detail, 1 g of sample was extracted with 5 mL of an 80:20 methanol/water solution (v/v). The suspensions were submitted to ultrasound (CEIA international S.A., 115/230 Vac 1 - 50/60 Hz–400 Watt, Viciomaggio, Italy) for 15 min at room temperature, then shaken for 30 min and centrifuged (Thermo Fisher Scientific, Osterode am Harz, Germany) for 10 min at 12000 × g at 4 °C. The supernatants were filtered through 0.45 μm nylon filters. The TPC were then quantified as described in [66] with some modifications. Specifically, 200 µL of the filtered extract was added to 800 µL of deionized water and 100 µL of Folin-Ciocalteu reagent and kept in the dark for 3 min, then 800 µL of 7.5% Na2CO3 was added, followed by incubation for 60 min, again in the dark. The spectrophotometric quantification was carried out at 720 nm, using a Cary 60 UV–Vis spectrophotometer (Agilent Technologies, Santa Clara, CA, USA) and TPC were expressed as mg gallic acid equivalents (GAE)/g of sample. The analysis was carried out in triplicate.
To assess the in vitro AA, the phenolic extracts were submitted to radical scavenging assay using 1,1-diphenyl-2-picrylhydrazyl (DPPH) radical, according to [66]. A 0.08 mM solution of DPPH in ethanol was freshly prepared. For the analysis, 50 µL of the extract was added to 950 µL of DPPH solution. After 30 min of incubation in the dark, the absorbance was read at 517 nm. The results were expressed in µmol of 6-Hydroxy-2,5,7,8-tetramethylchroman-2-carboxylic acid (Trolox) equivalents (TE)/g of sample. The analysis was carried out in triplicate.

4.2.2. Saponins

Two replicates, each consisting of 50 ± 0.2 mg of dried flour in a 2 mL vial, were prepared for each accession. In addition, an extraction blank, i.e. a vial without pea flour, was prepared for each extraction day. Blanks and sample replicates were randomized, then each was extracted in 500 µL 80/20 methanol/water (v/v, 80% MeOH containing 1 µg/mL Ginsenoside Rb1 as ISTD). The extracts were shaken for 30 min (1400 rpm, 20 °C), then centrifuged for 5 min (12 000 rpm, 20 °C, Heraeus Fresco21, Thermo Fisher Scientific). After removing 400 µL of the supernatant to a second vial, the pellet was resuspended and re-extracted as before in 500 µL 80 % MeOH (without ISTD). Then, 500 µL of the supernatant were combined with the previous 400 µL, vortexed, filtered through 0.2 µm regenerated cellulose (RC) syringe filters (Phenomenex Inc), and finally diluted 1:10 in 80 % MeOH. A QC sample was prepared by pooling aliquots from each extract. Extracts were analyzed in newly randomized order and after injection of extraction blanks on a Vanquish Horizon UHPLC coupled to an Orbitrap IQ-X iontrap orbitrap mass spectrometer (both Thermo Fisher Scientific). The chromatographic system consisted of an autosampler, pump, an Ascentis Express C18 column (150 mm × 2.1 mm, 2.7 µm, Merck) with a 5 mm guard cartridge maintained at a stable 20 °C in a column compartment, and a photodiode array detector (PDA) recording at 205 nm and 227 nm. The mobile phase was (A) water (0.2 % FA) and (B) ACN:MeOH 3:1 (v/v, 0.2% FA) with the following gradient: 0 min 15 % B; 10-14 min 90 % B; 14.1-16 min 100 % B; 16.1-24 min 15 % B. The flow was 0.25 mL/min and 1 µL of sample was injected. The heated ESI spray chamber settings were as follows: spray –3500 V, sheath gas 40 au, aux gas 15 au, sweep gas 2 au, ion transfer tube 350 °C, vaporizer 325 °C. The MS recorded in full scan mode in the time range 1.5-16 min and mass range m/z = 500-1700 Da. Saponins were first identified by their molecular ion as well as their tandem mass spectra (MS2) acquired representatively on the QC sample. Isolation and targeted fragmentation (tMS2) were performed on 5 candidate molecular ions (Supplementary Table S5) identified from PDA and MS chromatograms. Fragmentation used collision induced dissociation (CID) with 10 ms activation time at normalized collision energies of 30 %, 45 %, and 60 % and 5 s cycle time. The isolation window was m/z = 3 Da and isolation offset m/z = +1 Da. The resolution was set to R = 60 000 FWHM (at m/z = 200) for full scan and R = 30 000 FWHM for MS2 scans. Three scans were averaged to improve MS2 spectrum quality. MS2 spectra were subsequently compared to published data (Pollier et al., 2011). Individual saponins were then quantified based on their parental extracted ion chromatogram, corrected for ISTD, as soyasaponin-I equivalents based on an 11-point standard dilution series (0.005-5 µg/mL). The QC sample was analyzed after every 10th sample injection. Quantification was done in TraceFinder v.5.1 (Thermo Fisher Scientific) and corrected for sequential extraction loss.

4.2.3. HPLC Quantification of Sucrose and RFO for FT-IR Calibration

For each genotype, one sample consisting of 50 ± 2 mg of finely ground pea flour was weighed into 15 mL polypropylene centrifuge tubes. Samples were extracted in 10 mL of 50 % (v/v) ethanol containing 50 µg/mL melibiose as internal standard (prepared from a 1 mg/mL stock solution in Milli-Q water with 0.02 % sodium azide). Tubes were vortexed and subsequently shaken horizontally at 250 rpm and 50 °C for 1 h in an incubator. After extraction, samples were allowed to stand vertically at room temperature for 15 min and then centrifuged at 4000 × g for 10 min. The resulting supernatant was diluted 1:10 (v/v) with Milli-Q water, filtered through 0.22 µm PVDF syringe filters (Merck KGaA) into HPLC vials, and used for chromatographic analysis.
Soluble sugars were quantified by High-Performance Anion-Exchange Chromatography coupled with Pulsed Amperometric Detection (HPAEC–PAD) using a Dionex ICS 5000+ system (Thermo Fisher Scientific, USA) equipped with an AS-AP autosampler, ICS 5000+ SP pump, and ICS 5000+ DC column oven and detector compartment. The detection system consisted of a pulsed amperometric detector with a gold working electrode and an Ag/AgCl reference electrode, operated using the following waveform: 400 ms at 0.11 V; ramp 10 ms from 0.10 V to −2.00 V; 10 ms at −2.00 V; ramp 10 ms from −2.00 V to 0.60 V; ramp 10 ms from 0.60 V to −0.10 V; and 60 ms at −0.10 V. Separation was achieved on a CarboPac PA-1 analytical column (Thermo Fisher Scientific) with a CarboPac PA-1 guard column, maintained at 25 °C. The mobile phase consisted of A) MilliQ-water, B) 200 mM NaOH and C) 100 mM NaOH, 500 mM Na-acetate using the following A:B:C (v/v) gradient program: 0-5 min 49:49:2, 28-31 min 48:48:4, 31-34 min 0:0:100, followed by re-equilibration at start conditions. The injection volume was 25 µL, and the flow rate was 1 mL min⁻¹. Quantification was performed using external calibration with mixed sugar standards (sucrose, raffinose, stachyose, and verbascose) prepared in the same solvent system, with melibiose as internal standard.

4.2.4. FT-IR-Based Modeling for Sucrose and RFO

The content of soluble sugars, namely sucrose, raffinose, verbascose and stachyose content were estimated by Fourier Transform Infrared Spectroscopy (FT-IR) using Partial Least Squares (PLS) calibration models using the HPLC results for individual sugars as reference.
For the FTIR measurements a Bruker Invenio spectrometer (Bruker Optics, Billerica, MA, USA) equipped with a Pike MIRacle diamond crystal ATR accessory with a Deuterated Triglycine Sulfate (DTGS) detector was used for data collection. The spectra were recorded in the region between 4000 and 600 cm-1 with a spectral resolution of 4 cm-1 based on 32 scans. Before each sample a background spectrum of the empty ATR crystal was recorded to compensate for water vapour and CO2. Three replicates were measured for each sample. All FTIR spectra were imported to the Aspen Unscrambler version 14 (AspenTech Inc., USA) and spectra were processed by applying a Savitzky-Golay 2nd derivative with a 2.degree polynomial and a window size of 9. PLS models were calculated from average spectra for the spectral range 1800-700 cm-1 using the individual sugars as reference. This resulted in the following models: for sucrose root mean square error of cross validation RMSECV=0.9 and R2=0.83 (7-factor model); for verbascose RMSECV=1.27 and R2=0.77 (6-factor model), for raffinose RMSECV=0.26 and R2=0.77 (7-factor model) and for stachyose RMSECV=1.2 and R2=0.46 (3-factor model). For further statistical analyses sugar content from three individual replicate spectra was predicted from these models

4.3. Statistical Analyses

For each trait, a linear model with the random effects accession and replicate was fitted using the lmer() function from the lme4 package [67] of the R software with the following formula:
Y i j = µ + u i   + v j + ϵ i j  
where Y i j is the phenotype; µ is the overall mean; u i   represents the random effect of the i-th genotype; u i   N ( 0 , σ u 2 ) ; v j   represents the random effect of the j-th replicate; v j N ( 0 , σ v 2 ) ; and ϵ i j   N ( 0 , σ ϵ 2 ) is the residual error term. Best linear unbiased predictors (BLUPs) adjusted means for each accession were calculated by adding the random effect deviations to the overall intercept and used as input data for the subsequent correlation analyses, multivariate analyses, and genome-wide association studies (GWAS). For TPC, DPPH and soluble sugars, the models were fitted using data from three analytical replicates per accession, while two replicates per accession were used for saponins.
The response variables were evaluated for normality using both visual inspection (histogram and Q–Q plot of model residuals) and the Shapiro–Wilk test. Although for some traits the Shapiro–Wilk test indicated departures from perfect normality (p < 0.05), the visual assessment suggested approximately normal distributions without major deviations, supporting the suitability of the data for mixed model analysis.
An analysis of variance (ANOVA) that included the fixed factor germplasm pool and the random factors accession within germplasm pool and replicate assessed the variation between the 20 germplasm pools (hence, holding accession within germplasm pool as the error term for germplasm pool comparison).
To assess the magnitude of genetic variation within each germplasm pool, the variance between accessions of each germplasm pool was estimated and the genotypic coefficient of variation (CVg) was calculated as the square root of the genotypic variance divided by the trait mean value for the relevant pool.
Pearson’s correlation coefficients were estimated from BLUPs of individual accessions to test the association among traits. Multivariate patterns of variation among germplasm pool accessions were investigated by principal component analysis (PCA) and hierarchical clustering analysis (HCA). These analyses were performed on the BLUPs matrix of germplasm pool by trait after trait standardization to zero mean and unit variance. PCA and HCA were performed with PCA() and hclust() function of the factormineR [68] and the stats package function of R, respectively. For HCA, the distance matrix was calculated using Euclidean distance with the dist() function of the stats package according to Ward clustering algorithm. The optimal number of clusters was chosen both through visual assessment of the dendrograms and the silhouette method after generating the relative plot with the package cluster() [69]. Finally, a heatmap was created with the Heatmap() function from the ComlexHeatmap package [70], to simultaneously visualize HCA results for the metabolites and accessions. All other statistical analyses were performed by the R package stats (R Core Team, 2025).

4.4. GBS, SNP Calling, Marker Filtering and Imputation

Information on DNA isolation and GBS-based genotyping can be found in [71]. SNP calling was performed using Legpipe2 pipeline [72] with default settings for diploid species, with a preliminary filtering for mapping quality (MQ < 40). For alignment, we used the Pisum sativum L. (2n = 14) reference genome version 1a [73]. The whole set was filtered for minor allele frequency (MAF) > 5%, missing rate < 50% and imputed with the k-Nearest Neighbors (KNN) method. This process retained 10,249 SNP markers.

4.5. Linkage Disequilibrium, Population Genetic Structure and Genome Wide Association Study (GWAS)

Genomic data were available for only 151 of the 156 accessions characterized with phenotypic analyses; therefore, only 151 accessions were considered for the following genomic analyses. The linkage disequilibrium (LD) for each single chromosome was calculated using only the SNP markers with known chromosomal position relative to the reference genome [73]. LD was estimated as the squared allele frequency correlations (r^2) for each pairwise combination of markers distanced within 100 Kbp with the pcor.shrink () function of the package corpcor in R studio. LD was then plotted against the genomic distance between marker pairs and the LD decay was visualized with the LOESS regression model. The LD decay was estimated as the point where the fitted curve reached half of its maximum value [74].
The population structure was analyzed with the snmf() and Q() functions of the R package LEA [75] which output the results in a similar way as the STRUCTURE software although it employs different algorithms and was indicated as being more accurate for self-pollinating species [39]. Filtered and imputed SNP data, as described in the section above, were used as input in the analyses. The optimal number of genetic clusters was selected after visual assessment of the cross-entropy parameter plot estimated through cross-validation.
A GWAS was conducted for the eight phenotypic traits for 151 pea accessions using two models, namely FarmCPU and Blink, using the R package “GAPIT” [76]. The population structure was accounted for by including the first 2 principal components of a PCA conducted on the SNPs data (Supplementary figure 2). The appropriate compensation of the population structure was assessed through the visual examination of quantile-quantile (QQ) plots. For trait which showed an over-compensation of population structure (Ssβg and Ss1) GWAS models with reduced number of principal components (1 or 0) were performed. Significant SNPs were selected according to the Bonferroni threshold at 5%. Candidate genes associated with the significant SNPs and their putative function were searched with the pea genome browser (https://www.pulsedb.org/), investigating chromosomal regions corresponding to the chromosome-specific LD extent flanking the significant SNP.

4.6. Genomic Prediction

The SNP markers retained after SNP calling and filtering were employed to build GS models for the eight phenotypic traits. We compared two regression models, namely ridge-regression BLUP (rrBLUP) and Bayesian Lasso. The former model [77] assumes a linear mixed additive model in which each marker is assigned an effect as a solution of the following equation:
y = 1 µ + W q +   E
where y is the vector of observed phenotypes, µ is the mean of y, W is the genotype matrix (e.g., {0,1,2} for biallelic SNPs), q ∼ N (0, I σ q 2 ) is the vector of marker effects, and ε ∼ N (0, I σ e 2 ) is the vector of residuals. This model, which is solved in a restricted maximum likelihood (REML) context, assumes that the effects of all loci have a common variance, making it suitable for traits influenced by a large number of minor genes. According to a Bayesian context, Bayesian Lasso assigns different prior densities to marker effects, with a strong shrinkage for regression coefficients of marker effects with small values [78]. Predictive ability values were computed as Pearson’s correlation between the observed phenotypic values and the breeding values predicted by the regression model. We implemented a 10-fold cross-validation scheme repeated 50 times for numerical stability. Reported values are the resulting averages. All regressions and cross validations were implemented using the GROAN R package [79].

Supplementary Materials

The following supporting information can be downloaded at the website of this paper posted on Preprints.org, Table S1 Accession name, germplasm pool, area of origin, and material type (modern cultivars vs landrace/old cultivar) of a worldwide pea germplasm collection including 156 pea accessions. Table S2. Mean values and Tukey HSD-based mean comparison for traits with nutritional and health relevance observed in 156 pea accessions grouped into 19 landrace/old cultivar germplasm pools and one modern cultivar pool. Germplasm pools with different letter differ at P < 0.05. Table S3. Genetic coefficient of variation (CVg) for traits with nutritional and health relevance observed in 156 pea accessions grouped into 19 landrace/old cultivar germplasm pools and one modern cultivar pool. Table S4. List of genes potentially associated to the significant SNPs detected by GWAS models (BLINK and FarmCPU.) based on 10,249 SNPs and performed on 151 accessions for eight traits. Candidate genes were identified scanning chromosomal regions as far as the distance at which LD dropped below the threshold for LD decay flanking each significant SNP and are reported with their annotated function (https://www.pulsedb.org/). TPC = Total phenolic compounds; AA = Antioxidant activity. Table S5. Experimental LC-MS/MS data used for tentative identification of saponins in 156 pea (Pisum sativum) accessions from different germplasm pools. Figure S1. Cross-entropy criterion for increasing K values based on the SNPs data for a germplasm collection of 151 pea accessions. Figure S2. Linkage disequilibrium (LD) decay for each chromosome as squared correlations of allele frequencies (r2) between markers with a maximum distance of 100 Kbp. The X-axis shows the genomic distance in bp. The blue dotted line indicates the intersection between the LOESS curve (red) and the half of the average value at the minimal distance (dashed green line), highlighting the value of LD decay in base pairs (bp). Figure S3. Manhattan plots showing the association scores of 10,249 SNPs mapped in the seven pea chromosomes with eight phenotypic traits (TPC, AA, Ssβg, Ss1, sucrose, verbascose, raffinose and stachyose) characterized in 151 pea accessions (for which SNPs data were available). The green continuous line indicates the Bonferroni threshold of significance at 5%. The figure shows the results of GWAS conducted with the FarmCPU model. Figure S4. Population structure as PCA performed on the matrix of filtered and imputed SNPs for the 151 pea accessions.

Author Contributions

Conceptualization, S.Z., P.A.; methodology, S.Z., N.N, G.S., U.B., F.V. and P.A.; formal analysis, S.Z. and N.N.; investigation, S.Z., N.N., G.S., U.B., F.V. and A. P.; data curation, S.Z. and N.N.; writing—original draft preparation, S.Z., and P.A.; writing and editing, P.A, N.N, G.S., U.B., F.V., A.P. and A.K.H.; funding acquisition, S.Z., A.K.U., G.S., A.P. and P.A. All authors have read and agreed to the published version of the manuscript.

Funding

The phenotyping data were generated within the project FutureProteinCrops, funded by the Foundation for Research Levy on Agricultural Products (FFL), the Agricultural Agreement Research Fund (JA) in Norway, and industry partners (NFR project no. 326701), a grant from the Nansenfondet and Associated Funds, awarded through Statoils Forskningsfond, the research program “NorwegianFoods” financed by the Fund for Research Feed on Agricultural Products (NRF-3001720), the project “Agritech National Research Center” which received funding from the European Union Next-GenerationEU (Piano Nazionale di Ripresa e Resilienza (PNRR)—Missione 4 Componente 2, Investimento 1.4–D.D.103217/06/2022, CN00000022); the genotyping data were generated by the project “Plant Genetic Resources – FAO Treaty” granted by the Italian Ministry of Agricultural, Food and Forestry Policies.

Data Availability Statement

The phenotypic and genotypic data used in this work are available at: 10.6084/m9.figshare.30898559.

Acknowledgments

We are grateful to G. A. G. Sorheim, K. Grønnerud, and Ø. Jorgensen for the generation of plant material, B. Ferrari for DNA extraction of plants. Special thanks to C. Nivelle for the invaluable support in the greenhouse and field works.

Conflicts of Interest

The authors declare no conflicts of interest.

Abbreviations

The following abbreviations are used in this manuscript:
AA Antioxidant activity
ACN Acetonitrile
ANOVA Analysis of variance
BLUP Best linear unbiased prediction
rrBLUP Ridge regression best linear unbiased prediction
DPPH 1,1-diphenyl-2-picrylhydrazyl radical
FA Formic acid
FT-IR Fourier Transform Infrared Spectroscopy
FWHM Full width at half maximum
GAE Gallic acid equivalents.
GBS Genotyping-by-sequencing
(U) HPLC (Ultra) High Performance Liquid Chromatography
ISTD Internal standard
ITT Ion transfer tube
LD Linkage disequilibrium
MeOH Methanol
MS Mass spectrometry
MS2 Tandem mass spectrometry (fragmentation)
NaOH Sodium hydroxyde
PVDF Polyvinylidene fluoride
QC Quality control
RC Regenerated cellulose
SNP Single-nucleotide polymorphism
Ssβg Soyasaponin βg
Ss1 Soyasaponin I
TE 6-Hydroxy-2,5,7,8-tetramethylchroman-2-carboxylic acid (Trolox) Equivalents
TPC Total Phenolic content
AA Antioxidant activity
ANOVA Analysis of variance
BLUP Best linear unbiased prediction
rrBLUP Ridge regression best linear unbiased prediction
DPPH 1,1-diphenyl-2-picrylhydrazyl radical
FT-IR Fourier Transform Infrared Spectroscopy
GAE Gallic acid equivalents.
GBS Genotyping-by-sequencing
HPLC High Performance Liquid Chromatography
LD Linkage disequilibrium
SNP Single-nucleotide polymorphism
Ssβg Soyasaponin βg
Ss1 Soyasaponin I
TE 6-Hydroxy-2,5,7,8-tetramethylchroman-2-carboxylic acid (Trolox) equivalents
TPC Total Phenolic compounds

References

  1. Carrouée, B.; Crépon, K.; Peyronnet, C. Les protéagineux : intérêt dans les systèmes de production fourragers français et européens. 2003.
  2. Annicchiarico, P. Adaptation of Cool-Season Grain Legume Species across Climatically-Contrasting Environments of Southern Europe. Agron. J. 2008, 100, 1647–1654. [CrossRef]
  3. Jha, A.B.; Tar’an, B.; Diapari, M.; Warkentin, T.D. SNP Variation within Genes Associated with Amylose, Total Starch and Crude Protein Concentration in Field Pea. Euphytica 2015, 206, 459–471. [CrossRef]
  4. Annicchiarico, P.; Nazzicari, N.; Wei, Y.; Pecetti, L.; Brummer, E.C. Genotyping-by-Sequencing and Its Exploitation for Forage and Cool-Season Grain Legume Breeding. Front. Plant Sci. 2017, 8.
  5. Stagnari, F.; Maggio, A.; Galieni, A.; Pisante, M. Multiple Benefits of Legumes for Agriculture Sustainability: An Overview. Chem. Biol. Technol. Agric. 2017, 4, 2. [CrossRef]
  6. van Loon, M.P.; Alimagham, S.; Pronk, A.; Fodor, N.; Ion, V.; Kryvoshein, O.; Kryvobok, O.; Marrou, H.; Mihail, R.; Mínguez, M.I.; et al. Grain Legume Production in Europe for Food, Feed and Meat-Substitution. Glob. Food Secur. 2023, 39, 100723. [CrossRef]
  7. Visser, C.L.M. de; Schreuder, R.; Stoddard, F. The EU’s Dependency on Soya Bean Import for the Animal Feed Industry and Potential for EU Produced Alternatives. OCL 2014, 21, D407. [CrossRef]
  8. Prasad, S.; Gupta, E.; Yadav, S.; Babulal, K.S.; Mishra, S. Plant-Based Food Industry: Overview and Trends. In The Future of Plant Protein: Innovations, Challenges, and Opportunities; Younis, K., Yousuf, O., Eds.; Springer Nature: Singapore, 2025; pp. 73–97 ISBN 978-981-96-4190-1.
  9. Venter de Villiers, M.; Cheng, J.; Truter, L. The Shift Towards Plant-Based Lifestyles: Factors Driving Young Consumers’ Decisions to Choose Plant-Based Food Products. Sustainability 2024, 16, 9022. [CrossRef]
  10. Ali, A.; Bharali, P. The Rise of Plant-Based Meat Alternatives: Challenges and Perspectives. Food Biosci. 2025, 68, 106640. [CrossRef]
  11. Smýkal, P.; Kenicer, G.; Flavell, A.J.; Corander, J.; Kosterin, O.; Redden, R.J.; Ford, R.; Coyne, C.J.; Maxted, N.; Ambrose, M.J.; et al. Phylogeny, Phylogeography and Genetic Diversity of the Pisum Genus. Plant Genet. Resour. 2011, 9, 4–18. [CrossRef]
  12. Vaz Patto, M.C.; Amarowicz ,Ryszard; Aryee ,Alberta N. A.; Boye ,Joyce I.; Chung ,Hyun-Jung; Martín-Cabrejas ,Maria A.; and Domoney, C. Achievements and Challenges in Improving the Nutritional Quality of Food Legumes. Crit. Rev. Plant Sci. 2015, 34, 105–143. [CrossRef]
  13. Lara, S.W.; Ryan, P. The Current State of Peas in the United Kingdom; Diversity, Heritage and Food Systems. PLANTS PEOPLE PLANET 2025, 7, 1235–1244. [CrossRef]
  14. Annicchiarico, P.; Romani, M.; Cabassi, G.; Ferrari, B. Diversity in a Pea (Pisum Sativum) World Collection for Key Agronomic Traits in a Rain-Fed Environment of Southern Europe. Euphytica 2017, 213, 245. [CrossRef]
  15. Cheng, P.; Holdsworth, W.; Ma, Y.; Coyne, C.J.; Mazourek, M.; Grusak, M.A.; Fuchs, S.; McGee, R.J. Association Mapping of Agronomic and Quality Traits in USDA Pea Single-Plant Collection. Mol. Breed. 2015, 35, 75. [CrossRef]
  16. Elango, D.; Rajendran, K.; Van der Laan, L.; Sebastiar, S.; Raigne, J.; Thaiparambil, N.A.; El Haddad, N.; Raja, B.; Wang, W.; Ferela, A.; et al. Raffinose Family Oligosaccharides: Friend or Foe for Human and Plant Health? Front. Plant Sci. 2022, 13. [CrossRef]
  17. Price, K.R.; Johnson, I.T.; Fenwick, G.R.; Malinow, M.R. The Chemistry and Biological Significance of Saponins in Foods and Feedingstuffs. C R C Crit. Rev. Food Sci. Nutr. 1987, 26, 27–135. [CrossRef]
  18. Bljahhina, A.; Pismennõi, D.; Kriščiunaite, T.; Kuhtinskaja, M.; Kobrin, E.-G. Quantitative Analysis of Oat (Avena Sativa L.) and Pea (Pisum Sativum L.) Saponins in Plant-Based Food Products by Hydrophilic Interaction Liquid Chromatography Coupled with Mass Spectrometry. Foods 2023, 12, 991. [CrossRef]
  19. Heng, L.; Vincken, J.-P.; van Koningsveld, G.; Legger, A.; Gruppen, H.; van Boekel, T.; Roozen, J.; Voragen, F. Bitterness of Saponins and Their Content in Dry Peas. J. Sci. Food Agric. 2006, 86, 1225–1231. [CrossRef]
  20. Reim, V.; Rohn, S. Characterization of Saponins in Peas (Pisum Sativum L.) by HPTLC Coupled to Mass Spectrometry and a Hemolysis Assay. Food Res. Int. 2015, 76, 3–10. [CrossRef]
  21. Tanambell, H.; Bramsen, M.R.; Danielsen, M.; Nebel, C.; Møller, A.H.; Dalsgaard, T.K. Saponin and Hexanal in Pea (Pisum Sativum) Protein Isolates: A Comparative Study of Isoelectric Precipitation and Ultrafiltration. LWT 2025, 223, 117772. [CrossRef]
  22. Wink, M. Evolution of Secondary Metabolites in Legumes (Fabaceae). South Afr. J. Bot. 2013, 89, 164–175. [CrossRef]
  23. Oliete, B.; Lubbers, S.; Fournier, C.; Jeandroz, S.; Saurel, R. Effect of Biotic Stress on the Presence of Secondary Metabolites in Field Pea Grains. J. Sci. Food Agric. 2022, 102, 4942–4948. [CrossRef]
  24. Morita, M.; Shibuya, M.; Kushiro, T.; Masuda, K.; Ebizuka, Y. Molecular Cloning and Functional Expression of Triterpene Synthases from Pea (Pisum Sativum). Eur. J. Biochem. 2000, 267, 3453–3460. [CrossRef]
  25. Vernoud, V.; Lebeigle, L.; Munier, J.; Marais, J.; Sanchez, M.; Pertuit, D.; Rossin, N.; Darchy, B.; Aubert, G.; Le Signor, C.; et al. β-Amyrin Synthase1 Controls the Accumulation of the Major Saponins Present in Pea (Pisum Sativum). Plant Cell Physiol. 2021, 62, 784–797. [CrossRef]
  26. Hodgins, C.L.; Salama, E.M.; Kumar, R.; Zhao, Y.; Roth, S.A.; Cheung, I.Z.; Chen, J.; Arganosa, G.C.; Warkentin, T.D.; Bhowmik, P.; et al. Creating Saponin-Free Yellow Pea Seeds by CRISPR/Cas9-Enabled Mutagenesis on β-Amyrin Synthase. Plant Direct 2024, 8, e563. [CrossRef]
  27. Gawłowska, M.; Święcicki, W.; Lahuta, L.; Kaczmarek, Z. Raffinose Family Oligosaccharides in Seeds of Pisum Wild Taxa, Type Lines for Seed Genes, Domesticated and Advanced Breeding Materials. Genet. Resour. Crop Evol. 2017, 64, 569–578. [CrossRef]
  28. Peterbauer, T.; Lahuta, L.B.; Blöchl, A.; Mucha, J.; Jones, D.A.; Hedley, C.L.; Gòrecki, R.J.; Richter, A. Analysis of the Raffinose Family Oligosaccharide Pathway in Pea Seeds with Contrasting Carbohydrate Composition. Plant Physiol. 2001, 127, 1764–1772. [CrossRef]
  29. Role of Phenols and Polyphenols in Plant Defense Response to Biotic and Abiotic Stresses. In Biocontrol Agents and Secondary Metabolites; Woodhead Publishing, 2021; pp. 419–441.
  30. Elessawy, F.M.; Vandenberg, A.; El-Aneed, A.; Purves, R.W. An Untargeted Metabolomics Approach for Correlating Pulse Crop Seed Coat Polyphenol Profiles with Antioxidant Capacity and Iron Chelation Ability. Molecules 2021, 26, 3833. [CrossRef]
  31. He, F.; Pan, Q.-H.; Shi, Y.; Duan, C.-Q. Biosynthesis and Genetic Regulation of Proanthocyanidins in Plants. Molecules 2008, 13, 2674–2703. [CrossRef]
  32. Elessawy, F.M.; Bazghaleh, N.; Vandenberg, A.; Purves, R.W. Polyphenol Profile Comparisons of Seed Coats of Five Pulse Crops Using a Semi-Quantitative Liquid Chromatography-Mass Spectrometric Method. Phytochem. Anal. 2020, 31, 458–471. [CrossRef]
  33. Jha, A.B.; Purves, R.W.; Elessawy, F.M.; Zhang, H.; Vandenberg, A.; Warkentin, T.D. Polyphenolic Profile of Seed Components of White and Purple Flower Pea Lines. Crop Sci. 2019, 59, 2711–2719. [CrossRef]
  34. Hellens, R.P.; Moreau, C.; Lin-Wang, K.; Schwinn, K.E.; Thomson, S.J.; Fiers, M.W.E.J.; Frew, T.J.; Murray, S.R.; Hofer, J.M.I.; Jacobs, J.M.E.; et al. Identification of Mendel’s White Flower Character. PLOS ONE 2010, 5, e13230. [CrossRef]
  35. Krajewski, P.; Bocianowski, J.; Gawłowska, M.; Kaczmarek, Z.; Pniewski, T.; Święcicki, W.; Wolko, B. QTL for Yield Components and Protein Content: A Multienvironment Study of Two Pea (Pisum Sativum L.) Populations. Euphytica 2012, 183, 323–336. [CrossRef]
  36. Gali, K.K.; Liu, Y.; Sindhu, A.; Diapari, M.; Shunmugam, A.S.K.; Arganosa, G.; Daba, K.; Caron, C.; Lachagari, R.V.B.; Tar’an, B.; et al. Construction of High-Density Linkage Maps for Mapping Quantitative Trait Loci for Multiple Traits in Field Pea (Pisum Sativum L.). BMC Plant Biol. 2018, 18, 172. [CrossRef]
  37. Gali, K.K.; Sackville, A.; Tafesse, E.G.; Lachagari, V.B.R.; McPhee, K.; Hybl, M.; Mikić, A.; Smýkal, P.; McGee, R.; Burstin, J.; et al. Genome-Wide Association Mapping for Agronomic and Seed Quality Traits of Field Pea (Pisum Sativum L.). Front. Plant Sci. 2019, 10. [CrossRef]
  38. Crosta, M.; Nazzicari, N.; Ferrari, B.; Pecetti, L.; Russi, L.; Romani, M.; Cabassi, G.; Cavalli, D.; Marocco, A.; Annicchiarico, P. Pea Grain Protein Content Across Italian Environments: Genetic Relationship With Grain Yield, and Opportunities for Genome-Enabled Selection for Protein Yield. Front. Plant Sci. 2022, 12.
  39. Crosta, M.; Romani, M.; Nazzicari, N.; Ferrari, B.; Annicchiarico, P. Genomic Prediction and Allele Mining of Agronomic and Morphological Traits in Pea (Pisum Sativum) Germplasm Collections. Front. Plant Sci. 2023, 14, 1320506. [CrossRef]
  40. Zhou, J.; Gali, K.K.; Jha, A.B.; Tar’an, B.; Warkentin, T.D. Identification of Quantitative Trait Loci Associated with Seed Protein Concentration in a Pea Recombinant Inbred Line Population. Genes 2022, 13, 1531. [CrossRef]
  41. Zhou, J.; Wan, Z.; Gali, K.K.; Jha, A.B.; Nickerson, M.T.; House, J.D.; Tar’an, B.; Warkentin, T.D. Quantitative Trait Loci Associated with Amino Acid Concentration and in Vitro Protein Digestibility in Pea (Pisum Sativum L.). Front. Plant Sci. 2023, 14. [CrossRef]
  42. Meuwissen, T.H.E.; Hayes, B.J.; Goddard, M.E. Prediction of Total Genetic Value Using Genome-Wide Dense Marker Maps. Genetics 2001, 157, 1819–1829. [CrossRef]
  43. Crosta, M.; Nazzicari, N.; Pecetti, L.; Notario, T.; Romani, M.; Ferrari, B.; Cabassi, G.; Annicchiarico, P. Genomic Selection for Pea Grain Yield and Protein Content in Italian Environments for Target and Non-Target Genetic Bases. Int. J. Mol. Sci. 2025, 26, 2991. [CrossRef]
  44. Heffner, E.L.; Sorrells, M.E.; Jannink, J.-L. Genomic Selection for Crop Improvement. Crop Sci. 2009, 49, 1–12. [CrossRef]
  45. Han, X.; Akhov, L.; Ashe, P.; Lewis, C.; Deibert, L.; Irina Zaharia, L.; Forseille, L.; Xiang, D.; Datla, R.; Nosworthy, M.; et al. Comprehensive Compositional Assessment of Bioactive Compounds in Diverse Pea Accessions. Food Res. Int. 2023, 165, 112455. [CrossRef]
  46. Chen, S.-K.; Lin, H.-F.; Wang, X.; Yuan, Y.; Yin, J.-Y.; Song, X.-X. Comprehensive Analysis in the Nutritional Composition, Phenolic Species and in Vitro Antioxidant Activities of Different Pea Cultivars. Food Chem. X 2023, 17, 100599. [CrossRef]
  47. Vurro, F.; De Angelis, D.; Squeo, G.; Pavan, S.; Pasqualone, A.; Summo, C. Data on the Nutritional and Fatty Acid Composition, Bioactive Compounds, in Vitro Antioxidant Activity and Techno-Functional Properties of a Collection of Pea (Pisum Sativum L.). Data Brief 2025, 61, 111709. [CrossRef]
  48. Ma, Y.; Gao, J.; Wei, Z.; Shahidi, F. Effect of in Vitro Digestion on Phenolics and Antioxidant Activity of Red and Yellow Colored Pea Hulls. Food Chem. 2021, 337, 127606. [CrossRef]
  49. Kumar, Y.; Basu, S.; Goswami, D.; Devi, M.; Shivhare, U.S.; Vishwakarma, R.K. Anti-Nutritional Compounds in Pulses: Implications and Alleviation Methods. Legume Sci. 2022, 4, e111. [CrossRef]
  50. Wang, X.; Qi, Y.; Zheng, H. Dietary Polyphenol, Gut Microbiota, and Health Benefits. Antioxidants 2022, 11, 1212. [CrossRef]
  51. Zeb, A. Concept, Mechanism, and Applications of Phenolic Antioxidants in Foods. J. Food Biochem. 2020, 44, e13394. [CrossRef]
  52. Rashmi, H.B.; Negi, P.S. Phytochemical Constituents and Anthelmintic Potential of Surinam Cherry (Eugenia Uniflora L.) at Different Fruit Developmental Stages. South Afr. J. Bot. 2022, 145, 512–521. [CrossRef]
  53. Pasqualone, A.; Delvecchio, L.N.; Mangini, G.; Taranto, F.; Blanco, A. Variability of Total Soluble Phenolic Compounds and Antioxidant Activity in a Collection of Tetraploid Wheat. Agric. Food Sci. 2014, 23, 307–316. [CrossRef]
  54. Mohammadi, S.; Purves, R.W.; Paliocha, M.; Uhlen, A.K.; Zanotto, S. Multi-Environment Field Trials Indicate Strong Genetic Control of Seed Polyphenol Accumulation in Faba Bean. Euphytica 2025, 221, 47. [CrossRef]
  55. Vidal-Valverde, C.; Frias, J.; Hernández, A.; Martín-Alvarez, P.J.; Sierra, I.; Rodríguez, C.; Blazquez, I.; Vicente, G. Assessment of Nutritional Compounds and Antinutritional Factors in Pea (Pisum Sativum) Seeds. J. Sci. Food Agric. 2003, 83, 298–306. [CrossRef]
  56. Baud, S.; Guyon, V.; Kronenberger, J.; Wuillème, S.; Miquel, M.; Caboche, M.; Lepiniec, L.; Rochat, C. Multifunctional Acetyl-CoA Carboxylase 1 Is Essential for Very Long Chain Fatty Acid Elongation and Embryo Development in Arabidopsis. Plant J. Cell Mol. Biol. 2003, 33, 75–86. [CrossRef]
  57. Molendijk, A.J.; Ruperti, B.; Singh, M.K.; Dovzhenko, A.; Ditengou, F.A.; Milia, M.; Westphal, L.; Rosahl, S.; Soellick, T.-R.; Uhrig, J.; et al. A Cysteine-Rich Receptor-like Kinase NCRK and a Pathogen-Induced Protein Kinase RBK1 Are Rop GTPase Interactors. Plant J. Cell Mol. Biol. 2008, 53, 909–923. [CrossRef]
  58. Wu, C.; Feng, J.; Wang, R.; Liu, H.; Yang, H.; Rodriguez, P.L.; Qin, H.; Liu, X.; Wang, D. HRS1 Acts as a Negative Regulator of Abscisic Acid Signaling to Promote Timely Germination of Arabidopsis Seeds. PloS One 2012, 7, e35764. [CrossRef]
  59. Gangl, R.; Tenhaken, R. Raffinose Family Oligosaccharides Act As Galactose Stores in Seeds and Are Required for Rapid Germination of Arabidopsis in the Dark. Front. Plant Sci. 2016, 7. [CrossRef]
  60. Li, T.; Zhang, Y.; Wang, D.; Liu, Y.; Dirk, L.M.A.; Goodman, J.; Downie, A.B.; Wang, J.; Wang, G.; Zhao, T. Regulation of Seed Vigor by Manipulation of Raffinose Family Oligosaccharides in Maize and Arabidopsis Thaliana. Mol. Plant 2017, 10, 1540–1555. [CrossRef]
  61. Wang, X.; Xu, Y.; Hu, Z.; Xu, C. Genomic Selection Methods for Crop Improvement: Current Status and Prospects. Crop J. 2018, 6, 330–340. [CrossRef]
  62. Klein, A.; Houtin, H.; Rond-Coissieux, C.; Naudet-Huart, M.; Touratier, M.; Marget, P.; Burstin, J. Meta-Analysis of QTL Reveals the Genetic Control of Yield-Related Traits and Seed Protein Content in Pea. Sci. Rep. 2020, 10, 15925. [CrossRef]
  63. Franguelli, N.; Cavalli, D.; Nazzicari, N.; Pecetti, L.; Notario, T.; Annicchiarico, P. Genetic Variation and Genome-Enabled Prediction of White Lupin Frost Resistance in Different Reference Populations. Int. J. Mol. Sci. 2025, 26, 10224. [CrossRef]
  64. Osuna-Caballero, S.; Rubiales, D.; Annicchiarico, P.; Nazzicari, N.; Rispail, N. Genomic Prediction for Rust Resistance in Pea. Front. Plant Sci. 2024, 15. [CrossRef]
  65. Vurro, F.; Anelli, P.; Zocchi, D.M.; De Bellis, P.; Pieroni, A.; Pasqualone, A. Bessarabian Wild Hop Sourdough: Microbial Characterization and Effect on the Physicochemical Properties and Flavor of the Bread. Int. J. Gastron. Food Sci. 2025, 42, 101377. [CrossRef]
  66. Marcotuli, I.; Vurro, F.; Mores, A.; Pasqualone, A.; Colasuonno, P.; Cabas-Lühmann, P.; Schwember, A.R.; Gadaleta, A. Genetic Study of Total Phenolic Content and Antioxidant Activity Traits in Tetraploid Wheat via Genome-Wide Association Mapping. Antioxidants 2025, 14, 1048. [CrossRef]
  67. Bates, D.; Maechler, M.; Bolker, B.; Walker, S. Lme4: Linear Mixed-Effects Models Using “Eigen” and S4 2003, 1.1-38.
  68. Lê, S.; Josse, J.; Husson, F. FactoMineR : An R Package for Multivariate Analysis. J. Stat. Softw. 2008, 25. [CrossRef]
  69. Maechler, M.; Rousseeuw, P.; Struyf, A.; Hubert, M. Cluster: “Finding Groups in Data”: Cluster Analysis Extended Rousseeuw et Al. 1999, 2.1.8.1.
  70. Gu, Z.; Hübschmann, D. Make Interactive Complex Heatmaps in R. Bioinformatics 2022, 38, 1460–1462. [CrossRef]
  71. Pavan, S.; Delvento, C.; Nazzicari, N.; Ferrari, B.; D’Agostino, N.; Taranto, F.; Lotti, C.; Ricciardi, L.; Annicchiarico, P. Merging Genotyping-by-Sequencing Data from Two Ex Situ Collections Provides Insights on the Pea Evolutionary History. Hortic. Res. 2022, 9, uhab062. [CrossRef]
  72. Nazzicari, N.; Franguelli, N.; Ferrari, B.; Pecetti, L.; Annicchiarico, P. The Effect of Genome Parametrization and SNP Marker Subsetting on Genomic Selection in Autotetraploid Alfalfa. Genes 2024, 15, 449. [CrossRef]
  73. Kreplak, J.; Madoui, M.-A.; Cápal, P.; Novák, P.; Labadie, K.; Aubert, G.; Bayer, P.E.; Gali, K.K.; Syme, R.A.; Main, D.; et al. A Reference Genome for Pea Provides Insight into Legume Genome Evolution. Nat. Genet. 2019, 51, 1411–1422. [CrossRef]
  74. Gutierrez, N.; Pégard, M.; Solis, I.; Sokolovic, D.; Lloyd, D.; Howarth, C.; Torres, A.M. Genome-Wide Association Study for Yield-Related Traits in Faba Bean (Vicia Faba L.). Front. Plant Sci. 2024, 15. [CrossRef]
  75. Frichot, E.; François, O. LEA: An R Package for Landscape and Ecological Association Studies. Methods Ecol. Evol. 2015, 6, 925–929. [CrossRef]
  76. Wang, J.; Zhang, Z. GAPIT Version 3: Boosting Power and Accuracy for Genomic Association and Prediction. Genomics Proteomics Bioinformatics 2021, 19, 629–640. [CrossRef]
  77. Endelman, J.B. Ridge Regression and Other Kernels for Genomic Selection with R Package rrBLUP. Plant Genome 2011, 4. [CrossRef]
  78. Park, T.; Casella, G. The Bayesian Lasso. J. Am. Stat. Assoc. 2008, 103, 681–686. [CrossRef]
  79. Nazzicari, N.; Biscarini, F. Stacked Kinship CNN vs. GBLUP for Genomic Predictions of Additive and Complex Continuous Phenotypes. Sci. Rep. 2022, 12, 19889. [CrossRef]
Figure 1. Principal components analysis for traits with nutritional and health relevance observed in 156 pea accessions grouped into 19 landrace/old cultivar germplasm pools and one modern cultivar pool. TPC = Total Phenolic Compounds; AA = antioxidant activity.
Preprints 190921 g001
Figure 2. Hierarchical clustering based on the scaled and centered matrix of the content of traits with nutritional and health relevance observed in 156 pea accessions previously grouped into 19 landrace/old cultivar germplasm pools and one modern cultivar pool. TPC = Total Phenolic Compounds; AA = antioxidant activity.
Preprints 190921 g002
Figure 3. Results of a population structure analysis with Q = 11 performed on 10,249 SNP markers for 151 pea accessions. Each color represents a specific number of genotype groups (Q). Results are displayed for 20 germplasm pools (19 regional pools and 1 comprehending modern cultivars).
Preprints 190921 g003
Figure 4. Manhattan plots showing the association scores of 10,249 SNP markers mapped in the seven pea chromosomes with traits with nutritional and health relevance observed in 151 pea accessions. The green continuous line indicates the Bonferroni threshold of significance at 5%. The figure shows the results of GWAS conducted with the BLINK model. TPC = Total Phenolic Content; AA = antioxidant activity AA = antioxidant activity.
Preprints 190921 g004
Figure 5. Predictive ability (as correlation between predicted and observed values) and its 95% confidence intervals for genomic prediction of traits with nutritional and health relevance observed in 151 pea accessions according to two statistical models based on 10,249 SNP markers. Predictions based on a 10-fold cross-validation scheme repeated 50 times. TPC = Total Phenolic Compounds; AA = antioxidant activity.
Preprints 190921 g005
Table 1. Mean and range values, and analysis of variance (ANOVA) F value for mean comparison, for the seed content of secondary metabolites with nutritional and health relevance observed in 156 pea accessions grouped into 19 landrace/old cultivar germplasm pools and one modern cultivar pool. GAE = Gallic acid equivalents; TE = 6-Hydroxy-2,5,7,8-tetramethylchroman-2-carboxylic acid (Trolox) equivalents.
Germplasm pool Total phenolic compounds (mg GAE/g) Antioxidant activity (µmol TE/g) Ssβg saponin µg/g Ss1 saponin µg/g Sucrose mg/g Raffinose mg/g Stachyose mg/g Verbascose mg/g
Afghanistan 0.80 (0.55-1.00) 1.35 (0.43-2.34) 500.14 (240.39-712.70) 21.40 (10.86-34.10) 6.36 (4.44-8.79) 2.16 (1.49-2.77) 6.44 (5.34-7.87) 6.73 (3.72-9.86)
Central Asia 0.65 (0.52-0.72) 0.83 (0.53-1.29) 466.33 (263.76-754.24) 21.62 (16.17-29.40) 5.87 (4.32-10.02) 2.35 (1.77-3.47) 6.79 (5.93-8.85) 8.54 (6.24-10.42)
China 0.65 (0.57-0.74) 1.17 (0.85-1.37) 571.29 (382.44-718.51) 27.13 (14.31-41.41) 8.08 (4.71-10.49) 2.66 (2.00-3.34) 6.84 (5.99-8.91) 7.70 (4.59-9.78)
East Balkans 0.54 (0.35-0.72) 0.62 (0.16-1.13) 546.45 (307.77-749.58) 32.29 (13.15-53.82) 5.80 (4.09-8.85) 2.47 (1.52-3.61) 6.89 (4.89-8.97) 9.13 (6.75-12.57)
Ethiopia 0.74 (0.48-0.83) 1.37 (0.85-2.14) 584.16 (273.64-961.84) 26.89 (11.16-36.96) 5.32 (2.38-7.99) 2.17 (1.60-2.64) 6.08 (5.02-7.09) 8.29 (6.10-10.19)
France 0.69 (0.49-0.84) 1.27 (0.70-1.60) 331.71 (212.75-553.76) 18.71 (10.44-31.08) 6.35 (3.75-11.71) 2.66 (1.88-4.22) 6.31 (5.41-7.88) 7.45 (5.46-10.59)
Georgia 0.70 (0.56-0.85) 1.18 (0.55-1.93) 381.46 (154.07-624.52) 19.05 (9.40-30.31) 5.92 (2.57-8.38) 2.17 (1.47-2.82) 6.33 (4.94-7.67) 7.04 (3.55-9.99)
Germany 0.62 (0.60-0.65) 0.60 (0.49-0.71) 696.49 (690.52-702.45) 36.11 (34.29-37.93) 5.70 (4.91-6.49) 2.85 (2.72-2.99) 6.62 (6.49-6.76) 9.15 (8.56-9.73)
Greece 0.75 (0.53-1.07) 1.37 (0.86-2.10) 501.21 (155.63-801.31) 23.37 (6.56-35.96) 6.29 (3.79-10.72) 2.55 (1.77-3.85) 6.79 (5.94-8.32) 7.48 (2.79-10.70)
India 0.68 (0.46-0.83) 1.03 (0.34-2.14) 503.40 (290.07-677.81) 26.30 (12.37-49.00) 5.59 (4.09-8.76) 2.29 (1.86-3.01) 6.72 (5.75-7.43) 8.42 (6.34-10.69)
Italy 0.67 (0.57-0.80) 0.93 (0.69-1.16) 373.08 (124.09-741.41) 22.59 (9.59-34.47) 5.19 (2.94-9.10) 2.91 (1.87-4.12) 7.56 (5.87-10.53) 9.70 (6.18-12.82)
Nepal 0.59 (0.43-0.90) 0.79 (0.38-1.83) 512.76 (340.36-919.02) 27.65 (19.61-43.62) 4.98 (4.09-7.66) 2.37 (1.80-3.23) 6.88 (5.24-8.06) 9.26 (8.02-10.12)
North Africa 0.72 (0.59-0.81) 1.36 (0.88-1.74) 440.92 (404.28-476.63) 29.94 (20.49-42.84) 5.06 (4.22-5.78) 2.06 (1.76-2.22) 6.52 (5.59-7.30) 7.65 (7.52-7.73)
Russia 0.62 (0.50-0.70) 0.71 (0.61-0.87) 484.80 (370.24-564.36) 29.78 (23.36-37.18) 5.51 (4.14-6.13) 2.33 (2.02-2.55) 6.18 (5.32-6.92) 8.00 (6.74-10.60)
Spain 0.66 (0.48-0.76) 0.94 (0.42-1.98) 531.94 (43.86-768.24) 28.05 (1.97-44.66) 6.04 (2.48-10.08) 2.79 (1.85-3.62) 7.07 (5.34-9.56) 10.00 (8.57-14.16)
Turkey 0.67 (0.52-0.83) 1.30 (0.71-2.03) 436.67 (101.36-819.71) 20.99 (6.69-41.93) 7.20 (4.93-11.27) 2.33 (1.84-3.41) 6.14 (4.77-7.41) 7.06 (1.47-10.78)
UK 0.58 (0.49-0.71) 0.73 (0.16-1.56) 658.75 (284.57-1007.77) 47.31 (27.90-83.16) 5.97 (3.79-9.45) 2.75 (2.01-3.81) 7.99 (5.10-10.32) 11.74 (6.28-16.53)
Ukraine 0.68 (0.57-0.98) 0.63 (0.34-1.42) 532.82 (358.13-754.10) 26.85 (13.95-40.49) 4.33 (2.98-6.13) 2.07 (1.51-2.56) 6.19 (5.57-7.51) 8.02 (6.23-10.07)
Modern cultivars 0.57 (0.42-0.79) 0.83 (0.44-1.67) 483.32 (367.77-579.40) 26.97 (18.20-40.45) 5.04 (3.43-6.05) 2.25 (1.97-2.52) 6.55 (6.31-7.03) 9.53 (8.19-10.31)
ANOVA 3.04** 4.75** 1.66* 3.45** 1.72* 2.22** 1.91* 3.40**
Table 2. Pearson correlation coefficients for secondary metabolites with nutritional and health relevance observed in 156 pea accessions. TPC = Total Phenolic Compounds; AA = antioxidant activity.
TPC AA Ssβg Ss1 Sucrose Verbascose Raffinose
AA 0.63**
Ssβg -0.08 -0.27**
Ss1 -0.17* -0.34** 0.80**
Sucrose 0.11 0.13 0.08 0.06
Verbascose -0.25** -0.45** 0.47** 0.58** 0.16
Raffinose 0.05 0.03 0.12 0.23** 0.55** 0.39**
Stachyose 0.07 -0.11 0.27** 0.39** 0.41** 0.64** 0.72**
*, ** significance at the 0.05 and 0.01 p levels, respectively.
Disclaimer/Publisher’s Note: The statements, opinions and data contained in all publications are solely those of the individual author(s) and contributor(s) and not of MDPI and/or the editor(s). MDPI and/or the editor(s) disclaim responsibility for any injury to people or property resulting from any ideas, methods, instructions or products referred to in the content.
Copyright: This open access article is published under a Creative Commons CC BY 4.0 license, which permit the free download, distribution, and reuse, provided that the author and preprint are cited in any reuse.
Prerpints.org logo

Preprints.org is a free preprint server supported by MDPI in Basel, Switzerland.

Subscribe

Disclaimer

Terms of Use

Privacy Policy

Privacy Settings

© 2026 MDPI (Basel, Switzerland) unless otherwise stated