
Submitted:
22 December 2025
Posted:
23 December 2025
You are already at the latest version
Abstract
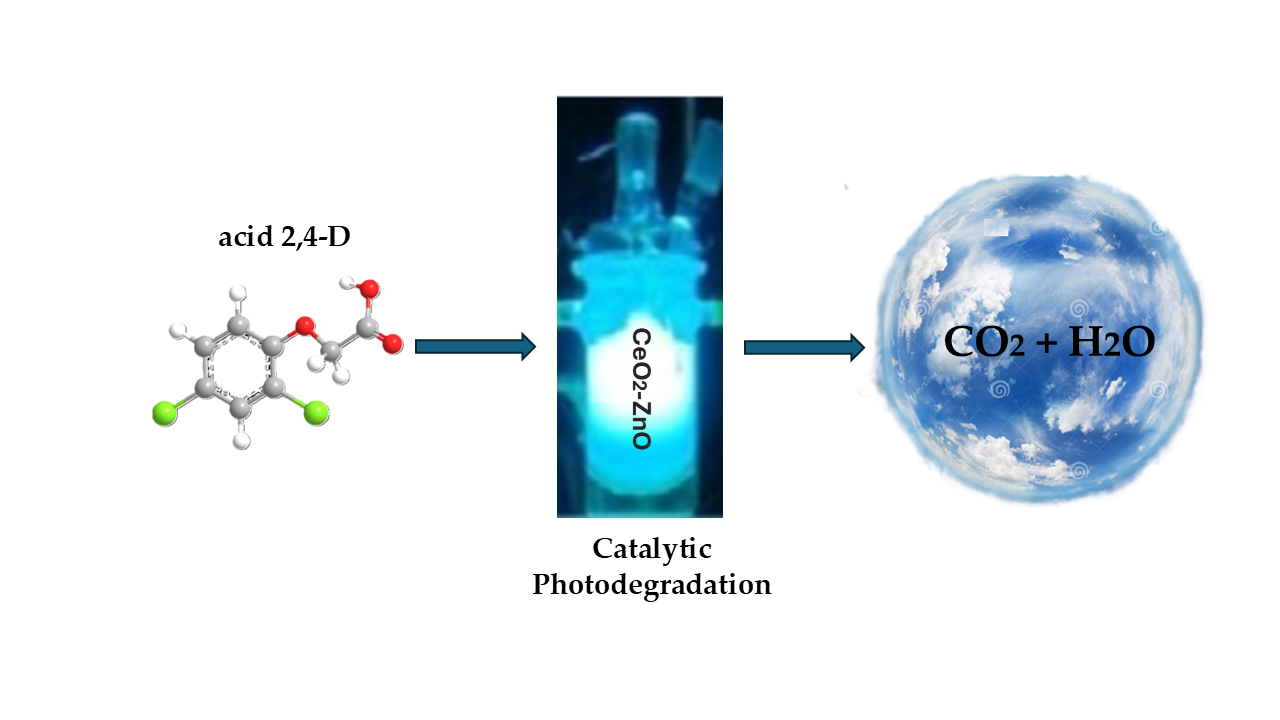
CeO₂–ZnO materials were synthesized via a modified sol–gel method, varying the ZnO loading to evaluate its effect on the photocatalytic degradation of 2,4-dichlorophenoxyacetic acid (2,4-D) under UV irradiation. XRD analysis confirmed the cubic fluorite structure of CeO₂ and, at higher loadings, the coexistence with a hexagonal wurtzite phase. At low loadings, Zn²⁺ incorporation into the CeO₂ lattice was evidenced, leading to lattice parameter contraction and the generation of oxygen vacancies. BET and SEM analyses indicated that an intermediate ZnO content (CZ1.5) increased the surface area (~41%) without collapsing the mesoporosity. XPS revealed Ce³⁺ species, defects, and Zn–O–Ce bonds, consistent with the formation of an S-scheme heterojunction. UV–Vis spectra showed similar Eg values (~3.13 eV) across the series, indicating that the photocatalytic enhancement is driven by structural and interfacial effects rather than optical changes. The CZ1.5 catalyst achieved ≈80% degradation and 74% mineralization (TOC), approximately twice that of pure CeO₂, attributed to efficient charge separation and the generation of reactive species O₂•⁻ and •OH. Furthermore, a temperature treatment CZ1.5 calcined to 400°C was the most active above the material treated at 300 and 500 °C.
Keywords:
CeO₂–ZnO
; 2
; 4-dichlorophenoxyacetic acid
; photodegradation
; S-scheme
; temperature treatment
1. Introduction
Today everyone knows that water scarcity is one of the main problems facing humanity, since the amount of fresh water available is only a small percentage, about 3% of the total, and despite this situation, little effort has been made to treat of reusing wastewater, since as reported by UNESCO, which states that around 80% of the municipal and industrial wastewater discharged worldwide returns to the ecosystem without being treated or reused, stressing in their report that wastewater is really a resource wasted [1]. Due to this problem, at present the scientific community has focused its efforts on the study and improvement of existing methods for the treatment of wastewater to try to remedy the situation, because, in addition to the shortage of drinking water there is another problem that damages not only humanity but also all living beings (including flora and fauna). When the different industries discharge their wastewater into rivers, soils and lagoons without any treatment, different chemical molecules reach populations causing great damage to the health of ecosystems, due to their toxicity, which can produce different symptoms ranging from simple headaches to death when these molecules are in large concentrations. These chemicals compounds are wastes from industries, among which are the petrochemical, pharmaceutical, food, textile and agricultural industries, among others [2]. It is the latter that takes on great relevance since some of the substances that are released into crops are very toxic and are not capable of degrading naturally, among these we can mention 2,4-Dichlorophenoxyacetic acid, which is an herbicide used worldwide since 1946 and classified by the Environmental Protection Agency as a group B carcinogen and a mutagenic agent [3]. There are several methods that are used for wastewater treatment, among which are adsorption, ultrafiltration and coagulation, among others, however, these methods are not capable of destroying this type of molecule, and some generate toxic by-products [4], however today the Advanced oxidation processes represent promising options, as encouraging results have been obtained. Photocatalysis is one of the most widely used processes, since it has shown high efficiency by being able to mineralize a wide range of toxic molecules to environmental conditions to CO2 and H2O by generating hydroxyl radicals (OH). This is a very powerful oxidizing species that can react with most organic pollutants, until it is completely mineralized [3,4,5,6,7,8,9,10,11,12,13,14,15,16,17,18,19,20,21,22,23,24,25,26,27,28,29,30,31,32,33,34,35,36,37,38,39]. The generation of • OH is promoted by the generation of an electron-hole pair, which is formed on the surface of a material that is mostly semiconductor, when irradiated with light of certain energy. TiO2, ZnO and CdS are generally the most widely used semiconductors in this type of reaction due to their photo-oxidizing power, chemical stability, non-toxicity and low cost [5,6]. Nevertheless, the rapid recombination of the electron-hole pair reduces photocatalytic activity. On the other hand, CeO2 is a semiconductor according to its physical and chemical properties, has had great advantages for photocatalysis, this is mainly attributed to its high oxygen storage capacity and high oxide capacity. reducing, high resistance to chemical corrosion and non-toxicity [3,7]. Nowadays, different methods of synthesis of semiconductor materials have been studied to try to improve the activity of these materials, among which we can mention sol-gel, solvothermal, precipitation, electro deposition, electro spinning, chemical vapor deposition, hydrothermal synthesis, sol-gel method and the precipitation technique [3] among others. In this work we focus on the study of CeO2-ZnO materials in the photocatalytic degradation of 2,4-dichlorophenoxyacetic acid.
2. Results
2.1. X-Ray Diffraction
In Figure 1 shows the diffraction patterns for the bare CZ0, CZ0.5, CZ1.5 and CZ2.5, the diffraction pattern of pure CeO2 (CZO) shows well-defined peaks at 2θ ≈ 28.66°, 33.1°, 47.5°, 56.3°, 59.1°, 69.4°, 76.7°, and 79.1°, corresponding to the (111), (200), (220), (311), (222), (400), (331), and (420) planes, respectively, characteristic of the cubic fluorite structure of CeO2 (JCPDS file No. 65-5923), [39]. The high intensity and narrow width of the peaks indicate high crystallinity. A clear right-shift of the (111) peak is observed for the CZ0.5 sample (2θ = 28.90°) compared to CZO (2θ = 28.66°), as shown in the enlarged inset of Figure 1. The calculated lattice parameter decreases from 5.3906 Å for CZO to 5.3467 Å for CZ0.5, representing a contraction of approximately 0.81%. This contraction is attributed to the partial substitution of Zn2+ ions (0.74 Å, CN=6) for Ce4+ (0.97 Å, CN=8) in the fluorite lattice, which generates oxygen vacancies for charge compensation and induces microstrain. This behavior is consistent with previous reports on Zn-doped CeO2 systems, where peak shifts have been attributed to lattice contraction caused by the incorporation of smaller cations [Tulsi mediated green synthesis of zinc doped CeO2 for super capacitor and display applications]. For the CZ1.5 and CZ2.5 samples, the lattice parameter remains practically identical to that of CZO, indicating minimal Zn2+ incorporation into the CeO2 lattice at higher loadings. In contrast, these samples show additional reflections at 2θ ≈ 31.7°, 34.4°, and 36.2°, corresponding to the (100), (002), and (101) planes of the hexagonal wurtzite ZnO phase (JCPDS No. 36-1451), see Figure 1. The appearance of these peaks confirms ZnO segregation at high ZnO contents. Consequently, at low Zn loadings, Zn2+ is incorporated into the fluorite lattice, leading to a measurable contraction of the lattice parameter, whereas at higher loadings, ZnO crystallite segregation occurs, reducing the peak shift. These structural results are consistent with SEM/EDX analyses, which show an increase in Zn content with loading, and with BET data, where variations in surface area can be related to changes in particle stacking and the appearance of ZnO phases.
2.2. Nitrogen Physisorption
All samples exhibit type IV isotherms according to the IUPAC classification, characteristic of mesoporous materials with pore sizes in the 2–50 nm range, see Figure 2. The incorporation of ZnO at 0.5, 1.5, and 2.5 wt% does not significantly modify the overall isotherm shape, indicating that the mesoporous nature of the CeO2 matrix is preserved throughout the series. Regarding the hysteresis loop, all samples display an H3-type loop, commonly associated with slit-shaped pores. However, slight variations are observed: for CZ0.5, the slope of the adsorption branch in the high relative pressure region (P/P0 > 0.8) is slightly steeper, suggesting a subtle increase in capillary condensation. In CZ1.5, this curvature becomes more pronounced, indicating greater mesopore accessibility. For CZ2.5, the behavior is very similar to CZ1.5, with only minor changes in slope and in the closure point of the loop. Although H3-type hysteresis is typically attributed to the stacking of plate-like particles, SEM images reveal semi-spherical particles without visible intraparticle porosity. This indicates that mesoporosity arises mainly from interparticle voids generated during particle packing, which behave as slit-like pores for N2 adsorption.
Regarding the surface area calculated by the Brunauer–Emmett–Teller method, the values are reported in Table 1. Compared to pure CeO2, the BET surface area increased by approximately 3.5% for CZ0.5, reached a maximum enhancement of about 41% for CZ1.5, and decreased to ~15.5% for CZ2.5. This trend indicates that moderate ZnO incorporation optimizes the specific surface area, while excessive loading may lead to partial blockage. These changes are consistent with SEM observations, where variations in particle stacking are more evident at intermediate ZnO contents. With respect to pore volume and pore size obtained by the BJH method, the values are presented in Table 1. The total pore volume remained in the range of 11–14 cm3 g−1, with a maximum increase of approximately 27% for CZ0.5 compared to pure CeO2, indicating that ZnO incorporation does not significantly modify the total porosity. On the other hand, the average pore size showed a progressive decrease from 5.2 nm (CeO2) to 4.1 nm (CZ2.5), representing a reduction of about 21%. This decrease indicates that at higher ZnO contents, the interparticle voids tend to become smaller due to changes in particle stacking, an effect also observed in the SEM analysis.
As to determination of the specific area by nitrogen adsorption desorption in the Table 1 an typical isotherm type III its show by all catalysts further the absence of hysteresis is also observed due to size of pores which are in range of 2 to 6 nm, also an increase in the values surface area its observed as ZnO is increases, being the CZ1.5 catalyst the material with the largest specific area however an decrease its observed in the CZ2.5 material, it can be due to the particles of ZnO cover the surface of CeO2 clogging the pores, also the crystal size is similar for the catalysts. By other sizes, values of similar band gap are observed by materials with ZnO, further a decrease in the value is observed with increase of load of ZnO, this behavior gives us the idea of the interaction between the two materials since less energy is required for the formation of the electro-hole pair.
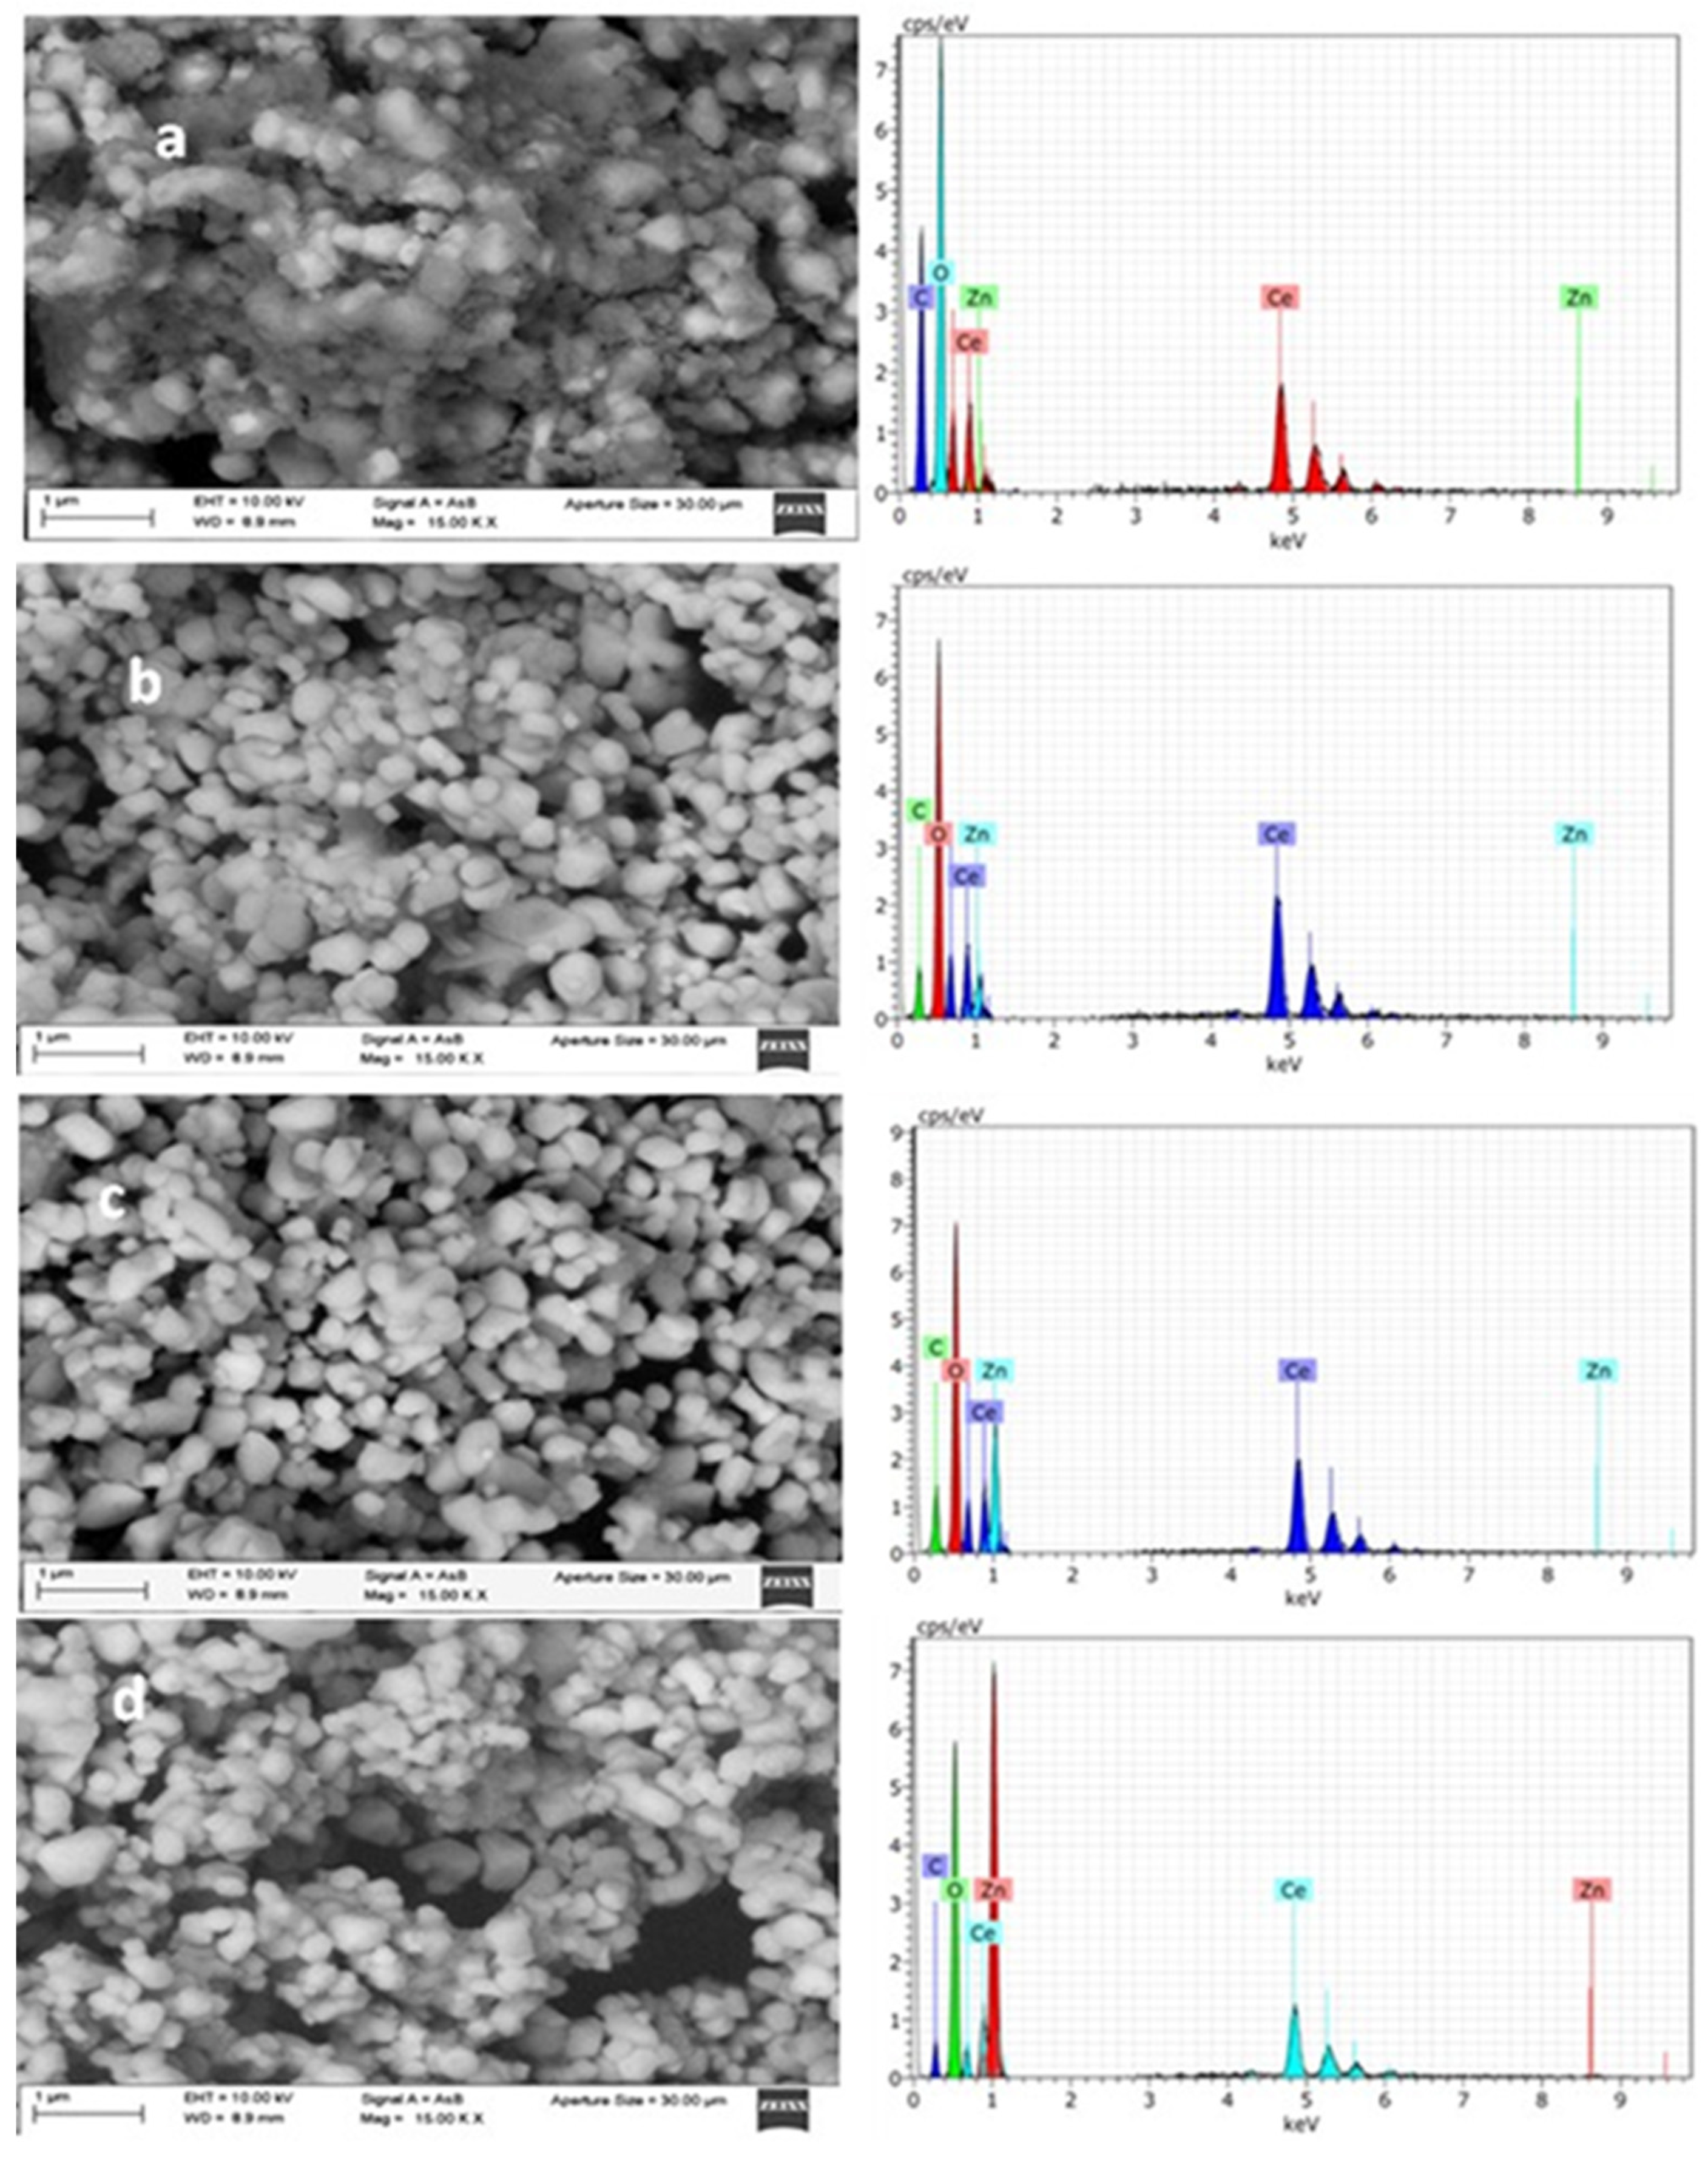
2.3. Scanning Electron Microscopy
SEM images of the CeO2 sample (CZ0, Figure 3a) show aggregates of semi-spherical nanoparticles with sizes in the range of ~50–150 nm, forming densely stacked particle clusters. The surface appears relatively homogeneous, without visible intraparticle porosity, suggesting that the mesoporosity detected by N2 physisorption originates mainly from voids between stacked particles.
The corresponding EDX spectrum (Figure 3a) confirms the presence of Ce and O as the main elements, with no detectable Zn signal, as expected for the reference material. For the CZO0.5 sample (Figure 3b), the morphology remains like pure CeO2, with semi-spherical particles forming compact stacks. A slight tendency towards tighter particle stacking is observed, which could reduce the size of some interparticle voids. The EDX analysis reveals Zn peaks of low intensity, consistent with the nominal 0.5 wt% ZnO loading. In the CZO1.5 sample (Figure 3c), the particles maintain a semi-spherical shape but appear more uniform in size distribution, and the stacking seems less compact in certain regions, creating slightly larger interparticle voids. The EDX spectrum shows a higher Zn signal compared to CZ0.5, confirming the increased ZnO content. The CZ2.5 sample (Figure 3d) exhibits clusters of semi-spherical nanoparticles with a more irregular stacking arrangement, where some regions show open voids between aggregates. This loose stacking could facilitate the accessibility of mesopores formed between particles. The EDX spectrum displays the most intense Zn peaks among the series, in line with the highest nominal ZnO loading. ZnO incorporation does not significantly alter the particle shape but slightly influences particle stacking and the size of the voids between them. EDX analysis corroborates the expected chemical composition, with Zn signal intensity increasing proportionally to the nominal loading.
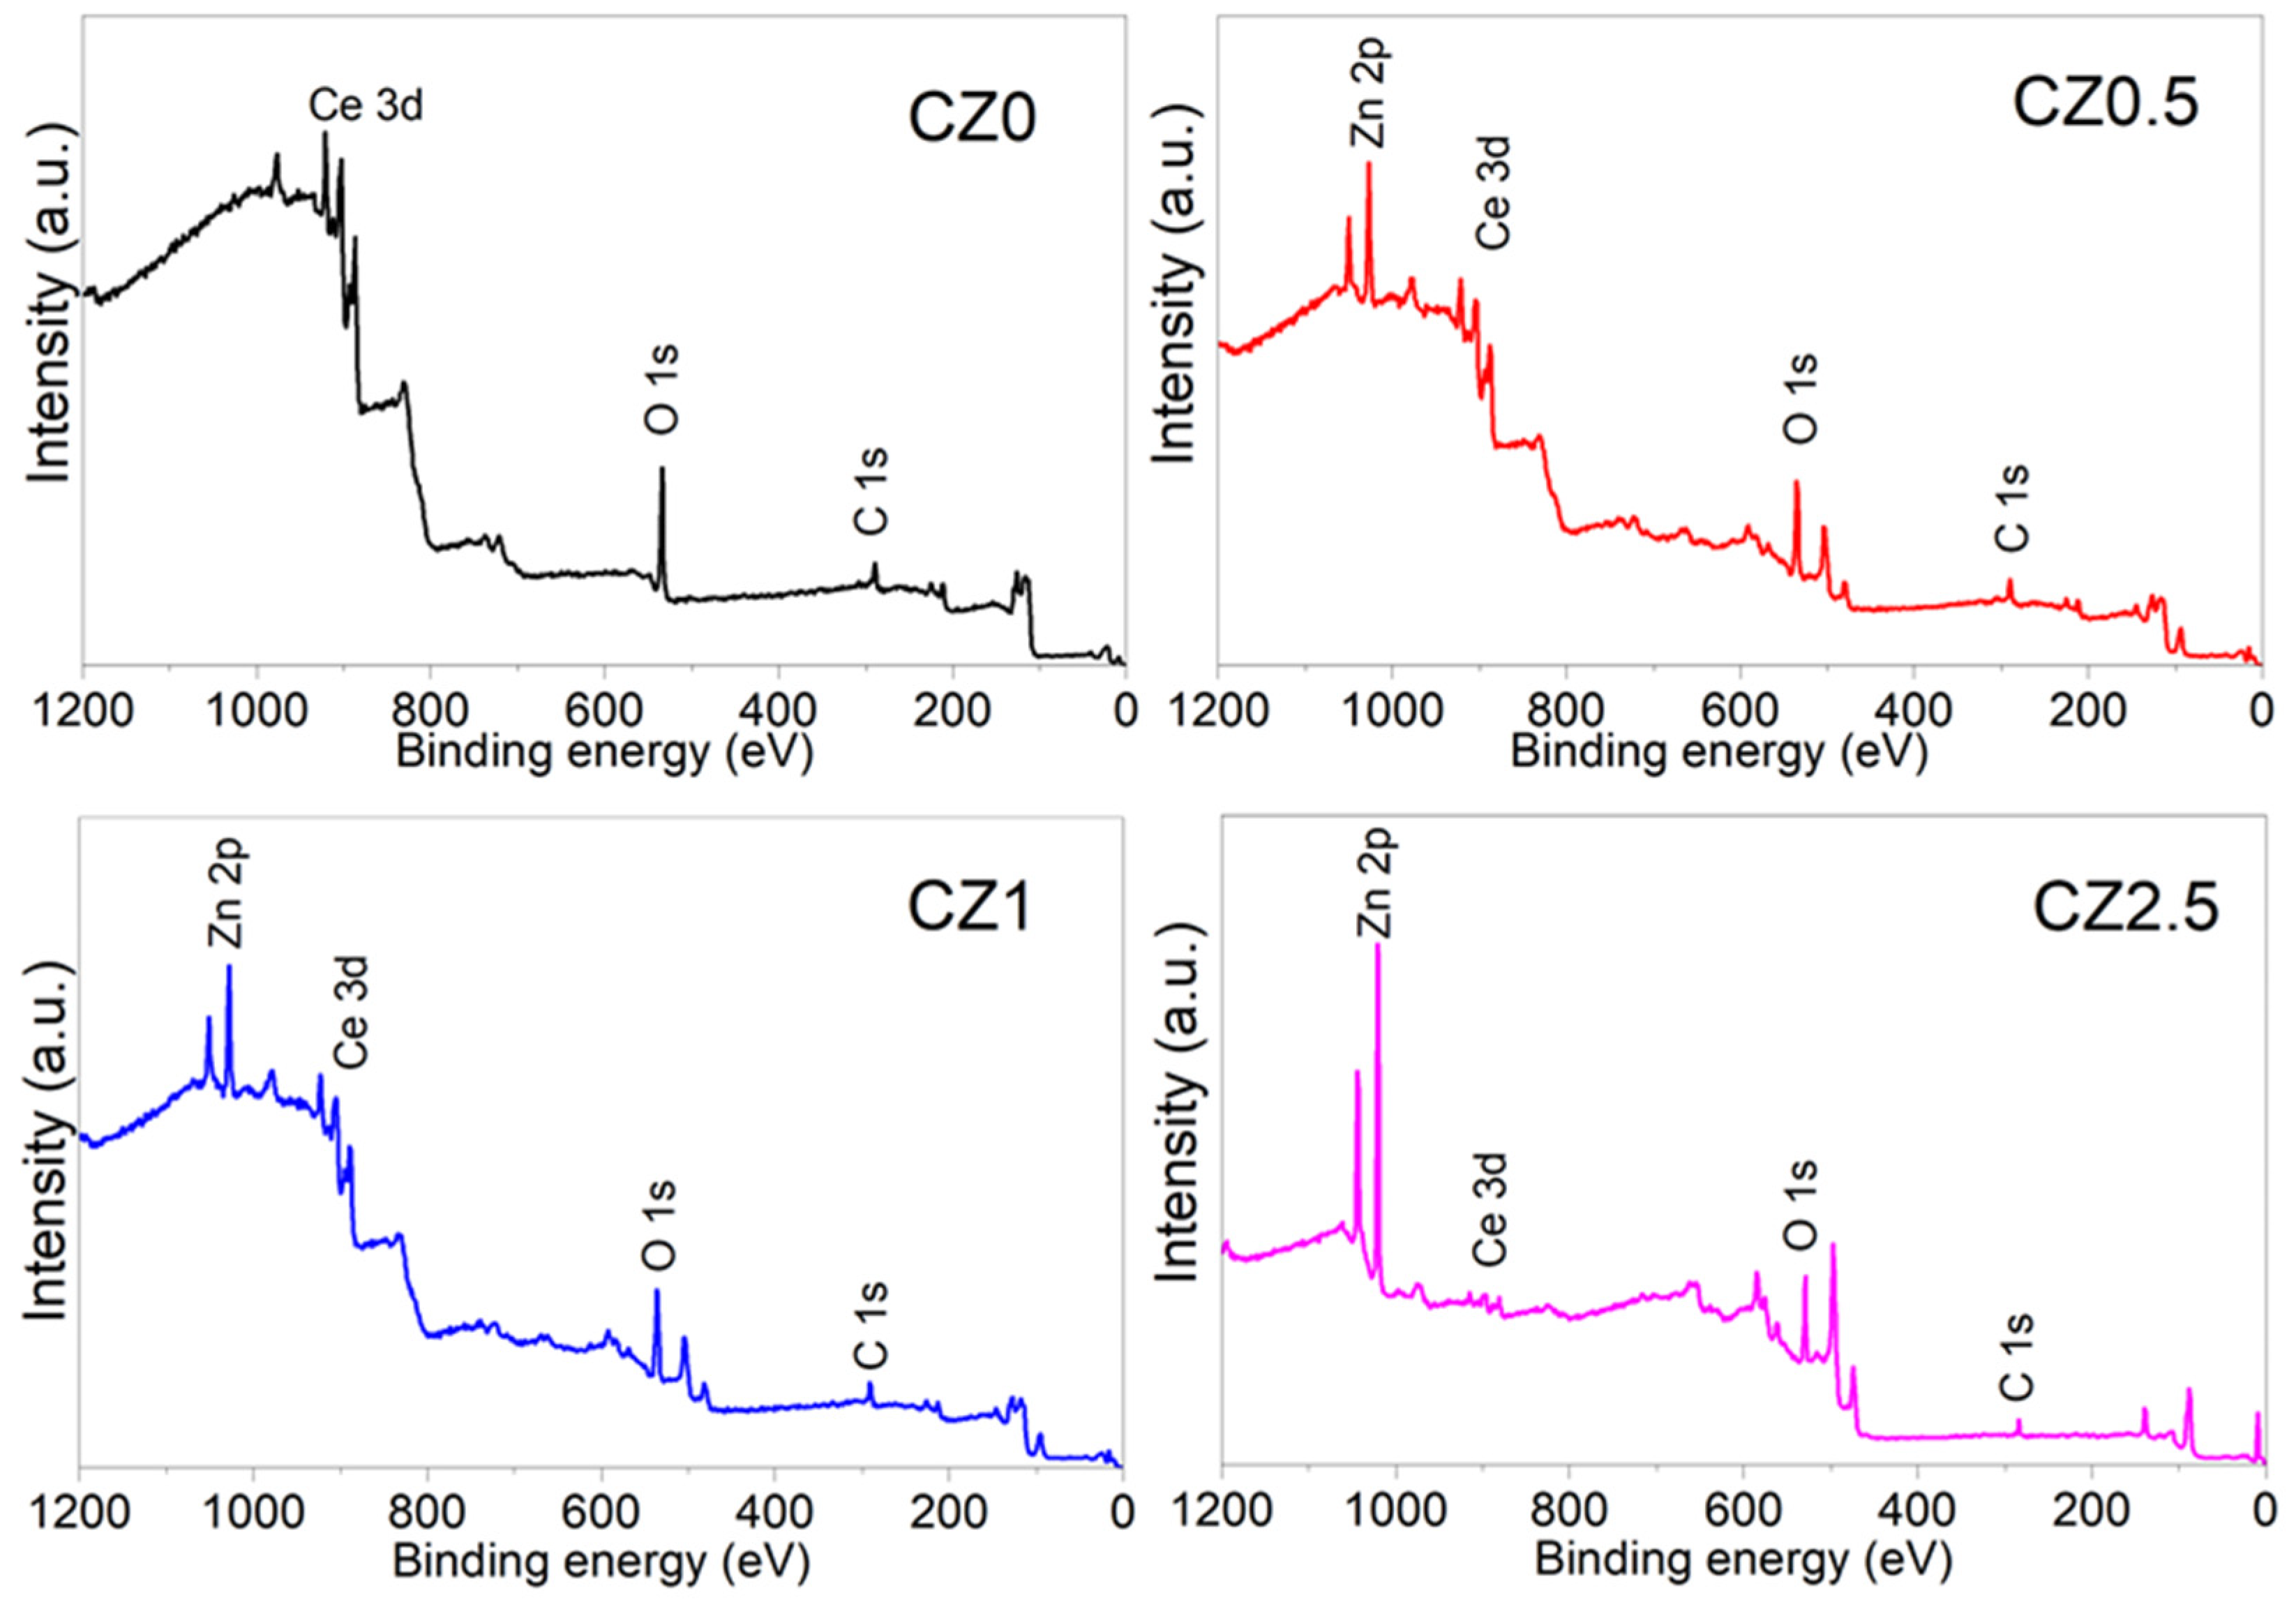
2.3. XPS Spectra of the Catalysts
The characterization by X-ray photoelectron spectroscopy (XPS) was performed on a spectrophotometer XPS microprobe PHI 5000 VersaProbe-II. with a monochrome of Al Ka (hn=1486.7 eV). The spectra were calibrated with respect C 1s to 284.5 eV.
To obtain information about the chemical states, stoichiometry, and surface species of the photocatalysts, the XPS technique was used. Figure 4 shows the survey spectra of the photocatalysts and confirms that they consist of the elements Ce, Zn, O, and C. No other elements were observed that could be correlated with impurities due to the precursors or the materials’ preparation method.
The deconvolution of the high-resolution XPS spectrum of core level (spin orbit coupling) of Ce 3d from the reference CZ0,in this is observed the doublet of the spin orbit coupling of Ce 3d5/2 and Ce 3d3/2 in wich 4 and 6 peaks were obtained, these are attributed to Ce3+ y Ce4+, respectively (see Figure 5). The binding energy (BE) that corresponds to Ce3+ are localized in 880.64 eV (Ce 3d5/2, v0), 899.24 eV (Ce 3d3/2, u0), 885.13 eV (v’) y 903.73 (u’). For Ce4+ its BE are localized in 882.20 eV (Ce 3d5/2, v), 888.28 eV (v’’), 897.82 eV (v’’’), 900.80 eV (Ce 3d3/2, u), 906.88 eV (u’’) and 916.35 eV (u’’’)
The results obteined to according to the adjustmen and deconvolution of the spectrum of higt resolution of Ce 3d (CZ0), are similar to the has been reported in the literature, mention that the associated BE to v’’, v’’’, u’’ and u’’’ correspond to the satellites shake-up of the levels of the del núcleo de Ce4+ 3d5/2 y 3d3/2. Las BE de los satelites shake up correspondientes a Ce3+ 3d5/2 y 3d3/2 son v’ y u. The spin-orbit shift of Ce 3d5/2 and 3d3/2 is of 18.60 eV, for both species of Ce3+ and Ce4+. The reason for Ce3+ content in CZ0, it was determined using the procedure and expression Ce3+/(Ce3+ + Ce4+) as reported in the literature [3,39], the value obtained of Ce3+ by CZ0 was 21.8%.
The relative reason of the Ce3+ specie was calculated in the same way using the previous expression for CZn0.5, CZn1.5 y CZ2.5; the value obtained were: 22%, 20% and 17.2%. The incorporation of Zn Oto CeO2 modifies the Ce3+ ratio below 1% of ZnO. Howhever, by the material of 2.5% of ZnO, A new peak can be observed that can be associated with cerium nanoparticles with a non-stoichimetric composition of CeO2-y, it’s correlated to the presence of oxygen vacancies and the formation of Ce2O3 due to the incorporation of ZnO [3].
According to what has been reported in the literature by the spin-orbit coupling of Zn 2p3/2 and Zn 2p1/2 present a BE of 1021.7 and 1044.7 eV, correspond to Zn2+ in the crystal lattice of ZnO [Ceramics International 2019]. In Figure 6, high resolution spectra of Zn are shown by Zn 2p3/2 and 2p1/2 by the catalysts CZ0.5, CZ1.5 y CZ2.5, Subsequently, the afore mentioned BEs are taken as a reference for our analysis.
Figure 6 shows the dotted line associated with the BE as a ZnO reference (1021.7 eV) which corresponds to Zn2+ in the structural network of ZnO. In the incorporation of Zinc to CeO2 shows a slight shift at low energy by CZ05 (1021.60 eV), CZ1.5 (1021.67 eV) and for CZ2.5 the displacement is much greater (1021.15 eV). The low energy shift indicates that zinc is within the CeO2 crystalline structure, causing the generation of oxygen vacancies and forming a heterojunction between both crystalline phases (CeO2 and ZnO) in addition, in samples CZ0 and CZ2.5 CeO2-y However, for sample CZ1.5 the opposite occurs, zinc is partially in the structure and outside the CeO2 structure, since there is no significant change in its BE and the displacement of coupling spin-orbit of Zn 2p2/3 and 2p1/2 is 23 eV.
By other size the high-resolution O 1s spectrum of the different catalysts according to our analysis can be observed in Figure 7. In the CZ0 sample, two peaks can be observed that are located at 529.15 eV and 531.55 eV, which are associated with oxygen in the structural network (blue dotted line) with 81.3% and with oxygen on the surface (red dotted line) as OH ions with 18.7% in CeO2 [Ceramics international 2019]. The Zinc incorporation in the framework of CeO2 generates new peaks (Table 2 and Figure 7).
The new oxygen species observed in CZ0.5 are located at 527.70 and 530.52 eV and can be assigned to the Zn-O-Ce interaction, which generates the vacancies, and Zn-OH-Ce on the surface. In the CZ1.5 material, it can be observed that there is a low-energy shift in the peaks associated with Zn-O-Ce and Zn-OH-Ce, and a peak located at 530.86 eV is generated, which can be associated with Zn-OH, since, as mentioned above, zinc is not completely contained in the CeO2 crystal structure. Finally, in CZ2.5, it is observed that there is a high energy shift which is associated with the strong interaction (heterojunction) of the species and substitution of Zn in the CeO2 network (Zn-O-Ce and Zn-OH-Ce) in addition to the formation of a non-stoichiometric species of CeO2-y, which is located at 529.87 eV.
2.4. UV Spectra of Catalysts CZ0, CZ0.5, CZ1.5 and CZ2.5
In the reference sample CZ0, the UV–Vis spectrum exhibits an absorption edge near 380 nm, with an estimated band gap of ~3.13 eV (Table 1), a value consistent with that reported for pure CeO2 with a cubic fluorite structure [Nanostructured CeO2 photocatalysts: Optimizing surface chemistry, morphology, and visible-light absorption]. This result confirms that the employed synthesis method does not significantly alter the intrinsic electronic structure of the base material, see Figure 8.
Upon incorporating ZnO, the spectra of all samples display similar absorption edges, with no significant changes in Eg, indicating that the partial substitution of Ce4+ by Zn2+ and the formation of heterojunctions do not substantially affect the fundamental transition of the semiconductors. Therefore, the observed improvement in photocatalytic activity cannot be attributed to a reduction in Eg, but rather to structural and interfacial factors such as the increase in oxygen vacancies, the presence of Ce3+ species, and the efficient charge separation in a possible S-scheme heterojunction.
2.5. Study of Photodegradation Catalytic of 40ppm of 2,4-Dichlorophenoxyacetic Acid
Figure 9 shows the relative degradation rate of 2,4-dichlorophenoxyacetic acid (2,4-D) using CeO2–ZnO catalysts. A clear increase in photocatalytic activity is observed as the ZnO loading increases. Among the catalysts evaluated, CZ1.5 exhibits the best performance, achieving approximately 80% degradation of 2,4-D after 6 h, while pure CeO2 (CZ0) shows the lowest activity. This trend is confirmed by total organic carbon (TOC) analysis, which reveals mineralization degrees of 74%, 50%, 39%, and 28% for CZ1.5, CZ2.5, CZ0.5, and CZ0, respectively. It is noteworthy that the activity of CZ1.5 is approximately twice that of CZ0, highlighting the beneficial effect of ZnO in the photocatalytic process.
Figure 3.
SEM/EDX analysis of catalysts CZ0, CZ0.5, CZ1.5 and CZ2.5.
2.4. X-Ray Photoelectron Spectroscopy
By the other size the characterization by X-ray photoelectron spectroscopy (XPS) was performed on a spectrophotometer XPS microprobe PHI 5000 VersaProbe-II. with a monochrome of Al Ka (hn=1486.7 eV). The spectra were calibrated with respect C 1s to 284.5 eV. To obtain information about the chemical states, stoichiometry, and surface species of the photocatalysts, the XPS technique was used. Figure 4 shows the survey spectra of the photocatalysts and confirms that they consist of the elements Ce, Zn, O, and C. No other elements were observed that could be correlated with impurities due to the precursors or the materials’ preparation method.
Figure 4.
Spectra survey XPS of photocatalysts CZ0, CZ0.5, CZ1.5, CZ2.5.
The deconvolution of the high-resolution XPS spectrum of core level (spin orbit coupling) of Ce 3d from the reference CZ0, in this is observed the doublet of the spin orbit coupling of Ce 3d5/2 and Ce 3d3/2 in wich 4 and 6 peaks were obtained, these are attributed to Ce3+ y Ce4+, respectively (ver Figure 5). The binding energy (BE) that corresponds to Ce3+ are localized in 880.64 eV (Ce 3d5/2, v0), 899.24 eV (Ce 3d3/2, u0), 885.13 eV (v’) y 903.73 (u’). For Ce4+ its BE are localized in 882.20 eV (Ce 3d5/2, v), 888.28 eV (v’’), 897.82 eV (v’’’), 900.80 eV (Ce 3d3/2, u), 906.88 eV (u’’) and 916.35 eV (u’’’). The results obteined to according to the adjustmen and deconvolution of the spectrum of higt resolution of Ce 3d (CZ0), are similar to the has been reported in the literature, Lazaro et.al, mention that the associated BE to v’’, v’’’, u’’ and u’’’ correspond to the satellites shake-up of the levels of the nucle of Ce4+ 3d5/2 y 3d3/2. The BE of the satellites shake up correspondent to Ce3+ 3d5/2 y 3d3/2 son v’ y u. The spin-orbit shift of Ce 3d5/2 and 3d3/2 is of 18.60 eV, for both species of Ce3+ and Ce4+. The reazon for Ce3+ content in CZ0, it was determined using the procedure and expression Ce3+/(Ce3+ + Ce4+) as reported in the literature [3,39], the value obtained of Ce3+ by CZ0 was 21.8%.
The relative reason of the Ce3+ species was calculated in the same way using the previous expression for CZn0.5, CZn1.5 y CZ2.5; the value obtained were: 22%, 20% and 17.2%. The incorporation of Zn Oto CeO2 modifies the Ce3+ ratio below 1% of ZnO. Howhever, by the material of 2.5% of ZnO, A new peak can be observed that can be associated with cerium nanoparticles with a non-stoichimetric composition of CeO2-y, this is correlated to the presence of oxygen vacancies and the formation of Ce2O3 due to the incorporation of ZnO [2015 referencia]. According to what has been reported in the literature by the spin-orbit coupling of Zn 2p3/2 and Zn 2p1/2 present a BE of 1021.7 and 1044.7 eV, correspond to Zn2+ in the crystal lattice of ZnO [Ceramics International 2019]. In Figure 6, high resolution spectra of Zn are shown by Zn 2p3/2 and 2p1/2 by the catalysts CZ0.5, CZ1.5 y CZ2.5, Subsequently, the BEs are taken as a reference for our analysis.
Figure 5.
High-resolution spin-orbit doublet spectra of Ce 3d (Ce 3d5/2 and Ce 3d3/2) by the photocatalysts CZ0, CZ0.5, CZ1 y CZ2.5This is a figure. Schemes follow the same formatting.
Figure 5.
High-resolution spin-orbit doublet spectra of Ce 3d (Ce 3d5/2 and Ce 3d3/2) by the photocatalysts CZ0, CZ0.5, CZ1 y CZ2.5This is a figure. Schemes follow the same formatting.
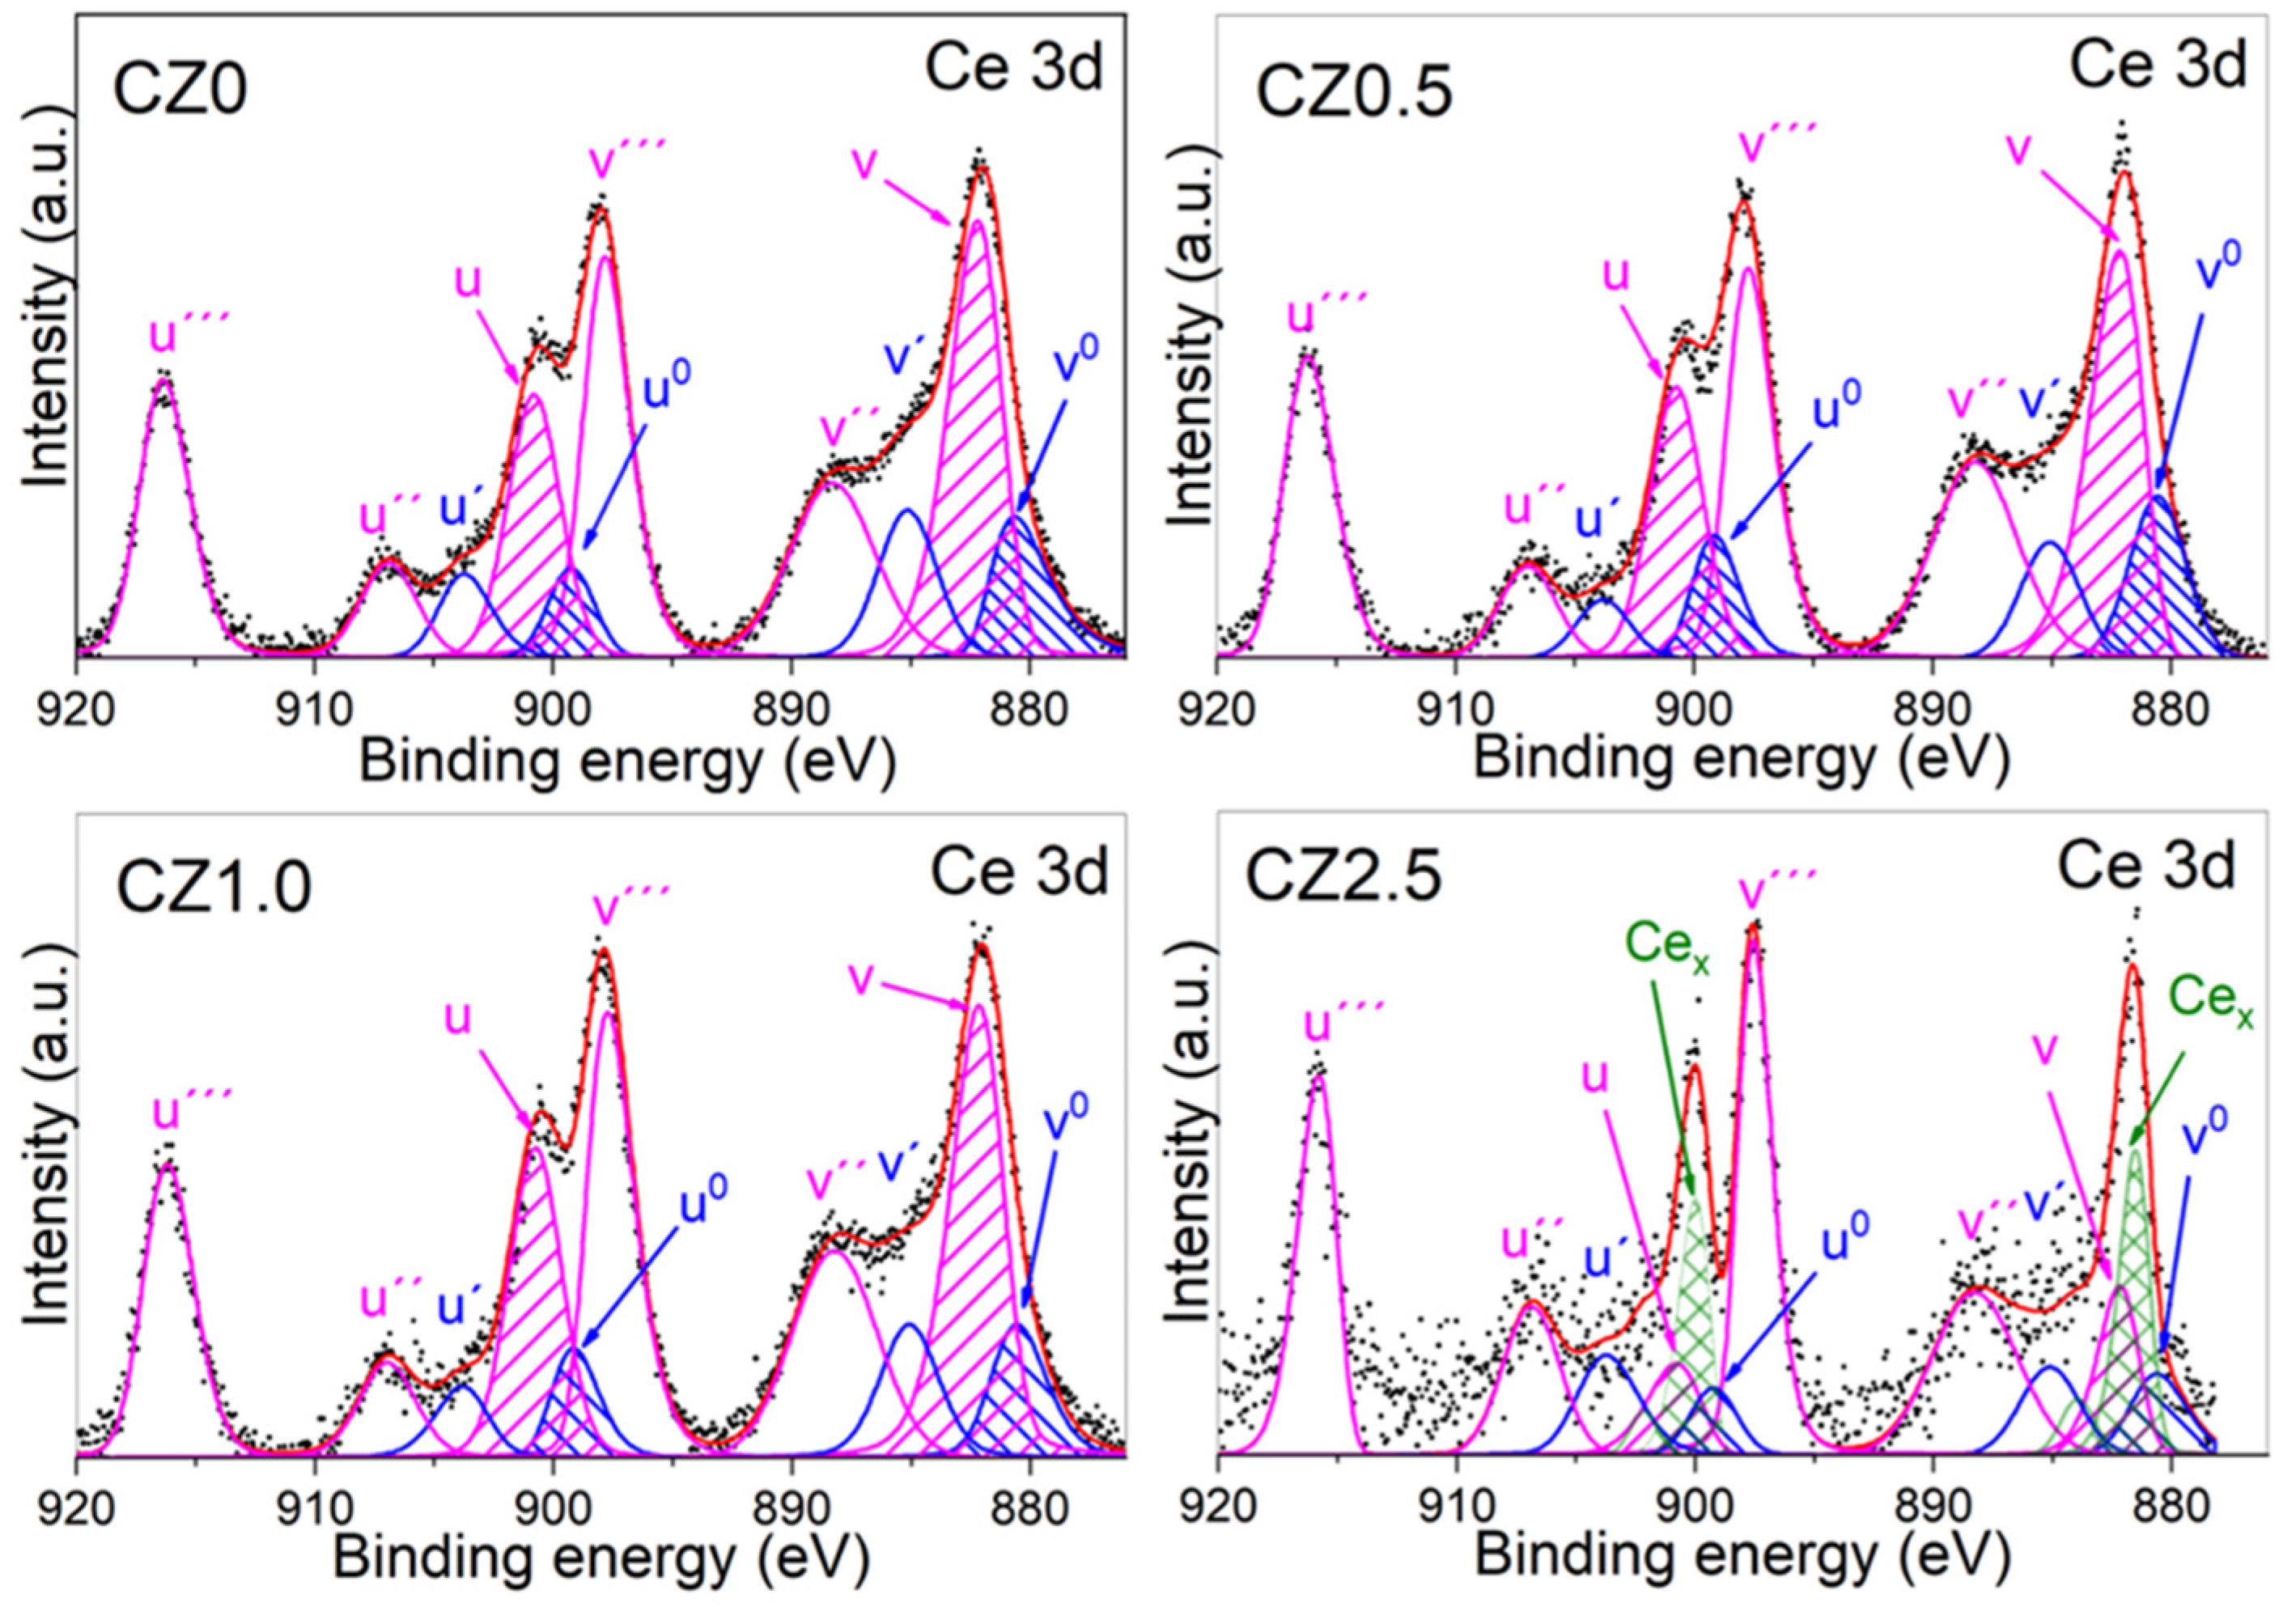
Figure 6.
High-resolution spectra for Zn2p of the catalysts CZ0, CZ0.5, CZ1.5 y CZ2.5.
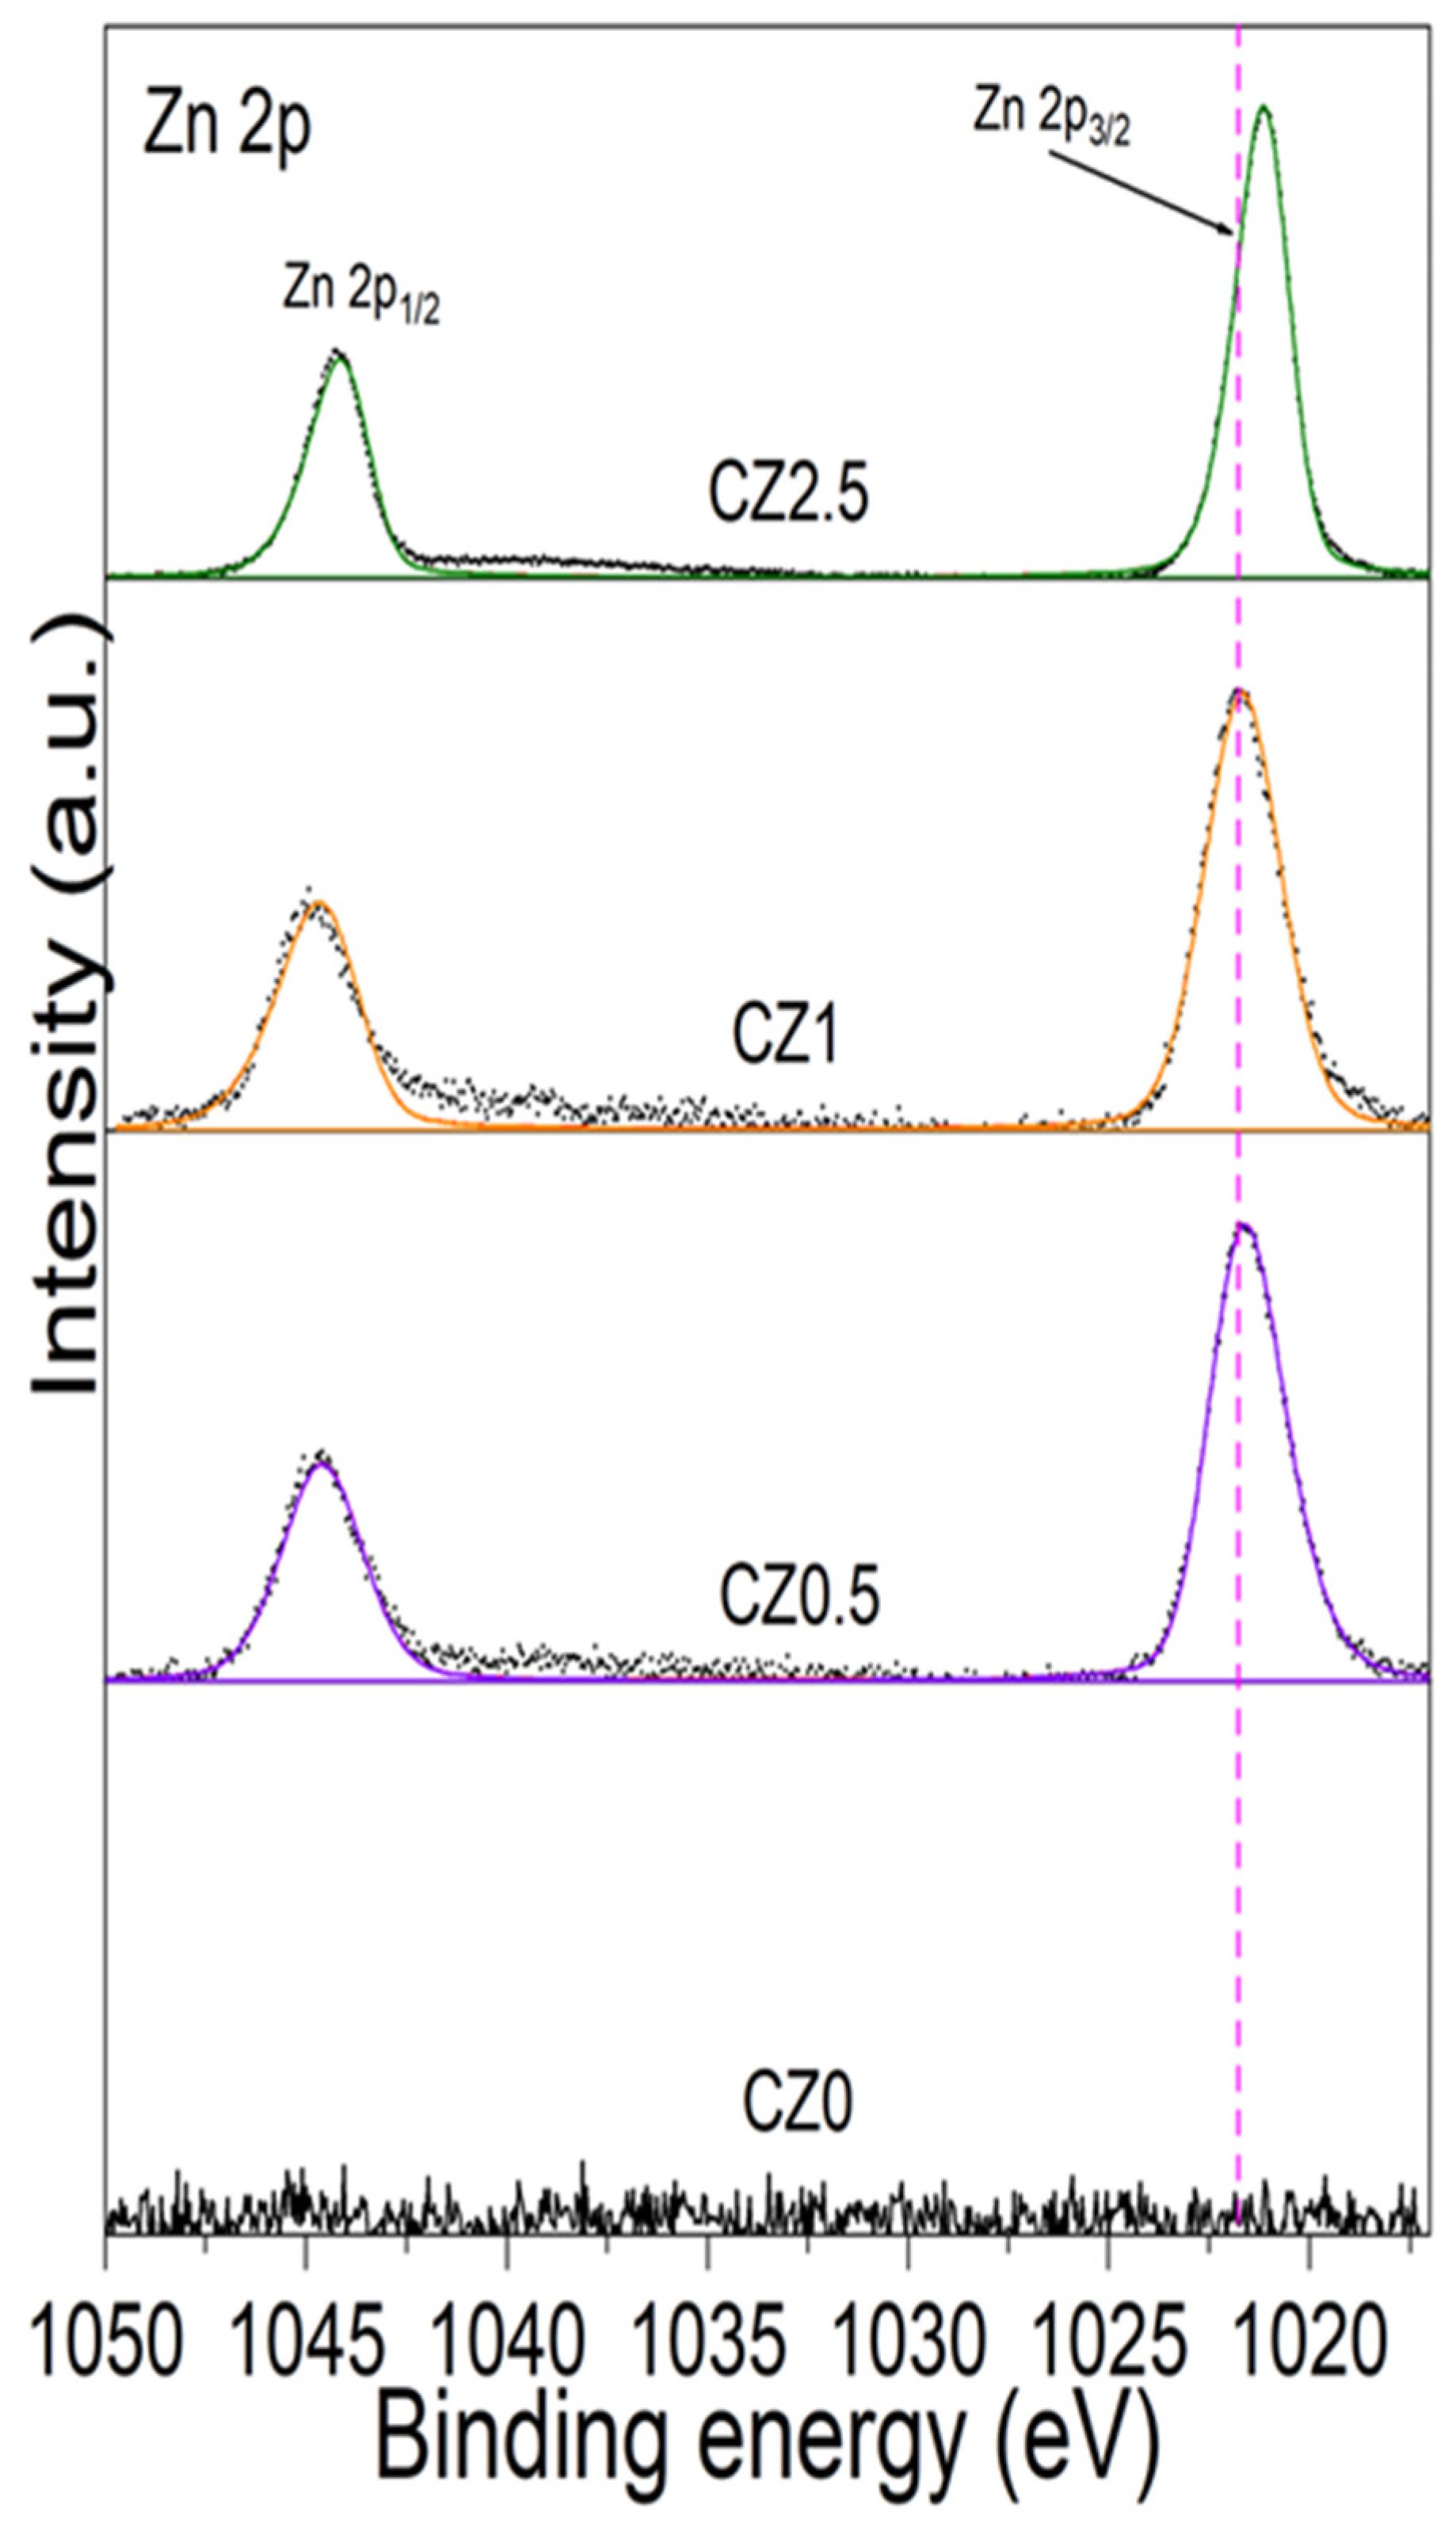
Figure 6 shows the dotted line associated with the BE as a ZnO reference (1021.7 eV) which corresponds to Zn2+ in the structural network of ZnO. In the incorporation of Zinc to CeO2 shows a slight shift at low energy by CZ05 (1021.60 eV), CZ1.5 (1021.67 eV) and for CZ2.5 the displacement is much greater (1021.15 eV). The low energy shift indicates that zinc is within the CeO2 crystalline structure, causing the generation of oxygen vacancies and forming a heterojunction between both crystalline phases (CeO2 and ZnO) in addition, in samples CZ0 and CZ2.5 CeO2-y However, for sample CZ1.5 the opposite occurs, zinc is partially in the structure and outside the CeO2 structure, since there is no significant change in its BE and the displacement of coupling spin-orbit of Zn 2p2/3 and 2p1/2 is 23 eV.
By other size the high-resolution O 1s spectrum of the different catalysts according to our analysis can be observed in Figure 7. In the CZ0 sample, two peaks can be observed that are located at 529.15 eV and 531.55 eV, which are associated with oxygen in the structural network (blue dotted line) with 81.3% and with oxygen on the surface (red dotted line) as OH ions with 18.7% in CeO2 [Ceramics international 2019]. The Zinc incorporation in the framework of CeO2 generates new peaks (Table 2 and Figure 7).
Figure 7.
High resolution O 1s spectrum of catalysts CZ0, CZ0.5, CZ1.5 and CZ2.5.
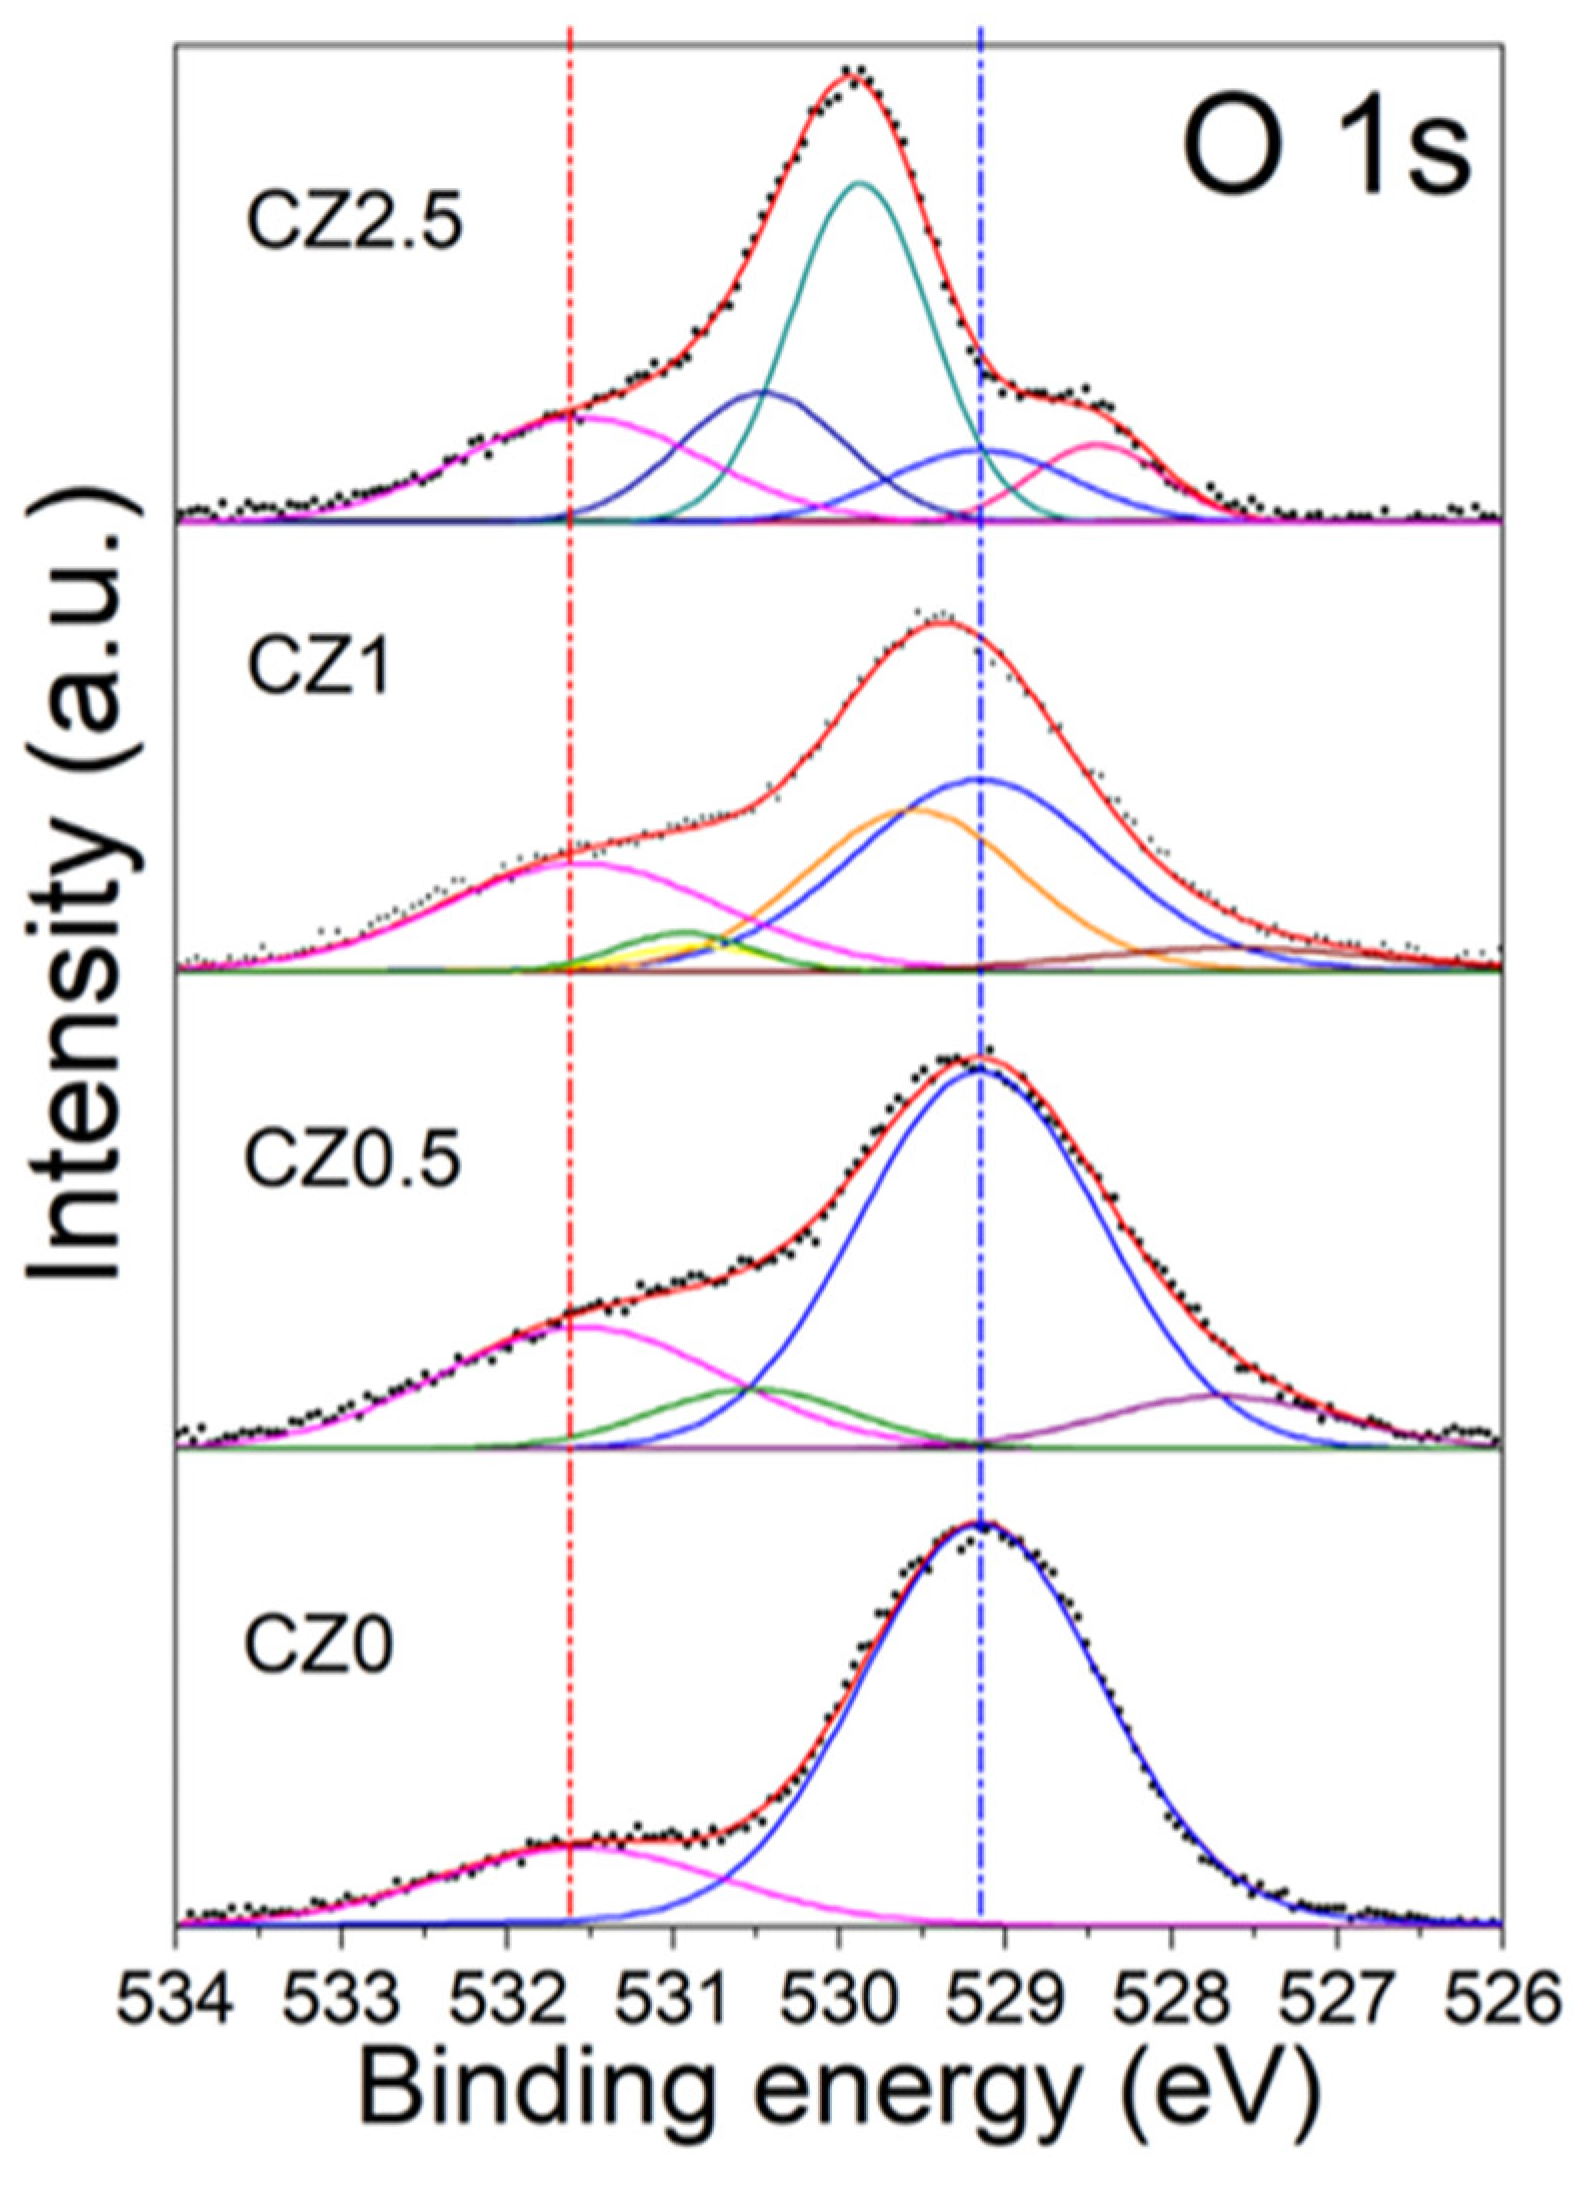

Table 2.
Binding energies O 1s of the different samples prepared by impregnation.
| CZ0 | CZ0.5 | CZ1.5 | CZ2.5 | ||||
| O 1s | O 1s | O 1s | O 1s | ||||
| Energy (eV) |
Concen. Relative (%) |
Energy (eV) |
Concen Relative (%) |
Energy (eV) |
Concen. Relative (%) |
Energy (eV) |
Concen. Relative (%) |
| 529.15 | 81.3 | 527.70 | 8.2 | 527.63 | 5.4 | 528.45 | 8.7 |
| 531.55 | 18.7 | 529.15 | 60.8 | 529.15 | 39.1 | 529.15 | 11.3 |
| 530.52 | 8 | 529.55 | 28.3 | 529.87 | 40.1 | ||
| 531.55 | 23 | 530.86 | 2.8 | 530.46 | 18.1 | ||
| 531.55 | 24.4 | 531.55 | 21.8 | ||||
The new oxygen species observed in CZ0.5 are located at 527.70 and 530.52 eV and can be assigned to the Zn-O-Ce interaction, which generates the vacancies, and Zn-OH-Ce on the surface. In the CZ1.5 material, it can be observed that there is a low-energy shift in the peaks associated with Zn-O-Ce and Zn-OH-Ce, and a peak located at 530.86 eV is generated, which can be associated with Zn-OH, since, as mentioned above, zinc is not completely contained in the CeO2 crystal structure. Finally, in CZ2.5 it is observed that there is a high energy shift which is associated with the strong interaction (heterojunction) of the species and substitution of Zn in the CeO2 network (Zn-O-Ce and Zn-OH-Ce) in addition to the formation of a non-stoichiometric species of CeO2-y, which is located at 529.87 eV.
2.5. UV Spectra of Catalysts CZ0, CZ0.5, CZ1.5, CZ2.5
In the reference sample CZ0, the UV–Vis spectrum exhibits an absorption edge near 380 nm, with an estimated band gap of ~3.13 eV (Table 1), a value consistent with that reported for CeO2 pure with a cubic fluorite structure [Nanostructured CeO2 photocatalysts: Optimizing surface chemistry, morphology, and visible-light absorption]. This result confirms that the employed synthesis method does not significantly alter the intrinsic electronic structure of the base material, see Figure 8.
Figure 8.
UV spectra for catalysts CZ0, CZ0.5, CZ1.5 and CZ2.5.
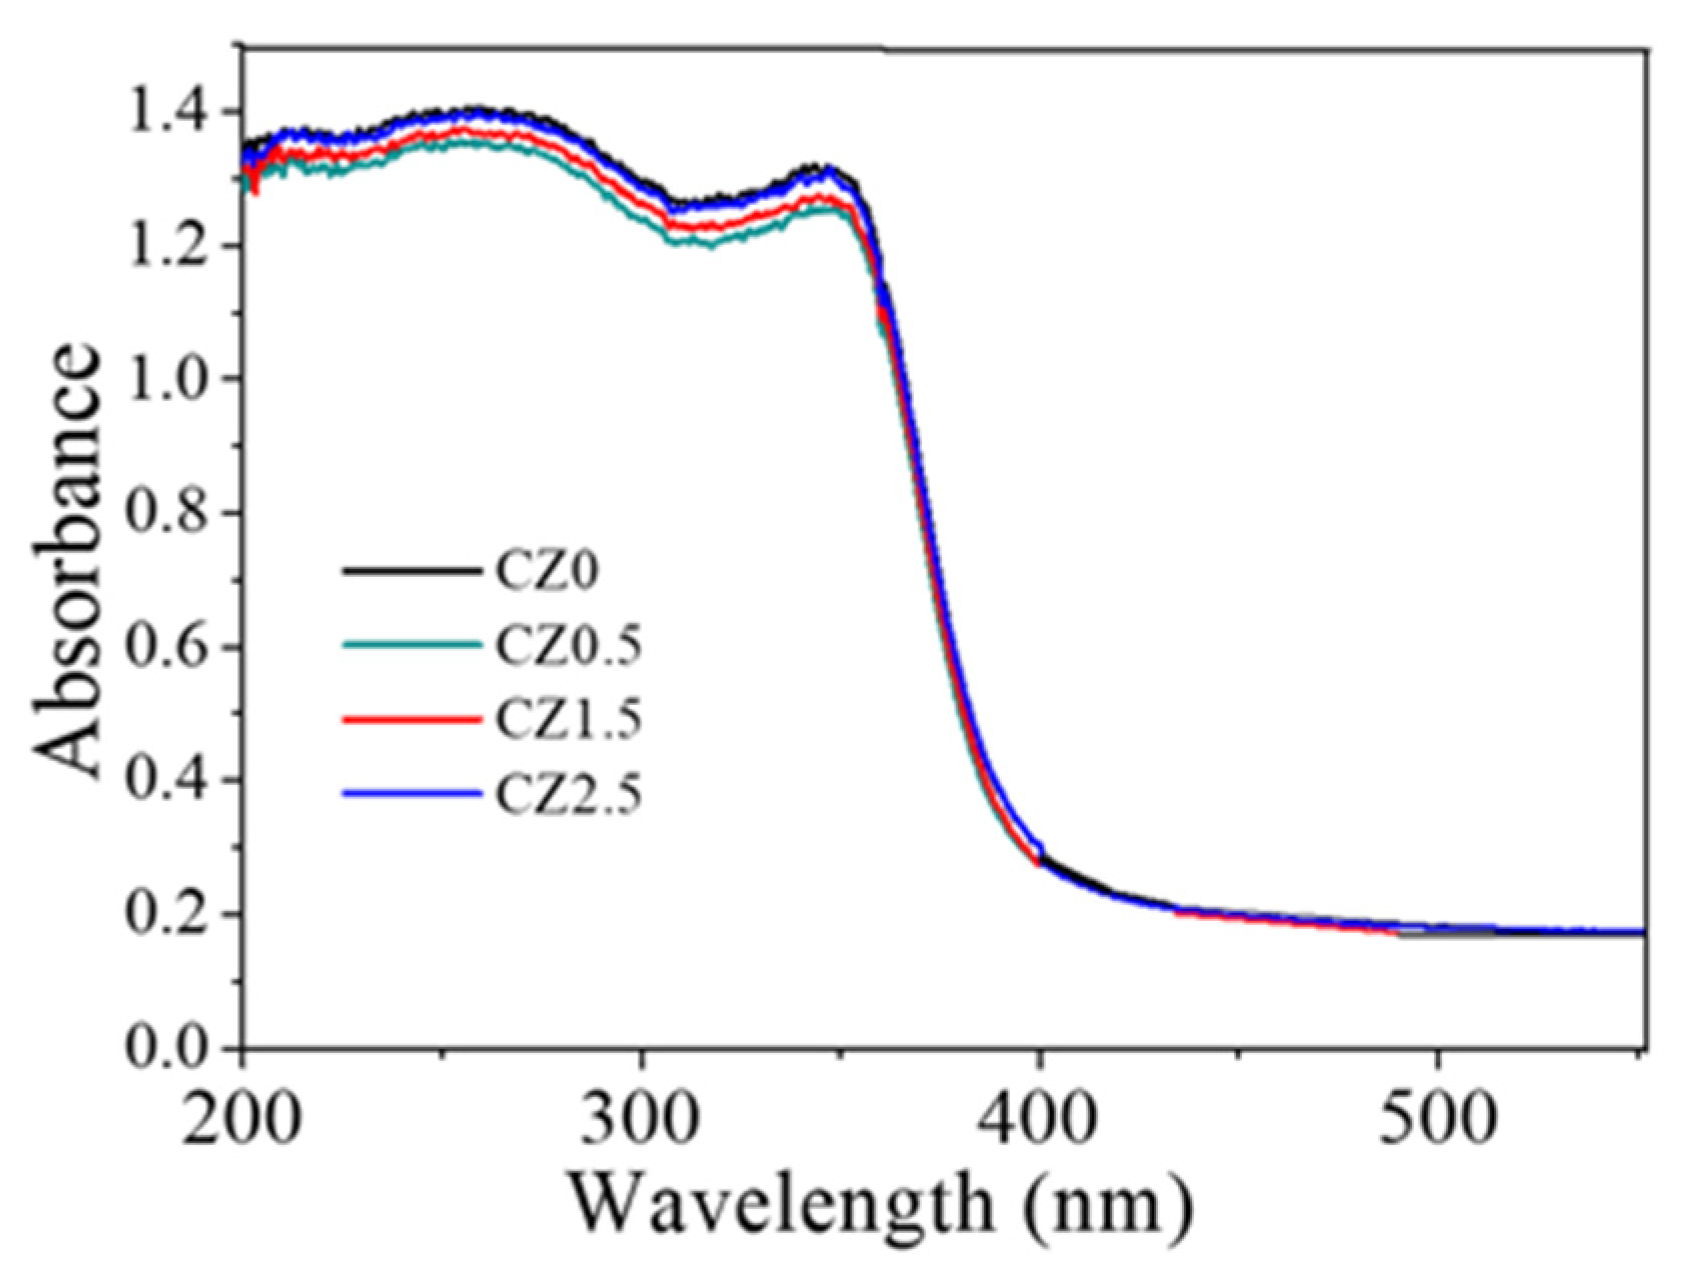
Upon incorporating ZnO, the spectra of all samples display similar absorption edges, with no significant changes in Eg, indicating that the partial substitution of Ce4+ by Zn2+ and the formation of heterojunctions do not substantially affect the fundamental transition of the semiconductors. Therefore, the observed improvement in photocatalytic activity cannot be attributed to a reduction in Eg, but rather to structural and interfacial factors such as the increase in oxygen vacancies, the presence of Ce3+ species, and the efficient charge separation in a possible S-scheme heterojunction.
2.6. Study of Photodegradation Catalytic of 40ppm oc Acid 2,4 Dichlorophenoxyacetic
Figure 9 shows the relative degradation rate of 2,4-dichlorophenoxyacetic acid (2,4-D) using CeO2–ZnO catalysts, in addition the photolysis and adsorption reactions are observed. A clear increase in photocatalytic activity is observed as the ZnO loading increases. Among the catalysts evaluated, CZ1.5 exhibits the best performance, achieving approximately 80% degradation of 2,4-D after 6 h, while pure CeO2 (CZ0) shows the lowest activity. This trend is confirmed by total organic carbon (TOC) analysis, which reveals mineralization degrees of 74%, 50%, 39%, and 28% for CZ1.5, CZ2.5, CZ0.5, and CZ0, respectively. It is noteworthy that the activity of CZ1.5 is approximately twice that of CZ0, highlighting the beneficial effect of ZnO in the photocatalytic process. Furthermore Table 2 shows the band gap values, as well as the results of the kinetic calculation of the photodegradation reaction of 2,4-d acid, and the TOC values.
Figure 9.
Graph of relative degradation rate of 40ppm of 2,4-D.
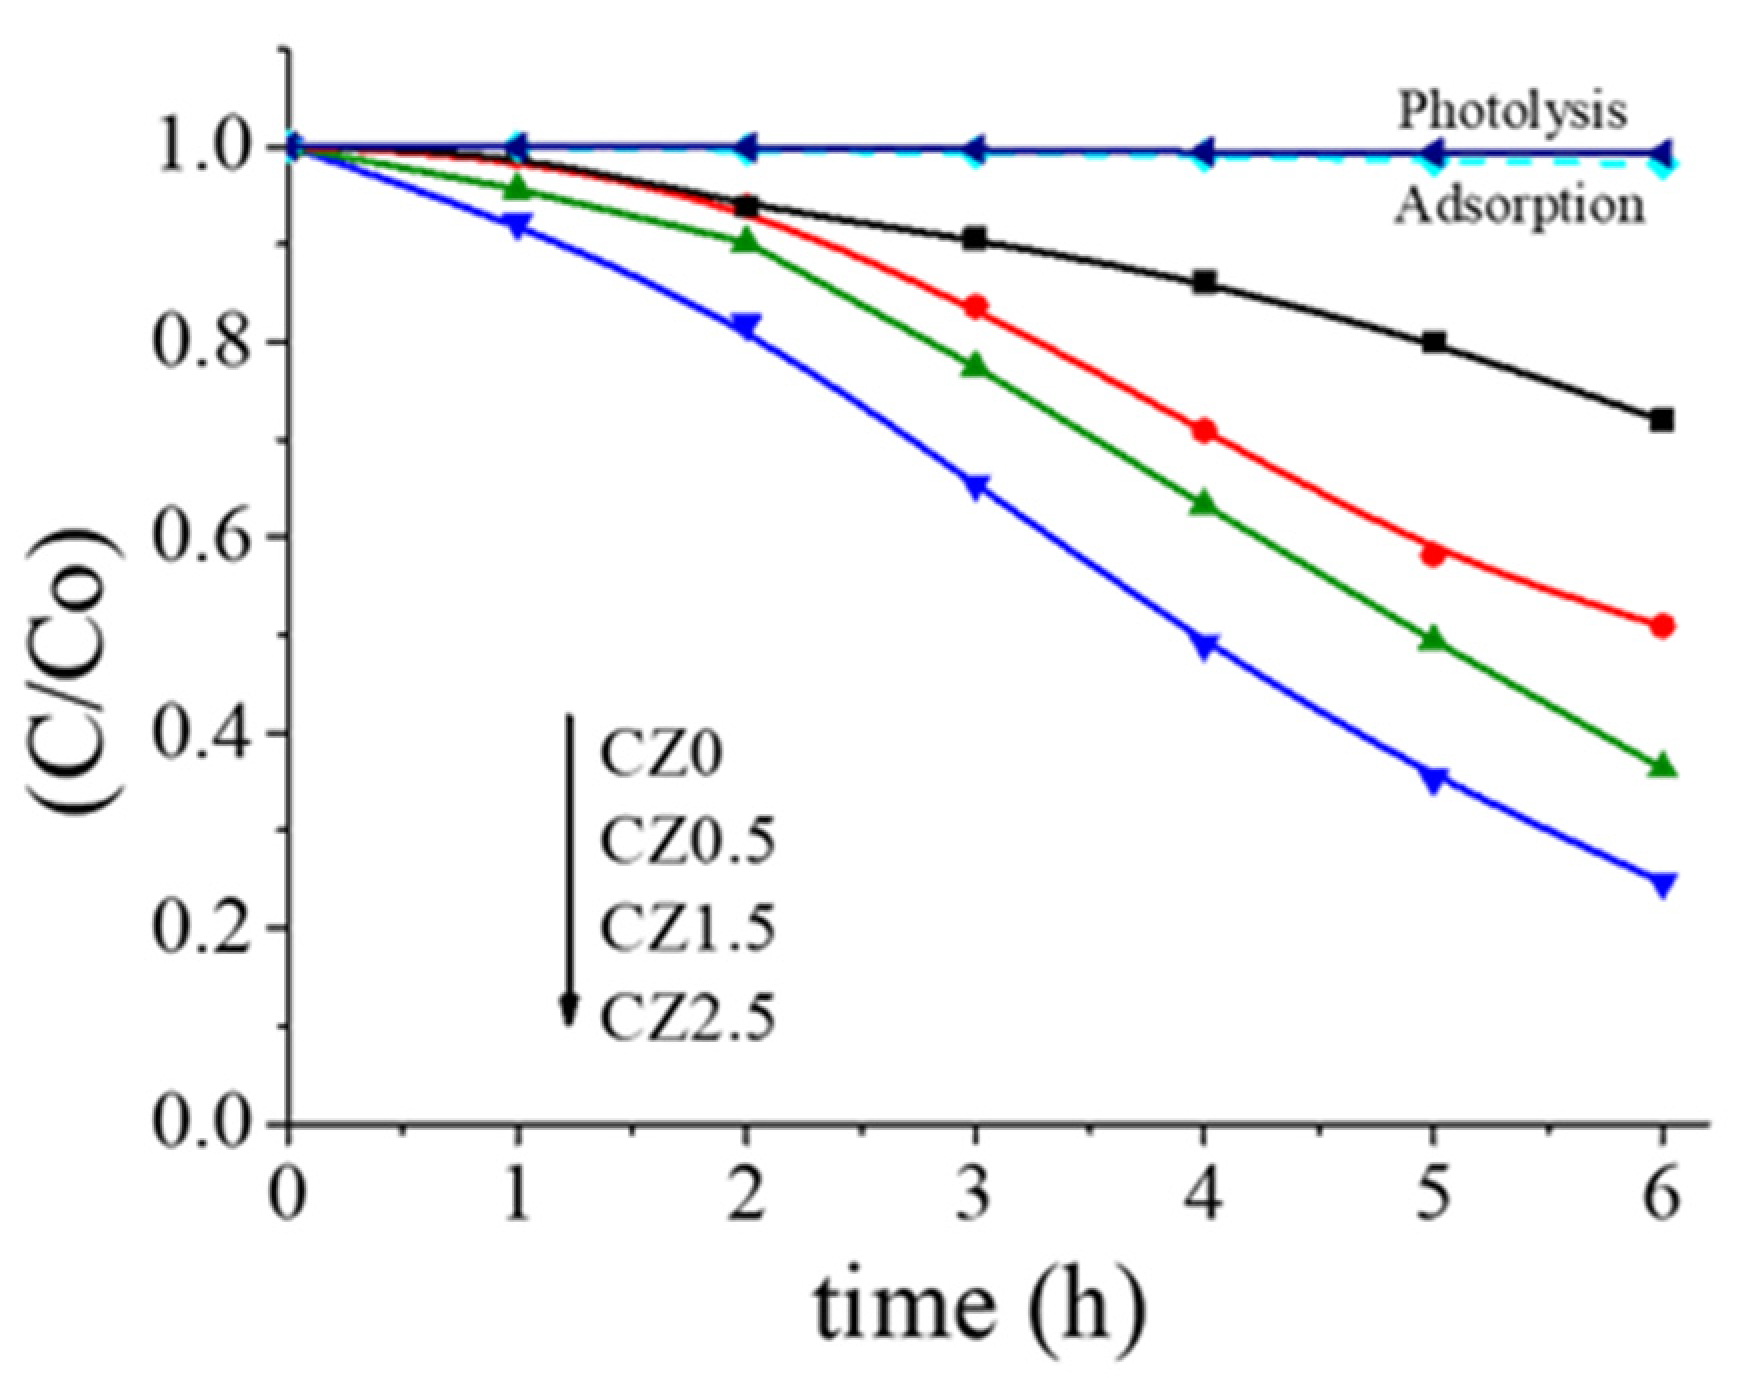
Table 2.
Shows the band Gap values, kapp values, half lifetime and %TOC degradation.
| Catalysts | Band gap (eV) |
Kapp | t1/2 h |
TOC % Degradation |
| CZ0 | 3.18 | 0.047 | 14.6 | 28 |
| CZ0.5 | 3.44 | 0.085 | 8.1 | 39 |
| CZ1.5 | 3.35 | 0.24 | 3.8 | 74 |
| CZ2.5 | 3.30 | 0.11 | 6.0 | 50 |
The kinetic data (Figure 10) fits well to a pseudo-first-order model, indicating that the reaction rate is mainly governed by the availability of active surface sites and the efficiency of photon absorption. The outstanding performance of CZ1.5 can be attributed to an optimal balance between ZnO content, surface area, and the formation of heterojunctions, which promote efficient charge separation and minimize electron–hole recombination.
Figure 10.
Kinetic graph of degradation of 40ppm of 2,4-D.
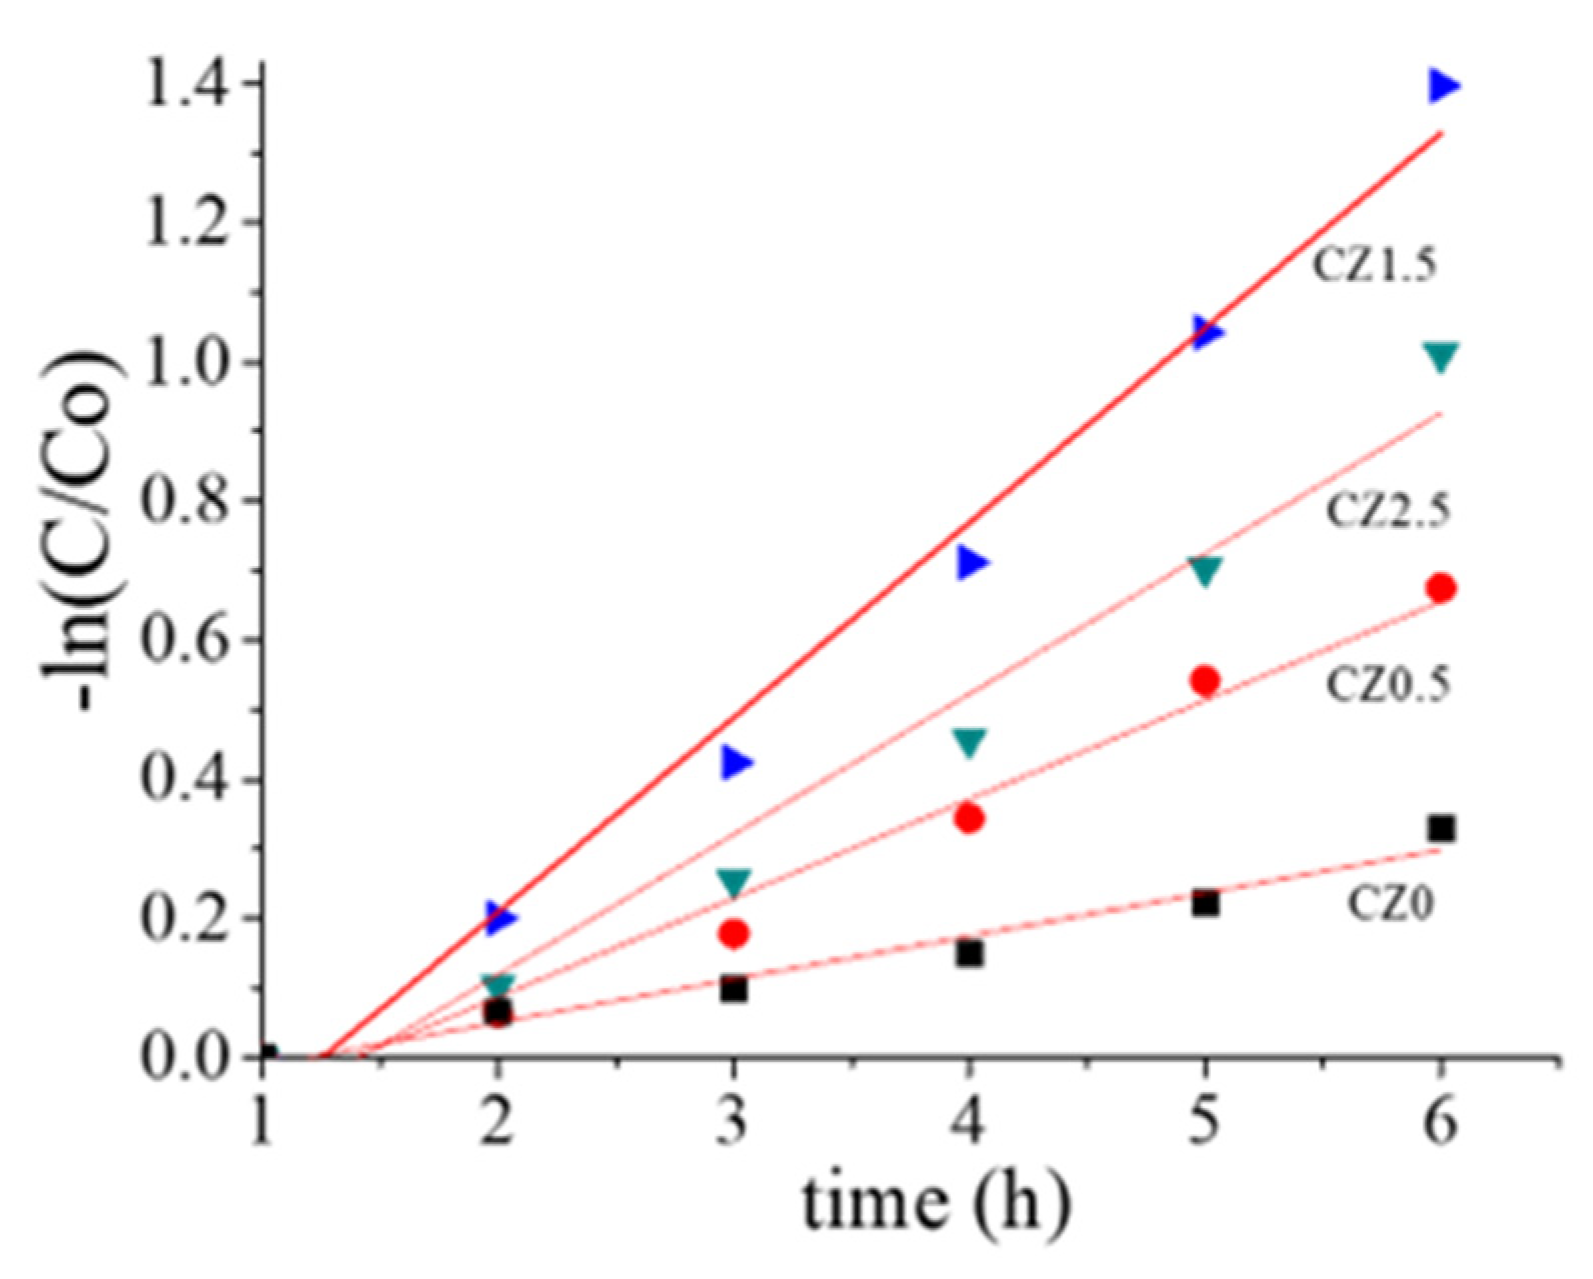
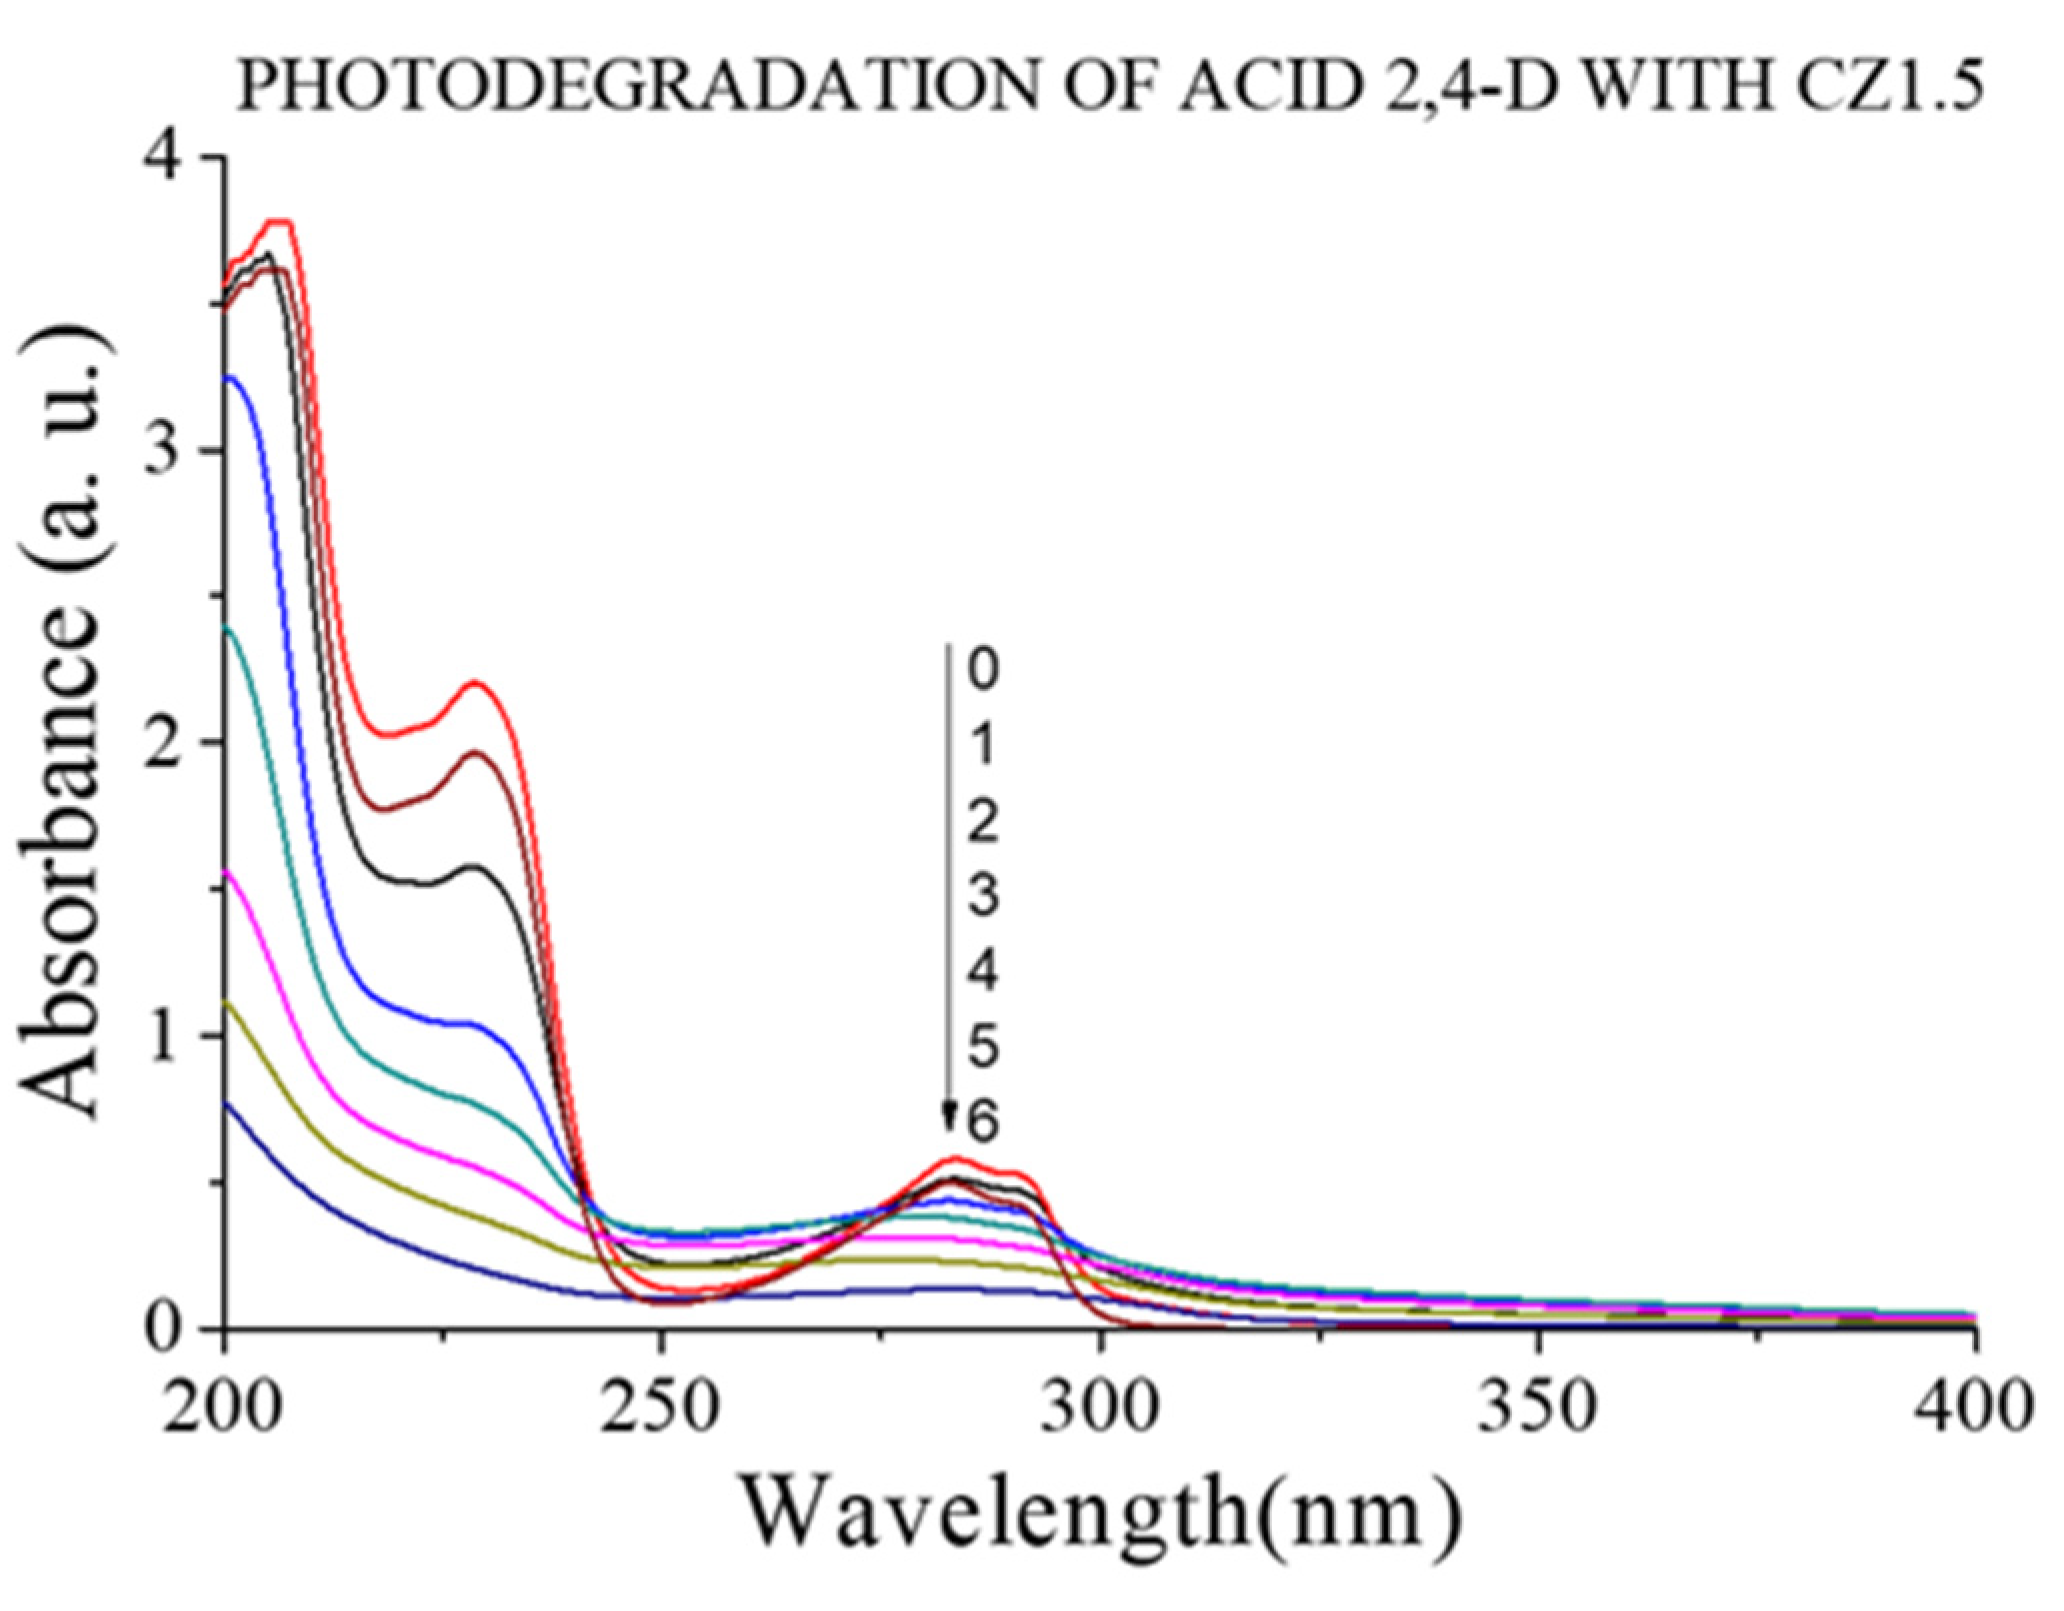
Figure 11 shows the photodegradation spectrum for the CZ1.5 catalyst. In this figure, it can be observed that the catalyst not only degrades the representative part of 2,4-D, but also the degradation of the aromatic part in the range of approximately 200 to 250 nm.
Figure 11.
UV spectra of the 2,4-D photodegradation with CZ1.5 catalysts.
The band edge values obtained by XPS for ZnO and CeO2 (Figure 5 and Figure 6) allow the construction of the actual energy diagram of the system, which shows that the conduction band (CB) of ZnO is located at a more negative potential (−0.23 eV vs. NHE) than that of CeO2 (−0.54 eV), while the valence band (VB) of CeO2 (2.63 eV) is less positive than that of ZnO (3.13 eV). This configuration suggests that, under UV irradiation, both semiconductors generate electron–hole (e−/h+) pairs independently.
In a conventional type-II heterojunction, electrons from the CB of the semiconductor with the more negative CB (ZnO) would migrate to the CB of the semiconductor with the more positive CB (CeO2), while holes from the VB of CeO2 would move to the VB of ZnO. However, this mechanism leads to the accumulation of electrons and holes with less extreme redox potential, thereby reducing their oxidative and reductive capabilities [37].
In contrast, the analysis of our structural (XRD) and surface chemistry (XPS) results, along with the high efficiency in the generation of •OH and O2•− inferred from the photocatalytic activity, indicates that the CeO2–ZnO system operates via an S-scheme mechanism. In this model, after simultaneous excitation of both semiconductors, electrons from the CB of CeO2 recombine with holes from the VB of ZnO at the interfacial contact region. As a result, high-energy electrons are preserved in the CB of ZnO (E_CB = −0.23 eV) and highly oxidative holes remain in the VB of CeO2 (E_VB = 2.63 eV), see Figure 12.
Figure 12.
S-Scheme of the CZ1.5 catalyst.
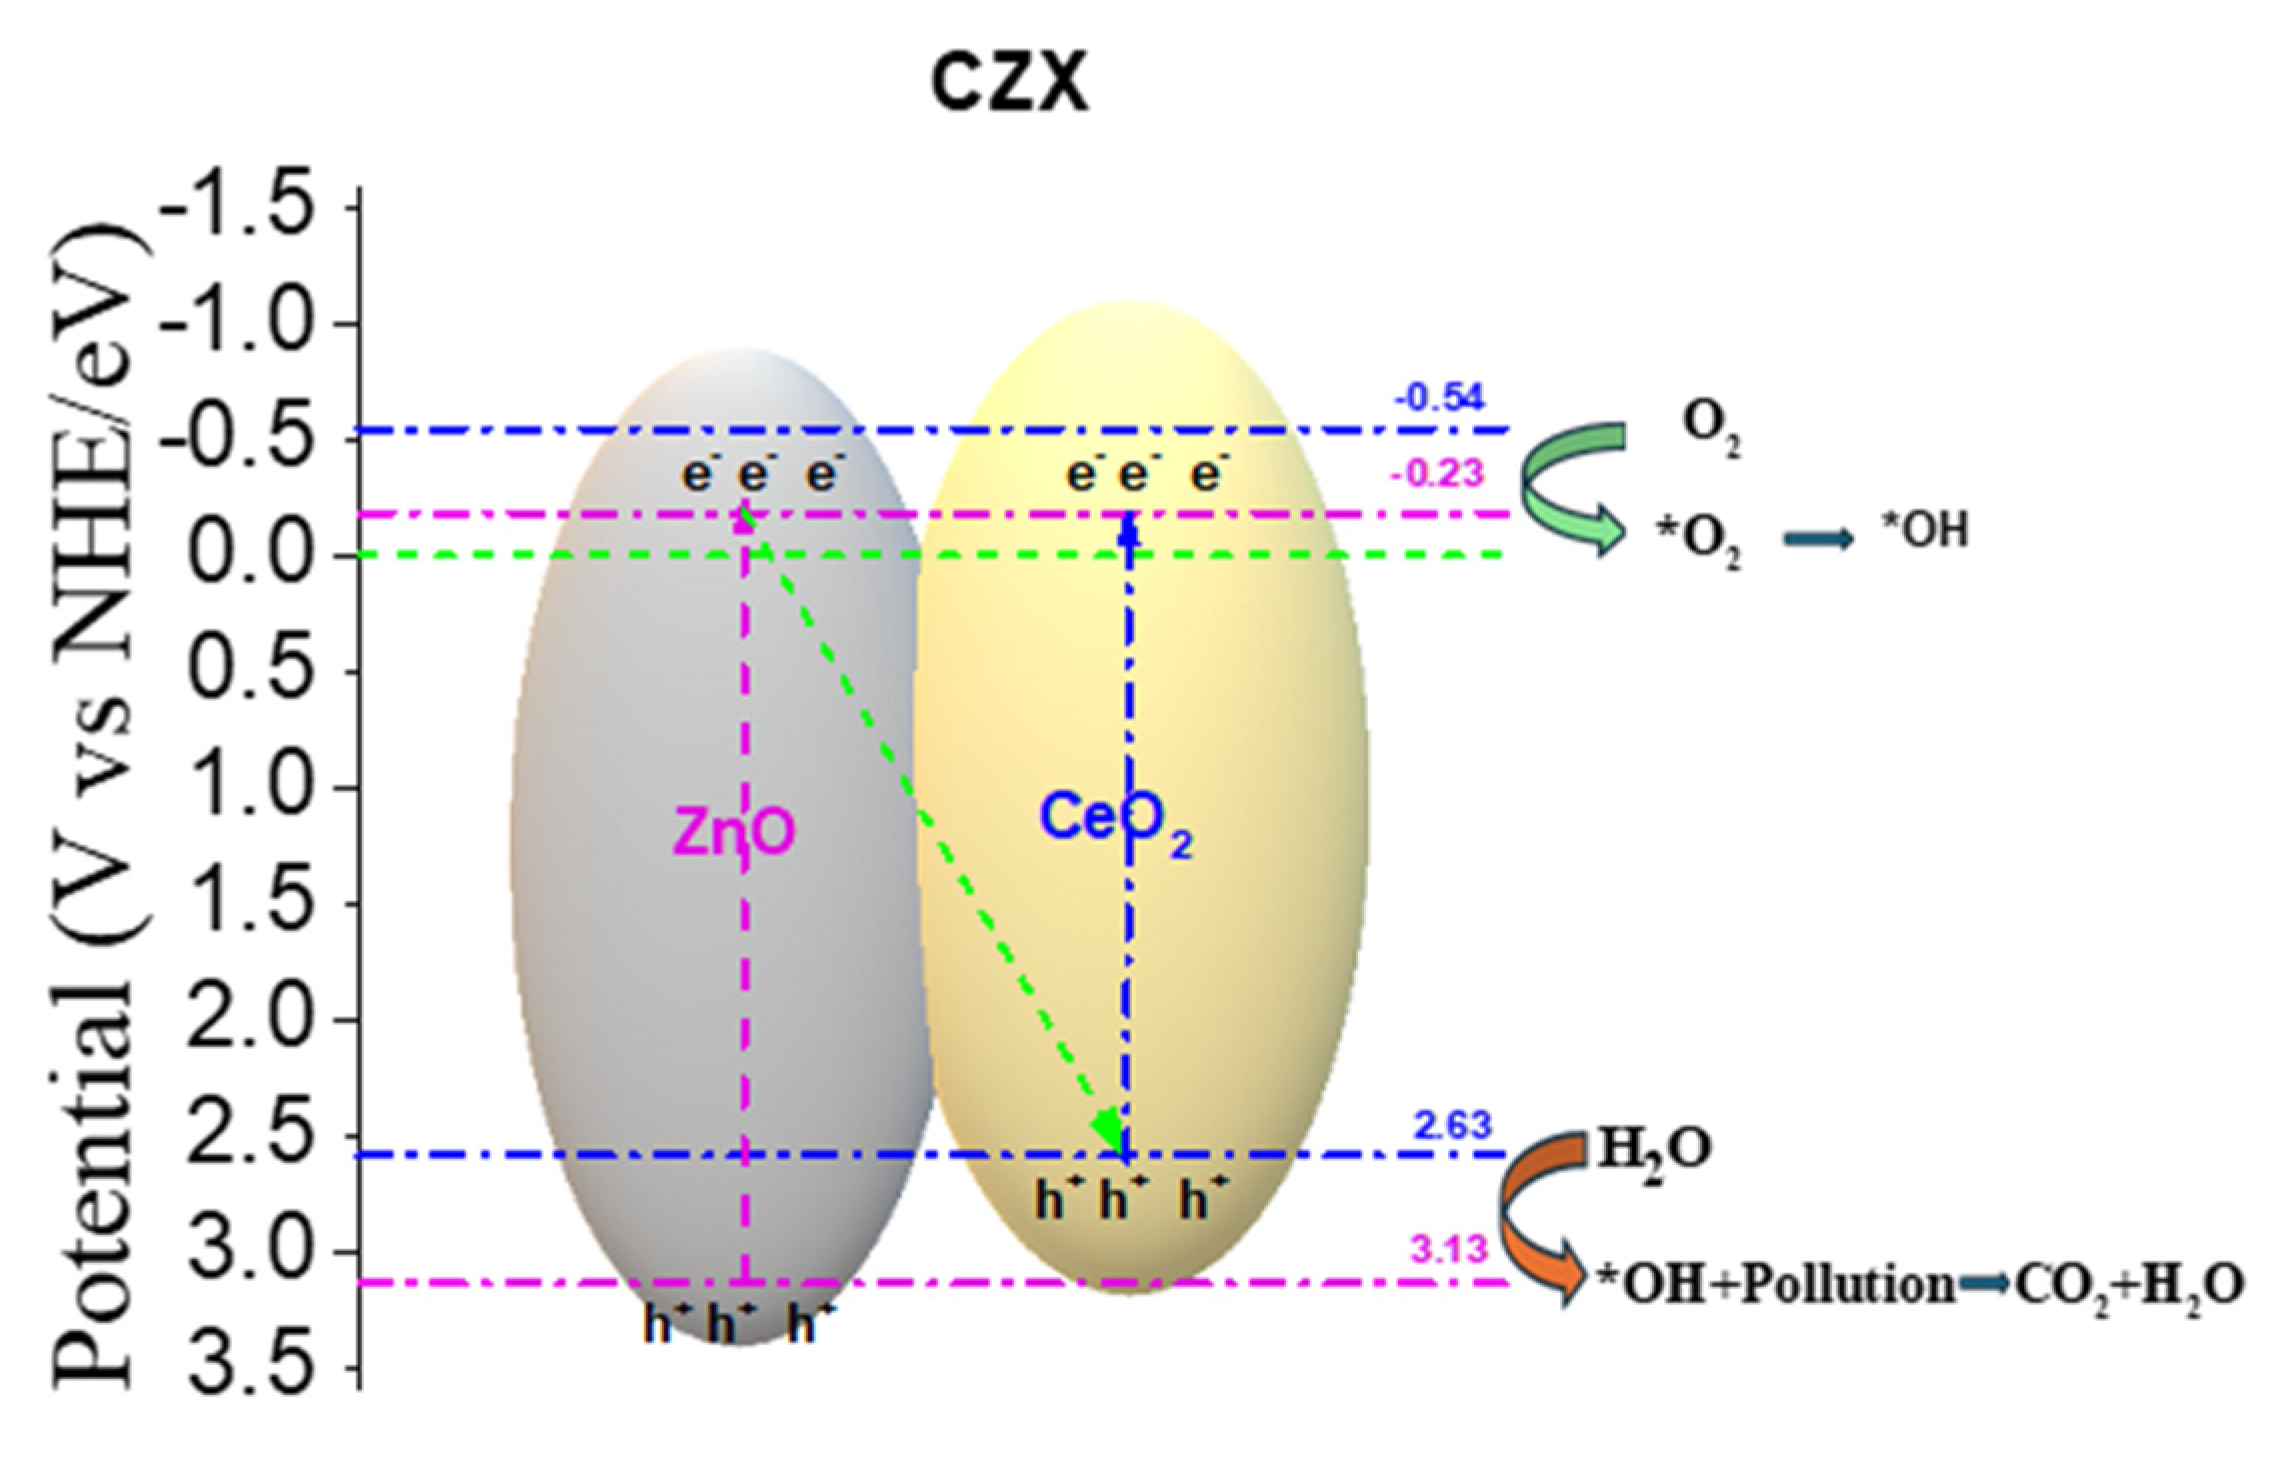
This charge separation retains the strong reducing power of electrons in the CB of ZnO, sufficient to reduce O2 to O2•−, and the strong oxidizing potential of holes in the VB of CeO2, capable of oxidizing H2O or OH− to generate •OH. Both radicals are key species in the degradation of 2,4-D, which explains the superior photocatalytic activity observed for the CZ1.5 catalyst.
Furthermore, the evidence of oxygen vacancies and the presence of Ce3+ detected by XPS support the S-scheme model, as these defects act as charge traps that promote the directional migration of electrons and holes, minimizing non-radiative recombination.
2.6. Effect of Treatment Temperature in Photoactivity
Once the material has been studied, the one that showed the most activity was chosen, and a temperature study was conducted to verify the optimal treatment for the materials, this study was realized at 300, 400 and 500 °C by 4 hours in air flow in the fresh material.
After this treatment, three reactions with the material CZ1.5 calcined to 3 temperatures, these reactions were monitored using UV-Vis spectroscopy and in Figure 13 the Uv spectra observed for the reactions of the calcined material to different temperatures. This image clearly shows that the treatment temperature is a determining factor in obtaining a material with the ideal physicochemical characteristics.
Figure 13.
Effect of treatment temperature on photoactivity.

3. Materials and Methods
All reagents used were of analytical grade obtained from Sigma Aldrich. For the preparation of reference CeO2 particles, Cerium (IV) Oxide (CeO2) 99.9%), and zinc acetylacetonate (Zn(C5H7O2)2.xH2O, was used as precursor of ZnO. The materials of CeO2-ZnO were named a: CZX, where C= CeO2, Z=ZnO and X= weight percent of zinc oxide in the sample.
CeO2-ZnO mixed oxides were prepared by peptization of CeO2 and zinc acetylacetonate (modified sol-gel method) [2,24], as follows: cerium oxide was placed in contact with nitric acid and water at 80 °C under stirring for 24 h. After this, the temperature decreased at room temperature, and zinc acetylacetonate was slowly added in the appropriate amounts to obtain 0.5, 1.5 and 2.5 wt% of ZnO in the peptized cerium oxide. The materials were dried and then placed in an oven at 120 °C for 12 hours. Calcination was performed under air flow (60 mL min-1) at 400 °C for 4 h. Thermal analysis was performed on a Thermogravimetric Analyzer (TA-Instruments Q500) under air flow by heating from 30 to 700 ° C at 1 ° C / min. The surface area of the materials was determined using a Micromeritics Tristar II Plus instrument and the BET method with nitrogen as the adsorbate gas. The BJH method was used to obtain the pore size distribution, after outgassing the samples for 3 h under vacuum to 250 °C. The X-ray diffractograms of the powders were measured at room temperature using Siemens D500 powder diffractometer, analyzing samples in the 2θ angle range between 5 ° and 80 °, with CuKα radiation, at 30 kV and 2 °/min. SEM-EDX-mapping analysis was performed using a Zeiss EVOHD15LS scanning electron microscope at 2kV, couple with energy-dispersive X-ray spectroscopy. The chemical state of the samples was analyzed in an ultra-high vacuum (UHV) system using a Scanning XPS microprobe PHI 5000 VersaProbe II, with a Al K X-ray source (hυ = 1486.6 eV), and an MCD analyzer.
Photodegradation of 2,4-Dichlorophenoxyacetic acid in aqueous media was carried out in a homemade batch type glass reactor (250 mL) with internal diameter of 4.44 cm and 17.78 cm, covered with an external cooling jacket. A solution (200 mL) containing 40 ppm (0.0400635 mmol) of 2,4-Dichlorophenoxyacetic acid bubbling dry air flow of 2mL s−1 and 200mg of catalyst were used. The solution was irradiated with a UV pen power supply (UVP Products) with a wavelength λ=254 nm and intensity 4.4 mWcm-2, placed in a quartz tube immersed in the reactor containing the pollutant solution. The temperature stabilized at 28 °C with a water recirculation bath connected to the outer jacket of the reactor. To assure the adsorption/desorption equilibrium of the contaminant solution on the catalyst surface, the system was stirred in the dark for 1 h before switching on UV light. The progress of the reaction was followed by measuring the decrease 2,4-Dichlorophenoxyacetic acid as a function of time. Aliquots of the pollutants were taken each 1 hour using a syringe containing a nylon membrane (0.45 μm, Millipore) to remove the solid material. The signal of the absorption bands of 2,4-Dichlorophenoxyacetic acid at 282 nm, was measured using a UV–vis spectrophotometer (2401PC Shimadzu) in the range of 200 to 400 nm. Total organic carbon (TOC) during the reaction was carried out using a Shimadzu 5000TOC analyzer.
4. Conclusions
The controlled incorporation of ZnO into CeO2 via a modified sol–gel method yielded materials with a cubic fluorite structure and, at higher loadings, coexistence with a hexagonal wurtzite phase. At low loadings (CZ0.5), partial substitution of Ce4+ by Zn2+ was evidenced, leading to lattice contraction and the generation of oxygen vacancies, while BET analysis revealed that an intermediate ZnO content (CZ1.5) optimizes the surface area (~41% higher than pure CeO2).
XPS characterization confirmed the presence of Ce3+ species, defects, and Zn–O–Ce bonds, supporting the formation of an S-scheme heterojunction. UV–Vis spectra showed similar band gap values (~3.13 eV) across the series, ruling out a significant optical effect. In the photocatalytic degradation of 2,4-D under UV irradiation, CZ1.5 achieved ≈80% degradation and 74% mineralization, approximately twice that of pure CeO2. This enhanced performance is attributed to the efficient charge separation within the heterojunction, preserving highly reductive electrons in the CB of ZnO and strongly oxidative holes in the VB of CeO2, thereby promoting the generation of O2•− and •OH responsible for degradation.
In addition, this study showed that the treatment temperature was crucial for obtaining the ideal properties for the good performance of the catalyst.
Author Contributions
Conceptualization C. M. G.; methodology: C. M. G., A. C. U. and A.P. L.; Formal Analysis: C. M. G., E. R. R. and I. R. V., Investigation C. M. G. E. R. R. and A. C. U., data curation, A. P. L., I. R. V., M. C.; Resources: E. R. R., I. R. V. and A. C. U.; writing—review and editing: C. M. G. A. P. L., M. C. and A. C. U.; visualization, C.M.G. and A.P.-L.; supervision: C. M. G., A. P. L. and A. C. U.; project administration, C. M. G., A. P. L.; funding acquisition, C.M.G., A. C. U. and A.P.-L. All authors have read and agreed to the published version of the manuscript.
Acknowledgments
We are grateful for the support received from the USAIQ of the Chemistry Department of the University of Guanajuato for the completion of this work, as well as the Metropolitan Autonomous University, Iztapalapa unit.
Conflicts of Interest
The authors declare no conflicts of interest.
References
- UNESCO report 2017. Available online: https://unesdoc.unesco.org/ark:/48223/pf0000247553_spa.
- Sa, S.; Nagashree, K.; Maiyalagan, T.; Keerthiga, G. Photocatalytic degradation of 2,4-dichlorophenoxyacetic acid – A comparative study in hydrothermal TiO2 and commercial TiO2. Applied Surface Science 2018, 449, 371–379. [Google Scholar] [CrossRef]
- Sherly, E.; Vijaya, J. Judith; Kennedy, L. John. Effect of CeO2 coupling on the structural, optical and photocatalytic properties of ZnO Nanoparticle. Journal of Molecular Structure 2015, 1099, 114–125. [Google Scholar] [CrossRef]
- Faisal, M.; Ismail, Adel A.; Ibrahimf, Ahmed A.; Bouzid, Houcine; Al-Sayari, Saleh A. Highly efficient photocatalyst based on Ce doped ZnO nanorods:Controllable synthesis and enhanced photocatalytic activity. Chemical Engineering Journal 2013, 229, 225–233. [Google Scholar] [CrossRef]
- Mehrabadi, Z.; Faghihian, H. Elimination of highly consumed herbicide; 2,4-dichlorophenoxyacetic acid from aqueous solution by TiO2 impregnated clinoptilolite, study of degradation pathway. Spectrochimica Acta Part A: Molecular and Biomolecular Spectroscopy 2018, 204, 248–259. [Google Scholar] [CrossRef] [PubMed]
- Fiorenza, R.; Di Mauro, A.; Cantarella, M.; Privitera, V.; Impellizzeri, G. Selective photodegradation of 2,4-D pesticide from water by molecularly imprinted TiO2. Journal of Photochemistry & Photobiology A: Chemistry 2019, 380, 111872. [Google Scholar] [CrossRef]
- Meng, Qingnan; Cui, Juanni; Tang, Yufei; Han, Zhenhua; Zhao, Kang; Zhang, Guojun; Diao, Quan. Solvothermal synthesis of dual-porous CeO2-ZnO composite and its enhanced acetone sensing performance. Ceramics International 2019, 45, 4103–4107. [Google Scholar] [CrossRef]
- Thakre, K.; Barai, D.; Bhanvase, A. A review of graphene-TiO2 and graphene-ZnO nanocomposite photocatalysts for wastewater treatment. Water Environment Research 2021, 93, 2414–2460. [Google Scholar] [CrossRef]
- Kang, S.; Yang, Y.; Bu, W.; Mu, J. TiO2 nanoparticles incorporated with Cuins2 clusters: Preparation and photocatalytic activity for degradation of 4-nitrophenol. Journal of Solid State Chemistry 2009, 182, 2972–2976. [Google Scholar] [CrossRef]
- Zhang, W.; Xiao, X.; An, T.; Song, Z.; Fu, J.; Sheng, G.; Cui, M. Kinetics, degradation pathway and reaction mechanism of advanced oxidation of 4-nitrophenol in water by a UV/H2O2 process. Journal of Chemical Technology & Biotechnology 2003, 78, 788–794. [Google Scholar] [CrossRef]
- Ely, A.; Baudu, M.; Kankou, M.; Basly, J. Copper and nitrophenol removal by low-cost alginate/Mauritanian clay composite beads. Chemical Engineering Journal 2011, 178, 168–174. [Google Scholar] [CrossRef]
- Wafi; Aji, D.; Mansoob, M. Recent Advances in Photocatalysis: From Laboratory to Mar. Result in Chemistry 2025, 18, 102672. [Google Scholar] [CrossRef]
- Liu, H.; Gong, X.; Zhang, L.; Shen, M.; Yina, G.; Wang, Y. Photodegradation of 2,4-DCP in biochar-related environments: impacts of dissolved organic matter and its molecular weight. RSC Adv. 2025, 15, 21555–21567. [Google Scholar] [CrossRef] [PubMed]
- Remucal, Christina K. The role of indirect photochemical degradation in the environmental fate of pesticides: a review. Environ. Sci.: Processes Impacts 2014, 16, 628–653. [Google Scholar] [CrossRef] [PubMed]
- Srinivasan, M.; Uthiram, C.; Ayeshamariam, A.; Kaviyarasu, K.; Punithavelan. Dielectric performance of CeO2/ZnO core–shell nanocomposite with their structural, optical and morphological properties. Journal of King Saud University - Science 2023, 35, 102508. [Google Scholar] [CrossRef]
- Amiri, F.; Dehghani, M.; Amiri, Z.; Yousefinejad, S.; Azhdarpoor, A. Photocatalytic degradation of 2,4-dichlorophenoxyacetic acid from aqueous solutions by Ag3PO4/TiO2 nanoparticles under visible light: kinetic and thermodynamic studies. Water Sci Technol 2021, 83, 3110–3122. [Google Scholar] [CrossRef] [PubMed]
- Fiorenza, R.; Di Mauro, A.; Cantarella, M.; Privitera, V.; Impellizzeri, G. Selective photodegradation of 2,4-D pesticide from water by molecularly imprinted TiO2. Journal of Photochemistry & Photobiology A: Chemistry 2019, 380, 111872. [Google Scholar] [CrossRef]
- Romero-Torres, E.; Gutiérrez-Arzaluz, M.; Mugica-Alvarez, V.; González-Reyes, L.; Torres-Rodríguez, M.; Tzompantzi-Morales, F.J.; Tzompantzi-Flores, C. Synthesis and characterization of gold nanoparticles on titanium dioxide for the catalytic photodegradation of 2,4-dichlorophenoxyacetic acid. J. appl. res. and Technol 2018, 16, 346–356. [Google Scholar] [CrossRef]
- Yuan; Long, Y.; Wu, L.; Liang, K.; Wen, H.; Luo, S.; Huo, H. TiO2@h-CeO2: a composite yolk–shell microsphere with enhanced photodegradation activity. Catal. Sci. Technol. 2016, 6, 6396–6405. [Google Scholar] [CrossRef]
- Yao, H.; Wang, Y.; Luo, G. A Size-Controllable Precipitation Method to Prepare CeO2 Nanoparticles in a Membrane Dispersion Microreactor. Ind. Eng. Chem. Res. 2017, 56, 4993–4999. [Google Scholar] [CrossRef]
- Balakrishnan, A.; Gopalram, K.; Appunni, S. Photocatalytic degradation of 2,4-dicholorophenoxyacetic acid by TiO2 modified catalyst: kinetics and operating cost analysis. [CrossRef]
- Ebrahimi, R.; Mohammadi, M.; Maleki, A.; Jafari, A.; Shahmoradi, B.; Rezaee, R.; Safari, M.; Daraei, H.; Giahi, O.; Yetilmezsoy, K.; Harikaranahalli, S. Photocatalytic Degradation of 2,4-Dichlorophenoxyacetic Acid in Aqueous Solution Using Mn-doped ZnO/Graphene Nanocomposite Under LED Radiation. Journal of Inorganic and Organometallic Polymers and Materials 2021, 30, 33331–33343. Available online: https://link.springer.com/article/10.1007/s10904-019-01280-3. [CrossRef]
- Darvishi Cheshmeh Soltani, R.; Khataee, A.; Mashayekhi, M.; Safari, M. Photocatalysis of formaldehyde in the aqueous phase over ZnO/diatomite nanocomposite. Turkish Journal, Chemistry 2016, 40, 402–411. [Google Scholar] [CrossRef]
- Marizcal, A.; Limón-Rocha, A.; Barrera, A.; Casillas, J.; González-Vargas, O.; Rico, J.; Martinez-Gómez, C.; Pérez-Larios, A. TiO2-La2O3 as photocatalysts in the degradation of naproxen. Inorganics 2022, 10(5), 67. [Google Scholar] [CrossRef]
- Panahi, A.; Monsef, R.; Imran, M. K.; Mahdi, A. A.; Kadhim Ruhaima, A. A.; Salavati-Niasari, M. TMVO4/FE2O3 nanocomposites: Sonochemical synthesis, characterization, and investigation of photocatalytic activity. International Journal of Hydrogen Energy 2023, 48, 3916–3930. [Google Scholar] [CrossRef]
- Karimipour, Z.; Jalilzadeh, R.; Haghighatzadeh, A.; Kazem, M.; Mohammadi, M. Rouzbahani4Photocatalytic Degradation of 2,4-Dichlorophenoxyacetic Acid Using Fe2O3/CeO2/Ag Composite Nanoparticles under Ultraviolet Irradiation, 9, (2021), 191-200. [CrossRef]
- Mkhalid, I.A. Photocatalytic degradation of herbicides under visible light using Pd-WO3 nanorods. Ceramics International 2016, 42, 15975–15980. [Google Scholar] [CrossRef]
- Sultana, S.; Mansingh, S.; Parida, K. Crystal facet and surface defect engineered low dimensional CeO2 (0D, 1D, 2D) based photocatalytic materials towards energy generation and pollution abatement. Mater. Adv. 2021, 2, 6942–6983. [Google Scholar] [CrossRef]
- Sa, S.; Nagashreeb, K.; Maiyalaganc, T.; Keerthiga, G. Photocatalytic degradation of 2,4-dichlorophenoxyacetic acid – A comparative study in hydrothermal TiO2 and commercial TiO2. Applied Surface Science 2018, 449, 371–379. [Google Scholar] [CrossRef]
- Reguero, G.; Lunagómez, M.; Cervantes-Uribe, A.; del Angel, G.; Rangel, I.; Torres-Torres, J.; González, F.; Godavarthi, S.; Arevalo-Perez, J.; Espinosa de los Monteros, A.; Silahua-Pavon, A. Photodegradation of 2,4-D (dichlorophenoxyacetic acid) with Rh/TiO2; comparative study with other noble metals (Ru, Pt, and Au). RSC Adv. 2022, 12, 25711–25721. [Google Scholar] [CrossRef]
- Mueen, R.; Morlando, A.; Qutaish, H.; Lerch, M.; Cheng, Z.; Konstantinov, K. ZnO/CeO2 nanocomposite with low photocatalytic activity as efficient UV filters. Journal of material Science 2020, 55, 6834–6847. [Google Scholar] [CrossRef]
- Althubiti, N.; Taha, T.; Azab, A.; Abdelhamid, H. ZnO-based nanocomposites for hydrogen generation via hydrolysis of Borohydride. Journal of Sol-Gel Science and Technology 2023, 106, 837–846. [Google Scholar] [CrossRef]
- Laguna, O.; Centeno, M.; Romero-Sarria, F.; Odriozola, J. Oxidation of CO over gold supported on Zn-modified ceria catalysts. Catalysis Today 2011, 172, 118–123. [Google Scholar] [CrossRef]
- Rashid, J.; Ahsan, A.; Xu, M.; Savina, I.; Rehman, F. Synthesis of cerium oxide embedded perovskite type bismuth ferrite nanocomposites for sonophotocatalysis of aqueous micropollutant ibuprofen. RSC Adv. 2023, 13, 2574–2586. [Google Scholar] [CrossRef] [PubMed]
- Najihah, S.; Hilni, M.; Ling-Tan, A.; Mansoob, M. Green-synthesized CeO2 nanoparticles for photocatalytic, antimicrobial, antioxidant and cytotoxicity activities. J. Mater. Chem. B 2021, 9, 5599–5620. [Google Scholar] [CrossRef]
- Hassnain, G.; Imrana, A.; Bahc, M.; Ali, A.; Bhatti, A.; Saeed, U.; Ismat, S. Identification and quantification of oxygen vacancies in CeO2 nanocrystals and their role in formation of F-centers. Applied Surface Science 396(2017), 547–553. [CrossRef]
- Salazar-Marín, a; Oza, G.; Díaz Real, J.; Cervantes-Uribe, A.; Pérez-Vidal, H.; Kesarla, M.; Torres, J.; Godavarthi, S. Distinguishing between type II and S-scheme heterojunction materials: A comprehensive review. Applied Surface Science Advances 2024, 19, 100536. [Google Scholar] [CrossRef]
- Wang; Ni, H.; Dai, J.; Liu, T.; Wu, Z.; Chen, X.; Dong, Z.; Qian, J.; Wu, Z. Comparison of highly active Type-I and Type-II heterojunction photocatalytic composites synthesized by electrospinning for humic acid degradation. Chemical Physics Letters 2022, 803, 139815. [Google Scholar] [CrossRef]
- Mishraa, S.; Sorena, S.; Debnathc, A.; Aswalc, D.; Dasb, N.; Parhi, P. Rapid microwave – Hydrothermal synthesis of CeO2 nanoparticles for simultaneous adsorption/photodegradation of organic dyes under visible light. Optik - International Journal for Light and Electron Optics 2018, 169, 125–136. [Google Scholar] [CrossRef]
- Saravanana, R.; Agarwalb, Sh.; Kumar Guptab, V.; Mansoob, M.; Gracia, F.; Mosquera, E.; Narayanan, V.; Stephen, A. Line defect Ce3+ induced Ag/CeO2/ZnO nanostructure for visible-light photocatalytic activity. J. of Photochem. and Photobiology A: Chem. 2018, 353, 499–506. [Google Scholar] [CrossRef]
Figure 1.
X-ray patterns of catalysts CZ0, CZ0.5, CZ1.5 and CZ2.5.
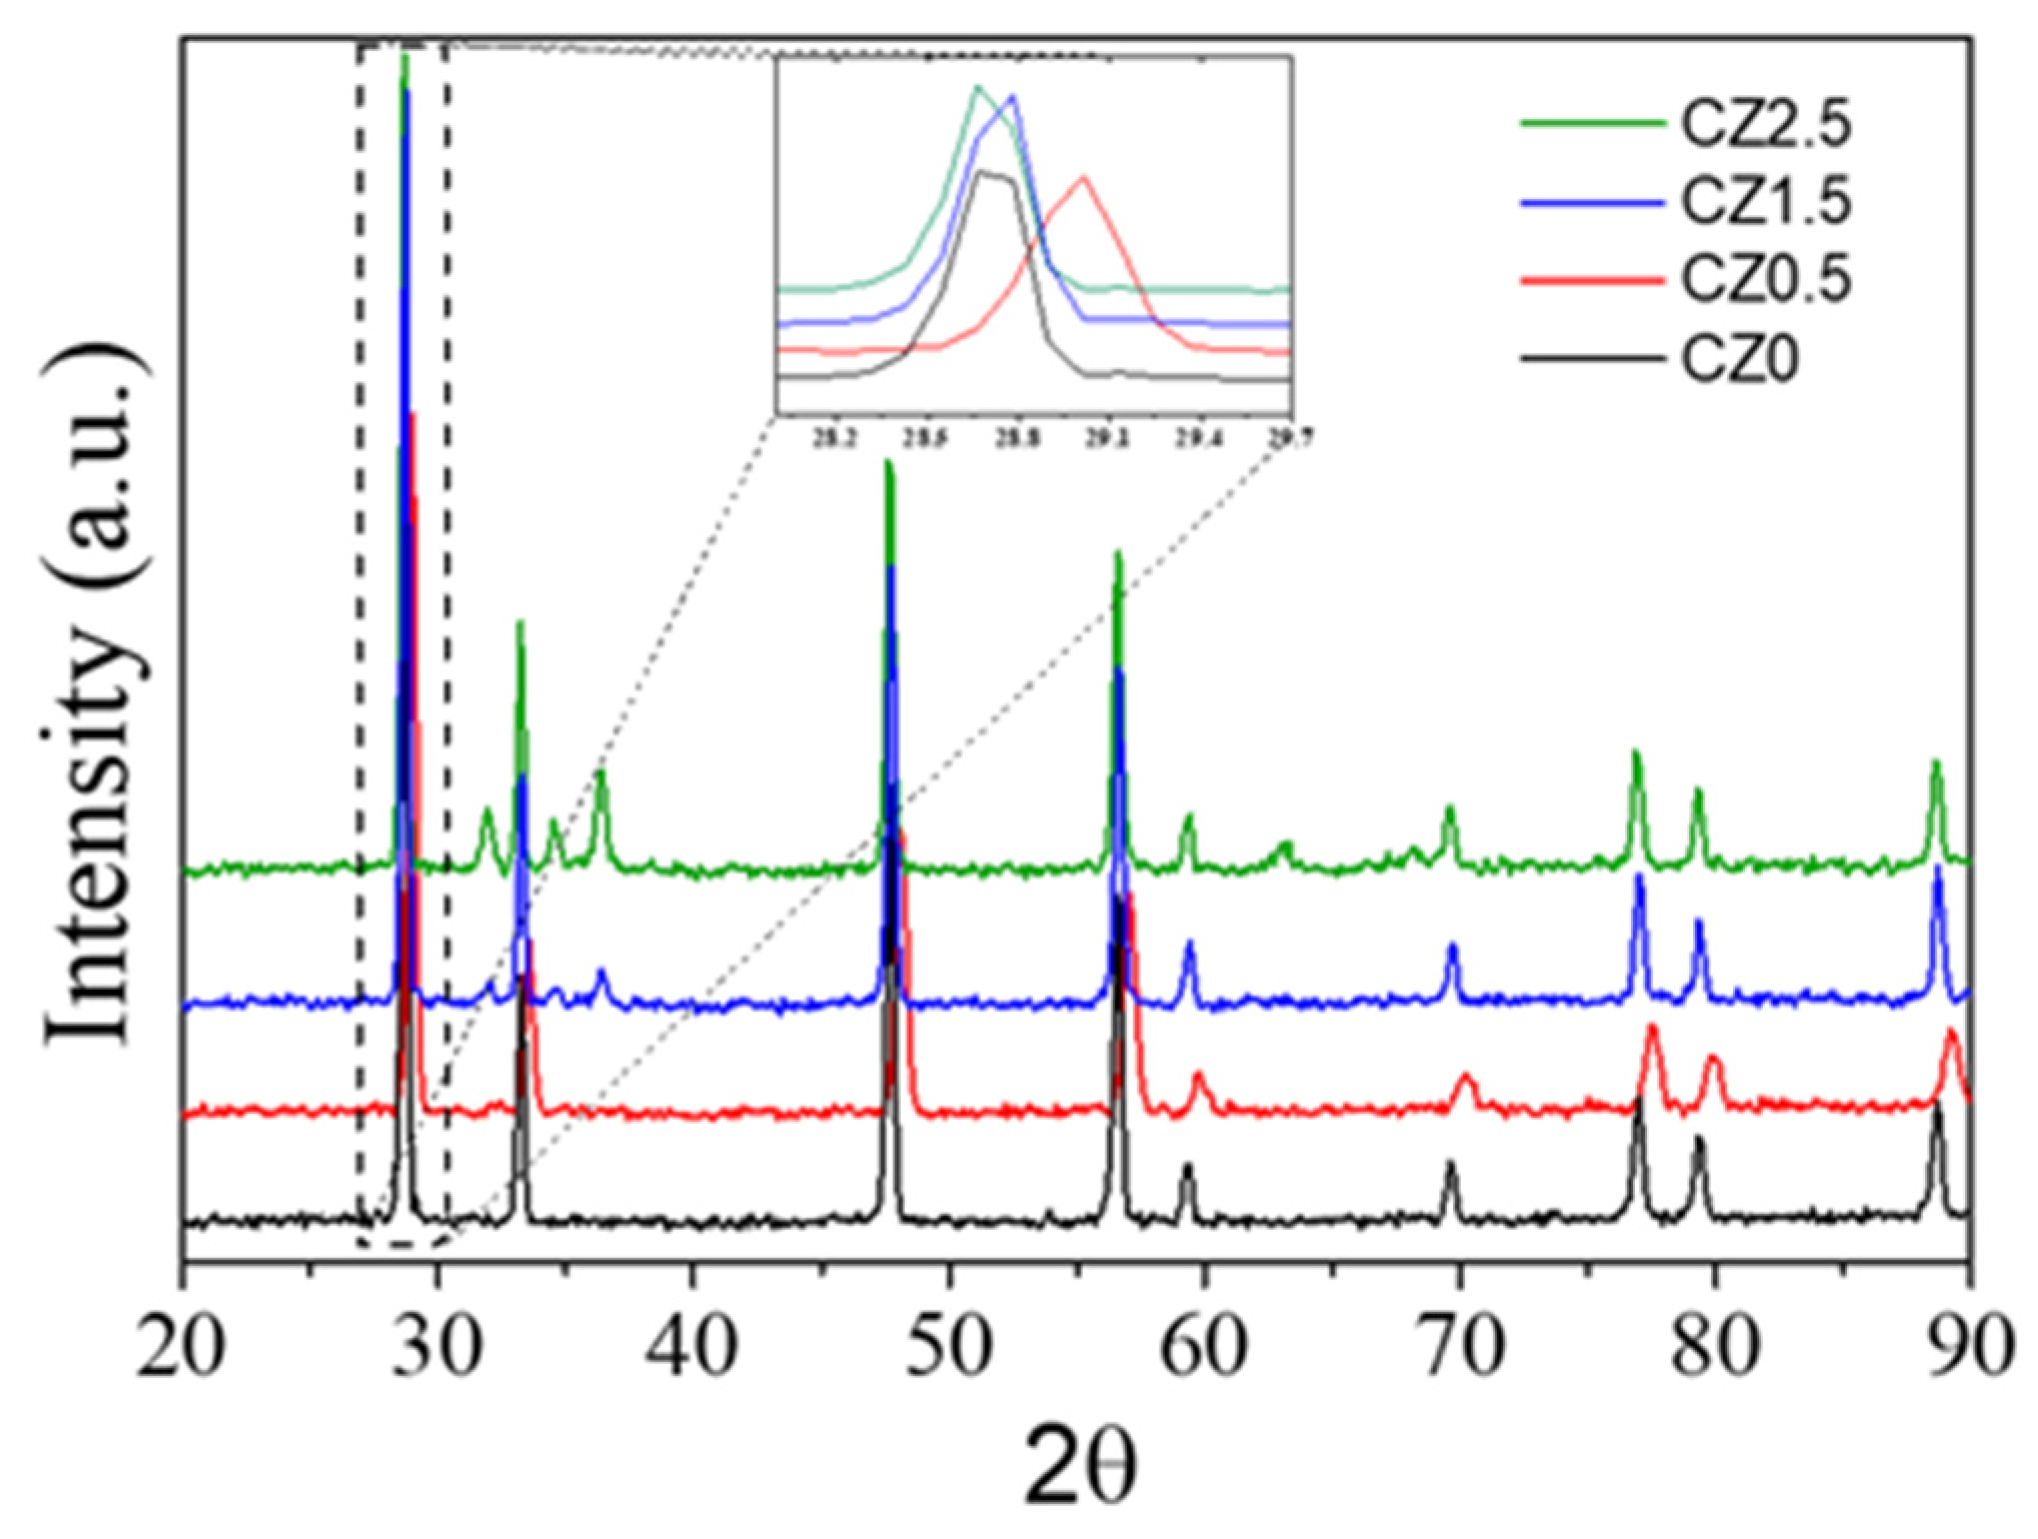
Figure 2.
Adsorption-Desorption isotherms for catalysts CZ0, CZ0.5, CZ1.5 and CZ2.5.
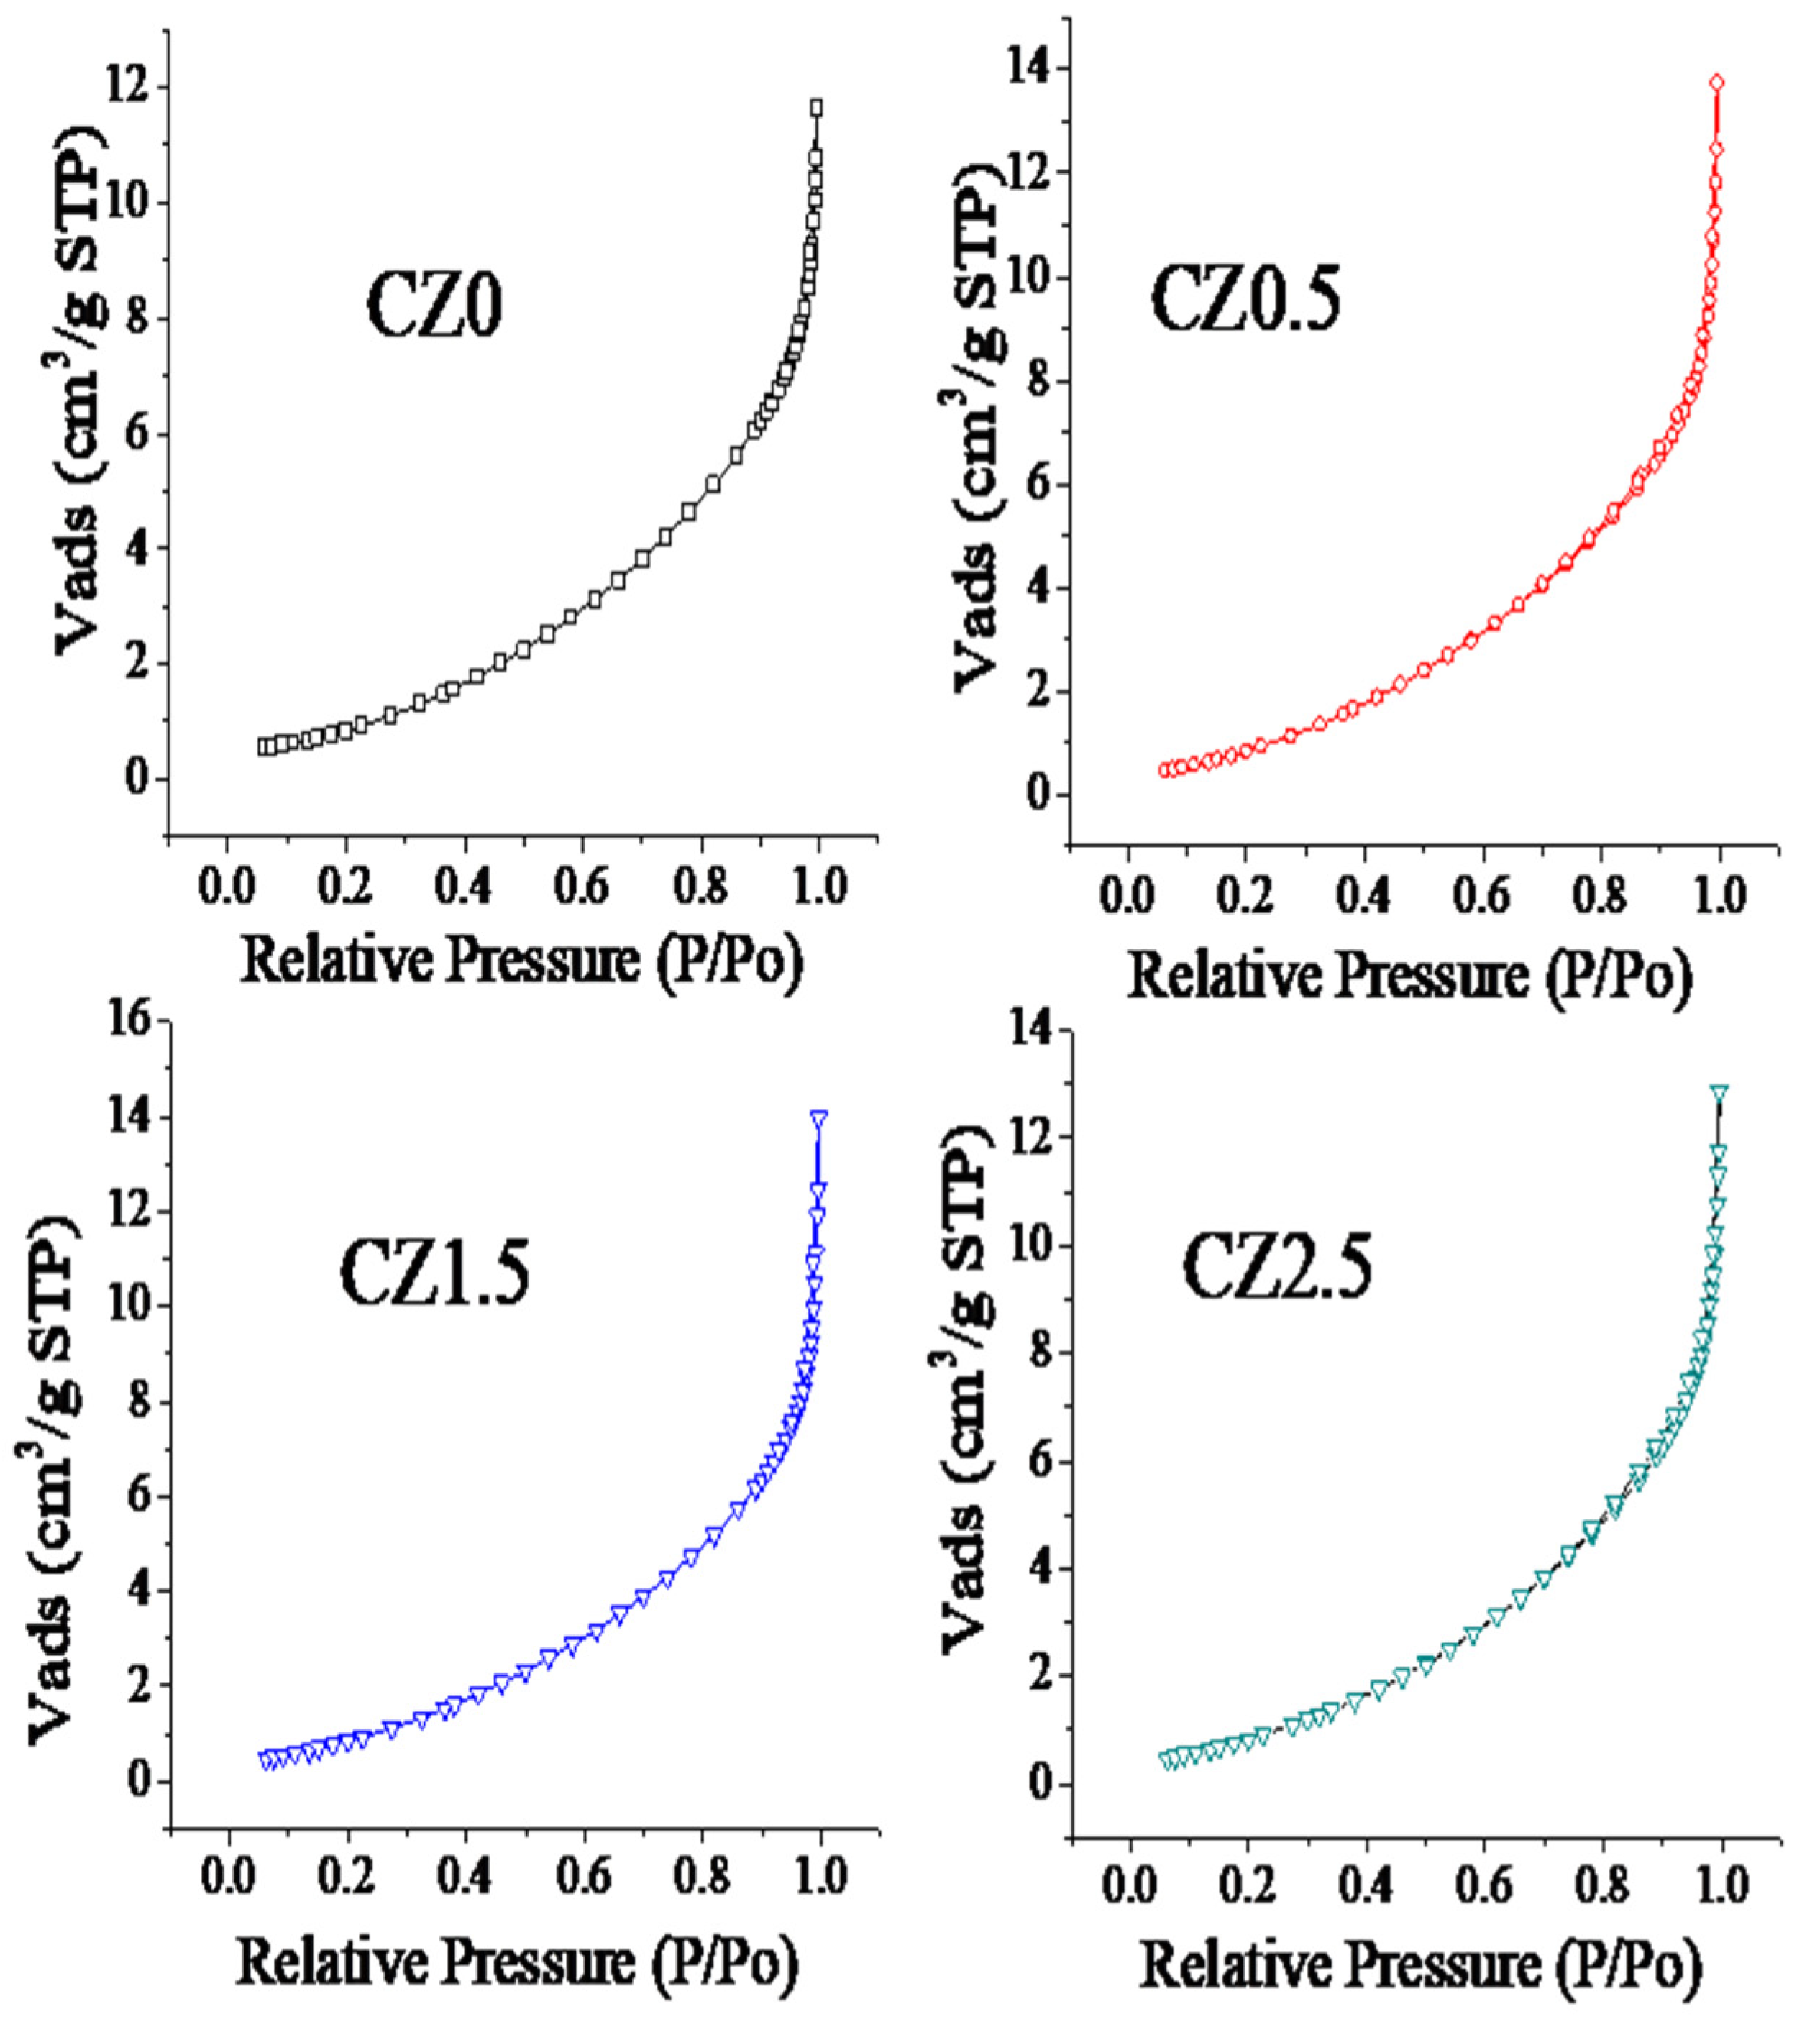
Figure 3.
SEM/EDX analysis of catalysts CZ0, CZ0.5, CZ1.5 and CZ2.5.
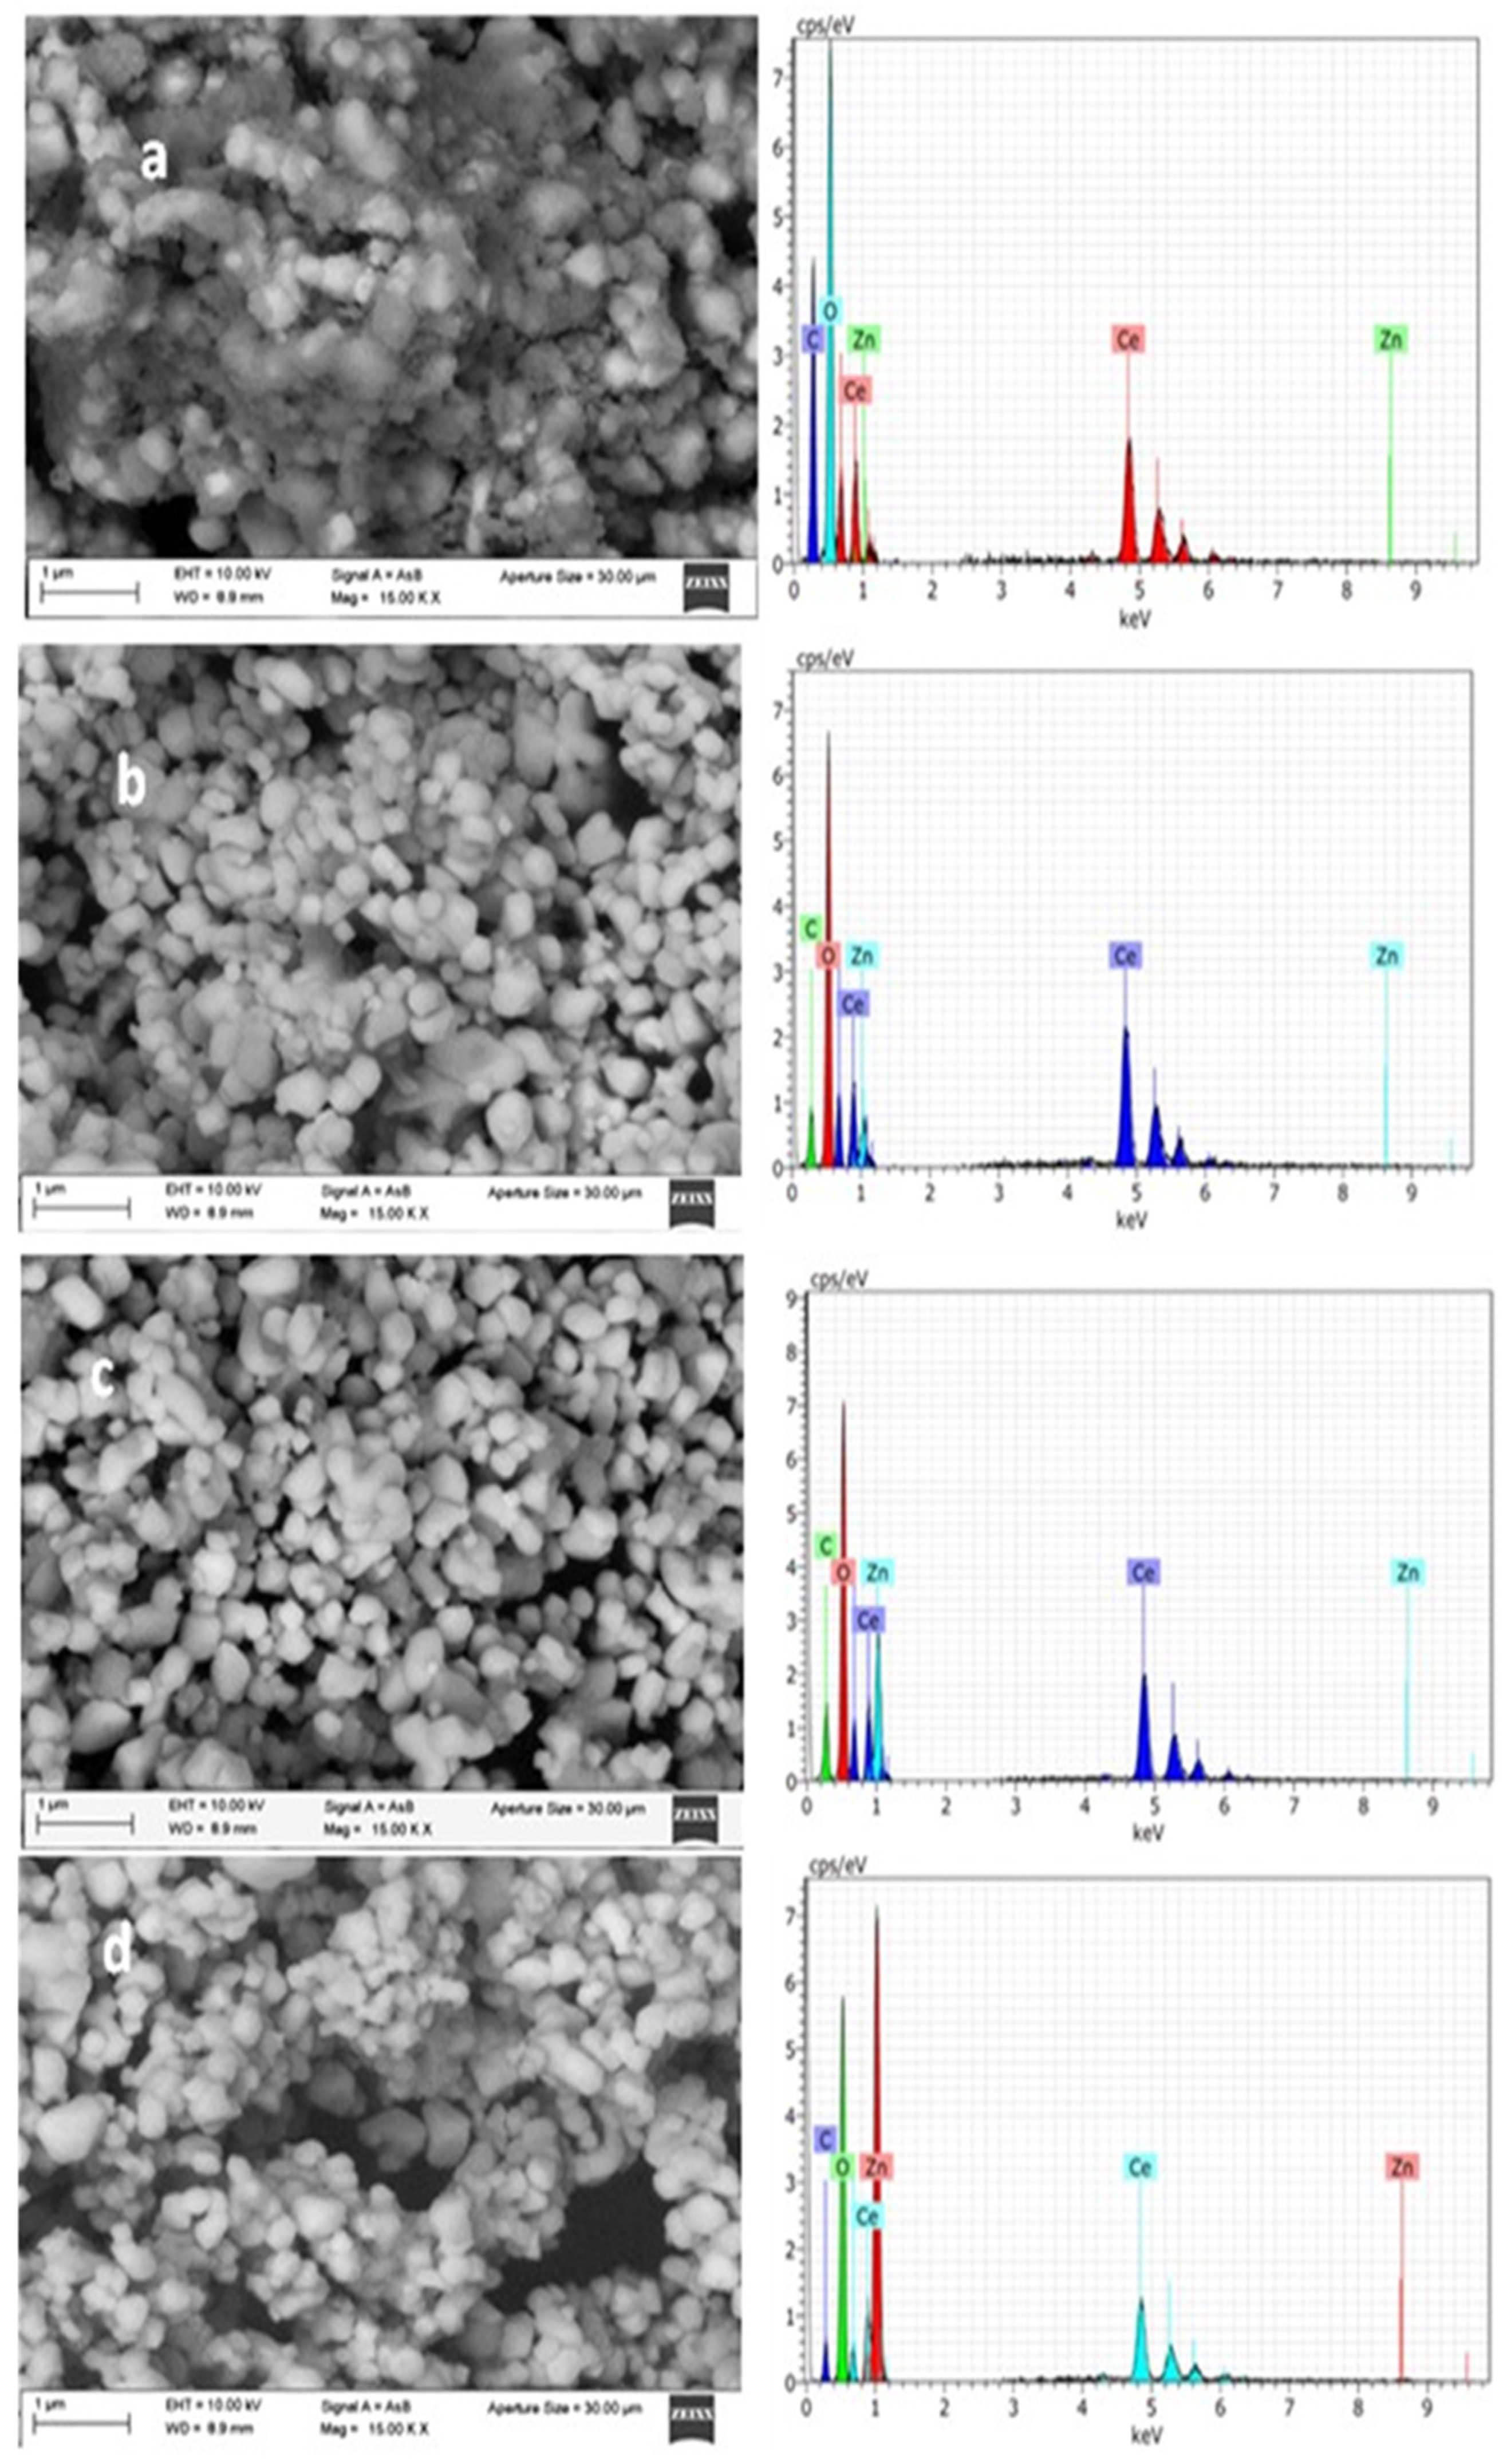
Figure 4.
Spectra survey XPS of photocatalysts CZ0, CZ0.5, CZ1.5 y CZ2.5.
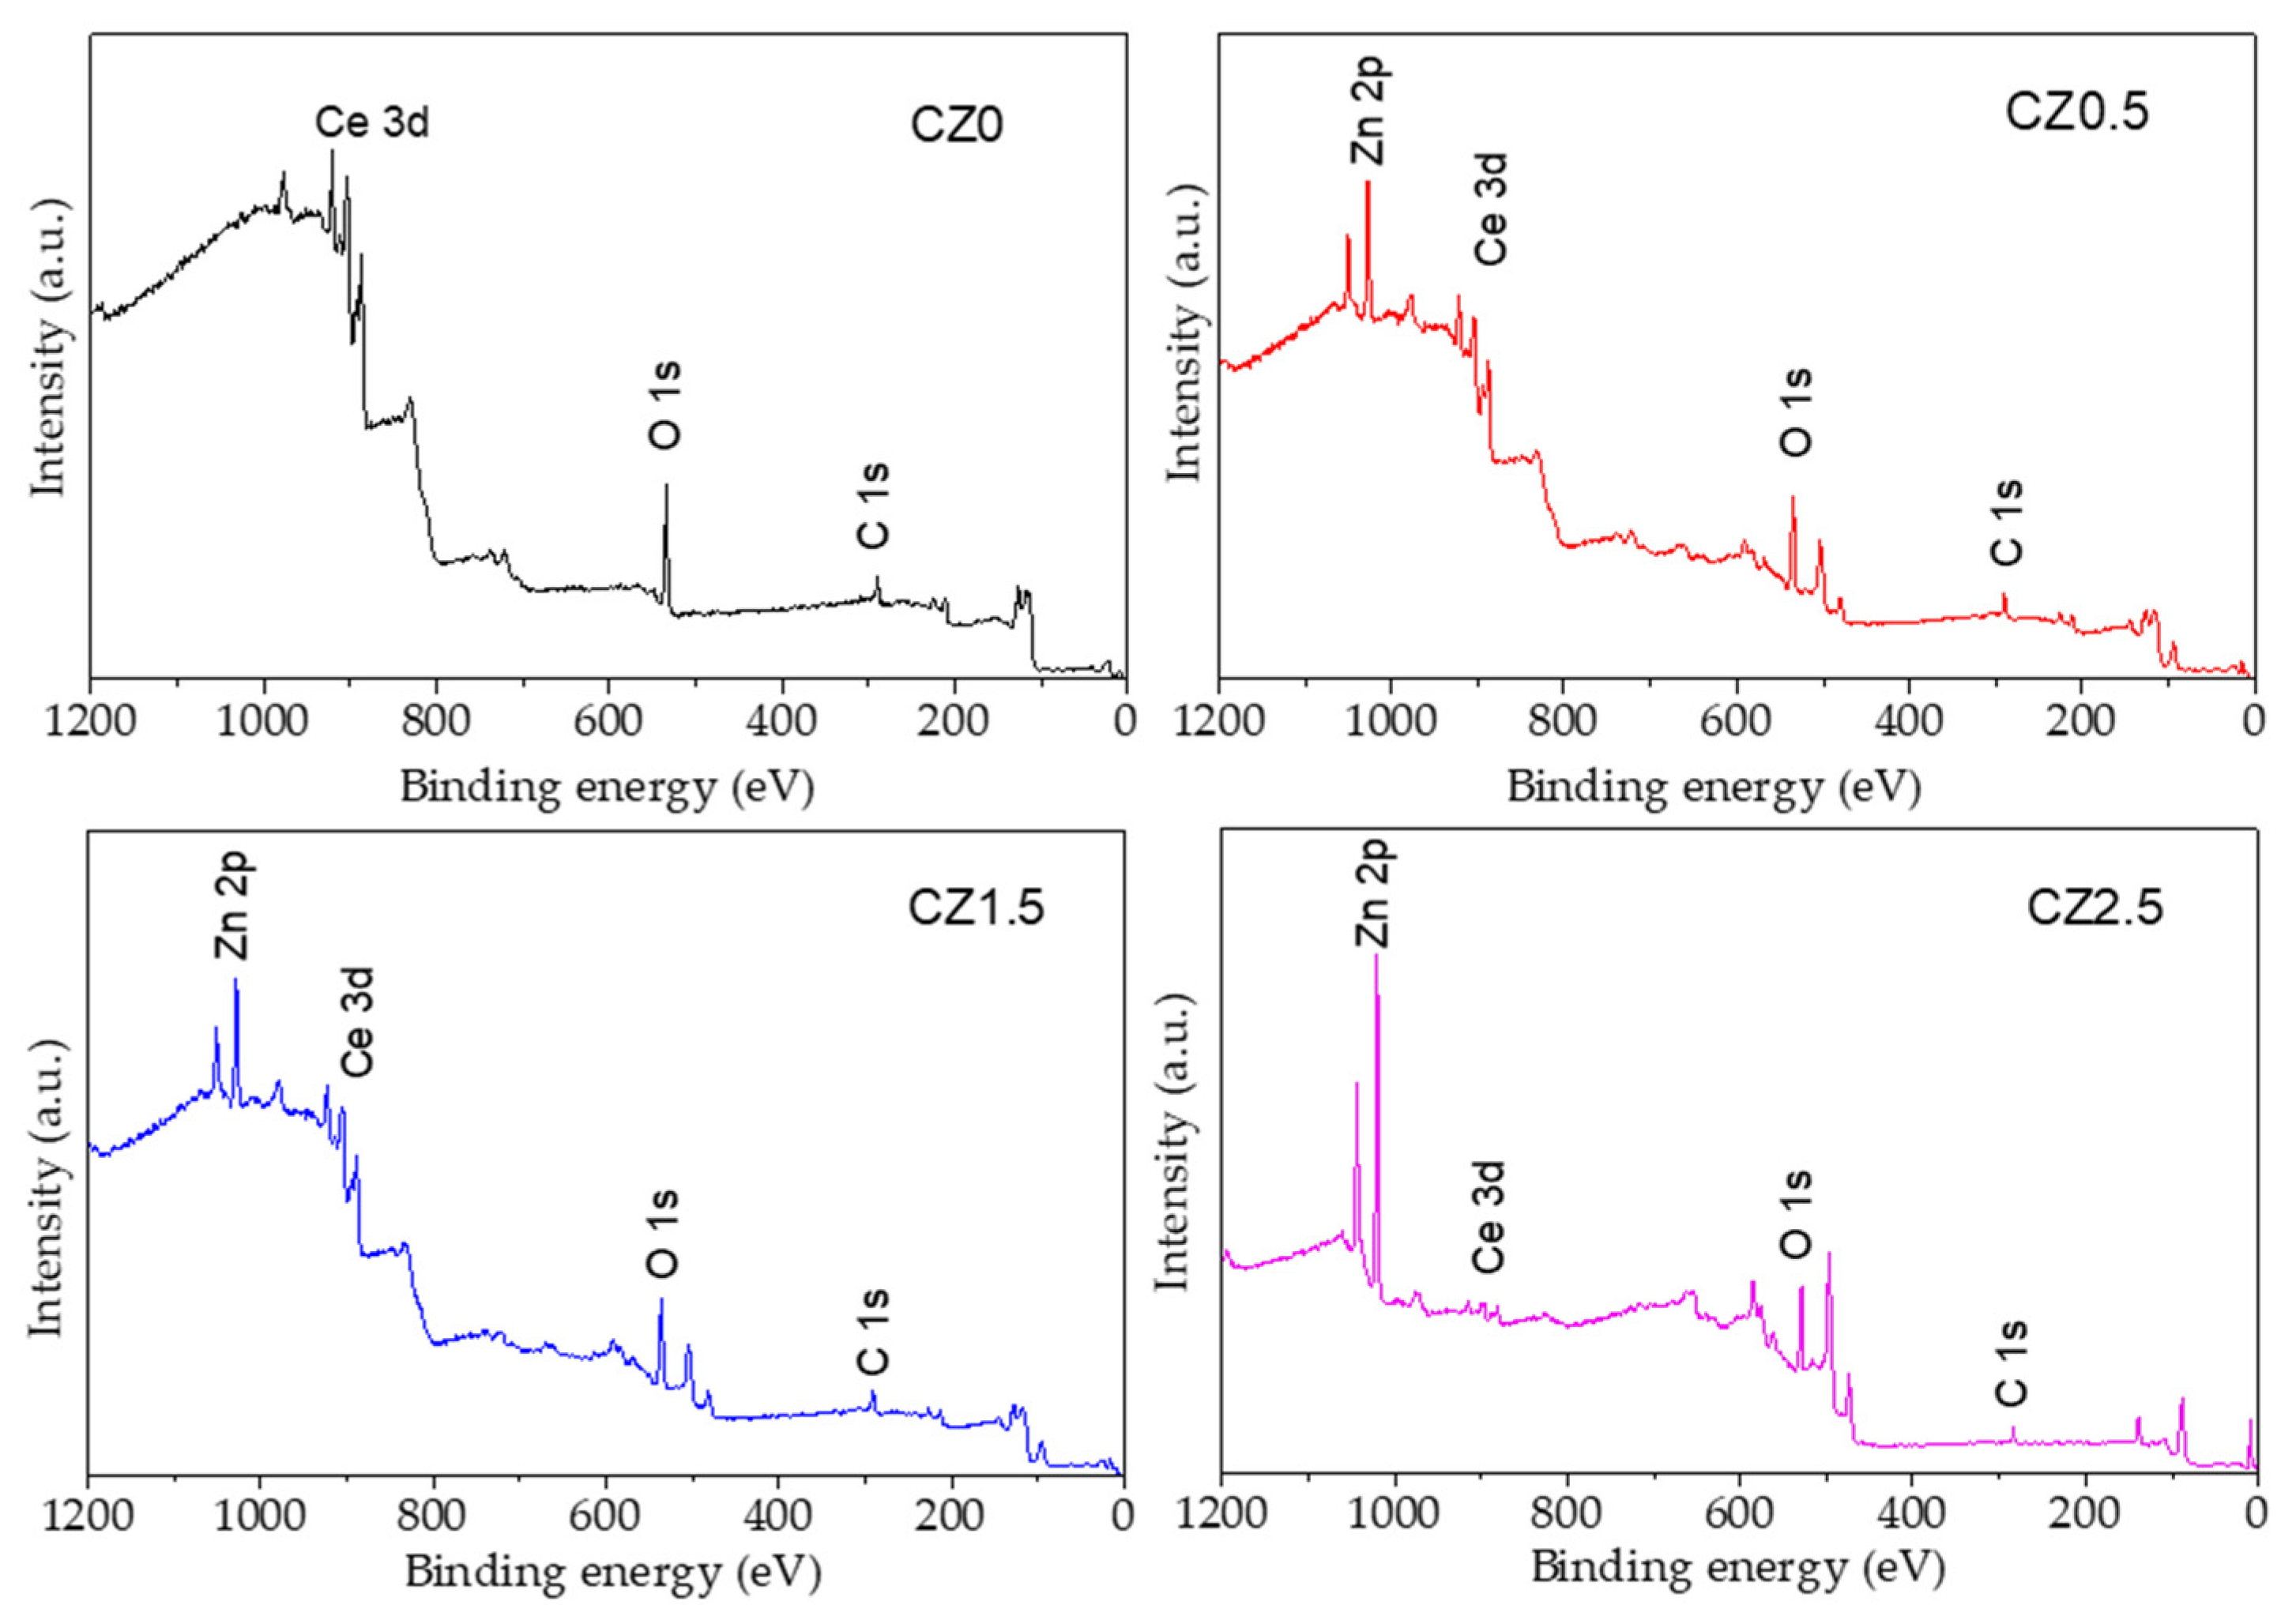
Figure 5.
High-resolution spin-orbit doublet spectra of Ce 3d (Ce 3d5/2 and Ce 3d3/2) by the photocatalysts CZ0, CZ0.5, CZ1.5 y CZ2.5.
Figure 5.
High-resolution spin-orbit doublet spectra of Ce 3d (Ce 3d5/2 and Ce 3d3/2) by the photocatalysts CZ0, CZ0.5, CZ1.5 y CZ2.5.
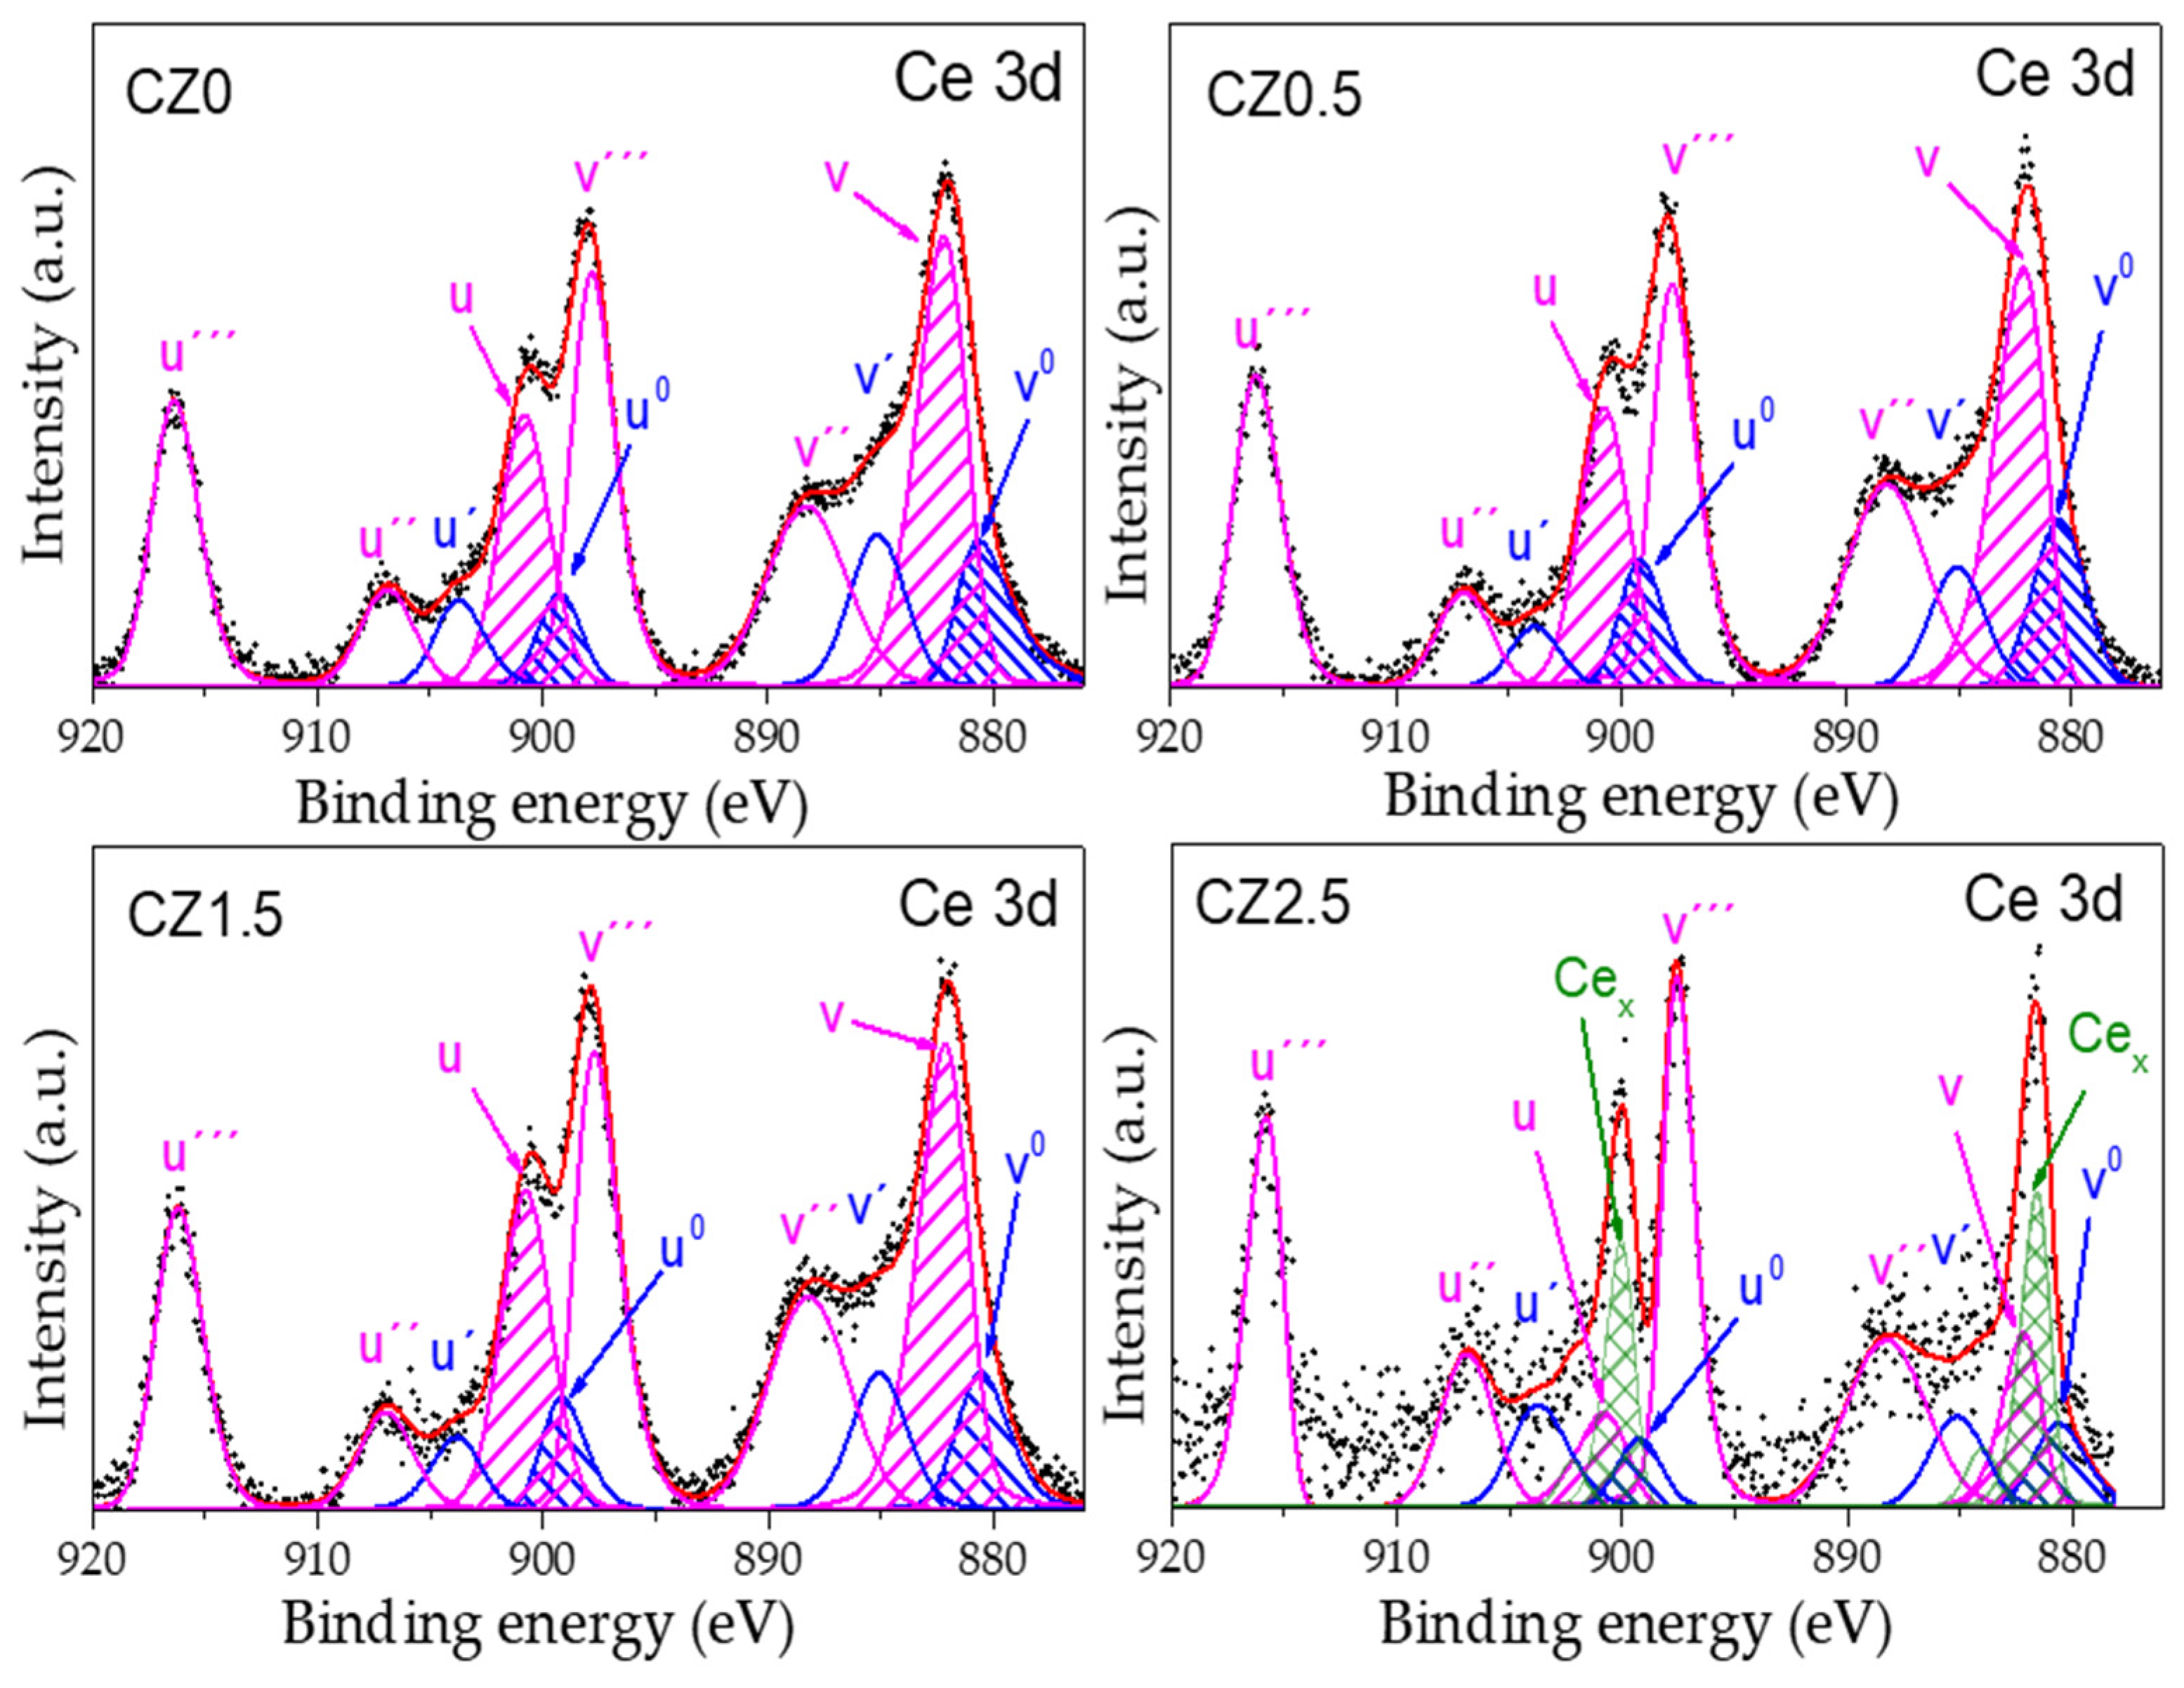
Figure 6.
High-resolution spectra for Zn2p of the catalysts CZ0, CZ0.5, CZ1.5 y CZ2.5.
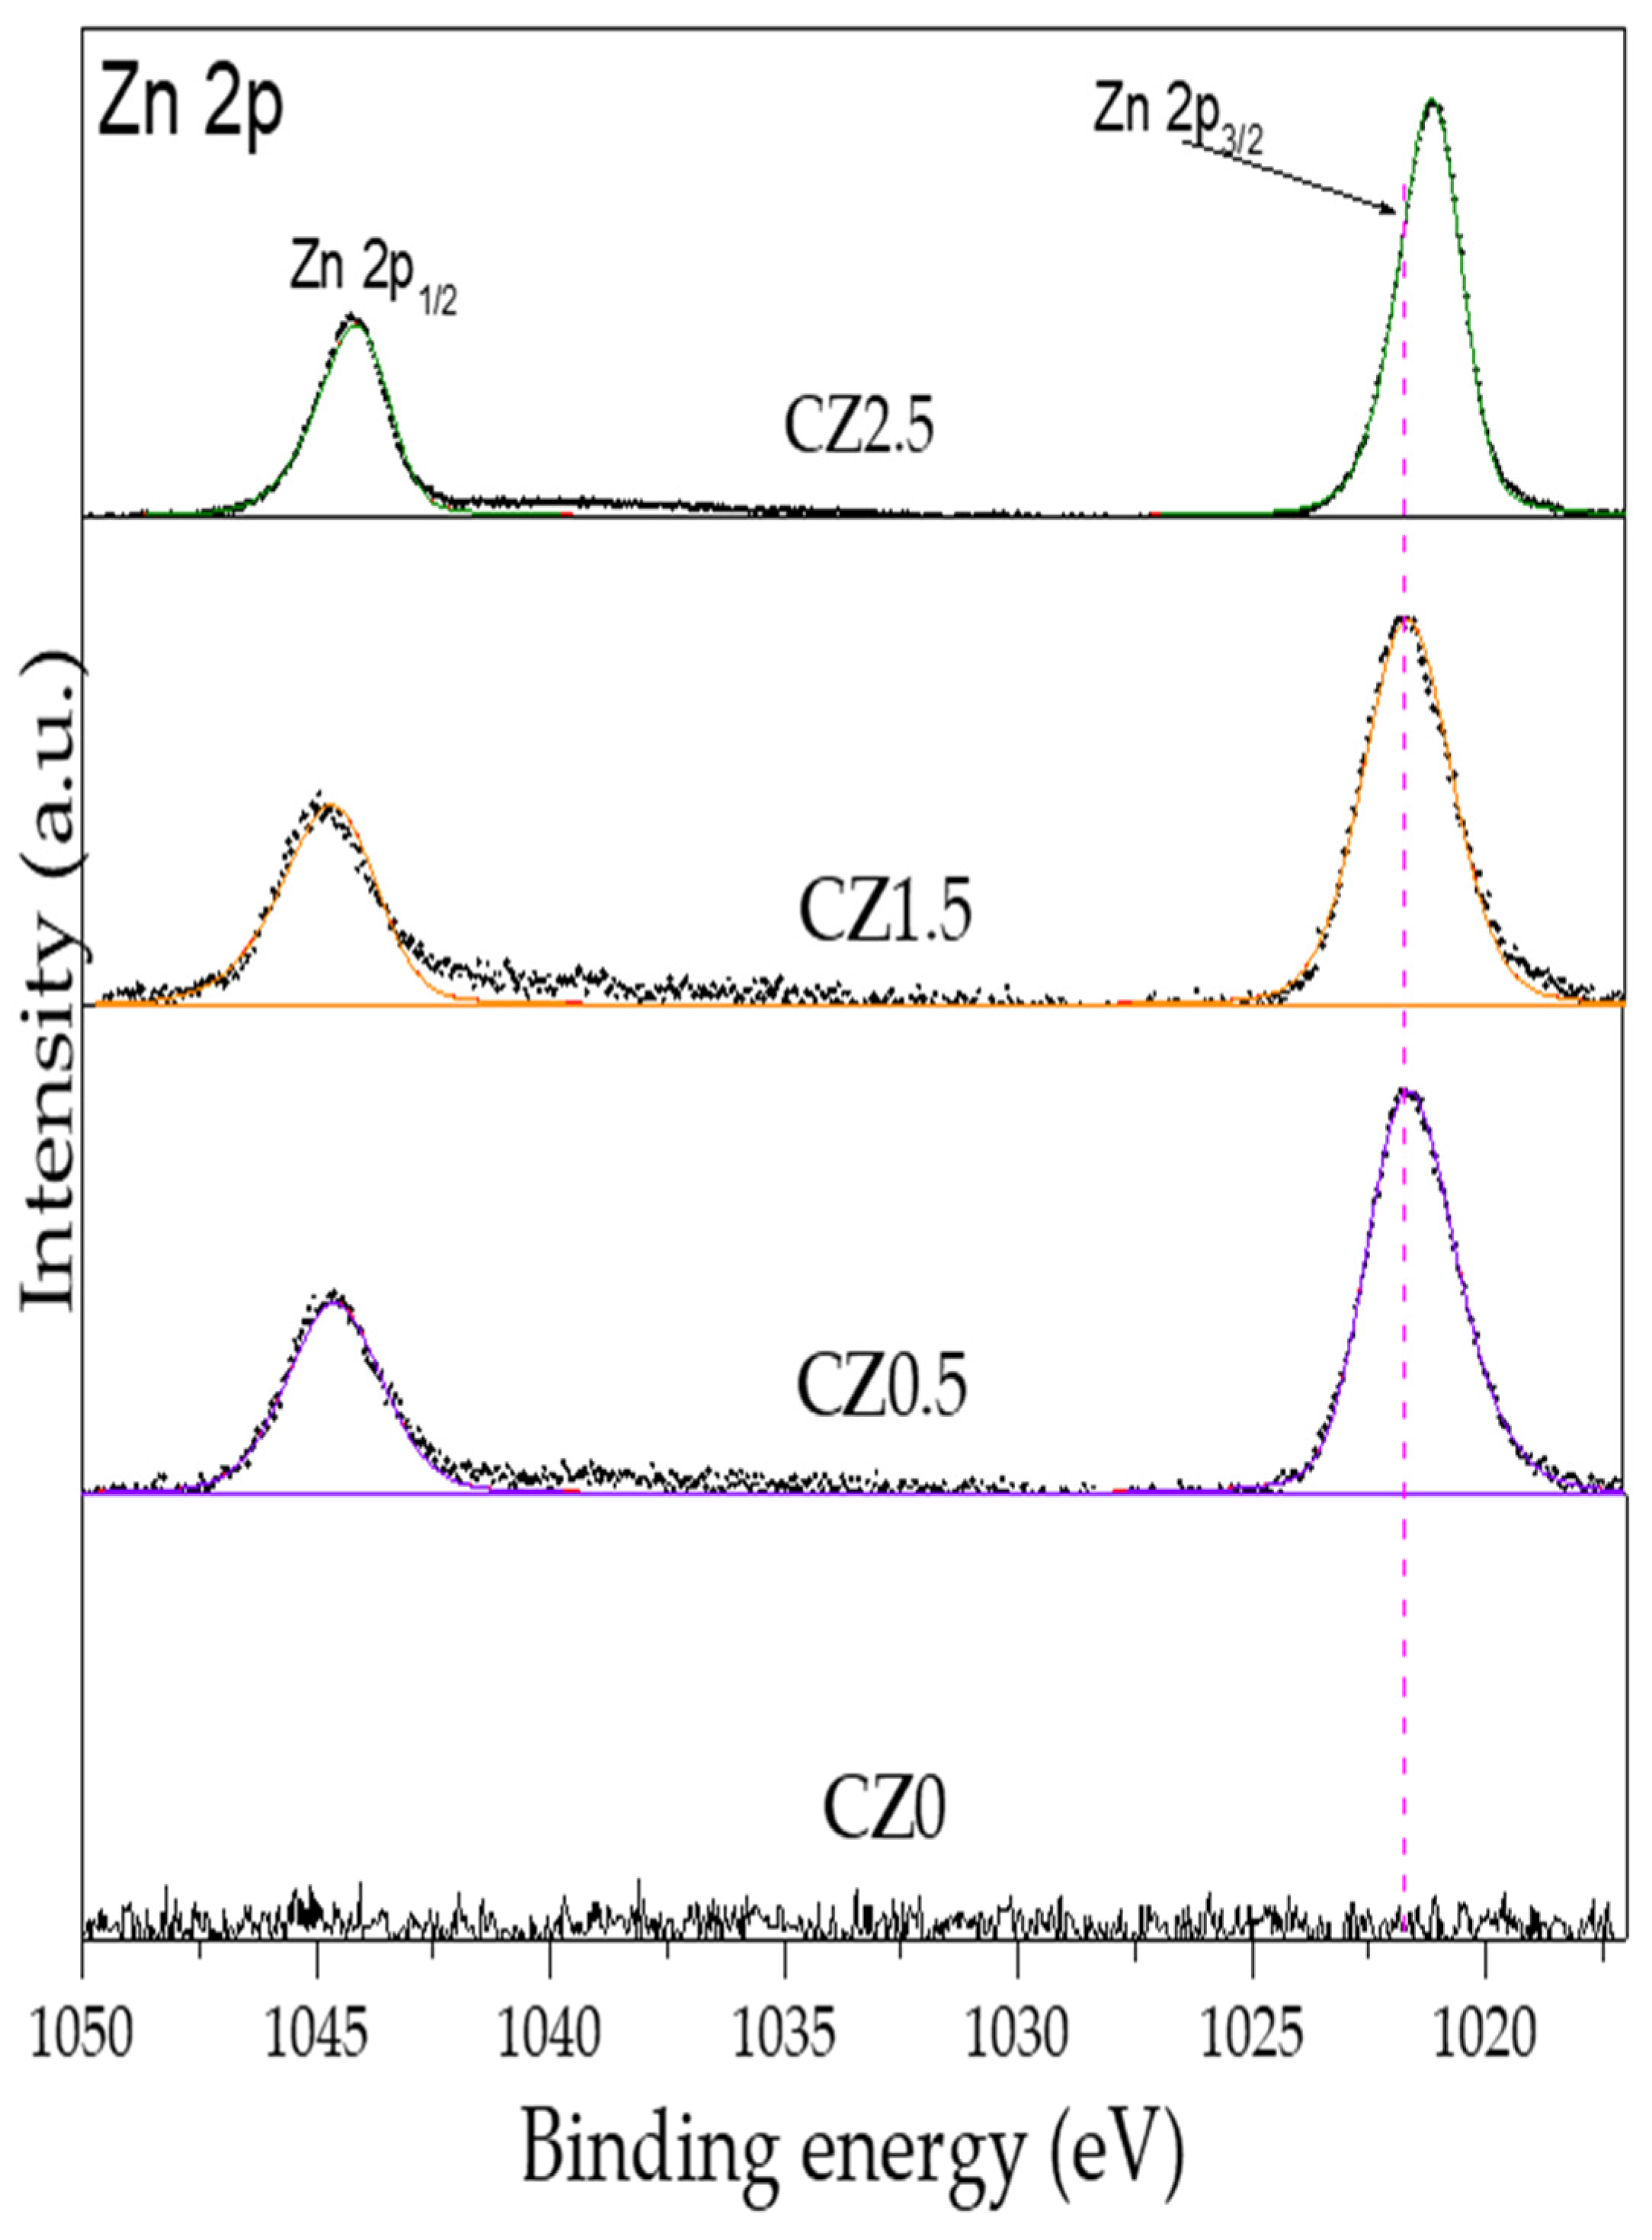
Figure 7.
High-resolution spectrum of O1s of materials CZ0, CZ0.5, CZ1 y CZ2.5.
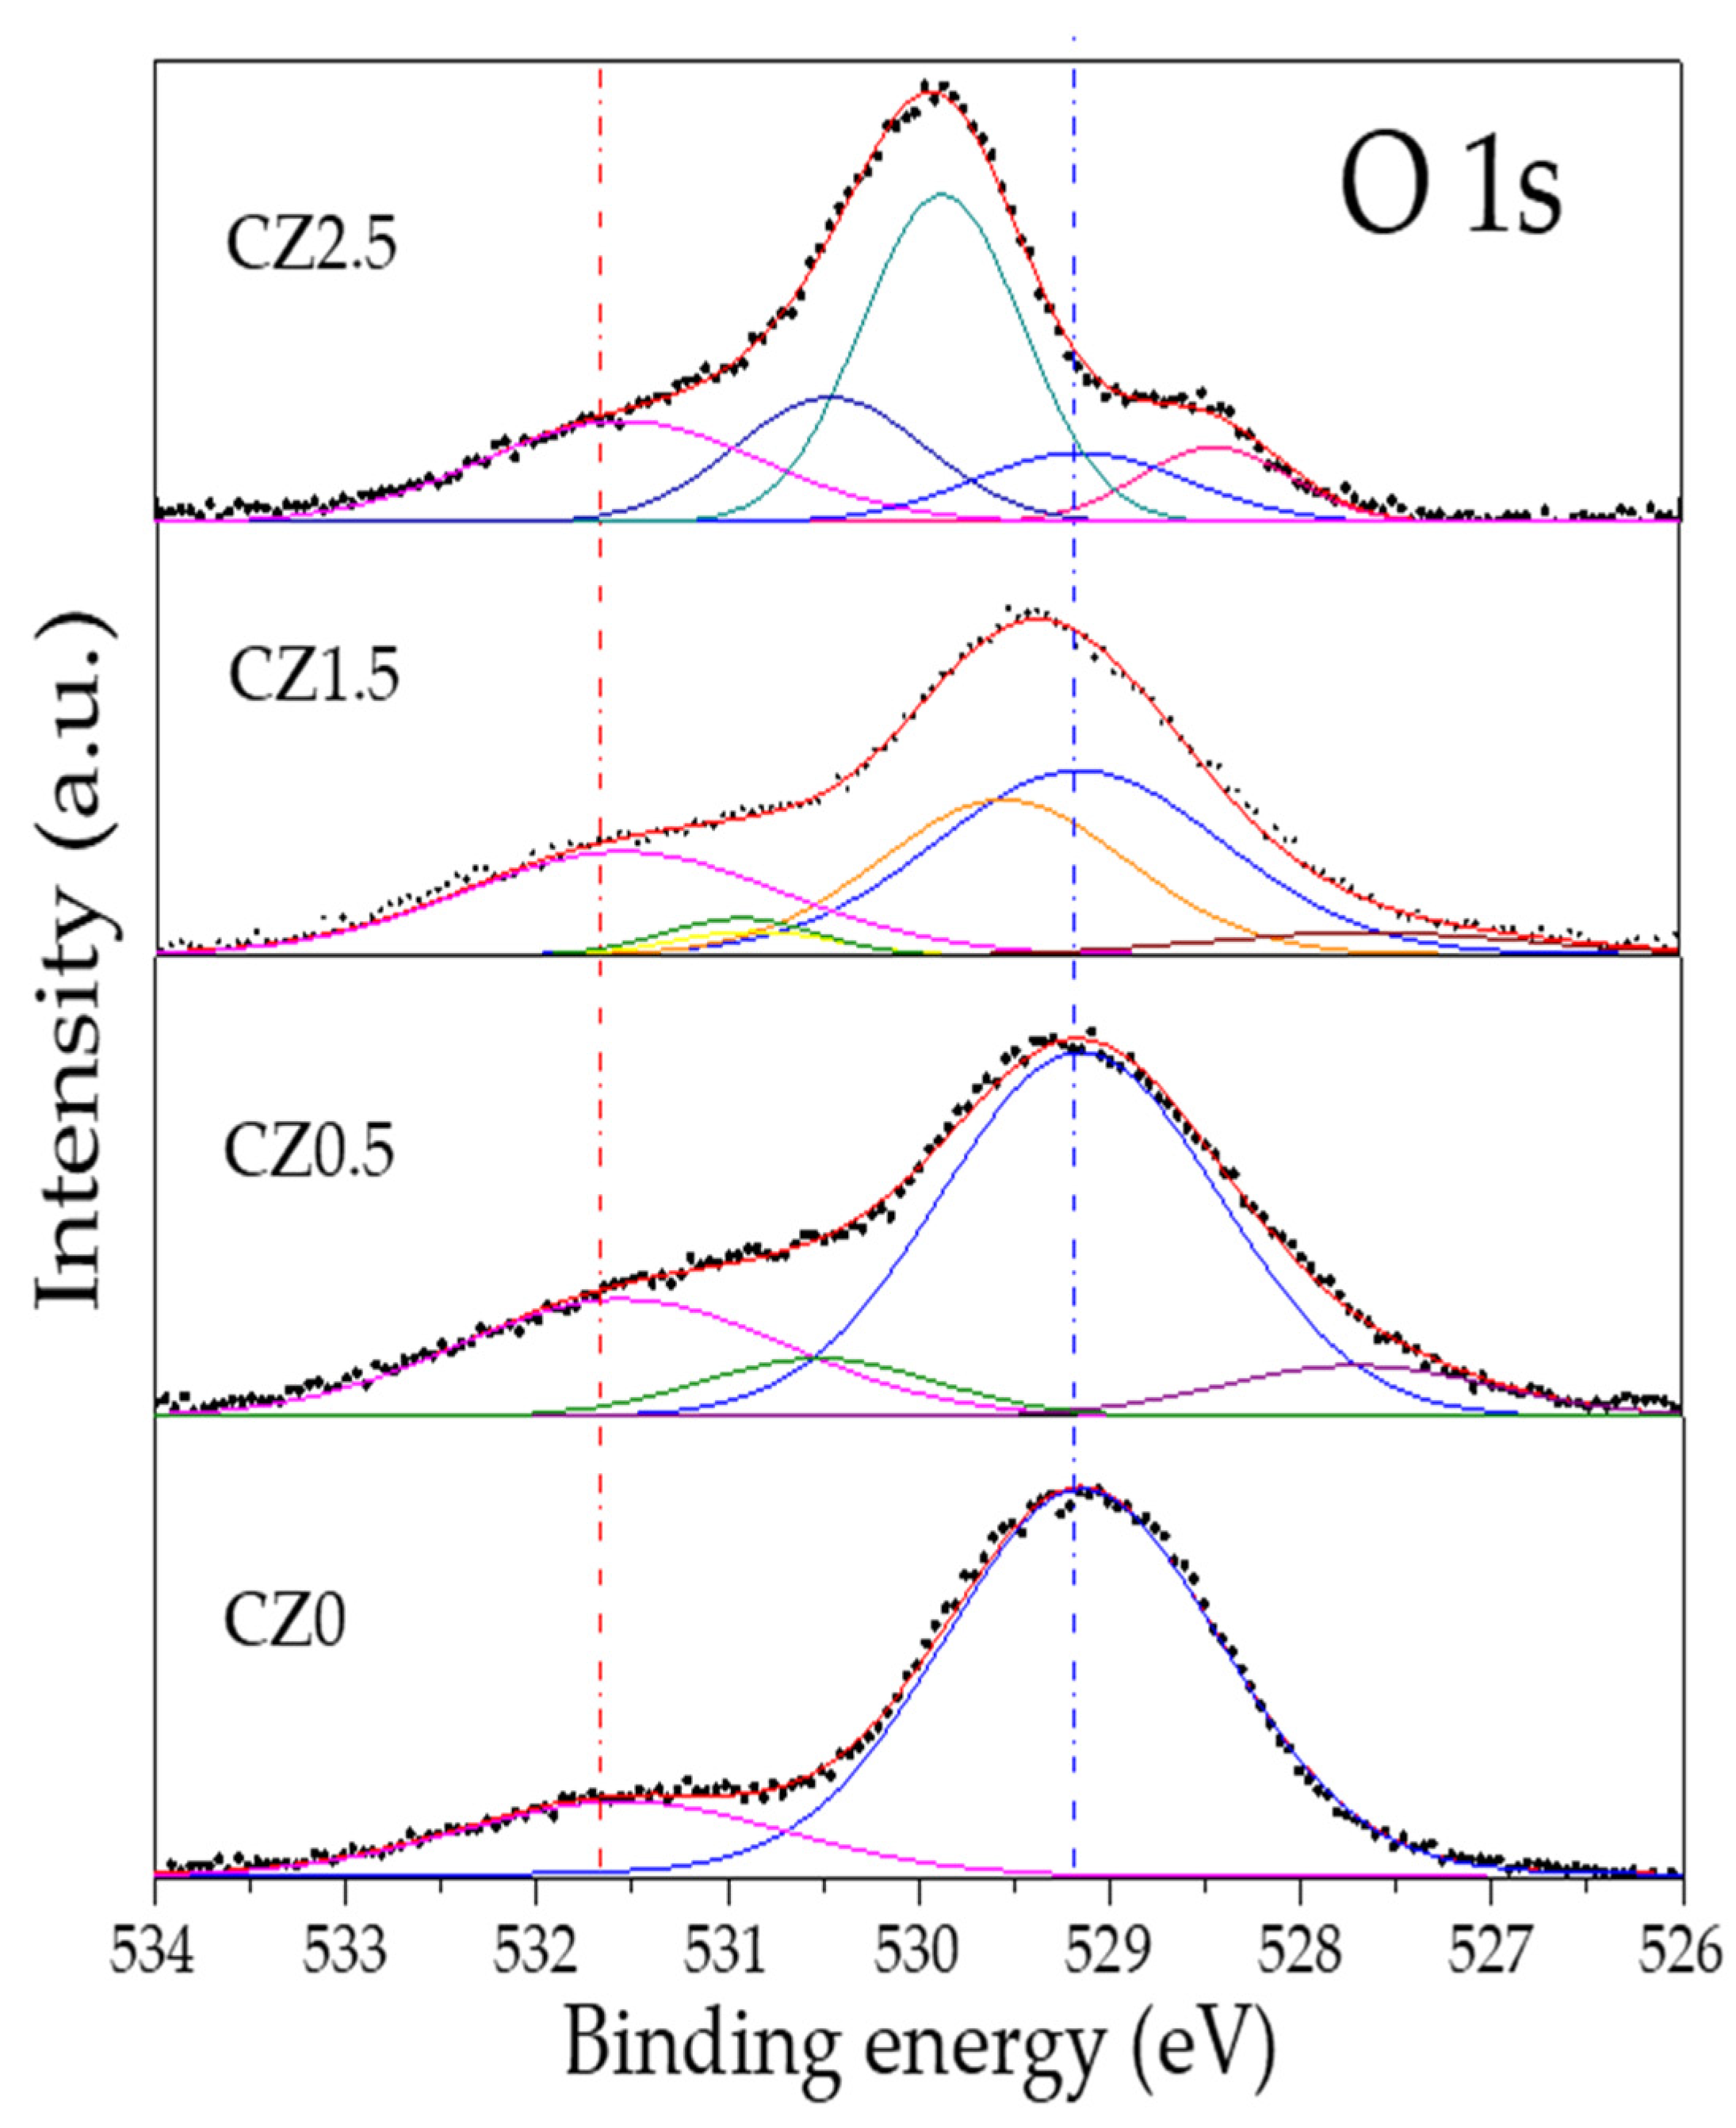
Figure 8.
UV spectra for catalysts CZ0, CZ0.5, CZ1.5 and CZ2.5.
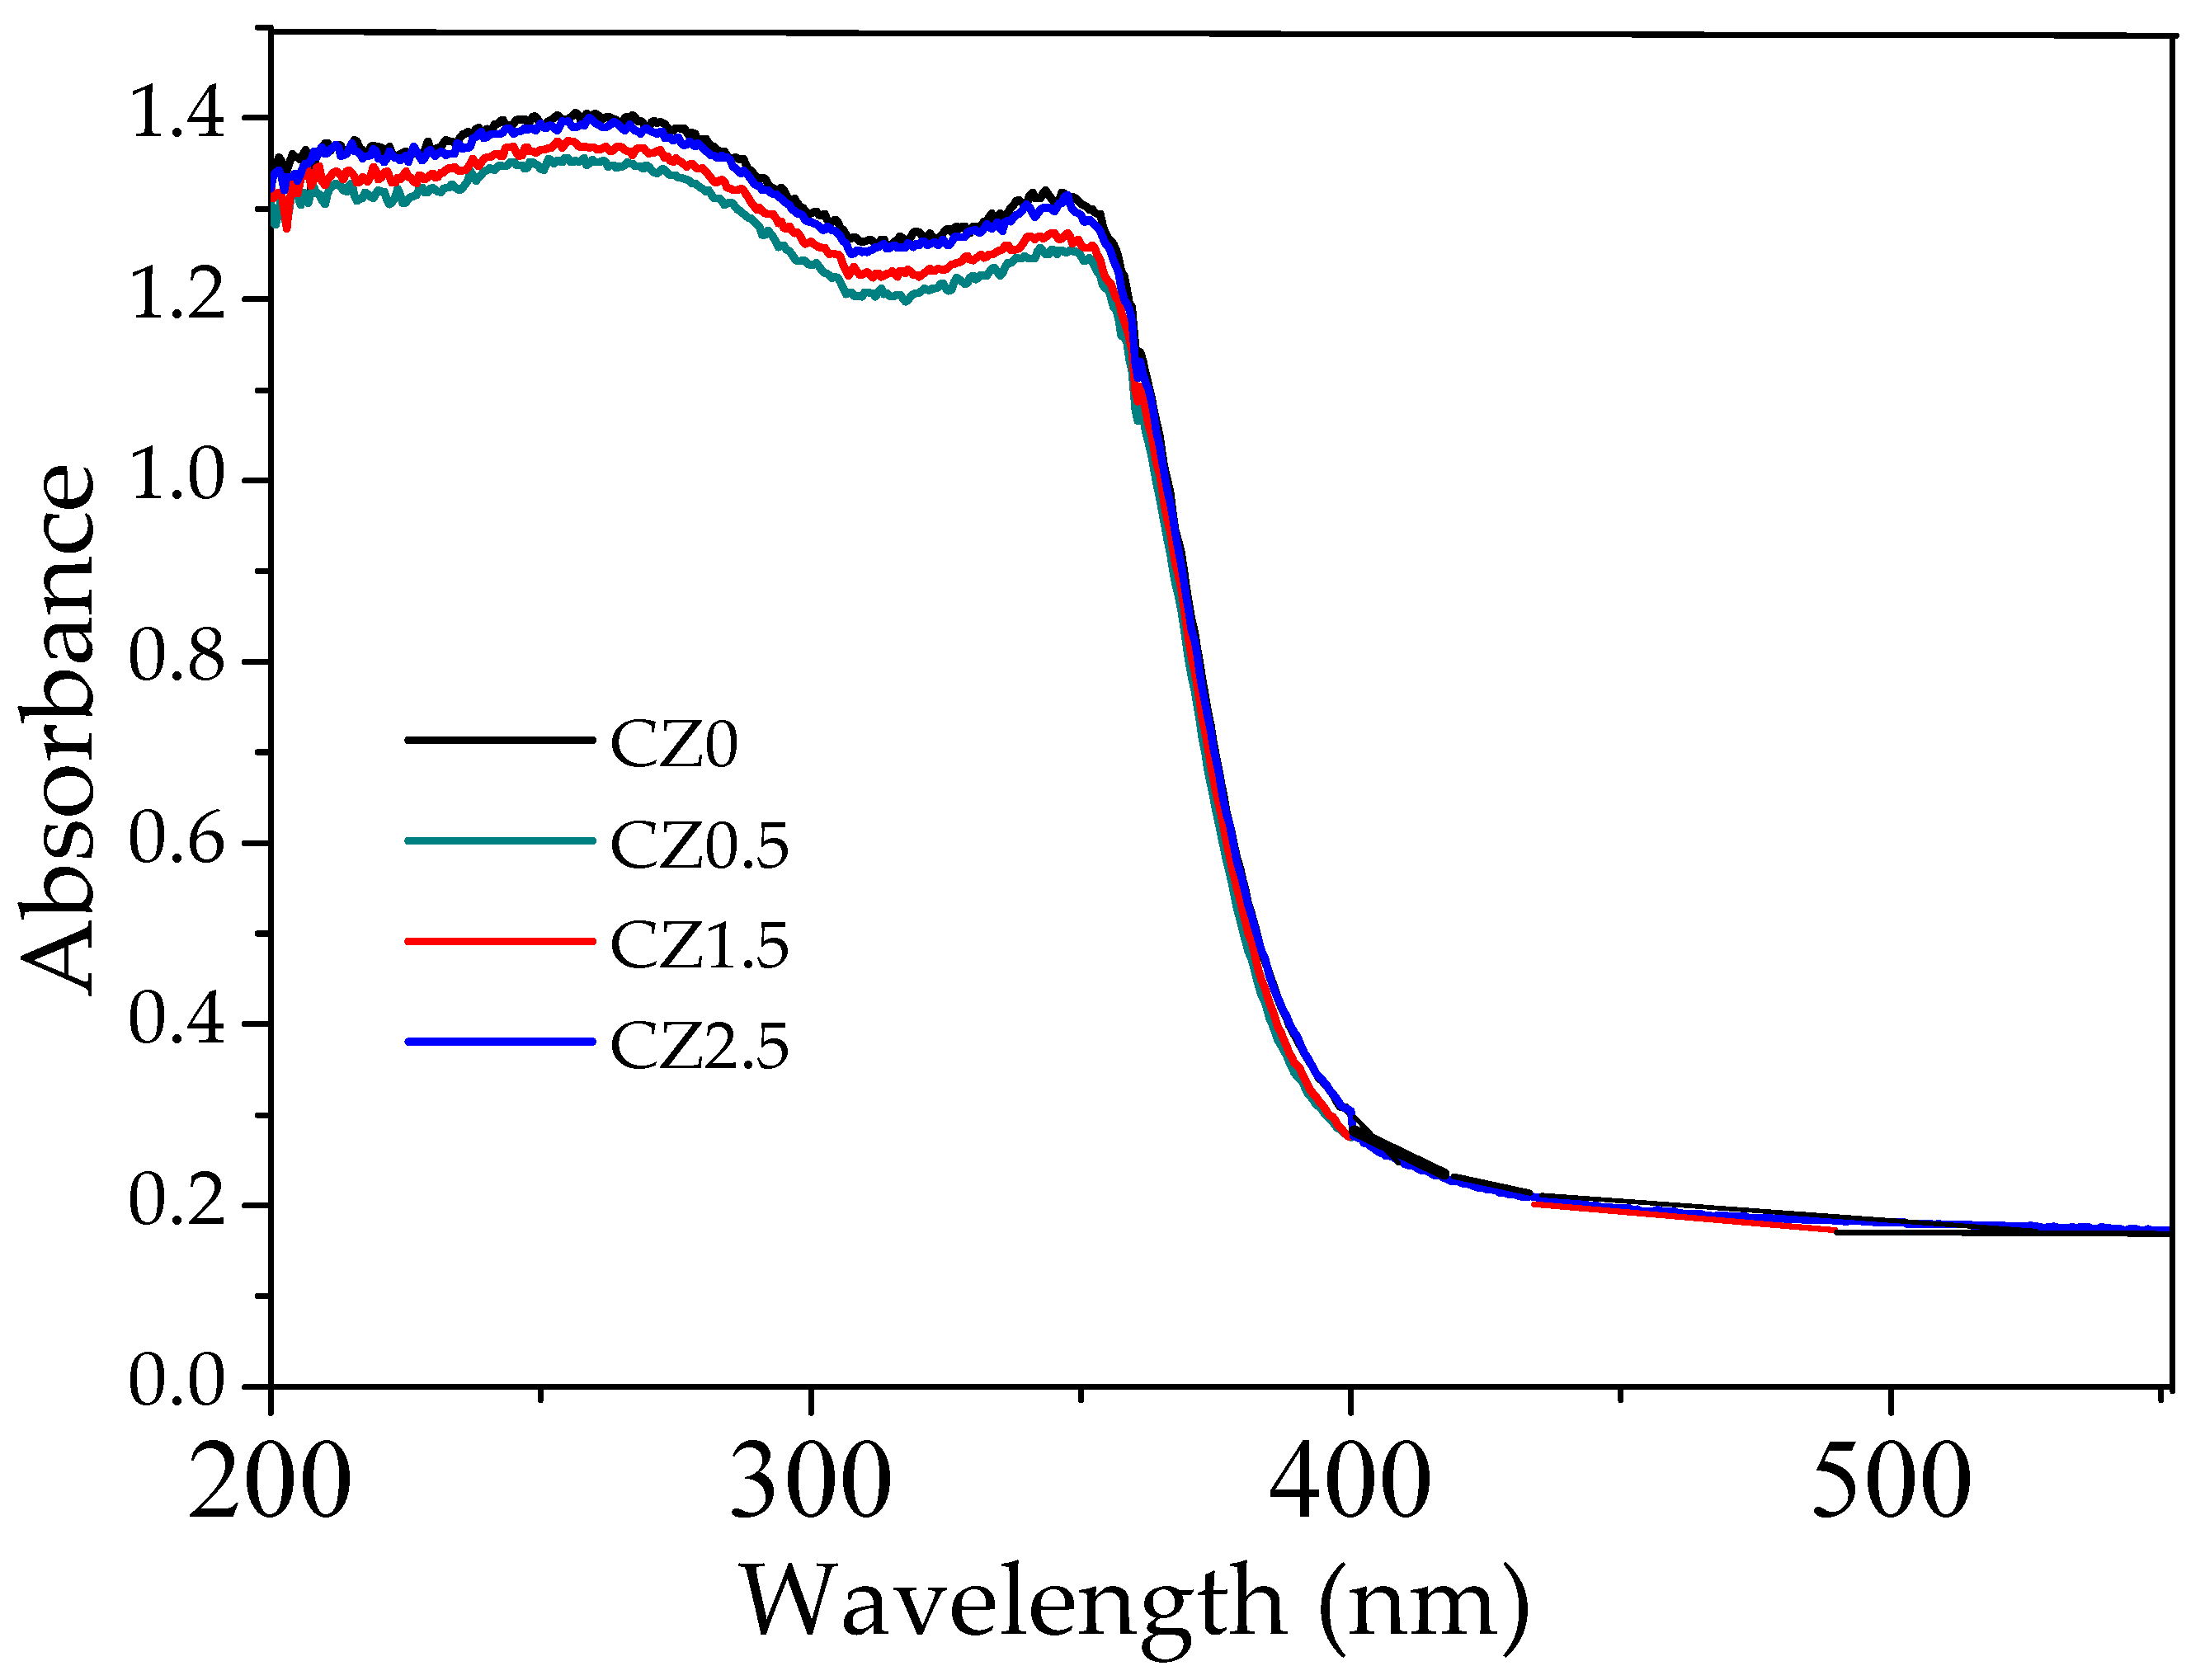
Table 1.
Surface area, pore volume and pore size values of photocatalysts.
| Catalysts | Area (m2/g) | Pore volume (cm3g-1) | Pore size (nm) |
| CZ0 | 58 | 11 | 5.2 |
| CZ0.5 | 60 | 14 | 5.4 |
| CZ1.5 | 82 | 14 | 4.5 |
| CZ2.5 | 67 | 13 | 4.1 |
Table 2.
Binding energies O 1s of the different samples prepared by impregnation.
| CZ0 | CZ0.5 | CZ1.5 | CZ2.5 | ||||
| O 1s | O 1s | O 1s | O 1s | ||||
| Energy (eV) |
Concen. Relative (%) |
Energy (eV) |
Concen Relative (%) |
Energy (eV) |
Concen. Relative (%) |
Energy (eV) |
Concen. Relative (%) |
| 529.15 | 81.3 | 527.70 | 8.2 | 527.63 | 5.4 | 528.45 | 8.7 |
| 531.55 | 18.7 | 529.15 | 60.8 | 529.15 | 39.1 | 529.15 | 11.3 |
| 530.52 | 8 | 529.55 | 28.3 | 529.87 | 40.1 | ||
| 531.55 | 23 | 530.86 | 2.8 | 530.46 | 18.1 | ||
| 531.55 | 24.4 | 531.55 | 21.8 | ||||
Disclaimer/Publisher’s Note: The statements, opinions and data contained in all publications are solely those of the individual author(s) and contributor(s) and not of MDPI and/or the editor(s). MDPI and/or the editor(s) disclaim responsibility for any injury to people or property resulting from any ideas, methods, instructions or products referred to in the content. |
© 2025 by the authors. Licensee MDPI, Basel, Switzerland. This article is an open access article distributed under the terms and conditions of the Creative Commons Attribution (CC BY) license.
Copyright: This open access article is published under a Creative Commons CC BY 4.0 license, which permit the free download, distribution, and reuse, provided that the author and preprint are cited in any reuse.


