
Submitted:
22 December 2025
Posted:
23 December 2025
You are already at the latest version
Abstract
The archaeological terraces of Petra (southern Jordan) have long been recognized for their role in agriculture and flood mitigation. Despite the dominance of fine-grained sediments behind many terrace walls, these systems exhibit high infiltration capacity and remarkable resistance to erosion. This study investigates the hydrological behavior of terrace-trapped sediments through detailed soil texture, aggregate stability, salinity, and chemical analyses across eight representative sites in and around Petra. Grain-size distributions derived from dry and wet sieving, supplemented by laser diffraction, reveal that dry sieving substantially overestimates sand content due to aggregation of fine particles into unstable peds. Wet analyses demonstrate that many terrace soils are clay- or sandy-clay-dominated yet remain highly permeable. Chem-ical indicators (nitrate, phosphate, potassium, pH, and salinity) further suggest that terracing enhances downward water movement and salt leaching irrespective of clay content. These findings indicate that terrace architecture and sediment structure exert a stronger control on hydrological functioning than texture alone. The results have direct implications for under-standing ancient land management in Petra and for informing sustainable terracing practices in modern arid and semi-arid landscapes.
Keywords:
Petra
; agricultural terraces
; soil texture
; wet sieving
; clay aggregates
; hydrology
; arid environments
1. Introduction
The introduction should briefly place the study in a broad context and highlight why it is important. It should define the purpose of the work and its significance. The current state of the research field should be carefully reviewed and key publications cited. Please highlight controversial and diverging hypotheses when necessary. Finally, briefly mention the main aim of the work and highlight the principal conclusions. As far as possible, please keep the introduction comprehensible to scientists outside your particular field of research. References should be numbered in order of appearance and indicated by a numeral or numerals in square brackets—e.g., [1] or [2,3], or [4,5,6]. See the end of the document for further details on references.
The archaeological terraces of Petra in southern Jordan have been the subject of intensive study recently [19]. These were built over an extended period of between 1850 BC and 1270 AD [7,14,23,37], and [19]. Of particular interest is the purpose of their construction and their impact on the flow of local surface water. While it was long assumed that they were built for agricultural purposes [25], it is now recognized that many of them were also built for flood mitigation ([1,6,8]). Subsequently, many of the flood control terraces were reused for agriculture as well [5].
While there is strong evidence that these terraces have had an important role in reducing erosion and stabilizing the landscape, it isn’t obvious why this would be the case. Even in places where the terraces themselves have collapsed, the amount of subsequent gullying is relatively small (Figure 1). This implies that much of the rainfall is still absorbed by the sediments, and that these sediments are absorbent and cohesive enough to resist erosion.
The sediments behind these terraces consist of mixtures of eroded rock and soil from upstream locations as well as aeolian dust from both local and exotic sources [23,24]. Previous studies have shown that they are dominated by fine-grained deposits that are markedly finer than the surrounding sandstone deposits [23].
Fine grained sediments are generally seen as being of low permeability. This relationship was first recognized by Hazen [20], who observed that permeability was correlated with a power function of median grain size [39]. In reality, the prediction of permeability based on any soil characteristic is a complex problem. Chapuis [17] conducted an extensive review of 45 different approaches of how this may be done, not reaching any definitive recommendations (although some approaches are better than others). Suffice to point out, finer grain sizes reduce permeability by orders of magnitude compared to coarser ones. This is reflected on the modeling inputs for the US Department of Agriculture Soil Conservation Service Curve Number Method [18].
Field measurements using rainfall simulation “sprinkler” tests at the terraces in Petra have been conducted on various occasions in order to ascertain the impact of terraces on surface water flow [1,8,32]. These measurements consistently have shown that these terraces are highly effective in absorbing surface runoff water in the Petra region. Successful efforts for reviving terrace-based land management should start with incorporating lessons for the past.
Modern large scale terracing efforts are at a risk of loss and environmental degradation in cases where they are not designed to take local topographical, geological and climatic factors into account [30,33]. In attempting to understand the hydrological impacts of terracing, it is common practice to resort to remote sensing and modeling approaches [36]. Often, this relies on soil data and land-use land-cover maps for which hydrological characteristics are not independently scrutinized [34]. Indeed, the widely used curve number method is better used with local data to calibrate the model [16].
Soil samples from various sites in and around Petra were described in the field, collected and analyzed for grain size distribution and chemistry. These sites were chosen to represent the variety seen in the terrace types, whether they were irrigated or rainfed, microclimate and geology. As such terraces could be used in the modern world to mitigate flooding and erosion and enhance agricultural production in high-relief, arid environments, it would be useful to learn more about what makes these terraces effective for these roles, and how best to make use of this insight.
2. Study Area
2.1. Geological Setting
The study area in and around Petra lies on the eastern margin of the Dead Sea Rift in southern Jordan. Petra itself lies in a NS trending graben along that margin [13], defined by the major Dead Sea Rift and the Quwaira faults on either side. Exposed in this graben are Palaeozoic sandstone formations known as the Ramm group. This group consists mostly of the Cambrian Umm Ishrin and the Ordovician Disi formations [12]. Within the graben, fluviolacustrine siliciclastic and carbonate deposits from a Late Pleistocene lake have been described [3]. The margins of the rift above Petra atop the Ramm group begin with an unconformity overlain by the Lower Cretaceous Kurnub sandstone formation. This, in turn, is overlain by the Upper Cretaceous and Lower Eocene Ajloun and Belqa groups. These consist of thick sequences of marine limestone, marl and silicified limestones [29].
2.2. Soils of the Petra Region
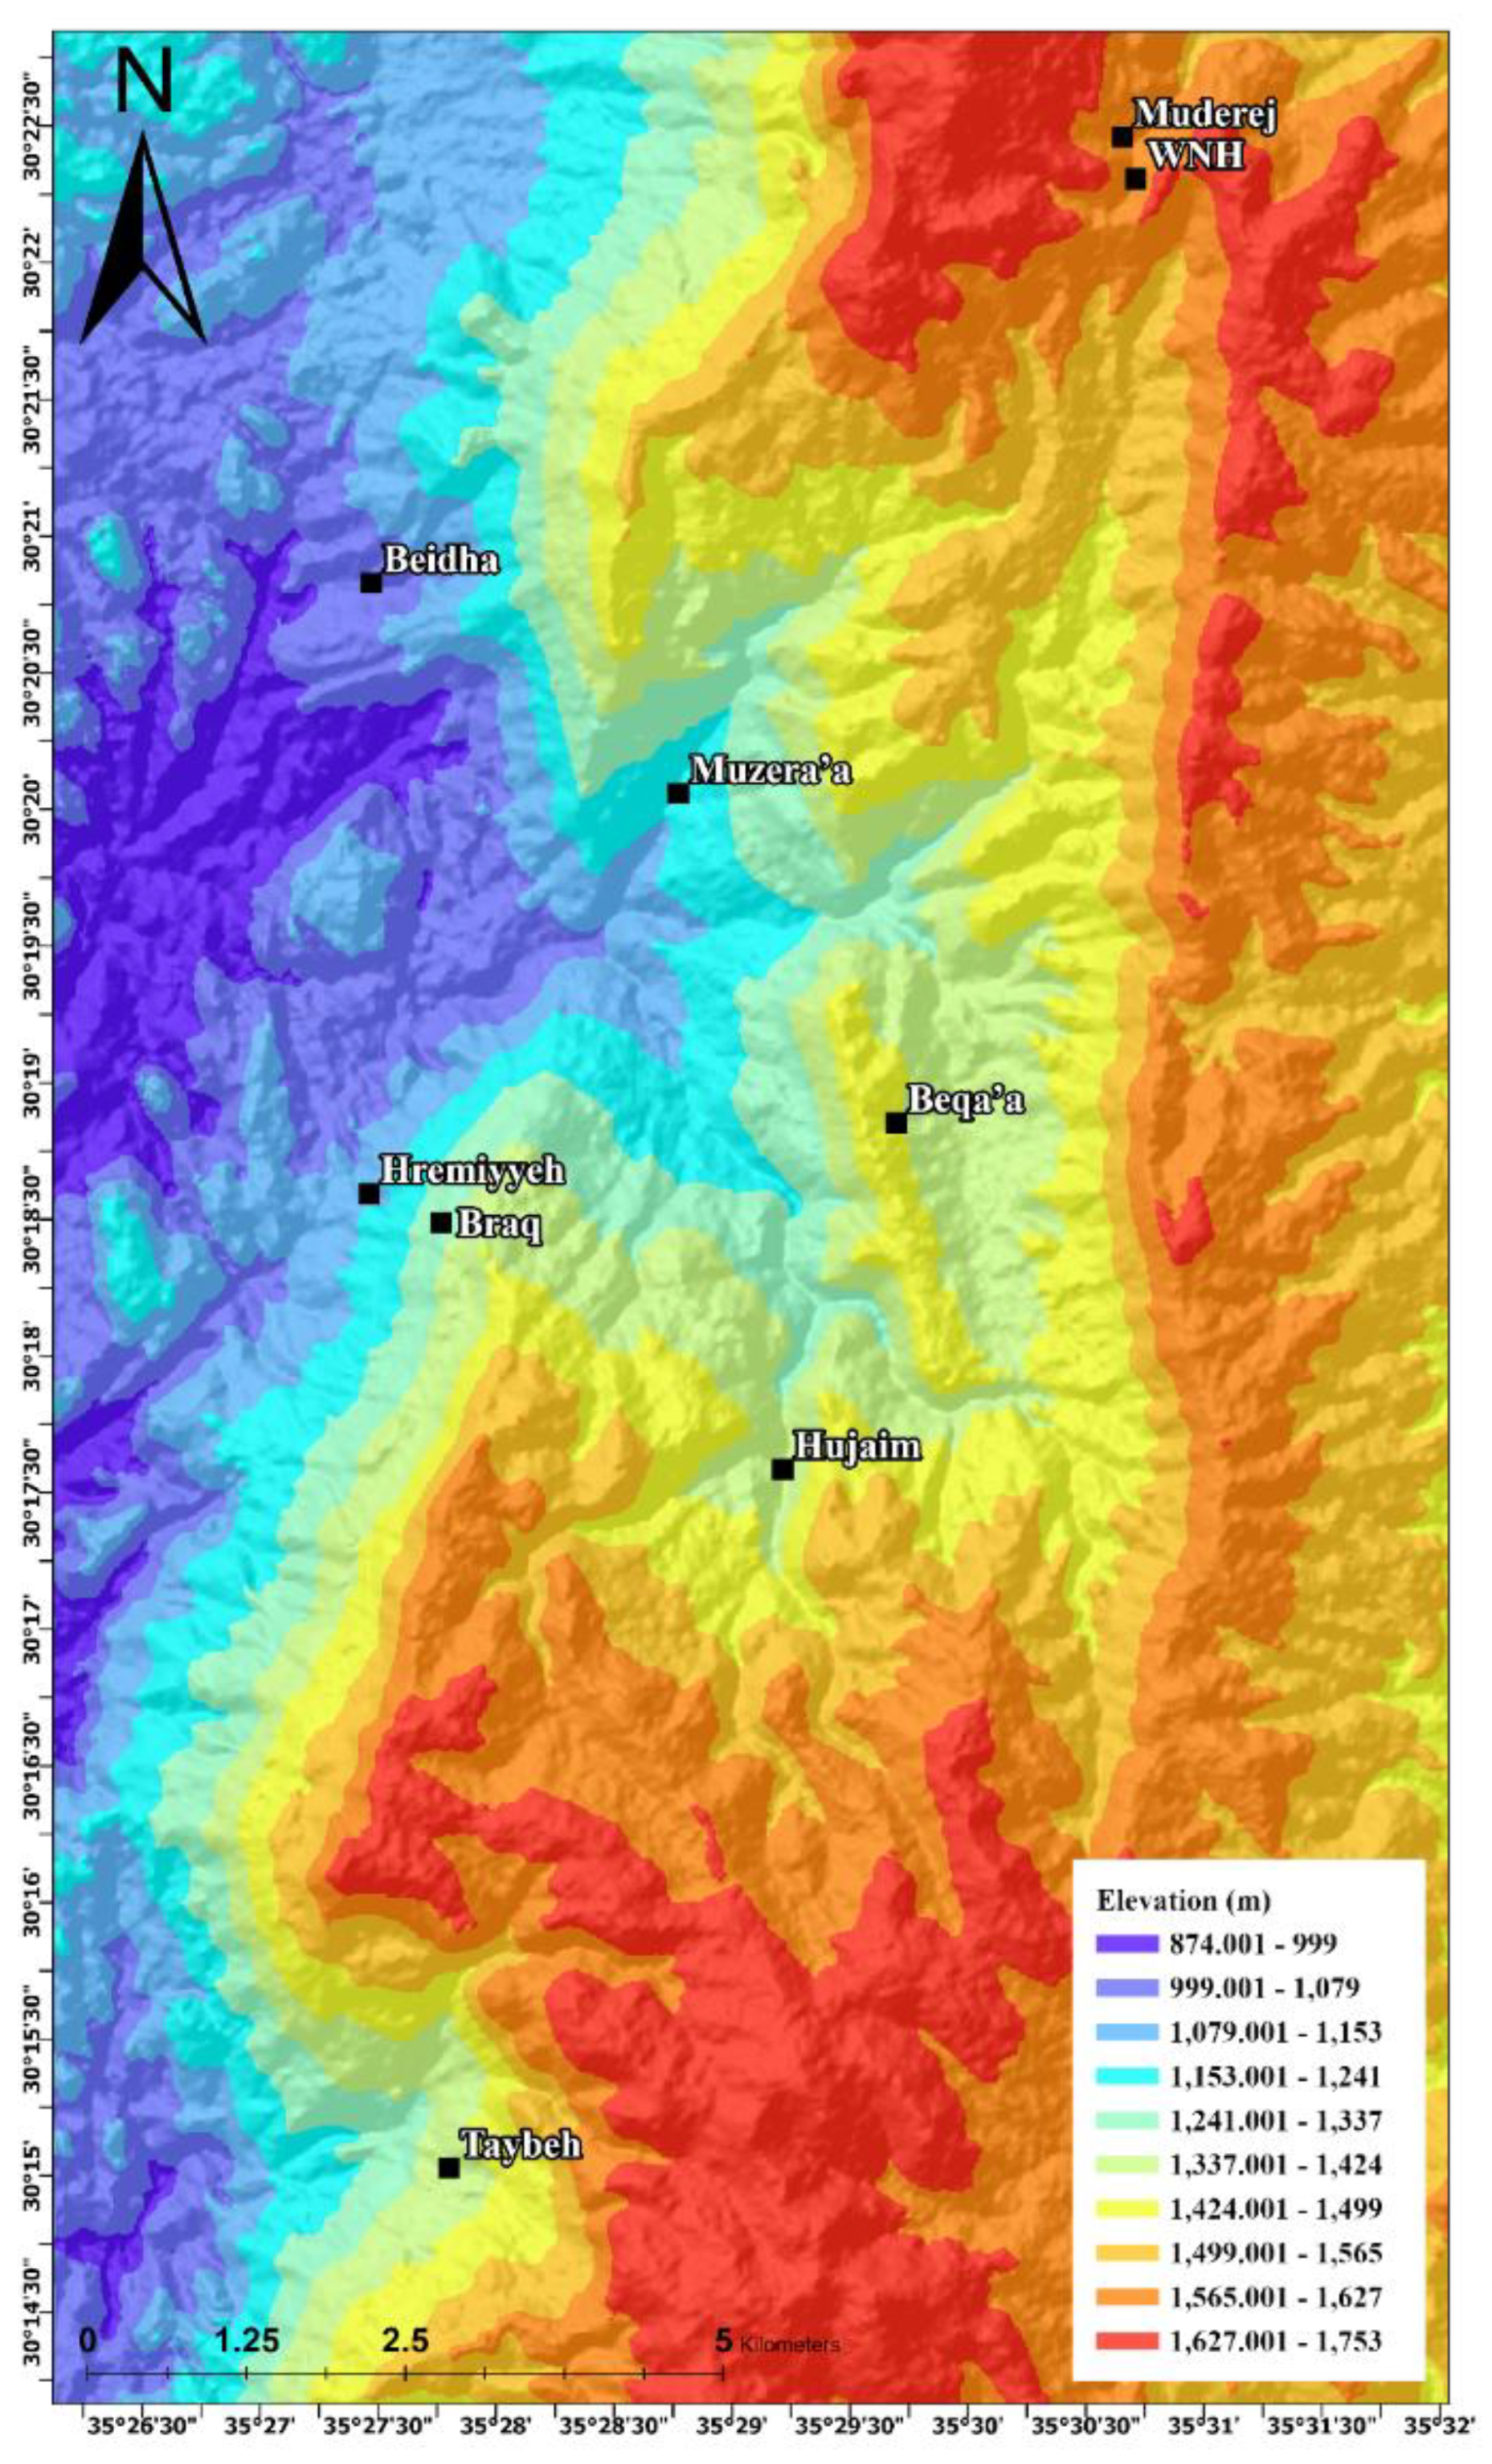
The soils of Petra can be viewed broadly as reflections of their underlying geology. Thus, soils above the Palaeozoic sandstones of the lower areas differ from the soils that overlie the Upper Cretaceous limestone and silicified limestone. Moreover, the soils developed on the steep cliffs formed by the major faults differ from the previous two, although these overlay the limestone formations as well. In the study sites, the Elephant Monument and Hremmiyyeh sites lie within the Palaeozoic Ramm formation outcrops. Hremmieyyeh also has some of the Kurnub sandstone exposed there as well. The other sites either lie on the slopes of exposed Upper Cretaceous marine limestones (i.e., Muzeiraa, Braq, Beqaa and Taybeh), or within broader alluvial plains within the limestone exposures (i.e., Mudeirij and the Farm Near the Highway). These zones differ not only in their underlying geology, but in their hydrological regimes as well (Figure 2).
Figure 1.
The soils of Petra.

Figure 2.
Distribution of sites under investigation.
A comprehensive study of the soils within Shoubak- Petra area was conducted by Al- Shabatat [10]. In this study, he classified the soils into three major categories: Aridosols, Entisols and Inceptisols, with eight subcategories based on parent rock material, elevation and geographic locality in addition to land use (agriculture, pastoral or abandoned).
The lower soils, above the sandstone substrates, are represented in this study by the Hremiyyeh and Elephant Monument terrace samples. These are light-colored tan soils that contain mixtures of fragments of rock from the surrounding rocks and aeolian sediments brought in from long distances [23]. These may include reworked Pleistocene fluviolacustrine sediments at levels below the 1060masl contour line [3]. These are alterations of aeolian and colluvial aggregates accumulated on the slopes in the form of sand dunes and hummocky sandstone hills [2]. These soils have been classified as Torripsamments, which are characterized by torrential moist conditions, and being gravely to sandy with coatings of iron oxide to calcareous cement [9]. The soil of the area is low in organic matter and classified as either Torripsamments or Torrifluvents. These are deep soils located in level to gentle slopes, sandy and unstructured soil. Classified as coarse sand to sandy loam mainly generated from weathering of red sandstone in addition to aeolian inputs.
The upland soils are darker soils that are broadly classified as Inceptisols. These benefited from higher rainfall rates. The mostly formed in situ, forming relatively thin Vertic Xerochrepts, consisting of reddish clay loam, or Calcixerollic Xerochrept, consisting of reddish clay loam (Al-Shababtat, 2005). This description is consistent with the soils of Muderij. The Beqa’a terraces are similar, as they are situated within the Upper Cretaceous Amman Silicified outcrop, with the upper soil that is characterised by darker brown hue.
Valley bottoms and the cliffs overlooking the rift valley are dominated by alluvium and colluvium -derived soils. This consist of Xeric-Aridic sandy loam [10]. The soils of Hujaim and al Muderej (WNH) fit this description (as will be elaborated below).
3. Materials and Methods
3.1. Study Sites
The studied terraces are located within the ash-Sharah Mountain ranges located NE and SE of the center of Petra. Eight major sites were chosen (Figure 3). At al-Muderej, located around 8 Km N of Petra, a recently abandoned terraced farm was sampled (Figure 4). The farm was part of a larger terraced ancient field and stone mounds that spans to an area of 28 Km2, from which 1.550km2 were later fenced with a stone wall to create a smaller farm. The farm included three linear terraces built of local stone in linear, irregular angular rubble stones in random courses (Hamarneh type V) ([19]). A gully cuts alluvial sediments accumulated in the area, running from the NW to the SE and forms the southern edge of the new farm. The farm used to have vines and some fruit trees. Based on the pottery fragments, the terraces were exploited during the Iron Age, late Nabataean, late Roman and the Byzantine periods. Just around 185m to the SE of the farm lies a set of terrace walls. These could be part of larger ancient farm system. Two walls built of regular large stones placed in regular courses (Hamarneh type IV). These terraces were exploited in the Nabataean period, based on pottery found within the fill.
The second site of Hujaim, located around 6 Km SE of Petra center, is a set of irrigated terraces with an orchard benefiting from a spring bearing the same name (Figure 5). The terraces are located in a valley bed, with terraced slopes on all the sides. They are bench terraces built with a mixture of large stones alternating with small stones of random ashlar forms in regular courses (Hamarneh type VII) ([19]). The terraces were exploited in the Nabataean, late Roman and Mamluk periods, and are still being intensely cultivated and well-tended, although some late 19th century houses in the vicinity have been abandoned. A wadi flows from the north to south.
Just around 1.50 Km NW of the town of Wadi Musa, and around 5 Km to N of Petra’s Center lies the large, terraced site of Muzera’a (Khirbat al-Qarara) (Figure 6). The terraces extend over the east side of the hill covering an area of 9.5 hectares, at an elevation of around 1200 m a.s.l. and sloping down to 1150 m a.s.l. The site is flanked by Wadi Ayn al-Tina from the northern and western sides. The bench terrace walls were constructed from large regular ashlar blocks of stone, surrounded by four anchor stones in the corners, laid in regular courses (Hamarneh type I). Pottery remains show an extensive exploitation from the Iron Age II through the Nabataean, Roman, Byzantine, and Islamic periods.
The fourth investigated site is the site of Braq (Figure 7). Located around 3.2Km SW of Petra Centre. The site is known for its Nabataean agrarian settlement, where the ruins of an ancient estate and religious building and water complex have been unearthed (Farajat et al. 1998; Tholbecq et al., 2018). The bench terraces, built as angular walls of mixed of large stones alternating with small stones of random ashlar in regular courses (Hamarneh type VII) [19] are located on the western slope and had once benefited from the nearby spring, currently almost dry. The terraces have long been abandoned, and no evidence of recent cultivation currently exists.
Downstream from Braq lies a set of terraces located at the site of Hremiyyeh (Figure 8). Located around 2.40 Km to the SE of Petra center. The terraces are located on the western slope of the rift. These to have been mainly used for water management and are currently located within an arid environment surrounded by wild shrubs. These are contour terraces, built of irregular angular rubble stones placed together in random courses (Hamarneh, type V) [19]. These terraces could be dated to the Nabataean, Roman and Byzantine periods based on the pottery fragments found within them [5]. No cultivation evidence was found.
The site of Beidha is located on the road that connects the village of Umm Sayhoun with Little Petra (Figure 9). Located around 3.5 Km to the NE of Petra center. The NW slope is of about 615m2, and is covered with 12 contour terraces, built of irregular angular rubble stones placed together in random courses (Hamarneh, type V). Evidence exists of the ancient use of terraces in agriculture; however, these were abandoned around 7-8th century.
The site of East Beqa’a is located around 6 Km to the E of Petra and is in the outskirts of Wadi Musa. The terraces are located western slope. The site is comprised of around 12 consecutive terraces built from chert as irregular angular rubble stones placed together in random courses (Hamarneh, type V) [19] (Figure 10). The terraces were situated on a 14.54% gradient slope. The terraces were mainly used for water management.
Around 12.30 Km to the south of Petra’s center lies Taybeh, an Ottoman-period village, surrounded by abandoned braided terraced fields (Figure 11), built of irregular angular rubble stones placed together in random courses (Hamarneh, type V). According to the pottery remains, the terraces seem to have been exploited in the Nabataean and late Byzantine periods.
3.2. Soil Sampling Strategy
The eight studied areas were surveyed, and the terraces were mapped using GPS. Material culture (pottery fragments) was collected to help date the human settlement and exploitation.
Pits were dug behind the terrace walls (into the tread) or under the terrace walls, with the depths equivalent to the hight of the wall, varying between 1 and 1.75 m. The pits were insured to be dug behind in-situ terrace riser (Figure 12). The stones of the terrace riser were carefully numbered and dismantled to expose the accumulated soil column behind. The soil horizons behind the terraces were measured, drawn and photographed. In addition, four soil samples were collected from below the terrace risers (Beidha was an exception) to provide a comparative example of the original soil before the terrace was constructed (Table 1). The second set of samples was collected from a radius of 90-150m from the terraced areas, and from unterraced profiles (open slopes) for comparison and a small portion was collected from wadi sides. In total, twenty-three soil samples were collected for soil texture, each weighing between 1.50-3.5Kg.
3.3. Soil Texture Analysis
3.3.1. Dry Sieving
The collected soil sample were further studied for texture at the Soil Mechanics Laboratory at the Department of Civil and Environmental Engineering at the German Jordanian University, Amman, Jordan. The samples were weighed before drying in the oven, and reweighed after drying to determine the humidity.
The samples were subjected to dry sieving using a pan and cover electric shaker. Each diameter fraction was separated and weighed.
To determine the proportions of silt (0.002–0.05 mm) and clay (<0.002 mm) for both the dry and the wet sieving, a laser diffraction technique was employed using the ANALYSETTE 22 MicroTec particle size analyzer available at the Geology Department laboratories at Yarmouk University.
The ANALYSETTE 22 MicroTec is a highly sensitive laser diffraction instrument used to measure particle size distribution across a wide grain size range (from nanometres to millimetres). It uses a laser beam that passes through a dispersed sample.
The results were then plotted using excel multi plot triangulation 100pt 508 to determine the soil texture based on the US soil texture classification.
3.3.2. Wet Sieving and Laser Diffraction
A 50g from the bulk sample was separated and subjected to wet sieving using (850, 150, 75 m sieves). The fractions were then dried and weighed. The silt and clay fractions were determined using the ANALYSETTE 22 MicroTec particle size analyzer available at the Geology Department laboratories at Yarmouk University. The results were then plotted using excel multi plot triangulation 100pt 508 to determine the soil texture based on the US soil texture classification.
3.4. Aggregate (Ped) Stability Testing
The peds from the dry sieving seemed to form a significant fraction of the coarse-grained material. Consequently, it was deemed necessary to determine if these peds were resilient and behaved like gravel during infiltration events. This would differ if they were simply agglomerated due to compaction of clay as opposed being cemented by secondary carbonates.
In order to differentiate, two burettes were set up: one containing deionized water and the other containing diluted hydrochloric acid. Samples of equal mass of the peds were chosen, and the volume of liquid from each burette needed to disintegrate the peds was measured.
3.5. Soil Chemical Analyses
3.5.1. Nutrients (N, P, K)
Three main nutrients were analysed: potassium (K), nitrogen (NO3-N) and phosphorus (PO4). These are considered to be indicators for human activity such as habitation, burial, agricultural manure, waste, and grazing among others. In addition, soil pH was also analysed to understand fertilizer fixation in the soil. The chemical analyses were conducted at the chemistry laboratory at the Department of Civil and Environmental Engineering at the German Jordanian University. Chemical analysis involved testing the presence and the concentration of phosphorous in the form of (PO4), nitrate (NO3) and potassium (K) along with the pH of the samples. Soil samples were tested for phosphorous (P-PO4) and nitrogen contents (N-NO3). The 12 soil samples selected were from fraction extracted from the mesh size of 250 µ.
The tested total phosphorous (TP) soil samples were prepared by sample calcination at 550 C for 1 hour [22], in which all the organic fractions of the phosphorus (OP) was converted to inorganic form (IP). An extraction was carried out by the addition of soil sample to 1 M of HCl [22,27,42] in a soil to solution ratio of 1:100 with a pH less than 1. The samples were stirred for 16 hours then the soil suspension was filtered using 0.45 micrometer filter paper to provide a clear filtration. The filtrate was tested for a P-PO4 by photometer means using Hach Colorimeter (DR/890) by adding PhosVer 3 Hach reagent kit to a 10 ml of each sample and the concentration was evaluated as mg/l of PO4.
The inorganic phosphorous (IP) of the soil samples were extracted by the addition of soil sample to 1 M of HCl [22,27,42] in a soil to solution ratio of 1:100 with a pH less than 1. The samples were stirred for 16 hours then the soil suspension was filtered using 0.45 micrometer filter paper to provide a clear filtration. The IP was carried out using a Hach colorimeter in similar manner to the TP determination. The organic phosphorous OP is a calculated value; it was determined by subtracting the IP value from the TP value.
The extract for evaluating nitrogen and potassium was carried out using CaCl2. Two grams of the soil sample was mixed with 100 ml of 0.01 M CaCl2. The mixture was stirred for 2 hours before a filtrated using 0.45 µm. There was no need to add activated carbon as a decoloring agent [31].
The filtrate was tested for a N-NO3 by photometer means using Hach Colorimeter (DR/890) by adding Hach reagent kit to a 10 ml of each sample and the concentration was evaluated as mg/l of NO3.
Another 10 ml of the filtrated sample was used to evaluate the concentration of Potassium using Jenway PFP7 Flame Photometer. After calibrating the device against K standard solution.
3.5.2. Soil pH and Salinity
The pH of samples was determined by adding 10 g of dried soil sample to 10 ml of distilled water. After shaking for 30 minutes the sample was left to subside for 15minutes. The sample was shaken again and left for 30 minutes after which the pH was measured using a multi-parameter water quality meter (EZ-9909A).
The relative salinity of the soil was measured by soaking 5 grams of sample into 50 ml of distilled water and measuring the change in salinity after the passing of 15 minutes.
4. Results
4.1. Soil Texture
4.1.1. Dry Sieving Results
The dry sieve particle-size analyses show that all sampled soils are overwhelmingly dominated by sand, with values ranging from 62 to 94%. Gravel content is highly variable (6–44%), while silt and clay consistently remain very low across the dataset, rarely exceeding 5% (Table 2). These results classify the samples into three main clusters: sand, loamy sand, and sandy loam according to the USDA texture system (Figure 13).
4.1.2. Wet Sieving Results
When compared to the wet sieve method, the dry sieve method regularly returns a substantially greater sand concentration, frequently above 70%. This disparity results from the agglomeration of small particles into peds when they are dry, resulting in the overestimation of the coarser grained fractions. Because fine particles are obscured by aggregation, the apparent amounts of clay and silt are underestimated. Therefore, the results of a dry sieve could suggest that a soil is more permeable and coarser, which could influence agricultural or technical decisions.
However, a more accurate particle size distribution that is essential for understanding soil water dynamics, fertility, and management is revealed when these aggregates are broken apart by wet sieving as these results clearly demonstrate.
After wet sieving, the soil texture analysis changes dramatically, rather than having all the samples classified under Sand according to the USDA texture system; five groups emerge (Figure 14). Clay seems to be the dominant category, with 54.17% of the samples falling under this category. These samples showed clay domination (45-55%) of the sample. 16.67% of the samples classified under sandy-clay-loam, with sand dominating 55–66% of the sample and the clay ranging between 24–33%. A similar dominance of sample percentage (16.67%) showed sandy-clay texture, these mainly have sand range: 45–53%, clay: 36–49%. 8.33% of the samples were of clay loam, with clay being around (35-45%). Only one was classified as a loam.
The wet sieve analysis for the Wall Near Highway sample reveals a texture dominated by clay, with 36.2% clay, 12.09% silt, and 51.71% sand. The relatively high clay content indicates finer particles are prominent, contributing to plasticity and water retention. The sand content remains significant but less than half, reflecting a balanced but fine-textured soil. The wet sieve data classifies this soil as “clay,” consistent with its fine particle dominance.
The site of Muderej shows large variation, for the sample (HF-2) taken from below the North Wall Outside shows a sandy clay loam texture with 33.5% clay, 8.95% silt, and 57.55% sand. The high sand proportion suggests a coarser soil than the highway wall sample, allowing for better drainage, while clay content remains substantial enough to influence soil cohesion. Silt content is comparatively low, indicating a smaller intermediate particle size, making the soil more permeable. This texture supports moderate water retention with adequate drainage.
This is totally different from the two samples collected from the terrace HF-4, which shows a sandy clay texture with 38.52% clay, 14.99% silt, and 49.49% sand, indicating a balanced mix favoring clay’s cohesive properties but with significant sand for drainage. HF-5 leans towards clay texture with 50.28% clay, 26.7% silt, and 23.01% sand, indicating a finer soil with good moisture retention but potential drainage issues.
When comparing the soil samples upstream from the north and the south sides, we find them having more clay. Sample (HF_3) from the North Side has a clay texture that dominates with 50.74% clay, 14.83% silt, and 34.43% sand. It is consistent with other upstream soils showing fine particle dominance and potential drainage challenges. The South Side Wadi Upstream (HF-1) is predominantly clay (42.34%), with 36.83% sand and 20.83% silt. Compared to Hujaim Village, it contains more sand, indicating slightly better drainage, but is still clay-dominated. The soil would likely be sticky when wet and hard when dry.
At Hujaim Village, the Top Horizon (Hj-1), coming from behind the terrace wall, has a clay loam texture with 34.52% clay, 33.19% silt, and 32.29% sand. Here, silt content is remarkably high, almost equal to clay, indicating fine particles dominate, but with more medium-sized particles than other locations.
Comparing that with the Flood Plain Horizon (Hj-2) shows even more clay at 51.21%, less sand (29.51%), and moderate silt (19.28%) which is typical for floodplain deposits.
The Beqaa sample has a sandy clay texture with 36.2% clay, 12.09% silt, and 51.71% sand. This composition closely mirrors the Wall Near Highway sample but with slightly coarser texture due to the sand dominance. The substantial clay portion suggests moderate plasticity, while sand promotes drainage. The silt fraction contributes minimally, indicating soil particle size distribution skewed towards the extremes.
At Hremiyyeh, sample T90’s exhibits sandy clay loam texture characterized by high sand (66.42%), moderate clay (24.87%), and low silt (8.71%).
Sample (EM-8) retained high sand domination in both the dry and wet sieving. The soil here is sandy clay with 36.49% clay, 10.5% silt, and 53.01% sand. This exhibits the influence of the lithology on soil morphology.
At the site of Braq, the area seems to be clay dominated, as the soils from beneath the terrace and the unterraced layer at the Braq site appear to have a high clay concentration, suggesting that the area is dominated by clay. Bq-3 beneath the terrace riser wall is clay with very high clay content (55.37%), moderate silt (22.08%), and low sand (22.56%), whereas Bq-4 beneath the terrace is clay-dominant with 52.24% clay, 20.98% silt, and only 26.78% sand. The soil behind the terrace wall (Bq-1), which has a clay loam texture with balanced clay (39.09%), silt (31.65%), and sand (29.26%), is the sole area that differs. These samples point to a general tendency toward finer soils in Braq, which may be the result of local geology preferring finer particles or sediment deposition.
Samples from Taybeh mostly fall into clay textures with clay content ranging from ~44% to 54%, moderate silt, and lower sand. Muzera’a samples vary more: some are sandy clay loams with sand contents up to 62%, others more clayey or loamy, showing soil heterogeneity in this region influenced by terraces and depth.
4.2. Comparison between Dry and Wet Sieving
The comparison between dry and wet sieving reveals that dry sieving markedly overestimates coarser content in soils. For instance, the WHN-1 sample shows a dry sand fraction of 93.9% compared to only 51.71% in the wet sieve, representing a 42% difference. Similarly, the BG-1 and EM-8 samples display overestimations of 20% and 36%, respectively, while the Bq-4 sample shows an extreme 67% overestimate. These discrepancies arise because some of these soils contain strong aggregates that behave as sand-sized particles when dry. Once wetted, these aggregates disperse, releasing the finer clay and silt particles enclosed within. Consequently, dry sieving can misclassify many clayey soils as sandy, masking their true texture.
Wet sieve analysis uncovers substantially higher clay contents than indicated by dry sieving. For example, the WHN-1 sample contains only 0.075% clay when dry but 36.2% clay after wet sieving, highlighting extremely aggregated soil, mainly at the gravel size, with clay locked inside sand-sized clumps. Other samples such as Hj-2 (2.8% dry vs. 51.21% wet clay) and HF-5 (0.45% dry vs. 50.28% wet clay) illustrate soils rich in swelling and dispersive clays, often typical of floodplain and terraced soils. The Bq-3 sample demonstrates a similar pattern with 1.36% dry clay rising to 55.37% wet clay. These results indicate that water rapidly breaks down water-unstable aggregates, releasing the true clay fractions. This phenomenon is common in soils with smectitic or vertic clays, low organic matter stabilization, and soils subjected to repeated wetting and drying cycles.
The inaccuracies inherent in dry sieving led to substantial shifts in soil texture classification when compared to wet sieve results. For example, the WHN-1 and Hj-2 samples are classified as sandy soils when dry but shift to clay soils after wet analysis, reflecting an extreme change. HF-4 transitions from sand to sandy clay, while Bq-1 moves from sand to clay loam, indicating large to moderate shifts. The Bq-4 sample undergoes a similarly extreme shift from sandy to clay texture. This misclassification by dry sieve results from the underestimation of fine particles, particularly clay and silt, thus compromising soil characterization.
4.3. Ped Stability
The results of the experiment conducted on the robustness of some of the samples are as presented in Table 3.
While the number of experiments was small, they showed that the peds quickly disintegrated in the presence of water. Moreover, the use of dilute HCl didn’t accelerate the process. This indicates that carbonate plays a minor role in cementing the peds.
4.4. Soil Chemistry
Twelve samples have been analysed for nitrate, phosphate, and potassium content. The nitrate content shows a certain tendency within the three main profiles (terraced, under the terrace riser wall and the unterraced) (Table 4). The concentration of the nitrates below the terraces tends to be higher, and drops tremendously behind the abandoned terraces, while retains its content in the cultivated terraces.
The unterraced areas, however, do not show any pattern. In most cases the nitrate concentration was higher in the flood plains and gullies, however in one case out of five the figures were much lower. There seems to be a weak relationship between soil salinity and nitrate concentrations (Figure 15).
The trendline (slope ≈ 0.0165) suggests a weak to moderate positive relationship between TDS and nitrate. Higher TDS tends slightly to correspond to higher nitrate, but the relationship isn’t very strong (R2 = 0.5534 ≈ 55%) and several points do not follow the trend. For example, Bq4 has extremely high TDS (~157) but low nitrate (~0.35), similar to Hj2 with high TDS (86) but very low nitrate (0.32). On the other hand, EM8 has the highest nitrate (3.78) but low TDS (~20).
Many of the higher-nitrate points are from terrace-backed soils or farmed areas, while unterraced or natural soils often show lower nitrate.
The soil within the study areas shows high alkalinity, mainly due to the calcific outcrop of the rock surfaces, as well as input from aeolian sources. Generally, the soil behind the terraces was less alkaline, probably due to the leaching of the calcium carbonate.
The potassium concentration seems to be uninfluenced by the terrace use. The soils of Petra can be considered poor in potassium as evident by the rather equal concentration of potassium in the slope soils and under the terraces. However, when examining the concentration within agrarian terraces such as the site of Hujaim we note that the concentration of still used terraces by around 2.5% from the unterraced or under the terrace soils.
The phosphate content was rather low and doesn’t show any tendency, thus the content of phosphate in the soil behind terraced matched in the cultivated and abandoned terraces (up to 0.37mg/g).
The unterraced soils showed low concentrations varying between (0.08mg/g) to (0.25mg/g). Most of the phosphate is generally in the form of organic phosphates, with the inorganic fraction consisting of about 0.05mg/g.
4.5. Soil Salinity
The soils generally show low salinity values throughout. However, some trends can be observed on the data on Table 5. For example, the sediments from the terraces show lower salt contents compared to the unterraced one. At Braq, the sample from the unterraced soil (Bq4) has the highest salt contents compared all of the other samples. A similar observation can be made in Hujaim, where the floodplain sample (Hj2) is higher than the other samples from the site. The only exception to this can be seen is in Muzera’a, where one sample behind the terrace wall shows an anomalously high reading.
5. Discussion
It is interesting to start with the grain sizes of the samples. Specifically, there is a clear discrepancy between the results of dry and wet sieving. Clay minerals and silt particles form aggregates that bind sand grains together seem to behave mechanically like sand-sized particles under air-dry conditions. This causes dry sieving to overestimate sand and underestimate finer fractions [15]. This is the consequence of the formation of clay peds within the soil. It was important to ascertain if these lumps are not resistant to water, and clearly disintegrate in the presence of water. These peds are not bound by carbonates, which aligns the analyses conducted by Lucke et al. [23], who showed that the sediments have relatively low carbonate contents.
The gravel content of the samples varies significantly, although it tends to range between 20 and 30%. In Braq, gravel ranges from 18% in unterraced slopes to 36% under terraces and 29.9% behind terrace walls, indicating that terraces act as sediment traps, concentrating coarser material while stabilizing soils. In Beqa’a, gravel content is moderate at 27.1%, reflecting typical semi-arid floodplain deposition where moderate runoff deposits both fine and coarse sediments. Hujaim exhibits a strong vertical variation: the village top horizon contains only 10.9% gravel, while the floodplain horizon reaches 27.8%, highlighting the role of hydraulic sorting in concentrating coarse fractions in lower-lying, water-affected areas. Hremiyyeh (T90: 22.2%) and upstream farm/wadi sites (HF-1: 31.3%, HF-3: 44.1%) show that gravel content increases with proximity to active water flow or sloped terrain. However, for the sample taken from the deposit from the Elephant Monument and Muderej wall near the highway (WNH-1) show very low gravel content (6–6.1%). This seems to be because much of the sediment is transported to the terraces by stream deposits from the nearby outcrops.
The variation in gravel content is strongly linked to both geomorphology and human landscape modification. Terraces enhance coarse sediment accumulation because they trap eroded material from upslope, while unterraced slopes are subject to selective erosion, which can remove fine material and leave moderate gravel behind. Floodplains and wadi channels accumulate the highest gravel concentrations due to hydraulic sorting, where flowing water transports fines away and deposits coarser fractions locally [26,38]. Topsoils on village platforms or stabilized areas retain finer particles and show the lowest gravel content because of reduced erosion and sediment input.
Despite this, the non-gravel fraction shows important variations. The first order variation seems to reflect the geological outcrops in the vicinity. Thus, the samples at Hremmiyyeh and the Elephant Monument have higher sand components (>50%), reflecting the Palaeozoic sandstone outcrops at these locations. Interestingly, the samples at Muzeiraa also have relatively high sand fractions, perhaps due to aeolian input from the outcrops that lay about 1.5km to the west. This is plausible, since the predominant wind pattern in the area from the west. The relatively high sand contents at the Farm Near the Highway are more difficult to explain.
Conversely, the samples taken to the east within terraces on the Cretaceous outcrops tends to have a lower sand fraction (<35%). Consequently, these deposits have a higher proportion of fine-grained material.
Two of the sites (Mdairej and Hujaim) lie within locations with notable alluvial deposits. These, in addition to the deposits at Braq, have the most notably higher concentrations of clay fractions. This seems to be a consequence of the role of abundant water in fixing and accumulating the clay fraction brought in by wind from distant sources [23,24].
Despite the variability in the grain size signatures demonstrated by the samples, it is evident that they are all highly effective in absorbing and transmitting water. This is evident in the salinity profiles seen in the sections. Unterraced soils or soils in deposits beneath the terrace walls show the highest salt accumulations. It should be noted that that direct measurements of rain-runoff relationships in the area show this as well [1,8,32]. The propensity for carbonate to wash through the sediment and accumulate on the interface with the bedrock is also evidence of this [4]. It is noteworthy that soil salinity is highly correlated with the nitrate concentrations measured. It is plausible that the major source of nitrates is waste from grazing animals and animal pens set up by local shepherds [41].
In considering the role of terracing in soil water movement, it is interesting to look at the relationships between clay contents and salinity (Figure 16). In this figure, four mostly non-overlapping fields can be distinguished. Field a is for unterraced soils, and field d is for soils under the terrace walls. Whereas they have similar clay contents, it is clear that field d has a significantly lower salinity. The implication of this is that the terrace collects water, which is ultimately flushing salt out to the underlying soil. This contrasts sharply with the unterraced soils. Field d is rather wide, but also clearly has lower salt accumulation than field a, with widely divergent clay contents. Field b represents the terraces that were built for irrigation purposes. This is distinct in that it has relatively lower clay content as well as low salt contents.
The implication of the data plotted on Figure 16 is that the very fact of terracing has a greater impact on water movement in the sediments than the exact clay content within them. This poses a curious question.
The hydraulic conductivity of soil is not strictly related to grain size, but to the pore sizes and their connectivity [35]. Thus, the relationship between the two parameters requires examination [11]. Heterogeneity in grain size distributions can either result in the domination of the fine or coarse fractions on the intergranular flows, depending on the fabric being matrix or grain supported [21]. The overwhelming evidence seen in Petra is that the later is the case.
It is common to see the use of the SCS-curve number model used to assess the hydrological impacts of terracing on a specific landscape. For example, Perlotto and D’Agostino [28] used this approach to model the impact of terracing on the hydrology of agricultural slopes. They used the FLO-2D method to model coupled with SCS-Curve number assumptions to explain the reduced surface flow in the terraced areas. The result was that most of the runoff mitigation was due to the reduction of slope rather than the nature of the sediments behind the terraces, as these were modelled as high clay low permeability soils.
6. Conclusions
This study confirms and extends the conclusions of Lucke et al. [23,24] by demonstrating that the terrace sediments of Petra are dominated by fine-grained material, most plausibly of aeolian origin, while nevertheless exhibiting high initial abstraction and sustained hydraulic conductivity. In agreement with earlier investigations [1,8], these properties are consistently reflected in chemical depth profiles, limited gullying even within partially collapsed terraces, and salinity patterns indicative of effective salt flushing rather than accumulation. Importantly, comparable hydrological and geochemical behavior is observed in both irrigated and non-irrigated terraces, indicating that these characteristics are intrinsic to the terrace–sediment system rather than a product of modern water management.
The persistence of high infiltration capacity in sediments rich in silt and clay highlights the controlling role of macroporosity. Although clay shrinkage could generate temporary macropores, field evidence does not support extensive desiccation cracking, and clay aggregates disintegrate rapidly upon wetting. The results instead point to a structurally supported macropore network in which gravel fractions provide a stable skeletal framework that maintains pore connectivity over long timescales. This framework counteracts dispersion and surface sealing, enabling sustained percolation and salt leaching even under fine-textured conditions typical of semi-arid environments.
From a cultural landscape perspective, the Petra terraces function as active hydrological infrastructures rather than passive archaeological features. They attenuate runoff, reduce erosion, limit salinization, and create persistent conditions for cultivation, thereby enhancing landscape resilience under variable climatic conditions. Methodologically, the study demonstrates that simplified hydrological models based solely on bulk texture are likely to underestimate both infiltration capacity and long-term system performance; integrated approaches that account for sediment heterogeneity and macropore dynamics are essential.
Policy and management implications follow directly from these findings. Terrace systems should be recognized as multifunctional nature-based solutions and incorporated into heritage conservation, land-use planning, and climate adaptation strategies. Protecting sediment structure, preventing gravel removal, and prioritizing terrace restoration can sustain their hydrological effectiveness, while informed replication of these systems offers a viable pathway for flood mitigation and soil conservation in comparable dryland regions.
Author Contributions
Conceptualization, C.H. and N.A.-J.; methodology, C.H.; formal analysis, C.H.; investigation, C.H.; writing—original draft preparation, C.H. and N.A.-J.; writing—review and editing, C.H. and N.A.-J.; supervision, N.A.-J. All authors have read and agreed to the published version of the manuscript.
Funding
This research was funded by German Jordanian University research grant N (RA SNREM 01/2025).
Institutional Review Board Statement
Not applicable.
Informed Consent Statement
Not applicable.
Data Availability Statement
Data are available upon reasonable request from the corresponding author.
Acknowledgments
The authors acknowledge the German Jordanian University and Yarmouk University laboratories for analytical support. Special gratitude is due to Eng. Fatimeh Al-Hadidi and Eng. Iman Al-Qudah from the biomedical Engineering School at the German Jordanian University for their assistance at the laboratory. Thanks are due to Geologist Abdelraheem Assalman for his help in particle size analysis at the Yarmouk University Geology Department Laboratory. Special gratitude is due to Dr. Abdullah al-Rawabdeh for preparing the maps.
Conflicts of Interest
The authors declare no conflict of interest.
References
- Abdelal, Q.; Al-Rawabdeh, A.; Al Qudah, K.; Hamarneh, C.; Abu-Jaber, N. Hydrological assessment and management implications for the ancient Nabataean flood control system in Petra, Jordan. J. Hydrol. 2021, 601, 126583. [Google Scholar] [CrossRef]
- Abu-Ajamieh, M.M.; Bender, F.K.; Eicher, R.N. Natural Resources in Jordan, Inventory, Evaluation, Development Program; Natural Resources Authority: Amman, Jordan, 1988. [Google Scholar]
- Abu-Jaber, N.; Al Khasawneh, S.; Alqudah, M.; Hamarneh, C.; Al-Rawabdeh, A.; Murray, A. Lake Elji and a geological perspective on the evolution of Petra, Jordan. Palaeogeogr. Palaeoclimatol. Palaeoecol. 2020, 557, 109904. [Google Scholar] [CrossRef]
- Abu-Jaber, N.; Rambeau, C.; Hamarneh, C.; Lucke, B.; Inglis, R.; Alqudah, M. Development, distribution and palaeoenvironmental significance of terrestrial carbonates in the Petra region, southern Jordan. Quatern. Int. 2020, 545, 3–16. [Google Scholar] [CrossRef]
- Abu-Jaber, N.; Hamarneh, C.; AlFarajat, M.; Al-Rawabdeh, A.; Al Khasawneh, S. Historic management of the dynamic landscape in the surroundings of Petra, Jordan. Jordan J. Earth Environ. Sci. 2022, 13, 232–241. [Google Scholar]
- Akasheh, T.S. Ancient and modern watershed management in Petra. Near East. Archaeol. 2002, 65, 220–224. [Google Scholar] [CrossRef]
- Al Khasawneh, S.; Abu-Jaber, N.; Hamarneh, C.; Murray, A. Age determination of runoff terrace systems in Petra, Jordan, using rock surface luminescence dating. Archaeol. Anthropol. Sci. 2022, 14, 48. [Google Scholar] [CrossRef]
- Al-Qudah, K.; Abdelal, Q.; Hamarneh, C.; Abu-Jaber, N. Taming the torrents: The hydrologic impacts of ancient terracing practices in Jordan. J. Hydrol. 2016, 542, 913–922. [Google Scholar] [CrossRef]
- Al-Qudah, B. Soils of Jordan. In Soil Resources of Southern and Eastern Mediterranean Countries; Zdruli, P., Steduto, P., Lacirignola, C., Montanarella, L., Eds.; CIHEAM: Bari, Italy, 2001; Volume B, Études et Recherches, No. 34; pp. 127–141. [Google Scholar]
- Al-Shabatat, A. Environmental Deterioration and Land Management in the Petra-Showbak Area, Jordan. Ph.D. Dissertation, University of Jordan, Amman, Jordan, 2005. [Google Scholar]
- Arya, L.M.; Leij, F.J.; Shouse, P.J.; van Genuchten, M.T. Relationship between the hydraulic conductivity function and the particle-size distribution. Soil Sci. Soc. Am. J. 1999, 63, 1063–1070. [Google Scholar] [CrossRef]
- Barjous, M.O. The Geology of Petra and Wadi Al Lahyana Area: Map Sheets No. 3050-I and 3050-IV; Natural Resources Authority: Amman, Jordan, 2003. [Google Scholar]
- Barjous, M.; Mikbel, S. Tectonic evolution of the Gulf of Aqaba-Dead Sea transform. Tectonophysics 1990, 180, 49–59. [Google Scholar] [CrossRef]
- Beckers, B.; Schütt, B.; Tsukamoto, S.; Frechen, M. Age determination of Petra’s engineered landscape–optically stimulated luminescence (OSL) and radiocarbon ages of runoff terrace systems in the Eastern Highlands of Jordan. J. Archaeol. Sci. 2013, 40, 333–348. [Google Scholar] [CrossRef]
- Brady, N.C.; Weil, R.R. The Nature and Properties of Soils, 15th ed.; Pearson: New York, NY, USA, 2017. [Google Scholar]
- Brandão, A.R.A.; Schwamback, D.; Ballarin, A.S.; Ramirez-Avila, J.J.; Neto, J.G.V.; Oliveira, P.T.S. Toward a better understanding of curve number and initial abstraction ratio values from a large sample of watersheds perspective. J. Hydrol. 2025, 655, 132941. [Google Scholar] [CrossRef]
- Chapuis, R.P. Predicting the saturated hydraulic conductivity of soils: A review. Bull. Eng. Geol. Environ. 2012, 71, 401–434. [Google Scholar] [CrossRef]
- Cronshey, R. Urban Hydrology for Small Watersheds; US Department of Agriculture, Soil Conservation Service, Engineering Division: Washington, DC, USA, 1986. [Google Scholar]
- Hamarneh, C. Investigating Ancient Man-Made Terraces of Petra–Jordan. Ph.D. Dissertation, Kultur-, Sozial-und Bildungswissenschaftliche Fakultät, Berlin, Germany, 2022. [Google Scholar] [CrossRef]
- Hazen, A. Some Physical Properties of Sand and Gravel, with Special Reference to Their Use in Filtration; 24th Annual Report; Massachusetts State Board of Health: Boston, MA, USA, 1892; pp. 539–556. [Google Scholar]
- Huang, W.; Chen, C.; Chen, S.; Ling, H.; Mei, S.; Tang, Y. Permeability estimation of engineering-adapted clay–gravel mixture based on binary granular fabric. Water 2024, 16, 2243. [Google Scholar] [CrossRef]
- Kuo, S. Phosphorus. In Methods of Soil Analysis. Part 3. Chemical Methods; Sparks, D.L., Page, A.L., Helmke, P.A., Loeppert, R.H., Eds.; Soil Science Society of America, American Society of Agronomy: Madison, WI, USA, 1996; pp. 869–920. [Google Scholar]
- Lucke, B.; Sandler, A.; Vanselow, K.A.; Bruins, H.J.; Abu-Jaber, N.; Bäumler, R.; Porat, N.; Kouki, P. Composition of modern dust and Holocene aeolian sediments in archaeological structures of the Southern Levant. Atmosphere 2019, 10, 762. [Google Scholar] [CrossRef]
- Lucke, B.; Roskin, J.; Vanselow, K.A.; Bruins, H.J.; Abu-Jaber, N.; Deckers, K.; Lindauer, S.; Porat, N.; Reimer, P.J.; Bäumler, R.; et al. Character, rates, and environmental significance of Holocene dust accumulation in archaeological hilltop ruins in the southern Levant. Geosciences 2019, 9, 190. [Google Scholar] [CrossRef]
- Kouki, P. The Hinterland of a City: Rural Settlement and Land Use in the Petra Region from the Nabataean-Roman to the Early Islamic Period. Ph.D. Dissertation, University of Helsinki, Helsinki, Finland, 2012. [Google Scholar]
- Odeh, I.; Brent, C.S.; Al-Khasawneh, A.S.; van der Sluijs, G.T.J. Soil and sediment dynamics in semi-arid landscapes of Jordan. Geoarchaeology 2015, 30, 211–228. [Google Scholar] [CrossRef]
- Pardo, P.; Lopez-Sanchez, J.F.; Rauret, G. Relationships between phosphorus fractionation and major components in sediments using the SMT harmonised extraction procedure. Anal. Bioanal. Chem. 2003, 376, 248–254. [Google Scholar] [CrossRef]
- Perlotto, C.; D’Agostino, V. Performance assessment of bench terraces through 2D modelling. Land Degrad. Dev. 2018, 29, 607–616. [Google Scholar] [CrossRef]
- Powell, J.H.; Moh’d, B.K. Evolution of Cretaceous to Eocene alluvial and carbonate platform sequences in central and south Jordan. GeoArabia 2011, 16, 29–82. [Google Scholar] [CrossRef]
- Pla, I.; Nacci, S. Traditional compared to new systems for land management in vineyards of Catalonia (Spain). In Techniques Traditionnelles de GCES en Milieu Méditerranéen;Bulletin Réseau Erosion; Roose, E., Ed.; IRD: Marseille, France; ENFI: Salé, Morocco, 2003; Volume 21, pp. 213–223. [Google Scholar]
- Puchades, R.; Llopis, A.; Raigón, M.D.; Peris-Tortajada, M.; Maquieira, A. A simplified method for the extraction and analysis of available nitrogen, phosphorus, and potassium in soils. Commun. Soil Sci. Plant Anal. 1994, 25, 2543–2560. [Google Scholar] [CrossRef]
- Qashou, M.; AlQura’an, S. Design of Flood Control System in Petra, Jordan, Using Ancient Technologies. Bachelor’s Thesis, Department of Water and Environmental Engineering, German Jordanian University, Amman, Jordan, 2019. [Google Scholar]
- Ramos, M.C.; Cots-Folch, R.; Martínez-Casasnovas, J.A. Sustainability of modern land terracing for vineyard plantation in a Mediterranean mountain environment–the case of the Priorat region (NE Spain). Geomorphology 2007, 86, 1–11. [Google Scholar] [CrossRef]
- Rawat, K.S.; Singh, S.K. Estimation of surface runoff from semi-arid ungauged agricultural watershed using SCS-CN method and earth observation data sets. Water Conserv. Sci. Eng. 2017, 1, 233–247. [Google Scholar] [CrossRef]
- Ren, X.W.; Santamarina, J.C. The hydraulic conductivity of sediments: A pore size perspective. Eng. Geol. 2018, 233, 48–54. [Google Scholar] [CrossRef]
- Rocha, J.; Duarte, A.; Fabres, S.; Quintela, A.; Serpa, D. Influence of DEM resolution on the hydrological responses of a terraced catchment: An exploratory modelling approach. Remote Sens. 2022, 15, 169. [Google Scholar] [CrossRef]
- Rojas, F.; Newman, S.; Nicosia, C.; Plekhov, D. Assembling Petra’s rural landscapes. Antiquity 2020, 94, e23. [Google Scholar] [CrossRef]
- Rosen, A.M. Geoarchaeology in semi-arid environments: Terrace and wadi sediment studies. J. Archaeol. Sci. 2012, 39, 456–468. [Google Scholar] [CrossRef]
- Shepherd, R.G. Correlations of permeability and grain size. Ground Water 1989, 27, 633–638. [Google Scholar] [CrossRef]
- United States Department of Agriculture (USDA), Soil Survey Staff. Soil Taxonomy: A Basic System of Soil Classification for Making and Interpreting Soil Surveys, 2nd ed.; USDA Natural Resources Conservation Service: Washington, DC, USA, 1999. [Google Scholar]
- Viets, F.G., Jr. Animal wastes and fertilizers as potential sources of nitrate pollution of water. In Effects of Agricultural Production on Nitrates in Food and Water with Particular Reference to Isotope Studies; Proc. panel of experts organized by joint FAO/IAEA Div. Atomic Energy in Food and Agriculture: Vienna, Austria, 1974; pp. 63–76. [Google Scholar]
- Wuenscher, R.; Unterfrauner, H.; Peticzka, R.; Zehetner, F. A comparison of 14 soil phosphorus extraction methods applied to 50 agricultural soils from Central Europe. Plant Soil Environ. 2015, 61, 86–96. [Google Scholar] [CrossRef]
Figure 1.
Collapsed terrace wall with intact fill.
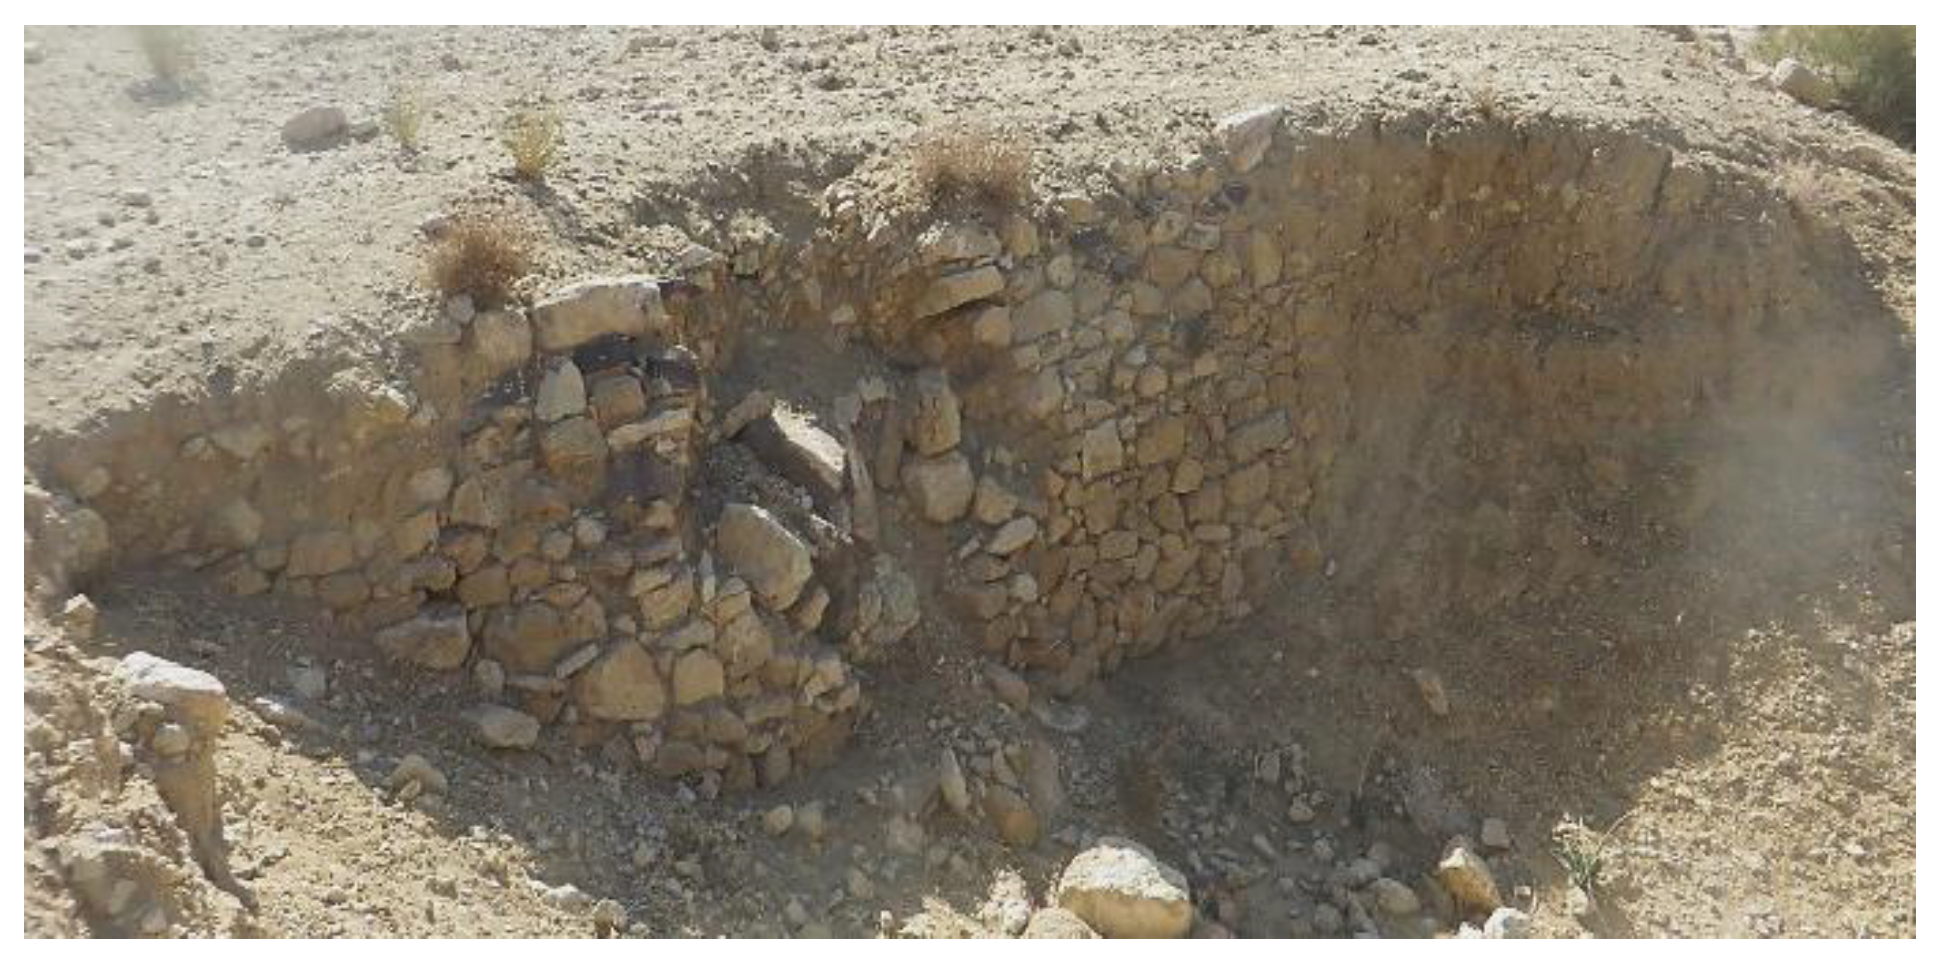
Figure 3.
Terraces at al-Muderej.
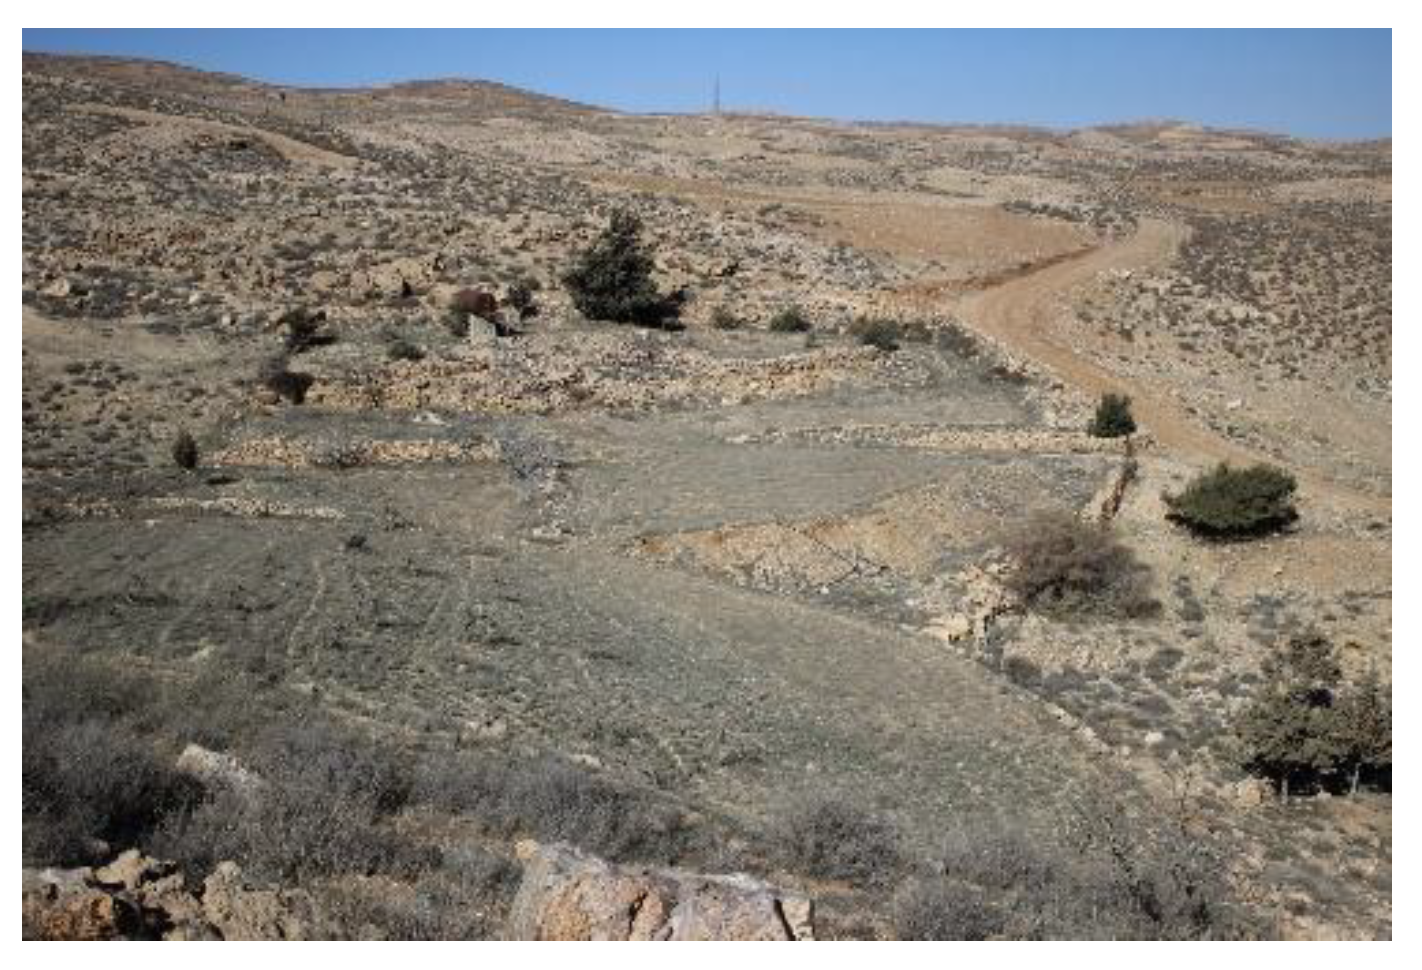
Figure 4.
Terrace system at Hujaim.
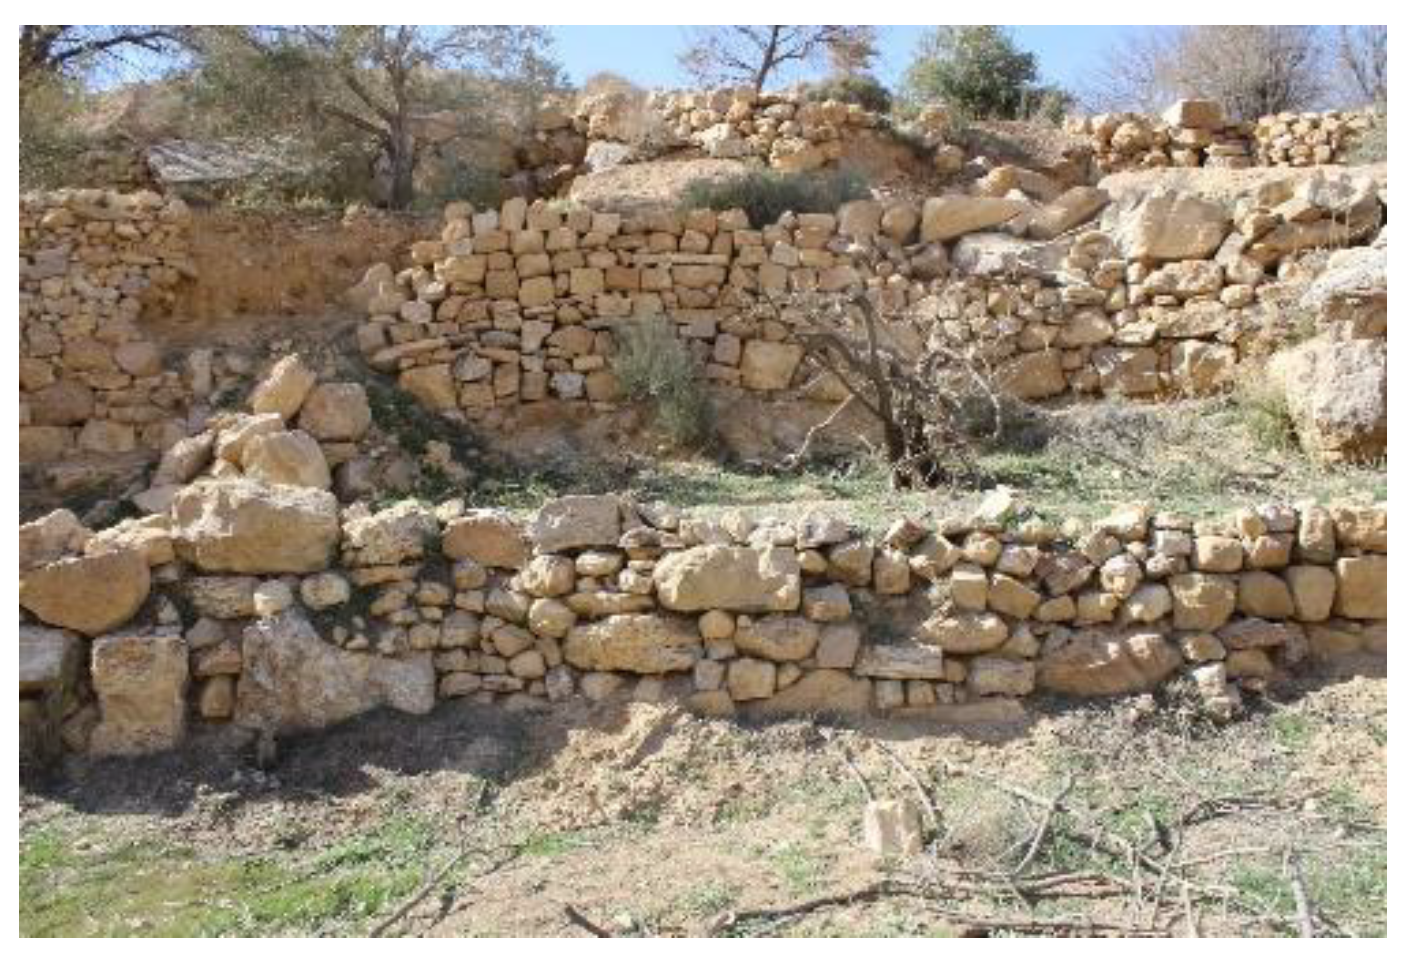
Figure 5.
The site of Muzera’a (Google Earth).
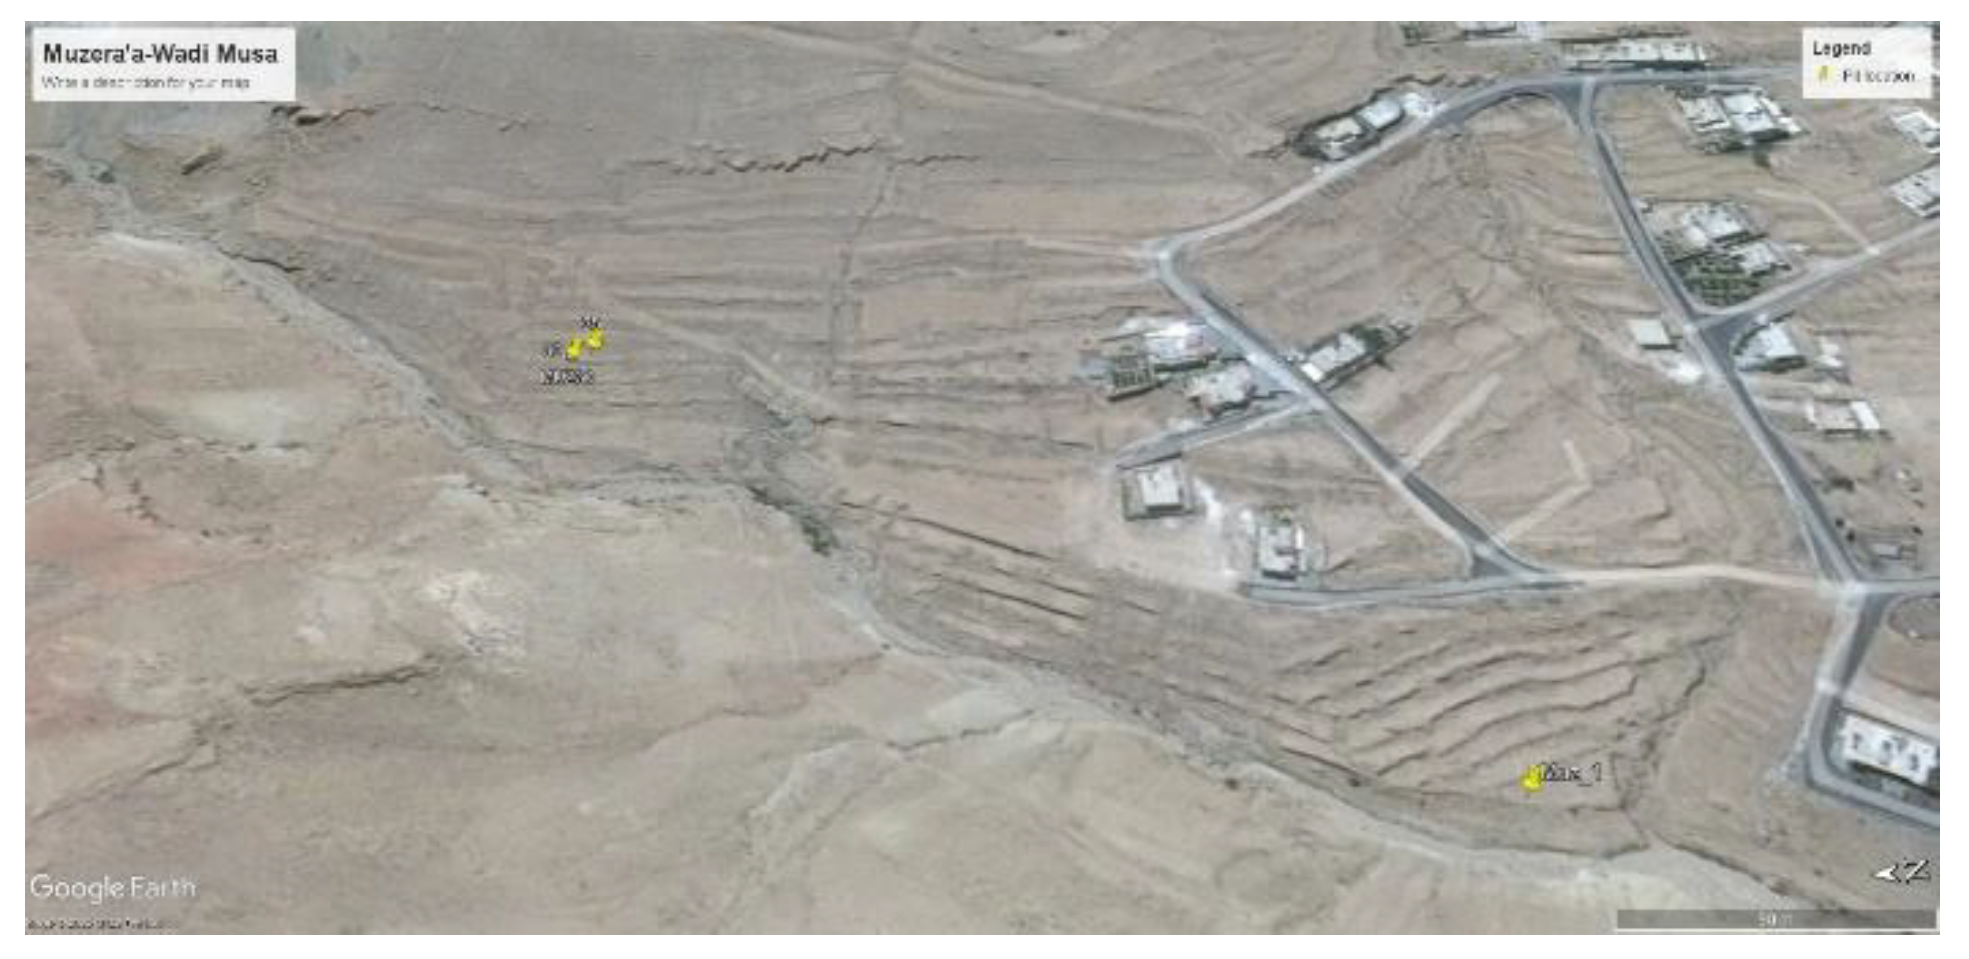
Figure 6.
The terrace system of Braq.
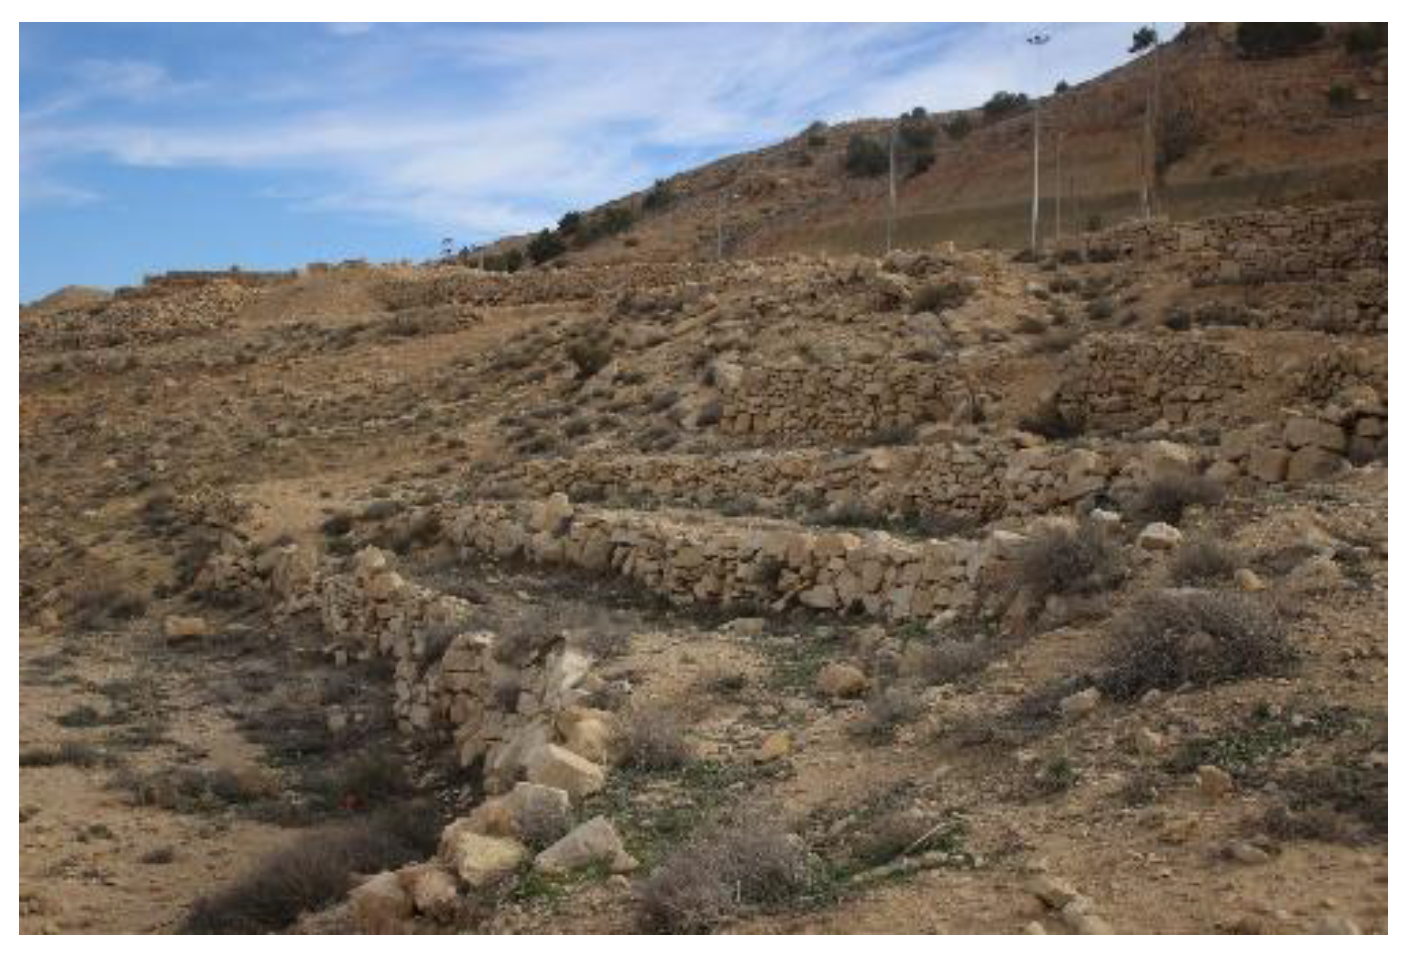
Figure 7.
The site of Hremiyyeh.
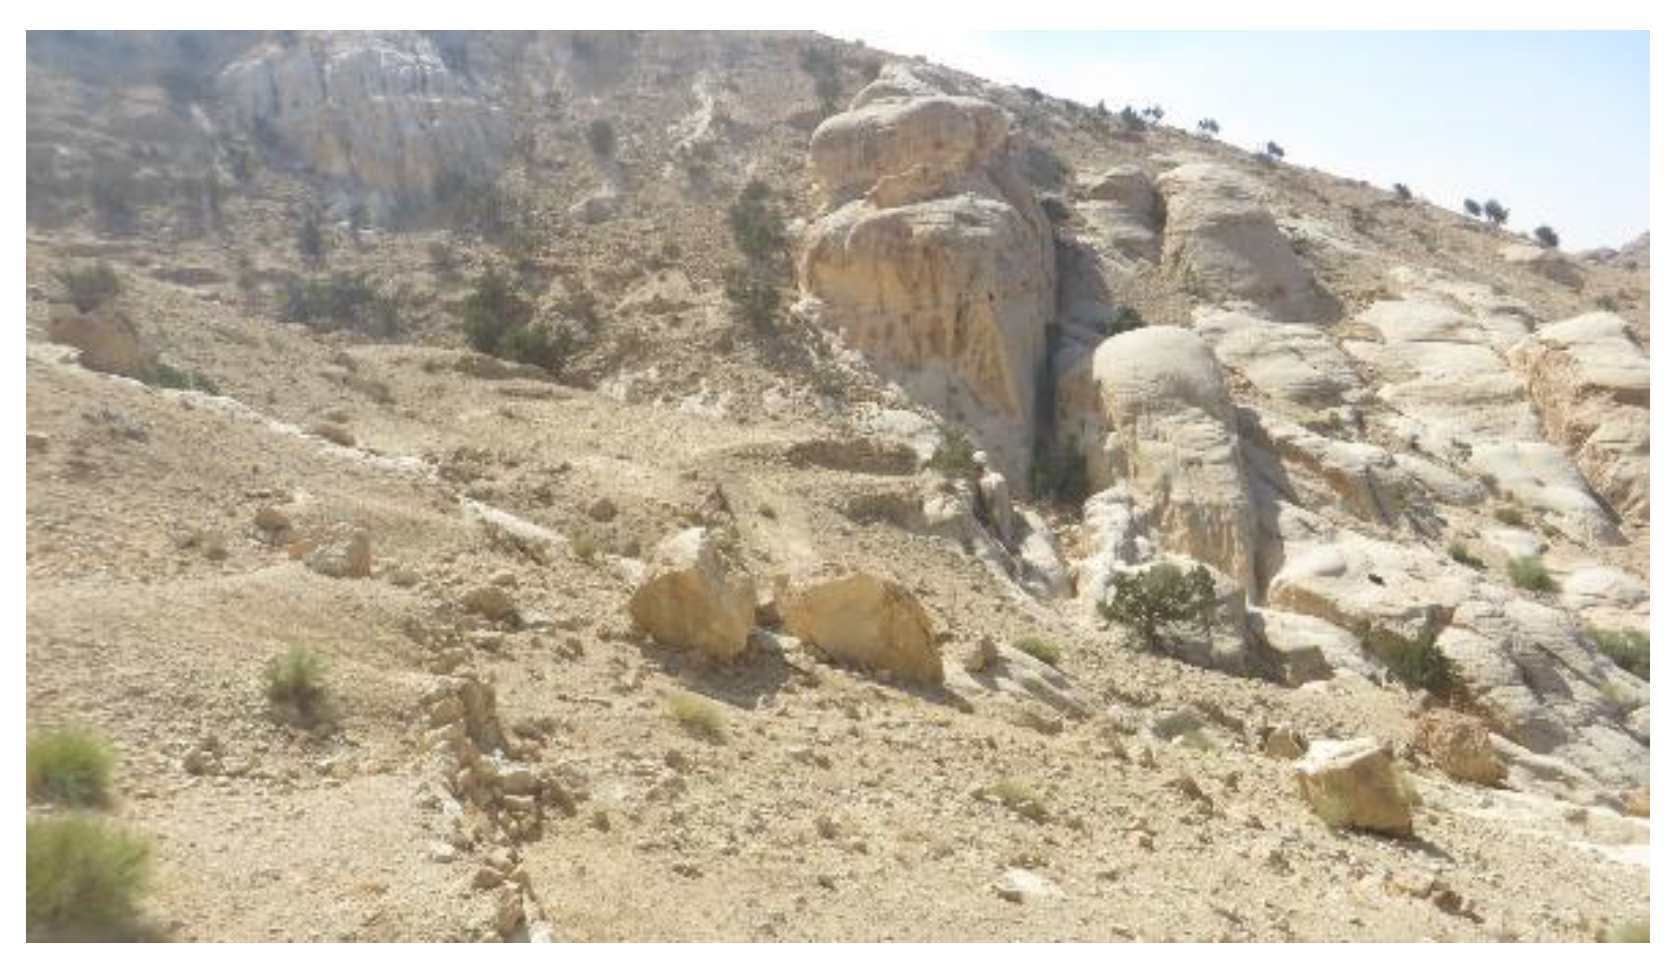
Figure 8.
The terraced platue at Beidha.
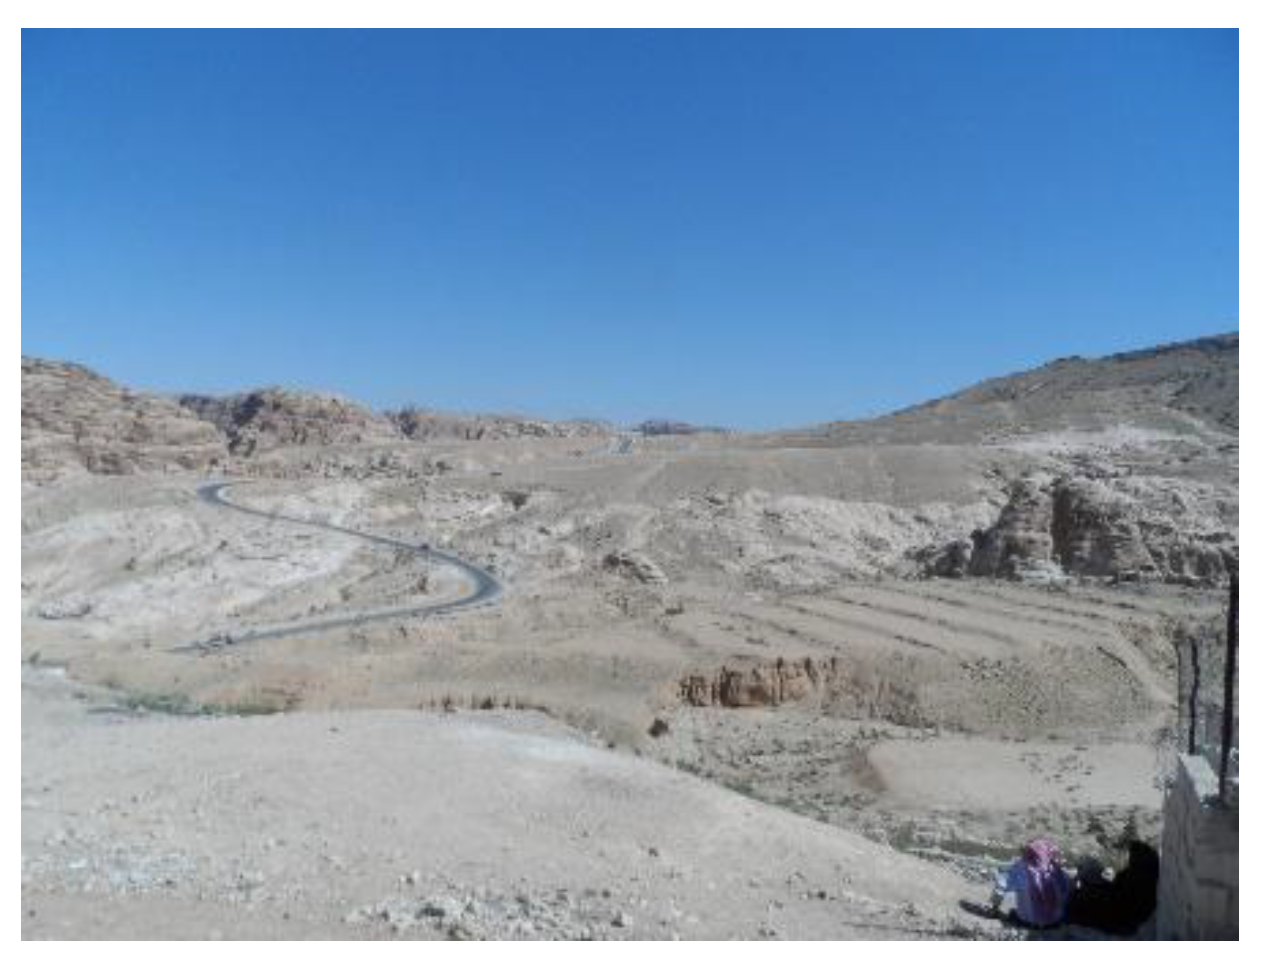
Figure 9.
Beqa’a terrace system.
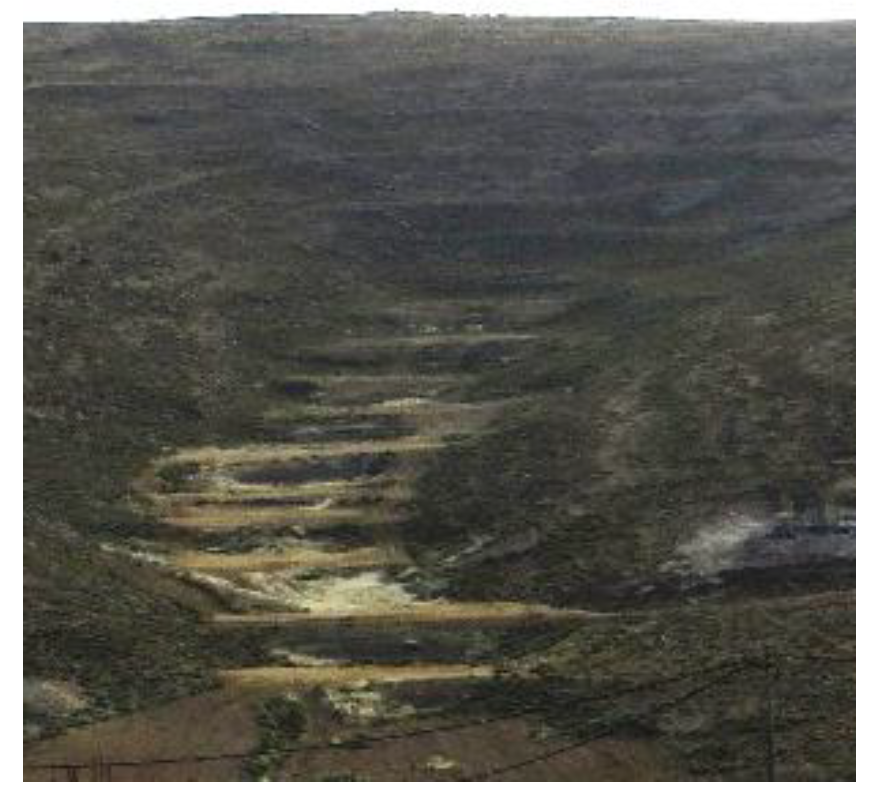
Figure 10.
Taybeh terrace system.
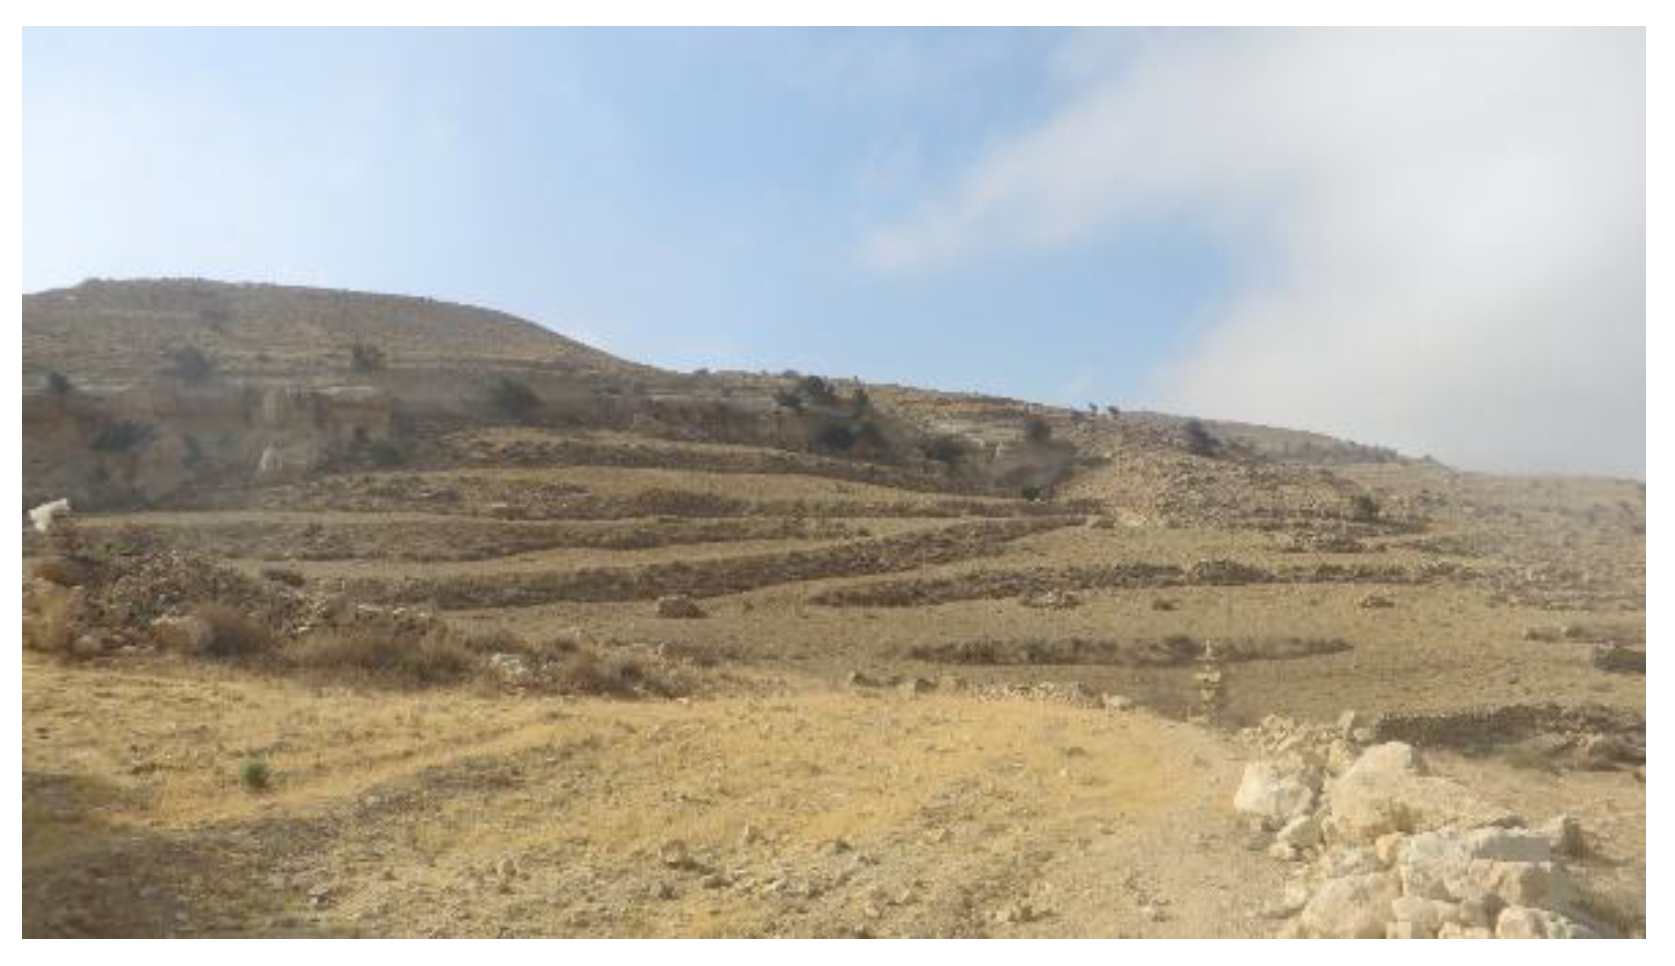
Figure 11.
Distribution of pits according to type (under the terrace, behind or unterraced) at the site of Braq.
Figure 11.
Distribution of pits according to type (under the terrace, behind or unterraced) at the site of Braq.
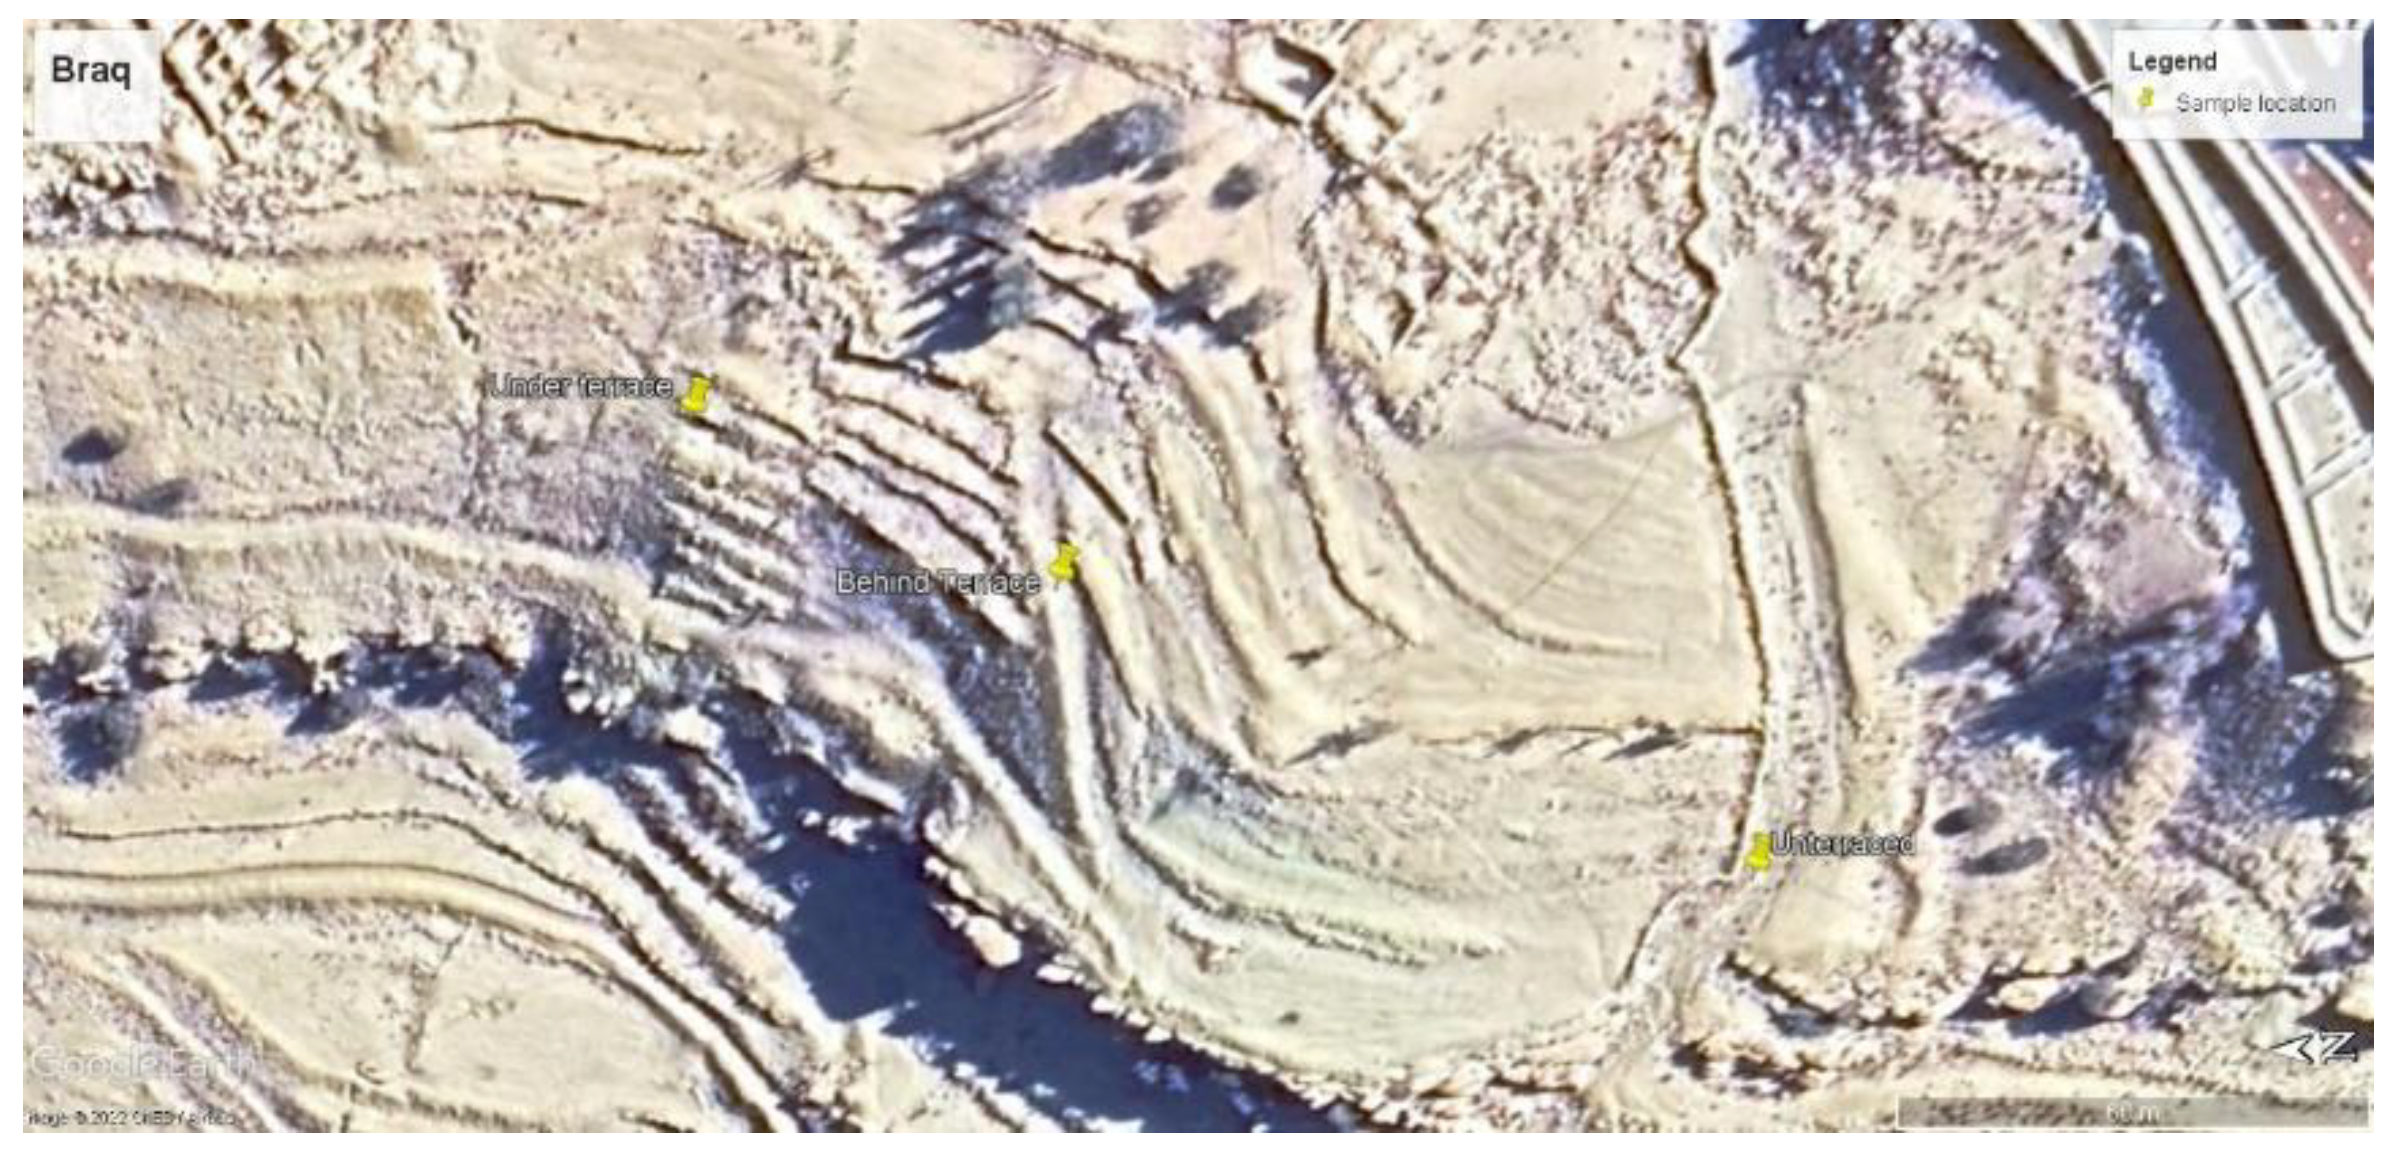
Figure 12.
Soil classification based on the dry sieve.
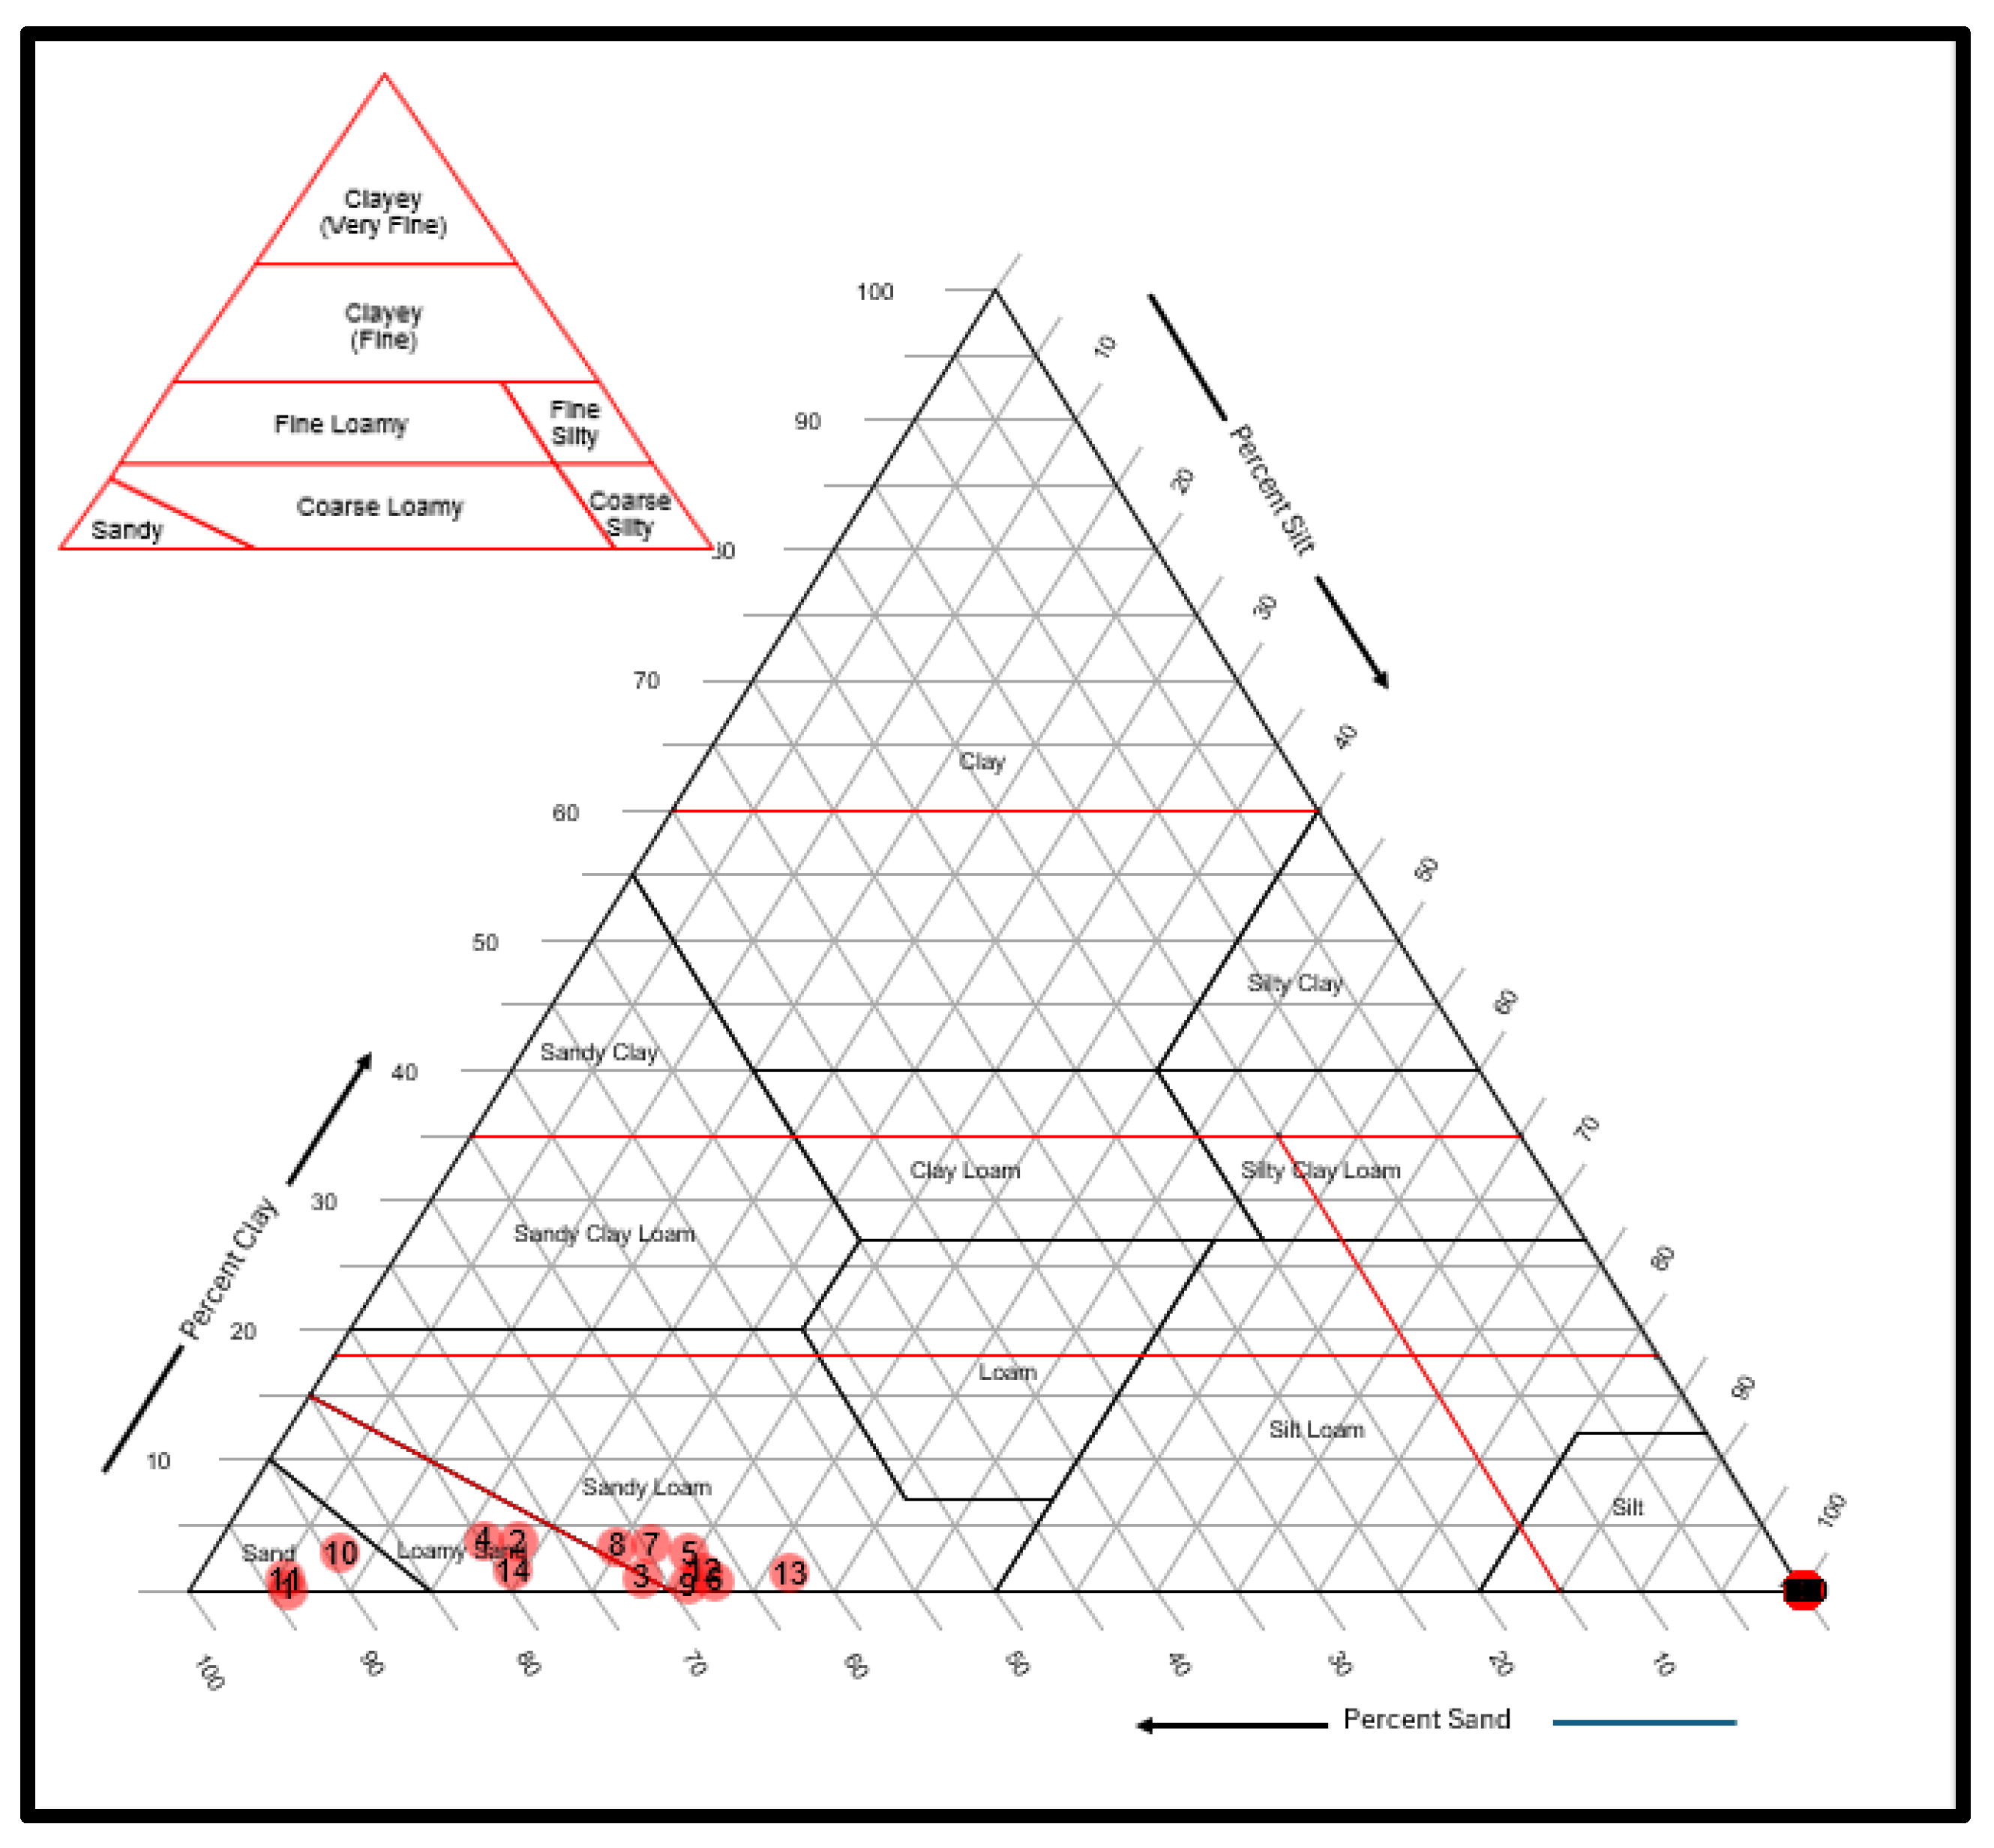
Figure 13.
Sample texture classification based on wet sieve.
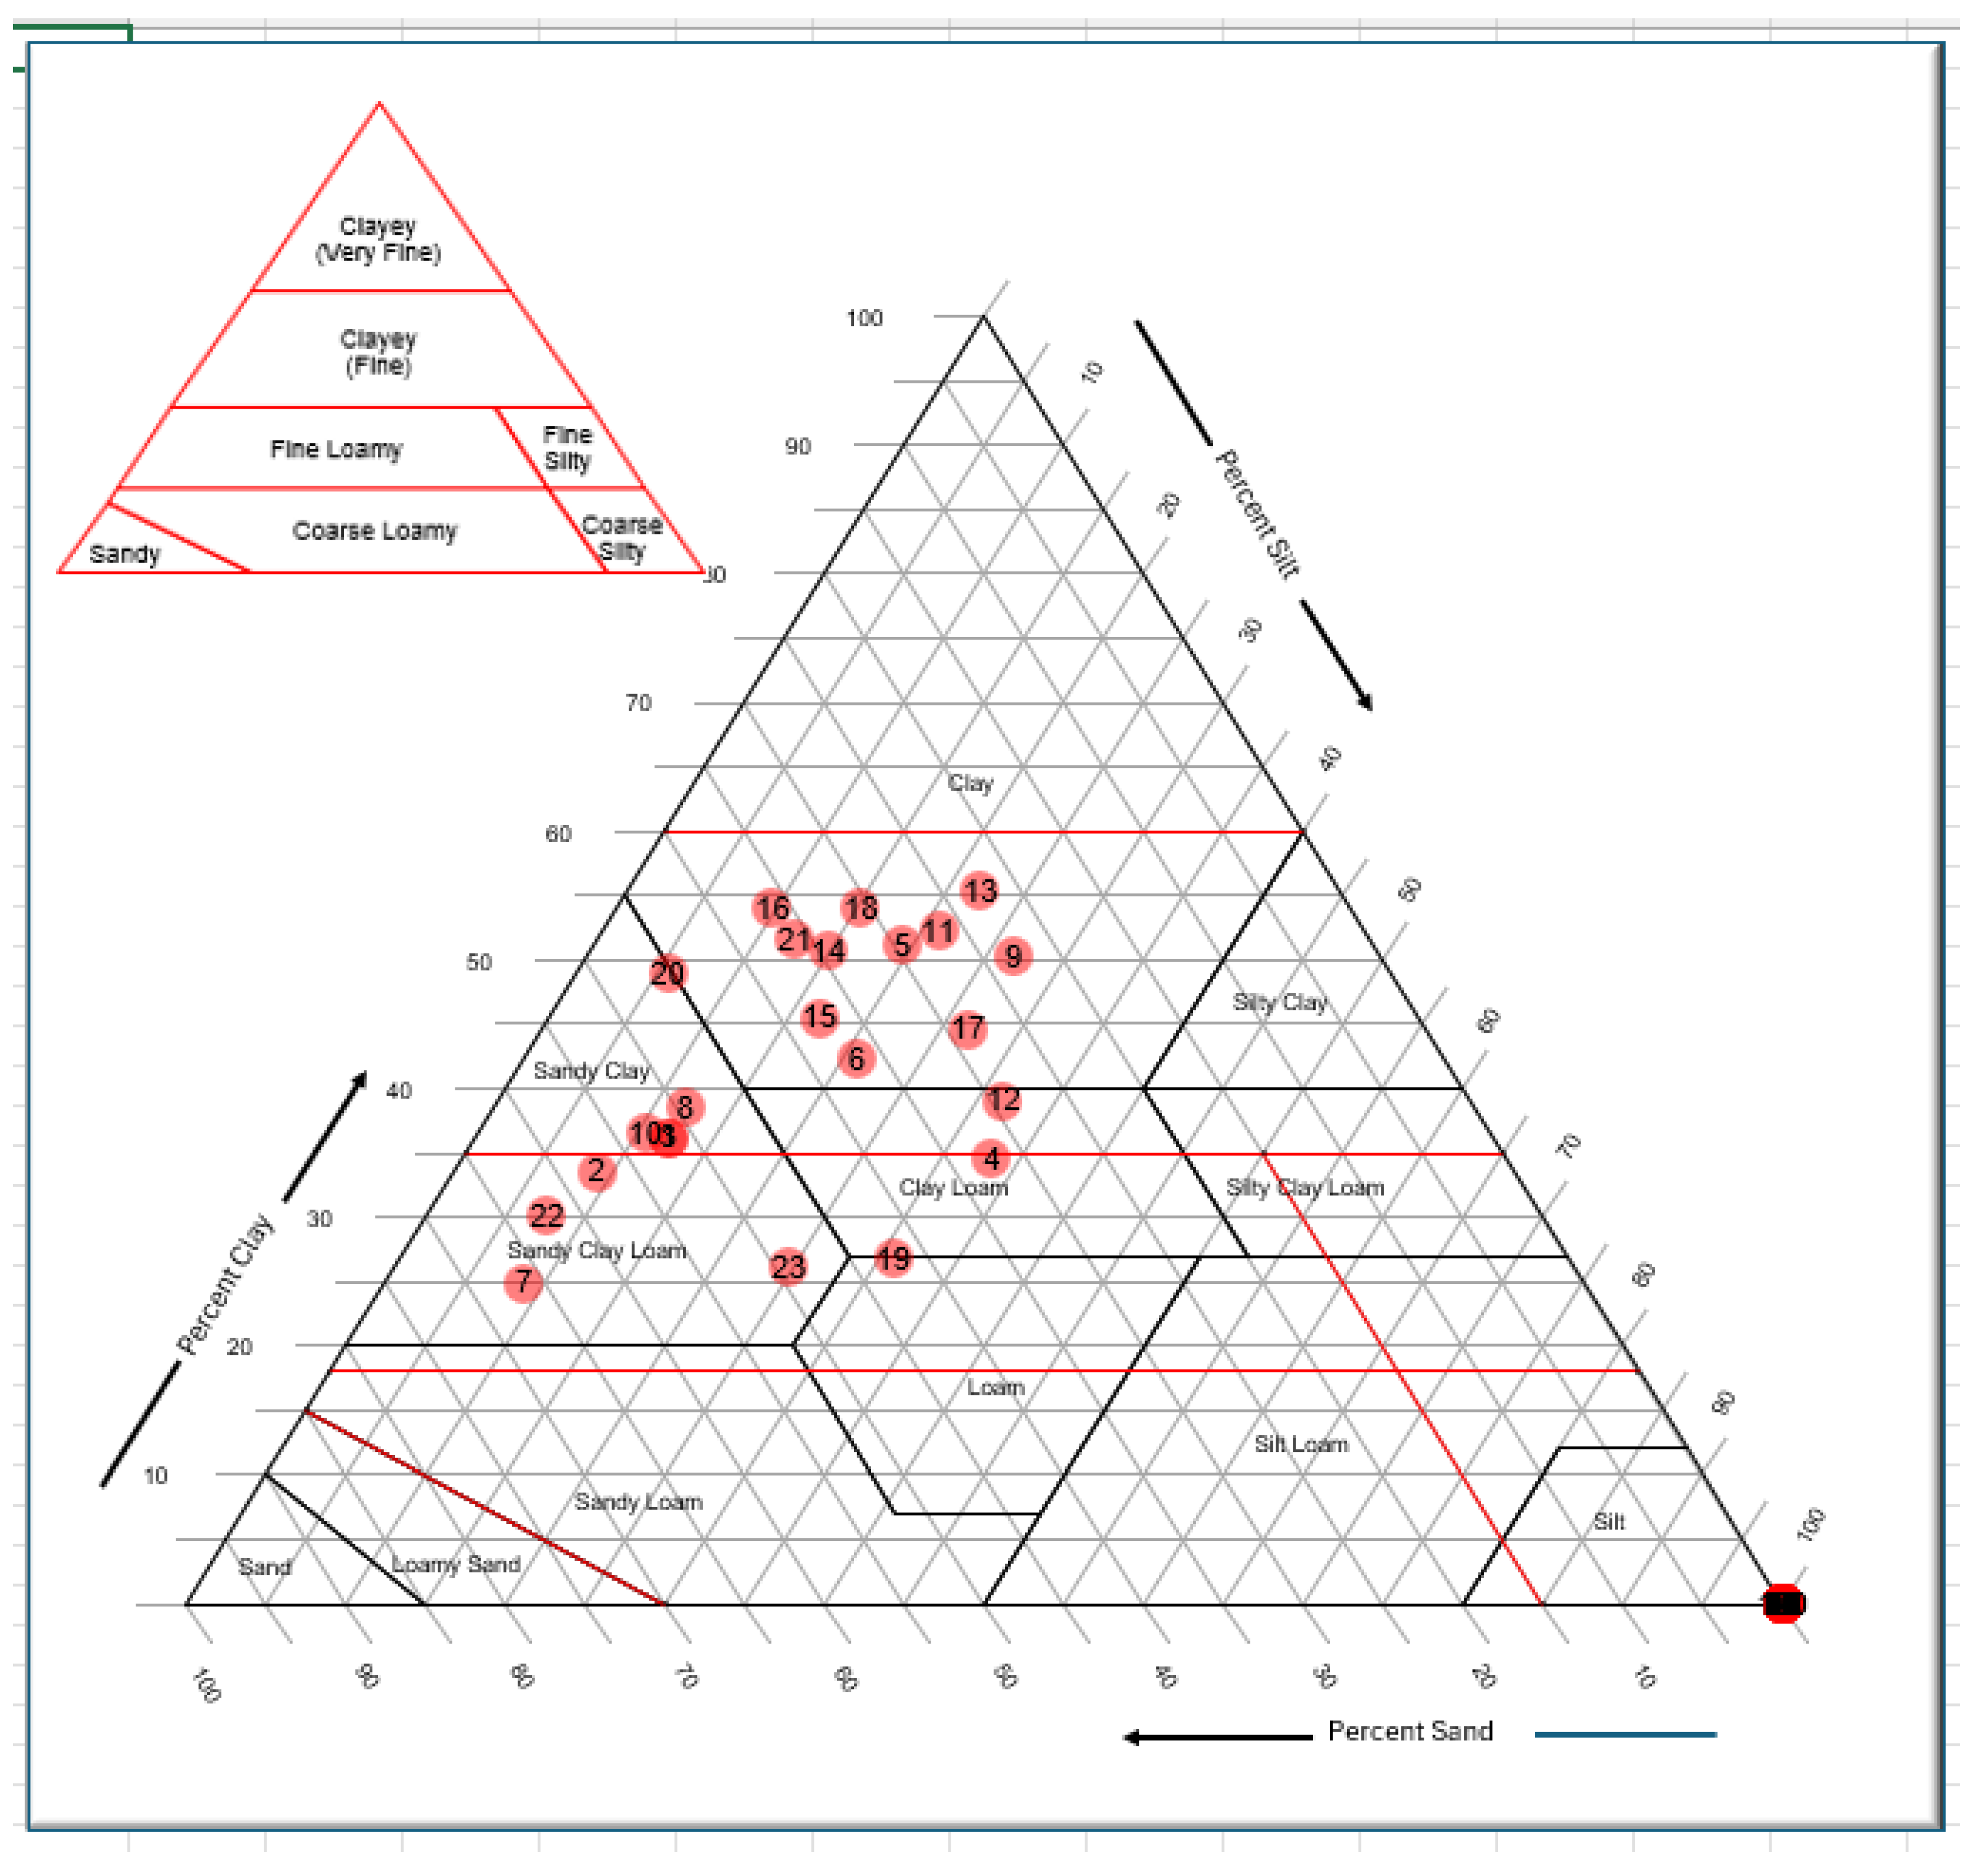
Figure 14.
TDS vs Nitrate.
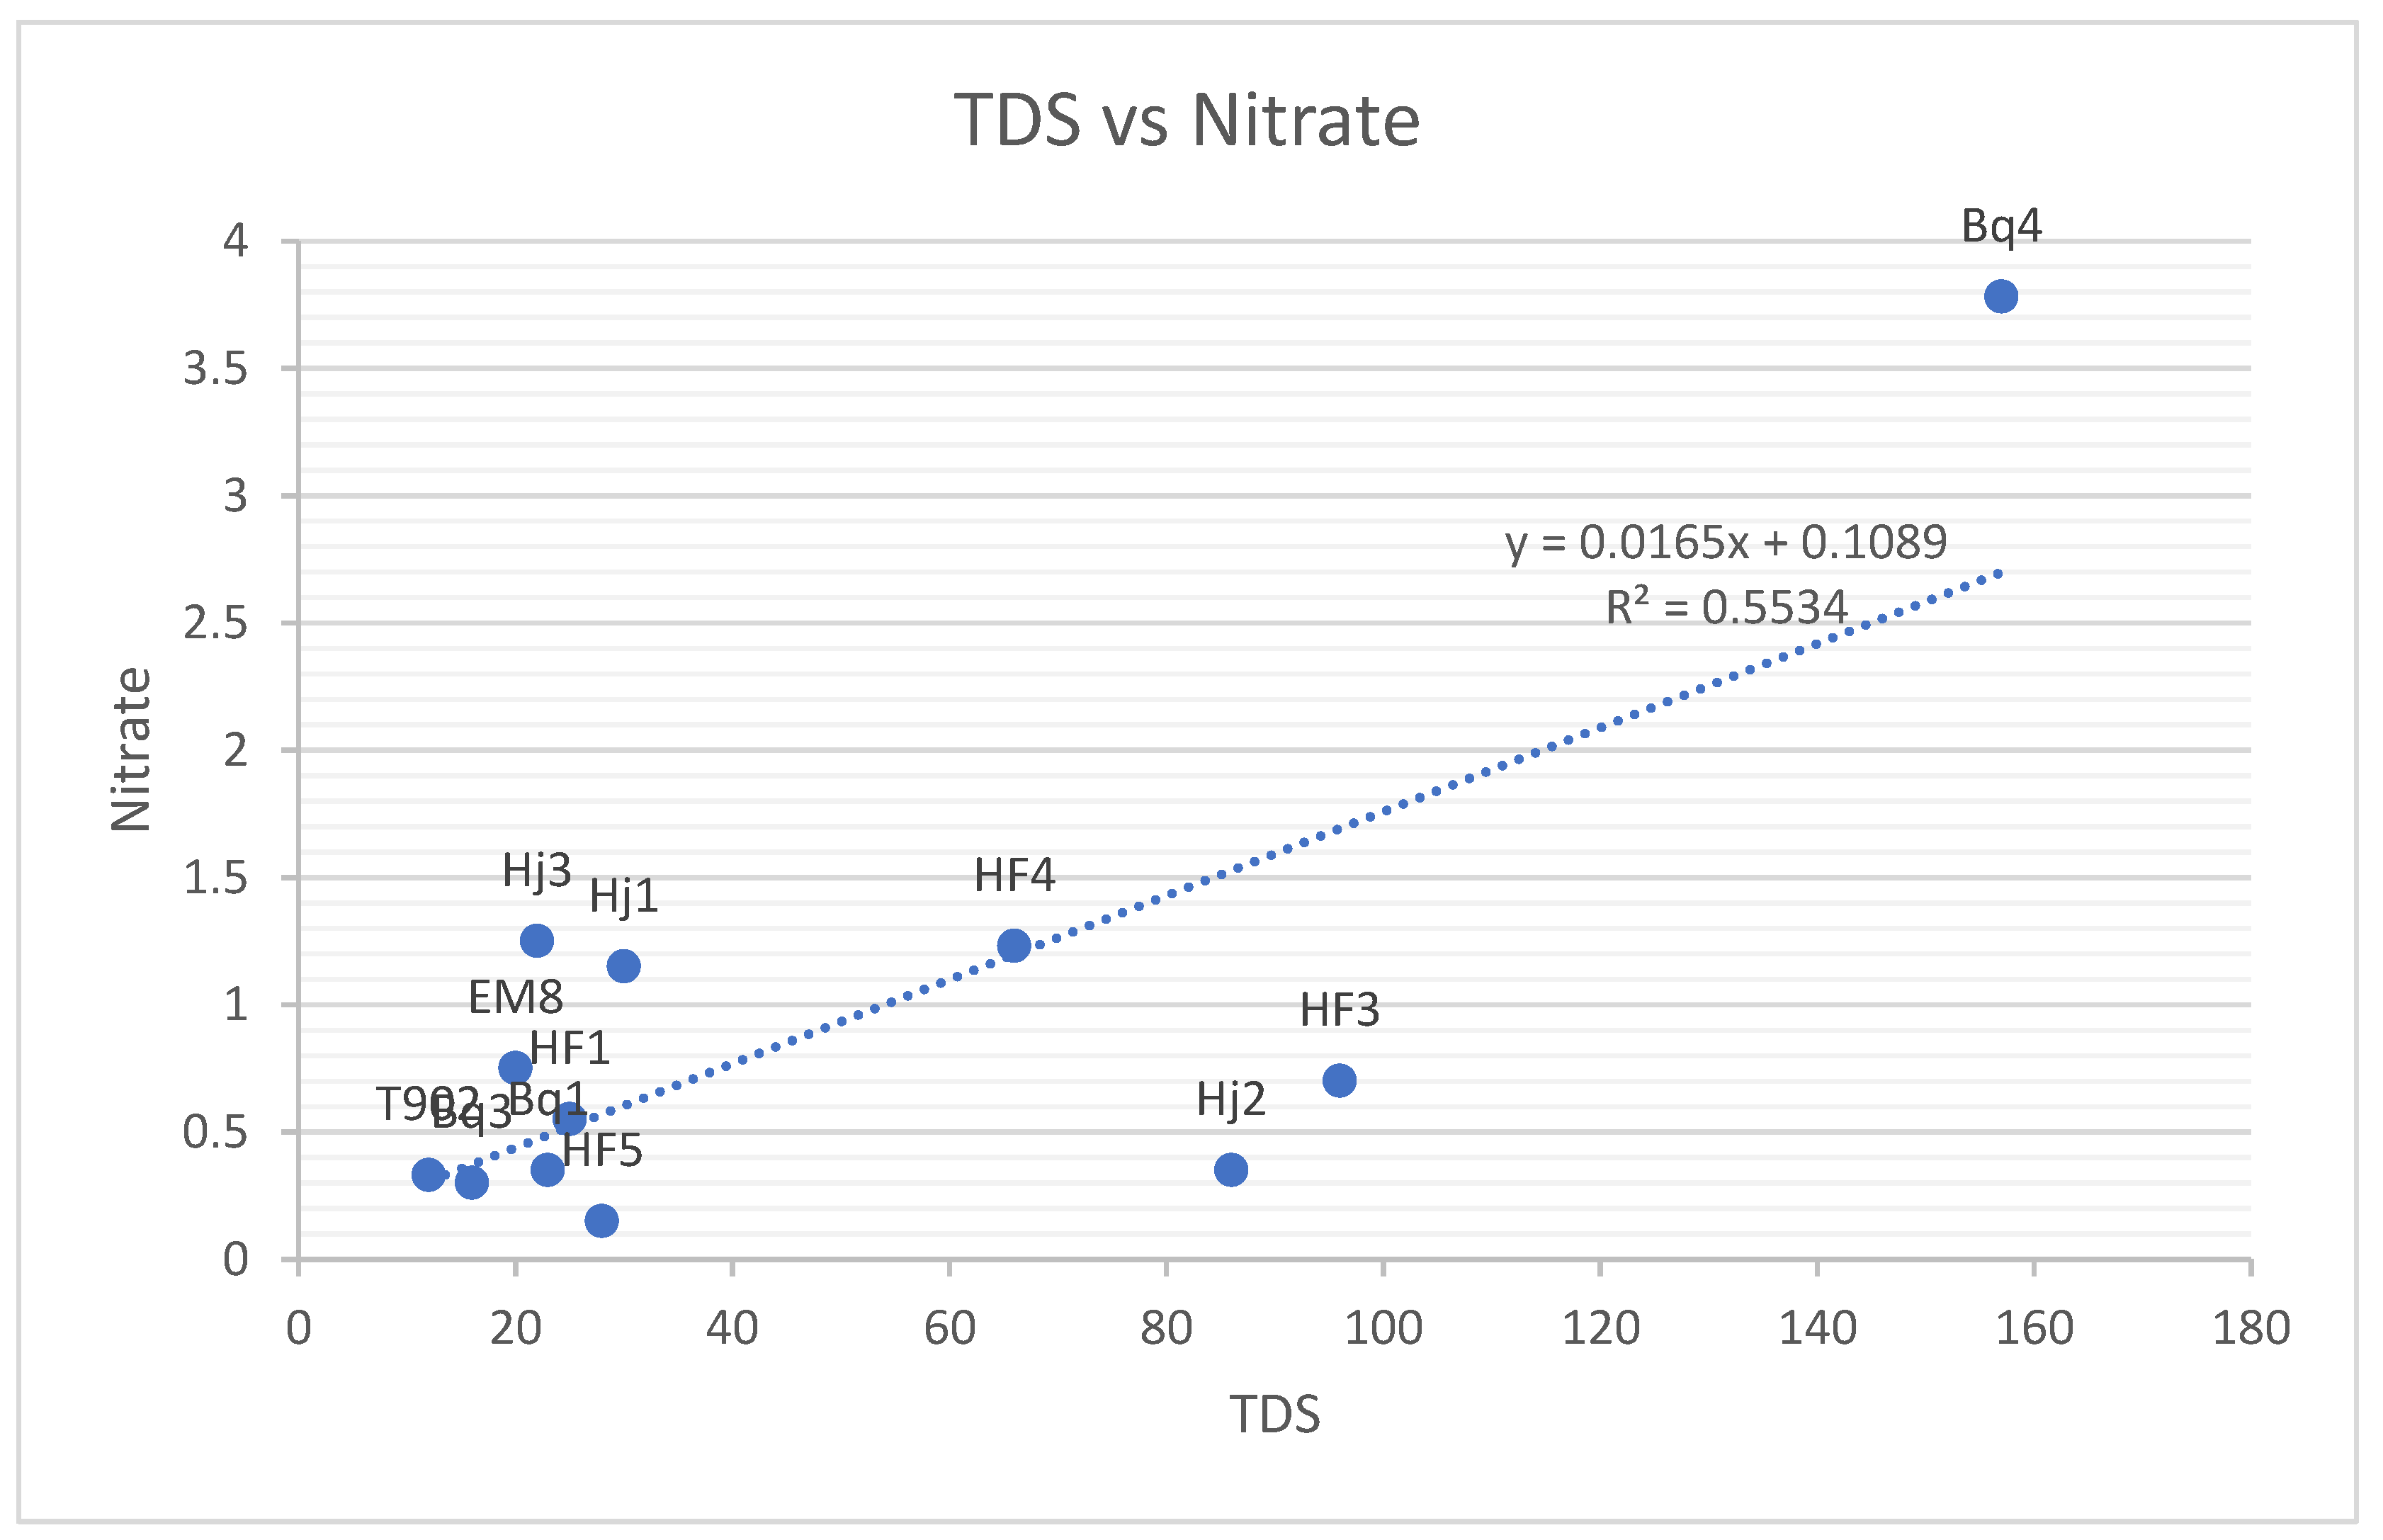
Figure 15.
Clusters of soils based on clay content and salinity.
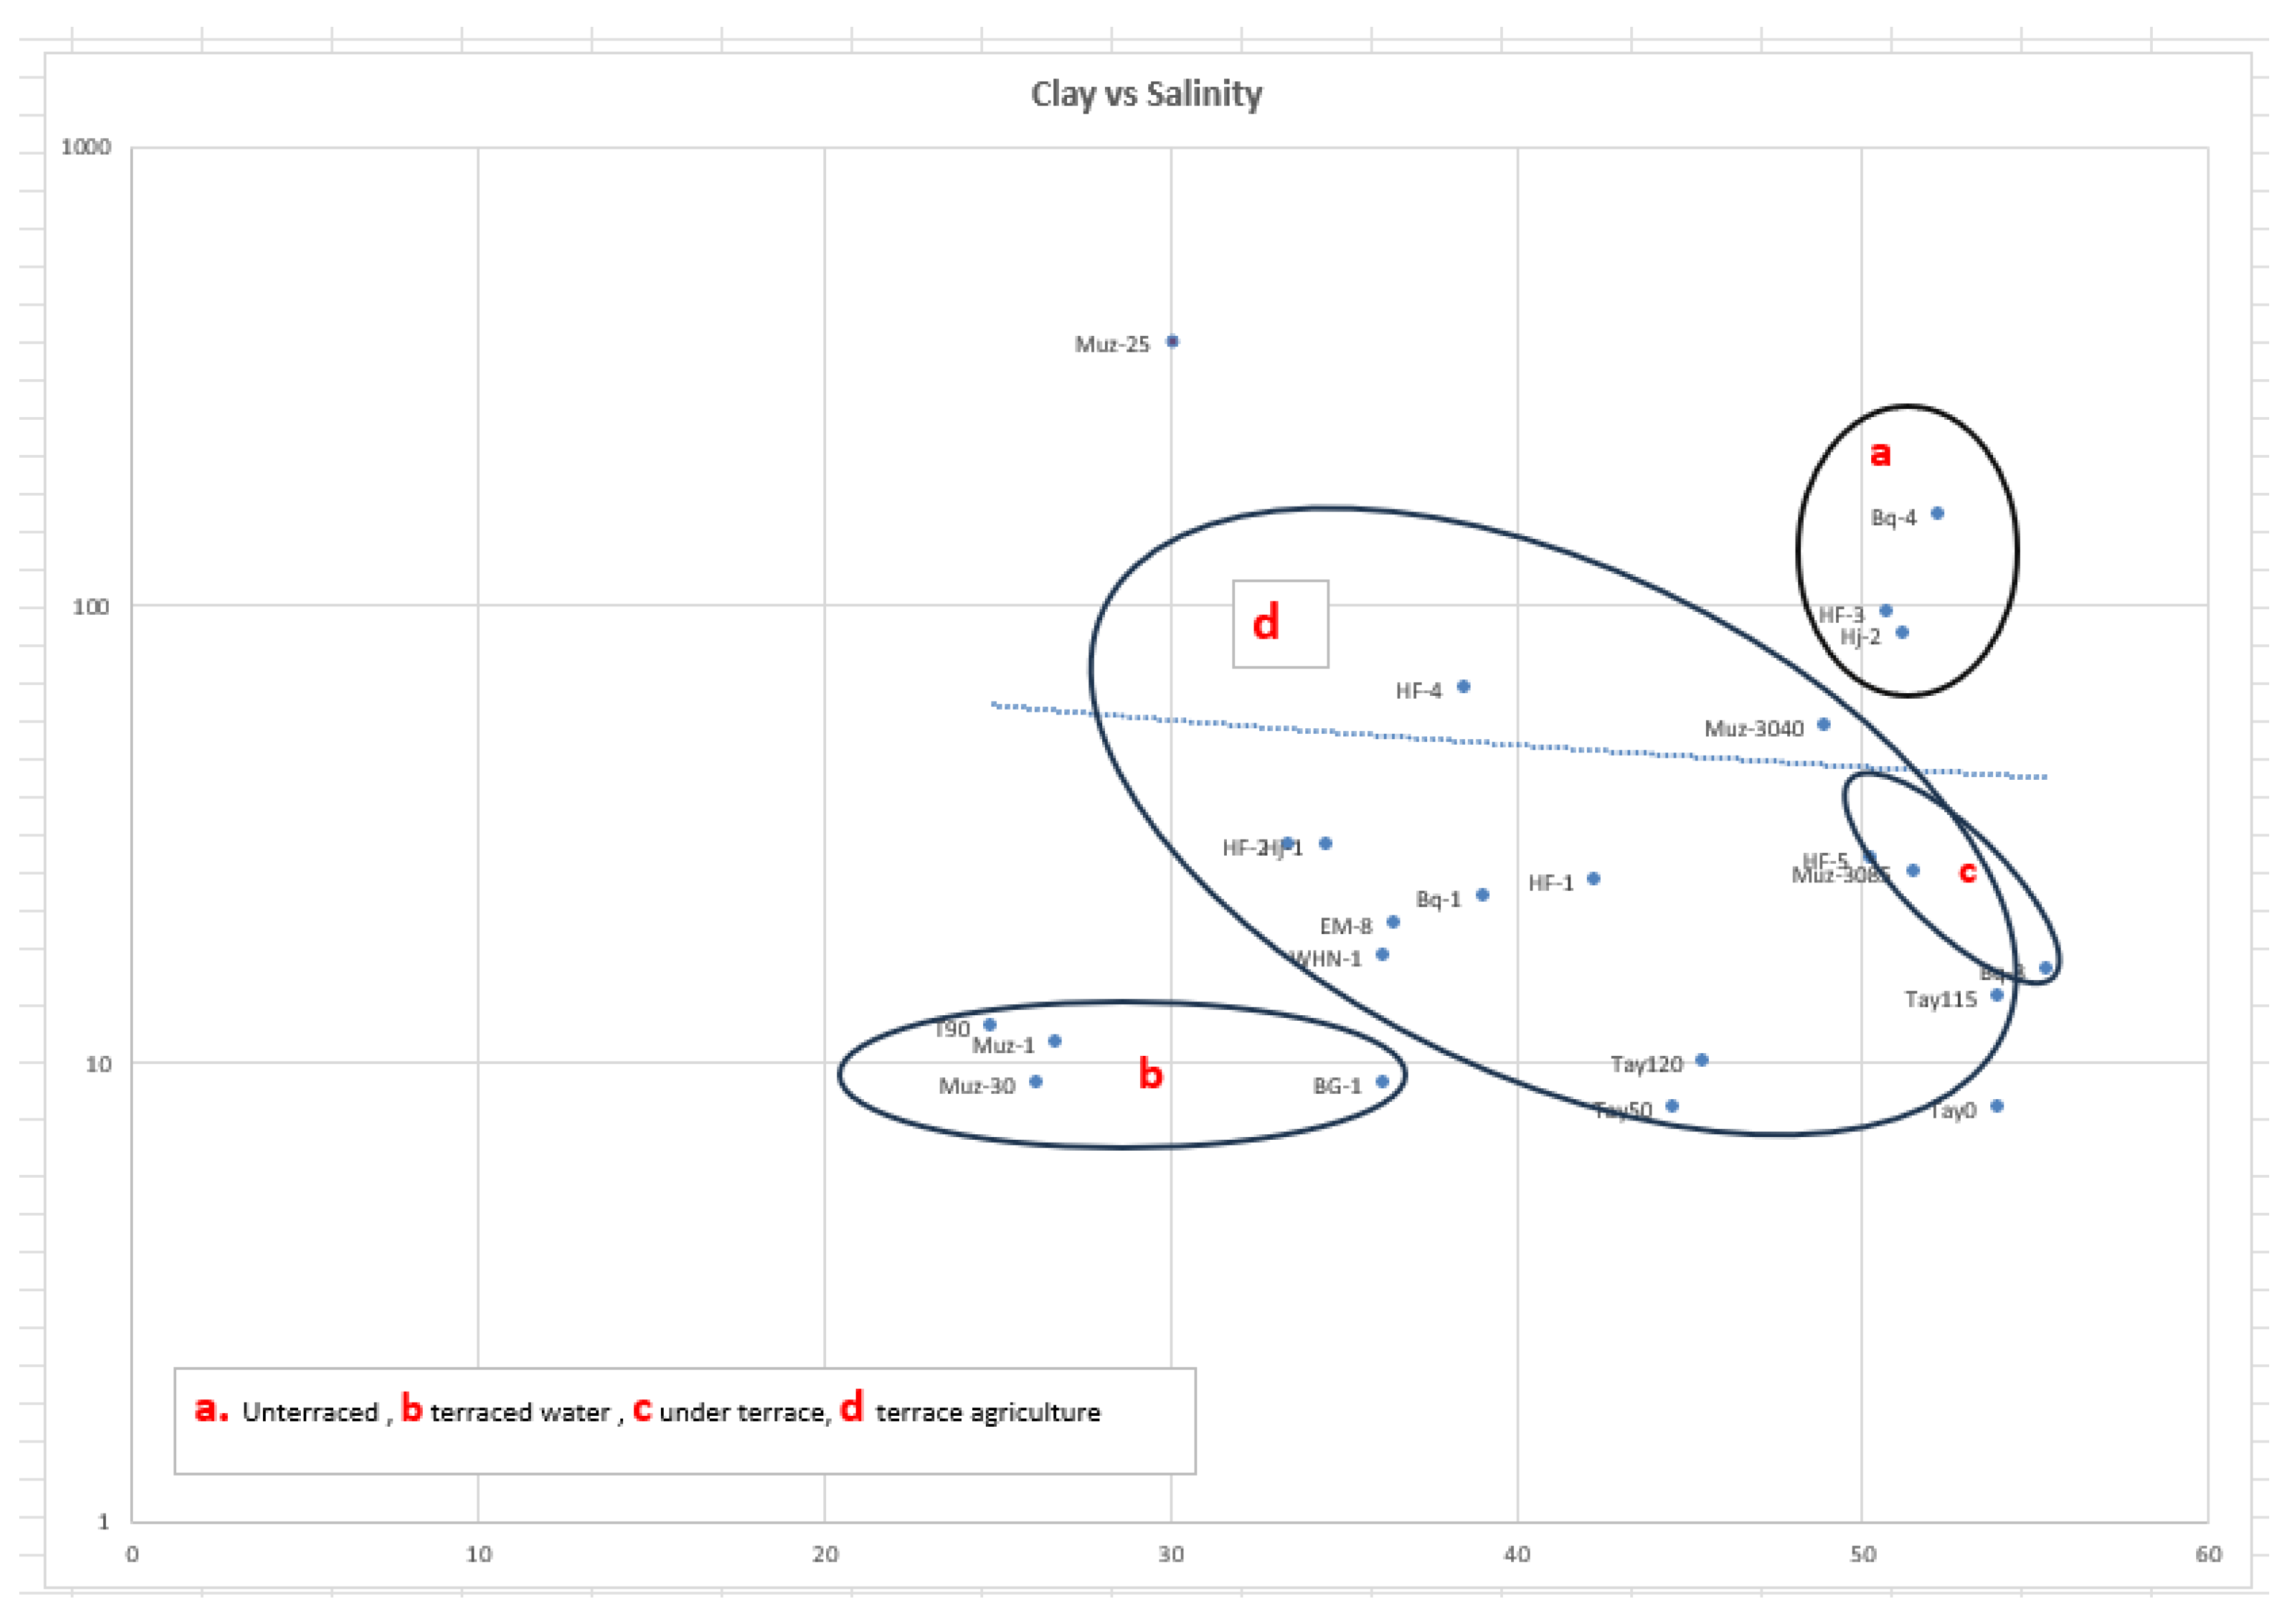

Table 1.
Pit locations and sampling site characteristics.
| Sample ID | Sample description | Elevation | Coordinates | |
|---|---|---|---|---|
| Easting (m E) | Northing (m N) | |||
| T90 | Hremiyyeh behind terrace | 1100 | 736335.00 | 3355685.00 |
| HF1 | Muderej farm Unterraced | 1576 | 741296.87 | 3362940.35 |
| HF2 | Muderej Farm wall outside | 1576 | 741277.63 | 3362929.34 |
| HF3 | Muderej Unterraced | 1584 | 741296.87 | 3362940.35 |
| HF4 | Muderej Behind the terrace C | 1575 | 741304.61 | 3362916.46 |
| HF5 | Muderej Under the terrace B wall. | 1576 | 741292.97 | 3362873.38 |
| EM8 | Beidha Behind the terrace | 1022 | 736261.00 | 3359814.00 |
| Hj1 | Hujaim Behind the terrace | 1351 | 739186.98 | 3353882.08 |
| Hj2 | Hujaim Unterraced flood plain | 1349 | 739204.29 | 3353887.00 |
| Bq1 | Braq Behind terrace wall | 1288 | 736829.09 | 3355500.18 |
| Bq3 | Braq under terrace wall | 1286 | 736850.00 | 3355545.00 |
| Bq4 | Braq Unterraced | 1283 | 736792.82 | 3355414.99 |
| WHN-1 | Muderej terrace near the highway | 1587 | 741393.63 | 3362659.59 |
| BG-1 | Beqa’a behind terrace | 1406 | 739908.49 | 3356242.48 |
| Tay0 | Taybeh Surface | 1361 | 737020.23 | 3349107.16 |
| Tay-120 | Taybeh behind terrace 2 at depth 120cm | 1350 | 736868.00 | 3349005.00 |
| y-50 | Taybeh behind terrace 1 depth 50cm | 1347 | 736878.00 | 3349010.00 |
| Tay-115 | Taybeh behind terrace 1 depth 115cm | 1347 | 736878.00 | 3349010.00 |
| Muz-1 | Muzera’a behind First low terrace W of the Wadi | 1158 | 738379.00 | 3358437.00 |
| Muz-3040 | Muzera’a behind central segment terrace N. 30 at depth 40 cm | 1190 | 738550.00 | 3358701.00 |
| Muz-3085 | Muzera’a behind central segment terrace N. 30 at depth 85 cm | 1190 | 738550.00 | 3358701.00 |
| Muz-25 | Muzera’a central segment terrace N. 25 under terrace | 1187 | 738554.00 | 3358695.00 |
| Muz-30 | Behind central segment terrace N. 30 at the surface | 1190 | 738550.00 | 3358701.00 |
Table 2.
Soil Texture Analysis of Samples Using Dry and Wet Sieving Methods (% by Weight).
| Sample ID | Sample location | Gravel (%) | Sand (%) | Fine (%) | Silt (%) | Clay (%) | Texture (Dry) | Sand (%) | Silt (%) | Clay (%) | Texture (Wet) |
|---|---|---|---|---|---|---|---|---|---|---|---|
| WHN-1 | Wall near highway | 6 | 93.9 | 0.1 | 0.03 | 0.08 | Sand | 51.71 | 12.09 | 36.20 | Clay |
| HF-2 | Farm N wall outside | 17.2 | 77.8 | 4.7 | 0.99 | 3.71 | Loamy sand | 57.55 | 8.95 | 33.50 | Sandy clay loam |
| BG-1 | Beqa’a | 27.1 | 71.5 | 1.4 | 0.39 | 1.01 | Loamy sand | 51.71 | 12.09 | 36.20 | Sandy clay |
| Hj-1 | Hujaim village, top horizon | 10.9 | 79.9 | 7.5 | 3.67 | 3.83 | Loamy sand | 32.29 | 33.19 | 34.52 | Clay loam |
| Hj-2 | Hujaim village, floodplain | 27.8 | 67.6 | 3.8 | 0.99 | 2.81 | Sandy loam | 29.51 | 19.28 | 51.21 | Clay |
| HF-1 | South side wadi upstream | 31.3 | 67.1 | 1.1 | 0.36 | 0.74 | Sandy loam | 36.83 | 20.83 | 42.34 | Clay |
| T90 | Hremiyyeh | 22.2 | 69.6 | 4.8 | 1.25 | 3.55 | Sandy loam | 66.42 | 8.71 | 24.87 | Sandy clay loam |
| EM-8 | Beidha | 6.1 | 89.2 | 3.7 | 0.83 | 2.87 | Sand | 53.01 | 10.50 | 36.49 | Sandy clay |
Table 3.
Results of pedogenic carbonate dissolution tests.
| Sample | H2O (mL g−1) | HCl (mL g−1) |
|---|---|---|
| Taybeh | 1.02 | 0.63 |
| Muz-1 | 1.83 | 0.73 |
| Hj-1 | 0.98 | 1.03 |
| HF-5 | 2.13 | 1.42 |
| EM-8 | 2.8 | 3.6 |
| BG-1 | 2.4 | 2.0 |
| Braq | 5.0 | 4.5 |
| T90 | ND a | ND a |
a ND = no observable dissolution under the applied test conditions.
Table 4.
Chemical analysis results of soil samples.
| Sample ID | NO3–N (mg g−1 soil) | Total P (mg g−1) | Inorganic P (mg g−1) | Organic P (mg g−1)a | pH | K (mg g−1) |
|---|---|---|---|---|---|---|
| T90 | 0.33 | 0.37 | 0.055 | 0.315 | 9.92 | 2.05 |
| HF1 | 0.55 | 0.25 | 0.095 | 0.155 | 10.28 | 1.10 |
| HF3 | 0.70 | 0.17 | 0.075 | 0.095 | 10.22 | 0.85 |
| HF4 | 1.23 | 0.125 | 0.060 | 0.065 | 8.66 | 1.50 |
| HF5 | 0.15 | 0.195 | 0.075 | 0.120 | 9.91 | 1.10 |
| Hj1 | 1.15 | 0.145 | 0.115 | 0.030 | 8.72 | 3.90 |
| Hj2 | 0.35 | 0.095 | 0.095 | 0.000 | 8.66 | 1.60 |
| Hj3 | 1.25 | 0.165 | 0.075 | 0.090 | 9.02 | 0.80 |
| Bq1 | 0.30 | 0.140 | 0.085 | 0.055 | 10.28 | 3.45 |
| Bq3 | 0.35 | 0.070 | 0.040 | 0.030 | 10.29 | 3.05 |
| Bq4 | 3.78 | 0.080 | 0.035 | 0.045 | 10.20 | 2.10 |
| EM-8 | 0.75 | 0.120 | 0.050 | 0.070 | 10.13 | 1.40 |
a Organic P calculated as Total P—Inorganic P.
Table 5.
Sample Total Dissolved Solids (TDS) Results.
| Sample ID | Sample location | TDS (mg/L) |
|---|---|---|
| T90 | Hremiyyeh behind terrace | 12 |
| HF1 | S side wadi upstream near al-Muderej | 25 |
| HF3 | N. side of wadi upstream al-Muderej | 96 |
| HF4 | al-Muderej behind terrace C | 66 |
| HF5 | Under terrace B al-Muderej Farm | 28 |
| Hj1 | Hujaim Village behind terrace | 30 |
| Hj2 | Hujaim Village floodplain horizon | 86 |
| Hj3 | Hujaim under terrace wall | 22 |
| Bq3 | Soil under Braq terrace | 16 |
| Bq1 | Braq behind terrace wall | 23 |
| Bq4 | Braq unterraced | 157 |
| EM8 | Beidha | 20 |
| WNH-1 | Terrace near highway | 17 |
| BG-1 | Beqa’a | 9 |
| Muz30 | Muzera’a near surface | 9 |
| Muz3040 | Muzera’a terrace 30 depth 40 | 54 |
| Muz3085 | Muzera’a terrace 30 depth 85 | 26 |
| Muz 25 | Behind the wall | 376 |
| Muz 1 | Muzera’a behind First low terrace W of the Wadi | 11 |
| Tay115 | Taybeh depth 115 | 14 |
| TayS0 | Taybeh Surface | 8 |
| Tay120 | Taybeh depth 120 | 10 |
| Tay50 | Taybeh depth 50 | 8 |
Disclaimer/Publisher’s Note: The statements, opinions and data contained in all publications are solely those of the individual author(s) and contributor(s) and not of MDPI and/or the editor(s). MDPI and/or the editor(s) disclaim responsibility for any injury to people or property resulting from any ideas, methods, instructions or products referred to in the content. |
© 2025 by the authors. Licensee MDPI, Basel, Switzerland. This article is an open access article distributed under the terms and conditions of the Creative Commons Attribution (CC BY) license (http://creativecommons.org/licenses/by/4.0/).
Copyright: This open access article is published under a Creative Commons CC BY 4.0 license, which permit the free download, distribution, and reuse, provided that the author and preprint are cited in any reuse.


