
Submitted:
19 December 2025
Posted:
22 December 2025
You are already at the latest version
Abstract
Type 2 diabetes mellitus (T2DM) is strongly associated with cardiovascular mortality, with coronary artery disease (CAD) being the main manifestation. The pathophysiology of this condition is exacerbated by the accumulation of advanced glycation end-products (AGEs), specifically carboxymethyllysine (CML), which intensifies inflammation, vascular dysfunction, and the progression of atherosclerosis. Considering that diet is the primary exogenous source of these compounds and a modifiable risk factor, this study aimed to evaluate the effect of a low-CML diet on reducing serum levels in patients with T2DM and CAD. This was a randomized clinical trial involving 36 overweight elderly patients, divided into an intervention group (n=19, assigned to a low-CML diet) and a control group (n=17), over a period of 15 days. The intervention reduced CML intake by approximately 56% (p<0.001), resulting in a 30% decrease in serum CML (from 2.90 to 2.03 µg/g; p=0.015). The proposed diet also increased fiber intake and significantly reduced the consumption of trans fatty acids, polyunsaturated fatty acids, and cholesterol. A positive correlation was observed between serum CML and lipid peroxidation (r=0.33; p=0.045), body water (r=0.35; p=0.03), and dietary AGEs (r=0.52; p<0.01), indicating a relationship with oxidative stress and osmolarity. We conclude that reducing CML consumption for 15 days, through temperature control in food preparation, proved to be an effective nutritional strategy. The intervention promoted vascular and metabolic protection, suggesting potential for ameliorating diabetes complications. Future studies with a longer duration and the development of Brazilian food composition tables are recommended to expand upon these findings.
Keywords:
carboxymethyllysine
; dietary advanced glycation end-products
; Type 2 diabetes mellitus
; coronary artery disease
; randomized clinical trial
1. Introduction
Diabetes Mellitus (DM) is one of the most urgent global public health issues of the 21st century [1]. Since the etiological distinction was made in the 1930s [2], it has been recognized that Type 2 Diabetes Mellitus (T2DM) accounts for the majority of cases, with a worldwide prevalence of over 90% [3]. T2DM is pathophysiologically characterized by a complex interaction between insulin resistance (IR) and progressive pancreatic β-cell dysfunction, leading to chronic hyperglycemia that disrupts metabolic homeostasis [4,5]. The current epidemiological outlook is alarming: recent estimates suggest that 589 million people live with the condition, and projections show a continuous rise in prevalence and mortality—especially evident in Brazil, where deaths and diagnoses are increasing [6]. The morbidity and mortality linked to T2DM are closely connected to cardiovascular health. Clinical evidence shows that up to 80% of diabetic patients die from heart-related causes, with coronary artery disease (CAD) being the primary clinical manifestation [7]. This connection is mediated by shared modifiable risk factors, such as visceral obesity, hypertension, and atherogenic dyslipidemia, which foster a chronic inflammatory state and endothelial dysfunction [8,9,10]. Hyperglycemia worsens this pro-atherogenic environment by triggering harmful metabolic processes, including the overproduction of reactive oxygen species (ROS), which leads to systemic oxidative stress [11]. In this context of metabolic stress, the role of advanced glycation end-products (AGEs) is underscored [12]. These compounds form through non-enzymatic reactions between reducing sugars and amino groups of proteins, lipids, or nucleic acids, resulting in irreversible molecular modifications [13]. Patients with T2DM tend to have higher serum levels of AGEs—up to 50% more—due to hyperglycemia and oxidative stress [14]. Among these, carboxymethyllysine (CML) is the most common and best-studied biomarker, directly linked to the activation of inflammatory pathways, arterial stiffness, and atherosclerosis progression via its interaction with receptors (RAGE) [15]. However, AGEs are not produced exclusively endogenously. The modern diet, typically high in calories and extensively processed using heat, constitutes a major exogenous source of these compounds, known as dietary AGEs [16]. Food preparation methods greatly influence their formation: techniques involving dry heat and high temperatures (such as frying, broiling, and roasting) enhance the Maillard reaction and CML formation, whereas moist or acidic methods (such as boiling, steaming, or marinating) significantly reduce their formation [17]. Since dietary AGEs are absorbed by the gut and contribute to systemic glycotoxins that worsen inflammation and insulin resistance, dietary modification offers a promising therapeutic intervention. The coexistence of T2DM and CAD presents a high-risk profile, in which limiting exogenous CML intake might be key to reducing vascular damage. Therefore, this study aims to examine how reducing CML intake, through dietary modifications and cooking techniques, affects serum levels of inflammatory and glycemic biomarkers in patients with T2DM and CAD.
2. Materials and Methods
Ethical Aspects
The study protocol was approved by the institutional Research Ethics Committee (CAAE: 52932821.9.0000.0068) on 11 November 2021. All procedures adhered to prevailing ethical standards. Participants were fully informed about the objectives and procedures of the study and provided their formal agreement by signing the Informed Consent Form between January 2022 and February 2024.
Design and Population
This single-center, randomized clinical trial was conducted in our outpatient clinic over a 15-day period. Participant recruitment was performed through a systematic review of electronic medical records and outpatient scheduling lists. The inclusion criteria comprised men and women aged 55 to 65 years, diagnosed with T2DM and presenting overweight or obesity. Individuals with insulin-dependent DM, renal failure, hepatic failure, eating disorders, psychiatric disorders, smokers, alcohol consumers, and users of nutritional supplements were excluded. Patients with a BMI between 22 and 27 kg/m² (normal weight), adherents to a plant-based diet, or participants in other concurrent research protocols were also excluded.
Experimental Protocol and Dietary Intervention
After enrollment, participants underwent a baseline evaluation comprising three teleconsultations focused on dietary assessment and one in-person visit for anthropometric measurements and collection of biological specimens. Following these procedures, participants were randomized into two groups: (1) Control Group, instructed to maintain their habitual diet; and (2) Intervention Group, assigned to a diet with restricted CML intake. The intervention group received illustrated educational materials and specific guidelines to prioritize moist cooking methods (boiling, steaming, stewing) and to avoid dry-heat and high-temperature methods (frying, broiling, roasting), in addition to restricting ultra-processed foods. The quantification of dietary CML was based on the database by Uribarri et al. [17], adapted for similar regional foods when necessary. Follow-up consisted of new teleconsultations starting from the seventh day (to verify adherence and collect dietary recalls) and a final in-person assessment at the end of the 15 days.
Dietary Intake Assessment
Dietary intake was assessed using six 24-hour dietary recalls (24HR), comprising three in the pre-intervention phase and three in the post-intervention phase, covering two weekdays and one weekend day in each stage. The Multiple Pass Method was used to detail preparation times, preparation types (including acidic marinades and reheating), commercial brands, and volumes [18]. Visual support was provided through a photographic manual for food quantification. The analysis of nutritional composition (macronutrients, fiber, dietary lipid profile) was performed using Dietbox® software, using the Brazilian Food Composition Table (TACO) as a reference [19].
Anthropometric Assessment and Body Composition
Weight and height measurements were taken on an electronic scale (Filizola® model PL, Teresina (PI), Brazi) with an attached stadiometer, with the patient in an orthostatic position and adhering to the Frankfurt plane. BMI, abdominal circumference (midpoint between the last rib and the iliac crest), and waist-to-height ratio were classified according to the World Health Organization (WHO) [20]. Body composition was evaluated by tetrapolar bioelectrical impedance (BIA) (Tanita® BC601 2018-2020, Maeno-cho, Itabashi-ku, Tokyo, Japan), following a rigorous preparation protocol: 3-hour fasting, abstinence from caffeine/exercise (24h), alcohol (48h), and diuretics (7 days).
Laboratory Analysis
Dosages of glucose, fructosamine, creatinine, LDL, HDL, and TG were performed using a colorimetric assay on an automated Alinity C analyzer (Abbott, TX, USA), utilizing specific kits. Insuline and C-peptide dosages were performed by chemiluminescence on an automated Alinity I analyzer (Abbott), utilizing specific kits.
HDL characterization included determination of HDL particle diameter by dynamic light scattering (Zetasizer Nano ZS90, Malvern, Instr., 31 Worcestershire, United Kingdom) after precipitation of apoB-containing lipoproteins, and esterified cholesterol content was indirectly estimated. Paraoxonase-1 (PON1) activity was assessed by kinetic assay using paraoxon as the enzymatic substrate.
Oxidative stress was evaluated by quantifying thiobarbituric acid-reactive substances (TBARS) in plasma using a colorimetric method (50 µL) following reaction under acidic conditions and high temperature, with results expressed as µmol TBARS/mg protein [21]. Serum CML concentrations were determined using a commercial ELISA kit OxiSelect™ Nε-(carboxymethyl) lysine Competitive (Cell Biolabs®, San Diego, CA - USA) following the manufacturer’s instructions.
Statistical Analysis
The sample size was calculated based on the CML variation reported in the literature [22], estimating 18 participants per group to achieve a test power of 0.80 and an alpha of 0.05. Data normality was verified, and comparisons between groups and time points were performed using the paired Student's t-test (for normally distributed data) or the Wilcoxon test (for non-normally distributed data). Categorical variables were analyzed using the Chi-square test, and correlations were analyzed using Spearman's coefficient. The significance level adopted was p < 0.05.
3. Results
A total of 1,242 patients were screened. Of these, 1,206 were excluded: 169 due to age being less than 55 or greater than 65 years; 240 for not having a T2DM diagnosis; 323 for insulin use; 61 due to renal failure; 141 due to hypothyroidism; 7 due to hepatic dysfunction; 9 due to rheumatic disease; 125 due to smoking; 14 due to alcohol use; 23 due to a diagnosis of depression and/or anxiety; 16 for being classified as normal weight by BMI; 1 due to a plant-based dietary pattern; 14 for participation in other research protocols; and 50 for failing to complete and sign the Informed Consent Form. Additionally, 13 participants did not complete the study protocol. Thus, the final sample consisted of 36 individuals (31 men and 5 women). Of these, 19 were randomized to the dAGEs group, and 17 to the control group (Figure 1).
Thirty-six patients were included in the evaluation, with a mean age of 60 years (55–65), and a predominance of male participants in both the control group (n = 15; 88%) and intervention group (n = 16; 84%). In the control group, the most frequently reported race was white (n = 9; 53%), and the most common education level was incomplete high school (n = 6; 35%). In the intervention group, the most prevalent race was brown-skinned (n = 8; 42%), and the most frequently reported educational level was high school (n = 6; 31%). In both groups, an average household income of two minimum wages was the most co monly cited, corresponding to 65% (n = 11) of participants in the control group and 74% in the intervention group (Table 1).
Regarding dietary composition (Table 2). both groups exhibited statistically significant reductions in the intake of proteins (control group: 86 g to 66 g. p = 0.012; intervention group: 91 g to 74 g. p = 0.044). lipids (control group: 66 g to 58 g. p = 0.023; intervention group: 64 g to 52 g. p = 0.003). monounsaturated fatty acids (control group: 21 g to 16 g. p = 0.006; intervention group: 20 g to 15 g. p = 0.003). and saturated fatty acids (control group: 20 g to 19 g. p = 0.039; intervention group: 22 g to 17 g. p = 0.005). Consequently. a trend toward reduced total caloric intake was also observed (control group: 1910 kcal to 1802 kcal. p = 0.07; intervention group: 1857 kcal to 1656 kcal. p = 0.07).
In the intervention group. additional statistically significant changes were identified. including increased fiber intake (18 g to 22 g. p = 0.03) and reductions in polyunsaturated fatty acids (11 g to 7 g. p = 0.002). trans fatty acids (1.17 g to 0.73 g. p = 0.006). cholesterol (293 mg to 200 mg. p < 0.001). and dietary AGEs (15.317 kU to 6.769 kU. p < 0.001).
In Table 3. the intervention group presented a statistically significant difference in bone mass (3.00 kg to 2.90 kg; p=0.031). Additionally. the control group showed a trend towards a statistically significant increase in muscle mass (67% to 68%; p=0.063). The remaining analyses performed did not show statistically significant results.
In the intervention group. a statistically significant decrease in serum CML levels was seen (from 2.90 µg/g to 2.03 µg/g; p = 0.015). There was also a trend toward improvement in several metabolic and lipid markers. including an increase in HDL particle size (8.78 nm to 8.89 nm; p = 0.09) and HDL cholesterol (33 mg/dL to 34 mg/dL; p = 0.09). along with reductions in esterified cholesterol (1.27 mg/dL to 0.99 mg/dL; p = 0.07). glucose (130 mg/dL to 127 mg/dL; p = 0.07). and insulin levels (15 IU/mL to 13 IU/mL; p = 0.07). No statistically significant differences were observed in the other parameters (Table 4).
In Table 5. regarding metabolic changes. a positive linear correlation was observed in the intervention group between serum CML levels and TBARS (r = 0.33; p = 0.045). Additionally. in this same group. there was a trend toward a linear correlation between serum CML and esterified cholesterol (r = 0.29; p = 0.08). The other results did not reach statistical significance. and no linear correlations were found between serum CML and anthropometric variables or dietary composition in either of the studied groups.
In Table 6 the linear correlation analysis of serum CML concentrations revealed a positive. statistically significant association with body water (r = 0.35; p = 0.03) and with dietary AGE intake (dAGEs. kU) (r = 0.52; p < 0.01). No statistically significant correlations were observed for the remaining variables.
In Table 7, a positive linear correlation was found for total cholesterol (r=0.36$; p=0.03), and a negative one for LDL (r=-0.38; p=0.020), non-HDL (r=-0.37; p=0.02), and glucose (r=-0.33; p=0.04). No statistical significance was observed in the remaining results.
4. Discussion
This study explored reductions in CML consumption over 15 days and their relationship with changes in nutrition. body composition. and metabolism. In the intervention group. CML intake decreased by about 56% (from 15.317 kU to 6.769 kU; p < 0.001). with a 30% reduction in serum CML levels (from 2.90 µg/g to 2.03 µg/g; p = 0.015). This can be explained by the fact that only 10-30% of AGEs are absorbed by simple diffusion or via the intestinal epithelium via peptide transporter 1 (PEPT1), as described by Koschinsky. Grunwald. and Geissler [23,24,25].
These findings support Goudarzi et al. [26], who found in a randomized controlled trial involving patients with metabolic syndrome that restricting CML intake. along with caloric restriction for 8 weeks, led to significant reductions in average CML levels (p < 0.004) compared to the group that continued their usual diet.
Given this it’s clear that lowering CML consumption directly relates to a decrease in this serum biomarker. Oliveira and Silva [27], also noted in their review that controlling dietary AGE intake reduces the body’s pool of these compounds. including CML, and may also decrease inflammation, oxidative stress, persistent endothelial dysfunction, the progression of atherosclerosis, and insulin resistance.
In terms of diet. both groups showed statistically significant differences in protein, lipid, monounsaturated fatty acids, and saturated fatty acids intake. There was also a trend toward reduced calorie intake. This suggests that dietary habits in the studied groups might change over 15 days regardless of specific nutritional guidance. Which aligns with what Fisberg. Kaptchuk. and Munnangi [28,29,30] have mentioned: behavioral changes can occur in control groups during health intervention studies, especially involving patients with diagnosed health conditions, due to psychological factors such as expectations of improvement, belief in treatment, and interactions with the research team, as well as the methods used for dietary recall in this study.
Additionally. the intervention group showed significant differences in fiber, polyunsaturated fatty acids, trans fats. Cholesterol, and dAGEs intake. These results are consistent with Uribarri [31], who noted that animal foods rich in fat and protein tend to contain high levels of AGEs, while foods rich in complex carbs, such as fruits, vegetables, and grains, contain lower levels. Thus, a low-AGE diet naturally correlates with a healthier diet that is lower in fat and calories, affecting fat and cholesterol intake as well.
It’s important to recognize that reducing AGE intake might not directly reduce lipids and calories, rather, they are linked through food choices and preparation methods that produce fewer AGEs, which typically mean lower calories and lower saturated fat and cholesterol content as discussed by Prasad [32].
Even though calorie levels weren’t statistically different between groups the trend suggests that larger studies are needed to confirm this effect alongside other findings.
Regarding body composition, the intervention group experienced a significant increase in bone mass (p=0.03). This supports Dhaliwal’s [33] previous work, which linked CML to changes in bone mass and bone fragility, particularly in conditions such as diabetes. Yamagishi [34] explained that this might occur because AGEs accumulate in bone collagen, compromising bone structure and making it more fragile, thereby increasing the risk of fractures. Controlling blood sugar and reducing intake of AGEs could help lower osteoporosis and fracture risks [35].
In metabolic terms, this work found a positive linear correlation between serum CML and TBARS (r=0.33; p=0.045), consistent with prior studies, such as Ahmed’s [36], which examined serum levels of CML and MDA (a marker of lipid peroxidation) in patients with type 2 diabetes and ischemic heart disease, a significant association was identified between CML and MDA, suggesting both play roles in vascular complications related to diabetes, with CML potentially serving as a biomarker for overall oxidative stress. Hidalgo’s [37] review noted that AGE formation and lipid peroxidation share pathways: lipid peroxides from polyunsaturated fats can convert into reactive dicarbonyls, which eventually form AGEs. Suryawanshi [38] highlighted that good control of blood sugar can prevent changes in peroxidation and lipid metabolism, supporting better outcomes and reducing vascular complications in diabetes.
Serum CML levels also showed a positive linear correlation with body water (r=0.35; p=0.03), consistent with the literature indicating that CML may influence osmolarity and kidney function, which affect fluid balance. Studies have shown that CML can accumulate in the kidneys, contributing to oxidative stress, inflammation, and fibrosis, damaging renal structures over time [39]. Loss of kidney function impairs the regulation of blood osmolarity and fluid balance, thereby affecting overall fluid balance [40].
An important finding was the strong positive correlation between CML and dAGEs (r=0.52; p<0.01), reaffirming that higher CML levels are associated with a greater total body AGE burden [41], which is implicated in various diseases such as cardiovascular disease and diabetes [13].
Our data also showed a surprising negative correlation between serum CML and total cholesterol (r = -0.36; p = 0.03), LDL cholesterol (r = -0.38; p = 0.020), non-HDL cholesterol (r = -0.37; p = 0.02), and glucose (r = -0.33; p = 0.04). Typically, higher LDL levels are linked to increased cardiovascular risk and oxidative stress conditions, where CML levels are elevated. The negative findings might relate to specific patient factors such as nutritional status or use of lipid-lowering and blood sugar medications, which could mask typical associations. Oxidized LDL (ox-LDL), a more harmful form, may be more closely linked to AGEs, suggesting that future research should examine ox-LDL more closely. These results challenge the expectation that glycoxidative stress consistently associates with worse lipid profiles, indicating complex interactions warranting further study.
The study also observed trends in the intervention group for HDL diameter (p=0.09), HDL levels (p=0.009), esterified cholesterol (p=0.07), glucose (p=0.07), and insulin (p=0.07). These small changes may reflect modest improvements in lipid and blood sugar control, but larger or longer studies are necessary to confirm these effects.
However, caution should be used in interpretation, as other trials and reviews have found that low-AGE diets may yield only modest or inconsistent improvements in glycemic markers such as glycated hemoglobin [42]. For example, a 4-week trial in healthy overweight individuals showed no effect on glucose sensitivity or metabolism [43]. It’s also known that AGE intake is linked to other aspects of metabolic syndrome. A study with 5.448 adults found that high AGE consumption raised the risk of abdominal obesity and high triglycerides. In pre-diabetic individuals, a 24-week diet restricting AGE intake resulted in significant reductions in total cholesterol and LDL cholesterol [44].
In this study’s intervention group, there was also a trend toward a correlation between serum CML and esterified cholesterol (r = 0.29; p = 0.08), suggesting that a low-AGE diet might improve cholesterol transport or metabolism, leading to a direct association. Nonetheless, longer or more detailed studies are needed to confirm this.
Both the control and intervention groups showed no significant changes in metabolic age, weight, BMI, body fat, visceral fat, water, waist circumference, and abdominal circumference, likely due to the study's short duration.
A positive trend in muscle mass was observed in the control group (p=0.06), but this may be incidental. Laboratory results did not show significant differences in paraoxonase, unesterified cholesterol, total cholesterol, LDL, non-HDL, triglycerides, fructosamine or C-peptide, which may require longer follow-up or larger reductions in AGE intake to detect.
The CML measurements used a food database from New York City, which reflects typical multi-ethnic urban American diets, potentially introducing bias when applying the findings to our cuisine as cultivation and cooking methods differ and affect CML content. The database includes only 549 foods, and sometimes a direct match wasn’t available in dietary recalls. In such cases, analyses were based on the food group and the closest macronutrient profile from our Food Composition Table [19] to minimize data loss. Given these limitations, a zero-AGE diet isn’t practically feasible. Nevertheless, this study identifies potential parameters for reducing dietary CML, which may favor better glycemic control and lower inflammation associated with cardiometabolic risks.
5. Conclusions
The present study showed that a reduction of approximately 56% in CML consumption promoted a 30% decrease in this serum biomarker. This effect was associated with increased fiber intake. It also reduced consumption of polyunsaturated fatty acids, trans fatty acids, and cholesterol, and showed a positive linear correlation with lipid peroxidation, body water, and dAGEs. This represents a potential benefit, given that these factors favor insulin resistance and vascular endothelial injury, and consequently, the progression of diabetes and atherosclerosis. Thus, reducing daily dietary CML consumption, combined with food preparation at lower temperatures, constitutes a potentially protective nutritional intervention in the context of diabetes and above all vascular health, with a plausible impact on preventing cardiometabolic complications. It should be emphasized that future research analyzing total AGEs, specific AGEs such as pyrraline and pentosidine, and dAGEs, as well as studies on dietary AGE composition in our regional foods is necessary, given their importance to public health. Furthermore, the need for studies with a longer duration of AGE consumption restriction is highlighted.
Supplementary Materials
The following supporting information can be downloaded at the website of this paper posted on Preprints.org.
Author Contributions
K.L.K., N.F.O.F., D.P.L., G.H.F.G., and A.P.M. conceptualized and designed the study. K.L.K., R.A.M.S.F. F.R.F., E.A.F.S.T, C.M.C.S., R.C.M., L.A.M.C. and A.P.M. formal analysis and analyzed the data, K.L.K., N.F.O.F., A.P.M. writing—original draft preparation. All authors have read and agreed to the published version of the manuscript.
Funding
This research was partially funded by CAPES (Coordination for the Improvement of Higher Education Personnel).
Institutional Review Board Statement
The study was conducted in accordance with the Declaration of Helsinki and approved by the ethics committee of the University of São Paulo (registration number, CAAE: 52932821.9.0000.0068) on 11 November 2021.
Informed Consent Statement
Informed consent was obtained from all subjects involved in the study.
Data Availability Statement
The datasets used during the current study are available from the corresponding author on reasonable request.
Conflicts of Interest
The authors declare no conflicts of interest.
Abbreviations
The following abbreviations are used in this manuscript:
| 24hDR | 24-Hour Dietary Recall |
| AC | Abdominal Circumference |
| AGEs | Advanced Glycation End Products |
| BMI | Body Mass Index |
| CAD | Coronary Artery Disease |
| CML | Carboximetilisina |
| DAC | Doença Arterial Coronária |
| dAGEs | Dietary Advanced Glycation End Products |
| HDL | High-Density Lipoprotein |
| LDL | Low Density Lipoprotein |
| PON-1 | Paraoxonase 1 |
| RI | Insulin Resistance |
| ROS | Reactive Oxygen Species |
| T2DM | Type 2 Diabetes Mellitus |
| TACO | Brazilian Food Composition Table |
| WC | Waist Circumference |
| WHO | World Health Organization |
References
- International Diabetes Federation. IDF Diabetes Atlas, 9th edn; International Diabetes Federation: Brussels. Belgium, 2019. [Google Scholar] [CrossRef]
- Himsworth, H.P. Diabetes mellitus: its differentiation into insulin-sensitive and insulin-insensitive types. 1936. Int J Epidemiol. 2013, 42(6), 1594–8. [Google Scholar] [CrossRef]
- BD 2019 Diseases and Injuries Collaborators. Global burden of 369 diseases and injuries in 204 countries and territories. 1990-2019: a systematic analysis for the Global Burden of Disease Study 2019. Lancet 2020, 396(10258), 1204–22. [Google Scholar] [CrossRef]
- Reaven, G.M. Banting lecture 1988. Role of insulin resistance in human disease. Diabetes 1988, 37(12), 1595–607. [Google Scholar] [CrossRef]
- Saisho, Y. β-cell dysfunction: Its critical role in prevention and management of type 2 diabetes. World J Diabetes 2015, 6(1), 109–24. [Google Scholar] [CrossRef] [PubMed]
- International Diabetes Federation. IDF Diabetes Atlas, 11th edn; International Diabetes Federation: Brussels. Belgium, 2025. [Google Scholar] [CrossRef]
- Abdul-Ghani, M.; DeFronzo, R.A.; Del Prato, S.; Chilton, R.; Singh, R.; Ryder, R.E.J. Cardiovascular Disease and Type 2 Diabetes: Has the Dawn of a New Era Arrived? Diabetes Care 2017, 40(7), 813–20. [Google Scholar] [CrossRef]
- Petrie, JR.; Guzik, TJ.; Touyz, RM. Diabetes. Hypertension. and Cardiovascular Disease: Clinical Insights and Vascular Mechanisms. Can J Cardiol. 2018, 34(5), 575–84. [Google Scholar] [CrossRef]
- Després, JP. Intra-abdominal obesity: an untreated risk factor for Type 2 diabetes and cardiovascular disease. J Endocrinol Invest. 2006, 29(3 Suppl), 77–82. [Google Scholar]
- Rivas-Garcia, L.; Quintana-Navarro, GM.; Alcala-Díaz, JF.; Torres-Peña, JD.; Arenas-de Larriva, AP.; Rangel-Zuñiga, OA.; et al. Association between Diet Quality and Risk of Type 2 Diabetes Mellitus in Patients with Coronary Heart Disease: Findings from the CORDIOPREV Study. Nutrients 2024, 16(8), 1249. [Google Scholar] [CrossRef] [PubMed]
- Evans, JL.; Maddux, BA.; Goldfine, ID. The molecular basis for oxidative stress-induced insulin resistance. Antioxid Redox Signal 2005, 7(7-8), 1040–52. [Google Scholar] [CrossRef] [PubMed]
- Pinto, R.; Machado, U.; Passarelli, M. Advanced Glycation End Products As Biomarkers for Cardiovascular Disease: Browning Clarifying Atherogenesis. Biomarkers in Medicine 2020, 14(8), 611–4. [Google Scholar] [CrossRef] [PubMed]
- Vlassara, H.; Uribarri, J. Advanced glycation end products (AGE) and diabetes: cause. effect. or both? Curr Diab Rep. 2014, 14(1), 453. [Google Scholar] [CrossRef]
- Su X dong. Li S she. Tian Y qiang. Zhang Z yan. Zhang G zhen. Wang L xin. Elevated Serum Levels of Advanced Glycation End Products and their Monocyte Receptors in Patients with Type 2 Diabetes. Archives of Medical Research 2011, 42(7), 596–601. [CrossRef]
- Rabbani, N.; Thornalley, PJ. Protein glycation - biomarkers of metabolic dysfunction and early-stage decline in health in the era of precision medicine. Redox Biol. 2021, 42, 101920. [Google Scholar] [CrossRef]
- Goldberg, T.; Cai, W.; Peppa, M.; Dardaine, V.; Baliga, BS.; Uribarri, J.; et al. Advanced glycoxidation end products in commonly consumed foods. J Am Diet Assoc. 2004, 104(8), 1287–91. [Google Scholar] [CrossRef] [PubMed]
- Uribarri J. Woodruff S. Goodman S. Cai W. Chen X. Pyzik R. et al. Advanced glycation end products in foods and a practical guide to their reduction in the diet. J Am Diet Assoc. 2010, 110(6), 911–916.e12. [CrossRef]
- Htet, MK.; Fahmida, U.; Do, TT.; Dibley, MJ.; Ferguson, E. The Use of Tablet-Based Multiple-Pass 24-Hour Dietary Recall Application (MP24Diet) to Collect Dietary Intake of Children under Two Years Old in the Prospective Cohort Study in Indonesia. Nutrients 2019, 11(12), 2889. [Google Scholar] [CrossRef]
- Universidade Estadual de Campinas. Tabela brasileira de composição de alimentos. In NEPA – UNICAMP, 4. ed. rev. e ampl; NEPA- UNICAMP: Campinas, 2011; 161 p. [Google Scholar]
- James, WP. WHO recognition of the global obesity epidemic. Int J Obes (Lond) 2008, 32 7, S120–6. [Google Scholar] [CrossRef] [PubMed]
- Antolovich, M.; Prenzler, PD.; Patsalides, E.; McDonald, S.; Robards, K. Methods for testing antioxidant activity. Analyst 2002, 127(1), 183–98. [Google Scholar] [CrossRef]
- Gugliucci A. Kotani K. Taing J. Matsuoka Y. Sano Y. Yoshimura M. et al. Short term low calorie diet intervention reduces serum advanced glycation end products in healthy overweight or obese adults. Ann Nutr Metab. 2009, 54(3), 197–201. [CrossRef]
- Koschinsky T. He CJ. Mitsuhashi T. Bucala R. Liu C. Buenting C. et al. Orally absorbed reactive glycation products (glycotoxins): An environmental risk factor in diabetic nephropathy. Proc Natl Acad Sci U S A 1997, 94(12), 6474–9. [CrossRef]
- Grunwald S. Krause R. Bruch M. Henle T. Brandsch M. Transepithelial flux of early and advanced glycation compounds across Caco-2 cell monolayers and their interaction with intestinal amino acid and peptide transport systems. Br J Nutr. 2006, 95(6), 1221–8. [CrossRef]
- Geissler, S.; Hellwig, M.; Zwarg, M.; Markwardt, F.; Henle, T.; Brandsch, M. Transport of the advanced glycation end products alanylpyrraline and pyrralylalanine by the human proton-coupled peptide transporter hPEPT1. J Agric Food Chem. 2010, 58(4), 2543–7. [Google Scholar] [CrossRef]
- Goudarzi, R.; Sedaghat, M.; Hedayati, M.; Hekmatdoost, A.; Sohrab, G. Low advanced Glycation end product diet improves the central obesity. insulin resistance and inflammatory profiles in Iranian patients with metabolic syndrome: a randomized clinical trial. J Diabetes Metab Disord. 2020, 19(2), 1129–38. [Google Scholar] [CrossRef]
- Silva EBO e. Seara LT e. Silva RCC da. Produtos de glicação avançada e desenvolvimento da aterosclerose. Nutrição Brasil 2016, 15(4), 219–28. [CrossRef]
- Fisberg RM. Marchioni DML. Colucci ACA. [Assessment of food consumption and nutrient intake in clinical practice]. Arq Bras Endocrinol Metabol. julho de 2009;53(5):617–24Kaptchuk TJ. Miller FG. Placebo Effects in Medicine. N Engl J Med. 2015;373(1):8-9. [CrossRef]
- Kaptchuk, TJ.; Kelley, JM.; Conboy, LA.; et al. Components of placebo effect: randomised controlled trial in patients with irritable bowel syndrome. BMJ 2008, 336, 999–1003. [Google Scholar] [CrossRef]
- Munnangi S. Sundjaja JH. Singh K. Dua A. Angus LD. Placebo Effect. Em: StatPearls [Internet]. Treasure Island (FL): StatPearls Publishing; 2025.
- Uribaari J. Woodruff S. Goodman S. Cai W. Chen X. Pyzik R. et al. Advanced Glycation End Products in Foods and a Practical Guide to Their Reduction in the Diet. J Am Diet Assoc. 2010, 110(6), 911–16.e12. [CrossRef]
- Prasad C. Davis KE. Imrhan V. Juma S. Vijayagopal P. Advanced Glycation End Products and Risks for Chronic Diseases: Intervening Through Lifestyle Modification. Am J Lifestyle Med. 2019, 13(4), 384–404. [CrossRef]
- Dhaliwal, R.; Ewing, SK.; Vashishth, D.; Semba, RD.; Schwartz, AV. Greater Carboxy-Methyl-Lysine Is Associated With Increased Fracture Risk in Type 2 Diabetes. J Bone Miner Res. 2022, 37(2), 265–72. [Google Scholar] [CrossRef] [PubMed]
- Yamagishi S ichi. Role of advanced glycation end products (AGEs) in osteoporosis in diabetes. Curr Drug Targets 2011, 12(14), 2096–102. [CrossRef]
- Moreira, CA.; Barreto, FC.; Dempster, DW. New insights on diabetes and bone metabolism. J bras nefrol 2015, 490–5. [Google Scholar] [CrossRef]
- A. Ahmed K. Muniandy S. S. Ismail I. Role of Nε-(Carboxymethyl)Lysine in the Development of Ischemic Heart Disease in Type 2 Diabetes Mellitus. J Clin Biochem Nutr. 2007, 41(2), 97–105. [CrossRef]
- Hidalgo, FJ.; Zamora, R. Interplay between the maillard reaction and lipid peroxidation in biochemical systems. Ann N Y Acad Sci. 2005, 1043, 319–26. [Google Scholar] [CrossRef]
- Suryawanshi, NP.; Bhutey, AK.; Nagdeote, AN.; Jadhav, AA.; Manoorkar, GS. Study of lipid peroxide and lipid profile in diabetes mellitus. Indian J Clin Biochem. 2006, 21(1), 126–30. [Google Scholar] [CrossRef]
- Goldin, A.; Beckman, JA.; Schmidt, AM.; Creager, MA. Advanced glycation end products: sparking the development of diabetic vascular injury. Circulation 2006, 114(6), 597–605. [Google Scholar] [CrossRef]
- Tsekovska, R.; Gatev, E.; Mironova, R.; Kerezieva, S.; Ilieva, S.; Ilieva, T.; et al. Serum Levels of Nε-(Carboxymethyl)-Lysine in Chronic Kidney Disease and Type 2 Diabetes Mellitus. Biomedicines 2025, 13(7), 1672. [Google Scholar] [CrossRef] [PubMed]
- .Han L. Li L. Li B. Zhao D. Li Y. Xu Z. et al. Review of the characteristics of food-derived and endogenous ne-carboxymethyllysine. J Food Prot. 2013, 76(5), 912–8. [CrossRef]
- Detopoulou, P.; Voulgaridou, G.; Seva, V.; Kounetakis, O.; Desli, II.; Tsoumana, D.; et al. Dietary Restriction of Advanced Glycation End-Products (AGEs) in Patients with Diabetes: A Systematic Review of Randomized Controlled Trials. Int J Mol Sci. 2024, 25(21), 11407. [Google Scholar] [CrossRef]
- Linkens, AM.; Houben, AJ.; Niessen, PM.; Wijckmans, NE.; de Goei, EE.; Van den Eynde, MD.; et al. A 4-week high-AGE diet does not impair glucose metabolism and vascular function in obese individuals. JCI Insight 2022, 7(6), e156950. [Google Scholar] [CrossRef] [PubMed]
- Angoorani, S.; Mirmiran, P.; Momenan, A.A.; Azizi, F. Major Dietary Patterns and the Risk of Metabolic Syndrome Components: A Prospective Study in Iranian Adults. Public Health Nutrition 2016, 19(16), 2963–2971. [Google Scholar] [CrossRef]
Figure 1.
Study Flowchart. Abbreviations: H: men; M: women; DM2: type 2 diabetes mellitus.
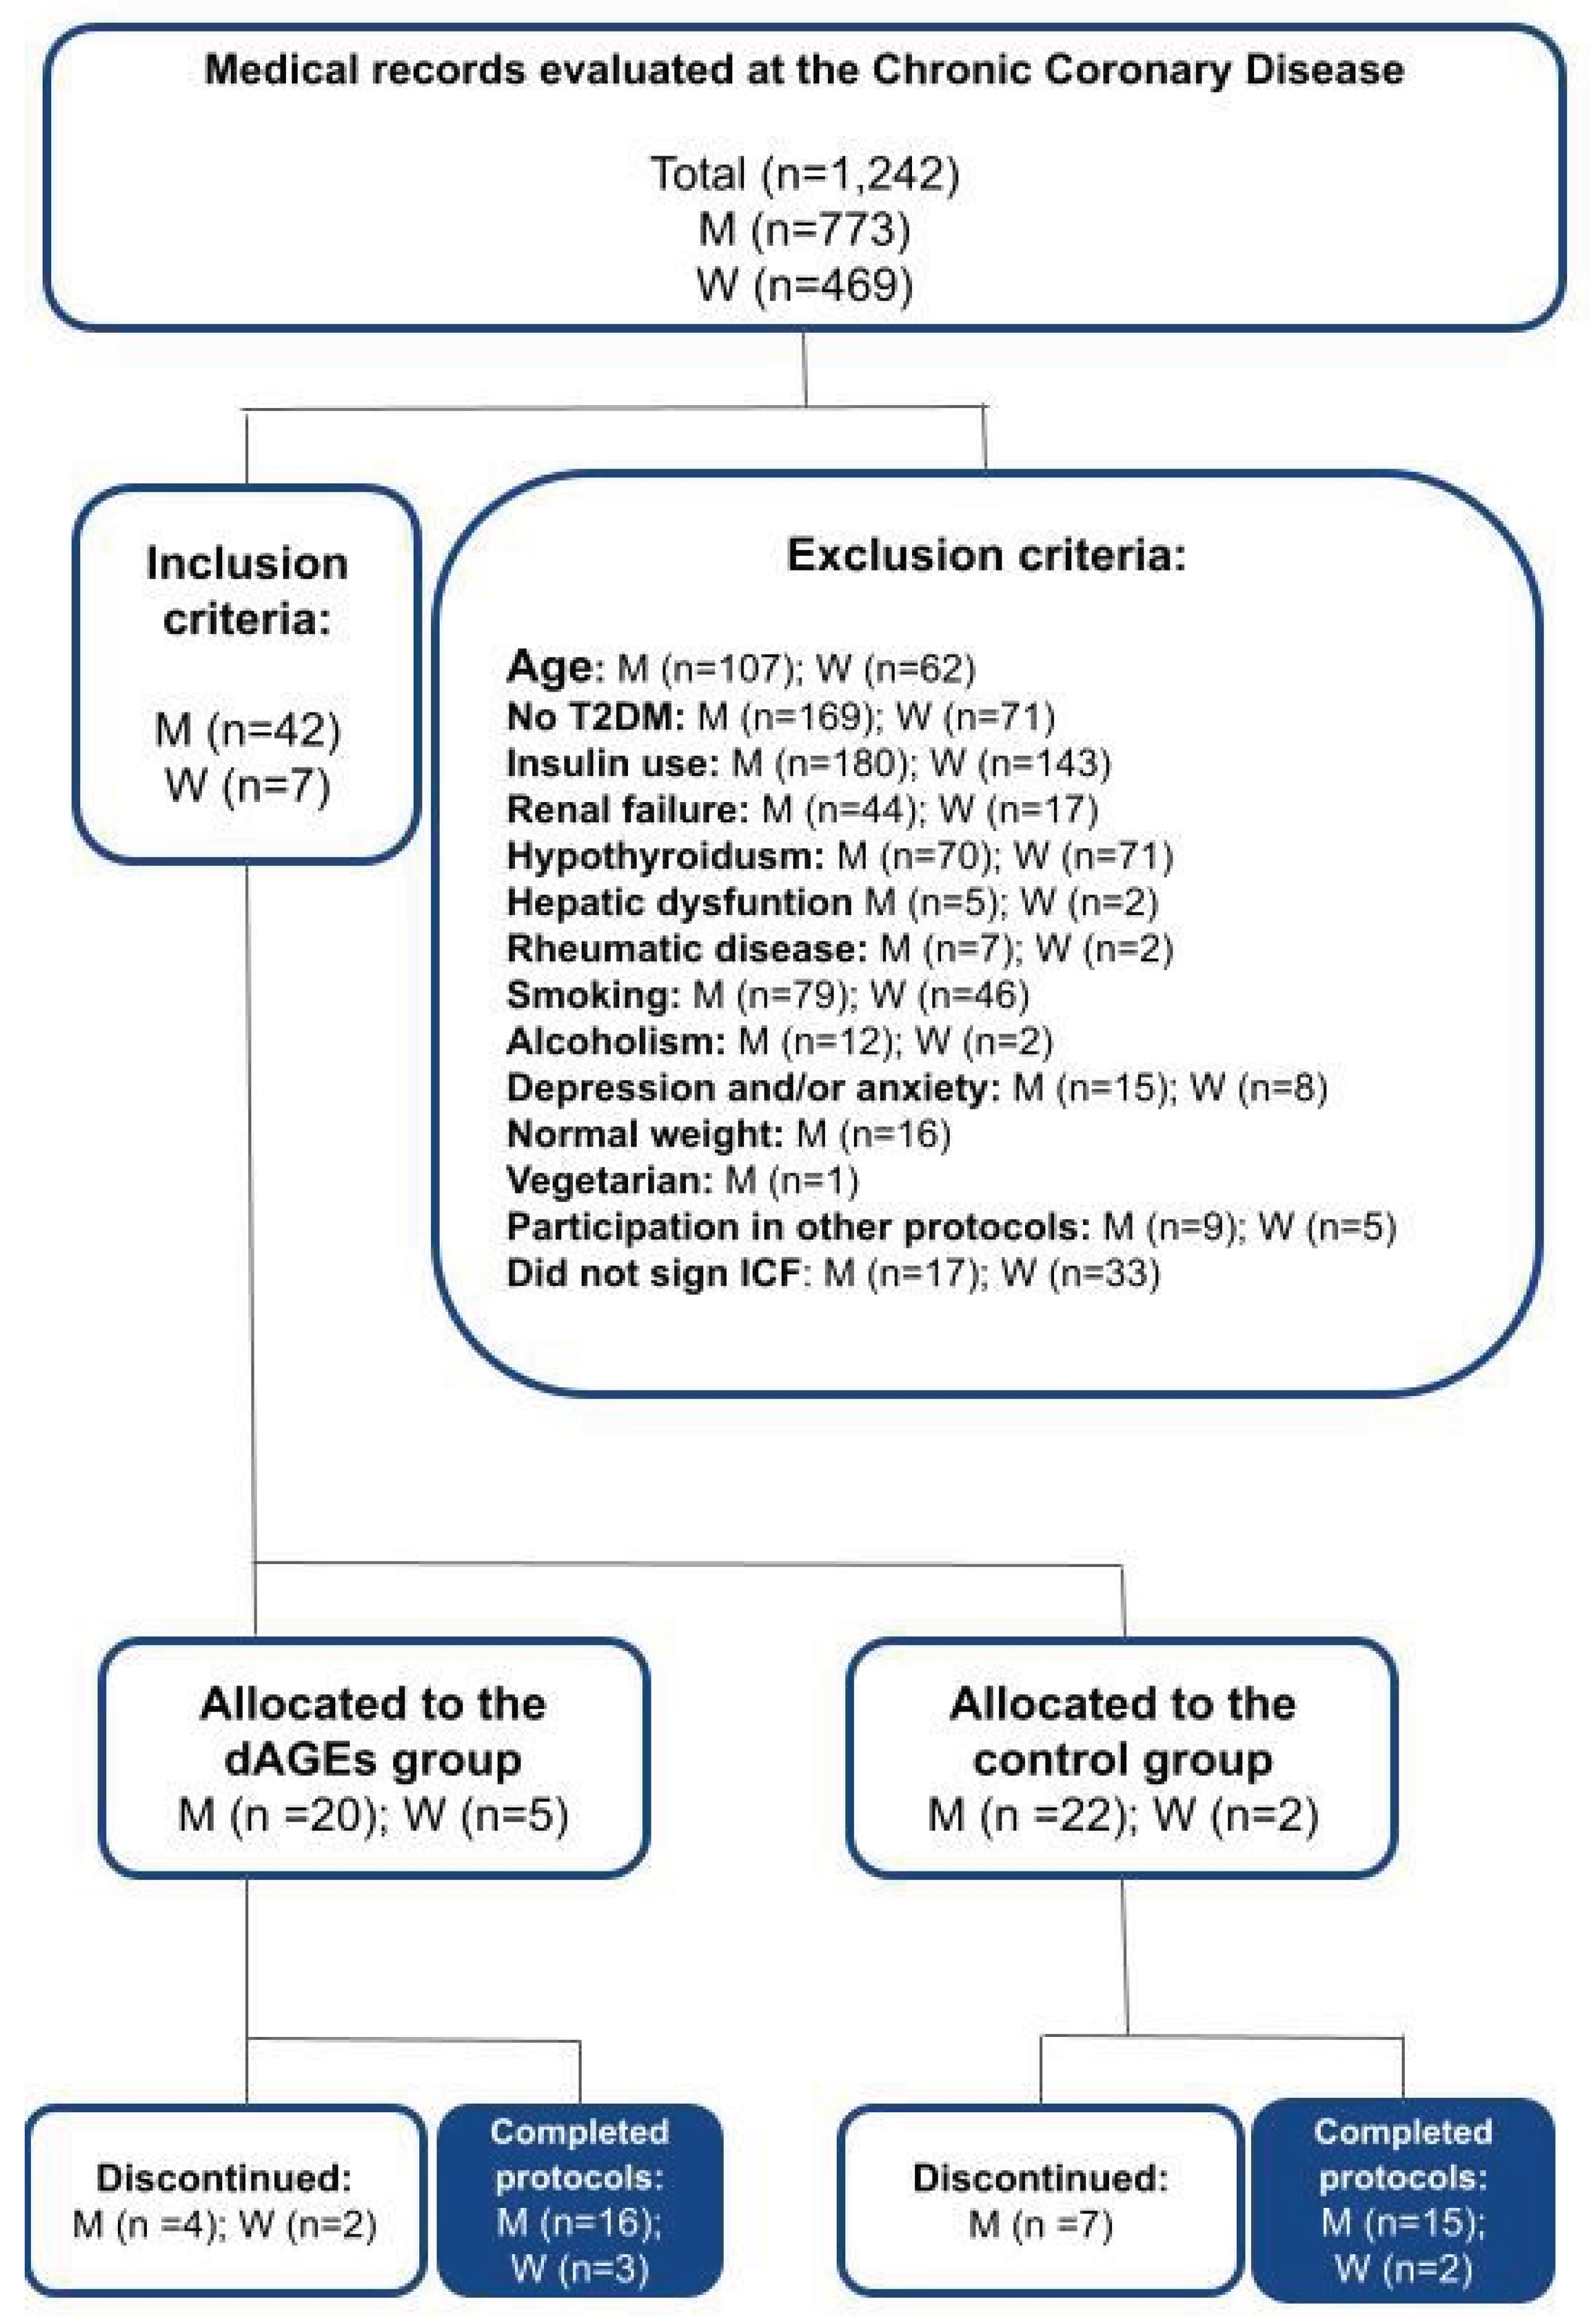

Table 1.
Clinical and sociodemographic characteristics of the study groups.
| Variables | Control group n=17 |
Intervention group n=19 |
|---|---|---|
| Age (years), median IQR | 60 (55-66) | 60 (55-65) |
| Sex n, (%) | ||
| Male | 15 (88) | 16 (84) |
| Female | 2 (12) | 3 (16) |
| Self-reported race n, (%) | ||
| White | 9 (53) | 6 (31) |
| Black | 3 (18) | 5 (26) |
| Brown- skinned | 5 (29) | 8 (42) |
| Nível de escolaridade n, (%) | ||
| Elementary school complete | 1 (6) | 2 (10) |
| High school incomplete | 6 (35) | 5 (26) |
| High school complete | 5 (29) | 6 (31) |
| Higher education incomplete | 1 (6) | 5 (26) |
| Higher education complete | 4 (23) | 1(5) |
| Average income n, (%) | ||
| 1 minimum wage | 4 (23) | 2 (10) |
| 2 minimum wages | 11 (65) | 14 (74) |
| 3 minimum wages | 2 (12) | 3 (16) |
| Associated comorbidities n, (%) | ||
| Arterial hypertension | 17 (100) | 19 (100) |
| Dyslipidemia | 17 (100) | 19(100) |
| Medications in use n, (%) | ||
| Hypoglycemic agents | 17 (100) | 19 (100) |
| Diuretics | 17 (100) | 19 (100) |
| ACE inhibitors | 9 (53) | 11 (58) |
| Beta blockers | 15 (88) | 8 (42) |
Data expressed Median and Interquartile Range and as absolute and relative frequency n (%). Abbreviations: CAD: coronary artery disease; ACE: angiotensin-converting enzyme inhibitors.
Table 2.
Data on the dietary compositions of the study groups pre- and post-15 days, expressed as median and interquartile range.
Table 2.
Data on the dietary compositions of the study groups pre- and post-15 days, expressed as median and interquartile range.
| Variables | Control group n=17 | Intervention group n=19 | ||||
|---|---|---|---|---|---|---|
| Pre | Post | p | Pre | Post | p | |
| Carbohydrates (g) | 219 (142-489) | 214 (170-511) | 0.206 | 238 (108-448) | 195 (21-819) | 0.650 |
| Proteins (g) | 86 (41-200) | 66 (37-297) | 0.012* | 91 (50-160) | 74 (45-191) | 0.044* |
| Lipids (g) | 66 (34-197) | 58 (22-210) | 0.023* | 64 (35-120) | 52 (16-78) | 0.003* |
| Fibers(g) | 23 (8-31) | 20 (3-55) | 0.781 | 18 (8-60) | 22 (11-56) | 0.031* |
| Free carbohydrates (g) | 207 (123-461) | 196 (142-457) | 0.306 | 209 (99-411) | 211 (111-353) | 0.515 |
| Monounsaturated FA (g) | 21 (8-52) | 16 (2-79) | 0.006* | 20 (11-53) | 15 (4-27) | 0.003* |
| Polyunsaturated FA (g) | 12 (4-41) | 7 (1-27) | 0.547 | 11 (4-21) | 7 (2-11) | 0.002* |
| Saturated FA (g) | 20 (14-74) | 19 (4-87) | 0.039* | 22 (13-37) | 17 (4-34) | 0.005* |
| Trans FA (g) | 1.10 (0.40-10) | 0.80 (0.20-38) | 0.794 | 1.17 (0.40-9.57) | 0.73 (0.07-6.20) | 0.006* |
| Cholesterol (mg) | 412 (178-971) | 274 (20-1244) | 0.120 | 293 (168-678) | 200 (45-514) | <0.001* |
| Calories (kcal) | 1910 (1245-4427) | 1802 (1076-4747) | 0.071 | 1857 (1185-3128) | 1656 (1043-2383) | 0.079 |
| Water (L) | 0.92 (0-2.50) | 1 (0-2.50 | 0.838 | 1.33 (0.70-2.51) | 1.60 (0.92-2.50) | 0.163 |
| dGEs (kU) | 13196 (3297-40296) | 11696 (1190-49296 | 0.890 | 15317 (4471-39967) | 6769 (3246-15476) | <0.001* |
Data expressed as median and interquartile range. Abbreviations: FA: fatty acids; dAGEs: dietary advanced glycation end products. *p < 0,05.
Table 3.
Anthropometric data of the study groups, pre- and post-15days, expressed as median and interquartile range.
Table 3.
Anthropometric data of the study groups, pre- and post-15days, expressed as median and interquartile range.
| Control group (n=17) | Intervention group (n=19) | |||||
|---|---|---|---|---|---|---|
| Variables | Pre | Post | p | Pre | Post | p |
| Metabolic age (years) | 65 (40-81) | 59 (40-81) | 0.246 | 61 (41-80) | 63 (41-80) | 0.888 |
| Weight (kg) | 79 (61-109) | 78 (61-111) | 0.200 | 80 (65-104) | 81 (65-103) | 0.140 |
| BMI (kg/m²) | 29 (24 -37) | 29 (23-37) | 0.362 | 28 (24-37) | 28 (24-37) | 0.168 |
| Body fat (%) | 28 (17-43) | 26 (17-41) | 0.345 | 30 (13-41) | 30 (20-41) | 0.571 |
| Visceral fat (Índice) | 14 (8-22) | 14 (8-21) | 0.269 | 13 (7-22) | 13 (9-22) | 0.259 |
| Muscle mass (%) | 67 (54-75) | 68 (56-75) | 0.063 | 66 (56-83) | 66 (56-76) | 0.513 |
| Bone mass (kg) | 2.90 (2-3) | 2.90 (2-4) | 0.104 | 3.00 (2-3) | 2.90 (2-3) | 0.031* |
| Body water (%) | 51 (41-59) | 53 (43-59) | 0.139 | 50 (43-65) | 50 (43-57) | 0.652 |
| WC (cm) | 101 (81-126) | 101 (81-126) | 0.650 | 98 (86-115) | 99 (85-115) | 0.776 |
| AC (cm) | 102 (91-115) | 102 (92-116) | 0.364 | 99 (88-121) | 102 (89-121) | 0.569 |
Abbreviations: BMI: body mass index; WC: waist circumference; AC: abdominal circumference. * p < 0,05.
Table 4.
Laboratory analysis data of the study groups, pre- and post-15 days, expressed as median and interquartile range.
Table 4.
Laboratory analysis data of the study groups, pre- and post-15 days, expressed as median and interquartile range.
| Variables | Control group (n=17) | Intervention group (n=19) | ||||
|---|---|---|---|---|---|---|
| Pre | Post | p | Pre | Post | p | |
| HDL diameter (nm) | 9.06 (8.26-9.63) | 9.08 (8.55-9.76) | 0.677 | 8.78 (8.44-9.42) | 8.89 (7.78-9.73) | 0.095 |
| PON1 (U/L) | 86.37 (20.61-149.68) | 84.06 (28.57-135.21) | 0.093 | 39 (13-121) | 39 (13-134) | 0.552 |
| Tbars (umol/mg) | 1.65 (1.24-2.20) | 1.56 (0.53-2.15) | 0.430 | 1.71 (1.09-2.24) | 1.75 (1.09-2.35) | 0.708 |
| Esterified cholesterol (mg/dL) | 1.30 (0.79-2.73) | 1.29 (0.82-2.45) | 0.148 | 1.27 (0.59-2.49) | 0.99 (0.73-2.41) | 0.076 |
| Unesterified cholesterol (mg/dL) | 2.48 (1.69-4.15) | 2.52 (1.62-3.89) | 0.331 | 2.21 (1.30-3.78) | 1.91 (1.50-3.19) | 0.153 |
| CML (µg/g) | 2.45 (0.35-3.19) | 2.33 (0.52-4.21) | 0.352 | 2.90 (0.87-5.79) | 2.03 (1.22-4.99) | 0.015* |
| CML bsa (µg/g) | 0.05 (0.01-0.07) | 0.05 (0.01-0.09) | 0.328 | 0.06 (0.02-0.13) | 0.05 (0.03-0.11) | 0.015* |
| Total cholesterol (mg/dL) | 142 (93-315) | 148 (96-271) | 0.836 | 140 (96-213) | 136 (96-203) | 0.297 |
| HDL (mg/dL) | 36 (22-59) | 37 (24-54) | 0.829 | 33 (24-49) | 34 (24-44) | 0.095 |
| LDL(mg/dL) | 82 (36-229) | 84 (35-191) | 0.962 | 69 (23-130) | 72 (23-126) | 0.704 |
| Non-HDL (mg/dL) | 104 (57-278) | 111 (61-218) | 0.876 | 99 (70-180) | 95 (72-173) | 0.331 |
| Triglycerides (mg/dL) | 110 (44-497) | 116 (71-404) | 0.722 | 111 (57-331) | 130 (93-525) | 0.868 |
| Glucose (mg/dL) | 127 (87-222) | 118 (43-238) | 0.452 | 130 (101-235) | 127 (95-200) | 0.079 |
| Creatinine (mg/dL) | 0.90 (0.71-1.42) | 0.92 (0.66-1.29) | 0.635 | 0.95 (0.73-1.23) | 0.98 (0.65-1.34) | 0.448 |
| Fructosamine (µmol/L) | 288 (233-399) | 276 (238-391) | 0.420 | 286 (238-418) | 298 (238-446) | 0.652 |
| C-Peptide (ng/mL) | 2.64 (1.55-8.25) | 3.31 (1.59-8.87) | 0.981 | 3.44 (2.07-13.40) | 3.20 (2-6.24) | 0.145 |
| Insulin (UI/mL) | 11 (6-64) | 12 (6-67) | 1.000 | 15 (5-145) | 13 (6-40) | 0.078 |
Abbreviations: PON1: Paraoxonase 1; Tbars: thiobarbituric acid reactive substances (lipid peroxidation); CML: carboxymethyllysine; * p <0.05. .
Table 5.
Expression of the results of the linear correlations between blood CML quantity and laboratory analysis variables.
Table 5.
Expression of the results of the linear correlations between blood CML quantity and laboratory analysis variables.
| Variables correlated with CML | Control group (n=17) |
Intervention group (n=19) |
||
|---|---|---|---|---|
| R | p | R | p | |
| HDL diameter (nm) | -0.01 | 0.986 | 0.11 | 0.491 |
| PON1 (U/L) | -0.01 | 0.932 | 0.22 | 0.241 |
| Tbars (umol/mg) | 0.09 | 0.581 | 0.33 | 0.045* |
| Esterified cholesterol (mg/dL) | 0.02 | 0.886 | 0.29 | 0.082 |
| Unesterified cholesterol (mg/dL) | 0.05 | 0.760 | 0.23 | 0.171 |
| Total cholesterol (mg/dL) | -0.17 | 0.328 | 0.10 | 0.524 |
| HDL (mg/dL) | -0.06 | 0.728 | 0.27 | 0.106 |
| LDL(mg/dL) | -0.17 | 0.327 | 0.16 | 0.324 |
| Non-HDL (mg/dL) | -0.18 | 0.277 | 0.05 | 0.737 |
| Triglycerides (mg/dL) | -0.11 | 0.506 | -0.15 | 0.371 |
| Glucose (mg/dL) | -0.32 | 0.060 | 0.08 | 0.605 |
| Creatinine (mg/dL) | 0.25 | 0.134 | 0.13 | 0.420 |
| Fructosamine (µmol/L) | -0.16 | 0.354 | 0.10 | 0.539 |
| C-Peptide (ng/mL) | 0.09 | 0.606 | -0.01 | 0.966 |
| Insulin (UI/mL) | 0.11 | 0.531 | 0.04 | 0.809 |
Abbreviations: PON1: Paraoxonase 1; Tbars: thiobarbituric acid reactive substances (lipid peroxidation); CML: carboxymethyllysine; * p < 0.05. .
Table 6.
Expression of the results of linear correlations between the groups regarding blood CML, and the anthropometric and dietary composition variables.
Table 6.
Expression of the results of linear correlations between the groups regarding blood CML, and the anthropometric and dietary composition variables.
| Variables correlated with CML | R | p |
|---|---|---|
| Metabolic age (years) | -0.09 | 0.589 |
| Weight (kg) | 0.08 | 0.636 |
| BMI (kg/m²) | 0.01 | 0.508 |
| Body fat (%) | -0.01 | 0.438 |
| Visceral fat (Índice) | -0.17 | 0.313 |
| Muscle mass (%) | 0.19 | 0.250 |
| Bone mass (kg) | 0.06 | 0.688 |
| Body water (%) | 0.35 | 0.031* |
| WC (cm) | -0.02 | 0.865 |
| AC (cm) | -0.09 | 0.564 |
| Carbohydrates (g) | 0.07 | 0.649 |
| Proteins (g) | 0.10 | 0.523 |
| Lipids (g) | 0.13 | 0.429 |
| Fibers(g) | 0.10 | 0.549 |
| Free carbohydrates (g) | -0.17 | 0.294 |
| Monounsaturated FA (g) | 0.12 | 0.482 |
| Polyunsaturated FA (g) | 0.02 | 0.187 |
| Saturated FA (g) | 0.04 | 0.794 |
| Trans FA (g) | 0.28 | 0.089 |
| Cholesterol (mg) | -0.01 | 0.482 |
| Calories (kcal) | -0.01 | 0.963 |
| Water (L) | 0.09 | 0.543 |
| dGEs (kU) | 0.52 | <0.01* |
Abbreviations: BMI: body mass index; WC: waist circumference; AC: abdominal circumference. FA: fatty acids * p < 0,05.
Table 7.
Expression of the results of linear correlations between the groups regarding blood CML, and the laboratory analysis variables.
Table 7.
Expression of the results of linear correlations between the groups regarding blood CML, and the laboratory analysis variables.
| Variables correlated with CML | R | p |
|---|---|---|
| HDL diameter (nm) | -0.08 | 0.608 |
| PON1 (U/L) | 0.04 | 0.809 |
| Tbars (umol/mg) | -0.03 | 0.820 |
| Esterified cholesterol (mg/dL) | -0.23 | 0.163 |
| Unesterified cholesterol (mg/dL) | -0.15 | 0.355 |
| Total cholesterol (mg/dL) | -0.36 | 0.030* |
| HDL (mg/dL) | -0.02 | 0.901 |
| LDL(mg/dL) | -0.38 | 0.020* |
| Non-HDL (mg/dL) | -0.37 | 0.026* |
| Triglycerides (mg/dL) | -0.24 | 0.141 |
| Glucose (mg/dL) | -0.33 | 0.049* |
| Creatinine (mg/dL) | -0.04 | 0.801 |
| Fructosamine (µmol/L) | -0.08 | 0.628 |
| C-Peptide (ng/mL) | 0.08 | 0.614 |
| Insulin (UI/mL) | 0.08 | 0.614 |
Abbreviations: PON1: Paraoxonase 1; Tbars: thiobarbituric acid reactive substances (lipid peroxidation); CML: carboxymethyllysine; * p < 0.05.
Disclaimer/Publisher’s Note: The statements, opinions and data contained in all publications are solely those of the individual author(s) and contributor(s) and not of MDPI and/or the editor(s). MDPI and/or the editor(s) disclaim responsibility for any injury to people or property resulting from any ideas, methods, instructions or products referred to in the content. |
© 2025 by the authors. Licensee MDPI, Basel, Switzerland. This article is an open access article distributed under the terms and conditions of the Creative Commons Attribution (CC BY) license.
Copyright: This open access article is published under a Creative Commons CC BY 4.0 license, which permit the free download, distribution, and reuse, provided that the author and preprint are cited in any reuse.


