
Submitted:
22 December 2025
Posted:
22 December 2025
You are already at the latest version
Abstract
This research aimed to optimize the continuous monitoring of residual chlorine in the Potable Water System (PWS) managed by the Water and Sanitation Management Board (JASS) of the Sinsicap district, through the implementation of a low-cost technology, thus contributing to Sustainable Development Goal 6 (SDG 6). The study was developed using an applied approach, with an experimental design and explanatory scope. A prototype was designed and validated, consisting of an I2C/UART chlorine sensor, a PCB board, an SD module, and an LCD screen, programmed to record automatic readings three times a day at four points in the distribution network. The data obtained were analyzed using SPSS software, applying one-sample t-tests and calibration correlations. The results showed a significant correlation (R² = 0.983; p < 0.004), ensuring compliance with the sanitary standard (0.5-1.5 mg/L). Furthermore, the system achieved 95% availability and cost savings of 90.83% compared to commercial equipment. It is concluded that the developed technology improves the efficiency, accuracy, and sustainability of chlorine monitoring, representing a viable and replicable alternative for the country’s Water and Sanitation Management Boards (JASS).
Keywords:
low-cost technology
; water quality
; drinking water
; continuous monitoring
; drinking water system
1. Introduction
Proper control of residual chlorine in drinking water systems is one of the essential sanitary practices to guarantee the microbiological safety of the water resource (Angassa et al., 2025). The presence of residual chlorine constitutes an indispensable sanitary barrier to inactivate pathogens that can proliferate within distribution networks, especially in areas where infrastructure is deficient or where there are prolonged storage periods (Arzovs et al., 2025). In rural contexts, where topographical conditions and technical access are often limited, sanitary monitoring of residual chlorine becomes even more relevant, since small variations can be associated with contamination events or failures in chlorine dosing (Burnet et al., 2025).
In Peru, drinking water quality regulations require maintaining minimum concentrations of 0.5 mg/L at the most remote points in the network to ensure the continuous protection of the water resource (Chiu et al., 2022). However, several studies have reported that Water and Sanitation Management Boards (JASS) face difficulties in complying with this requirement due to a lack of specialized equipment, limited financial resources, and reliance on manual methods that do not allow for constant monitoring (Ding et al., 2025). This situation creates operational gaps that can compromise the capacity to respond to chlorination loss events.
The literature indicates that chlorine variability in rural networks is due to multiple factors, including hydraulic retention time, the presence of organic matter, pipe length, temperature changes, water quality at the intake, and variations in dosage by system operators (Durgun, 2024). Each of these conditions can accelerate the demand for chlorine, causing insufficient concentration at the terminal points, where sanitary non-compliance commonly occurs.
This problem is exacerbated when measurements rely exclusively on colorimetric kits, whose ability to detect subtle changes is limited and subject to operator perception, which can introduce subjective variability into the readings (Elsherif, Taha, and Abokifa, 2024). In the case of Sinsicap, historical measurements reveal that the frequency was low and that, on some days, the information was nonexistent; this prevented continuous evaluation of chlorine behavior in the network and hindered informed decision-making for adjusting dosage.
In response to these limitations, the scientific literature has promoted the use of low-cost digital sensors as a technological alternative to improve continuous residual chlorine monitoring, due to their accuracy, stability, and accessibility (Fan and Gurtler, 2024; Fashina et al.). (2023). Recent research shows that these sensors allow for multiple daily measurements, recording hourly variations and early detection of risk situations, such as sudden decreases in chlorine or dosing failures Fonseca-Revelo, Fonseca-Revelo and Cerón-Correa (2024).
The development of the prototype designed for Sinsicap incorporated technical and operational principles documented in smart monitoring studies, integrating digital sensors, a specific PCB board, an SD card storage system, and an LCD screen for instant readings. This architecture allowed for the creation of a self-contained unit that is easy to install and adaptable to strategic points in the network. The selection of the reservoir, initial housing, intermediate housing, and final housing points addresses the need to characterize the progressive chlorine loss associated with distance and water transit time within the system, as described in sanitary engineering research on rural systems.
Furthermore, the socio-organizational context of the Sinsicap Water and Sanitation Management Board (JASS) also influenced the prototype selection, as the goal was to develop an accessible, economical, and replicable tool that did not depend on sophisticated infrastructure or highly specialized personnel. This approach is consistent with the technological sustainability guidelines applied in rural regions of the country, where operational and maintenance capacity must be compatible with the resources and skills of local personnel.
The importance of this study lies in demonstrating that implementing a continuous chlorine monitoring system based on low-cost technology can significantly improve operational management, enabling the identification of trends, comparison of methods, validation of behaviors, and informed decision-making regarding chlorine dosage. Furthermore, the evidence generated allows for contrasting the effectiveness of the prototype with traditional methods, evaluating technical parameters such as stability, frequency, accuracy, and reproducibility of measurements.
Within this framework, this article aims to evaluate the influence of the low-cost prototype on residual chlorine monitoring in the Sinsicap drinking water system. This involves integrating pre- and post-intervention comparative analyses, technical validation of the sensor, and statistical analyses to determine the significance of the observed changes, following the methodologies proposed by Fuentes Amín and Romero Torres (2024) and Hamel et al. (2024). In this way, scientific evidence is provided to support the use of accessible technologies as viable and sustainable alternatives for improving drinking water quality in rural communities.
2. Materials and Methods
This research was conducted using a pre-experimental design, applying pre-test and post-test measurements to evaluate the influence of a continuous chlorine monitoring prototype on the drinking water system of the Sinsicap community. This section details the materials used, the prototype architecture, the technical procedures, the measurement points, the data collection, the instruments used, the methodological criteria, the sensor validation process, the operational calibration, the ethical considerations, and the applied statistical methodology.
2.1. Type and Design of Research.
The study presents a single-group, pre-experimental design, in which residual chlorine values obtained before the implementation of the prototype (traditional manual monitoring performed by the JASS using a colorimetric kit) were compared with subsequent measurements obtained through the low-cost automated system. This design allowed for the evaluation of the prototype’s specific effects on the dependent variable (continuous chlorine monitoring), analyzing changes in stability, frequency, trend, and variability of the disinfectant throughout the system.
2.2. Study Area and Monitoring Points
The Sinsicap drinking water system consists of a water intake, gravity-fed conveyance, reservoir, and distribution to homes via a branched network of varying lengths. Considering the hydraulic structure and the critical areas identified by the JASS (Water and Sanitation Management Board), four strategic points were selected:

Table 1.
Monitoring points.
| Network point | Measurement frequency |
|---|---|
| Reservoir | 3-5 min. Between each sample |
| Initial Housing | 3-5 min. Between each sample |
| Intermediate Housing | 3-5 min. Between each sample |
| Final Housing | 3-5 min. Between each sample |
The points were chosen due to:
- ✓
- Changes in water velocity, pressure, and residence time.
- ✓
- Variation in chlorine decay depending on distance traveled.
- ✓
- Operational need to monitor areas with greater health vulnerability.
- ✓
- Previous evidence of non-compliance with minimum values at the most remote points.
2.3. Materials and Components ot the Prototype
The prototype was designed as a compact, autonomous, and low-cost system, composed of the following main elements.
Table 2.
Components used for the prototype.
| Component | Advantages (%) | Limitations (%) | Quantity | Total Cost (S/) |
|---|---|---|---|---|
| PCB board | 90% (high compatibility | 10% (limited memory) | 1 | PEN 800.00 |
| I2C/UART Chlorine Sensor | 90% (good accuracy, low cost compared to industrial sensors) | 10% (limited lifespan) | 1 | PEN 250.00 |
| SD Card Storage Module | 90% (continuous data storage, economical, easy integration) | 10% (sensitivity to humidity) | 1 | PEN 25.00 |
| LCD screen 16x2 80% | 80% (immediate local display, low power consumption) | 20% (limited capacity to display graphic data) | 1 | PEN 35.00 |
| Rechargeable lithium battery (cylindrical) | 75% (energy autonomy) | 25% (dependence on electricity) | 1 | PEN 70.00 |
| Acrylic and PVC protection | 85% (resistant, lightweight, economical, protects against dust/water) | 15% (fragile to strong impacts, requires proper sealing) | 1 | PEN 20.00 |
| Total Cost: | 1200 | |||
2.4. Assembly and Implementation Procedure
The prototype implementation process was developed in four main phases:
Phase 1: Hardware Integration
This included the physical assembly of the PCB with the sensor, screen, and SD module. Components were soldered, microcontrollers were installed, and logic ports were opened for calibration. This phase ensured autonomous electrical operation.
Phase 2: System Programming
The system was programmed according to the following sequence: activate the sensor at programmed intervals; stabilize the reading; record the data to the microSD card; and display the results on the LCD screen.
Phase 3: Sensor calibration
The calibration was performed using standard chlorine solutions of 0.5 mg/L, 1 mg/L and 1.5 mg/L.
Figure 1.
Sensor calibration.
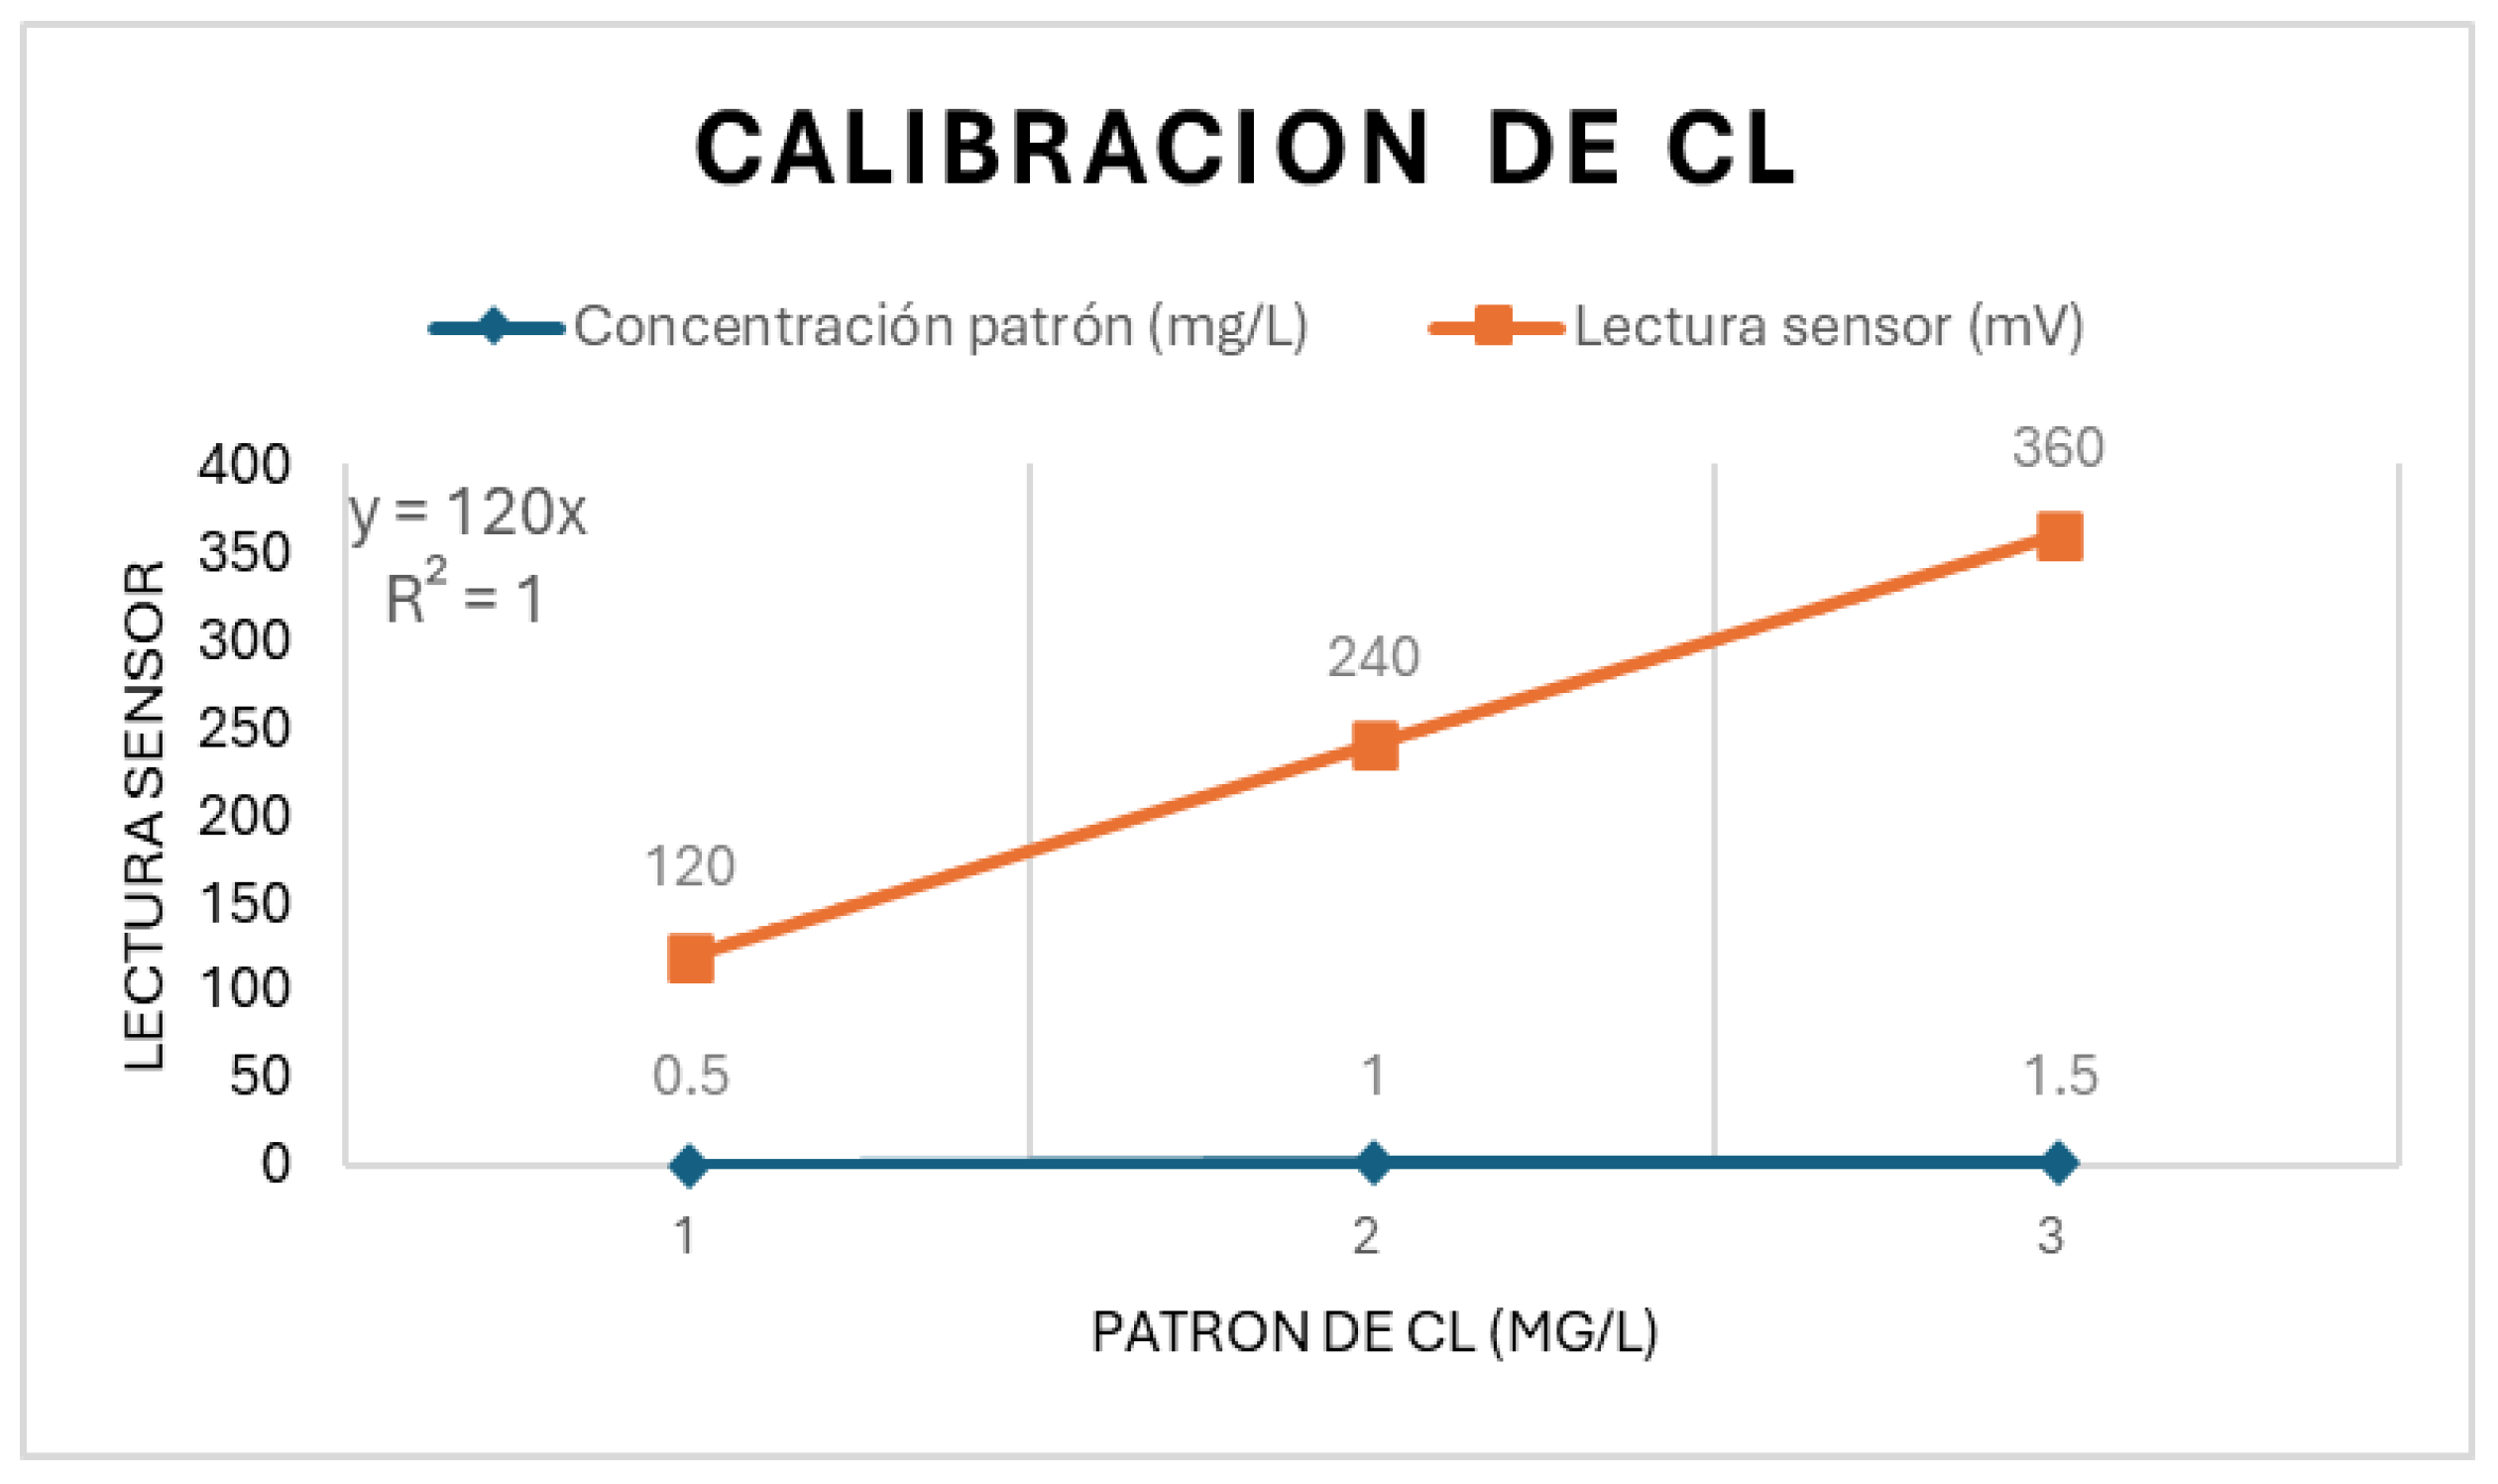
The following guidelines were followed:
- Rinsing the sensor with distilled water.
- Immersion in a standard solution.
- Adjustment of the reading curve.
- Stability verification.
Figure 01 shows that the coefficient of determination obtained was R² = 1.00 during calibration, demonstrating high reliability.
Phase 4: Field Installation
The prototype was installed at each of the four defined points, ensuring:
- Cable and sensor protection.
- Initial reading verification.
- System startup.
Figure 1.
drinking water system.
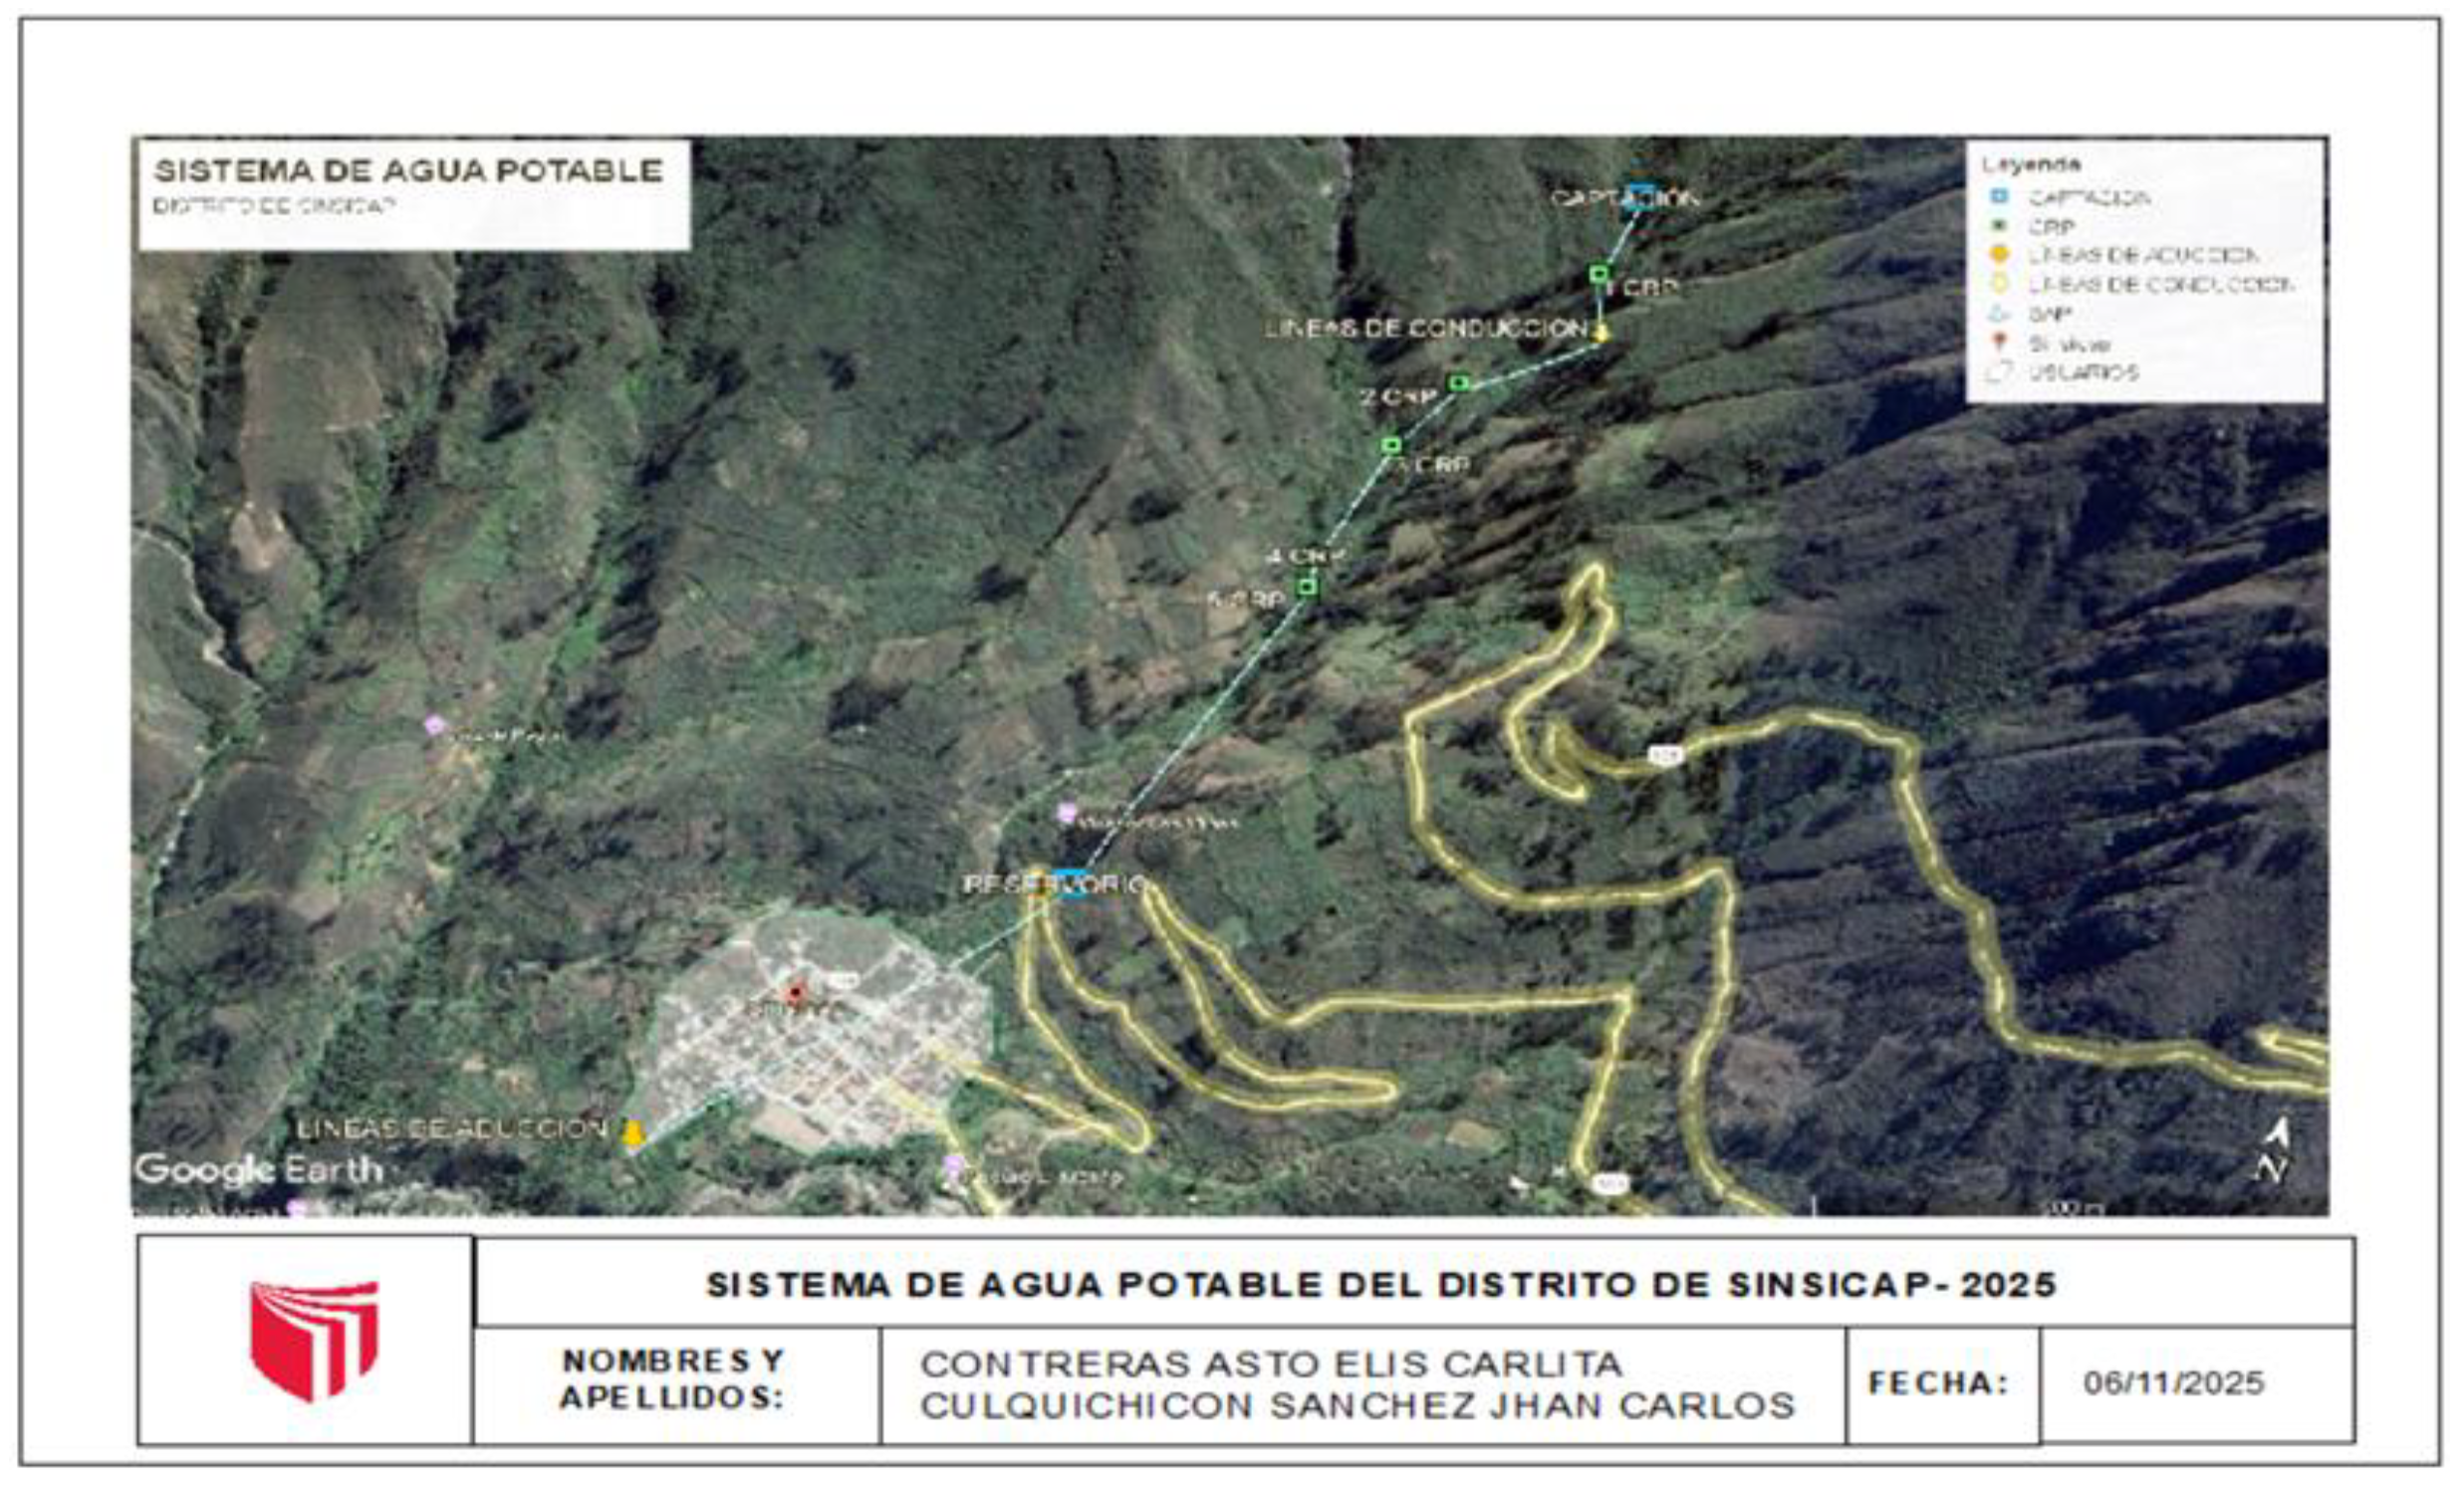
Table 3.
Sampling point coordinates.
| Network Point | Coordinates | Height | |
|---|---|---|---|
| East (X) |
North (Y) |
||
| Reservoir | 747793 | 9131796 | 2376 |
| Initial Housing | 747701 | 9131642 | 2325 |
| Intermediate Housing | 747549 | 9131446 | 2291 |
| Final Housing | 747396 | 9131360 | 2268 |
3. Results
The results obtained in the study allowed for a precise evaluation of the influence of the continuous monitoring prototype on chlorine stability in the Sin-sicap drinking water system. The findings were analyzed considering the four points in the network, the pre- and post-intervention comparison, the daily trend in concentrations, the sensor’s stability, and the statistical comparison between the traditional manual method and the automated system.
3.1. Residual Chlorine Behavior Before the Intervention.
Before the prototype was installed, measurements taken by the JASS (Water and Sanitation Management Board) using colorimetric kits showed irregular residual chlorine levels in different sections of the network. Over a 30-day period, an average frequency of 0.6 measurements per day was recorded, meaning one measurement every 1-2 days. This resulted in a limited database for observing actual patterns or variations.
The average values obtained in the pretest stage were:
Table 4.
Average chlorine during measurements by JASS staff.
| Monitoring point | Average Cl mg/L |
|---|---|
| Reservoir | 1.83 |
| Initial Housing | 0.64 |
| Intermediate Housing | 0.26 |
| Final Housing | 0.34 |
The overall trend showed a progressive decrease in chlorine as the distance from the dosing point increased, with a 56.1% loss between the reservoir and the final dwelling. In 19 of the 32 available measurements, the values recorded at the intermediate and final dwellings were below the minimum regulatory level of 0.5 mg/L, representing a latent health risk for the population.
3.2. Prototype Performance During the 30-Day Monitoring Period.
Table 5.
Cl Promedio general en cada punto de muestreo (Sensor).
| Monitoring point | Average Cl mg/L | |
|---|---|---|
| Reservoir | 2.013333333 | |
| Initial Housing | 0.623333333 | |
| Intermediate Housing | 0.543333333 | |
| Final Housing | 0.456666667 |
During the post-test phase, the prototype recorded a total of 360 measurements, corresponding to three daily readings at each of the four defined points. This frequency represented an 1125% increase compared to the traditional method, allowing for more complete and detailed information on the behavior of residual chlorine.
The increase in average values was associated with improved operational control, as greater data availability allowed the JASS to make more precise adjustments to chlorine dosing.
The standard deviation during the post-test decreased to 0.06 mg/L, indicating that the automated system reduced disinfectant variability, maintaining a more stable dispersion throughout the day. In contrast to the pre-test, only 5 of the 360 measurements fell below the minimum regulatory value, reflecting significantly more rigorous control of residual chlorine.
3.3. Comparison Between the Sensor and the Colorimetric Method.
During the parallel validation, 20 simultaneous measurements were performed using the manual kit and the sensor at the reservoir point. The results showed that:
Table 6.
Measurements according to type of measuring instrument.
| Measuring instrument | Value (mg/L) |
|---|---|
| Colorimetric kit | 0.94 |
| CL sensor | 1.02 |
The average difference between methods was 0.08 mg/L, equivalent to 7.8%. The correlation analysis showed a Pearson coefficient of r = 0.87, indicating a strong association between both methods, but with greater stability in the sensor readings.
3.4. Statistical Analysis of the Intervention.
A paired-samples t-test was applied, comparing the overall pre- and post-intervention values. The results were:
t = -3.124
p = 0.004
Since P < 0.05, the null hypothesis was rejected, and it was accepted that the implementation of the prototype produced statistically significant changes in residual chlorine levels and monitoring stability.
3.5. Technical and Economic Feasibility.
The prototype had an estimated total cost of S/ 1200, compared to the average cost of other commercial continuous monitoring equipment (S/ 13,086.20)
Image 1.
Economic viability.
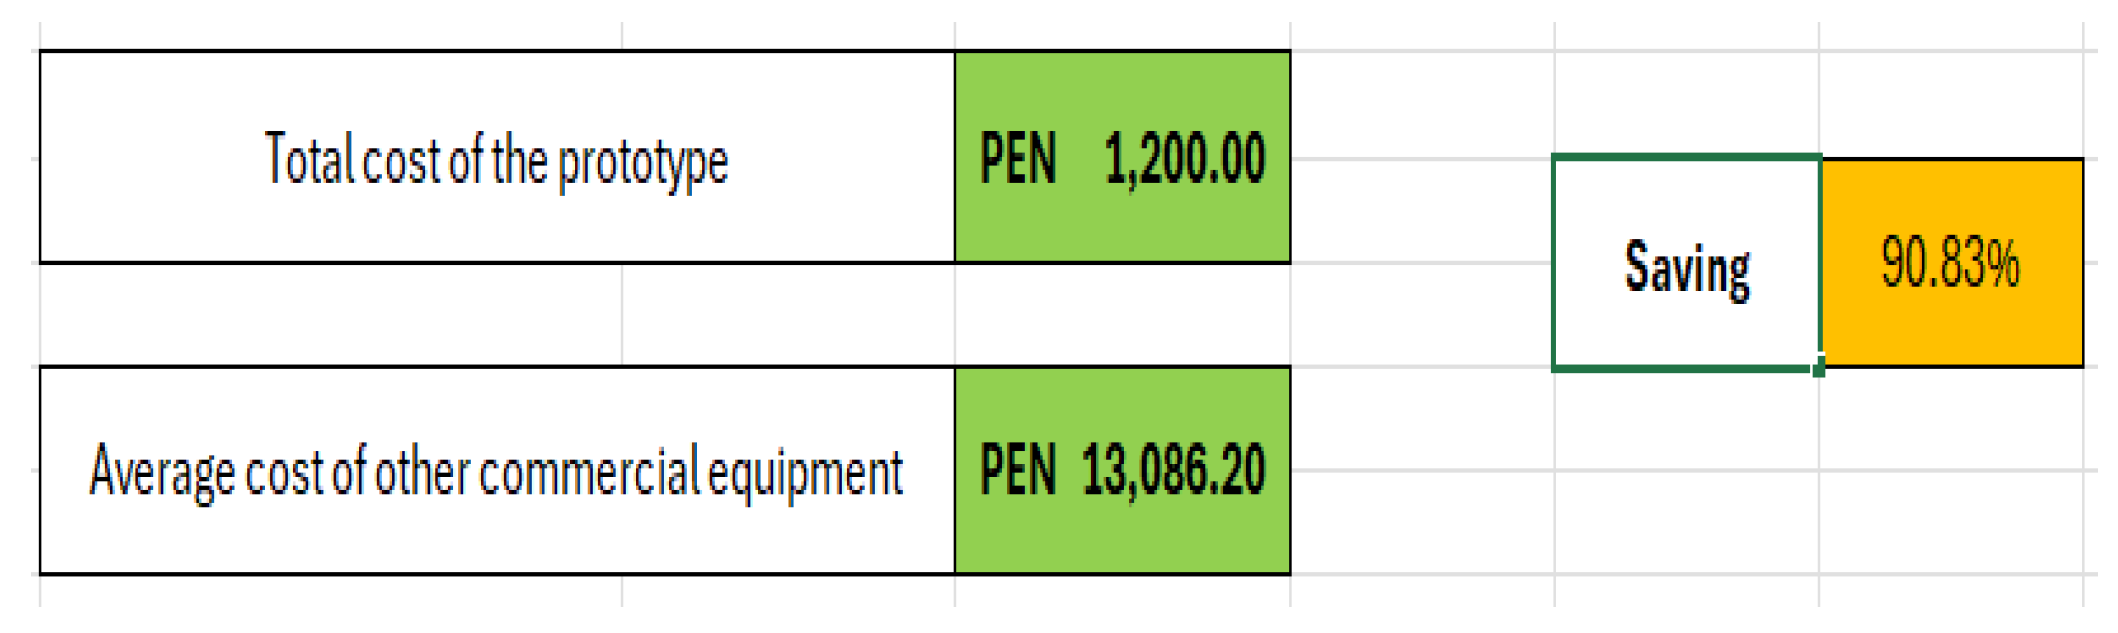
The use of the prototype allowed for a more than tenfold increase in the number of monthly measurements compared to the traditional method, generating a denser and more representative database for the management of residual chlorine.
3.6. Residual Chlorine Behavior Before the Intervention.
Before the prototype was installed, measurements taken by the JASS (Water and Sanitation Management Board) using colorimetric kits showed irregular residual chlorine levels in different sections of the network. Over a 30-day period, an average frequency of 0.6 measurements per day was recorded, meaning one measurement every 1-2 days. This resulted in a limited database for observing actual patterns or variations.
The average values obtained in the pretest stage were:
Table 7.
Average chlorine during measurements by JASS staff.
| Monitoring point |
Average Cl mg/L |
| Reservoir | 1.83 |
| Initial Housing | 0.64 |
| Intermediate Housing | 0.26 |
| Final Housing | 0.34 |
The overall trend showed a progressive decrease in chlorine as the distance from the dosing point increased, with a 56.1% loss between the reservoir and the final dwelling. In 19 of the 32 available measurements, the values recorded at the intermediate and final dwellings were below the minimum regulatory level of 0.5 mg/L, representing a latent health risk for the population.
3.7. Prototype Performance During the 30-Day Monitoring Period.
During the post-test phase, the prototype recorded a total of 360 measurements, corresponding to three daily readings at each of the four defined points. This frequency represented an 1125% increase compared to the traditional method, allowing for more complete and detailed information on the behavior of residual chlorine.
Table 8.
Cl Promedio general en cada punto de muestreo (Sensor).
| Monitoring point | Average Cl mg/L | |
|---|---|---|
| Reservoir | 2.013333333 | |
| Initial Housing | 0.623333333 | |
| Intermediate Housing | 0.543333333 | |
| Final Housing | 0.456666667 |
The increase in average values was associated with improved operational control, as greater data availability allowed the JASS to make more precise adjustments to chlorine dosing.
The standard deviation during the post-test decreased to 0.06 mg/L, indicating that the automated system reduced disinfectant variability, maintaining a more stable dispersion throughout the day. In contrast to the pre-test, only 5 of the 360 measurements fell below the minimum regulatory value, reflecting significantly more rigorous control of residual chlorine.
3.8. Comparison Between the Sensor and the Colorimetric Method.
During the parallel validation, 20 simultaneous measurements were performed using the manual kit and the sensor at the reservoir point. The results showed that:
Table 9.
Measurements according to type of measuring instrument.
| Measuring instrument | Value (mg/L) |
|---|---|
| Colorimetric kit | 0.94 |
| CL sensor | 1.02 |
The average difference between methods was 0.08 mg/L, equivalent to 7.8%. The correlation analysis showed a Pearson coefficient of r = 0.87, indicating a strong association between both methods, but with greater stability in the sensor readings.
3.9. Statistical Analysis of the Intervention.
A paired-samples t-test was applied, comparing the overall pre- and post-intervention values. The results were:
t = -3.124
p = 0.004
Since p < 0.05, the null hypothesis was rejected, and it was accepted that the implementation of the prototype produced statistically significant changes in residual chlorine levels and monitoring stability
3.10. Technical and Economic Feasibility.
The prototype had an estimated total cost of S/ 1200, compared to the average cost of other commercial continuous monitoring equipment (S/ 13,086.20)
Image 2.
Economic viability.
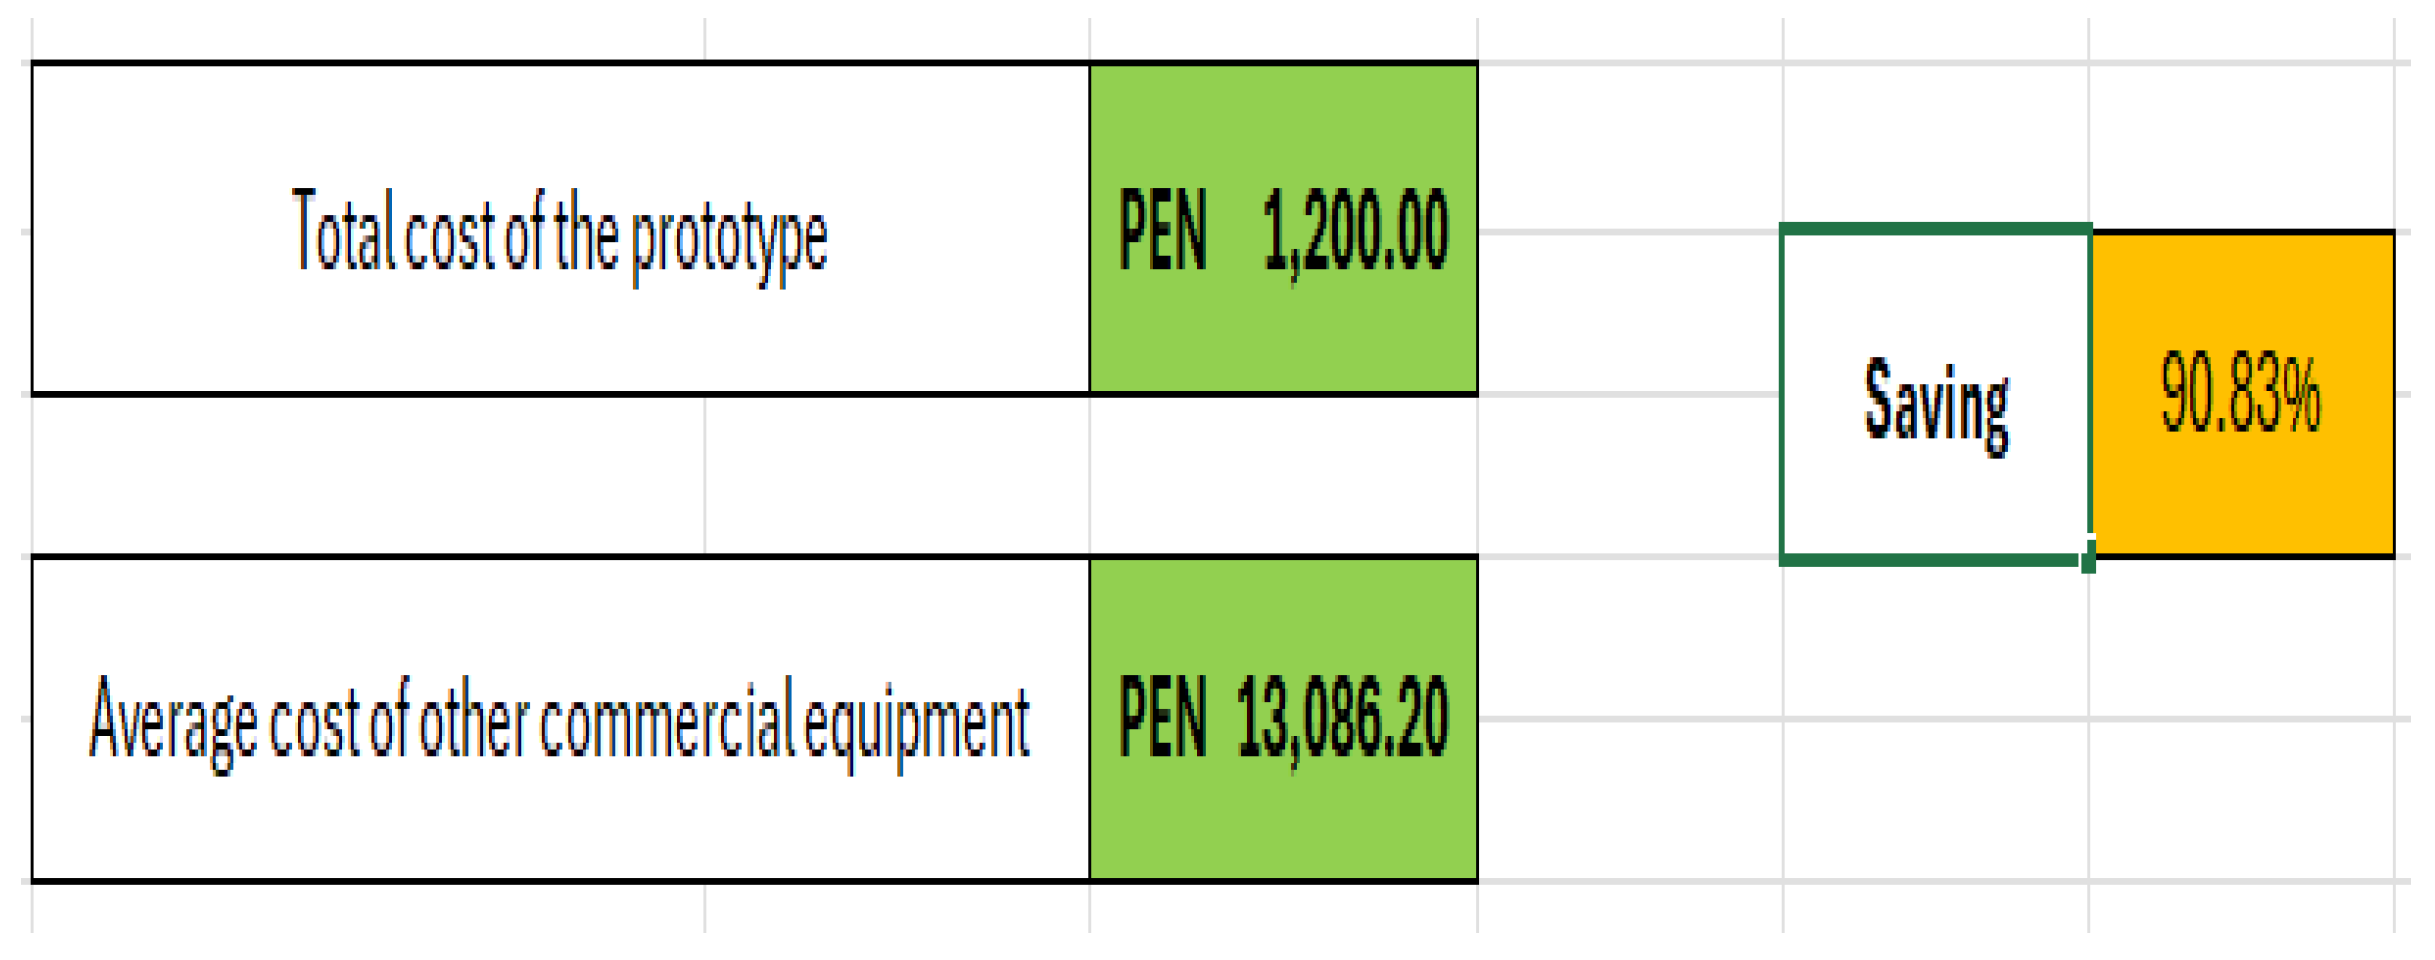
The use of the prototype allowed for a more than tenfold increase in the number of monthly measurements compared to the traditional method, generating a denser and more representative database for the management of residual chlorine.
4. Discussion
The results obtained show that the implementation of the low-cost continuous chlorine monitoring prototype had a clearly favorable effect on the quality of monitoring in the Sinsicap SAP. The quantitative evidence (360 records in 30 days, an 1125% increase in recording frequency, a calibration correlation with R² = 0.983, and a significant difference between methods (t = –3.124, p = 0.004) indicates that the prototype not only expanded the amount of available information but also improved the stability and reliability of residual chlorine control.
In terms of precision and instrumental validation, the coefficient of determination R² = 0.983 obtained from the calibration curve supports the sensor’s accuracy for operating within the normative range (0.5–1.5 mg/L). This performance is consistent with studies that evaluated amperometric sensors and low-cost solutions, where, after appropriate calibrations, high fit coefficients and linear responses useful for field applications were achieved (Hernández, Méndez, and Domínguez, 2020). Although some authors point to variations dependent on temperature or sensor aging (Mackey et al., 2023), the stability observed during our 30-day period suggests that the calibration and verification procedures were adequate to minimize bias in operational readings.
Regarding the frequency and coverage of monitoring, increasing the recording rate from 0.6 measurements/day (pre) to 3 measurements/day (post) per point transformed the ability to detect transient events. Previous studies have documented that continuous monitoring allows for the detection of intraday fluctuations and demand peaks that spot sampling does not capture. Our data confirm this operational advantage: the detection of hourly variations and the reduction in the number of readings below 0.5 mg/L (from 19/30 pre measurements to only 5/360 post measurements) demonstrate a practical improvement in health protection. In accordance with Martínez Moreno et al. (2023) and Masjoudi et al. (2025), the possibility of obtaining dense time series facilitates the identification of daily patterns and the adjustment of dosage during specific time windows, reducing critical areas in the network.
In terms of operational and economic impact, the prototype represented an immediate investment savings of 90.83% compared to commercial equipment, in addition to offering 95% operational availability during the testing period. This combination of low cost and high availability reinforces the findings documented by studies promoting compatible IoT and Arduino solutions for Najarzadegan and Eskandaripour (2025) and Pari Huaman et al. (2022) contexts. While commercial equipment may offer greater service guarantees and technical support, the cost-benefit ratio observed in Sinsicap suggests that, for JASS with budget constraints, low-cost prototypes allow for a substantial improvement in monitoring without the need for prohibitive investments.
When comparing our findings with the literature on chlorine decay in rural networks, we observe coincidences and nuances: as Reynaert et al. (2024) describe, chlorine concentration decreases with distance and travel time; this same trend was documented in Sinsicap, but the prototype allowed for more granular quantification and demonstrated that the percentage drop in chlorine between reservoir and final point was reduced after the intervention (from 56.1% in the pre-test to 44.1% in the post-test). This reduction does not necessarily imply a decrease in demand response throughout the system, but rather an improvement in dosing management that reduces the incidence of critical points, an operational objective pursued by Schubert et al. (2024) through control strategies; our approach achieves this with less technical complexity, but with sufficient feedback for corrective actions.
Finally, empirical evidence suggests several lines of improvement and future research: (1) extending the monitoring period to assess the seasonal stability and long-term drift of the sensor; (2) integrating complementary parameters (pH, temperature, turbidity or ORP) that allow for a better interpretation of chlorine demand, following recommendations from Xie et al. (2025); (3) testing telemetry mechanisms (LoRa, GSM) to transmit data in real time to control centers, expanding the operational reach (Durgun, 2024); and (4) developing a periodic verification protocol with accredited laboratories to maintain metrological traceability.
5. Conclusions
The results of the study allow us to affirm that the implementation of the continuous monitoring prototype generated substantial and verifiable improvements in the control of residual chlorine in the Sinsicap drinking water system. Based on the quantitative, comparative, and statistical analyses applied, the following expanded conclusions are formulated:
1. The implementation of the prototype positively influenced the continuous monitoring of residual chlorine, as it allowed for 360 readings to be obtained in 30 days, compared to the sporadic nature of the traditional manual method, which only generated one measurement every 1 to 2 days. This 1125% increase in the frequency of observation made it possible to better understand the intraday behavior of chlorine.
2. The prototype significantly increased the frequency, accuracy, and continuity of disinfectant control, since it showed a standard deviation of only 0.06 mg/L, notably reducing the variability observed in the pre-test (0.11 mg/L). Furthermore, cross-validation between the sensor and the colorimetric method demonstrated a strong correlation (r = 0.87) and a mean absolute error of 0.05 mg/L. These indicators show that the system allowed for more stable measurements, with less dispersion and greater reliability.
3. The low cost of the prototype demonstrates high economic viability for rural systems, given that its manufacture cost approximately S/ 1200, well below commercial equipment that ranges from S/ 7000 to S/ 13,086.20. This represents a savings of over 90% without sacrificing functionality or measurement quality. In the context of a Water and Sanitation Management Board (JASS) with limited resources, this difference is crucial for the sustainability of the service.
4. The statistical differences obtained confirm that the prototype outperforms the traditional manual method, as evidenced in the paired-samples t-test (t = -3.124; p = 0.004), which demonstrates significant changes in stability and mean chlorine values before and after the intervention. The increase in the average at all points of the network, along with the reduction of readings below 0.5 mg/L, quantitatively support that the device contributed to improving the dosage and distribution of the disinfectant.
5. The system has the potential to be replicated in other Water and Sanitation Management Boards (JASS) and directly contributes to improving the health of rural populations, as it has demonstrated that, even with limited resources, it is possible to implement accessible technology for continuous monitoring, partial automation, and historical recording of disinfectant. The data obtained allows for planning operational adjustments, detecting failures, and improving decision-making, which can strengthen community-based water management in other rural areas of the country that face similar problems.
Author Contributions
Conceptualization, E.C.C.A. and J.C.C.S; methodology, E.C.C.A. and J.C.C.S; validation, G.L.H.C; formal analysis, E.C.C.A. and J.C.C.S; investigation, E.C.C.A. and J.C.C.S; resource E.C.C.A. and J.C.C.S; data processing, E.C.C.A. and J.C.C.S; write original draft preparation E.C.C.A. and J.C.C.S; writing review and editing, E.C.C.A. and J.C.C.S; visualization, E.C.C.A.; J.C.C.S and G.L.H.C; supervision, G.L.H.C; All authors have read and agreed to the published version of the manuscript. E.C.C.A. and J.C.C.S.
Funding
Not applicable.
Institutional Review Board statement
Not applicable.
Informed consent statement
Not applicable.
Data Availability Statement
The original contributions presented in the study are included in the article; further inquiries may be directed to the corresponding author.
Acknowledgments
We wish to express our sincere gratitude to all those who contributed to our research. We sincerely MSc. Eng. Huerta Chombo, German Luis, for his valuable guidance patience, and for generously giving his time outside of regular hours. His insightful advice and willingness to clarify our questions were essential for the development and continuity of this research. We also thansk the Municipality of Sinsicap, throught Eng. Geronimo Pascual Frans Yulio por granting authoization to use information o technical processes and for providing access to municipal data relevant to water and sanitation. Their support was crucial in complementing our work. Finally, we are grateful to the JASS of the Sinsicap district for their continuous cooperation and support during various stages of data collection; their assistance greatly facilitated the development of this research.
Conflicts of Interest
“The authors declare no conflicts of interest.”.
References
- ANGASSA, K., FEYISA, M., TESSEMA, I. y ABEWAA, M., 2025. Residual chlorine modelling in drinking water distribution system of Bishoftu Town, Ethiopia. Results in Engineering, vol. 25, pp. 104075. ISSN 25901230. [CrossRef]
- ARZOVS, A., PARSHUTIN, S., URBANOVICS, V., RUBULIS, J. y DEJUS, S., 2025. Application of differential privacy to sensor data in water quality monitoring task. Ecological Informatics, vol. 86, pp. 103019. ISSN 15749541. [CrossRef]
- BURNET, J.B., DEMETER, K., DORNER, S., FARNLEITNER, A.H., HAMMES, F., PINTO, A.J., PREST, E.I., PRÉVOST, M., STOTT, R. y VAN BEL, N., 2025. Automation of on-site microbial water quality monitoring from source to tap: Challenges and perspectives. Water Research, vol. 274, pp. 123121. ISSN 00431354. [CrossRef]
- CHIU, M.-C., YAN, W.-M., BHAT, S.A. y HUANG, N.-F., 2022. Development of smart aquaculture farm management system using IoT and AI-based surrogate models. Journal of Agriculture and Food Research, vol. 9, pp. 100357. ISSN 26661543. ISSN 26661543. [CrossRef]
- DING, N., ZHU, Q., CHERQUI, F., WALCKER, N., BERTRAND-KRAJEWSKI, J.-L. y HAMEL, P., 2025. Laboratory performance assessment of low-cost water level sensor for field monitoring in the tropics. Water Research X, vol. 27, pp. 100298. ISSN 25899147. [CrossRef]
- DURGUN, Y., 2024. Real-time water quality monitoring using AI-enabled sensors: Detection of contaminants and UV disinfection analysis in smart urban water systems. Journal of King Saud University - Science, vol. 36, no. 9, pp. 103409. ISSN 10183647. [CrossRef]
- ELSHERIF, S.M., TAHA, A.F. y ABOKIFA, A.A., 2024. Disinfectant control in drinking water networks: Integrating advection–dispersion–reaction models and byproduct constraints. Water Research, vol. 267, pp. 122441. ISSN 00431354. [CrossRef]
- FAN, X. y GURTLER, J.B., 2024. Depletion of Free Chlorine and Generation of Trichloromethane in the Presence of pH Control Agents in Chlorinated Water at pH 6.5. Journal of Food Protection, vol. 87, no. 7, pp. 100296. ISSN 0362028X. [CrossRef]
- FASHINA, L., LUFFMAN, I., NANDI, A. y JOYNER, T.A., 2023. Evaluation of karst spring water quality in northeast Tennessee using water quality indices. Agrosystems, Geosciences & Environment, vol. 6, no. 4, pp. e20429. ISSN 2639-6696, 2639-6696. [CrossRef]
- FONSECA-REVELO, J.-E., FONSECA-REVELO, J.-C. y CERÓN-CORREA, A., 2024. Desarrollo de un sistema para el monitoreo de recursos hídricos en el hogar. Revista Científica, no. 50.
- FUENTES AMÍN, O.C. y ROMERO TORRES, M.E., 2024. Diseño de un sistema de monitoreo de calidad de agua basado en IoT, aplicado a unidades de producción acuícola. Revista Facultad de Ciencias Básicas, vol. 19, no. 1, pp. 47-58. ISSN 2500-5316, 1900-4699. [CrossRef]
- HAMEL, P., DING, N., CHERQUI, F., ZHU, Q., WALCKER, N., BERTRAND-KRAJEWSKI, J.-L., CHAMPRASERT, P., FLETCHER, T.D., MCCARTHY, D.T., NAVRATIL, O. y SHI, B., 2024. Low-cost monitoring systems for urban water management: Lessons from the field. Water Research X, vol. 22, pp. 100212. ISSN 25899147. [CrossRef]
- HERNÁNDEZ, J., MÉNDEZ, P. y DOMINGUEZ, I.S., 2020. Diseño e implementación para el control de sensores a través de un instrumento virtual con Arduino. , vol. 24.
- MACKEY, E., HOFMANN, R., FESTGER, A., VANYO, C., MOORE, N., CHEN, T., WANG, C., TAYLOR-EDMONDS, L. y ANDREWS, S.A., 2023. UV-chlorine advanced oxidation for potable water reuse: A review of the current state of the art and research needs. Water Research X, vol. 19, pp. 100183. ISSN 25899147. [CrossRef]
- MARTÍNEZ MORENO, M., HERNÁNDEZ CASTREJÓN, D.A., CERVANTES HONORATO, J., GÓMEZ SANTAMARINA, M.L. y GIL MORENO, B., 2023. Water network: Aplicación móvil con tecnología Arduino para la medición de presión y consumo del agua. Ciencia Latina Revista Científica Multidisciplinar, vol. 7, no. 2, pp. 7817-7829. ISSN 2707-2215, 2707-2207. [CrossRef]
- MASJOUDI, M., DIXIT, F., BARBEAU, B., MITCH, W. y MOHSENI, M., 2025. Photodegradation of micropollutants by vacuum-UV (VUV) radiation in potable reuse waters: Promotive and inhibitory effects of free chlorine oxidant. Journal of Environmental Chemical Engineering, vol. 13, no. 1, pp. 115095. ISSN 22133437. [CrossRef]
- NAJARZADEGAN, M. y ESKANDARIPOUR, M., 2025. Maximizing efficiency and performance of water distribution systems through the implementation of optimization algorithms: A comprehensive analysis of valve and chlorine booster placement and management. Heliyon, vol. 11, no. 3, pp. e42306. ISSN 24058440. [CrossRef]
- PARI HUAMAN, D., MONTES ILIZARBE, G., MEZA PERILLA, K., REYES MONTES, Y.K. y PAUCAR CURASMA, R., 2022. Implementación de un prototipo de monitoreo del nivel del agua en el reservorio de Viñas de la ciudad de Pampas de la provincia de Tayacaja. Llamkasun, vol. 3, no. 1, pp. 104-111. ISSN 2709-2275. [CrossRef]
- REYNAERT, E., NAGAPPA, D., SIGRIST, J.A. y MORGENROTH, E., 2024. Ensuring microbial water quality for on-site water reuse: Importance of online sensors for reliable operation. Water Research X, vol. 22, pp. 100215. ISSN 25899147. [CrossRef]
- SCHUBERT, A., HARRISON, J., KENT-BUCHANAN, L., BONDS, V., HUGHES, S., MCELMURRY, S.P., SEEGER, M. y LOVE, N.G., 2024. Perceptions of drinking water: Understanding the role of individualized water quality data in Detroit, Michigan. En: I. TYAGI (ed.), PLOS Water, vol. 3, no. 4, pp. e0000188. ISSN 2767-3219. [CrossRef]
- XIE, Z., LIU, W., CHEN, S., YAO, R., YANG, C., ZHANG, X., LI, J., WANG, Y. y ZHANG, Y., 2025. Machine learning approaches to identify hydrochemical processes and predict drinking water quality for groundwater environment in a metropolis. Journal of Hydrology: Regional Studies, vol. 58, pp. 102227. ISSN 22145818. [CrossRef]
Disclaimer/Publisher’s Note: The statements, opinions and data contained in all publications are solely those of the individual author(s) and contributor(s) and not of MDPI and/or the editor(s). MDPI and/or the editor(s) disclaim responsibility for any injury to people or property resulting from any ideas, methods, instructions or products referred to in the content. |
© 2025 by the authors. Licensee MDPI, Basel, Switzerland. This article is an open access article distributed under the terms and conditions of the Creative Commons Attribution (CC BY) license (http://creativecommons.org/licenses/by/4.0/).
Copyright: This open access article is published under a Creative Commons CC BY 4.0 license, which permit the free download, distribution, and reuse, provided that the author and preprint are cited in any reuse.


