
Submitted:
21 December 2025
Posted:
22 December 2025
You are already at the latest version
Abstract
Background: The Affordable Care Act enabled states to expand Medicaid eligibility, potentially improving access to care and reducing psychological distress among low-income adults. Evidence on population-level mental health effects remains inconclusive, and conventional two-way fixed-effects difference-in-differences can be biased when adoption is staggered. Objective: To estimate the effect of Medicaid expansion on frequent mental distress (FMD) among non-elderly adults, with emphasis on low-income adults.Methods: We used Behavioral Risk Factor Surveillance System (BRFSS ) data from 2011 to 2024 and restricted the sample to adults aged 18–64 years. FMD was defined as reporting 14 or more days of poor mental health in the past 30 days. Medicaid expansion timing was assigned at the state level. For computational feasibility and transparent weighting, data were collapsed to the state-year level using BRFSS survey weights and screened for minimum unweighted cell size and effective sample size in the low-income panel. We estimated group-time average treatment effects using a staggered difference-in-differences framework implemented via csdid, clustering standard errors at the state level, and using pair-balanced observations when panels were unbalanced. We report pooled average effects and cohort-specific dynamic patterns. Results: In the low-income state-year panel (353 observations), Medicaid expansion was not associated with a statistically significant change in frequent mental distress (ATT −0.0125; 95% CI −0.0521 to 0.0271; p=0.54); estimates in the high-income and pooled panels were similarly small and not significant, while event-time estimates showed modest heterogeneity at selected leads/lags.Conclusions: Medicaid expansion was not associated with significant reductions in frequent mental distress at the population level during 2011–2024, though modest, time-varying effects may occur in specific expansion cohorts. Findings suggest that insurance expansion alone may be insufficient to meaningfully shift population psychological distress without complementary mental health and social support interventions.
Keywords:
medicaid expansion
; affordable care act
; frequent mental distress
; mental health
; BRFSS
; staggered difference-in-differences
; low-income adults
Plain Language Summary
Medicaid expansion under the Affordable Care Act increased health insurance coverage for many low-income adults, which could improve mental health by reducing financial stress and improving access to care. We studied whether Medicaid expansion changed the share of adults reporting “frequent mental distress,” defined as 14 or more days of poor mental health in the past 30 days. Using BRFSS data from 2011–2024, we compared changes in frequent mental distress in states that expanded Medicaid to changes in states that had not yet expanded at the same time. Because states expanded in different years, we used an approach designed for staggered policy adoption and estimated effects separately for low-income, high-income, and all adults aged 18–64. Overall, average effects were small and not statistically distinguishable from zero, although some expansion cohorts showed statistically significant changes in certain years after expansion. These results suggest that Medicaid expansion alone may have limited population-level effects on frequent mental distress.
Introduction
Mental health conditions are a major source of disability and impaired functioning and carry substantial economic consequences. Prior work has argued that commonly used burden-of-disease frameworks understate the population burden attributable to mental illness, and US cost-of-illness estimates for major depressive disorder indicate large and growing economic impacts over time.1,2 In the United States, psychological distress is also closely tied to labor market outcomes, household finances, and health care use—channels that are plausibly affected by health insurance coverage and affordability.
The Affordable Care Act (ACA) Medicaid expansion was designed to increase coverage for low-income adults, reduce out-of-pocket spending, and improve access to care. These mechanisms could influence mental health through reduced financial strain, improved access to behavioral health services, and greater continuity of care. However, Medicaid expansion was adopted at different times across states, creating a staggered policy rollout. This staggered timing matters because standard two-way fixed effects difference-in-differences (TWFE DiD) can be biased when treatment effects vary across cohorts or over time—both plausible for mental health outcomes under a multi-year policy rollout.
Gap in the literature. Evidence on Medicaid expansion and mental health has been mixed, and a meaningful share of prior work relies on TWFE DiD specifications that may be sensitive to staggered adoption and treatment-effect heterogeneity. In addition, fewer studies have used a consistent, public health–oriented measure of population mental health that is available over a long time span and comparable across states. Frequent mental distress (FMD)—defined as reporting ≥14 days of poor mental health in the past 30 days—offers a standardized outcome that can capture population-level changes, including subclinical distress.
Contribution. This study evaluates the association between Medicaid expansion and FMD using (1) the Callaway–Sant’Anna staggered DiD framework (implemented via csdid), which is designed for staggered adoption; (2) pooled estimates for adults aged 18–64 and income-stratified estimates (low-income vs high-income) consistent with the analytic panels produced in the replication code; and (3) BRFSS-based FMD as the primary outcome over 2011–2024.
Objective. To estimate the causal effect of state Medicaid expansion on the prevalence of frequent mental distress among non-elderly adults, with emphasis on low-income adults, and to compare results against high-income and pooled 18–64 panels.
Hypotheses.
- Primary (low-income): Medicaid expansion reduces frequent mental distress among low-income adults (ATT < 0).
- Secondary: Effects are smaller (closer to zero) among high-income adults and in pooled analyses.
- Heterogeneity: Effects vary across expansion cohorts and time since expansion, consistent with treatment-effect heterogeneity under staggered adoption.
Methods
Data Source and Analytic Sample
We used Behavioral Risk Factor Surveillance System (BRFSS) microdata from 2011–2024, a nationally representative, state-based survey of U.S. adults.³ The analytic sample was restricted to adults aged 18–64 years to align with the population most directly affected by Medicaid expansion eligibility. Observations with missing outcome data or missing/nonpositive survey weights were excluded. BRFSS weighting procedures followed established national methods.⁴
Outcome: Frequent Mental Distress
The primary outcome was frequent mental distress (FMD), defined as reporting ≥14 days in the past 30 days when mental health was “not good” (eg, stress, depression, or emotional problems).⁵ This threshold is used in public health surveillance and has supporting evidence on measurement reliability and validity in BRFSS-based research.⁶ Outcomes were aggregated to the state-year level as survey-weighted prevalence.
Treatment: Medicaid Expansion Timing
Treatment was defined by each state’s Medicaid expansion implementation year (expand_year). State-years with expand_year = 0 were coded as non-expansion during the study window (per the policy file used for merging). A state contributed treated observations beginning in its expansion year and in all subsequent years.
Income Stratification
Income strata were constructed from the BRFSS income category (inc_cat). The low-income panel included respondents with non-missing income and inc_cat == 1, and the high-income panel included respondents with non-missing income and inc_cat != 1. Respondents with missing income were excluded from the income-stratified panels. A pooled 18–64 panel retained all respondents and adjusted for income composition and income missingness to limit confounding from shifts in sample composition over time.
Covariates and Missing-Data Handling
Because estimation was conducted on state-year panels, covariates were entered as state-year survey-weighted shares: female, Black, Hispanic, less than high school education, employed, and married. To match the replication code, missing covariate values were zero-imputed, and the corresponding missingness shares (the state-year-weighted proportion missing for each covariate) were included as controls.
In the pooled 18–64 panel, models additionally controlled for the share of low-income among respondents with non-missing income and the share with missing income, reflecting potential changes in observed income composition and missingness over time.
Panel Construction and Precision Screens
Microdata were collapsed to the state-year level using BRFSS survey weights.³,⁴ For each state-year, we computed the Kish effective sample size, , to characterize the information content of weighted estimates under unequal weighting.⁷ To reduce instability from sparse state-year cells, we applied prespecified panel screens. In the low-income panel, we required an unweighted sample size of N≥150 and per state-year. In the high-income and pooled (18–64) panels, we required per state-year. Because the resulting state-year panels were not fully balanced, the estimator used pair-balanced observations when required by the software implementation.
In sensitivity analyses, we assessed robustness to alternative thresholds (e.g., N≥200 and/or lower cutoffs) for the low-income panel.
Empirical Strategy and Estimation
Analyses use screened state-year panels as described above. We used a staggered difference-in-differences design appropriate for variation in treatment timing across states, estimating group-time average treatment effects and then aggregating effects across cohorts and time.⁸ Because Medicaid expansion occurred in different years and effects may vary across cohorts and time since expansion, we avoided relying on two-way fixed effects DiD estimators that can be difficult to interpret under staggered adoption.⁹
Estimation was implemented using csdid, the Stata implementation of the Callaway–Sant’Anna framework.¹⁰ Identification relies on a (conditional) parallel trends assumption given included covariates; sensitivity analyses and diagnostics for parallel trends are conceptually important in this setting and are increasingly emphasized in the modern DiD literature.¹¹
Inference and Unbalanced Panels
Standard errors were clustered at the state level to account for within-state serial correlation. When the panel was not fully balanced, the implementation used pair-balanced observations as required by the estimator.
Dynamic and Cohort-Specific Effects
We summarized results as an overall average treatment effect on the treated (ATT) and examined dynamic (event-time) patterns using event-study functionality. Interpretation of event-study estimates under staggered adoption requires care when treatment effects are heterogeneous.¹²,¹³ We therefore reported dynamic and cohort plots only when post-estimation routines succeeded and only for cohorts present in the estimation sample, consistent with best-practice concerns about event-study implementation and robustness.¹⁴
Robustness and Placebo
As robustness checks, we re-estimated the csdid ATT under alternative specifications that (i) omit all covariates, (ii) exclude state–year observations with high covariate missingness (defined as any available covariate exceeding 50% missingness based on the screening rule in the analysis code), and (iii) implement a placebo design that assigns a pseudo-adoption year of 2014 to ever-treated states (0 for never-treated), holding the estimator and clustering constant.
Results
Analytic Panels and Coverage
After constructing state-year panels from BRFSS microdata and applying the prespecified sample-size/effective-sample screens, the final estimation samples included 353 state-years in the low-income panel, 656 state-years in the high-income panel, and 709 state-years in the pooled ages 18–64 panel. In each panel, states contributed observations as “treated” beginning in their Medicaid expansion year and thereafter; state-years with expand_year=0 served as the never-expanded comparison group within the study window.
Pooled Average Effects (Overall ATT)
Across panels, the pooled average treatment effect on the treated (ATT) was small and statistically indistinguishable from zero (Table 1, Table 2, and Appendix Table A1):
Interpretation: In the pooled 18–64 analysis, the point estimate implies an increase of about 0.2 percentage points in FMD after expansion, but the confidence interval includes both small decreases and small increases.
Dynamic (Event-Time) Effects
Event-study summaries similarly indicated no consistent average post-expansion shift in FMD:
- Low-income panel: pre-period average effect was near zero; the post-period average effect was also near zero. Some event-time coefficients were statistically significant (eg, a negative estimate at t−2 and at t+7), but signs were not uniformly sustained across post-expansion years.
- High-income panel: the pre/post averages were near zero; only isolated event-time estimates reached conventional significance.
Cohort-Specific Heterogeneity
Cohort plots were generated only for expansion cohorts present in the estimation sample. These figures should be interpreted as heterogeneity in cohort-by-year effects (ATT(g,t)) rather than a single “effect of Medicaid expansion,” because effects may differ across adoption cohorts and over time since expansion (Figure 4, Figure 5 and Figure 6). Specifically, we present low-income cohort-specific estimates for the 2014 and 2016 expansion cohorts (Figure 4 and Figure 5) and pooled 18–64 cohort-specific estimates for the 2014 cohort (Figure 6).
Overall, pooled estimates were close to zero, while cohort- and event-time estimates showed modest variation across expansion cohorts and time since expansion. This pattern aligns with prior evidence suggesting that Medicaid coverage expansions can reduce distress for some low-income groups, but that population-average mental health effects are often small and not uniform across settings, outcomes, or follow-up windows.¹⁵⁻¹⁸
Robustness check, in the pooled 18–64 panel, omitting all covariates yields an ATT estimate nearly identical to the baseline specification (ATT = 0.0020, SE = 0.0046). Dropping state–years with high covariate missingness produces a modestly larger pooled estimate (ATT = 0.0053, SE = 0.0049) with a substantially reduced sample (N = 250). In the placebo specification (pseudo-adoption year = 2014), the estimated ATT is near zero (ATT = 0.0008, SE = 0.0050). Table A2 summarizes these checks.
Discussion
Principal Findings
Using a staggered difference-in-differences design aligned with staggered Medicaid expansion timing, we found near-zero average effects of expansion on frequent mental distress (FMD) in pooled (ages 18–64) estimates and in income-stratified panels, alongside cohort- and event-time variability in some post-expansion periods. These patterns suggest that any population-level mental health gains attributable to expansion—if present—are modest and not uniform across cohorts or over time.
Comparability to Prior Work
Our estimates are not directly comparable to many prior Medicaid expansion studies because we analyze aggregated state-year BRFSS outcomes and use frequent mental distress (≥14 poor mental health days) as the primary endpoint. Much of the existing literature relies on individual-level designs (often using NHIS or other sources) and alternative mental health measures. Accordingly, we interpret alignment with prior findings qualitatively as evidence that mental health responses to Medicaid expansion are generally small and heterogeneous, rather than as one-to-one replication.
Results in Context
Our pattern of minor average effects, with heterogeneous cohort- and event-time estimates, aligns with prior evidence that insurance expansions can improve access, affordability, and some self-reported outcomes but do not necessarily translate into significant, stable reductions in mental health symptoms at the population level. The Oregon Health Insurance Experiment found that Medicaid increased coverage and health care use and improved some self-reported health outcomes, including mental health–related measures. Still, the magnitude and persistence of these effects were limited and context-dependent.17 Similarly, quasi-experimental comparisons of early expansion approaches documented substantial coverage gains and improvements in access and affordability, with mixed findings across health outcomes (including depression-related measures) 16 Broader syntheses of expansion’s economic impacts consistently document improvements in financial security and related outcomes,18 which are plausible mechanisms for mental health changes, yet such mechanisms may be insufficient on their own to produce large shifts in a population mental-distress indicator like FMD.
Interpretation and Potential Mechanisms
Several factors may explain modest average effects on FMD despite clear pathways from coverage to mental health:
- Distance from mechanism to outcome: Expansion may reduce financial strain and improve treatment access, but psychological distress is also shaped by labor markets, housing instability, and broader social conditions, potentially diluting net effects in a state-year population measure.
- Service capacity constraints: Insurance gains may not yield proportional gains in effective mental health treatment when provider availability is limited or when nonfinancial barriers persist.
- Outcome sensitivity: FMD (≥14 “not good” mental health days) captures relatively frequent distress; shifts may occur for some subgroups or margins (e.g., milder distress, diagnosed depression) without producing detectable changes in this thresholder measure at the state-year level.
While these Robustness checks are not definitive, especially given the limitations of using a common pseudo-treatment year and the pair-balanced panel, they reinforce the interpretation that the main results are not driven by outlier state–years or specific covariate specifications. The placebo estimate being close to zero is consistent with limited spurious treatment effects generated by the design.
Policy Implications
These findings are most consistent with Medicaid expansion being necessary but not sufficient for broad improvements in population mental distress. Expansion likely supports mental health indirectly via improved access and affordability,16,18 but meaningful reductions in distress may require complementary interventions (e.g., strengthened behavioral health capacity, integrated primary care-behavioral health models, and upstream social supports).
Strengths and Limitations
Key strengths include a long BRFSS time horizon and an estimator appropriate for staggered adoption, with results reported in pooled and income-stratified panels consistent with the replication workflow. Limitations include (1) reliance on self-reported mental health; (2) state-year aggregation, which can attenuate subgroup effects and mask within-state heterogeneity; and (3) a design that estimates average policy effects rather than clinical treatment effects. Cohort/event-time variability should therefore be interpreted as suggestive heterogeneity rather than a definitive map of dynamic causal pathways.
Limitations
- Self-reported outcome: FMD is a validated public health measure, but it remains self-reported and may be affected by reporting differences across states and time.
- State-year aggregation: Collapsing BRFSS microdata to state-year means effects concentrated in specific subgroups (eg, near-eligibles, people with baseline distress) can be diluted, and individual-level heterogeneity cannot be assessed.
- Changing survey conditions over time: BRFSS methods and the social context (notably the COVID-19 period) may introduce time-varying measurement or compositional shifts that are not fully captured by covariate shares.
- Policy exposure misclassification risk: Coding treatment by “expansion year” does not capture partial expansions, waiver details, benefit generosity, provider payment differences, or implementation intensity; this can attenuate estimated effects.
- Identification assumptions: Although the estimator is designed for staggered adoption, causal interpretation still relies on (conditional) parallel trends, and the absence of differential shocks correlated with expansion timing that are not controlled for.
- Unbalanced panels and screening: Pair-balancing and effective-sample-size screens improve stability but may alter the estimating sample, potentially affecting generalizability (especially in the low-income panel).
- Outcome threshold choice: The ≥14-day threshold captures frequent distress; expansion might affect milder symptoms or other mental health outcomes without shifting this indicator.
Future Research
- Individual-level extensions: Re-estimate using microdata (when computationally feasible) to examine heterogeneity by baseline distress, sex, race/ethnicity, education, and employment, and to quantify distributional effects beyond a thresholded outcome.
- Mechanisms and mediators: Test pathways (coverage, cost-related care avoidance, usual source of care, mental health service utilization) to see whether null FMD effects mask improvements in access/financial strain.
- Policy intensity and design features: Move beyond a single expansion-year indicator by incorporating waiver type, eligibility thresholds, benefit packages, managed care penetration, and behavioral health carve-ins to capture better “dose.”
- Capacity constraints: Link to county/state mental health workforce and provider availability to assess whether treatment effects are moderated by supply-side capacity.
- Alternative outcomes and time horizons: Evaluate depression diagnosis, treatment, unmet need, and other HRQOL outcomes; examine longer-run effects and whether impacts differ in post-2020 periods.
- Sensitivity and falsification: Add pre-trend diagnostics and sensitivity analyses (eg, robust parallel-trends approaches and placebo timing tests) to bound estimates under plausible deviations from identification assumptions.
Conclusions
Using BRFSS data from 2011–2024 and a staggered difference-in-differences design that accounts for variation in Medicaid expansion timing, we find little evidence of a large population-wide effect of Medicaid expansion on frequent mental distress among adults aged 18–64. Pooled estimates are near zero, and income-stratified results show similarly modest average effects, although some cohort- and event-time–specific estimates vary in magnitude and statistical significance. Overall, the findings suggest that insurance expansion alone may be insufficient to produce substantial reductions in frequent mental distress at the population level, and that any mental health gains may be heterogeneous and contingent on timing, context, and complementary behavioral health and social supports.
Author Contributions
Conceptualization: Kola Adegoke; Methodology: Abimbola Adegoke; Data Curation: Abimbola Adegoke; Deborah Dawodu; Formal Analysis: Kola Adegoke; Software: Kola Adegoke; Validation: Abimbola Adegoke; Abiodun Isola Aluko; Investigation: Abimbola Adegoke; Olajide Alfred Durojaye; Deborah Dawodu; Abiodun Isola Aluko; Interpretation: Abimbola Adegoke, Olajide Alfred Durojaye; Deborah Dawodu; Abiodun Isola Aluko.; Writing – Original Draft: Kola Adegoke; Writing – Review & Editing: Abimbola Adegoke; Olajide Alfred Durojaye; Deborah Dawodu; Abiodun Isola Aluko; Kenneth A. Knapp.; Supervision: Kola Adegoke; Project Administration: Deborah Dawodu; Resources / Clinical / Program Context Input: Olajide Alfred Durojaye; Abiodun Isola Aluko.
Funding
No specific grant or external funding was received for this study.
Ethics Approval and Consent to Participate
This study analyzed de-identified, publicly available BRFSS data and did not involve interaction with human participants. In accordance with federal regulations (45 CFR 46), institutional review board (IRB) approval was not required because no human subjects were involved. BRFSS obtained participant-informed consent during data collection.
Competing Interests
The authors declare no potential conflicts of interest with respect to the research, authorship, or publication of this article.
Data Availability Statement
BRFSS public-use data are available from the U.S. Centers for Disease Control and Prevention. The analysis-ready dataset, state Medicaid expansion-year crosswalk, and replication code used in this study are available on OSF at: DOI: 10.17605/OSF.IO/QMZNR.
Appendix A

Table A1.
Pooled average treatment effect of Medicaid expansion on frequent mental distress (FMD), by analytic panel (csdid). (Outcome is state-year FMD prevalence; effects are percentage-point units.).
Table A1.
Pooled average treatment effect of Medicaid expansion on frequent mental distress (FMD), by analytic panel (csdid). (Outcome is state-year FMD prevalence; effects are percentage-point units.).
| Analytic Panel | N (State-Years) | ATT | SE | P Value |
|---|---|---|---|---|
| Low-income (screened) | 353 | -0.0125 | 0.0202 | 0.537 |
| High-income (screened) | 656 | 0.0006 | 0.0035 | 0.857 |
| Pooled, ages 18–64 (screened) | 709 | 0.0020 | 0.0046 | 0.668 |
Notes: Estimates are from staggered difference-in-differences using the Callaway–Sant’Anna approach implemented via csdid. Panels are constructed by collapsing BRFSS microdata to the state-year level using survey weights. Standard errors are clustered at the state level. Covariate adjustment follows the replication code (state-year shares of sex, race/ethnicity, education, employment, marital status, and missingness shares; pooled models additionally adjust for income composition among non-missing income and income-missing share). The LOW-income panel is screened using minimum unweighted n and Kish effective sample size; HIGH-income and pooled panels are screened using Kish effective sample size only. Because panels are not fully balanced, the implementation uses pair-balanced observations when required. OSF supplement: Full ATT(g,t) tables and all cohort/event-study figures are provided in the OSF repository.
Table A2.
Robustness and placebo checks (csdid estimator; standard errors clustered by state). Outcome: Frequent Mental Distress (FMD), BRFSS 2011–2024, ages 18–64. Estimator: Callaway & Sant’Anna csdid; regression adjustment; SE clustered at state. Unit: State–year (survey-weighted aggregation; effective-N screening as in main text).
| Panel | Specification | ATT | SE | N |
|---|---|---|---|---|
| Low-income | Baseline (main covariates) | -0.0125 | 0.0202 | 400 |
| Low-income | No covariates | -0.0125 | 0.0202 | 400 |
| Low-income | Drop high covariate missingness (>50%) | -0.0468 | 0.0365 | 159 |
| Pooled (18–64) | Baseline (main covariates) | 0.0020 | 0.0046 | 709 |
| Pooled (18–64) | No covariates | 0.0020 | 0.0046 | 709 |
| Pooled (18–64) | Drop high covariate missingness (>50%) | 0.0053 | 0.0049 | 250 |
| Pooled (18–64) | Placebo: pseudo-adoption year = 2014 for ever-treated | 0.0008 | 0.0050 | 709 |
Notes: 1. “Drop high covariate missingness” removes state–year observations where any available covariate exceeds 50% missingness, based on screening criteria defined in the analysis code. 2. The placebo assigns 2014 as a pseudo-treatment year for ever-treated states and 0 for never-treated states; estimation otherwise matches the pooled baseline specification. 3. N denotes observations used in each estimation sample (state–years).
References
- Vigo, D.; Thornicroft, G.; Atun, R. Estimating the true global burden of mental illness. Lancet Psychiatry 2016, 3, 171–178. [Google Scholar] [CrossRef] [PubMed]
- Greenberg, P.E.; Fournier, A.-A.; Sisitsky, T.; Simes, M.; Berman, R.; Koenigsberg, S.H.; Kessler, R.C. The Economic Burden of Adults with Major Depressive Disorder in the United States (2010 and 2018). PharmacoEconomics 2021, 39, 653–665. [Google Scholar] [CrossRef] [PubMed]
- Centers for Disease Control and Prevention. Behavioral Risk Factor Surveillance System (BRFSS): Overview/FAQ. Available online: https://www.cdc.gov/brfss/about/brfss_faq.htm? (accessed on 18 December 2025).
- Iachan, R.; Pierannunzi, C.; Healey, K.; Greenlund, K.J.; Town, M. National weighting of data from the Behavioral Risk Factor Surveillance System (BRFSS). BMC Med Res. Methodol. 2016, 16, 1–12. [Google Scholar] [CrossRef] [PubMed]
- Cree, R.A.; Okoro, C.A.; Zack, M.M.; Carbone, E. Frequent Mental Distress Among Adults, by Disability Status, Disability Type, and Selected Characteristics — United States, 2018. Mmwr-Morbidity Mortal. Wkly. Rep. 2020, 69, 1238–1243. [Google Scholar] [CrossRef] [PubMed]
- Pierannunzi, C.; Hu, S.S.; Balluz, L. A systematic review of publications assessing reliability and validity of the Behavioral Risk Factor Surveillance System (BRFSS), 2004–2011. BMC Med Res. Methodol. 2013, 13, 49. [Google Scholar] [CrossRef] [PubMed]
- Wiegand, H.; Kish, L. Survey Sampling. John Wiley & Sons, Inc., New York, London 1965, IX + 643 S., 31 Abb., 56 Tab., Preis 83 s. Biom. Z. 1968, 10, 88–89. [Google Scholar] [CrossRef]
- Callaway, B.; Sant’aNna, P.H. Difference-in-Differences with multiple time periods. J. Econ. 2021, 225, 200–230. [Google Scholar] [CrossRef]
- Goodman-Bacon, A. Difference-in-differences with variation in treatment timing. J. Econ. 2021, 225, 254–277. [Google Scholar] [CrossRef]
- Rios-Avila, F. csdid: Difference-in-Differences with Multiple Time Periods in Stata [software]. GitHub Repository (csdid_drdid). Available online: https://www.stata.com/meeting/us21/slides/US21_SantAnna.pdf (accessed on 18 December 2025).
- Correction: Regarding Article History dates for articles on journal Review of Economic Studies. Rev. Econ. Stud. 2023, 90, 2674. [CrossRef]
- de Chaisemartin, C.; D’Haultfœuille, X. Two-Way Fixed Effects Estimators with Heterogeneous Treatment Effects. Am. Econ. Rev. 2020, 110, 2964–2996. [Google Scholar] [CrossRef]
- Sun, L.; Abraham, S. Estimating dynamic treatment effects in event studies with heterogeneous treatment effects. J. Econom. 2021, 225, 175–199. [Google Scholar] [CrossRef]
- Borusyak, K.; Jaravel, X.; Spiess, J. Revisiting Event-Study Designs: Robust and Efficient Estimation. Rev. Econ. Stud. 2024, 91, 3253–3285. [Google Scholar] [CrossRef]
- McMorrow, S.; Gates, J.A.; Long, S.K.; Kenney, G.M. Medicaid Expansion Increased Coverage, Improved Affordability, And Reduced Psychological Distress For Low-Income Parents. Health Aff. 2017, 36, 808–818. [Google Scholar] [CrossRef] [PubMed]
- Sommers, B.D.; Blendon, R.J.; Orav, E.J.; Epstein, A.M. Changes in Utilization and Health Among Low-Income Adults After Medicaid Expansion or Expanded Private Insurance. JAMA Intern. Med. 2016, 176, 1501–1509. [Google Scholar] [CrossRef] [PubMed]
- Finkelstein, A.; Taubman, S.; Wright, B.; Bernstein, M.; Gruber, J.; Newhouse, J.P.; Allen, H.; Baicker, K. Oregon Health Study Group The Oregon Health Insurance Experiment: Evidence from the First Year*. Q. J. Econ. 2012, 127, 1057–1106. [Google Scholar] [CrossRef] [PubMed]
- Antonisse, L.; Garfield, R.; Rudowitz, R.; Artiga, S. The Effects of Medicaid Expansion Under the ACA: Updated Findings from a Literature Review. Kaiser Family Foundation. 2019. Available online: https://collections.nlm.nih.gov/catalog/nlm:nlmuid-101707525-pdf (accessed on 18 December 2025).
Figure 1.
Dynamic effects of Medicaid expansion on frequent mental distress (FMD), pooled adults aged 18–64 (BRFSS 2011–2024). Notes: Event-study estimates from staggered DiD (Callaway–Sant’Anna) implemented via csdid. Outcome is state-year FMD prevalence (≥14 mentally unhealthy days). Effects are in proportion units (×100 = percentage points) for event times Tm5–Tp8 (Tp0 = expansion year). Points show 95% CIs; SEs clustered by state. BRFSS microdata were survey-weighted and collapsed to state-year; pooled panel screened by Kish neff; models adjust for state-year covariate and missingness shares.
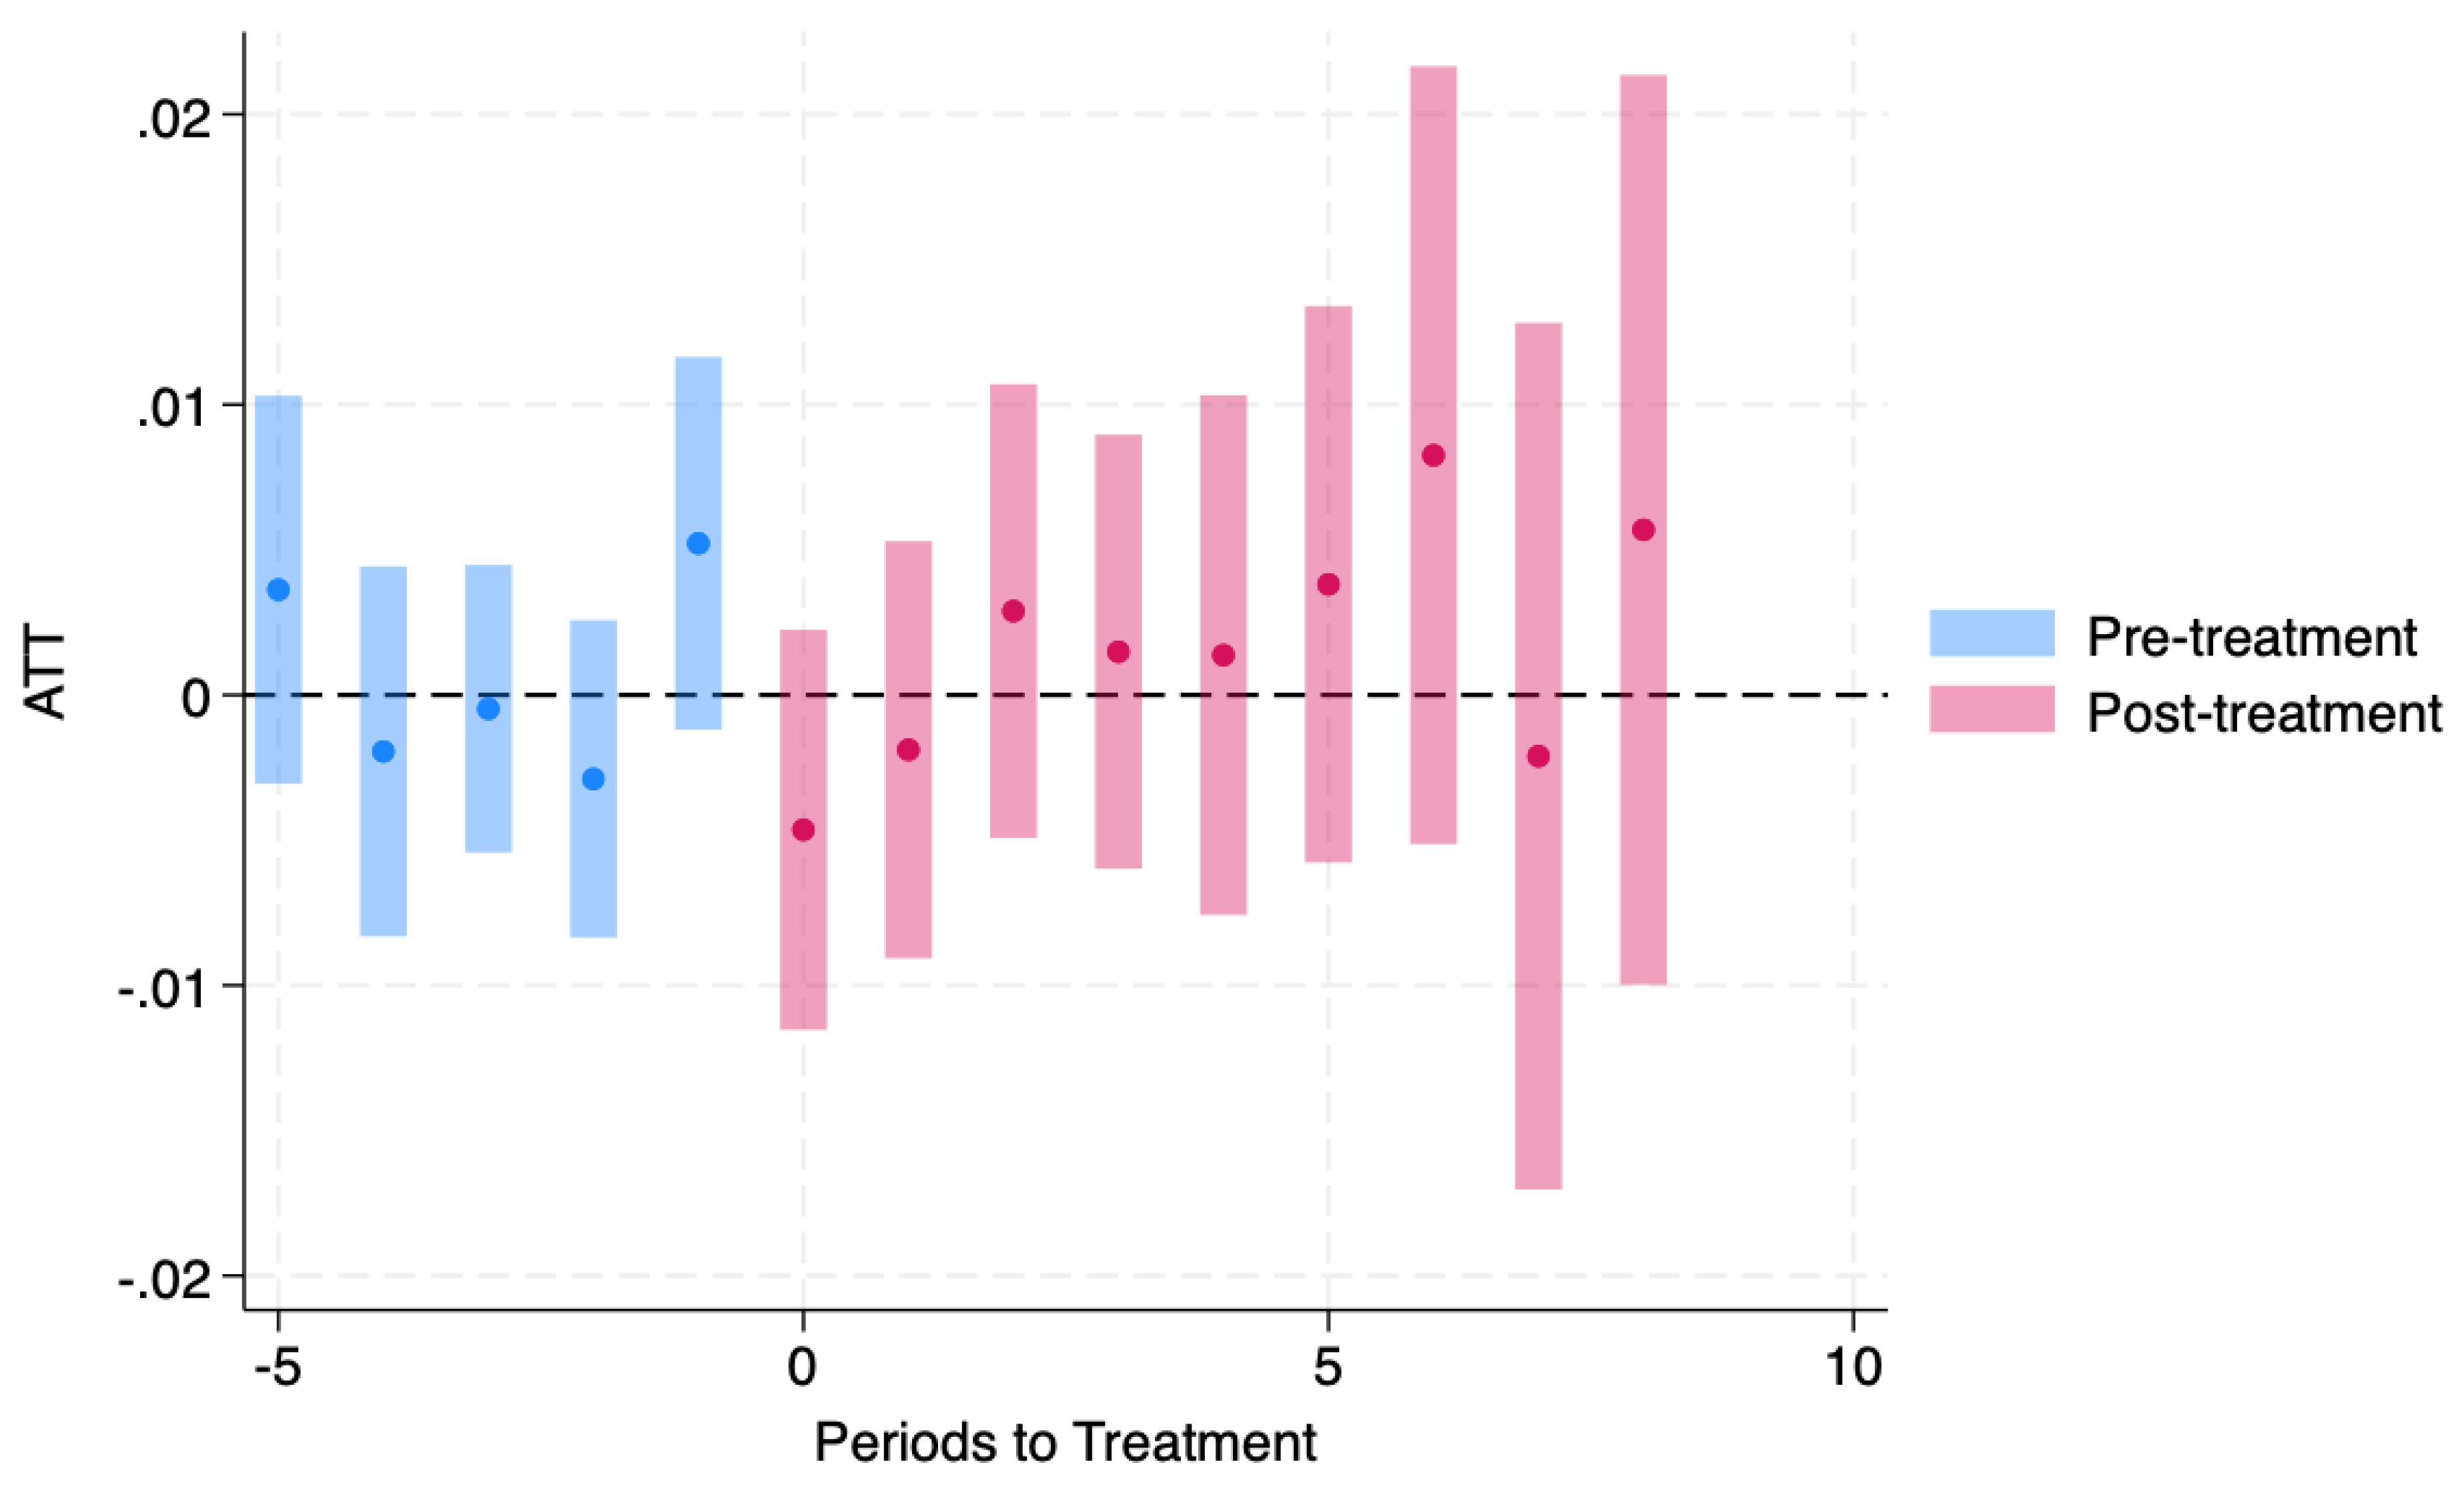
Figure 2.
Dynamic effects of Medicaid expansion on frequent mental distress (FMD), low-income adults (BRFSS 2011–2024). Notes: Same estimator and event-time coding as Figure 1. The low-income panel includes respondents with non-missing income in the low-income category; BRFSS microdata were survey-weighted and collapsed to state-year. Effects are in proportion units (×100 = percentage points). Points show 95% CIs; SEs clustered by state. LOW panel applies minimum unweighted n and Kish neff screens; models adjust for state-year covariate and missingness shares.
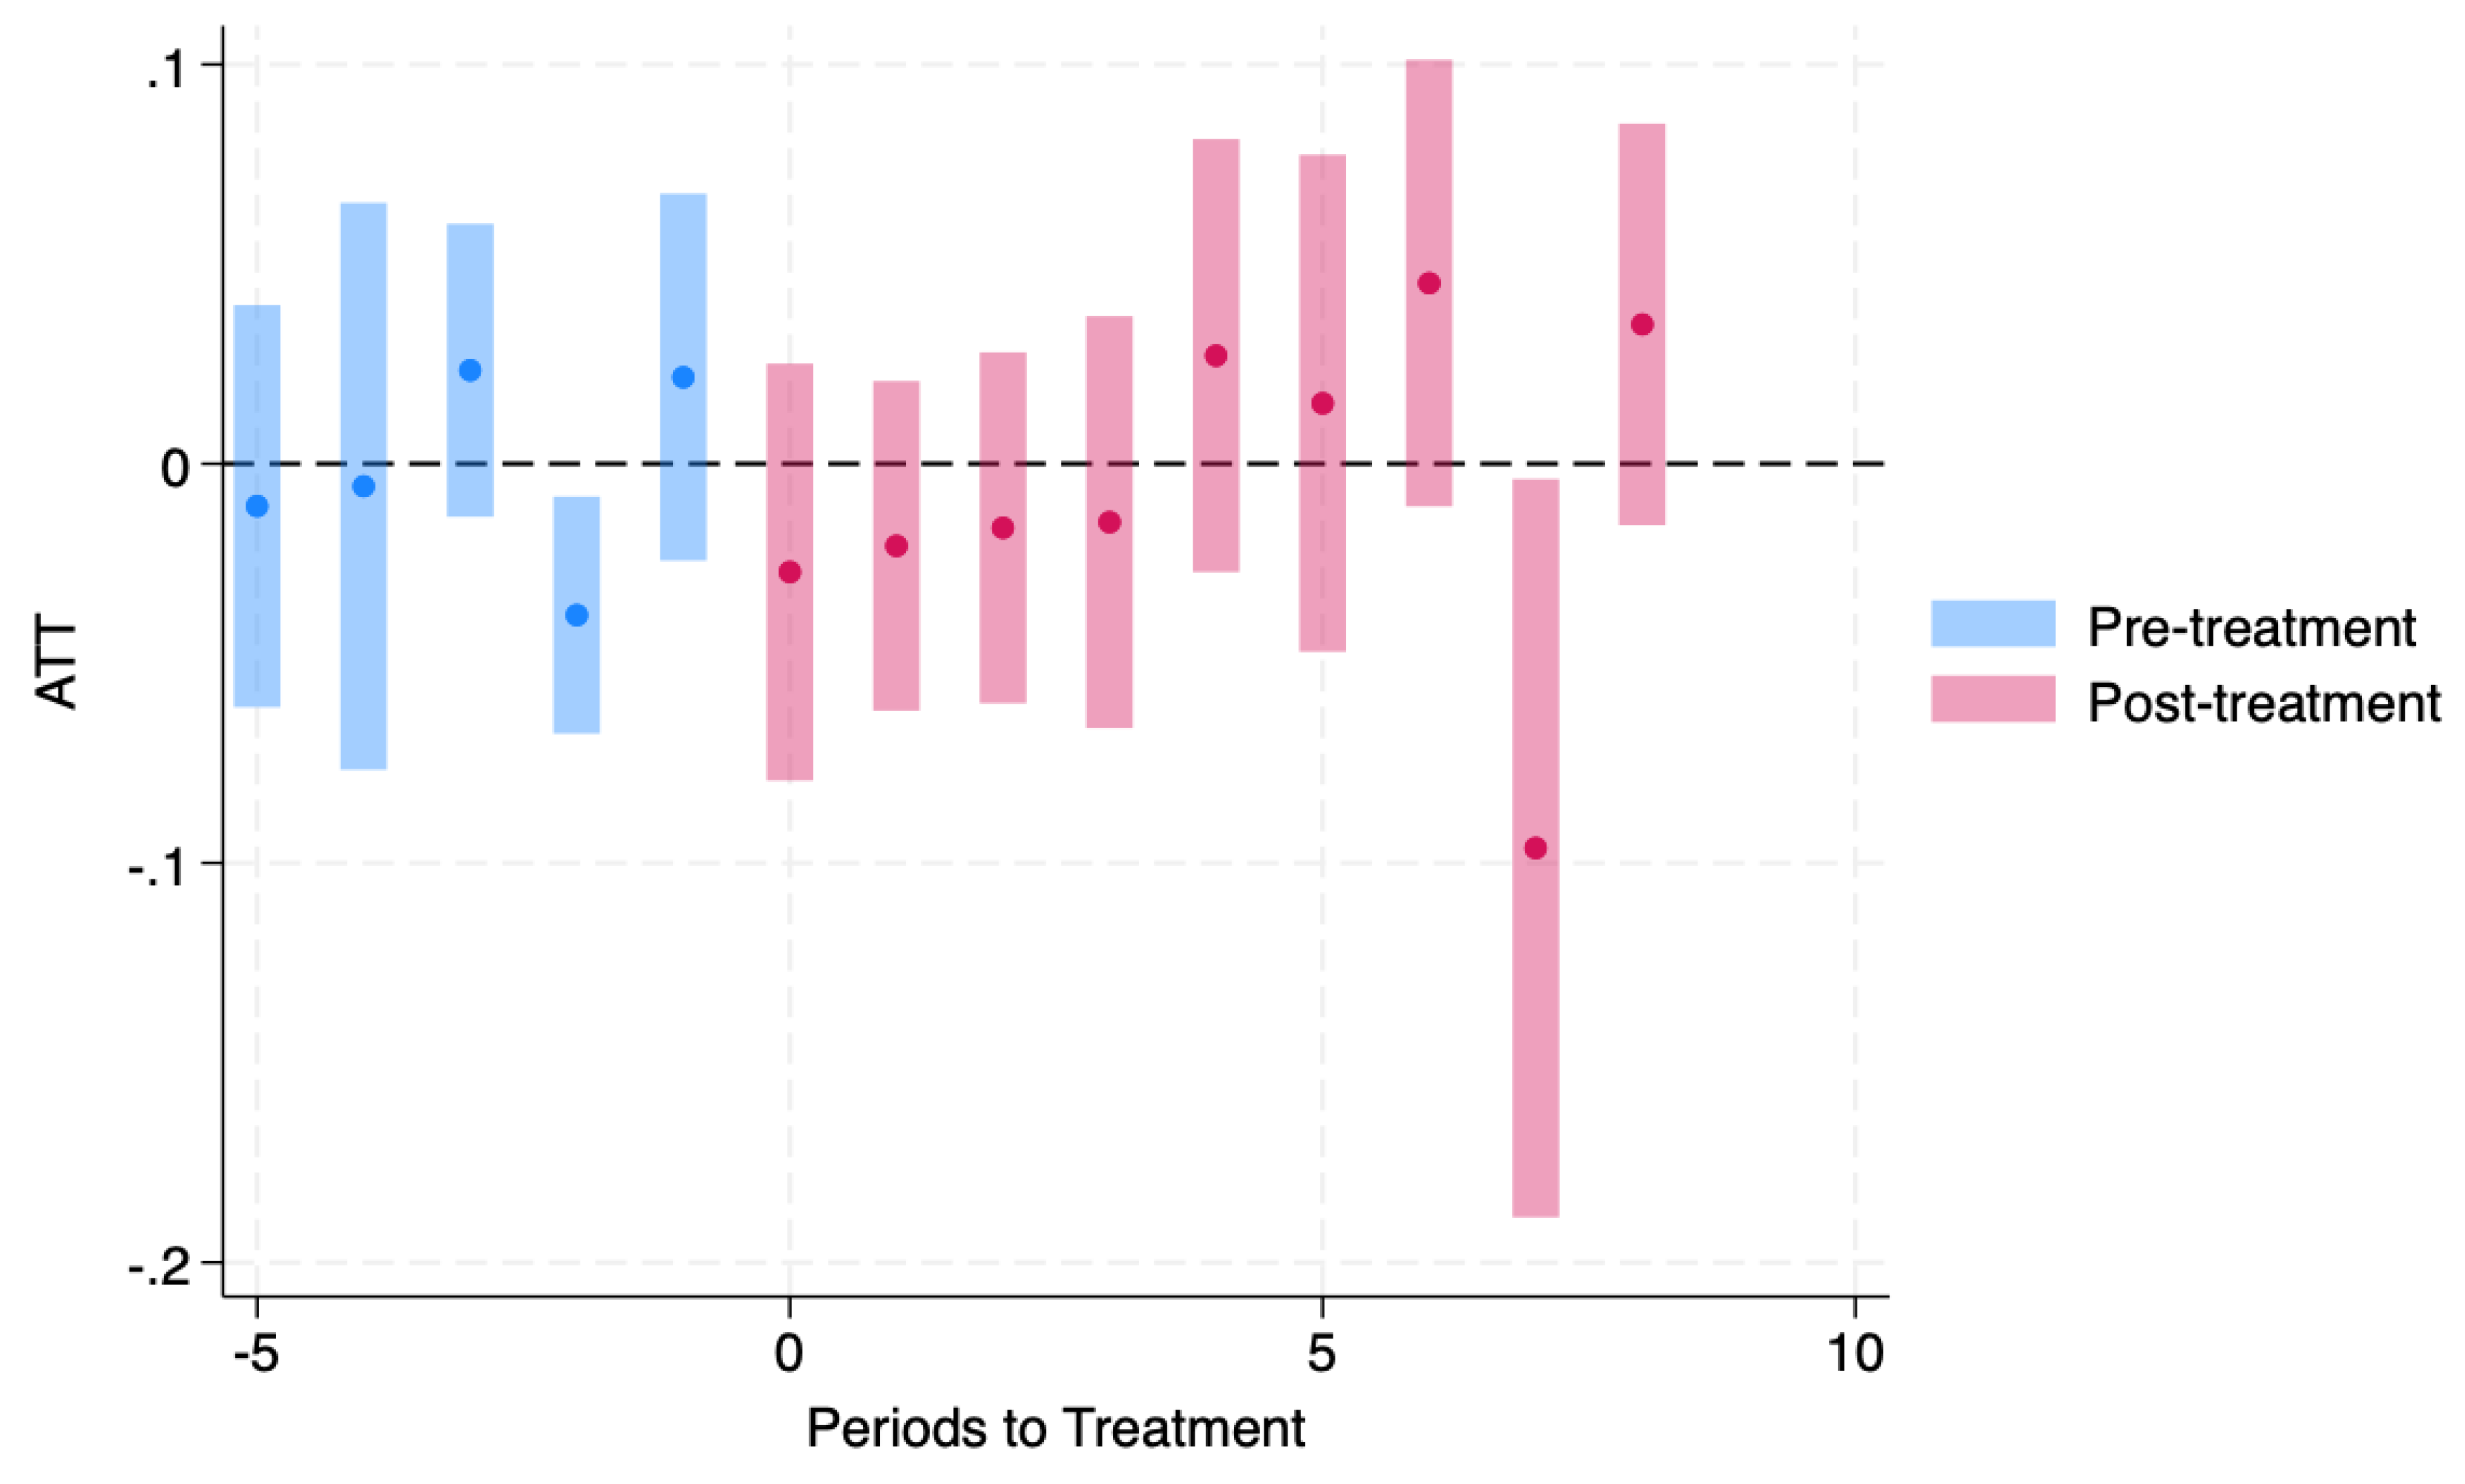
Figure 3.
Dynamic effects of Medicaid expansion on frequent mental distress (FMD), high-income adults (BRFSS 2011–2024). Notes: Event-study ATT estimates from a Callaway–Sant’Anna staggered DiD (csdid) using BRFSS 2011–2024 collapsed to state-year with survey weights. Outcome is FMD prevalence (≥14 mentally unhealthy days/30); effects are in percentage points. Bars show 95% Cis with Ses clustered by state. Event window is −5 to +8 years relative to expansion year (Tp0). The high-income panel is screened by the Kish effective sample size (n_eff) and adjusted for state-year covariate shares and missingness shares.
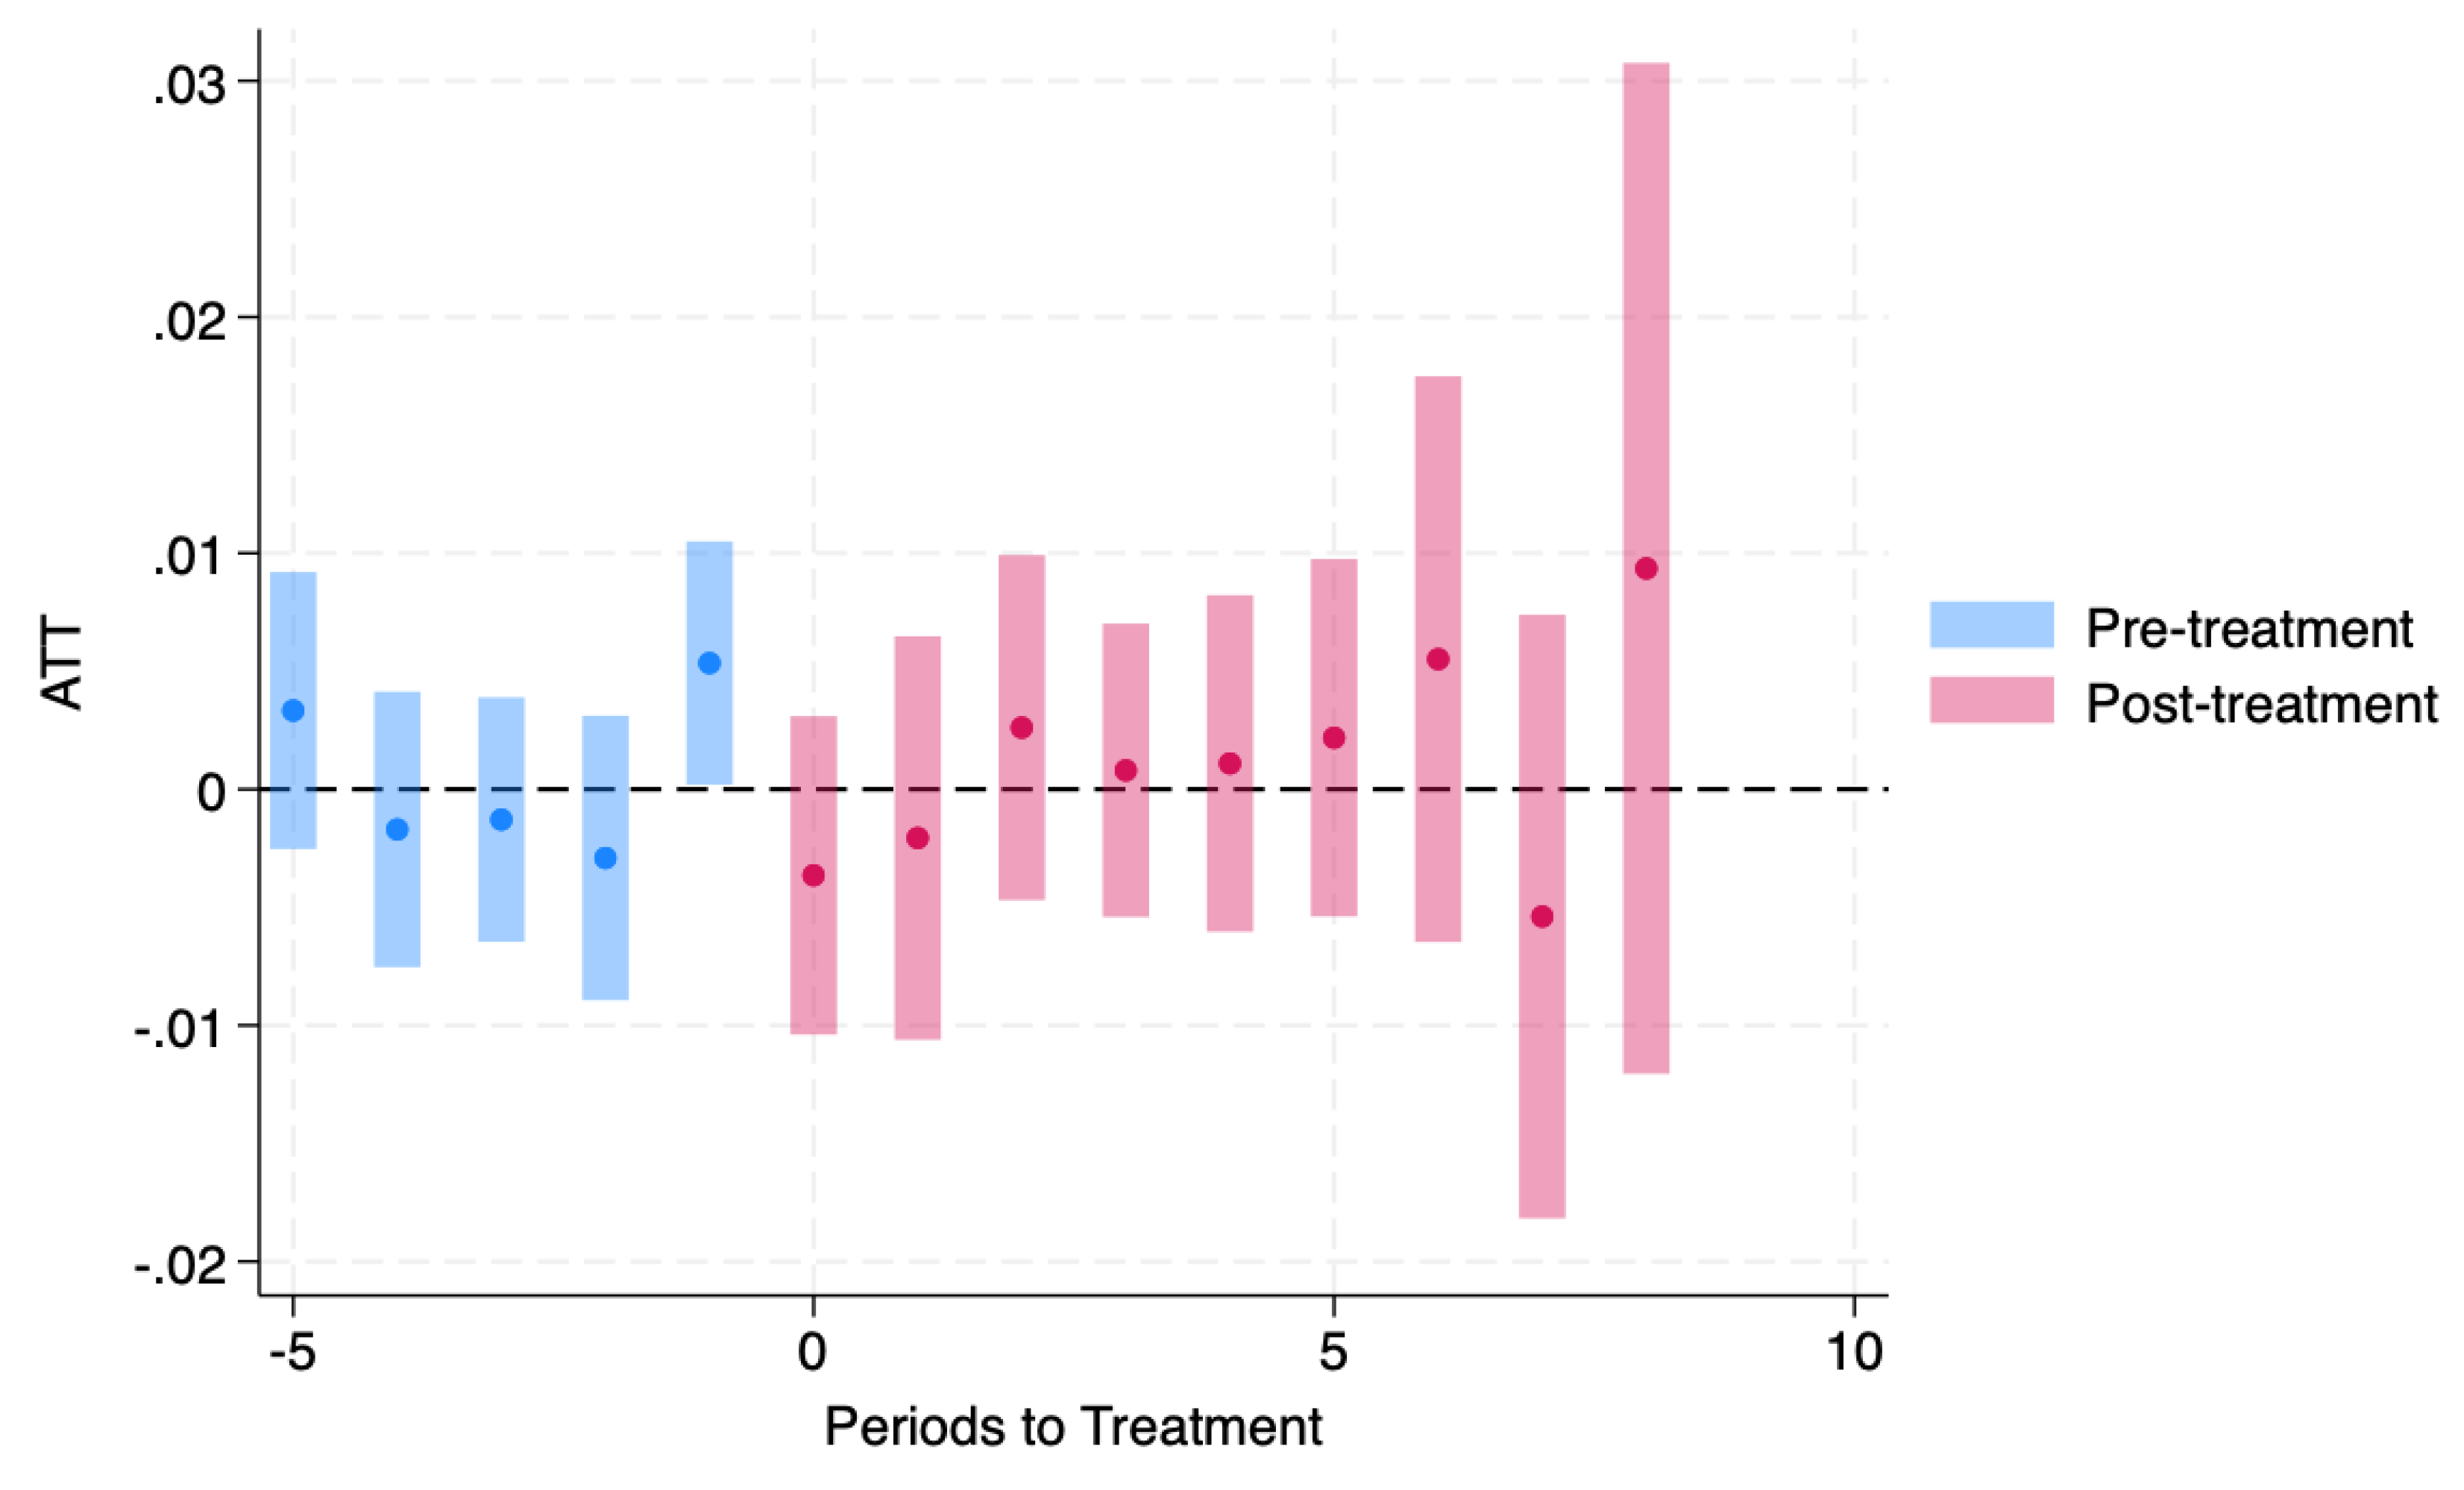
Figure 4.
Cohort-specific effects of Medicaid expansion on FMD: 2014 expansion cohort, low-income panel (BRFSS 2011–2024). Notes: Cohort-specific group-time ATT(g,t) estimates from the Callaway–Sant’Anna staggered DiD (csdid) for states expanding Medicaid in 2014. Outcome is low-income state-year FMD prevalence (≥14 mentally unhealthy days/30), collapsed from BRFSS 2011–2024 using survey weights and screened by minimum unweighted n and Kish n_eff. Points show estimates with 95% Cis; Ses clustered by state. Only cohort-years observed in the estimation sample are shown.
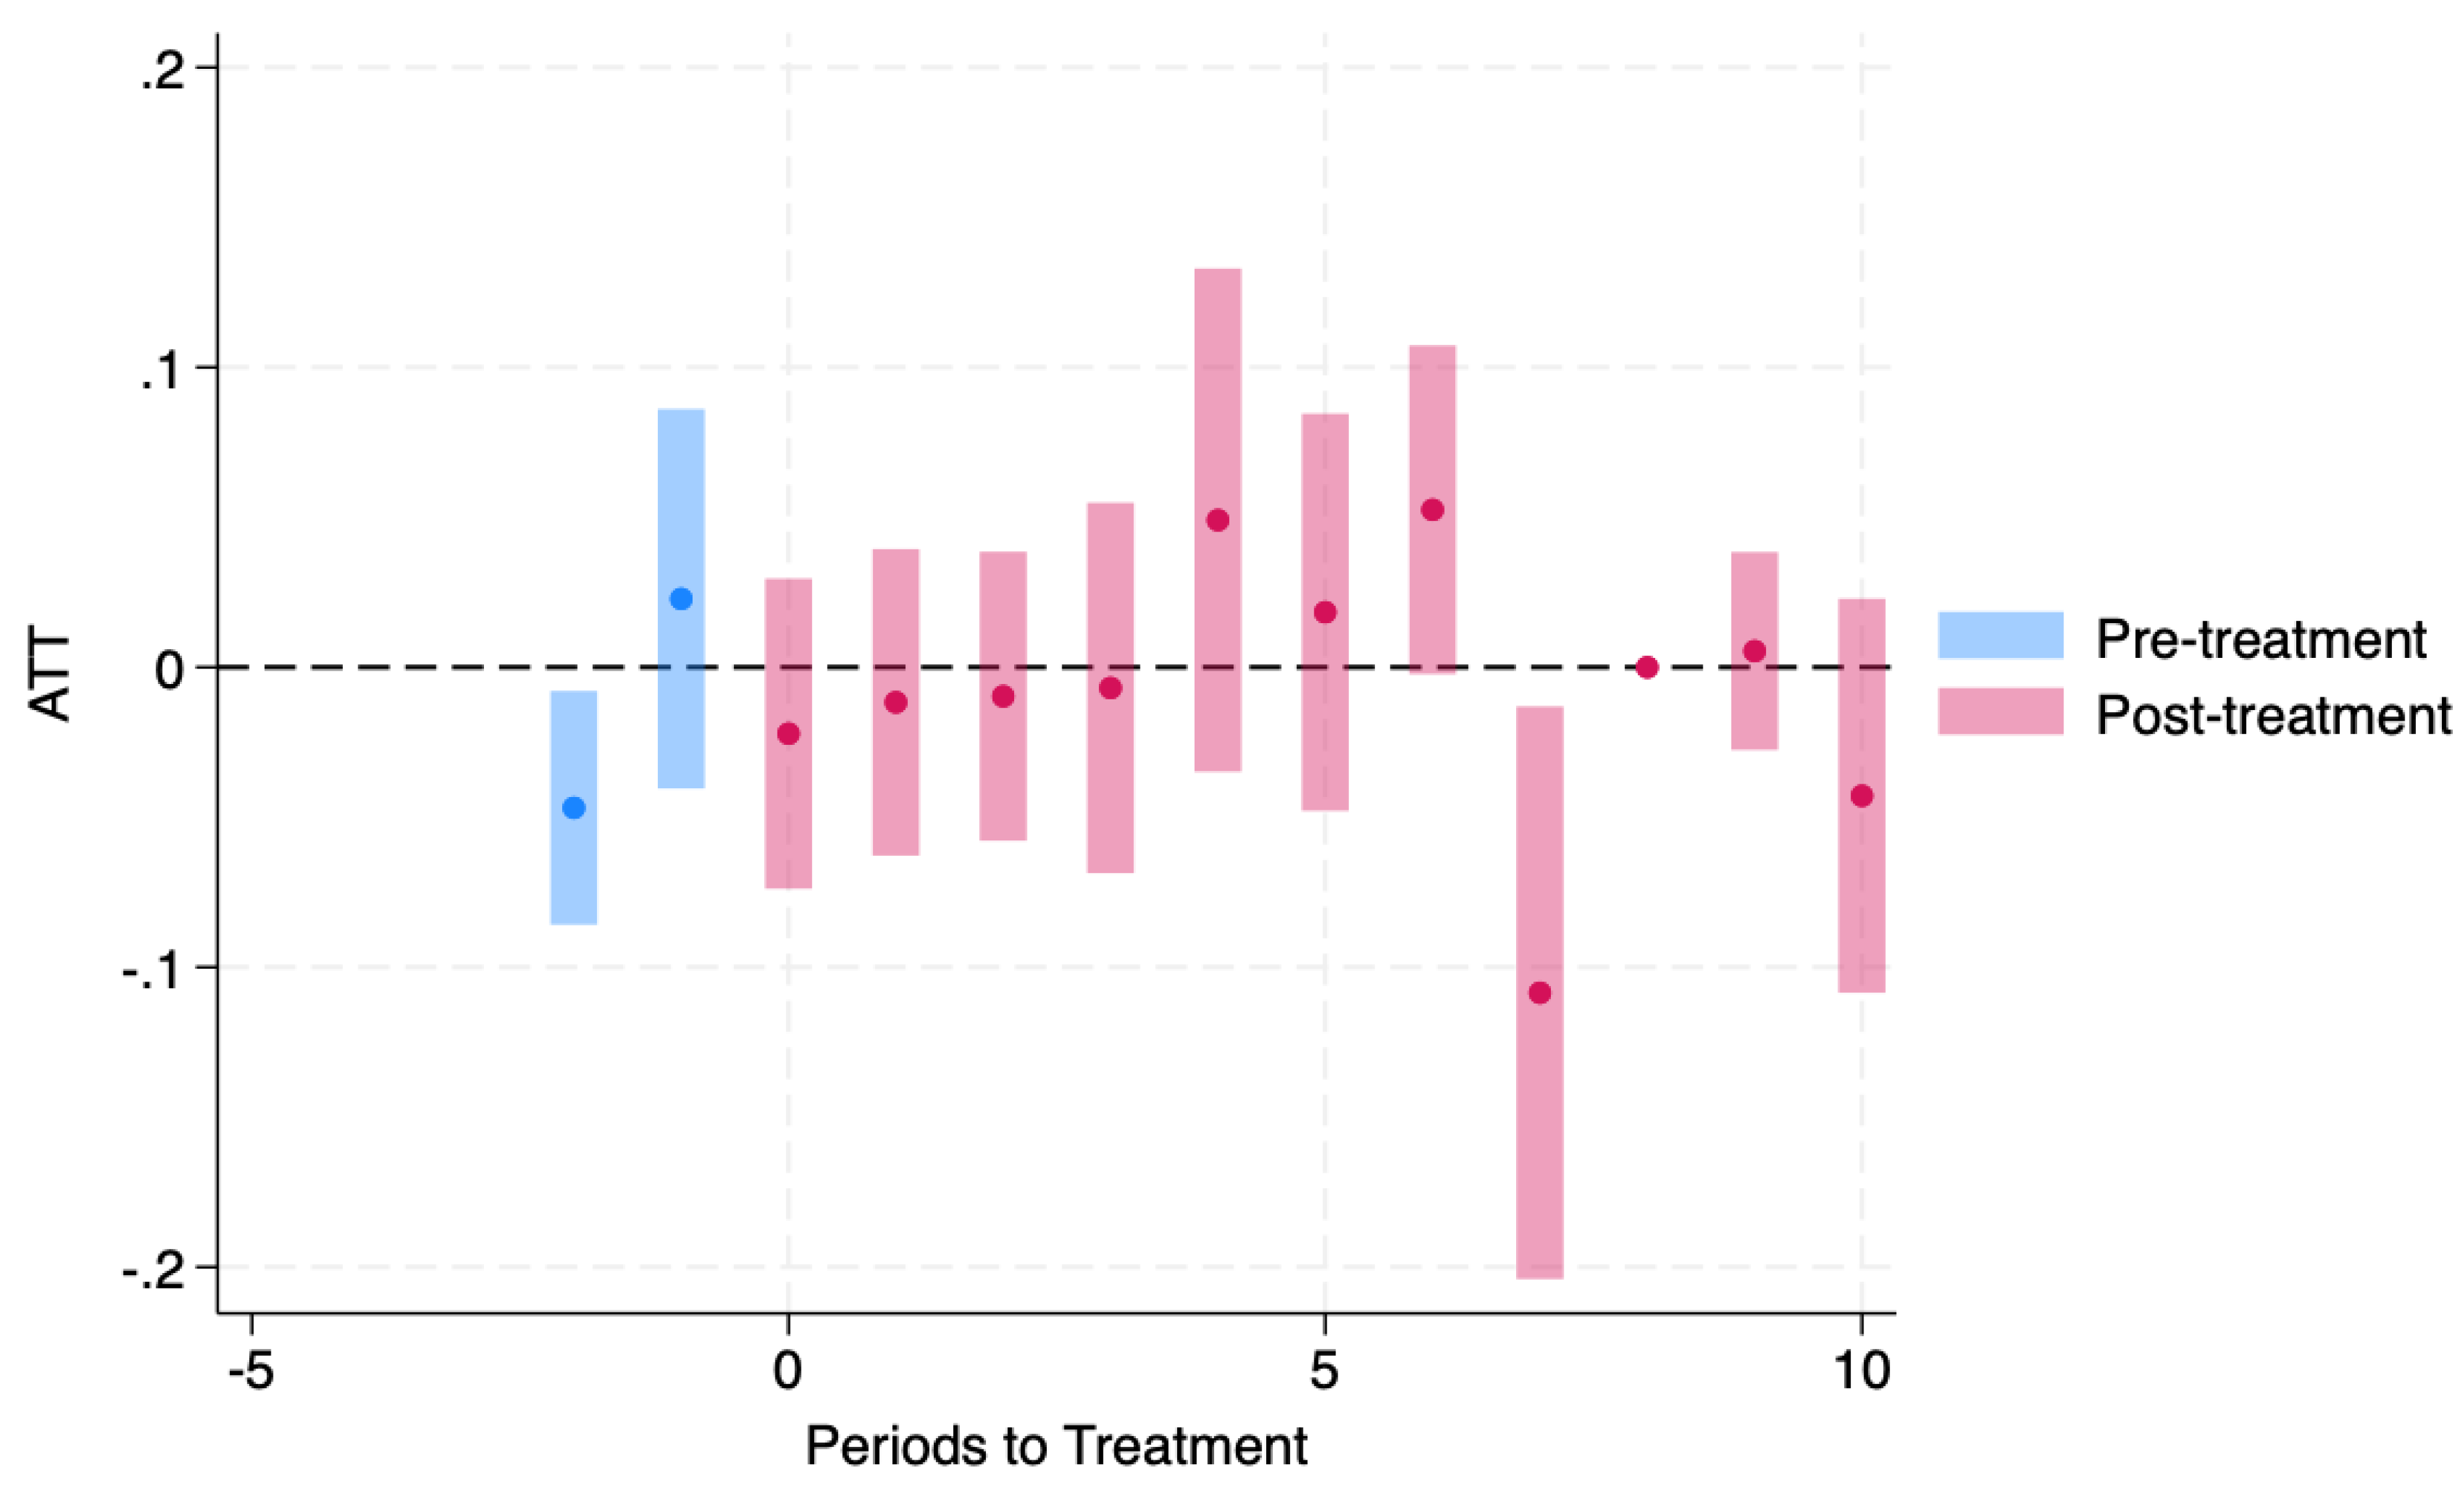
Figure 5.
Cohort-specific effects of Medicaid expansion on FMD: 2016 expansion cohort, low-income panel (BRFSS 2011–2024). Notes: Cohort-specific ATT(g,t) estimates (csdid) for 2016 expansion states in the low-income panel; points are estimates and bars are 95% CIs with state-clustered SEs. Only cohort-years observed in the estimation sample are shown; effects are percentage-point changes in state-year FMD prevalence.
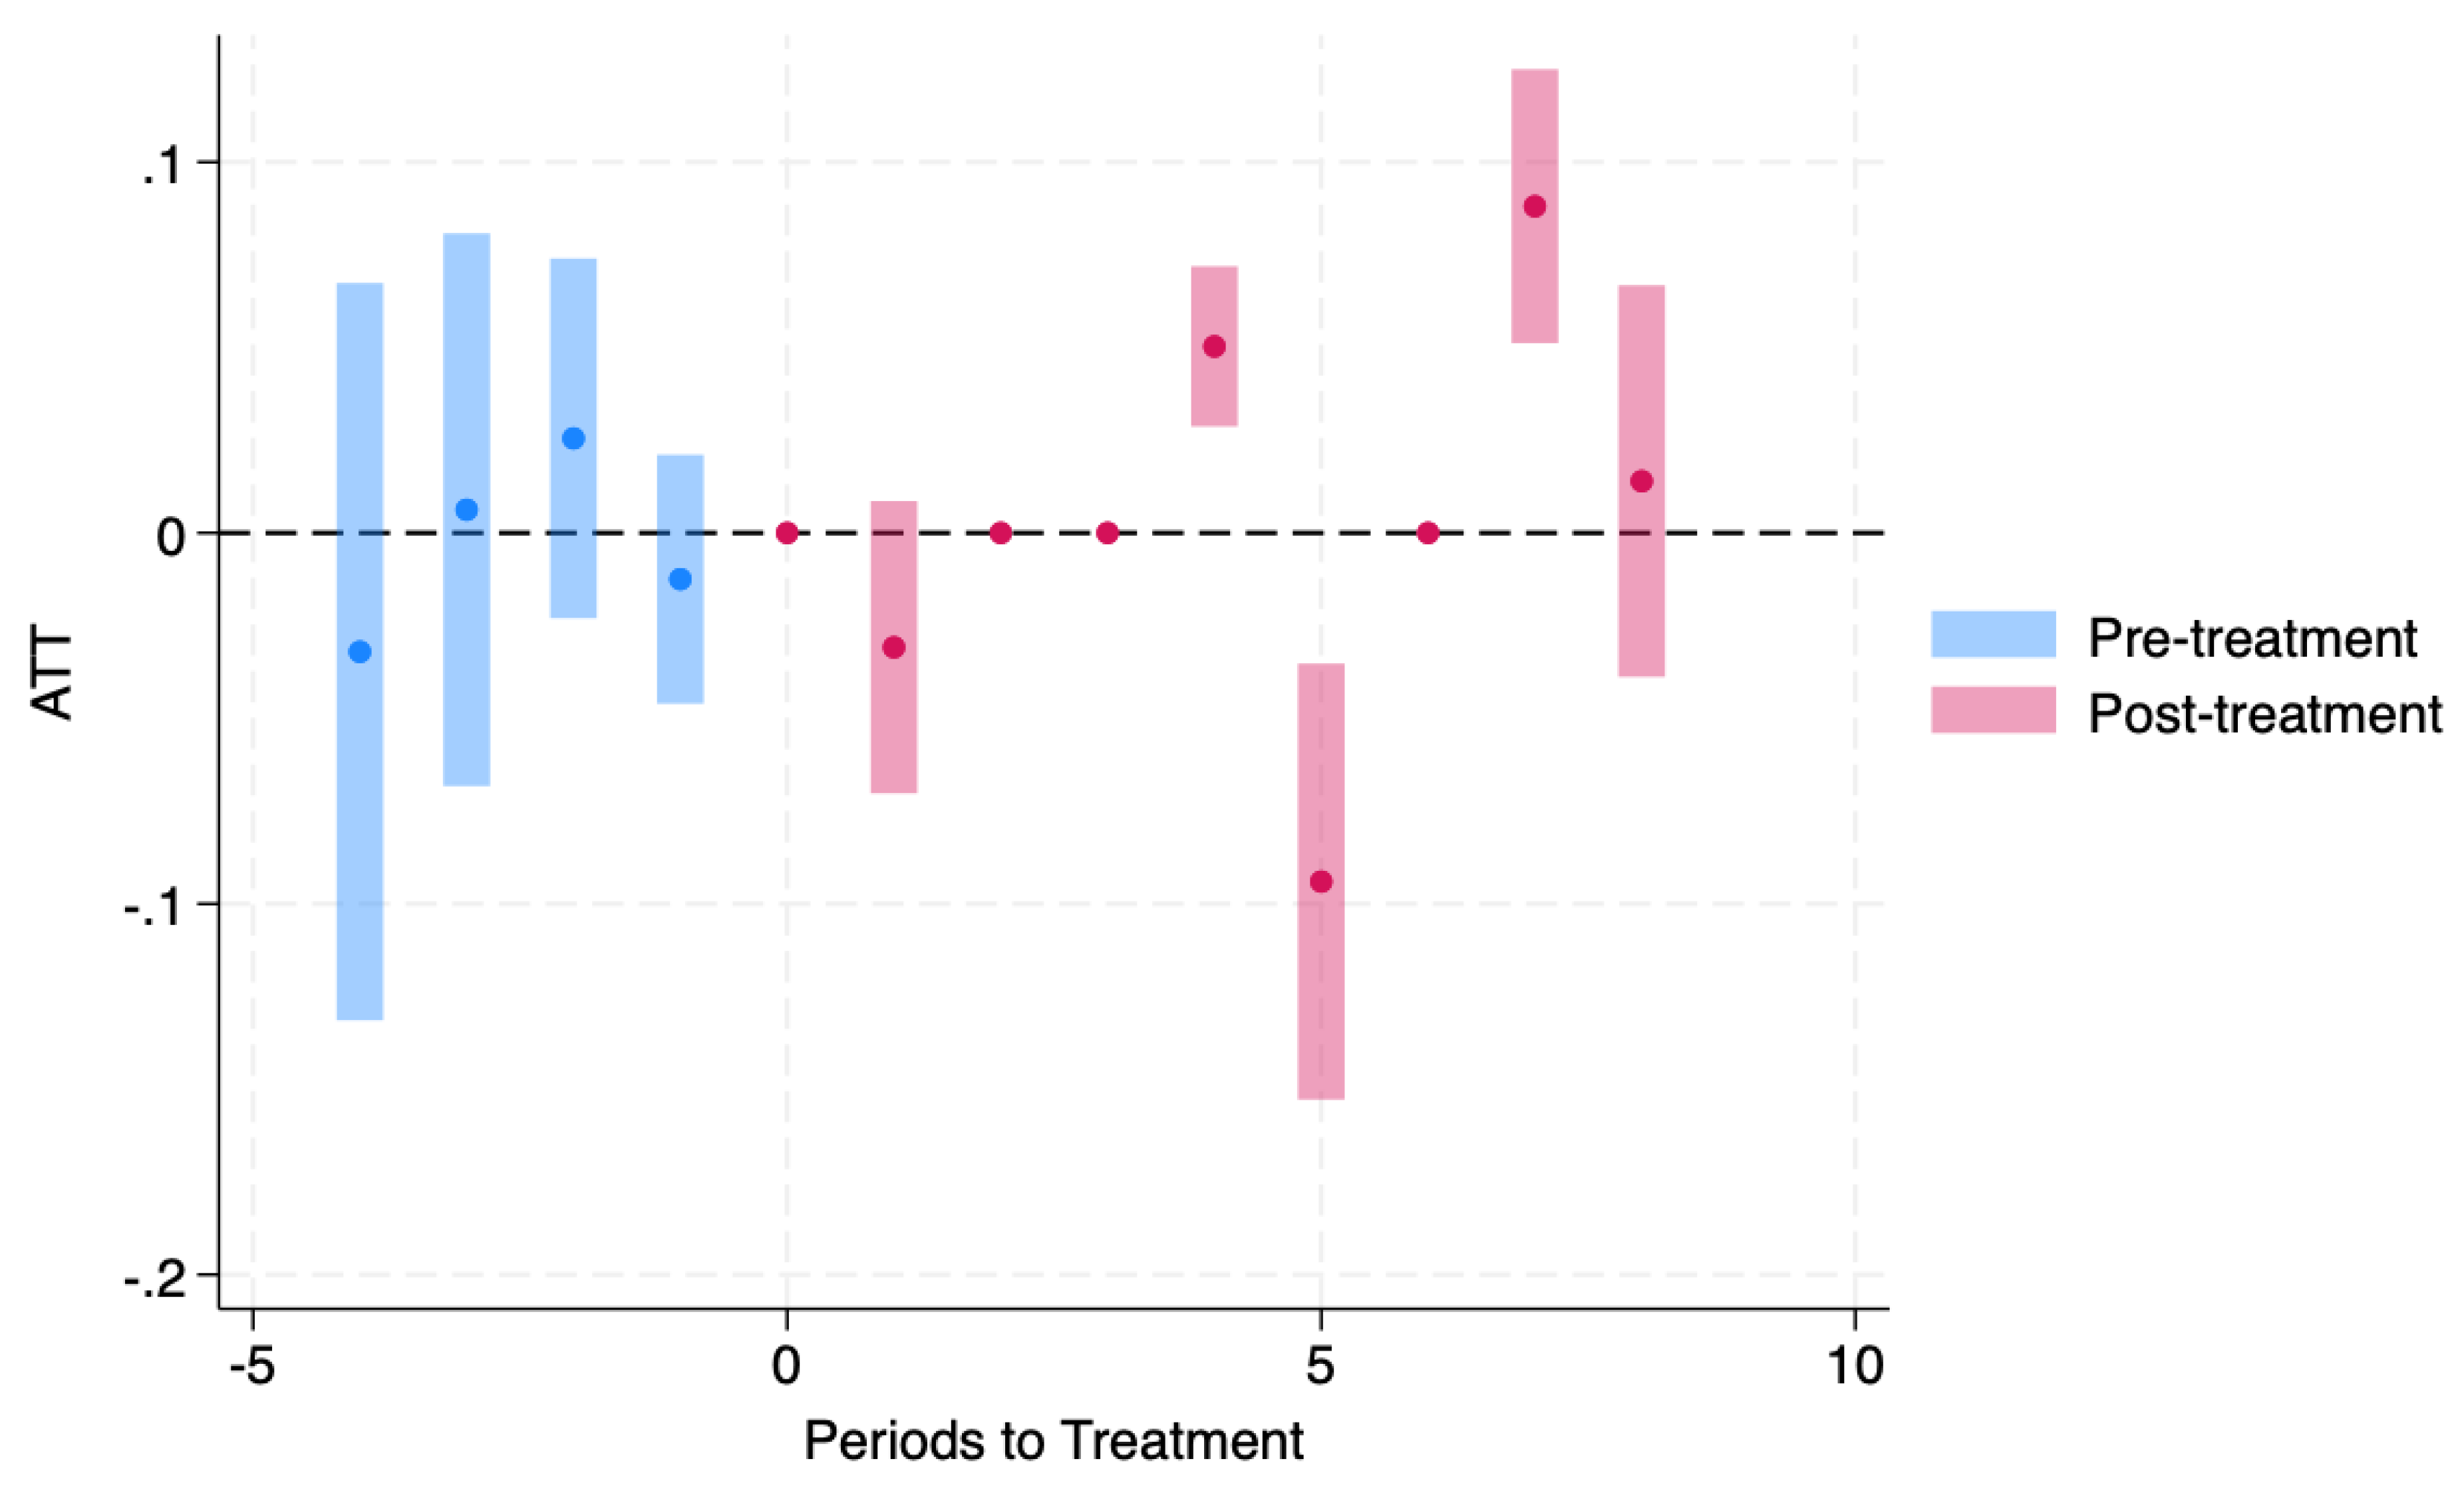
Figure 6.
Cohort-specific effects of Medicaid expansion on FMD: 2014 expansion cohort, pooled adults aged 18–64 (BRFSS 2011–2024). Notes: Cohort-specific ATT(g,t) estimates (csdid) for 2014 expansion states in the pooled 18–64 panel; points are estimates and bars are 95% CIs with state-clustered SEs. Outcomes are survey-weighted state-year FMD prevalence (percentage-point units); pooled panel screened by Kish n_eff.
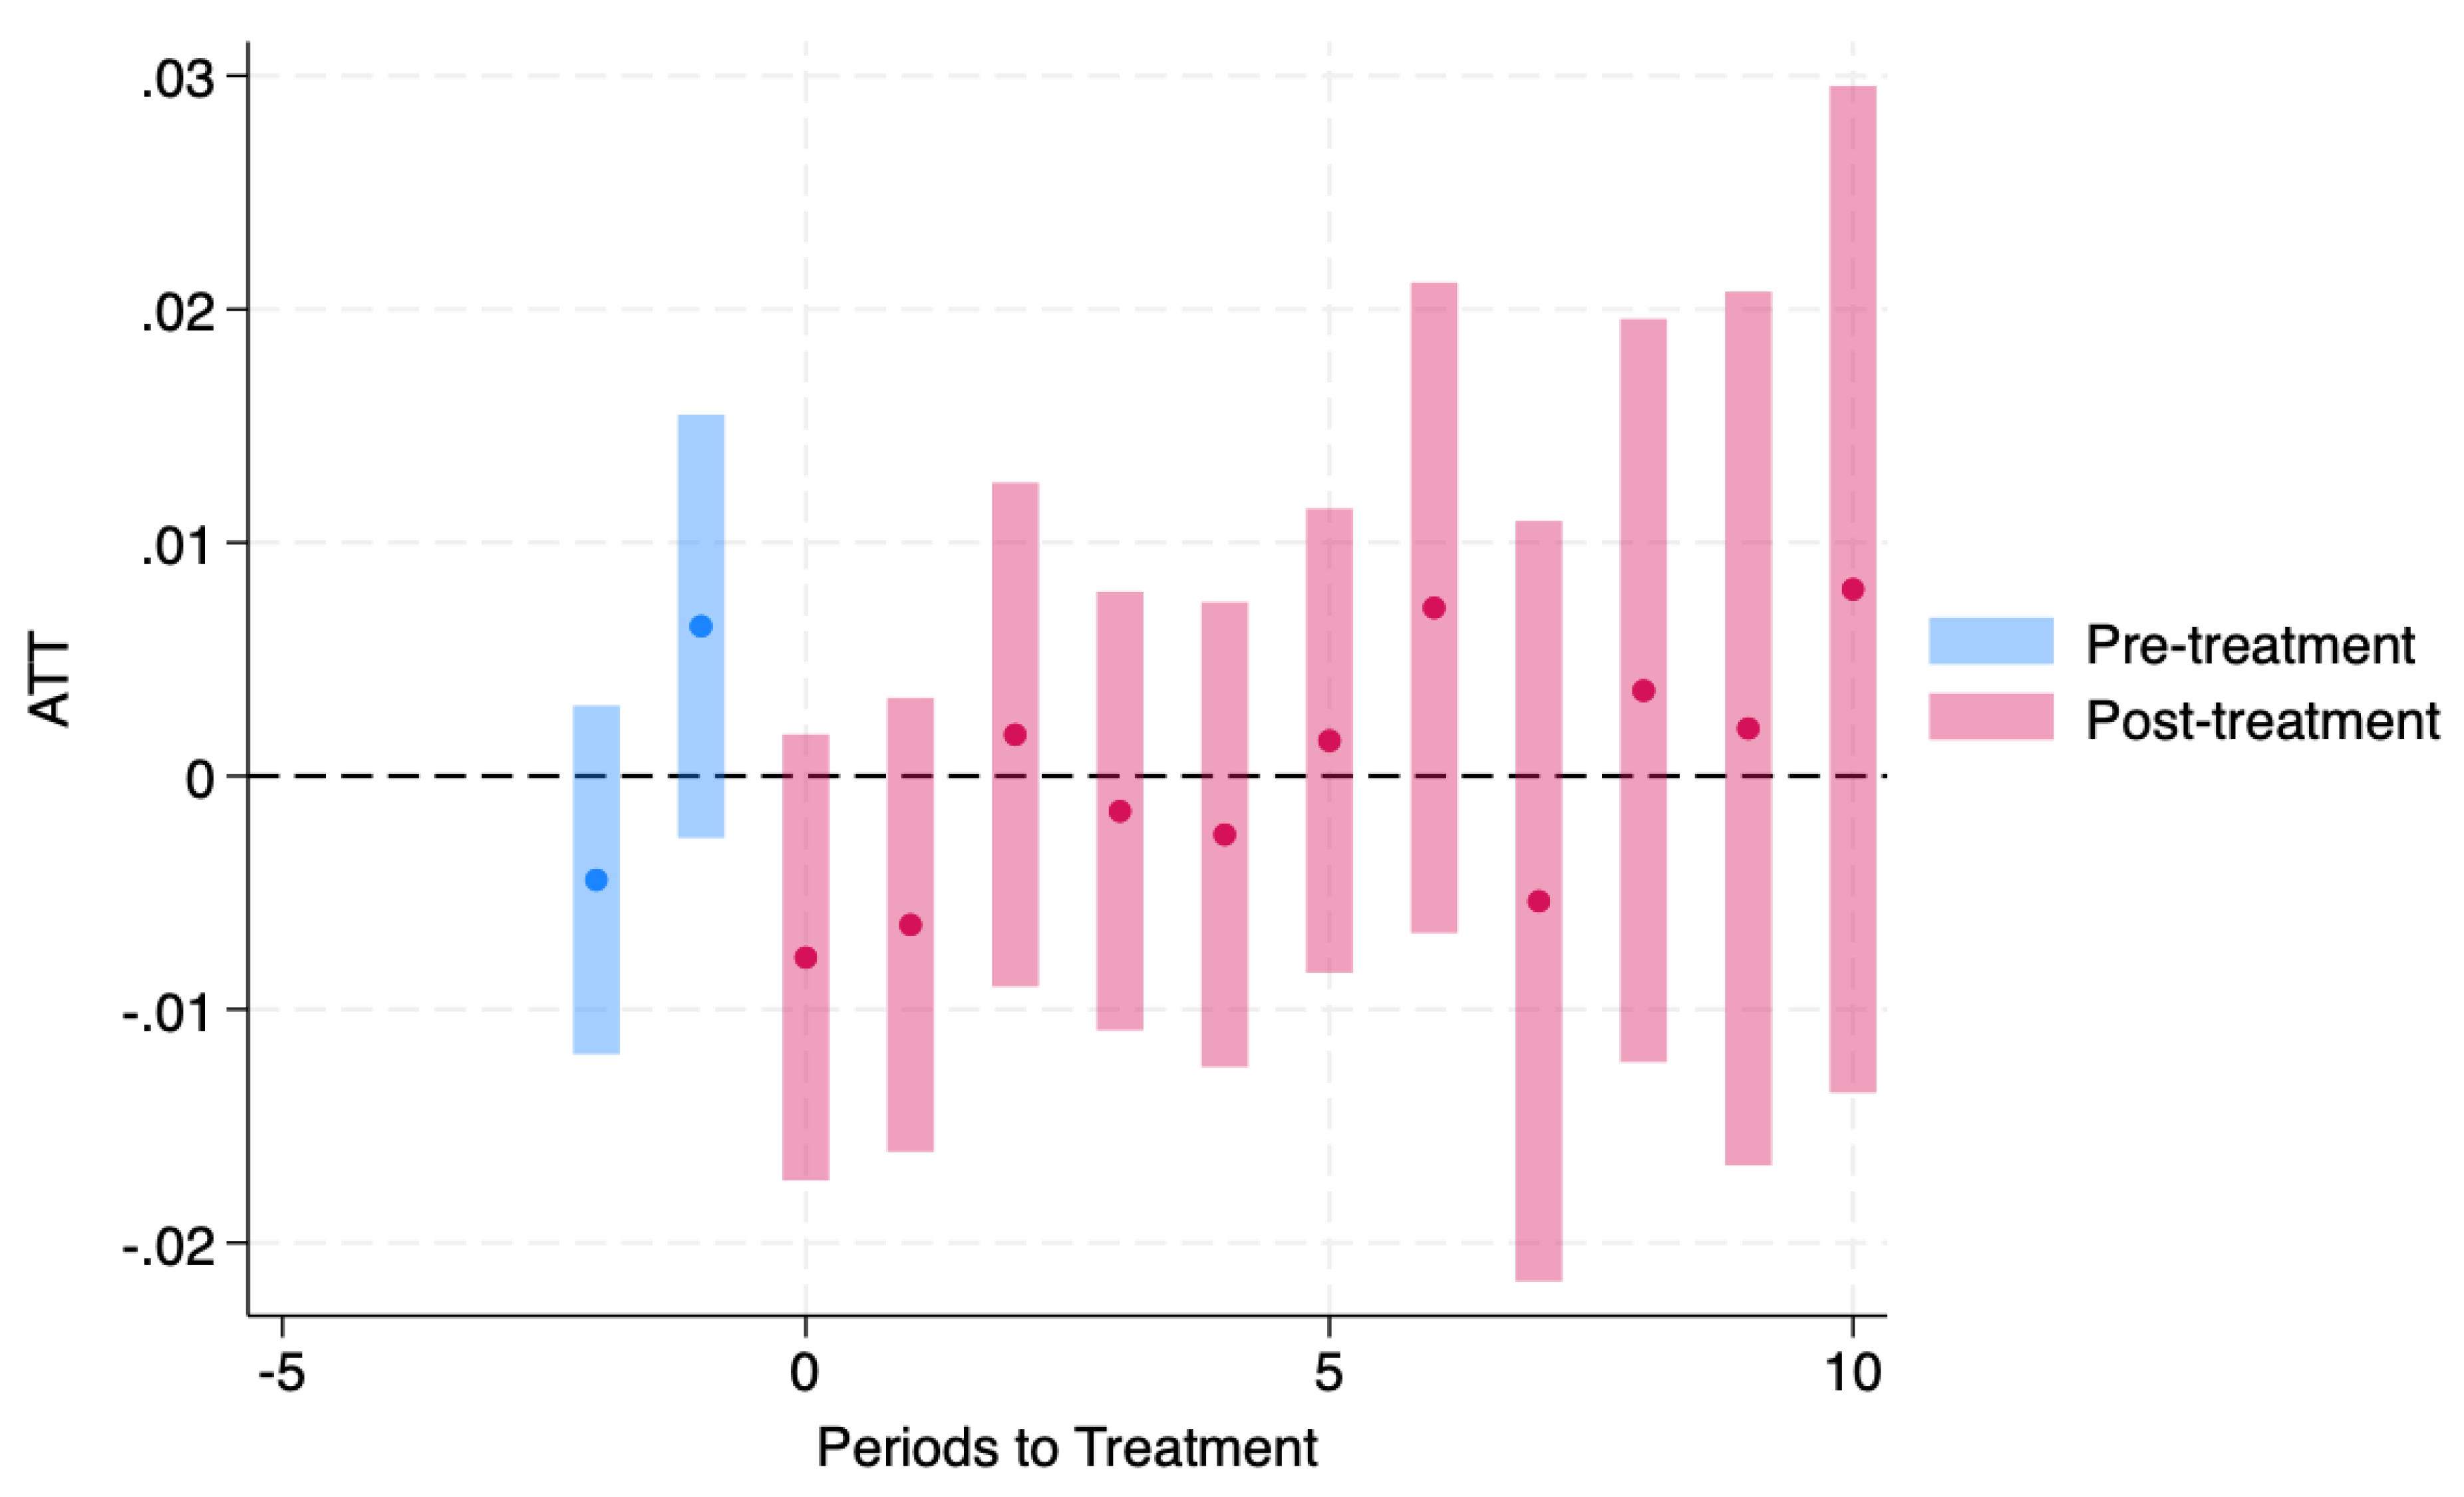
Table 1.
Overall ATT of Medicaid expansion on frequent mental distress (FMD), by panel (Outcome is a state-year prevalence; effects are in percentage-point units.).
Table 1.
Overall ATT of Medicaid expansion on frequent mental distress (FMD), by panel (Outcome is a state-year prevalence; effects are in percentage-point units.).
| Panel | State-Years (N) | ATT | SE | 95% CI | P Value |
|---|---|---|---|---|---|
| Low-income | 353 | -0.0125 | 0.0202 | -0.0521 to 0.0271 | 0.537 |
| High-income | 656 | 0.0006 | 0.0035 | -0.0062 to 0.0074 | 0.857 |
| Pooled (18–64) | 709 | 0.0020 | 0.0046 | -0.0071 to 0.0110 | 0.668 |
Table 2.
Compact event-study estimates (selected event times), by analytic panel. (Outcome is state-year FMD prevalence; effects are in percentage-point units. Tm# = years before expansion; Tp# = years after expansion; Tp0 = expansion year.).
Table 2.
Compact event-study estimates (selected event times), by analytic panel. (Outcome is state-year FMD prevalence; effects are in percentage-point units. Tm# = years before expansion; Tp# = years after expansion; Tp0 = expansion year.).
| Event Time | Low-Income | High-Income | Pooled (18–64) |
|---|---|---|---|
| Pre_avg | -0.0018 (0.0087) | 0.0006 (0.0009) | 0.0007 (0.0010) |
| Post_avg | -0.0058 (0.0187) | 0.0012 (0.0033) | 0.0017 (0.0042) |
| Tm2 | -0.0379** (0.0151) | -0.0029 (0.0031) | -0.0029 (0.0028) |
| Tm1 | 0.0217 (0.0234) | 0.0053* (0.0026) | 0.0052 (0.0033) |
| Tp0 | -0.0271 (0.0266) | -0.0036 (0.0034) | -0.0046 (0.0035) |
| Tp1 | -0.0206 (0.0210) | -0.0021 (0.0044) | -0.0019 (0.0037) |
| Tp2 | -0.0161 (0.0224) | 0.0026 (0.0037) | 0.0029 (0.0040) |
| Tp4 | 0.0271 (0.0277) | 0.0011 (0.0036) | 0.0014 (0.0046) |
| Tp6 | 0.0452 (0.0285) | 0.0055 (0.0061) | 0.0083 (0.0068) |
| Tp7 | -0.0962* (0.0472) | -0.0054 (0.0065) | -0.0021 (0.0076) |
| Tp8 | 0.0349 (0.0256) | 0.0094 (0.0109) | 0.0057 (0.0080) |
Notes: Standard errors in parentheses (clustered at the state level). *P<0.05; **P<0.01.
Disclaimer/Publisher’s Note: The statements, opinions and data contained in all publications are solely those of the individual author(s) and contributor(s) and not of MDPI and/or the editor(s). MDPI and/or the editor(s) disclaim responsibility for any injury to people or property resulting from any ideas, methods, instructions or products referred to in the content. |
© 2025 by the authors. Licensee MDPI, Basel, Switzerland. This article is an open access article distributed under the terms and conditions of the Creative Commons Attribution (CC BY) license.
Copyright: This open access article is published under a Creative Commons CC BY 4.0 license, which permit the free download, distribution, and reuse, provided that the author and preprint are cited in any reuse.


