Submitted:
21 December 2025
Posted:
22 December 2025
You are already at the latest version
Abstract
This study introduces a hybrid optimization method to enhance the melting characteristics and weld bead morphology of flux-cored wire hardfacing with exothermic addition into the core filler. The Taguchi Design of Experiments (L9 orthogonal array) was used to analyze the effects of key conditions on multiple melting characteristics. The hybrid Taguchi-GRA-PCA effectively identified the best parameter combination, resulting in a significant improvement in overall melting performance. The impact of welding modes on weld bead parameters and melting characteristics was examined. It was determined that the optimal amount of the exothermic addition CuOAl introduced into the flux-cored wire filler should be at a medium level (EA = 28 wt.%). Results showed that wire feed speed WFS and EA had the greatest effect on MOR and DR, while EA and CTWD mainly influenced SF and De. It has been determined that the content of the exothermic additive has a significant impact on the melting process of filler materials, affecting the melting characteristics and weld bead morphology. It has been found that the melting characteristics of deposition rate and spattering factor can be used to optimize welding modes and characterize most output parameters of the welding/surfacing process.
Keywords:
hardfacing
; flux-cored wire
; exothermic addition
; melting
; deposition rate
; spattering
; weld bead
; Taguchi method
; factorial design
; PCA
; GRA
1. Introduction
Welding remains one of the most crucial and widely applied manufacturing technologies across a broad spectrum of industries – including construction [1,2,3], automotive manufacturing [4,5,6], mechanical engineering [7,8,9,10], railway transport [11,12,13,14], agriculture [15,16] and many others. The quality of welding in these industries, along with other factors, plays an important safety role [17,18,19,20]. The capability of welding to join complex structures, rebuild worn components, and fabricate high-performance assemblies ensures its central role in modern industrial operations [21,22,23,24,25].
Among the wide array of welding consumables and process variations, flux-cored wires stand out as one of the most significant and promising choices, due to their superior process efficiency, adaptability to diverse welding conditions, and enhanced control over weld metal chemistry and deposition conditions [26,27,28].
1.1. Literature Review: Use of Exothermic Additives in Flux-Cored Wires
In recent years, the performance demands placed on welded joints and deposited layers have increased substantially, driven by requirements for higher wear resistance and longer service life [29,30,31,32]. One promising approach to meet these demands has been the incorporation of exothermic additions into the core filler of flux-cored wires [33,34,35,36,37,38]. Exothermic additions are widely used in various welding processes, including tungsten inert gas (TIG) welding, gas tungsten arc welding (GTA) with an activation flux, shielded metal arc welding (SMAW), and submerged arc welding (SAW). By integrating carefully selected exothermic additions, the deposited metal can benefit from secondary heating reactions that contribute additional thermal energy during welding, thereby enhancing melt fluidity, refining microstructure [43,44], and reducing defects [44,45]. The introduction of such exothermic additions exerts a complex and multifaceted influence on the welding and hardfacing process [46]. Specifically, it affects key parameters such as weld bead morphology [34,47,48], arc stability [49], and the overall quality [43,50], homogeneity and mechanical performance of the deposited metal [6]. These effects are mediated through modifications in thermal cycles, droplet transfer behaviour, arc stability, weld bead morphology and subsequent microstructural evolution [34,47,51]. Moreover, the process performance metrics themselves must be addressed: for instance, the DR remains a critical indicator of productivity in welding operations, while deposition efficiency (De) reflects the effective utilization of filler materials [48]. Equally important is the spatter factor (SF), which determines the extent of post-weld cleanup required and thus influences the overall cost-effectiveness and operational efficiency of production [28]. Earlier research has demonstrated that melting characteristics such as deposition rate (DR) and spatter factor (SF) closely mirror the necessary set of other parameters, including weld morphology, arc stability, and bead appearance [44,47,49]. Therefore, these two characteristics can be selected for optimisation and qualitative assessment of the entire process.
Given the interplay of process, materials, thermal and metallurgical factors, a comprehensive understanding of how exothermic filler additions influence not only macro-scale productivity but also micro-scale metallurgical quality is essential. Such understanding enables optimization of welding conditions, filler composition and process control to achieve enhanced outcomes.
1.2. Literature Review of Methods for Optimising Welding Processes with Multiple Output Parameters
Before initiating an experimental study, candidate variables relevant to the investigated topic can be selected based on domain-specific expertise [53]. The orthogonal array (OA) technique allows exploration of the entire process with a substantially reduced number of experimental runs. Orthogonal experimental designs theoretically enable an independent estimation of each factor’s influence on the observed responses [54]. This is due to the fact that the orthogonality of an experimental design determines the correlation structure among the design attributes [55]. In the first stage, the Taguchi method utilizes a special orthogonal array (OA), signal-to-noise (S/N) ratios, and main effects [56]. This method achieves efficiency by testing pairs of factor combinations [57]. Moreover, analysis of variance (ANOVA) is often applied in parallel with the Taguchi method. The ANOVA allows determination of each factor’s contribution to the response, thereby identifying the most significant variables. Insignificant variables can then be excluded, simplifying the experimental plan.
The second stage focuses on developing a prediction model. Such a model provides insights into which variables determine the outcome, their strength of association, and can forecast future results. A simplified yet effective way to construct prediction models involves the use of full factorial designs, which serve as a means to assess the influence of various factors on a response [58]. Factorial designs further allow the examination of the joint effects of process or design parameters on the response variable. Depending on the objective, factorial experiments can be either full or fractional. The Response Surface Methodology (RSM) – based on factorial design – has been widely applied in studies of Flux-Cored Arc Welding (FCAW) processes [59]. It has been reported that the fractional factorial technique is particularly useful for predicting both main and interaction effects among welding conditions [60,61,62].
The third stage concerns optimization. However, the traditional Taguchi method is primarily suited for optimizing a single quality characteristic [63,64,65]. In welding and surfacing operations, multiple and often conflicting quality attributes are typically present. Hence, a multi-objective optimization strategy is essential to achieve balanced system performance. To address this challenge, the PCA technique is introduced as a valuable statistical tool to explore interrelationships within datasets containing multiple correlated quality characteristics (MPC).
In welding and surfacing processes, multiple and often conflicting quality attributes are simultaneously. Therefore, a robust multi-objective optimization methodology is required to achieve a balanced performance of the system. In welding and surfacing processes, multiple and often conflicting quality attributes are simultaneously. Therefore, a robust multi-objective optimization methodology is required to achieve a balanced performance of the system.
To address this challenge, the Principal Component Analysis (PCA) technique was introduced as a valuable statistical tool to explore interrelationships within a dataset comprising multiple correlated quality characteristics (MPC) and to improve overall process performance. By transforming the correlated response variables into a smaller number of uncorrelated principal components, PCA enables dimensionality reduction while retaining the most significant information regarding process variability [13,62,63,64]. These principal components and their associated eigenvalues can then be integrated as a single composite quality index, allowing for the simultaneous optimization of several performance criteria within the Taguchi framework [62,66,67,68,69].
The combination of the Taguchi method and PCA has been widely recognized as a powerful hybrid approach for optimizing complex manufacturing systems. Earlier research demonstrated that the PCA-assisted Taguchi method effectively resolves multi-response optimization problems in diverse engineering applications, ranging from optical system design to advanced manufacturing processes [70,71]. PCA is particularly effective in identifying a small number of latent constructs that explain the main sources of variation in correlated datasets [62,70]. In this study, Through PCA, multiple correlated response variables – such as deposition efficiency, spattering factor, hardness, and surface roughness–were transformed into a set of uncorrelated principal components, which served as the unified quality index for process optimization [62].
The objective of this work is to develop an optimization strategy for hardfacing modes and flux-cored filler compositions that ensures high process efficiency and superior coating properties while minimizing production costs and maintaining a wide range of variable control. The study integrates PCA-based Taguchi design with experimental validation to establish statistically significant correlations between process conditions, exothermic addition content, and quality outcomes in surfacing operations.
1.3. Contribution and Organization
In line with advancing high-precision, data-driven, efficiency-oriented manufacturing technologies, this study introduces a comprehensive, hybrid methodology for optimising the melting behaviour of self-shielded flux-cored arc welding with exothermic additions. The main scientific contributions are as follows:
(1) The multifactorial nature of welding processes is addressed by enhancing an existing hybrid optimisation framework that combines Taguchi orthogonal arrays, full factorial analysis, grey component relational analysis (GRA) and principal component analysis (PCA). To obtain mathematical models of the desired parameters, ANOVA regression analysis and factorial analysis are added to the methodology. This enables the development of mathematical models to predict values within the studied ranges and optimise the process.
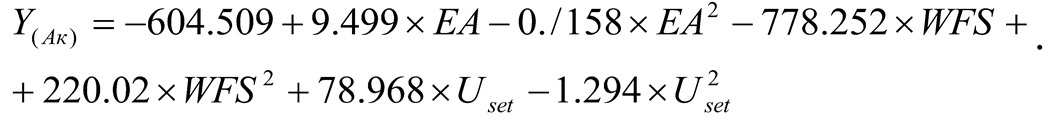
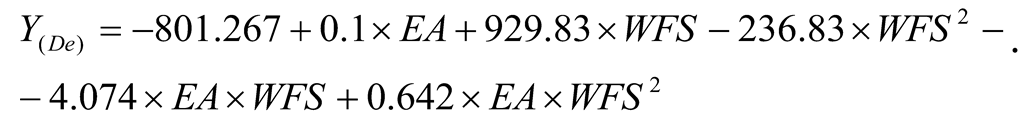
(2) High-resolution predictive models have been established for four key melting characteristics: melt-off rate (MOR), deposition rate (DR), spattering factor (SF) and deposition efficiency (De). Using factorial regression and ANOVA, the study identifies the primary and interaction effects of the process variables (EA, WFS, CTWD, Uset), enabling the precise quantitative prediction of melting characteristics across diverse hardfacing modes.
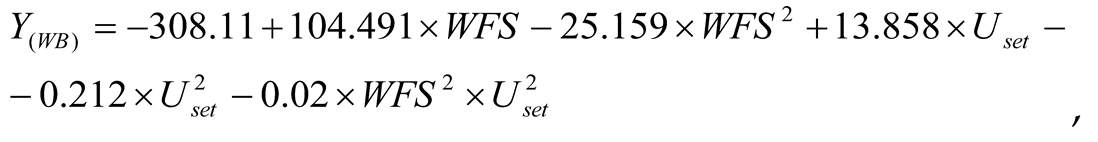
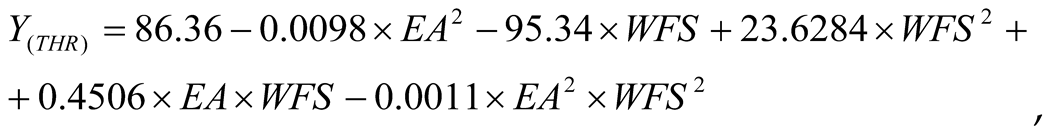
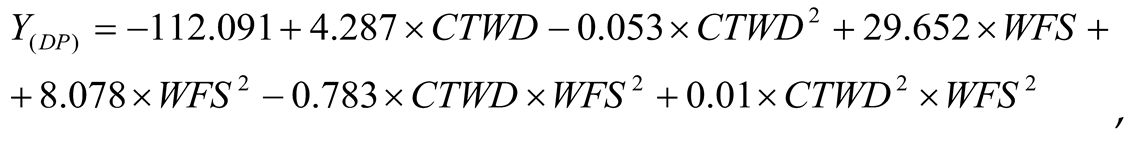
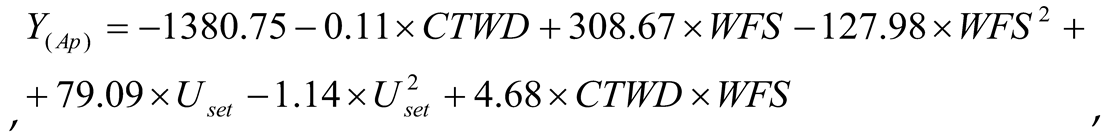
(3) The influence of the content of the exothermic additive and hardfacing modes on weld bead parameters. High-resolution predictive models have been established for four key weld bead parameters: width bead (WB), top high of reinforcement (THR), bottom depth of penetration (DP), cross-sectional area of reinforcement (Ar), ross-sectional area of penetration (Ap) and dilution variation (Dv).
(4) Experimental investigation of the influence mechanisms of exothermic additions within flux-cored wires reveals that EA and WFS predominantly control MOR and DR, while EA and CTWD govern SF and De.
(5) The optimal process parameters for maximising multi-response melting characteristics were determined to be EA = 38 wt.%, CTWD = 35 mm, WFS = 2.07 m/min and Uset = 31 V, significantly enhancing deposition efficiency, reducing spattering and ensuring high melt-off and deposition rates. These results demonstrate the practical value of the proposed methodology for designing efficient, cost-effective, and industrially scalable surfacing processes.
The remainder of this article is structured as follows: Section 2 presents the materials, experimental setup, and the hybrid optimization methodology, including Taguchi design, GRA, PCA, and factorial modeling. Section 3 presents the experimental results, Taguchi analysis, regression modeling, and optimization outcomes derived from the Taguchi–GRA–PCA framework. Section 4 discusses the thermochemical mechanisms governing melting behavior, interprets parameter interactions, and evaluates the industrial implications of the findings. Finally, Section 5 summarizes the main conclusions and proposes directions for further research on advanced modeling and optimization of flux-cored arc welding processes.
2. Materials and Methods
2.1. Statistical Evaluation
2.1.1. Taguchi’s Design of Experiment
As the main experimental design, an orthogonal array based on the Taguchi method was employed. Four factors were investigated: the percentage of the exothermic additive in the cored wire filler (EA), the contact tip-to-work distance (CTWD), the wire feed speed (WFS), and the preset arc voltage at the power source (Uset). Based on the selected variables and their levels, a Taguchi L9 orthogonal array was developed for the experimental study. The control factors and their three levels are presented in Table 1.
The 9 experiments were conducted according to Table 2, and each experiment was repeated three times.
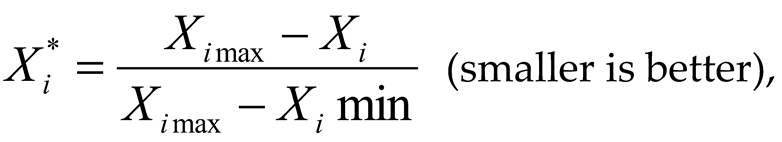
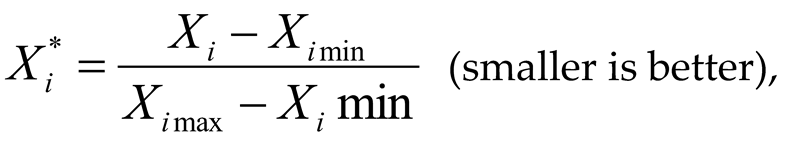
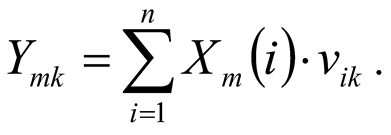
These dependencies are divided into two types: “smaller is better” and “larger is better”. Which were calculated using the following equations, respectively [72,73]:
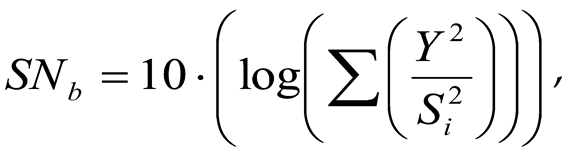
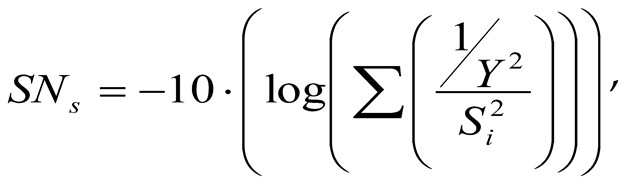
where - dispersion:
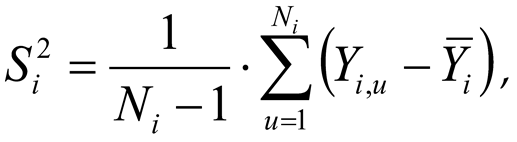
where – average value:
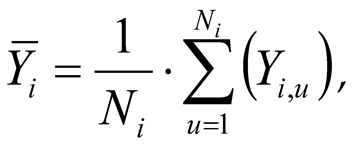 where i – is the number of experiments; u – is the number of the experiment; Ni – is the number of tests for experiment i.
ANOVA was done afterward at 95% confidence level to determine the degree of influence of the variables on the output by calculating the percentage contribution using Eq. 5 below [43]:
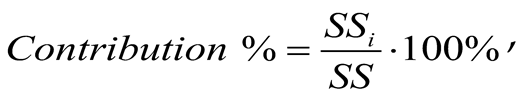
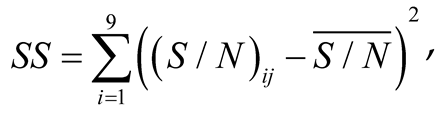
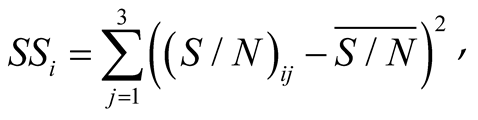
where SSq – sum of squares, SS- total sum of squares.
2.1.2. Grey Relational Analysis
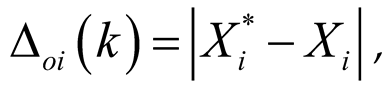
RA works like a discovery idea where known and obscure components are assembled to get the optimum level of responses. GRA utilizes normalization of values to compute the grey relational coefficient (GRC) and the grey relational grade (GRG). The initial step is to create a grey relational matrix with values in the vicinity of 0 and 1. This creation is accomplished for all three quality attributes. The procedure was executed for every performance characteristic detailed in Table 3, utilizing the following equations [74,75]:
The GRC after data processing were calculated with the particular deviation calculations as given in Equations (10) and (11) [74,75]:
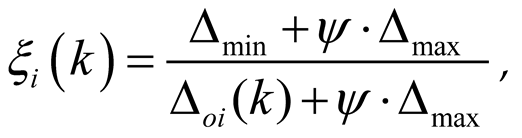 and compatibility sequence ; Ψ is distinguishing coefficient and is usually taken 0.5 when equal weightage is given to the process parameters.
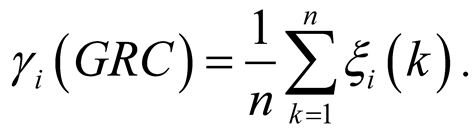
The value of GRG lies between 0 and 1. The larger value of GRG displays better relation among process factors combination at that level and it is assessed as an optimum level [74,75]:
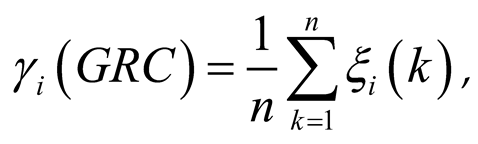 where γi(GRG) of i-th experiment and n represents the number of performance characteristics.
The higher value of grey relational grade shows that the corresponding experimental results are closer to the optimum value or normalized value.
2.1.3. Principal Component Analysis
The PCA has been invented by Pearson and Hotelling [76], which explains the construction of variance and covariance of all performance characteristics by linearly integrating them. The steps involved in PCA are detailed as follows [74,77,78]:
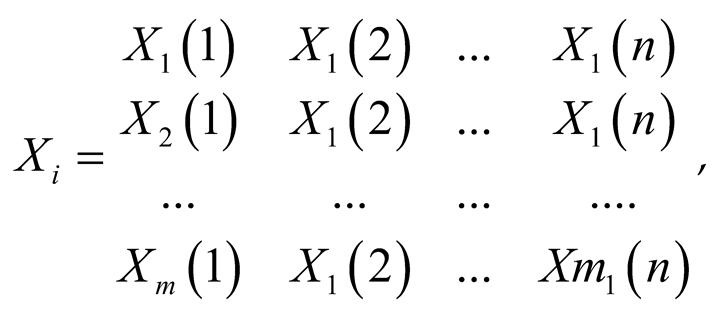 where Xi(j), i=1 to m, j=1 to n. Here in this study, X represents the GRC of each performance characteristic.
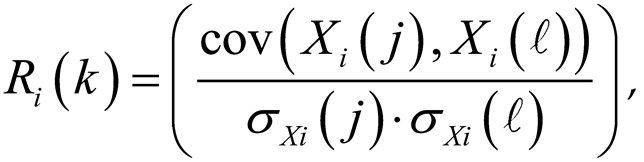
where cov(Xi(j), Xi(ℓ)) is the covariance sequence of Xi(j) and Xi(ℓ), and σXi (j), σXi (ℓ) are the standard deviations of the sequence Xi(j) and Xi(ℓ) respectively.
Then, the eigenvectors and eigenvalues are determined by using a coefficient correlation array with the help of the equation shown below [77,78]:
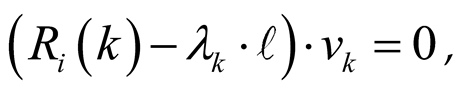
where Ri(k) is the correlation coefficient matrix form Ri(k), λk is the k-th eigenvalue, λk = n, k=1,2...,n and Vi,k=[ak1, ak2, …, akn] is the eigenvector corresponding to the eigenvalue λk.
Principal components
2.2. Materials
For the hardfacing process, flux-cored wires with filler compositions as shown in Table 4 were used. A metal strip made of St 24 DIN 1614.1 steel (20 mm in width and 0.5 mm in thickness) was used, which was formed into a metal wire sheath about the core filler. The self-shielded flux-cored wire was made according to the procedure described in [43].
2.3. Hardfacing Procedure
The hardfacing was applied to the steel plates using the single-pass roller method. These plates were made of low-carbon steel (S 235J2G2EN 10025-2, or St3ps) measuring 10×100×200 mm. The process was carried out on an A-874 automatic machine, which was equipped with a power source featuring a rigid volt-ampere characteristic under reverse polarity. The cladding speed was set to TS = 18 m/h and kept constant throughout.
2.4. Calculation Method for Melting Characteristics
The research methodology for determining melting characteristics is outlined in [72,79] and the following equations were used to calculate them:
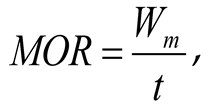
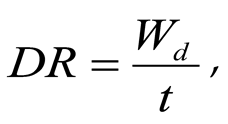
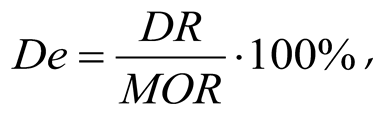
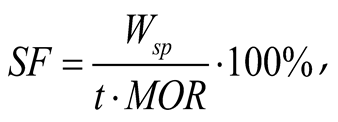
where Wm – weight of electrode consumed [kg], t – time of hardfacing [hr], Wd – weight of metal deposited [kg], Wsp – is the weight of weld spatter [kg].
3. Results
3.1. Melting Characteristics
3.1.1. Experiment Results for Weld Bead Morphology
In FCAW, the filler wire melts and moves to the workpiece as droplets. Depending on welding conditions, the process can produce coarse or fine droplets, continuous jet transfer, or even vapor-phase transfer [80,81]. FCAW typically uses low welding currents to limit dilution of the deposited metal [43]. However, low current often causes large droplets and frequent short-circuiting, which increases spatter due to longer short-circuit durations and higher localized energy release [43,82,83]. As a result, deposition efficiency (De) and deposition rate (DR) decrease [78,84,85]. The results obtained for each experiment are shown in Table 5.
3.1.2. Taguchi Method and Analysis of Variance (ANOVA) for Melting Characteristics
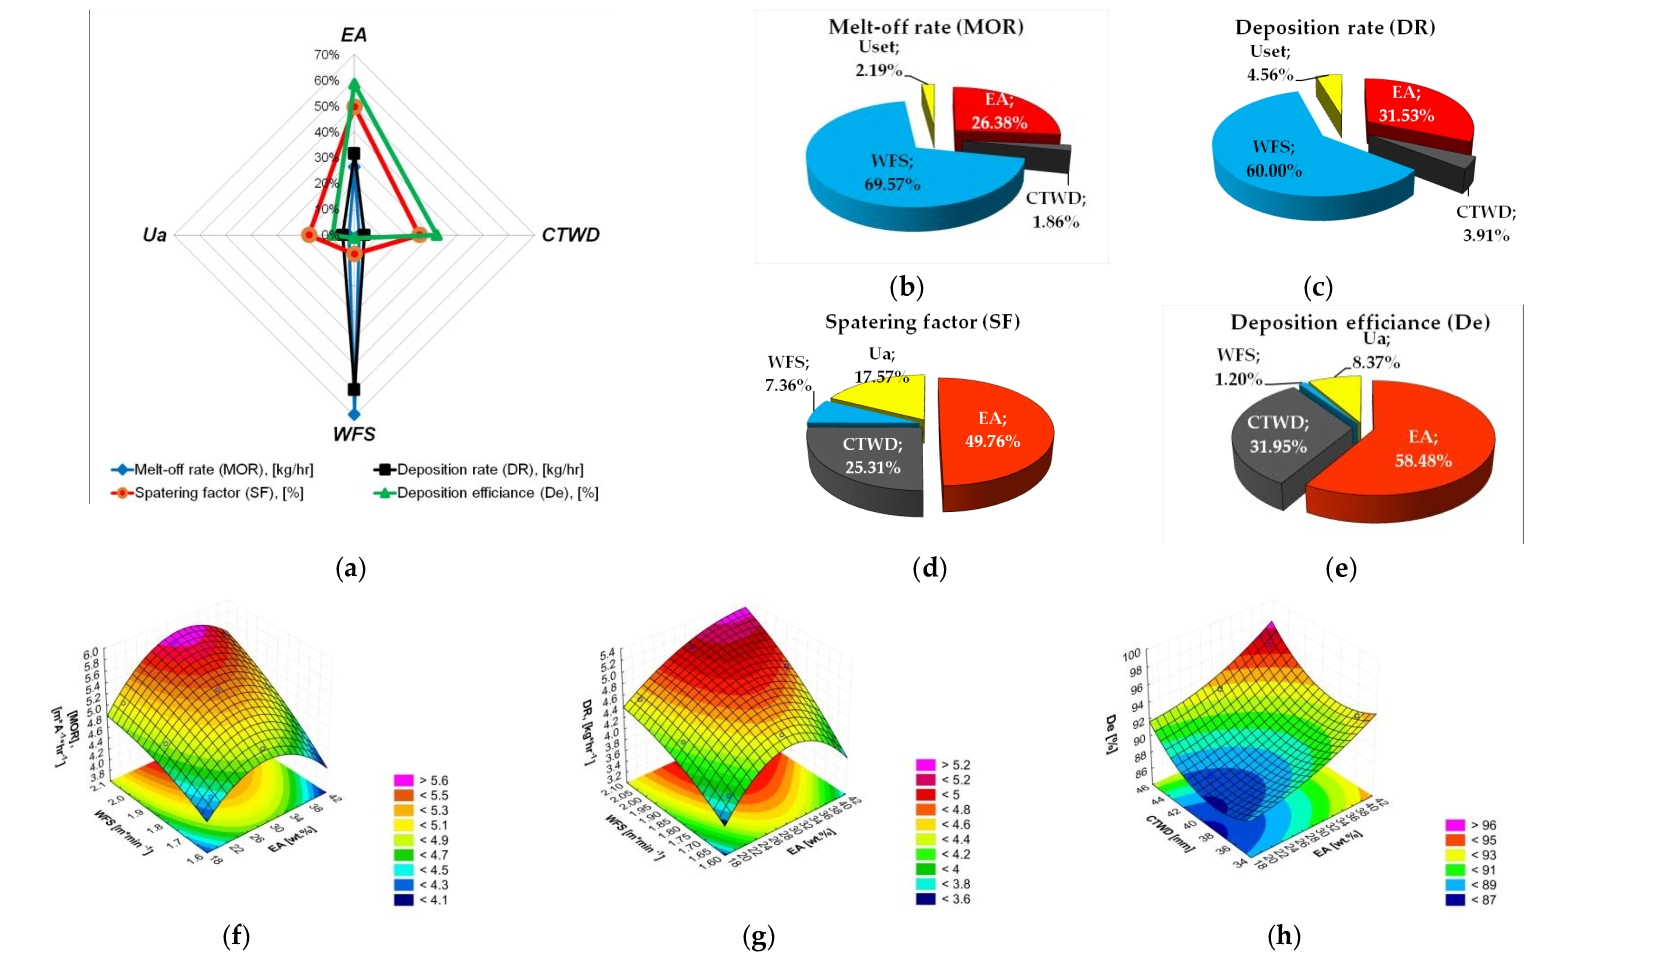
Figure 1 showed experimental results for indicators of melting, which were based on the Taguchi method.
As shown in Figure 2a and Figure 2b, the highest melt-off rate (MOR) and deposition rate (DR) values are observed at high wire feed speeds (WFS = 2.067 m·min⁻¹, Level 3) and a medium exothermic addition content (EA = 30 wt.%, Level 2), while the lowest values occur at minimum levels. A low spattering factor (SF) and a high deposition efficiency (De) are achieved at a high content of the exothermic addition (EA = 39 wt.%, Level 3) and at a high contact tip-to-work distance (CTWD = 45 mm, Level 3).
ANOVA was applied to determine the percentage contribution of the welding parameters to the melting characteristics. Using this tool provided insight into reducing variability by eliminating non-significant factors, thus maximizing performance and supporting the development of mathematical models [86]. The results are presented in Figure 2.
Analysis of the radar chart (Figure 2a) shows that the wire feed speed is the parameter exerting the greatest influence on MOR and DR. This amounts to РWFS(MOR) = 69.57% and РWFS(DR) = 60.00%, respectively (see Figure 2b and Figure 2c). The exothermic addition to the core filler also had a significant effect, contributing: РEA(MOR) = 26.38% and РEA(DR) = 31.53% (Figure 2b and Figure 2c). In contrast, the hardfacing conditions CTWD and Uset have demonstrated only a very minor influence.
As illustrated by the pie charts (Figure 2d and Figure 2e), the influence of the melting characteristics, such as the spattering factor and deposition efficiency, is mainly affected by the exothermic addition content in the core filler (EA). The respective contributions are РEA(SF) = 49.76% and РEA(De) = 58.48%. A notable effect is also seen for the wire feed rate, with contributions measured as follows: РCTWD(SF) = 25.31% and РCTWD(De) = 31.95%. It is important to note that the spattering factor is significantly affected by three parameters: EA, CTWD, and Uset.
3.1.3. Factorial Design Analysis of Melting Characteristics
Predictive models serve as essential tools for identifying the relationships between variables within a system and the resulting responses, as well as for forecasting future outcomes. These models enable the determination of the variables that significantly influence the response, quantify the strength of their effects, and predict the behaviour of the system based on specific input values [87,88]. In industrial applications, Response Surface Methodology (RSM) is widely used for constructing response surfaces. One of the primary advantages of RSM is its ability to reveal the contribution of individual factors through the coefficients of the regression model [89]. Simplified models can be efficiently obtained using full factorial designs, which provide a systematic approach to evaluating the influence of each factor on the response [90]. Due to the presence of four variables in the primary orthogonal L9 design, applying the factorial design requires excluding non-significant variables, as determined by the results of the ANOVA analysis. In practice, it is customary to cut off factors with an influence of less than 5%, while factors with an influence of 5-10% can also be excluded. Our experience has shown that a limit of 15% of the contribution to the search parameters can be used with sufficient practicality when deciding on the rejection of variables when building mathematical models using a factorial design. However, in the case of a predominant influence of one of the variables (more than 80%), this limit was reduced to 10%. This approach to excluding variables made it possible to develop mathematical models with sufficient reliability [44,62]. These designs allow researchers to examine both the individual and combined effects of process or design parameters on the target response [60,91], including their interactions. At the stepwise regression stage, a more lenient significance threshold of p < 0.20 was adopted for variable inclusion [92]. This prevented the exclusion of potentially important predictors at the early stages of model construction. This is important in conditions of limited experimental data, especially for data analyzed using Taguchi orthogonal arrays. This approach increases the reliability of the model [93]. Regression models of melting characteristics are represented by equations (22-25):
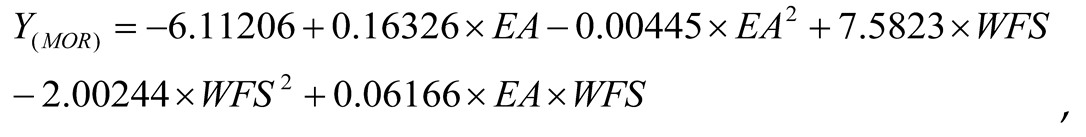

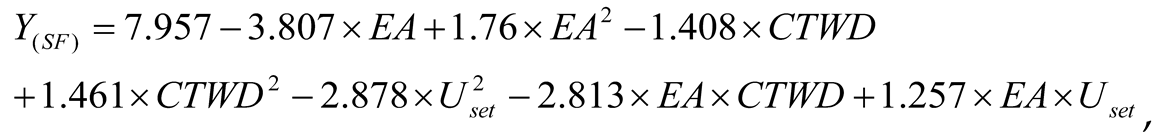
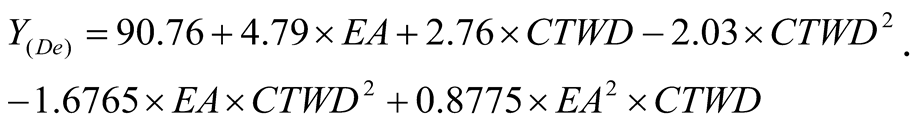
Table 6 displays the coefficients of determination (R²) and the adjusted sums of squares (R Adj) for each developed mathematical model. The quality of these models is rated as ‘very good,’ supported by the high values of the coefficients of determination and adjusted sums of squares.
As shown in Figure 3, the plots of observed and predicted values for the developed mathematical models are presented.
Analysis of the constructed plots showed strong agreement between the predicted points and observed values for the developed MOR and DR mathematical models (see Figure 3a and Figure 3b). The closer the predicted points are to the inclined line, the better the model’s performance. In contrast, minor deviations of the predicted values from the inclined line were observed for the SF and De models (Figure 3c, d). However, the quality of these models is sufficient.
Figure 4 presents the Pareto chart along with the plots of predicted versus observed values. These are for the constructed model.
Analysing the Pareto chart (Figure 4a) shows that the linear effect of wire feed speed (WFS(L)) has the greatest impact on melt-off rate (MOR). The quadratic effect of ЕА(Q) also contributes, though to a lesser degree.
Figure 4b shows that the linear effect of wire feed speed WFS(L) has had the greatest impact on deposition rate. The linear effect of exothermic addition EA(L) and the quadratic effect of EA (EA(Q)) contributed almost half as much. These effects are significant as their values exceed the upper critical limit (p = 0.05).
The most influential factors for the spattering factor (SF) are the linear term of the exothermic addition content in the filler and the quadratic term of Uset(Q) (see Figure 4c). The EA coefficient has exhibited a negative effect, indicating that increasing the exothermic addition content reduces spattering. Conversely, an increase in arc voltage has been found to lead to an increase in the SF.
Figure 4d shows that the effect of the addition term, EA(L), had the biggest effect. Its positive sign indicates that an increase in its value will lead to an increase in deposition efficiency.
3.2. Weld Bead Morphology
3.2.1. Experiment Results for Weld Bead Morphology
Cross-sections of welded joints at different hardfacing conditions were illustrated in Figure 7. The dilution of variation (Dv) calculation was done by the relationship between the area of reinforcement (Ar) and the total area of the weld bead [94].
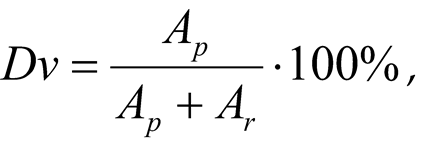 where Dv – dilution variation [%]; Ar – area of reinforcement (deposited metal) [mm2]; Ap – area of penetration (molten area) [mm2].
Table 7 presents the experimental and calculated values of the geometric parameters of deposition: width of bead (WB), top point of reinforcement (THR), bottom depth of penetration (DP), cross-sectional area of reinforcement (Ar), cross-sectional area of penetration (Ap) and dilution variation (Dv) obtained during deposition using the developed FCAW-S with an exothermic CuO-Al addition in the filler.
3.2.2. Taguchi Method and Analysis of Variance (ANOVA) for Weld Bead Morphology
For the preliminary optimisation of the deposition parameters, Figure 8 shows the results of the experiment with the calculated S/N ratios for the geometric parameters of the bead using the Taguchi method.
The influence of each deposition parameter on the weld bead morphology was shown in Figure 9.
The content of the exothermic additive to the core filler, according to the results of analysis of variance (ANOVA) (Figure 9), has a significant impact on such geometric parameters as top height of weld reinforcement (TWR), cross-sectional area of reinforcement (Ar) and dilution of variation (Dv). The contribution of the exothermic addition is РЕА(THR) = 43.62%, РЕА(Ar) = 32.01% and РЕА(Dv) = 32.14%, respectively. The influence on the specified indicators of the shape of the welded bead of the content of the exothermic additive can be explained primarily by the increase in the molten filler materials due to chemical heat. The optimal values of the content of the exothermic addition, according to the results of the analysis by the method of Taguchi (Figure 8), at which the highest values of the above-mentioned variable parameters that were studied are observed, were observed at the average level (EA = 30%).
From Figure 9, it can be seen that the wire feed speed (WFS) mainly affects such geometric parameters as bottom depth of penetration (DP) and cross-sectional area of penetration (Ap). Their contribution will be РWFS(DP) = 61,23%, and РWFS(Ap) = 81,97% respectively. Known contributions also include such parameters as roller width (WB), cross-sectional area of reinforcement (Ar) and dilution of variation (Dv). Their contribution will be РWFS(WB) = 36,71%, РWFS(Ar) = 39,16%, and РWFS(Dv) = 38,21%respectively. The optimal values of wire feed speed (WFS), according to the results of the analysis by the Taguchi method (Figure 8), at which the lowest values of the indicated indicators will be observed, were observed at a wire feed speed at a low level (WFS = 98 m/h, Level 1).
According to the obtained results of analysis of variance (ANOVA) shown in Figure 9, the set voltage on the power source mainly affects such a geometric parameter of the welded bead as the width bead, with a contribution of РU(WB) = 52.01%. At the same time, the set voltage on the power source will have a smaller impact on such parameters as cross-sectional area of reinforcement (Ar) and cross-sectional area of penetration (Ap). Their influence is, РU(Ar) = 25.98% and РU(Ap) = 16.16%, respectively. According to the results of the analysis by the method of Taguchi, Figure 8, the optimal values of the width bead and cross-sectional area of penetration will be observed at a low level, i.e., Uset=28 V (Level 1). While for the cross-sectional area of reinforcement at an average level, Uset=31V (Level 2).
Figure 9 shows that the contact tip to work distance (CTWD) has a significant contribution to the weld bead parameters that characterize the penetration depth, as the bottom depth of penetration (DP), cross-sectional area of penetration (Ap), and the weld bead shape, as the degree of mixing dilution of variation (Dv). The share of their influence is РCTWD(DP) = 25,39%,РCTWD(Ap) = 16,01% and РCTWD(Dv) = 15,49%, respectively. Figure 8 showed that the minimum value of these parameters is achieved at a high value of the contact tip to work distance, which corresponds to the value of CTWD = 45 mm.
3.2.3. Factorial Design Analysis of Weld Bead Morphology
According to the results of ANOVA, by eliminating insignificant variables (whose contribution was less than 15%), mathematical models were developed. Regression models of melting characteristics are represented by equations (27-32):
The developed mathematical models are of good quality, the statistical characteristics of which are shown in Table 8.
In Figure 10, the plots of observed and predicted values for the developed mathematical models for the parameters of the weld bead are presented.
Figure 10d and Figure e show that the data points are very tightly clustered around the red line, which is the ideal prediction line. This close alignment indicates that the model explains the variability of the dependent variable well and has high predictive power. Figure 10a and b show that these models lack obvious outliers. The dispersion of the residuals is uniform. The models can predict WB, DP, and THR, but with significant random errors. The mathematical model for the Dv parameter demonstrated the greatest dispersion of the residuals, and therefore the lowest predictive power. However, these models exhibit good adequacy.
Figure 11 shows the Pareto chart for the parameters of the welded rollers.
Pareto analysis of standardized effects confirmed the distribution of influence obtained from the ANOVA results. Analysis of the graphs showed that the quadratic term of the percentage of the exothermic additions in the core filler had the greatest influence on such parameters as height of reinforcement (Figure 11b) and cross-sectional area of reinforcement (Figure 11d). At the same time, EA(Q) had a high influence on such parameters as dilution of variation (Figure 11f) and cross-sectional area of r penetration (Figure 11e).
Parameters such as depth of penetration (Figure 11c) and cross-sectional area of penetration (Figure 11e) were most sensitive to the linear effect of wire feed speed WFS(L). Parameter Dv (Figure 11f) was most sensitive to the quadratic effect of WFS(Q).
The quadratic term of the voltage at the power source U(Q) had the largest effect on the width bead (Figure 11a). The linear effects of the wire feed speed WFS(L) and the preset arc voltage at the power source U(L) have a slightly smaller effect.
3.3. Taguchi-Grey Relational Analysis Coupled with Principal Component Analysis
This study presents a robust methodology that merges the efficiency of the Taguchi design of experiments with the objectivity of Principal Component Analysis (PCA) and the multi-response transformation capability of Grey Relational Analysis (GRA). This powerful Taguchi-GRA-PCA coupling is specifically formulated to overcome the inherent limitations of single-objective optimization by converting complex, conflicting quality characteristics into a singular, high-fidelity Grey Relational Grade (GRG) [95,96]. GRA ensures that the optimization results accurately reflect the relative importance and contribution of each quality characteristic based on the structure of the experimental data [97,98,99]. For optimization, the following melting characteristics were selected: deposition rate and spattering factor. While the parameters characterizing weld bed morphology were selected: cross-sectional area of reinforcement (Ar) and Dilution variation (Dv).
The normalized values and deviation sequence are shown in Table 9.
The values of the principal-component loadings for each response have been presented in Table 10.
The computation of grey relation grades (GRGs) after introducing PCA and the weighted value of each performance characteristic has been obtained by using equation Eq. 17. The GRGs and its rank are mentioned in Table 11.
From these graphs, it has been observed that Experiment 5 demonstrates the best performance in terms of the two main components (GRA = 0.778055). Therefore, the overall optimal hardfacing conditions for self-shielded flux-cored wires are determined as follows: EA = 28 wt.% for the exothermic mixture in the core filler, CTWD = 40 mm for the contact tip-to-work distance, WFS = 2.07 m·min-1 for the wire feed speed, and Uset=28V for the set voltage on the power source.
3.4. Principal Component Analysis (PCA)
The optimal number of principal components was determined using both the Kaiser-Guttman criterion and the visual inspection of the scree plot. The resulting eigenvalues for each component are presented in Figure 1.
Figure 12.
Screen plot.
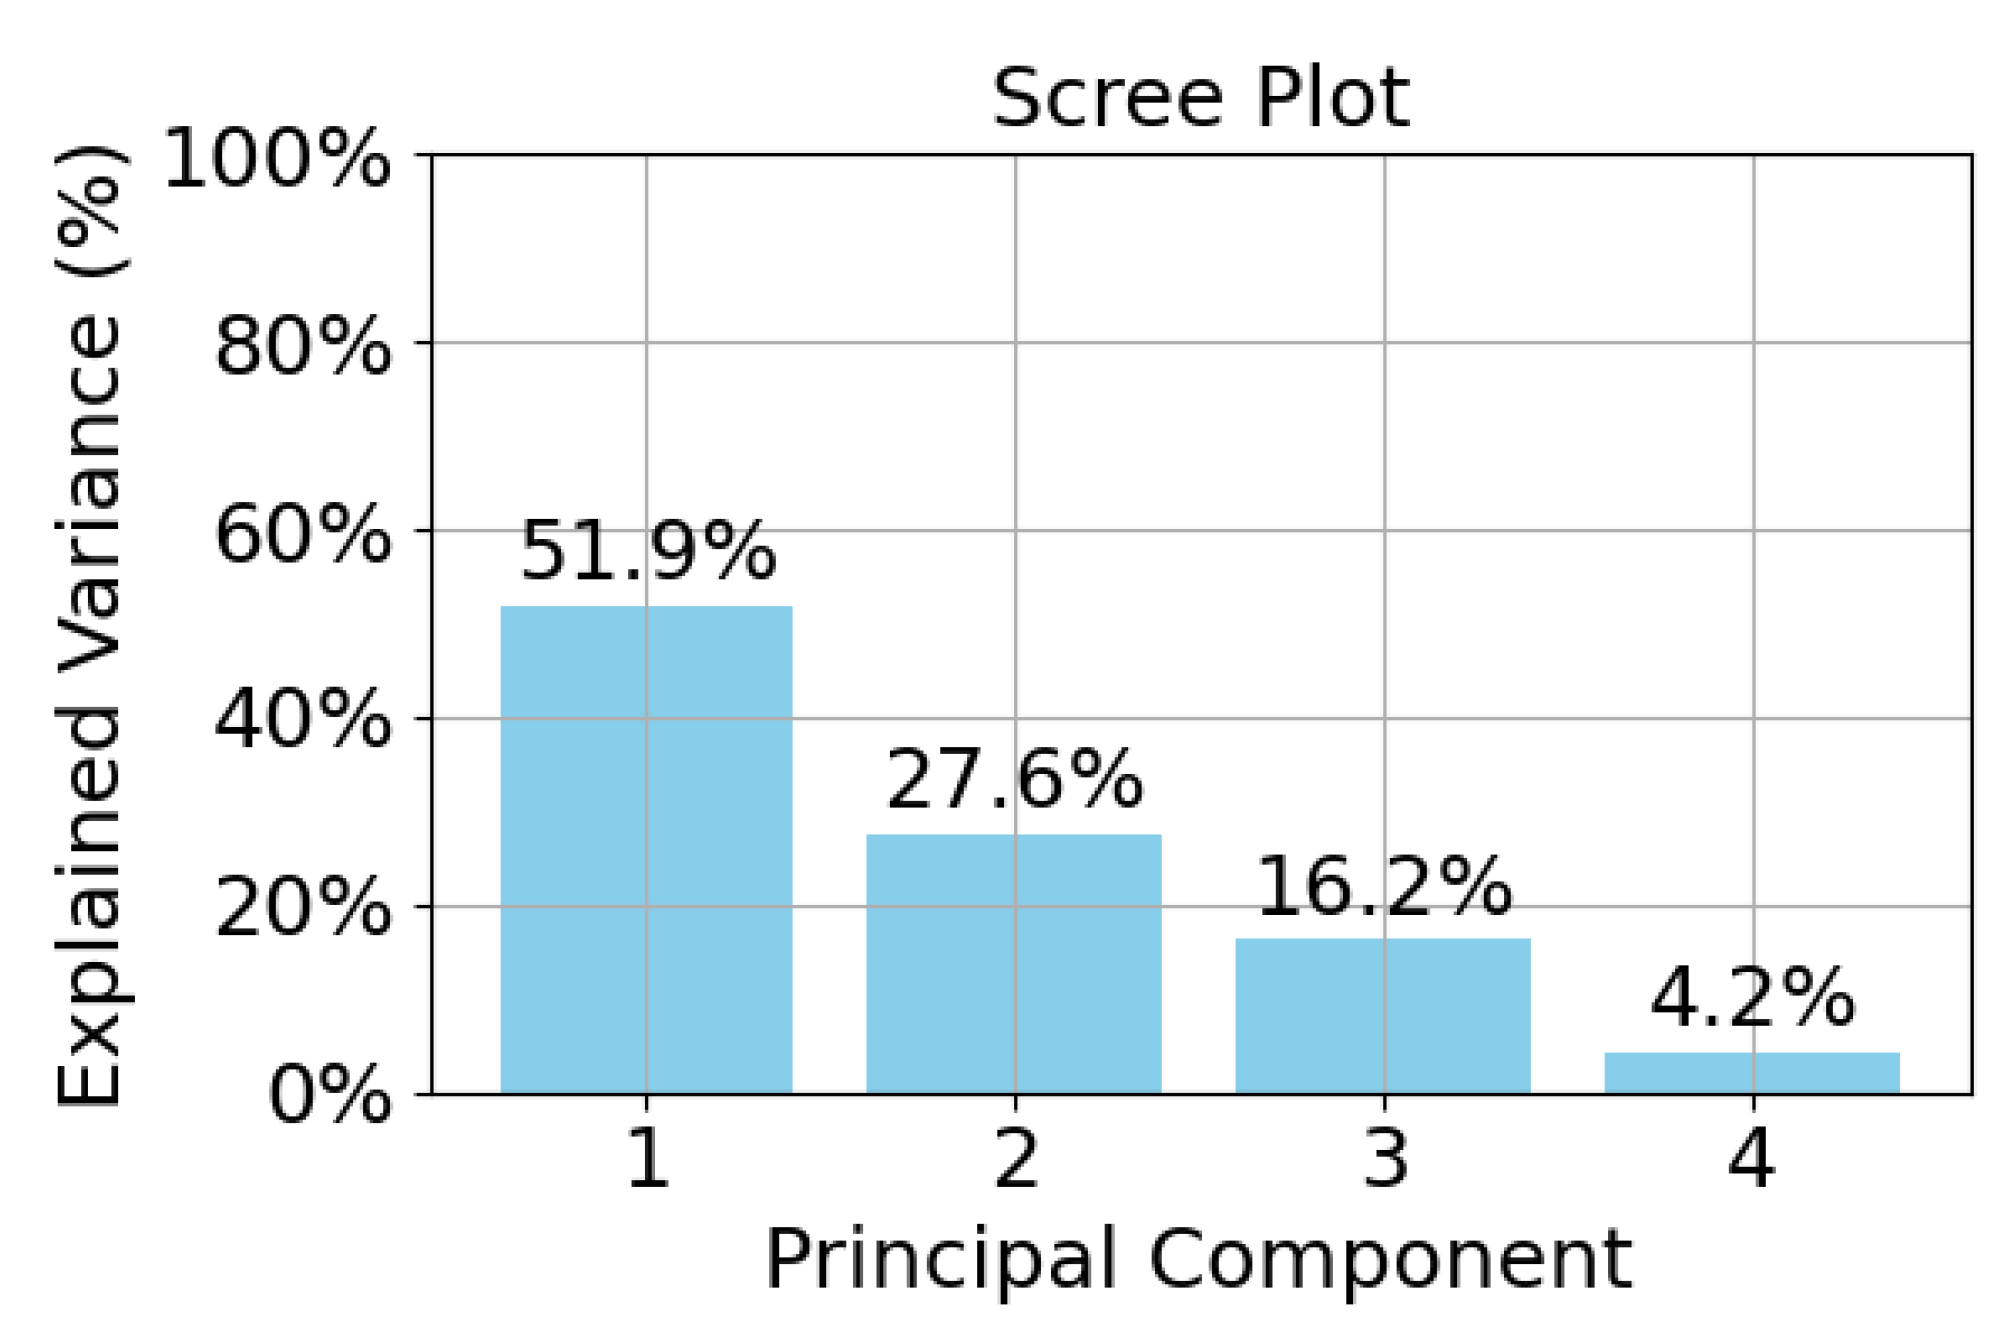
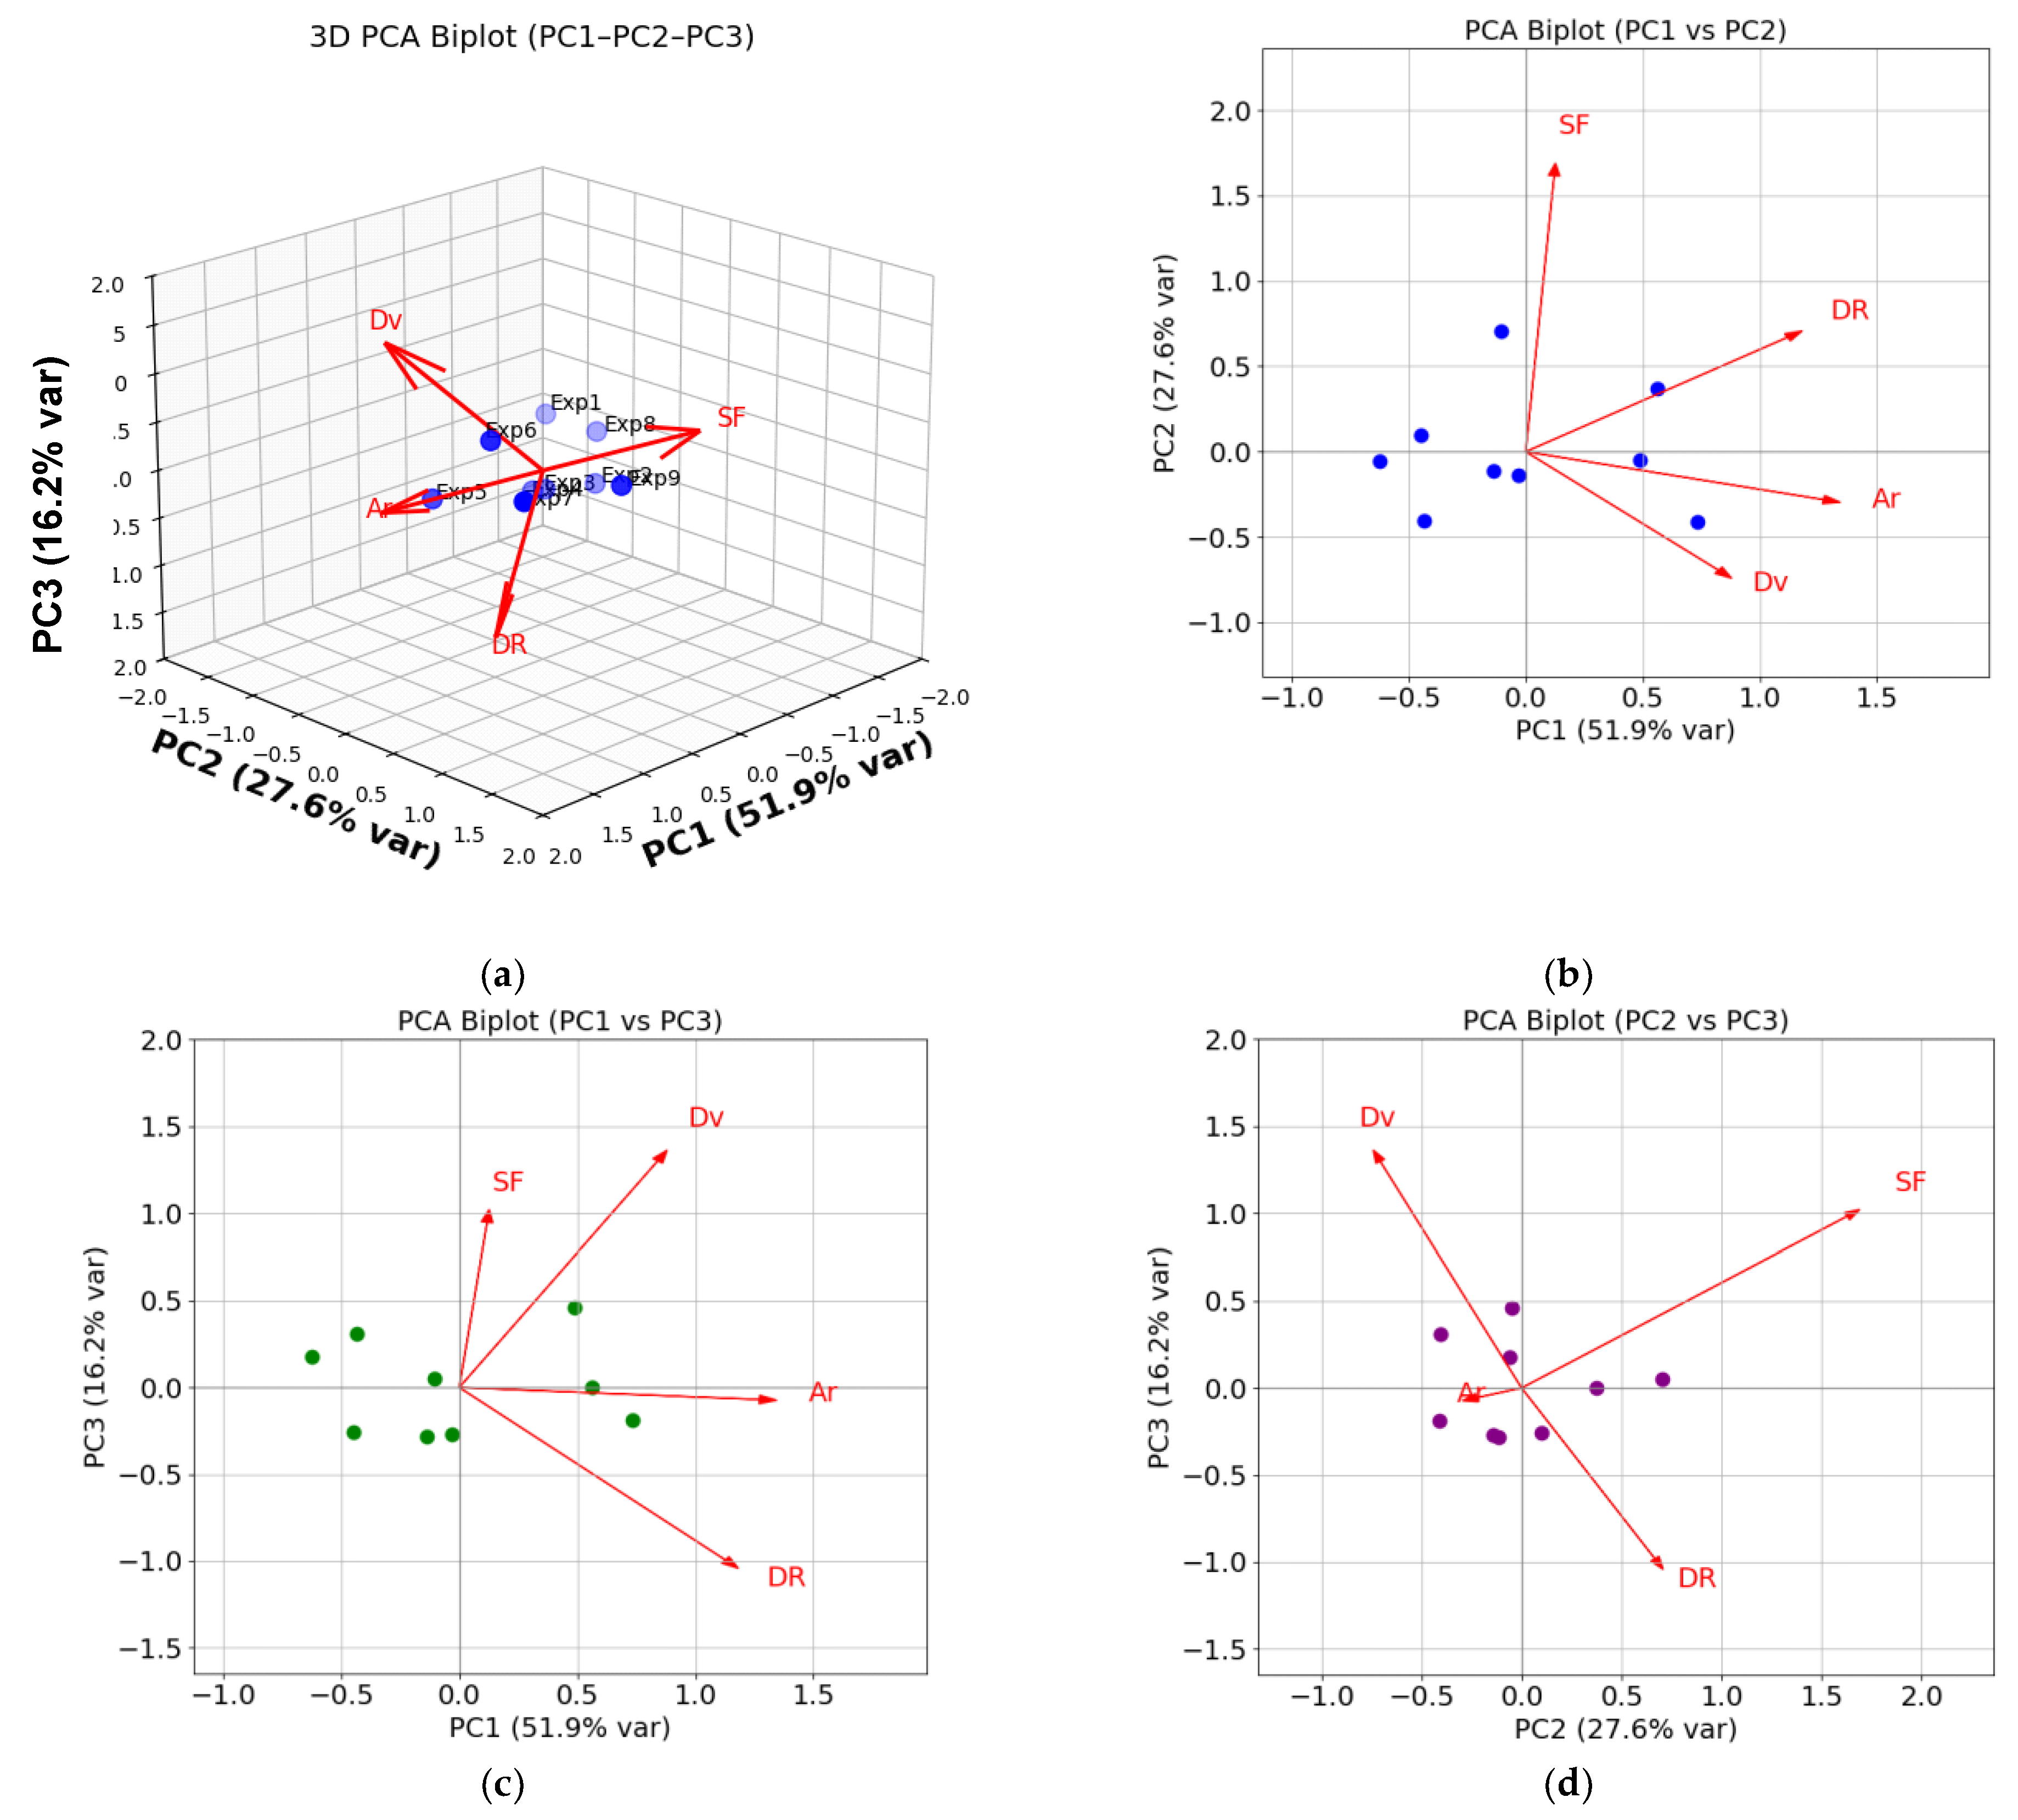
Figure 13 illustrates the 3D (a) and biplot (2D) (b) of principal component analysis for the orthogonal experiment
The Figure 12 accounts for 95.7% of the total variance distributed among three principal components: PC1 (51.9 %), PC2 (27.6 %), and PC3 (16.2 %). The 3D PCA biplot analysis (see Figure 13a) showed that on PC1, the following indicators had a significant positive loading: Ar (0.673)→DR (0.591)→Dv (0.440). This indicates their key role in the main variability of the system. PC2 shows a strong positive loading of SF (0.846), as well as a positive contribution of DR (0.354) and a moderate negative impact of Dv (-0.371). PC3 is characterized by a high positive loading of Dv (0.682) and a moderate positive loading of SF (0.511). The two-dimensional PCA biplot (Figure 13 b), explaining 79.56% of the variance, confirms the determining role of Ar, DR and Dv for PC1, as well as the dominant impact of SF for PC2. ‘Exp5’ and ‘Exp6’ appear relatively close, indicating similar characteristic profiles.
Figure 13.
Result of PCA analysis: (a) 3D representation of PCA, (b) Biplot graphics of PC1-PC2, (c) Biplot graphics of PC1-PC3 and (d) Biplot graphics of PC2-PC3.
Figure 13.
Result of PCA analysis: (a) 3D representation of PCA, (b) Biplot graphics of PC1-PC2, (c) Biplot graphics of PC1-PC3 and (d) Biplot graphics of PC2-PC3.
4. Discussion
Research has been conducted to examine how variables such as the amount of exothermic CuO–Al addition introduced into the cored-wire filler (EA), as well as hard-facing conditions, including the contact tip-to-work distance (CTWD), the wire feed speed (WFS), and the preset arc voltage at the power source (Uset), affect the melting behaviour of the compositions. These factors influence the heating, melting, and metal transfer characteristics during the hardfacing process of flux-cored wires containing an exothermic addition. Depending on both the thermo-physical properties of the exothermic addition itself (such as enthalpy change, adiabatic temperature rise, reaction onset temperature, and reaction kinetics [100]) and the heating and melting characteristics of the flux-cored wire, the exothermic reaction can occur either in the electrode extension zone or in the arc column. In the first case, introducing the exothermic addition results in uniform melting of both the core filler and the metallic sheath, which should improve melting performance, including melt-off rate and deposition rate. This aligns well with previous research findings [72]. In the second case, intense heat release from the exothermic reaction may cause significant overheating of droplets during transfer or neck rupture during short-circuit transfer [36,47,101]. Under these conditions, a decrease in deposition efficiency and increased filler-material losses have been observed. It has been determined that a slightly above medium level of exothermic-addition content in the filler of the self-shielded flux-cored wire is optimal. The stage at which the exothermic reaction occurs during filler material melting also influences the chemical state of the reaction components (CuO + Al) entering the arc column: (I) unreacted (as CuO and Al), (II) fully reacted (as Cu and Al₂O₃), or (III) partially reacted with intermediate compounds (e.g., CuO₂). This significantly impacts arc stability, constriction, temperature, and other arc parameters [43,102,103]. Special attention should be given to the combined effects of CTWD and Uset, since these determine the length of the electrode extension zone – the resistively heated region of the flux-cored wire before reaching the electrode tip. These variables have been shown to notably affect both the spattering factor (SF) and deposition efficiency (De).
The analysis of the results shows a significant influence of the content of the exothermic addition on the deposition rate and the spatter coefficient. In this case, the optimal content of the exothermic addition is at a medium or high level. At the same time, it is necessary to limit the welding current; at high values of wire feed speed (WFS), an increase in the loss of filler materials due to spatter was observed. Despite the increase in MOR and DR. The latter can be explained by the mixing of the stage of the flow of the exothermic reaction with the stage of the transfer of filler materials through the arc colume, which can be accompanied by splashes and was accompanied by an increase in SF and a decrease in De. An effective measure is to increase the electrode extension zone area, due to the use of a contact tip to work distance at a high level (CTWD=40 mm) and limited voltages on the arc (Figure 1). This will allow the use of the exothermic addition at a high level. The influence of the melting characteristics is reflected in the weld bead morphology parameters. The wire feed speed and the amount of the exothermic addition introduced into the core filler have a strong influence. The effect of WFS on the parameters characterizing the deposited metal and the melted substrate materials is opposite, so the optimal values will be at the medium level. The optimal values of the CTWD variable for the weld bead morphology parameters will be at a high level. Such optimal values of the wire feed speed and tip to work distance variables can be explained by the limitation of the welding current, which mainly affects the penetration capacity of the welding arc and the dilution of the deposited metal by the substrate materials.
The proposed methodology has enabled the identification of the most significant variables, the construction of mathematical models for predicting outcomes, and the determination of the optimal hardfacing conditions and CuO–Al exothermic mixture content in the flux-cored wire filler. Further research is planned to explore how variations in the exothermic additions into the core filler composition affect microstructure and hardness. The methodology can also be applied to relevant industries, such as railway transport [104,105,106], automotive industry [107,108], mechanical engineering industry [109,110], construction [111], energy [112,113,114], agriculture [115,116] and others.
5. Conclusions
This study employs a Taguchi-based grey relational analysis (GRA) combined with principal component analysis (PCA) to optimize multiple melting characteristics during hardfacing with self-shielded flux-cored wires. By integrating the Taguchi method with a factorial ANOVA design, highly accurate mathematical models for key melting characteristics – such as melt-off rate, deposition rate, spattering factor, and deposition efficiency – are developed.
Based on the results obtained, the following conclusions can be reached:
1. It has been determined that the variables exerting the strongest influence on the deposition rate are the wire-feed speed, РWFS(DR) = 60.00%, and the content of the exothermic addition, РEA(DR) = 31.53%. This suggests a significant contribution of the chemical reaction to the overall energy balance during the melting of the flux-cored wire.
2. For melting characteristics like the spattering factor and deposition efficiency, the most influential variable has been the exothermic-addition content: РEA(SF) = 49.76% and РEA(De) = 58.48%, respectively. CTWD has also played a significant role: РCTWD(SF) = 25.31% and РCTWD(De) = 31.95%.
3. The research conducted resulted in the development of mathematical models of melting characteristics and weld bead parameters, and the creation of response surfaces.
4. To effectively use exothermic additives in flux-cored wire filler, it is necessary to limit the wire feed speed and increase the contact tip to work distance.
5. The content of the exothermic additive to the core filler has a significant impact on the amount of molten metal (MOR and DR) and determines such geometric parameters as top height of reinforcement (THR), cross-sectional area of reinforcement (Ar) and dilution variation (Dv).
6. The parameter wire feed speed (WFS) had the main influence on the parameters characterizing the penetration of substrate materials, such as bottom depth of penetration (DP) and cross-sectional area of penetration (Ap). This is explained by the influence on the arc pressure. This parameter also had a significant contribution to other parameters of weld bead morphology. So, as a parameter, such as сontact tip to work distance, had the opposite effect on the penetration of substrate materials, decreasing their values with increasing distance.
7. The investigations conducted have identified the optimal hardfacing conditions for self-shielded flux-cored wires with an exothermic CuO–Al addition: EA=28 [wt.%], CTWD=40 [mm], WFS=2.07 [m·min-1], and Uset=28 [V].
8. The proposed methodology builds on existing approaches, enabling it to optimize variables using Taguchi-GRA-PCA and to develop high-quality mathematical models based on the L9 orthogonal array using ANOVA and factor analysis.
Author Contributions
Conceptualization, B.T. and O.D.; methodology, B.T.; software, B.T. and O.B.; validation, V.M., O.B. and K.K.; formal analysis, L.N.; investigation, B.T. and O.B.; resources, L.N.; data curation, V.M. and O.B.; writing—original draft preparation, B.T.; writing—review and editing, O.D. and L.N.; visualization, O.B. and L.N.; supervision, K.K. and O.D.; project administration, B.T.; funding acquisition, B.T. and L.N. All authors have read and agreed to the published version of the manuscript.
Funding
This research received no external funding.
Data Availability Statement
The original contributions presented in this study are included in the article. Further inquiries can be directed to the corresponding authors.
Conflicts of Interest
The authors declare no conflicts of interest.
Abbreviations
The following abbreviations are used in this manuscript:
| GRA | Grey Relational Analysis |
| PCA | Principal Component Analysis |
| ANOVA | Analysis of Variance |
| RSM | Response Surface Methodology |
| FCAW | Flux-Cored Arc Welding |
| WFS | Wire feed speed |
| CTWD | Contact tip-to-work distance |
| EA | Percentage of exothermic mixture in the core filler |
| MOR | Melting-off rate |
| DR | Deposition rate |
| SF | Spattering factor |
| De | Deposition efficiency |
| R sqr | Coefficient of Determination |
| R Adj | Adjusted Sum of Squares |
| WB | Width bead |
| THR | Top high of reinforcement |
| DP | Bottom depth of penetration |
| Ar | Cross-sectional area of reinforcement |
| Ap | Cross-sectional area of penetration |
| Dv | Dilution variation |
References
- Bannikov, D.; Tiutkin, O.; Hezentsvei, Y.; Muntian, A. Controlling the dynamic characteristics of steel bunker containers for bulk materials. IOP Conference Series: Earth and Environmental Science 2024, 1348(1), 012002. [Google Scholar] [CrossRef]
- Bembenek, M.; Mandziy, T.; Ivasenko, I.; Berehulyak, O.; Vorobel, R.; Slobodyan, Z.; Ropyak, L. Multiclass Level-Set Segmentation of Rust and Coating Damages in Images of Metal Structures. Sensors 2022, 22, 7600. [Google Scholar] [CrossRef] [PubMed]
- Krol, O.; Sokolov, V.; Stanciu, D.I. Structural and Parametric Identification of Mathematical Models of HVAC Systems. In International Conference on Reliable Systems Engineering (ICoRSE) - 2025. Lecture Notes in Networks and Systems; Cioboată, D.D., Machado, J., Eds.; Springer: Cham, 2025; p. 1592. [Google Scholar] [CrossRef]
- Ratov, B.; Mechnik, V.A.; Rucki, M.; Hevorkian, E.; Bondarenko, N.; Prikhna, T.; Moshchil, V.E.; Kolodnitskyi, V.; Morozow, D.; Gusmanova, A.; Jozwik, J.; Arshidinova, M.; Tofil, A. Enhancement of the Refractory Matrix Diamond-Reinforced Cutting Tool Composite with Zirconia Nano-Additive. Materials 2024, 17, 2852. [Google Scholar] [CrossRef] [PubMed]
- Ulbrich, D.; Psuj, G.; Bartkowski, D.; Bartkowska, A. Assessment of Coating Properties in Car Body by Ultrasonic Method. Appl. Sci. 2024, 14, 8117. [Google Scholar] [CrossRef]
- Fekiač, J.J.; Krbata, M.; Kohutiar, M.; Janík, R.; Kakošová, L.; Breznická, A.; Eckert, M.; Mikuš, P. Comprehensive Review: Optimization of Epoxy Composites, Mechanical Properties, & Technological Trends. Polymers 2025, 17, 271. [Google Scholar] [CrossRef] [PubMed]
- Magalhães, K.M.M.; Brasil, R.M.L.R.F.; Wahrhaftig, A.M.; Siqueira, G.H.; Bondarenko, I.; Neduzha, L. Influence of Atmospheric Humidity on the Critical Buckling Load of Reinforced Concrete Columns. International Journal of Structural Stability and Dynamics 2022, 2250011. [Google Scholar] [CrossRef]
- Bannikov, D.O.; Tiutkin, O.L. Prospective directions of the development of loose medium mechanics. Science and Innovation 2020, 16(2), 42–50. [Google Scholar] [CrossRef]
- Petruš, P.; Barényi, I.; Majerík, J.; Krbata, M.; Kohutiar, M.; Kovaříková, I.; Bilka, M. Impact of Heat Treatment on Microstructure Evolution in Grey Cast Iron EN-GJL-300. Metals 2025, 15, 530. [Google Scholar] [CrossRef]
- Myamlin, S.; Neduzha, L.; Urbutis, Ž. Research of Innovations of Diesel Locomotives and Bogies. Procedia Engineering 2016, 134, 470–475. [Google Scholar] [CrossRef]
- Myamlin, S.; Lunys, O.; Neduzha, L.; Kyryl’chuk, O. Mathematical modeling of dynamic loading of cassette bearings for freight cars. In Proceedings of the 21st International Scientific Conference Transport Means, Juodkrante, Lithuania, 20–22 September 2017; pp. 973–976. [Google Scholar]
- Bondarenko, I.; Lunys, O.; Neduzha, L.; Keršys, R. Dynamic track irregularities modeling when studying rolling stock dynamics. In Proceedings of the 23rd International Scientific Conference Transport Means, Palanga, Lithuania, 2–4 October 2019; pp. 1014–1019. [Google Scholar]
- Bondarenko, I.; Lukoševičius, V.; Keršys, R.; Neduzha, L. Investigation of Dynamic Processes of Rolling Stock–Track Interaction: Experimental Realization. Sustainability 2023, 15, 5356. [Google Scholar] [CrossRef]
- Sawczuk, W.; Cañás, A.M.R.; Ulbrich, D.; Kowalczyk, J. Modeling the Average and Instantaneous Friction Coefficient of a Disc Brake on the Basis of Bench Tests. Materials 2021, 14, 4766. [Google Scholar] [CrossRef]
- Knyazev, S.; Rebrova, R.; Riumin, V.; Nikichanov, V.; Rebrova, A. Establishment of structure and operational properties of borated layers on 40X steel obtained from paste by induction heating. Functional Materials 2021, 28(1), 76–83. [Google Scholar] [CrossRef]
- Romek, D.; Selech, J.; Ulbrich, D. Use of Heat-Applied Coatings to Reduce Wear on Agricultural Machinery Components. Materials 2024, 17, 2849. [Google Scholar] [CrossRef] [PubMed]
- Sokolovskij, E.; Žuraulis, V. Advances in Vehicle Dynamics and Road Safety: Technologies, Simulations, and Applications. Applied Sciences 2024, 14, 3735. [Google Scholar] [CrossRef]
- Kalivoda, J.; Neduzha, L. Running Dynamics of Rail Vehicles. Energies 2022, 15, 5843. [Google Scholar] [CrossRef]
- Zelenko, Y.; Zelenko, D.; Neduzha, L. Contemporary principles for solving the problem in noise reduction from railway rolling stock. IOP Conference Series: Materials Science and Engineering 2020, 985(1), 012015. [Google Scholar] [CrossRef]
- Ropyak, L.Y.; Velychkovych, A.S.; Vytvytskyi, V.S.; Shovkoplias, M.V. Analytical study of “crosshead – slider ail” wear effect on pumprod stress state. J Phys Conf Ser 2021, 1741, 012039. [Google Scholar] [CrossRef]
- Efremenko, V.G.; Chb; ak, Yu.G.; Fedun, V.I.; Shimizu, K.; Pastukhova, T.V.; Petryshynets, I.; Zusin, A.M.; Kudinova, E.V.; Efremenko, B.V. Formation mechanism, microstructural features and dry-sliding behaviour of “Bronze/WC carbide” composite synthesised by atmospheric pulsed-plasma deposition. Vacuum 2021, 185, 110031. [Google Scholar] [CrossRef]
- Hlushkova, D.B.; Bagrov, V.A.; Saenko, V.A.; Volchuk, V.M.; Kalinin, A.V.; Kalinina, N.E. Study of wear of the buiding-up zone of martensite-austenitic and secondary hardening steels of the Cr-Mn-Ti system. Problems of Atomic Science and Technology 2023, 144(2), 105–109. [Google Scholar] [CrossRef]
- Coetsee, T.; De Bruin, F. J. Thermochemical analysis of the behaviour of Cu in Ti nano-strand formation from low-temperature reaction of Al-Fe-Cu powder with CaF2-SiO2-Al2O3-MgO-MnO-TiO2 flux. Chemical Thermodynamics and Thermal Analysis 2025, 17, 100160. [Google Scholar] [CrossRef]
- Coetsee, T.; De Bruin, F. A Review of the Thermochemical Behaviour of Fluxes in Submerged Arc Welding: Modelling of Gas Phase Reactions. Processes 2023, 11, 658. [Google Scholar] [CrossRef]
- Sukhova, O.V. Mechanical and corrosion properties of Fe–B–C alloys. Mater. Sci. 2024, 59, 554–560. [Google Scholar] [CrossRef]
- Świerczyńska, A.; Varbai, B.; Pandey, C.; Fydrych, D. Exploring the trends in flux-cored arc welding: Scientometric analysis approach. Int. J. Adv. Manuf. Technol 2024, 130, 87–110. [Google Scholar] [CrossRef]
- Wolski, A.; Świerczyńska, A.; Lentka, G.; Fydrych, D. Storage of high-strength steel flux-cored welding wires in urbanized areas. Int J Precis Eng Manuf-Green Technol 2024, 11(1), 55–70. [Google Scholar] [CrossRef]
- Trembach, B.; Starikov, V.; Sukov, M.G.; Zharikov, S.; Kabatskyi, O.; Ivanova, Y. Application of mixture design in optimization of physical properties of slag during self-shielded flux-cored wire arc welding process. In Proceedings of the IEEE 5th International Conference on Modern Electrical and Energy System. MEES, Kremenchuk. Ukraine; 2023; pp. pp 1–5. [Google Scholar] [CrossRef]
- Fagundes, J.G.; Moreno, A.M.; Ribeiro, P.H.; Arias, A.R.; Bracarense, A.Q. Formation of TiC by the application of Ti6Al4V machining chips as flux compounds of tubular wires. Journal of physics. Conference series 2018, 1126, 012027. [Google Scholar] [CrossRef]
- Lozynskyi, V.; Trembach, B.; Hossain, M.M.; Kabir, M.H.; Silchenko, Y.; Krbata, M.; Sadovyi, K.; Kolomiitse, O.; Ropyak, L. Prediction of phase composition and mechanical properties Fe–Cr–C–B–Ti–Cu hardfacing alloys: modeling and experimental validations. Heliyon 2024, 10. [Google Scholar] [CrossRef]
- Bembenek, M.; Prysyazhnyuk, P.; Shihab, T.; Machnik, R.; Ivanov, O.; Ropyak, L. Microstructure and Wear Characterization of the Fe-Mo-B-C-Based Hardfacing Alloys Deposited by Flux-Cored Arc Welding. Materials 2022, 15, 5074. [Google Scholar] [CrossRef]
- Sukhova, O.V. Structure and properties of Fe–B–C powders alloyed with Cr, V, Mo or Nb for plasma-sprayed coatings. Probl. At. Sci. Technol. 2020, 4, 77–83. [Google Scholar] [CrossRef]
- Li, H.; Hu, C.; Hu, J.; Han, K.; Wang, Z.; Yang, R.; Liu, D. Underwater wet welding of high-strength low-alloy steel using self-shielded flux-cored wire with highly exothermic Al/CuO mixture. J Mater Process Technol. 2024, 328, 118404. [Google Scholar] [CrossRef]
- Li, H.L.; Liu, D.; Guo, N.; Chena, H.; Dua, Y.P.; Feng, J.C. The effect of alumino-thermic addition on underwater wet welding process stability. J. Mater. Process. Technol. 2017, 245, 149–156. [Google Scholar] [CrossRef]
- Boiko, I.A.; Grin’, A.G. Effect of the surface condition of fluxed-cored wires on the stability of the arc process. Welding International 2015, 29(7), 543–547. [Google Scholar] [CrossRef]
- Zharikov, S.V.; Grin, A.G. Investigation of slags in surfacing with exothermic flux-cored wires. Weld. Int. 2015, 29(5), 386–389. [Google Scholar] [CrossRef]
- Vlasov, A.F.; Makarenko, N.A.; Kushchiy, A.M. Using exothermic mixtures in manual arc welding and electroslag processes. Weld. Int. 2017, 31(7), 565–570. [Google Scholar] [CrossRef]
- Vlasov, A.F.; Makarenko, N.A. Special features of heating and melting electrodes with an exothermic mixture in the coating. Weld. Int. 2016, 30(9), 717–722. [Google Scholar] [CrossRef]
- Vora, J.; Patel, V.K.; Srinivasan, S.; Chaudhari, R.; Pimenov, D.Y.; Giasin, K.; Sharma, S. Optimization of Activated Tungsten Inert Gas Welding Process Parameters Using Heat Transfer Search Algorithm: With Experimental Validation Using Case Studies. Metals 2021, 11, 981. [Google Scholar] [CrossRef]
- Binande, P.; Shahverdi, H.R.; Farnia, A. Study on the effect of flux composition on the melting efficiency of A-TIG of AISI 316L stainless steel: experimental and analytical approaches. J. Mater. Res. Technol. 2024, 33, 9092–9108. [Google Scholar] [CrossRef]
- Coetsee, T.; De Bruin, F. Sodium-Oxide Fluxed Aluminothermic Reduction of Manganese Ore for a Circular Economy: Cr Collector Metal Application. Sustain. Chem. 2025, 6, 30. [Google Scholar] [CrossRef]
- Coetsee, T.; De Bruin, F.J. Thermochemical analysis of the behaviour of Cu in Ti nano-strand formation from low-temperature reaction of Al-Fe-Cu powder with CaF2-SiO2-Al2O3-MgO-MnO-TiO2 flux. Chem. Thermodyn. Therm. Anal. 2025, 17, 100160. [Google Scholar] [CrossRef]
- Wang, J.; Li, H.; Hu, C.; Wang, Z.; Han, K.; Liu, D.; Wang, J.; Zhu, Q. The Efficiency of Thermite-Assisted Underwater Wet Flux-Cored Arc Welding Process: Electrical Dependence, Microstructural Changes, and Mechanical Properties. Metals 2023, 13, 831. [Google Scholar] [CrossRef]
- Trembach, B.; Trembach, I.; Grin, A.; Makarenko, N.; Babych, O.; Knyazev, S.; Musairova, Y.; Krbata, M.; Balenko, O.; Vorobiov, O.; et al. Study of the Effects of Hardfacing Modes Carried out by FCAW-S with Exothermic Addition of MnO2-Al on Non-Metallic Inclusions, Grain Size, Microstructure and Mechanical Properties. Eng 2025, 6, 125. [Google Scholar] [CrossRef]
- Liu, D.; Li, H.; Yan, Y.; Guo, N.; Song, X.; Feng, J. Effects of processing parameters on arc stability and cutting quality in underwater wet flux-cored arc cutting at shallow water. J. Manuf. Process. 2018, 33, 24–34. [Google Scholar] [CrossRef]
- Rong, X.; Zhao, D.; He, C.; Shi, C.; Liu, E.; Zhao, N. Revealing the strengthening and toughening mechanisms of Al-CuO composite fabricated via in-situ solid-state reaction. Acta Mater. 2021, 204, 116524. [Google Scholar] [CrossRef]
- Trembach, B.; Silchenko, Y.; Balenko, O.; Hlachev, D.; Kulahin, K.; Heiko, H.; Bellorin-Herrera, O.; Khabosha, S.; Zakovorotnyi, O.; Trembach, I. Study of the hardfacing process using self-shielding flux-cored wire with an exothermic addition with a combined oxidizer of the Al-(CuO/Fe2O3) system. Int. J. Adv. Manuf. Technol. 2024, 134, 309–335. [Google Scholar] [CrossRef]
- Trembach, B.; Trembach, I.; Maliuha, V.; Knyazev, S.; Krbata, M.; Kabatskyi, O.; Balenko, O.; Zarichniak, Y.; Brechka, M.; Mykhailo, B.; Khabosha, S.; Kniazieva, H. Study of self-shielded flux-cored wire with exothermic additions CuO-Al on weld bead morphology, microstructure, and mechanical properties. Int. J. Adv. Manuf. Technol. 2025, 137, 4685–4711. [Google Scholar] [CrossRef]
- Lozynskyi, V.; Trembach, B.; Katinas, E.; Sadovyi, K.; Krbata, M.; Balenko, O.; Krasnoshapka, I.; Rebrova, O.; Knyazev, S.; Kabatskyi, O.; Kniazievf, H.; Ropyak, L. Effect of Exothermic Additions in Core Filler on Arc Stability and Microstructure during Self-Shielded, Flux-Cored Arc Welding. Crystals 2024, 14, 335. [Google Scholar] [CrossRef]
- Kim, C.J.; Seo, B.W.; Son, H.J.; Kim, S.; Kim, D.; Cho, Y.T. Slag inclusion-free flux cored wire arc directed energy deposition process. Mater. Des. 2024, 238, 112669. [Google Scholar] [CrossRef]
- Kassov, V.; Berezshna, O.; Yermakova, S.; Turchanin, D.; Malyhina, S. Features of heating and melting of powder tape for surfacing of composite and complex-alloyed alloys. East Eur. J. Enterp. Technol. 2025, 2(1 (134), 60–67. [Google Scholar] [CrossRef]
- Jia, C.; Zhang, Y.; Wu, J.; Xing, C.; Zhao, B.; Wu, C. Comprehensive analysis of spatter loss in wet FCAW considering interactions of bubbles, droplets and arc–Part 1: Measurement and improvement. J. Manuf. Process. 2019, 40, 122–127. [Google Scholar] [CrossRef]
- Chowdhury, M.Z.I.; Turin, T.C. Variable selection strategies and its importance in clinical prediction modelling. Fam Med Community Health 2020, 16;8(1), e000262. [Google Scholar] [CrossRef]
- Rose, J.M.; Bliemer, M.C. Constructing efficient stated choice experimental designs. Transport Reviews 2009, 29(5), 587–617. [Google Scholar] [CrossRef]
- Bliemer, M.C.J.; Rose, J.M.; Hensher, D.A. Constructing efficient stated choice experiments allowing for differences in error variances across subsets of alternatives. Transportation Research Part B 2009, 43(1), 19–35. [Google Scholar] [CrossRef]
- Saha, U.; Mokhtar, W. Quality Improvement of Polycarbonate Medical Device by Moldex3D and Taguchi DOE. J. Manuf. Mater. Process. 2025, 9, 16. [Google Scholar] [CrossRef]
- Daniyan, I.A.; Tlhabadira, I.; Mpofu, K.; Adeodu, A.O. Process design and optimization for the milling operation of aluminum alloy (AA6063 T6). Mater Today: Proc. 2021, 32(2), 536–542. [Google Scholar] [CrossRef]
- Funai, V.I.; Melo, D.N.; Lima, N.M.; Pattaro, A.F.; Liñan, L.Z.; Bonon, A.J.; Maciel Filho, R. Attainment of kinetic parameters and model validation for nylon-6 process. Computer Aided Chemical Engineering 2014, 33, 1483–1488. [Google Scholar] [CrossRef]
- Sahali, M.A. Multi-objective optimization of FCA welding process: trade-off between welding cost and penetration under hardness limitation. Int J Adv ManufTechnol 2020, 110, 729–740. [Google Scholar] [CrossRef]
- Trembach, I.O.; Trembach, B.O.; Grin, A.G.; Luzhetskyy, R.Y.; Brechko, V.O.; Zakovorotniy, O.Y.; Balenko, O.I.; Molchanov, H.I.; Rebrova, O.M.; Kabatskyi, O.V. Application of a complete factorial experiment for optimization of the filling factor and charge density of self-shielding flux-cored powder wire. Mater. Sci. 2025, 60, 52–59. [Google Scholar] [CrossRef]
- Patel, Y.; Shah, A.; Chaudhari, R.; Vaghasia, V.; Patel, V.; Vora, J. Experimental Investigations on Wire-Arc Additive Manufacturing of Metal-Cored Wires. Eng. Proc. 2025, 114, 14. [Google Scholar] [CrossRef]
- Trembach, B.; Trembach, I.; Grin, A.; Makarenko, N.; Rebrov, O.; Musairova, Y.; Kuravska, N.; Knyazev, S.; Krasnoshapka, I.; Kuravskyi, M.; Krykun, V.; Nedashkovskyi, A.; Panchenko, A. Optimisation of hardfacing conditions carried out by self-shielded flux-cored wire using combined Taguchi method and factorial design. Int J Adv ManufTechnol 2025, 140, 1367–1408. [Google Scholar] [CrossRef]
- Farhangi, H.; Mozafari, V.; Roosta, H.R.; Farhangi, M. Optimizing growth conditions in vertical farming: enhancing lettuce and basil cultivation through the application of the Taguchi method. Sci. Rep. 2023, 13, 6717. [Google Scholar] [CrossRef]
- Yen, C.T.; Ye, J.W. Optical design of contact lenses using principal component analysis method with Taguchi method. Appl. Math. Model. 2015, 39(19), 5778–5782. [Google Scholar] [CrossRef]
- Vinothkumar, K.; Mathivanan, A. Optimization of CMT Welding for 18/8 Stainless Steel: A Teaching Learning Based Algorithm-Driven Approach. In J. of Materi Eng and Perform; 2025. [Google Scholar] [CrossRef]
- Tomita, R.K.; Park, S.W. Analysis of activated sludge process using multivariate statistical tools – a PCA approach. Chem. Eng. J. 2002, 90, 283–290. [Google Scholar] [CrossRef]
- Datta, S.; Nandi, G.; Bandyopadhyay, A.; Pal, P.D. Application of PCA-based hybrid Taguchi method for correlated multicriteria optimization of submerged arc weld: a case study. Int J Adv Manuf Technol. 2009, 45, 276–286. [Google Scholar] [CrossRef]
- Alao, AR. Simultaneous optimization of multivariate surface roughness parameters in precision grinding of silicon by unsupervised machine learning. Int J Adv ManufTechnol 2025, 139, 3543–3553. [Google Scholar] [CrossRef]
- Sahoo, P.; Pal, S.K. Tribological performance optimization of electroless Ni–P coatingsusing the Taguchi method and grey relational analysis. Tribology Letters 2007, 28(2), 191–201. [Google Scholar] [CrossRef]
- Tomita, R.K.; Park, S.W. Analysis of activated sludge process using multivariate statistical tools – a PCA approach. Chem. Eng. J. 2002, 90, 283–290. [Google Scholar] [CrossRef]
- Hisam, M.W.; Dar, A.A.; Elrasheed, M.O.; Khan, S.; Gera, R.; Azad, I. The Versatility of the Taguchi Method: Optimizing Experiments Across Diverse Disciplines. J Stat Theory Appl 2024, 23, 365–389. [Google Scholar] [CrossRef]
- Trembach, B.; Balenko, O.; Davydov, V.; Brechko, V.; Trembach, I.; Kabatskyi, O. Prediction the Melting Characteristics of Self-Shielded Flux Cored arc Welding (FCAW-S) with Exothermic Addition (CuO-Al). In Proceedings of the IEEE 4th International Conference on Modern Electrical and Energy System (MEES), Kremenchuk, Ukraine, 20–23 October 2022; pp. 1–6. [Google Scholar] [CrossRef]
- Tarng, Y.S.; Yang, W.H.; Juang, S.C. Use of fuzzy logic in the Taguchi method for the optimization of the submerged arc welding process. Int. J. Adv. Manuf. Technol. 2000, 16, 688–694. [Google Scholar] [CrossRef]
- Kaushik, N.; Singhal, S. Hybrid combination of Taguchi-GRA-PCA for optimization of wear behavior in AA6063/SiCp matrix composite. Prod. Manuf. Res. 2018, 6, 171–189. [Google Scholar] [CrossRef]
- Shahapurkar, K.; Chenrayan, V.; Soudagar, M.E.M.; Badruddin, I.A.; Shahapurkar, P.; Elfasakhany, A.; Mujtaba, M.; Siddiqui, M.I.H.; Ali, M.A.; Mahlia, T.M.I. Leverage of Environmental Pollutant Crump Rubber on the Dry Sliding Wear Response of Epoxy Composites. Polymers 2021, 13, 2894. [Google Scholar] [CrossRef]
- Hotelling, H. Analysis of a complex of statistical variables into principal components. J. Educ. Psychol. 1933, 24(6), 417. [Google Scholar] [CrossRef]
- Chenrayan, V.; Gelaw, M.; Manivannan, C.; Rajamanickam, V.; Venugopal, E. An extensive data set related to micro-drilling of Al-SiC-B4C hybrid composite through µECM using GRA coupled PCA. Data Brief 2020, 33, 106491. [Google Scholar] [CrossRef] [PubMed]
- Shahapurkar, K.; Chenrayan, V.; Soudagar, M.E.M.; Badruddin, I.A.; Shahapurkar, P.; Elfasakhany, A.; Mujtaba, M.; Siddiqui, M.I.H.; Ali, M.A.; Mahlia, T.M.I. Leverage of Environmental Pollutant Crump Rubber on the Dry Sliding Wear Response of Epoxy Composites. Polymers 2021, 13, 2894. [Google Scholar] [CrossRef] [PubMed]
- Szymura, M.; Czupryński, A.; Ochodek, V. Development of a Mathematical Model of the Self-Shielded Flux-Cored Arc Surfacing Process for the Determination of Deposition Rate. Materials 2024, 17, 5616. [Google Scholar] [CrossRef] [PubMed]
- Starling, C.M.D.; Modenesi, P.J. Metal Transfer Evaluation of Tubular Wires. Weld. Int. 2007, 21, 412–420. [Google Scholar] [CrossRef]
- Le, D.K.; Tashiro, S.; Trinh, N.Q.; Tanaka, T.; Bui, H.V. Elucidation of alkali element’s role in optimizing metal transfer behavior in rutile-type flux-cored arc welding. J. Manuf. Process. 2025, 139, 105–125. [Google Scholar] [CrossRef]
- Zhu, Z.; Fan, K.; Liu, H.; Ma, G. Characteristics of short-circuit behaviour and its influencing factors in self-shielded flux-cored arc welding. Sci Technol Weld Join. 2016, 21, 91–98. [Google Scholar] [CrossRef]
- Assunção, M.T.; Bracarense, A.Q. A novel strategy to improve melting efficiency and arc stability in underwater FCAW via contact tip air chamber. J. Manuf. Process 2023, 104, 1–16. [Google Scholar] [CrossRef]
- Bauné, E.; Bonnet, C.; Liu, S. Assessing Metal Transfer Stability and Spatter Severity in Flux Cored Arc Welding. Sci. Technol. Weld. Join. 2001, 6, 139–148. [Google Scholar] [CrossRef]
- Raj, A.; Chadha, U.; Chadha, A.; Mahadevan, R.R.; Sai, B.R.; Chaudhary, D.; Selvaraj, S.K.; Lokeshkumar, R.; Das, S.; Karthikeyan, B.; et al. Weld Quality Monitoring via Machine Learning-Enabled Approaches. Int. J. Interact. Des. Manuf. (IJIDeM) 2023, 3, 1–43. [Google Scholar] [CrossRef]
- Aita, C.A.G.; Goss, I.C.; Rosendo, T.S.; Tier, M.D.; Wiedenhoft, A.; Reguly, A. Shear strength optimization for FSSW AA6060-T5 joints by Taguchi and full factorial design. J. Mater. Res. Technol. 2020, 9, 16072–16079. [Google Scholar] [CrossRef]
- Yao, K.C.; Chiang, S. Mathematical Modeling and Structural Equation Analysis of Acceptance Behavior Intention to AI Medical Diagnosis Systems. Mathematics 2025, 13, 2390. [Google Scholar] [CrossRef]
- Zhang, X.; Xu, C.; Yi, J.; Li, X.; Yin, J. Analysis of Strength Effects on the Dynamic Response of a Shaped-Charge Under Lateral Disturbances. Appl. Sci. 2025, 15, 6313. [Google Scholar] [CrossRef]
- Veza, I.; Spraggon, M.; Fattah, I.M.R.; Idris, M. Response Surface Methodology (RSM) for Optimizing Engine Performance and Emissions Fueled with Biofuel: Review of RSM for Sustainability Energy Transition. Results Eng. 2023, 18, 101213. [Google Scholar] [CrossRef]
- Finšgar, M.; Jezernik, K. The Use of Factorial Design and Simplex Optimization to Improve Analytical Performance of In Situ Film Electrodes. Sensors 2020, 20, 3921. [Google Scholar] [CrossRef]
- Pavčnik, L.; Bohanec, S.; TrdanLušin, T.; Roškar, R. Use of Factorial Designs to Reduce Stability Studies for Parenteral Drug Products: Determination of Factor Effects via Accelerated Stability Data Analysis. Pharmaceutics 2025, 17, 1067. [Google Scholar] [CrossRef]
- Hosmer, D.W.; Lemeshow, S. Applied Logistic Regression; John Wiley & Sons: Hoboken, NJ, USA, 2000. [Google Scholar]
- Saeed, M.A. Minimizing Vibrations and Power Consumption in Milling of AZ31 Alloy Through Parameter Optimization. Results in Engineering 2025, 107186. [Google Scholar] [CrossRef]
- Klimpel A Industrial surfacing and hardfacing technology, fundamentals and applications. Weld Technol Rev 2019, 91(12), 33–42. [CrossRef]
- Liu, D.-K.; Hsieh, C.-C.; Liao, T.-W.; Kuo, C.-F.J. The Use of the Taguchi Method with Grey Relational Analysis for Nanofluid-Phase Change-Optimized Parameter Design at a Rooftop Solar Photovoltaic Thermal Composite Module for Small Households. Sustainability 2023, 15, 15163. [Google Scholar] [CrossRef]
- Thekkuden, D.T.; Sherif, M.M.; Alkhedher, M.; Iftikhar, S.H.; Mourad, A.H.I. Integrated Taguchi-PCA-GRA based multi objective optimization of tube projection and radial clearance for friction stir welded heat exchanger tube-to-tube sheet joints. Manufacture 2024, 7(6), 914–924. [Google Scholar] [CrossRef]
- Kavimani, V.; Prakash, K.S.; Thankachan, T.; Nagaraja, S.; Jeevanantham, A.K.; Jhon, J.P. WEDM Parameter Optimization for Silicon@r-GO/Magneisum Composite Using Taguchi Based GRA Coupled PCA. Silicon 2020, 12, 1161–1175. [Google Scholar] [CrossRef]
- Rojas, H.; Vargas, Z.; Valdez, S.; Serrano, M.; del Pozo, A.; Alcántara, M. Taguchi, Grey Relational Analysis, and ANOVA Optimization of TIG Welding Parameters to Maximize Mechanical Performance of Al-6061 T6 Alloy. J. Manuf. Mater. Process. 2024, 8, 246. [Google Scholar] [CrossRef]
- Qazi, M.I.; Akhtar, R.; Abas, M.; Khalid, Q.S.; Babar, A.R.; Pruncu, C.I. An Integrated Approach of GRA Coupled with Principal Component Analysis for Multi-Optimization of Shielded Metal Arc Welding (SMAW) Process. Materials 2020, 13, 3457. [Google Scholar] [CrossRef] [PubMed]
- Ngo, H.N.; Nishi, T.; Ohta, H. Measurement of Exothermic Values of Casting-sleeve Materials Using an Ice Calorimeter. ISIJ International 2023, 63(4), 679–684. [Google Scholar] [CrossRef]
- Trinh, N.Q.; Tashiro, S.; Tanaka, K.; Suga, T.; Kakizaki, T.; Yamazaki, K.; Morimoto, T.; Shimizu, H.; Lersvanichkool, A. Effects of Alkaline Elements on the Metal Transfer Behavior in Metal Cored Arc Welding. J. Manuf. Process. 2021, 68, 1448–1457. [Google Scholar] [CrossRef]
- Ding, F.; Xinglong, Y.; Yingjie, H.; Jiankang, H.; Dequan, L. ThestudyofarcbehaviorwithdifferentcontentofcoppervaporinGTAW. China Weld. 2022, 31, 1–14. [Google Scholar] [CrossRef]
- Mostaghimi-Tehrani, J.; Pfender, E. Effects of metallic vapor on the properties of an argon arc plasma. Plasma Chem. Plasma Process 1984, 4, 129–139. [Google Scholar] [CrossRef]
- Myamlin, S.; Dailidka, S.; Neduzha, L. Mathematical modeling of a cargo locomotive. In Proceedings of the 16th International Conference on Transport Means, Kaunas, Lithuania, 25–26 October 2012; pp. 310–312. [Google Scholar]
- Lunys, O.; Neduzha, L.; Tatarinova, V. Stability research of the main-line locomotive movement. In Proceedings of the 23rd International Conference Transport Means, Palanga, Lithuania, 2–4 October 2019; pp. 1341–1345. [Google Scholar]
- Bondarenko, I.; Severino, A.; Olayode, I.O.; Campisi, T.; Neduzha, L. Dynamic Sustainable Processes Simulation to Study Transport Object Efficiency. Infrastructures 2022, 7, 124. [Google Scholar] [CrossRef]
- Goolak, S.; Riabov, I.; Petrychenko, O.; Kyrychenko, M.; Pohosov, O. The simulation model of an induction motor with consideration of instantaneous magnetic losses in steel. Advances in Mechanical Engineering 2025, 17(2), 16878132251320236. [Google Scholar] [CrossRef]
- Goolak, S.; Riabov, I.; Tkachenko, V.; Sapronova, S.; Rubanik, I. Model of pulsating current traction motor taking into consideration magnetic losses in steel. Electrical Engineering & Electromechanics 2021, 6, 11–17. [Google Scholar] [CrossRef]
- Klimenko, I.; Kalivoda, J.; Neduzha, L. Influence of Parameters of Electric Locomotive on its Critical Speed. In TRANSBALTICA XI: Transportation Science and Technology. TRANSBALTICA 2019. Lecture Notes in Intelligent Transportation and Infrastructure; Gopalakrishnan, K., Prentkovskis, O., Jackiva, I., Junevičius, R., Eds.; Springer: Cham, 2020; pp. 531–540. [Google Scholar] [CrossRef]
- Riabov, I.; Goolak, S.; Neduzha, L. An Estimation of the Energy Savings of a Mainline Diesel Locomotive Equipped with an Energy Storage Device. Vehicles 2024, 6, 611–631. [Google Scholar] [CrossRef]
- Ulbrich, D.; Kowalczyk, J.; Josko, M.; Sawczuk, W.; Chudyk, P. Assessment of selected properties of varnish coating of motor vehicles. Coatings 2021, 11, 1320. [Google Scholar] [CrossRef]
- Shatskyi, I.; Makoviichuk, M.; Ropyak, L. Planede formation of contrast layered coating under local load. Procedia Struct Integr 2024, 59, 407–412. [Google Scholar] [CrossRef]
- Dalyak, T.M..; Shatsky, I.P. On brittle fracture of a body with partial healed star-shaped crack. Bull Taras Shevchenko Natl Univ Kyiv Phys Math Sci 2023, 2, 100–103. [Google Scholar] [CrossRef]
- Dutkiewicz, M.; Dalyak, T.; Shatskyi, I.; Venhrynyuk, T.; Velychkovych, A. Stress analysis in damaged pipe line with composite coating. Appl Sci 2021, 11, 10676. [Google Scholar] [CrossRef]
- Luzan, S.A.; Sidashenko, A.I.; Luzan, A.S. Composite material for hardening of tillage machines working bodies containing titanium and chromium borides synthesized using shs-process. MetallofizikaiNoveishieTekhnologii 2020, 42(4), 541–552. [Google Scholar] [CrossRef]
- Luzan, S.A.; Bantkovskiy, V.A. Structure and Tribotechnical Properties of Deposited Composite Layers Based on PG 10N-01 Alloy Containing AL2O3. Mater. Sci. 2023, 59, 328–334. [Google Scholar] [CrossRef]
Figure 1.
Main effects diagram for signal-to-noise ratio for melting characteristics:(a) Melt-off rate (MOR); (b) Deposition rate (DR); (c) Spattering factor (SF); (d) Deposition efficiency (De).
Figure 1.
Main effects diagram for signal-to-noise ratio for melting characteristics:(a) Melt-off rate (MOR); (b) Deposition rate (DR); (c) Spattering factor (SF); (d) Deposition efficiency (De).
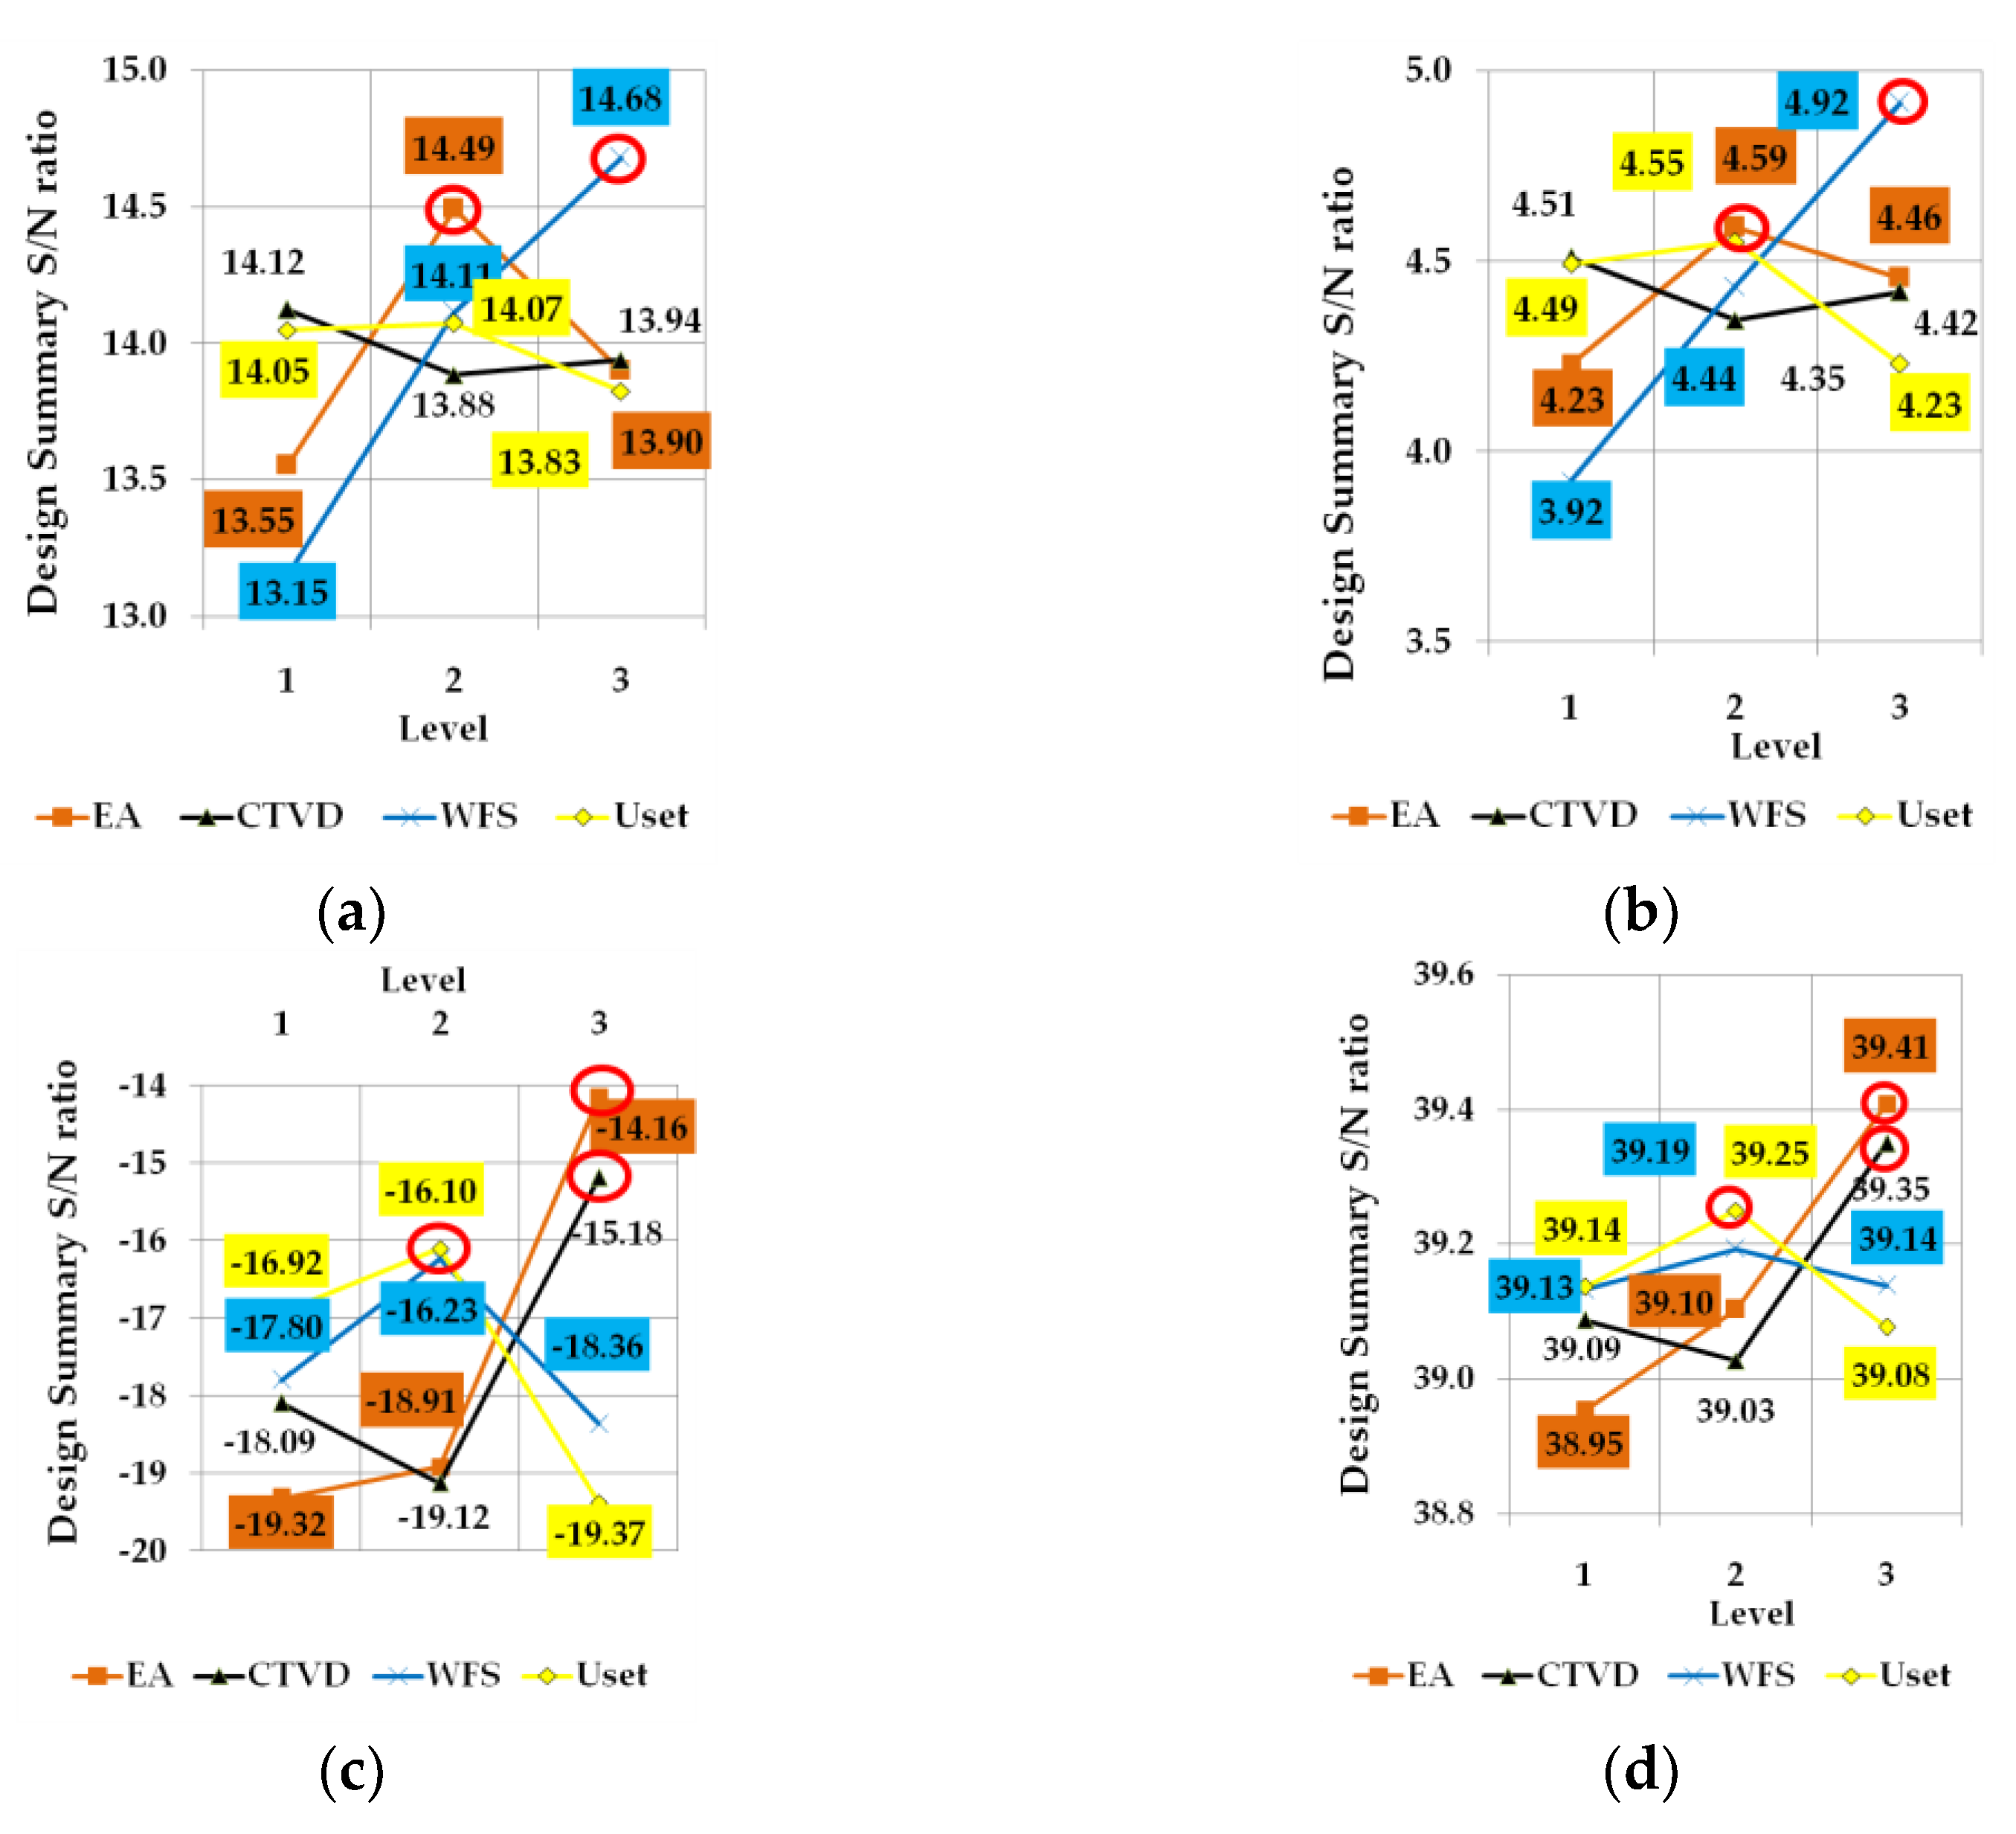
Figure 2.
(a) Radar graph showing the interaction between factors of for melting characteristics and pie charts showing the contribution of variables to the melting characteristics studied: (b) Melt-off rate (MOR); (c) Deposition rate (DR); (d) Spattering factor (SF); (e) Deposition efficiency (De).
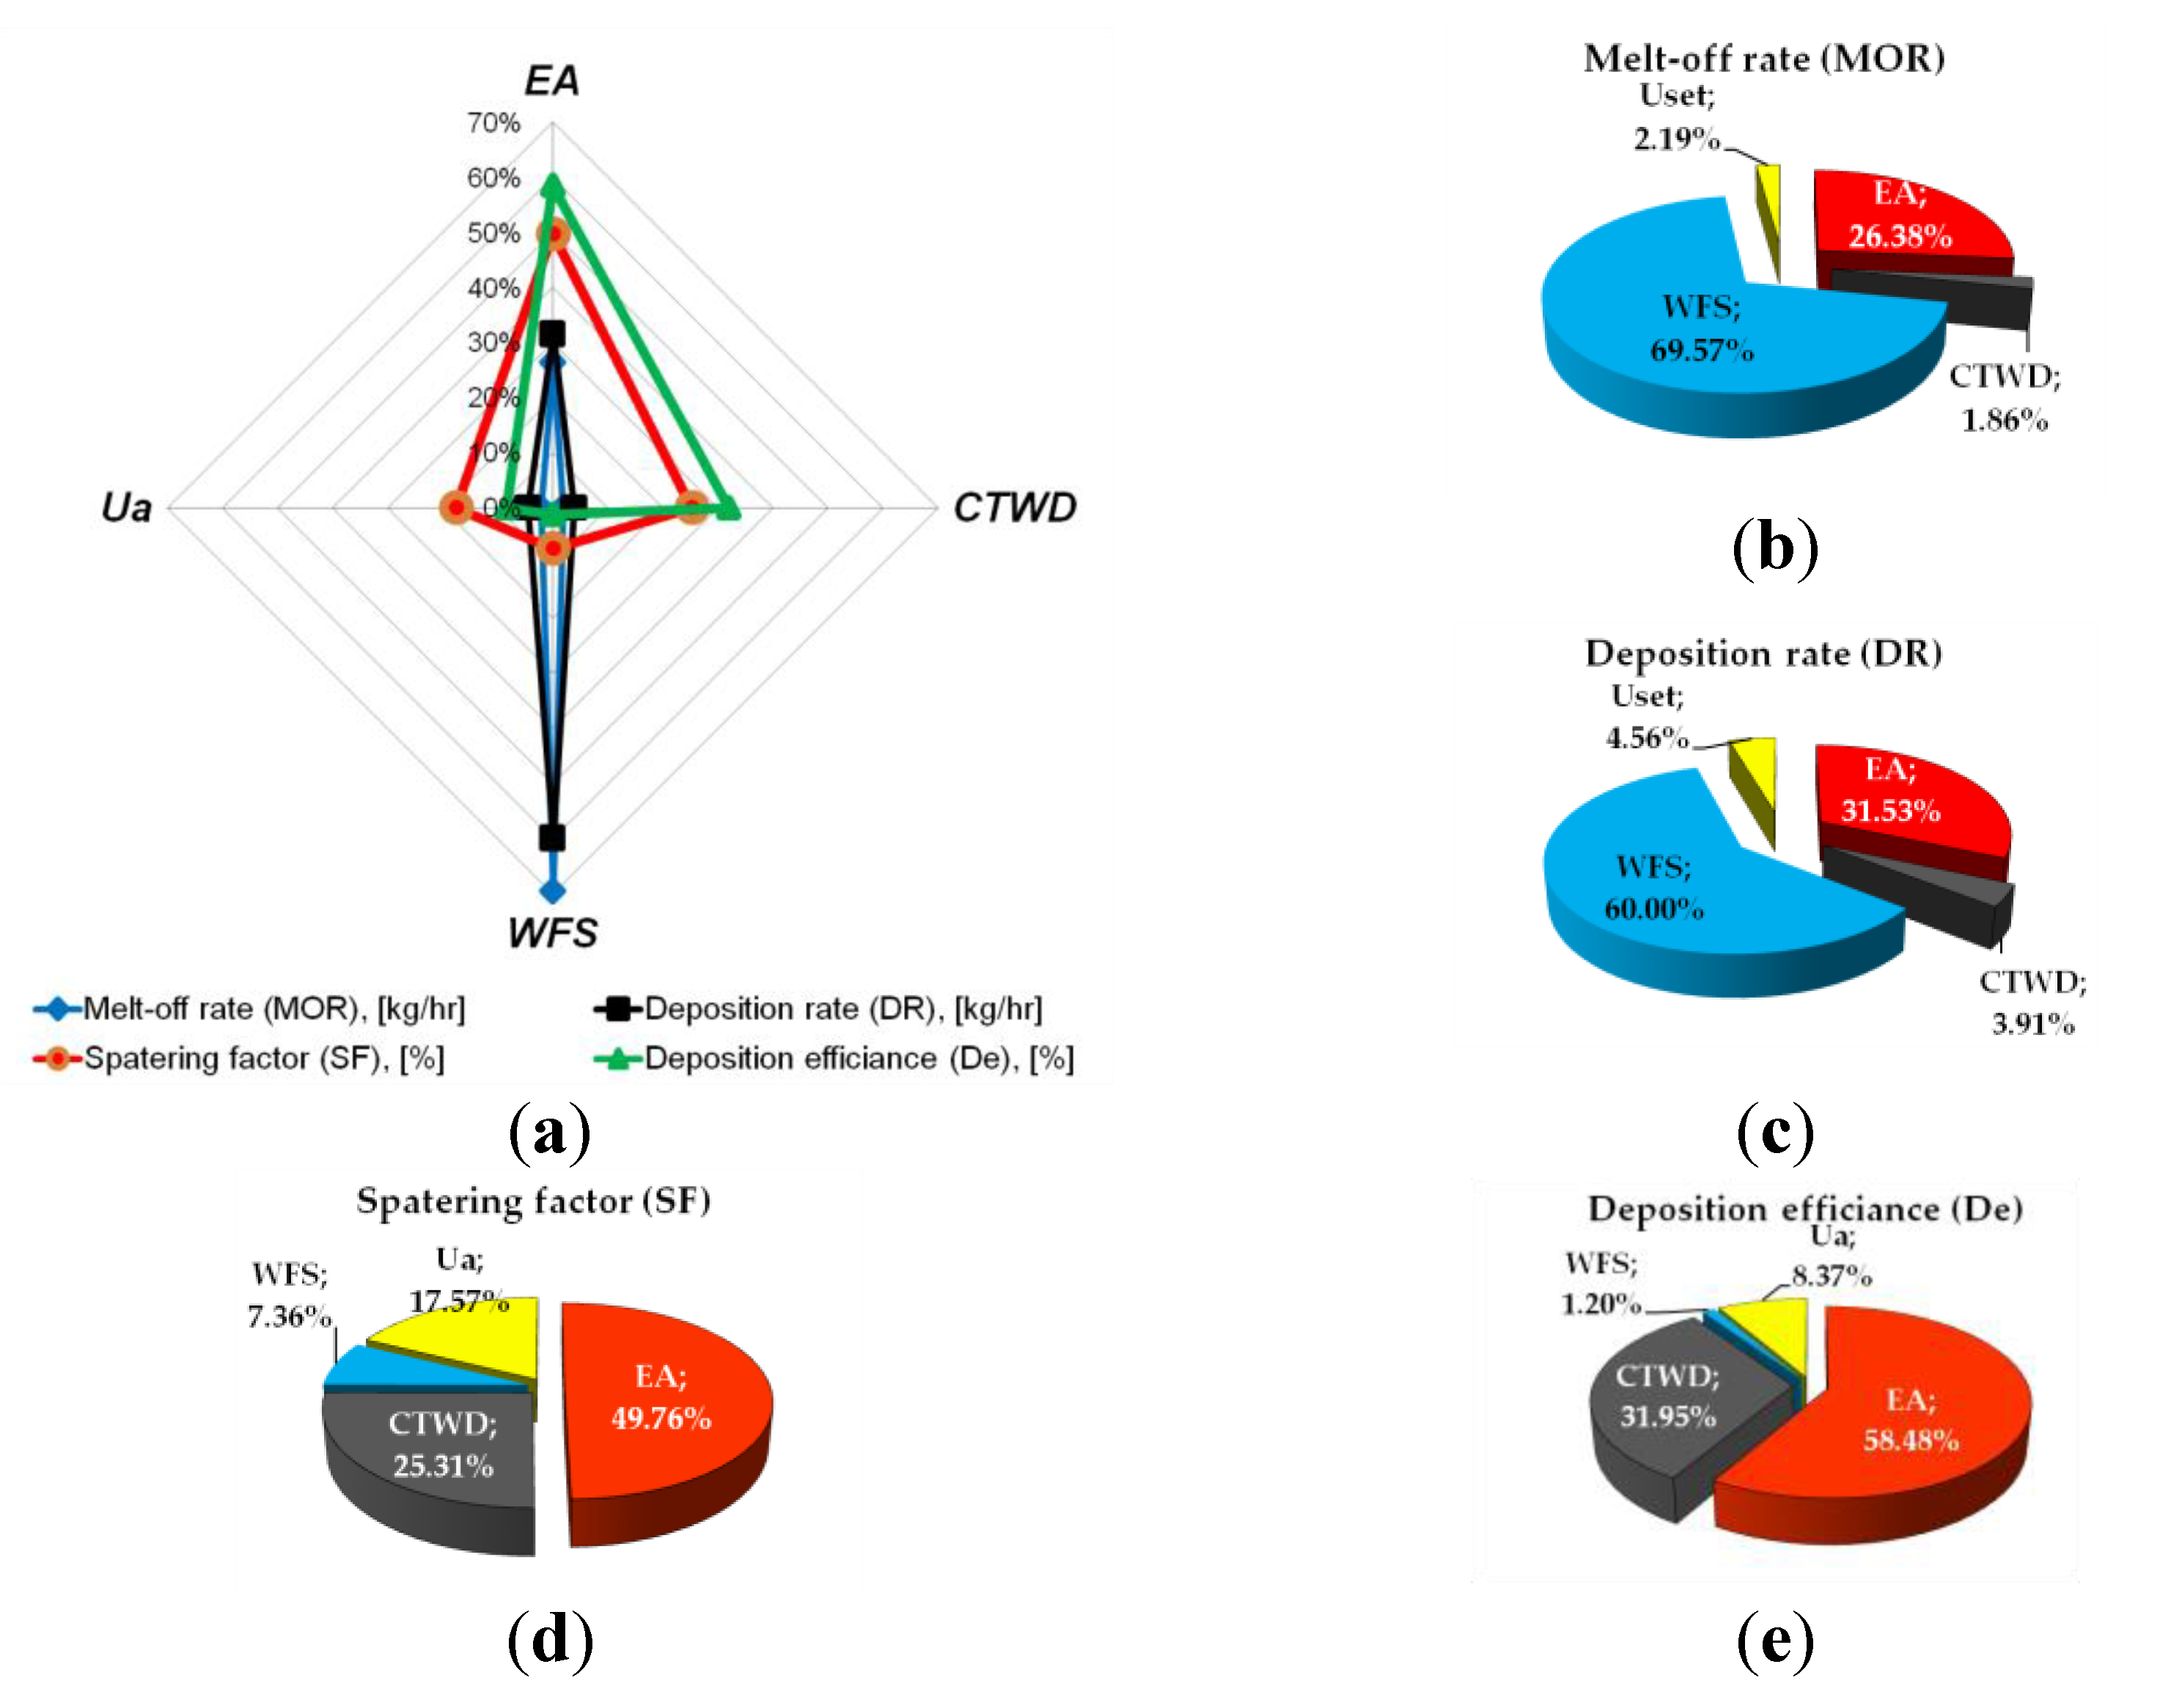
Figure 3.
Predicted and observed values of the dependent variable for melting characteristics: (a) Melt-off rate (MOR); (b) Deposition rate (DR); (c) Spattering factor (SF); (d) Deposition efficiency (De).
Figure 3.
Predicted and observed values of the dependent variable for melting characteristics: (a) Melt-off rate (MOR); (b) Deposition rate (DR); (c) Spattering factor (SF); (d) Deposition efficiency (De).
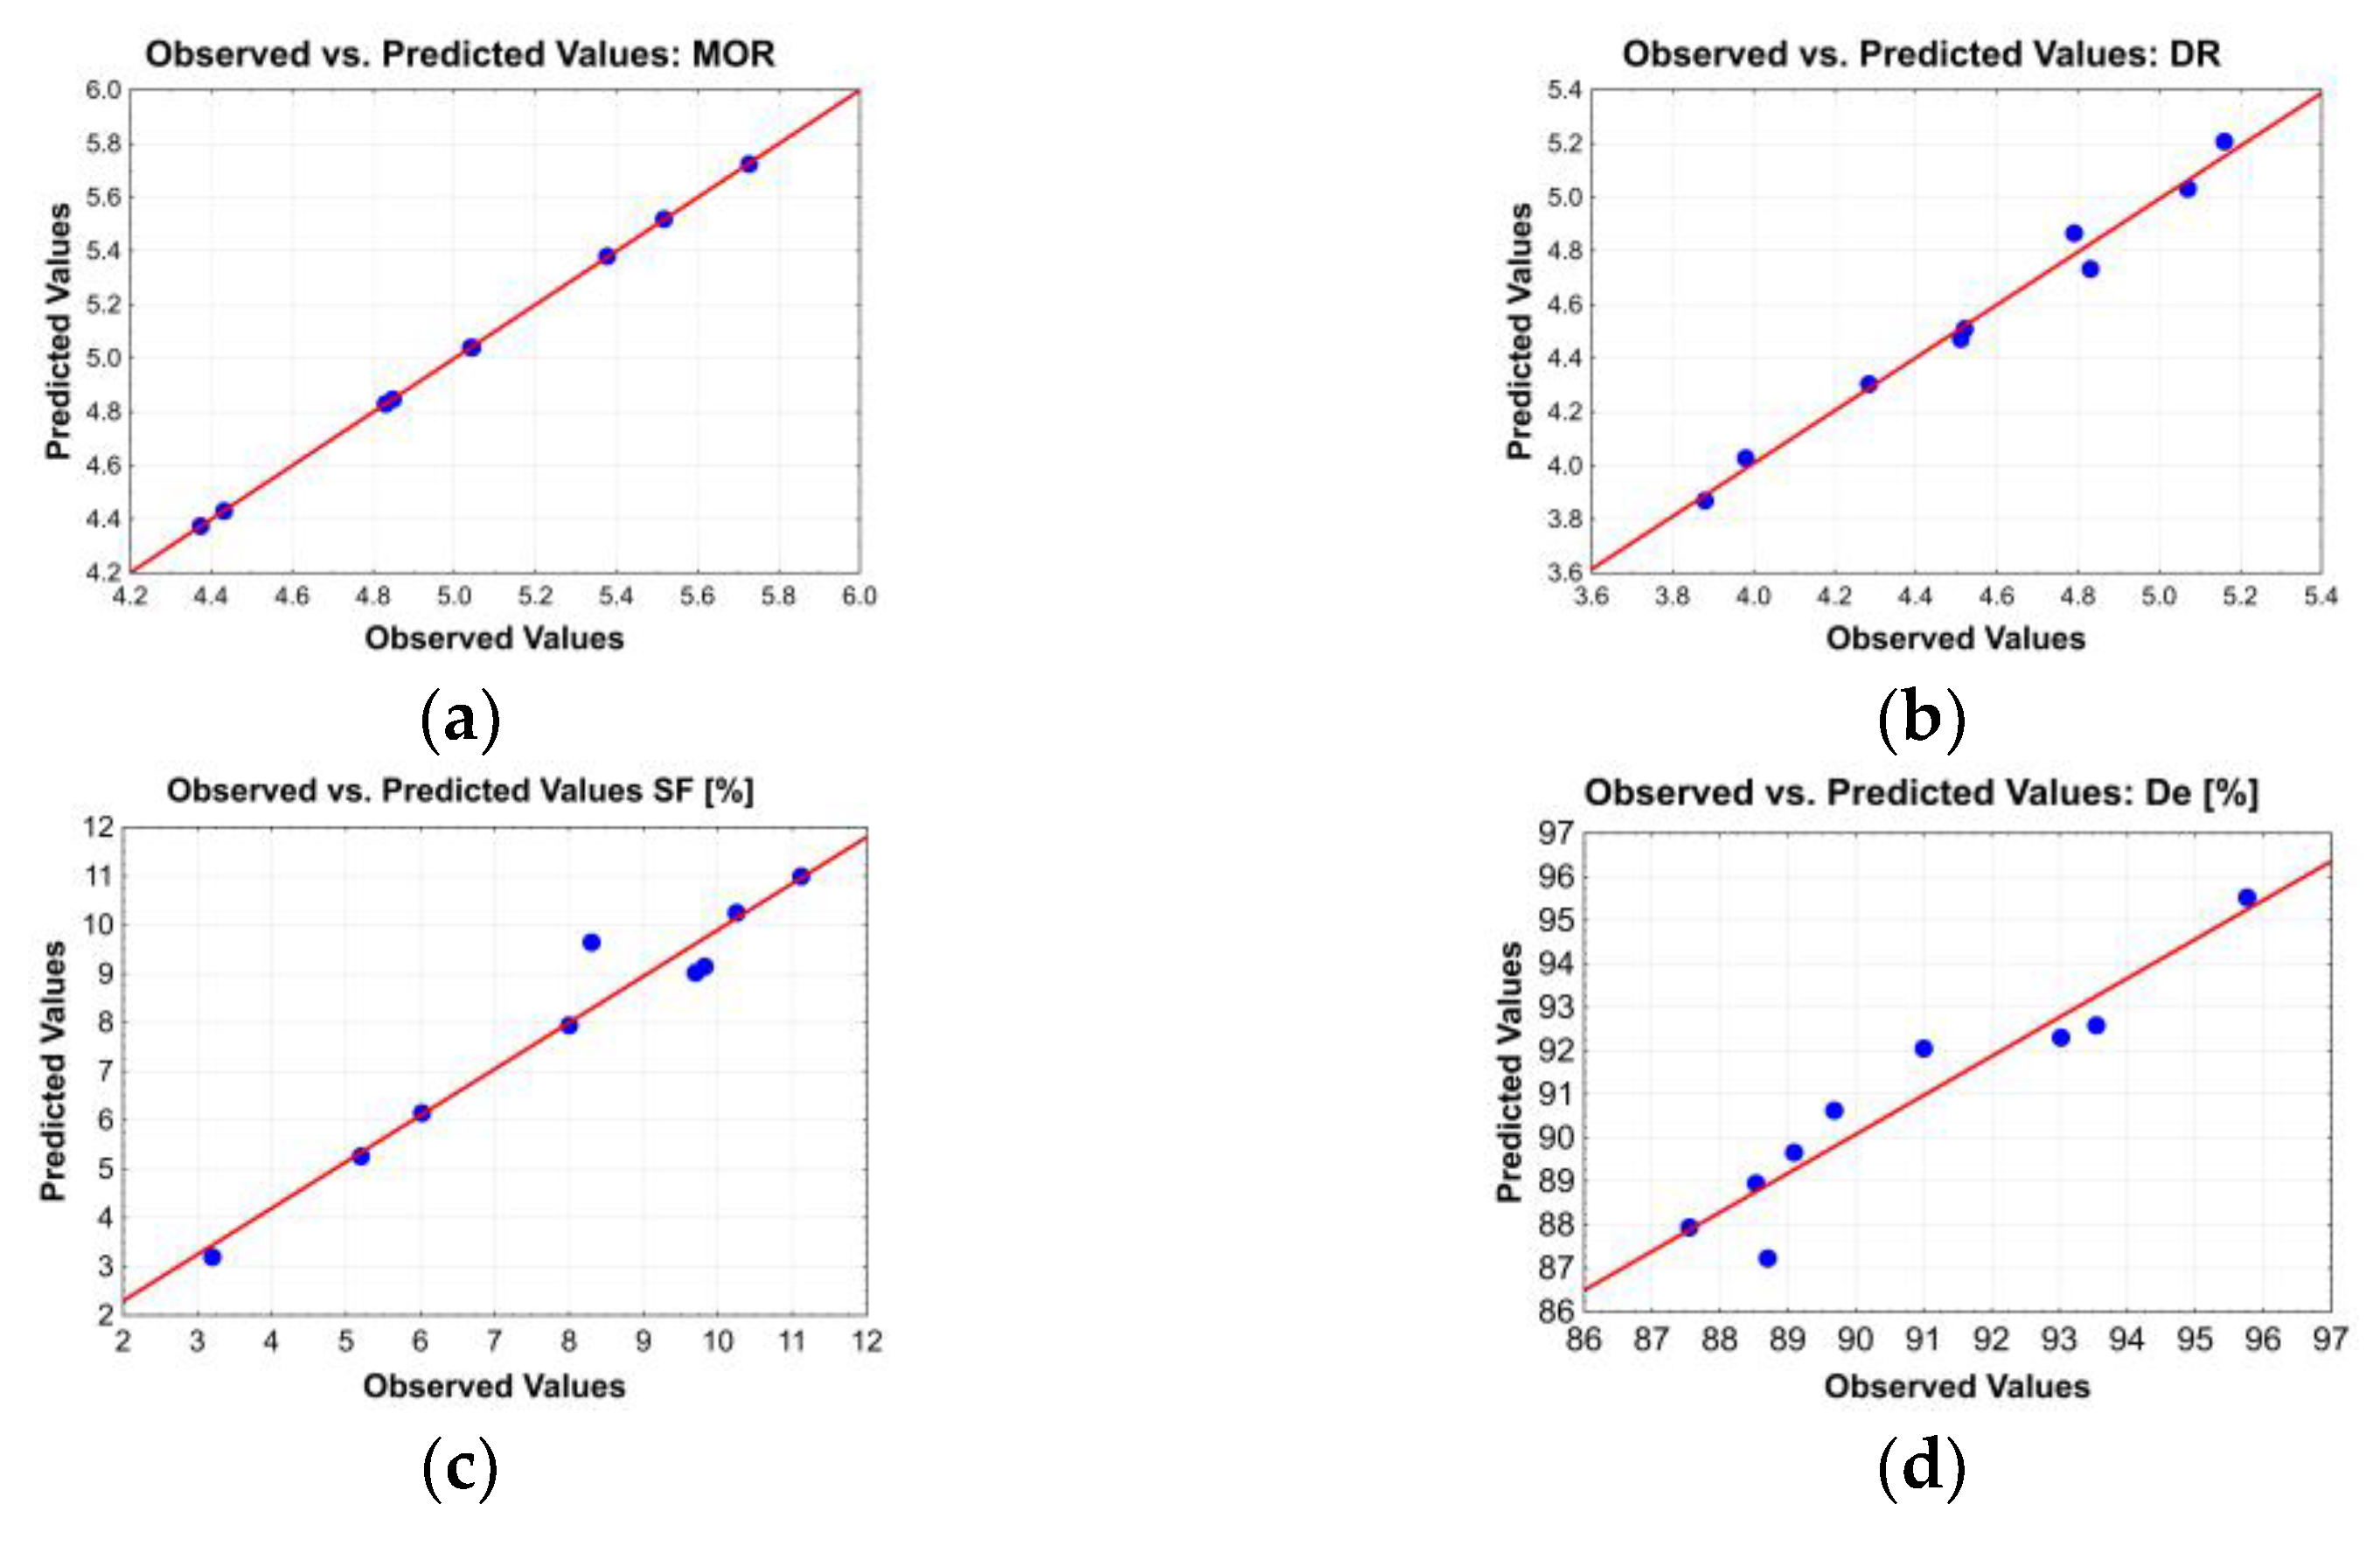
Figure 4.
Pareto chart of the influence of the terms of the equations for the most significant variables, for melting characteristics: (a) Melt-off rate (MOR); (b) Deposition rate (DR); (c) Spattering factor (SF); (d) Deposition efficiency (De).
Figure 4.
Pareto chart of the influence of the terms of the equations for the most significant variables, for melting characteristics: (a) Melt-off rate (MOR); (b) Deposition rate (DR); (c) Spattering factor (SF); (d) Deposition efficiency (De).
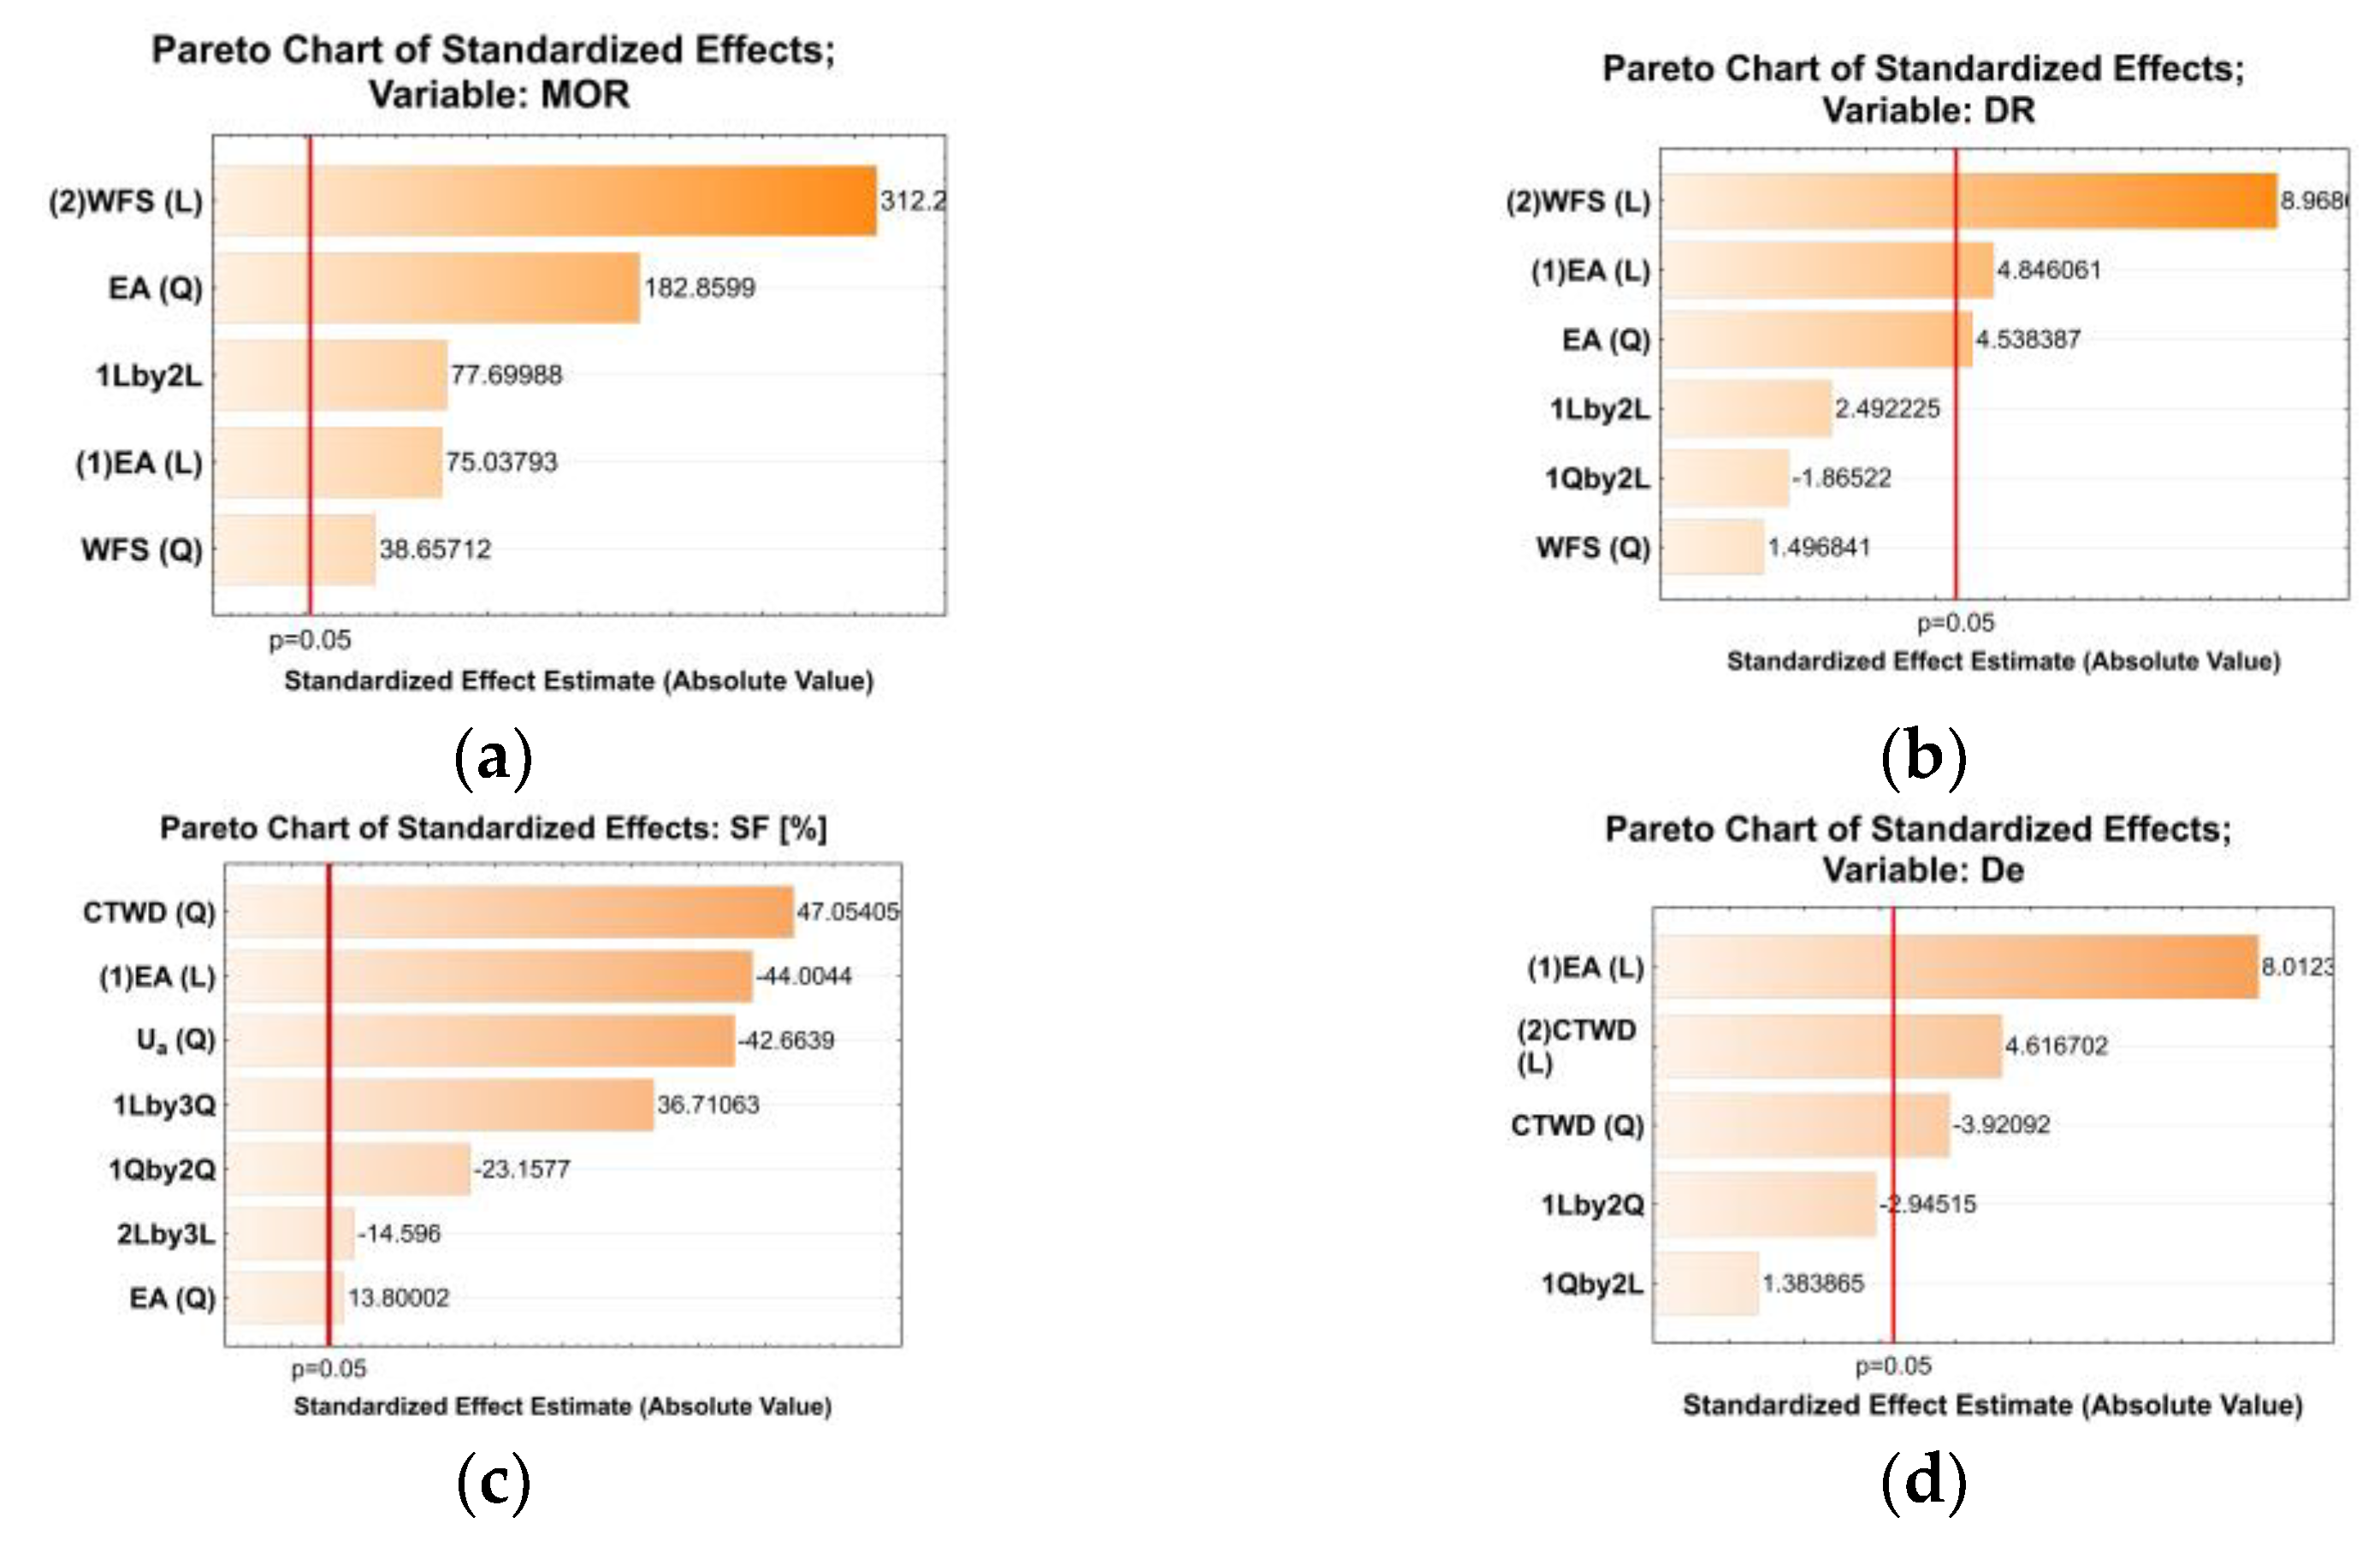
Figure 5.
Response surfaces plot for (a) the melt-off rate (MOR)and (b) for the deposited rate (DR) and (b) the deposition efficiency (De).
Figure 5.
Response surfaces plot for (a) the melt-off rate (MOR)and (b) for the deposited rate (DR) and (b) the deposition efficiency (De).
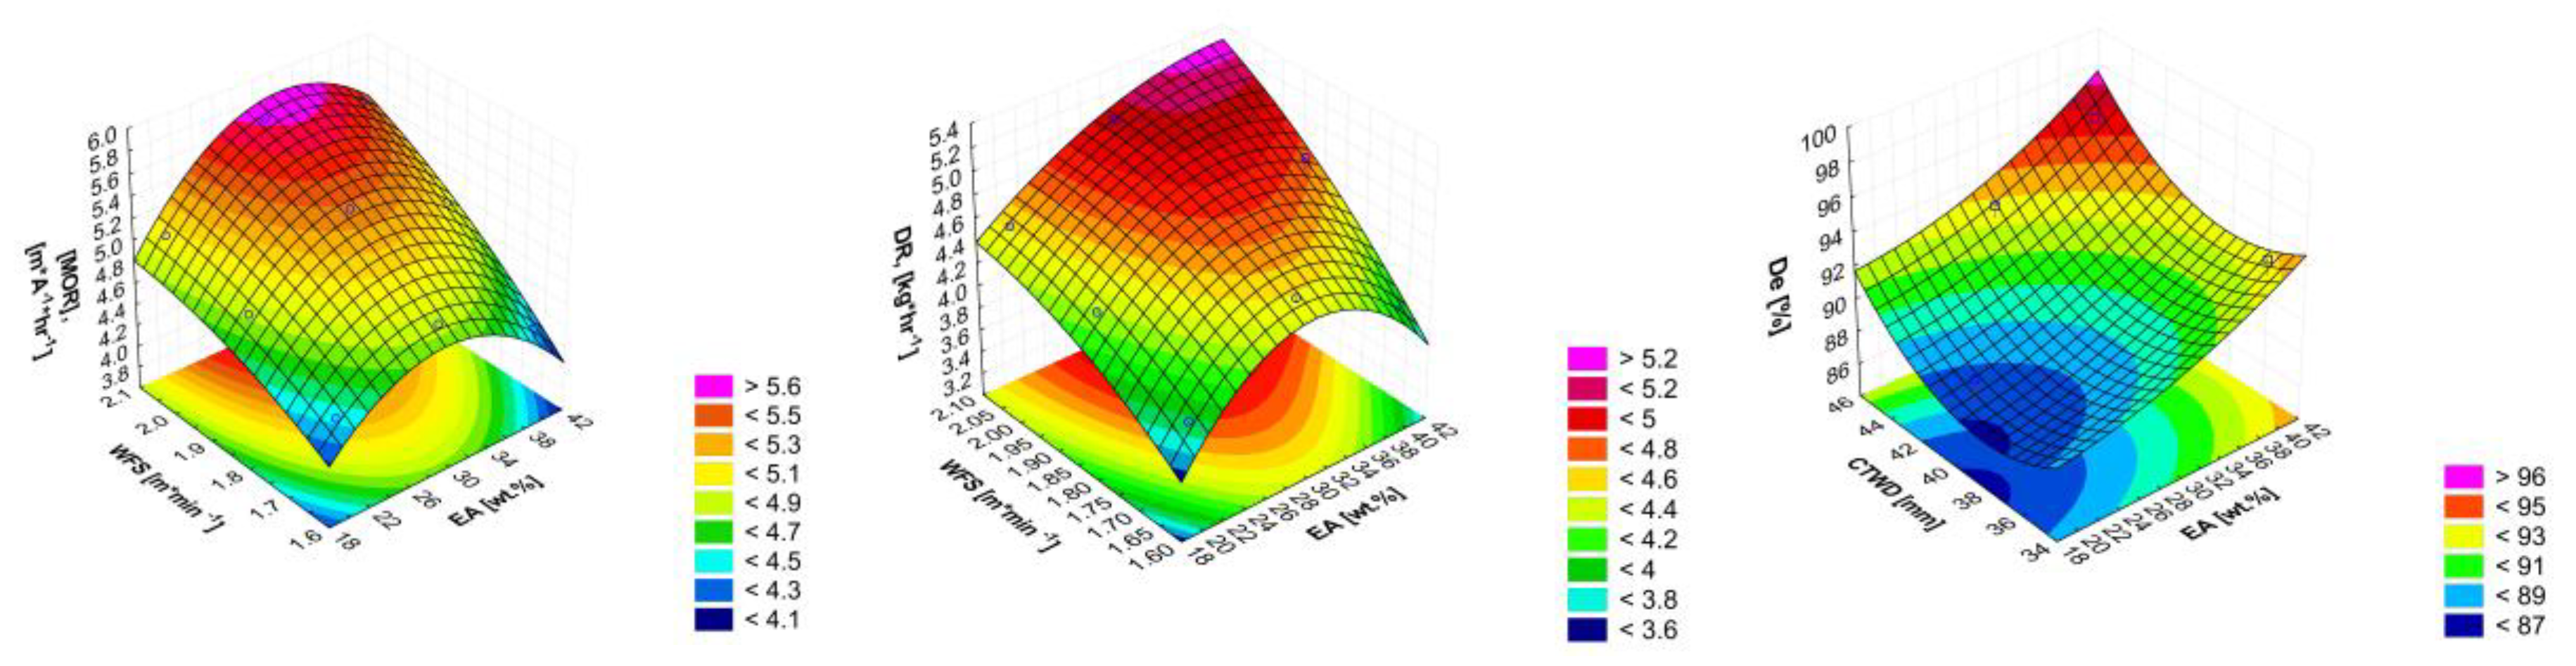
Figure 6.
Response surface with three slump levels for spattering factor (SF): (a) high of percentage of exothermic mixture in the core filler (EA=38 wt.%), (b) high of contact tip-to-work distance (CTWD=45 mm) and (c) medium of set voltage on the power source (Uset =31 V).
Figure 6.
Response surface with three slump levels for spattering factor (SF): (a) high of percentage of exothermic mixture in the core filler (EA=38 wt.%), (b) high of contact tip-to-work distance (CTWD=45 mm) and (c) medium of set voltage on the power source (Uset =31 V).
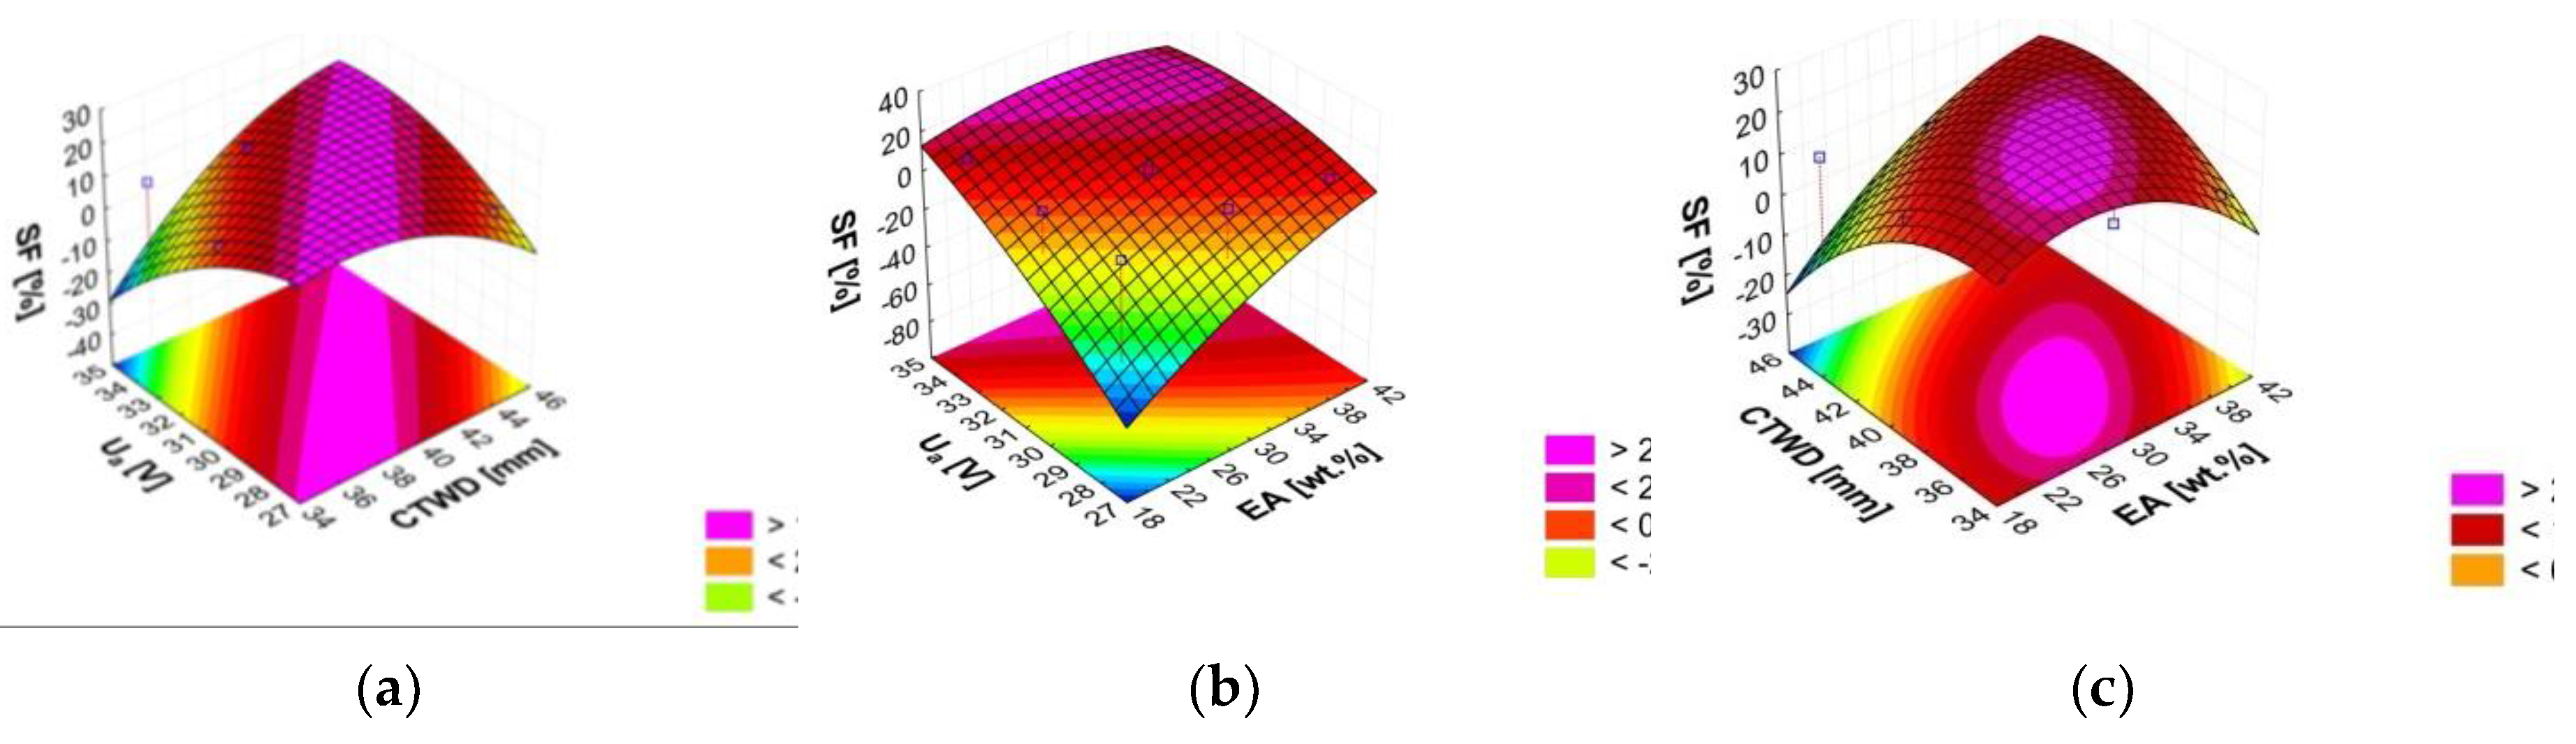
Figure 7.
Photograph of the bead profile in cross-section for 9 samples, for different experiments: Sampel 1.
Figure 7.
Photograph of the bead profile in cross-section for 9 samples, for different experiments: Sampel 1.
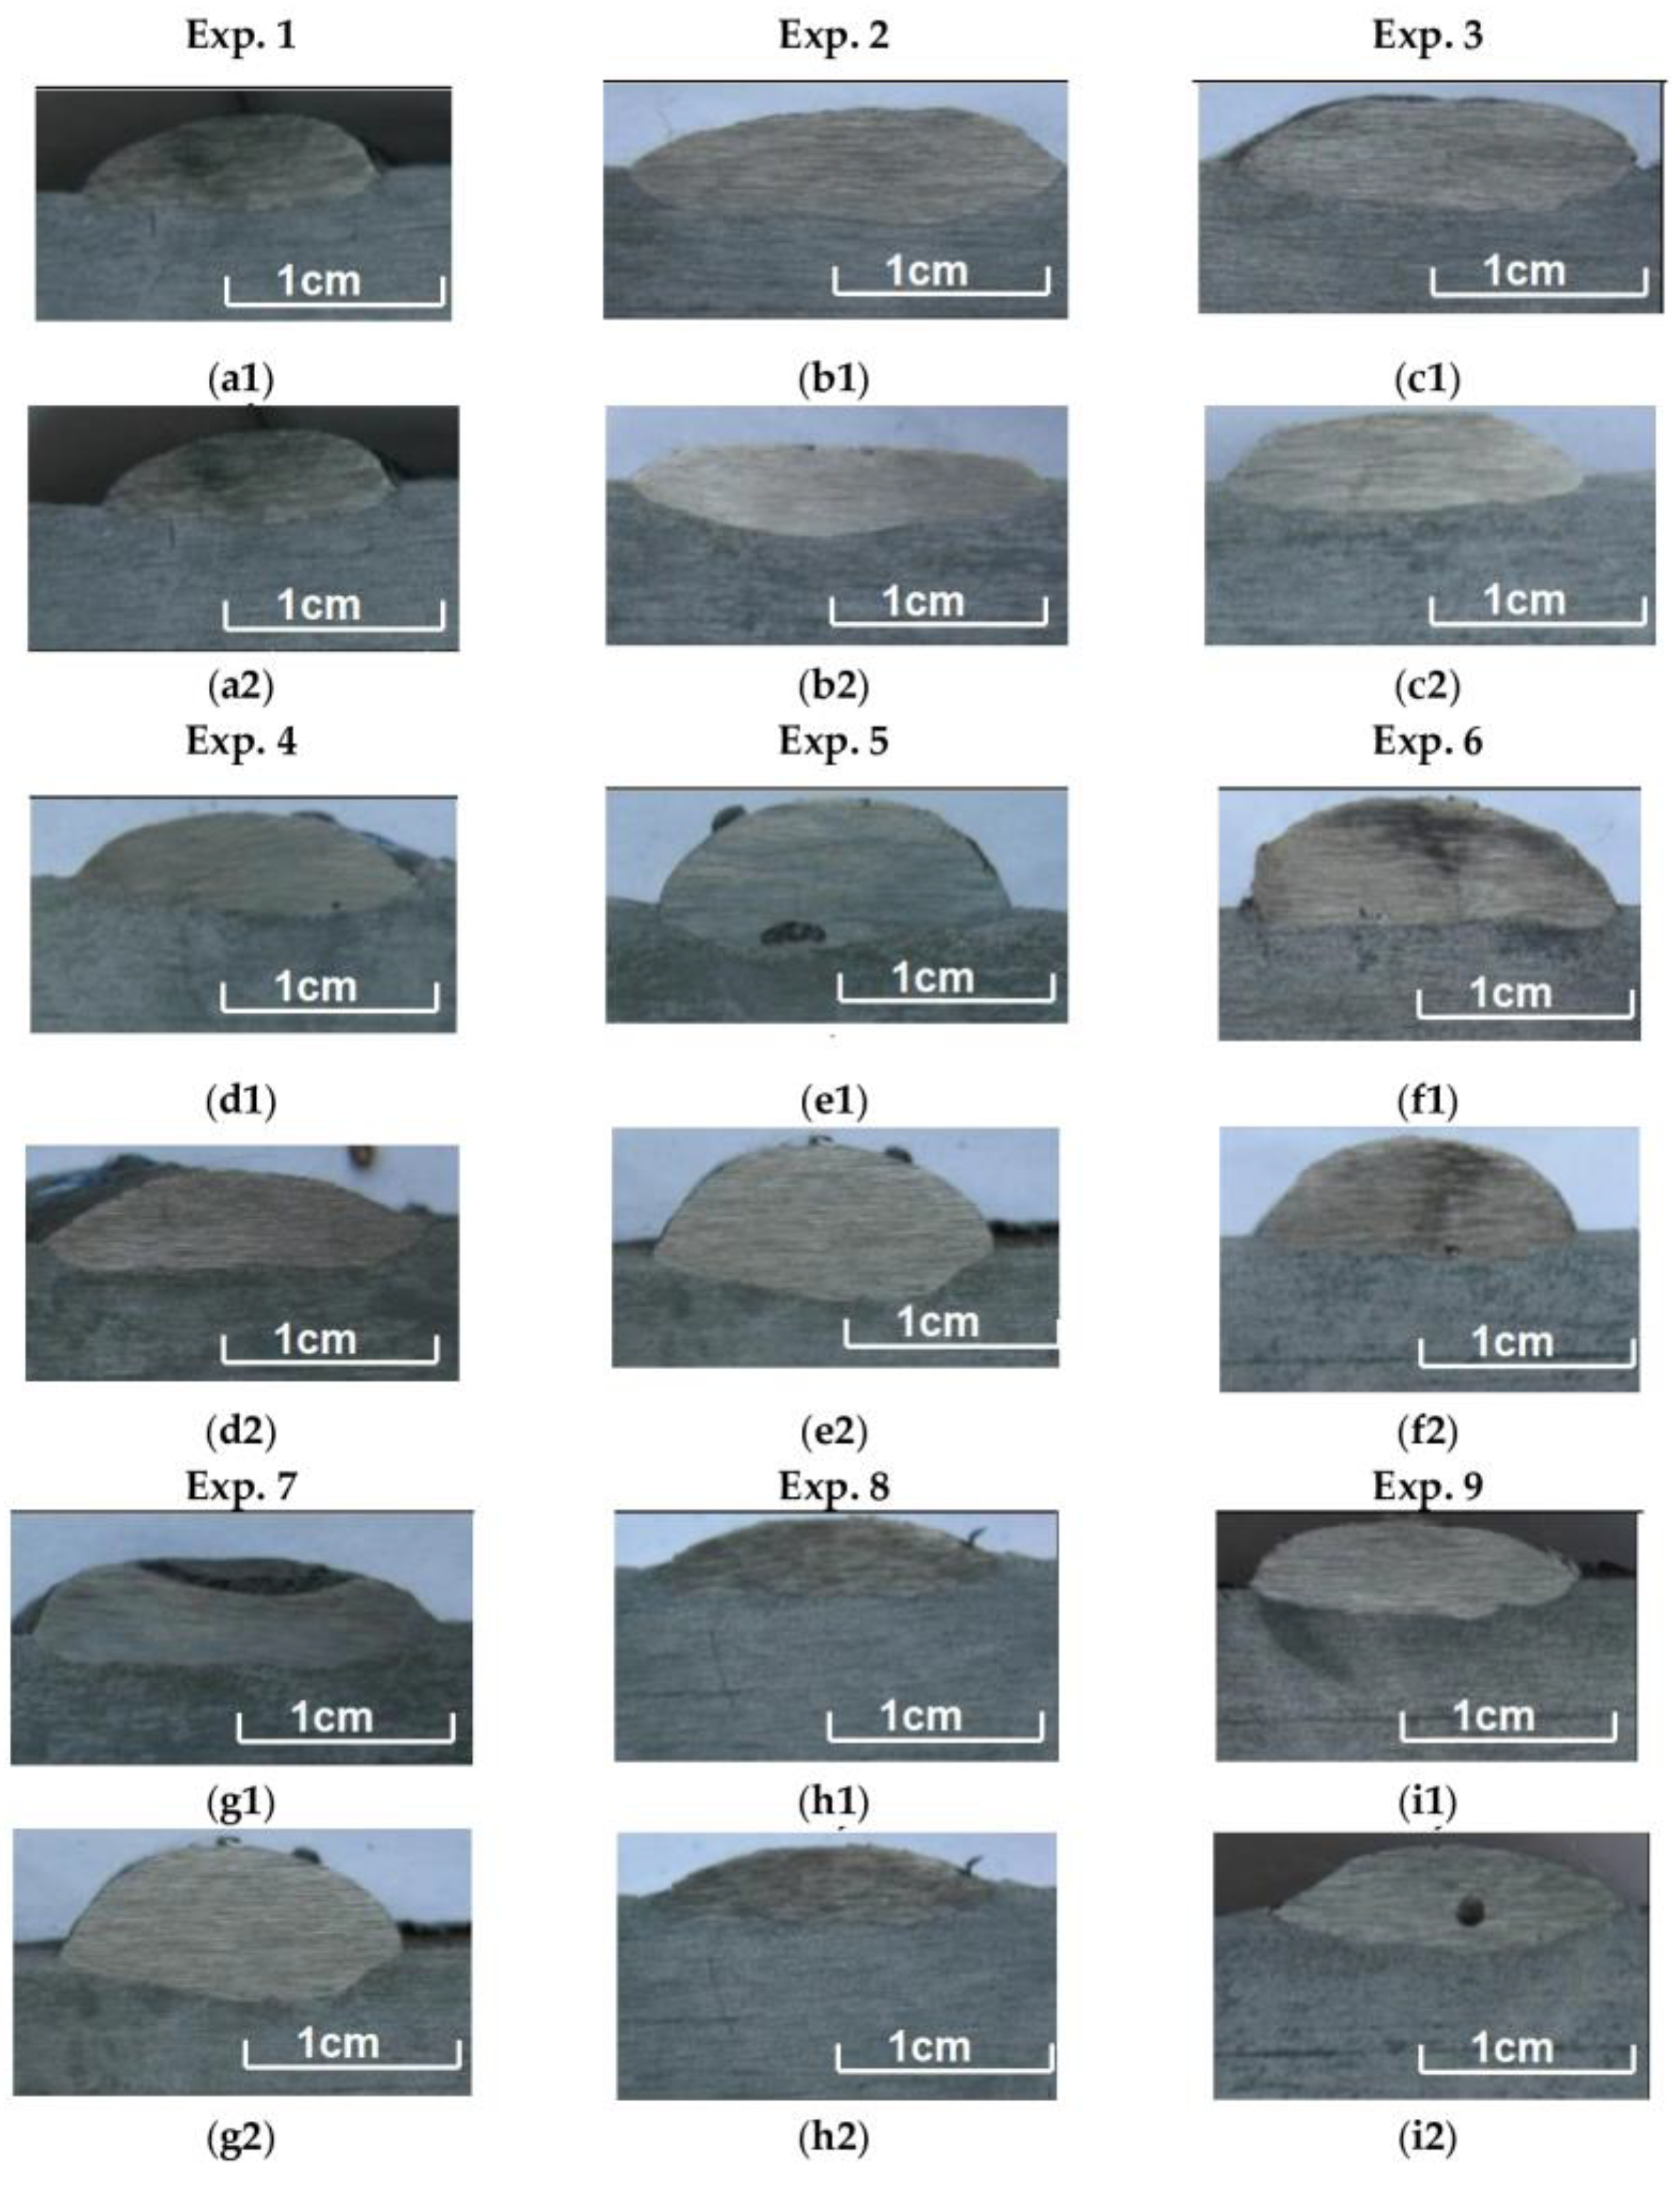
Figure 8.
Main effects diagram for signal-to-noise ratio for melting characteristics: (a) Width bead (WB); (b) Top high of reinforcement (THR); (c) Bottom depth of penetration (DP); (d) Cross-sectional area of reinforcement (Ar); (e) Cross-sectional area of penetration (Ap) and (f) Dilution variation (Dv).
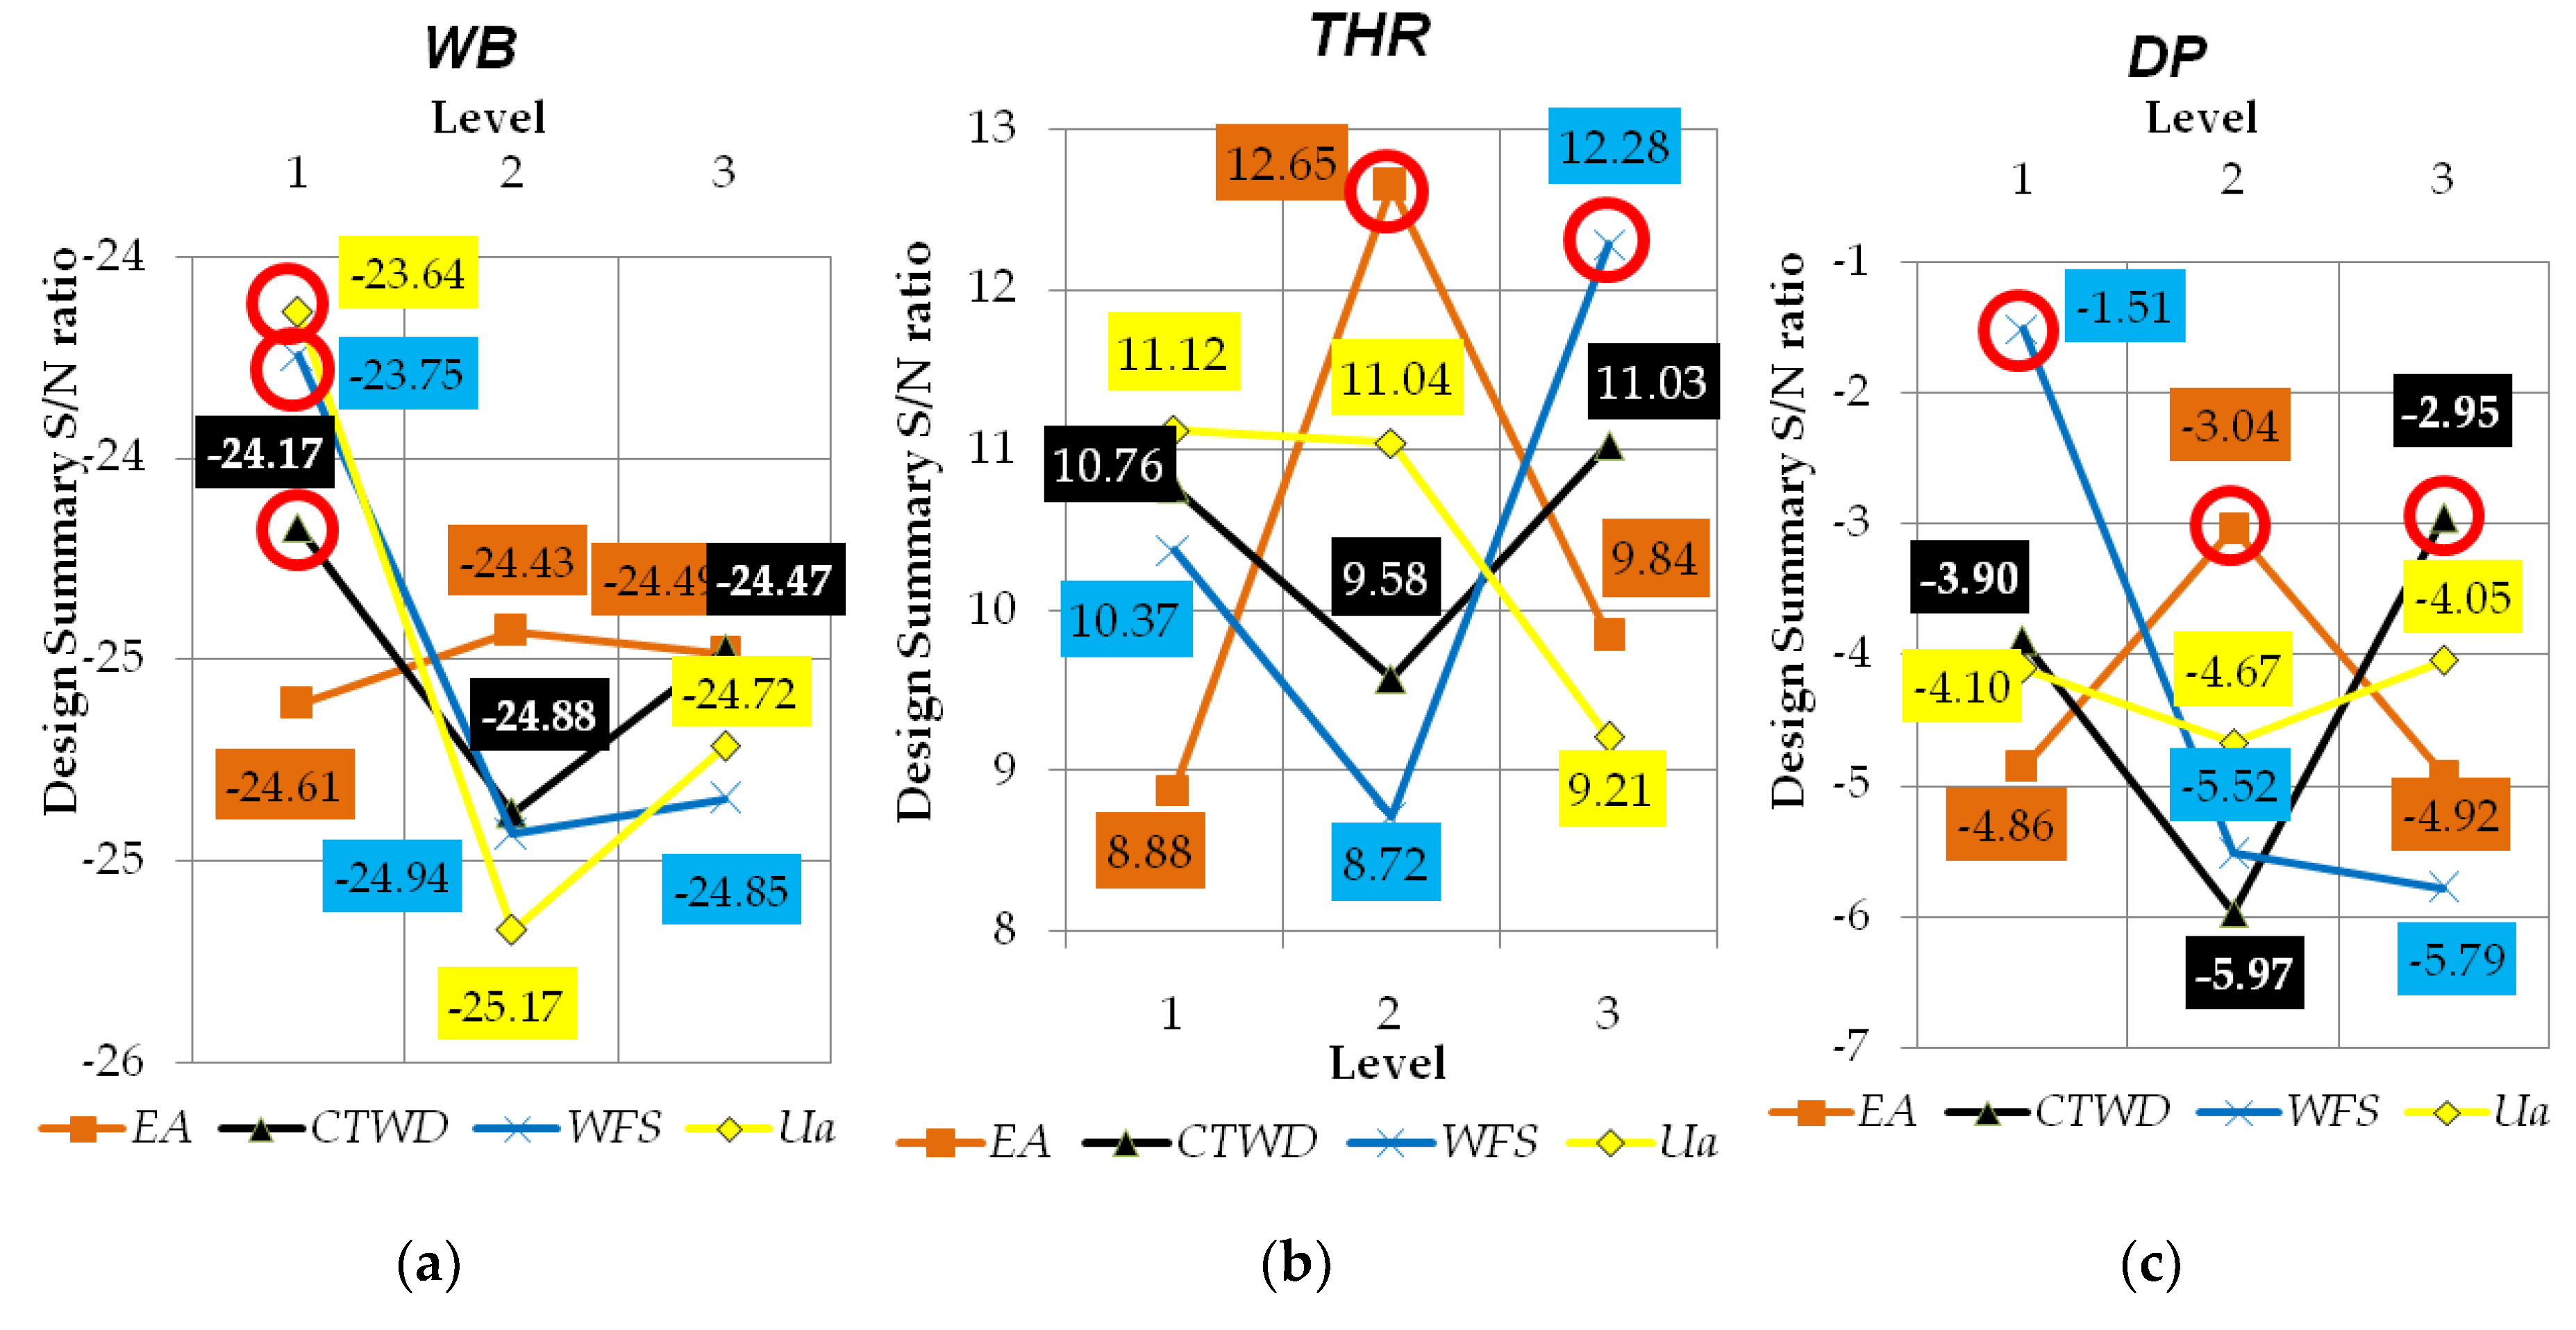
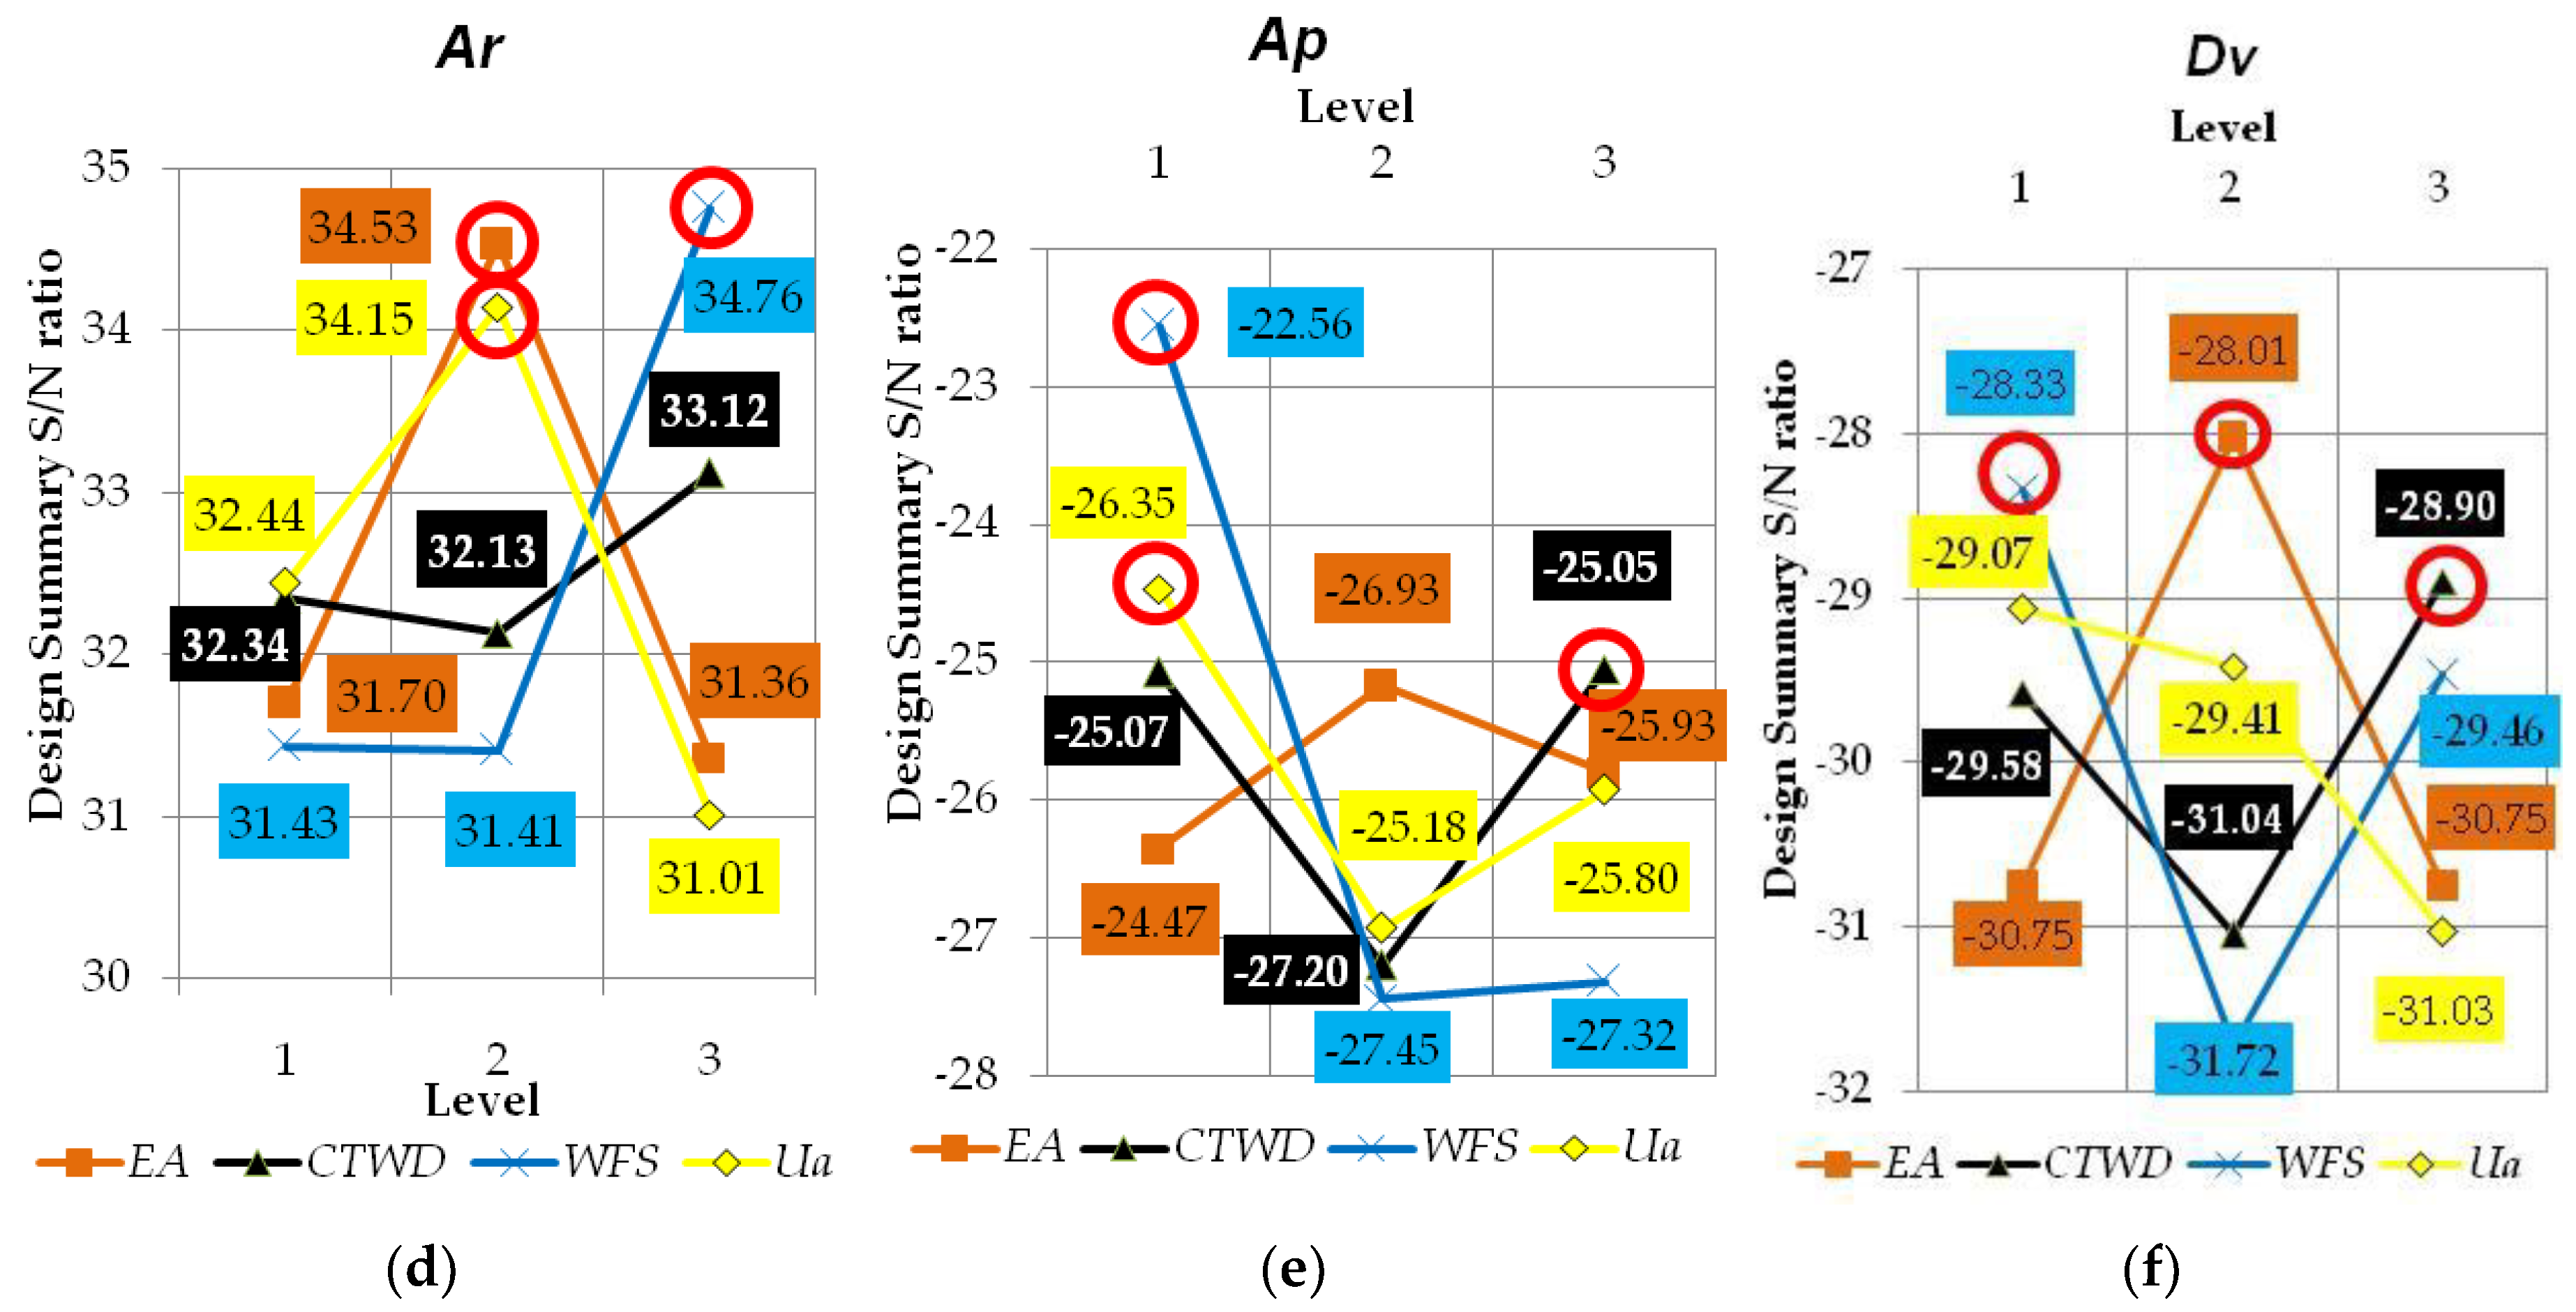
Figure 9.
(a) Radar graph showing the interaction between factors of for melting characteristics and pie charts showing the contribution of variables to the melting characteristics studied: (b) Width bead (WB); (c) Top high of reinforcement (THR); (d) Bottom depth of penetration (DP); (e) Cross-sectional area of reinforcement (Ar); (f) Cross-sectional area of penetration (Ap) and (g) Dilution variation (Dv).
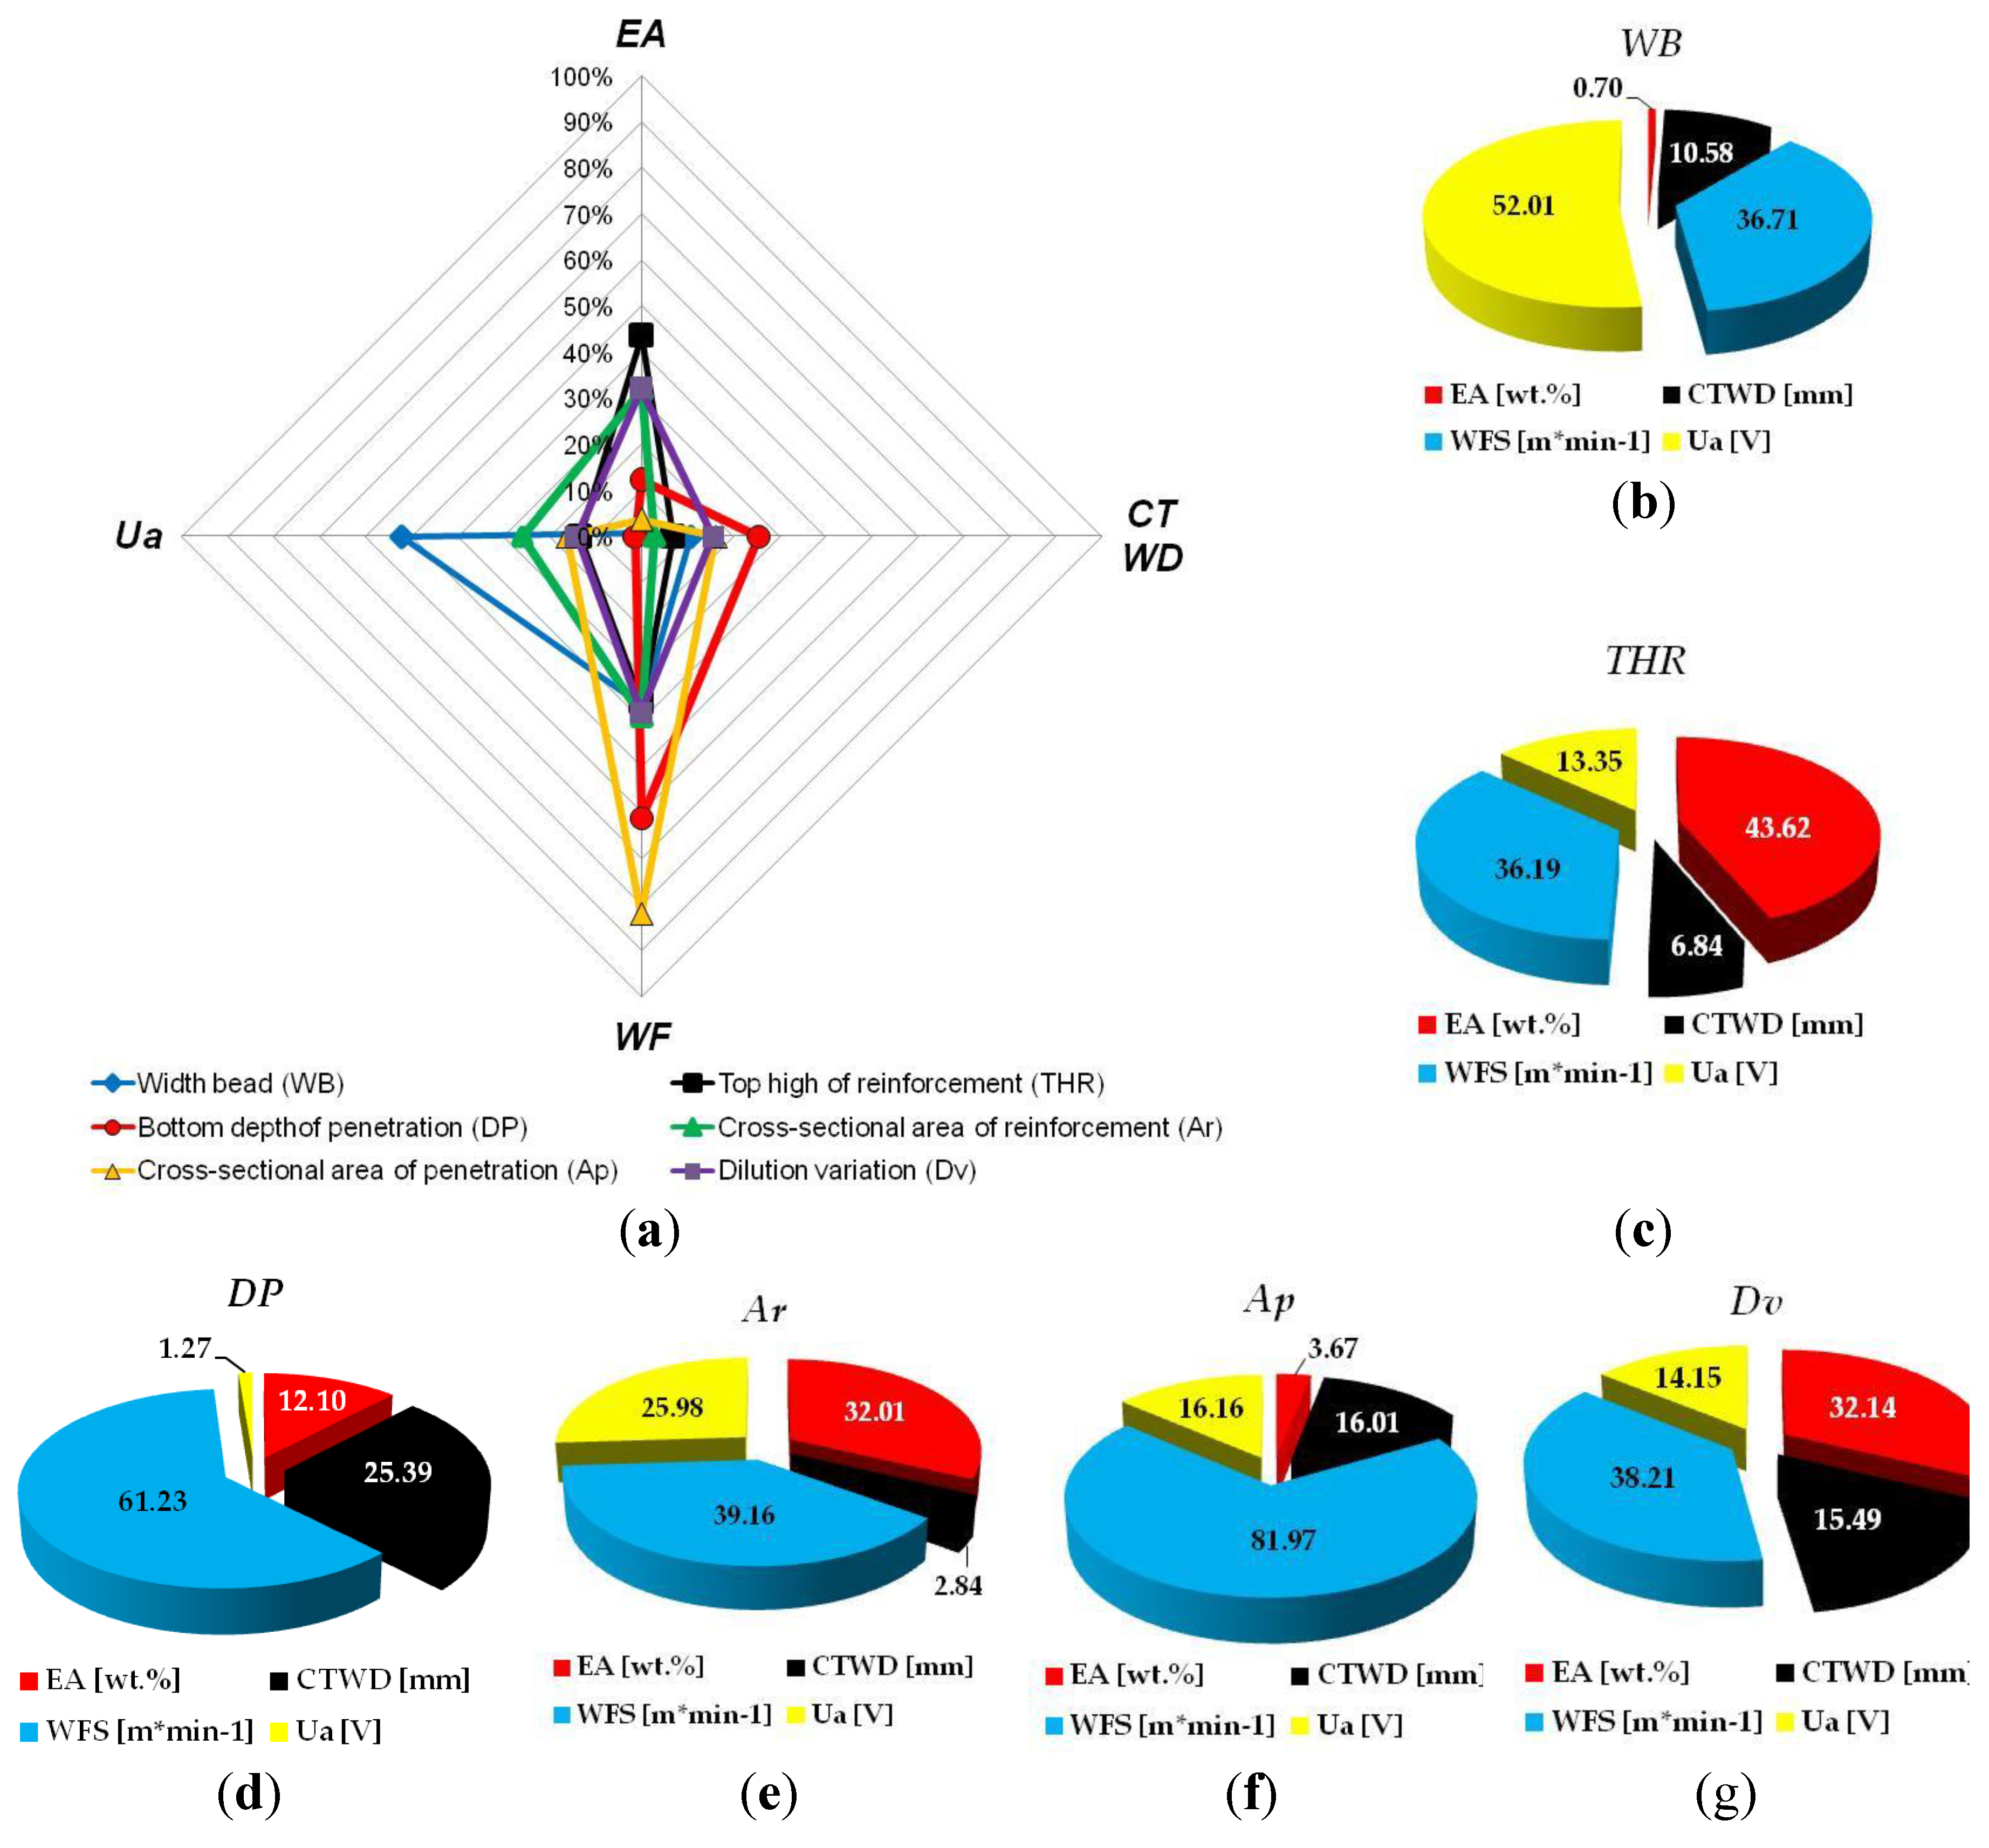
Figure 10.
Predicted and observed values of the dependent variable for weld bead morphology parameters: (a) Width bead (WB); (b) Top high of reinforcement (THR); (c) Bottom depth of penetration (DP); (d) Cross-sectional area of reinforcement (Ar); (e) Cross-sectional area of penetration (Ap) and (f) Dilution variation (Dv).
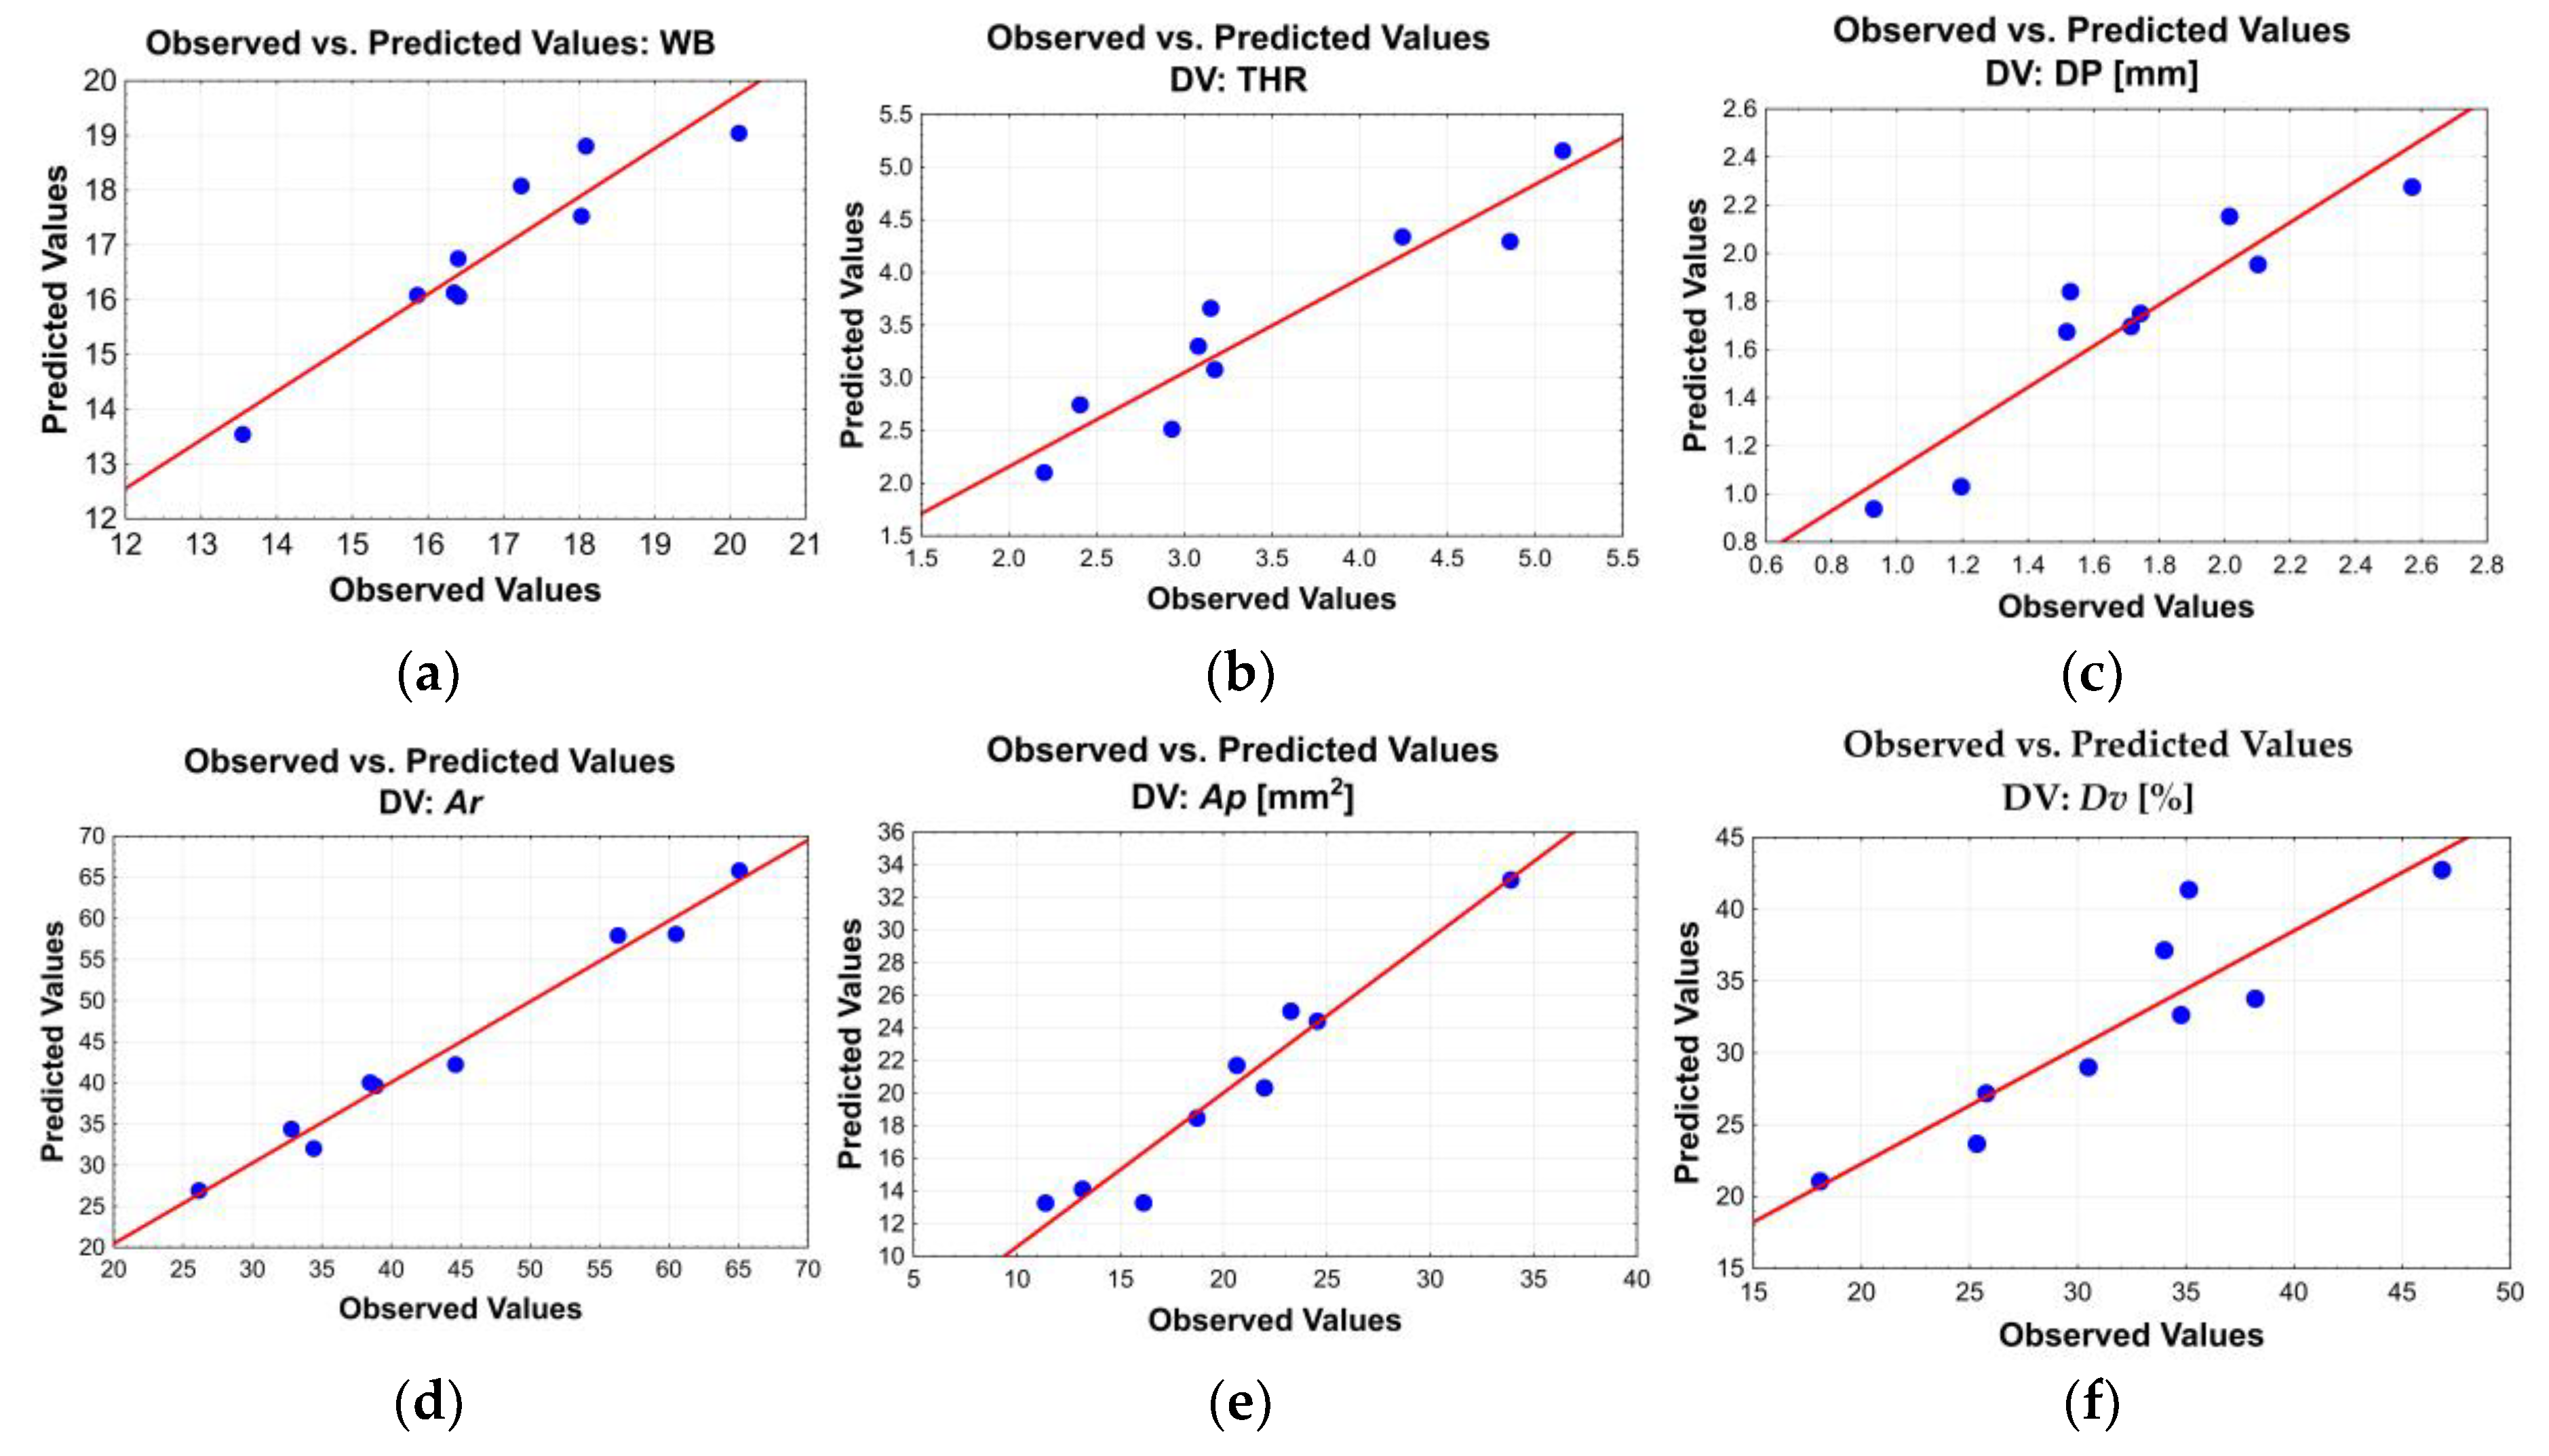
Figure 11.
Pareto chart of the influence of the terms of the equations for the most significant variables, for weld bead morphology parameters: (a) Width bead (WB); (b) Top high of reinforcement (THR); (c) Bottom depth of penetration (DP); (d) Cross-sectional area of reinforcement (Ar); (e) Cross-sectional area of penetration (Ap) and (f) Dilution variation (Dv).
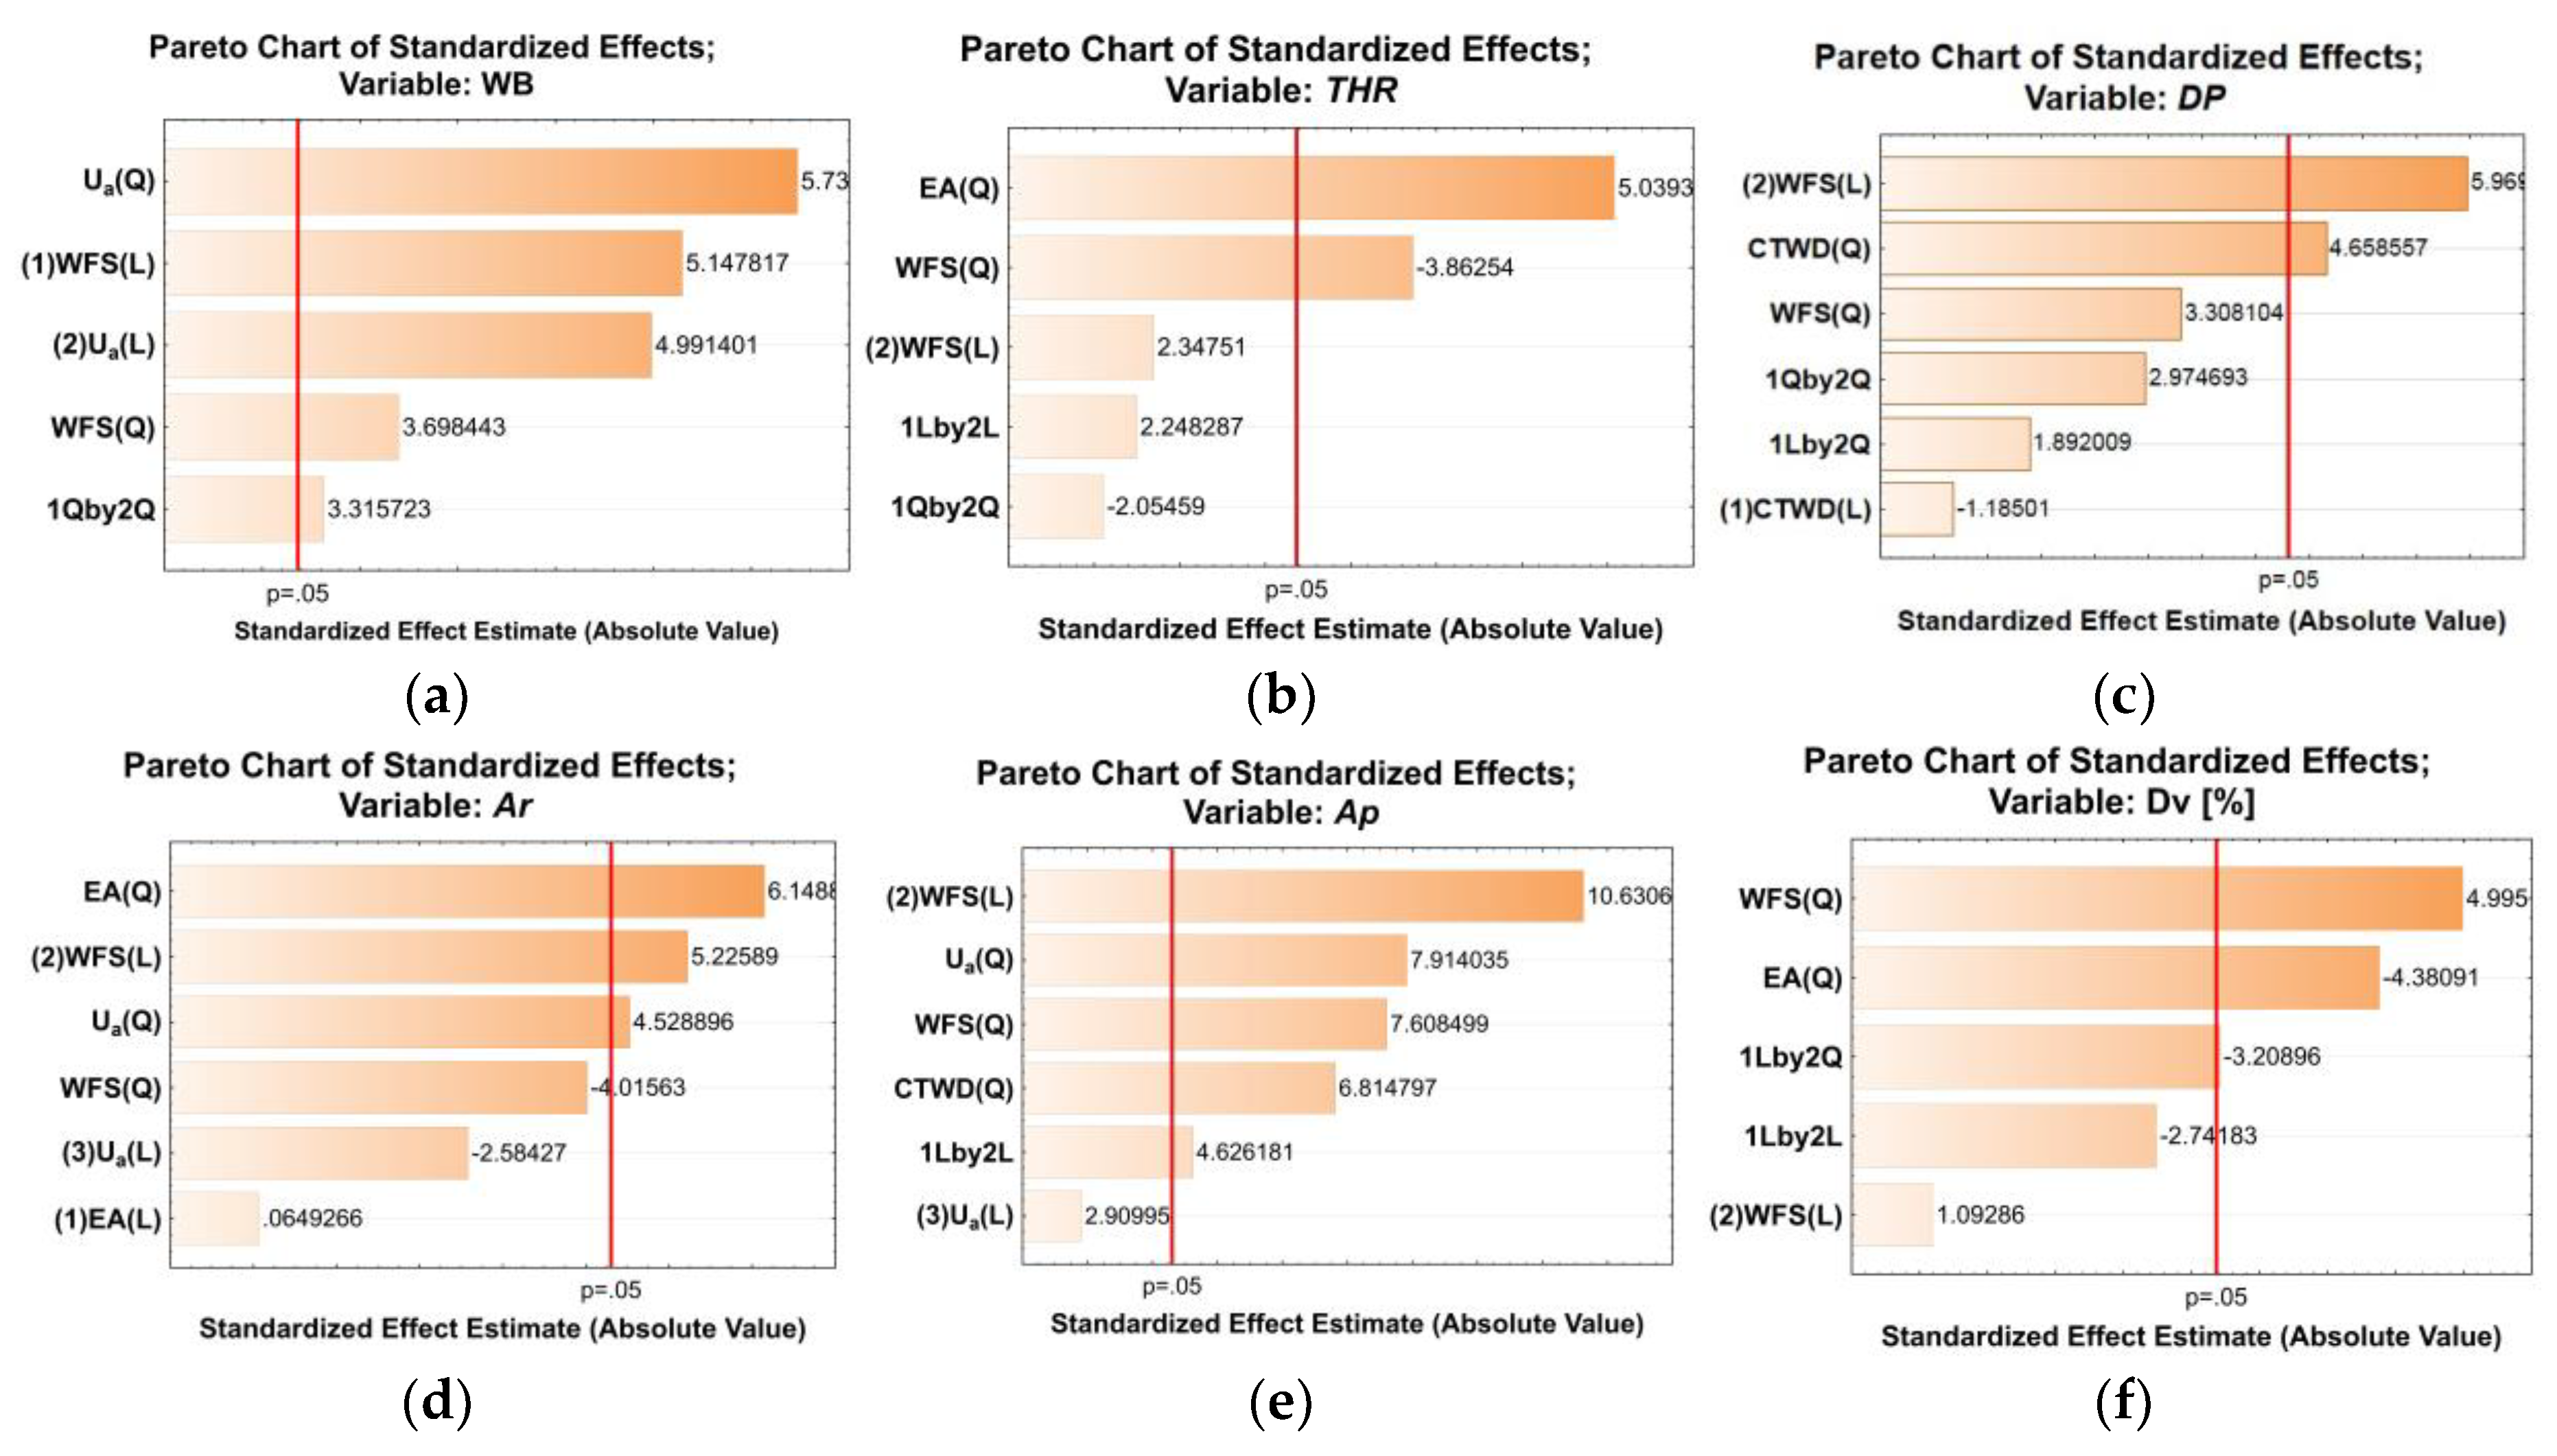
Figure 12.
Response surfaces plot for (a) Width bead (WB); (b) Top high of reinforcement (THR); (c) Bottom depth of penetration (DP); (d) Dilution variation (Dv).
Figure 12.
Response surfaces plot for (a) Width bead (WB); (b) Top high of reinforcement (THR); (c) Bottom depth of penetration (DP); (d) Dilution variation (Dv).
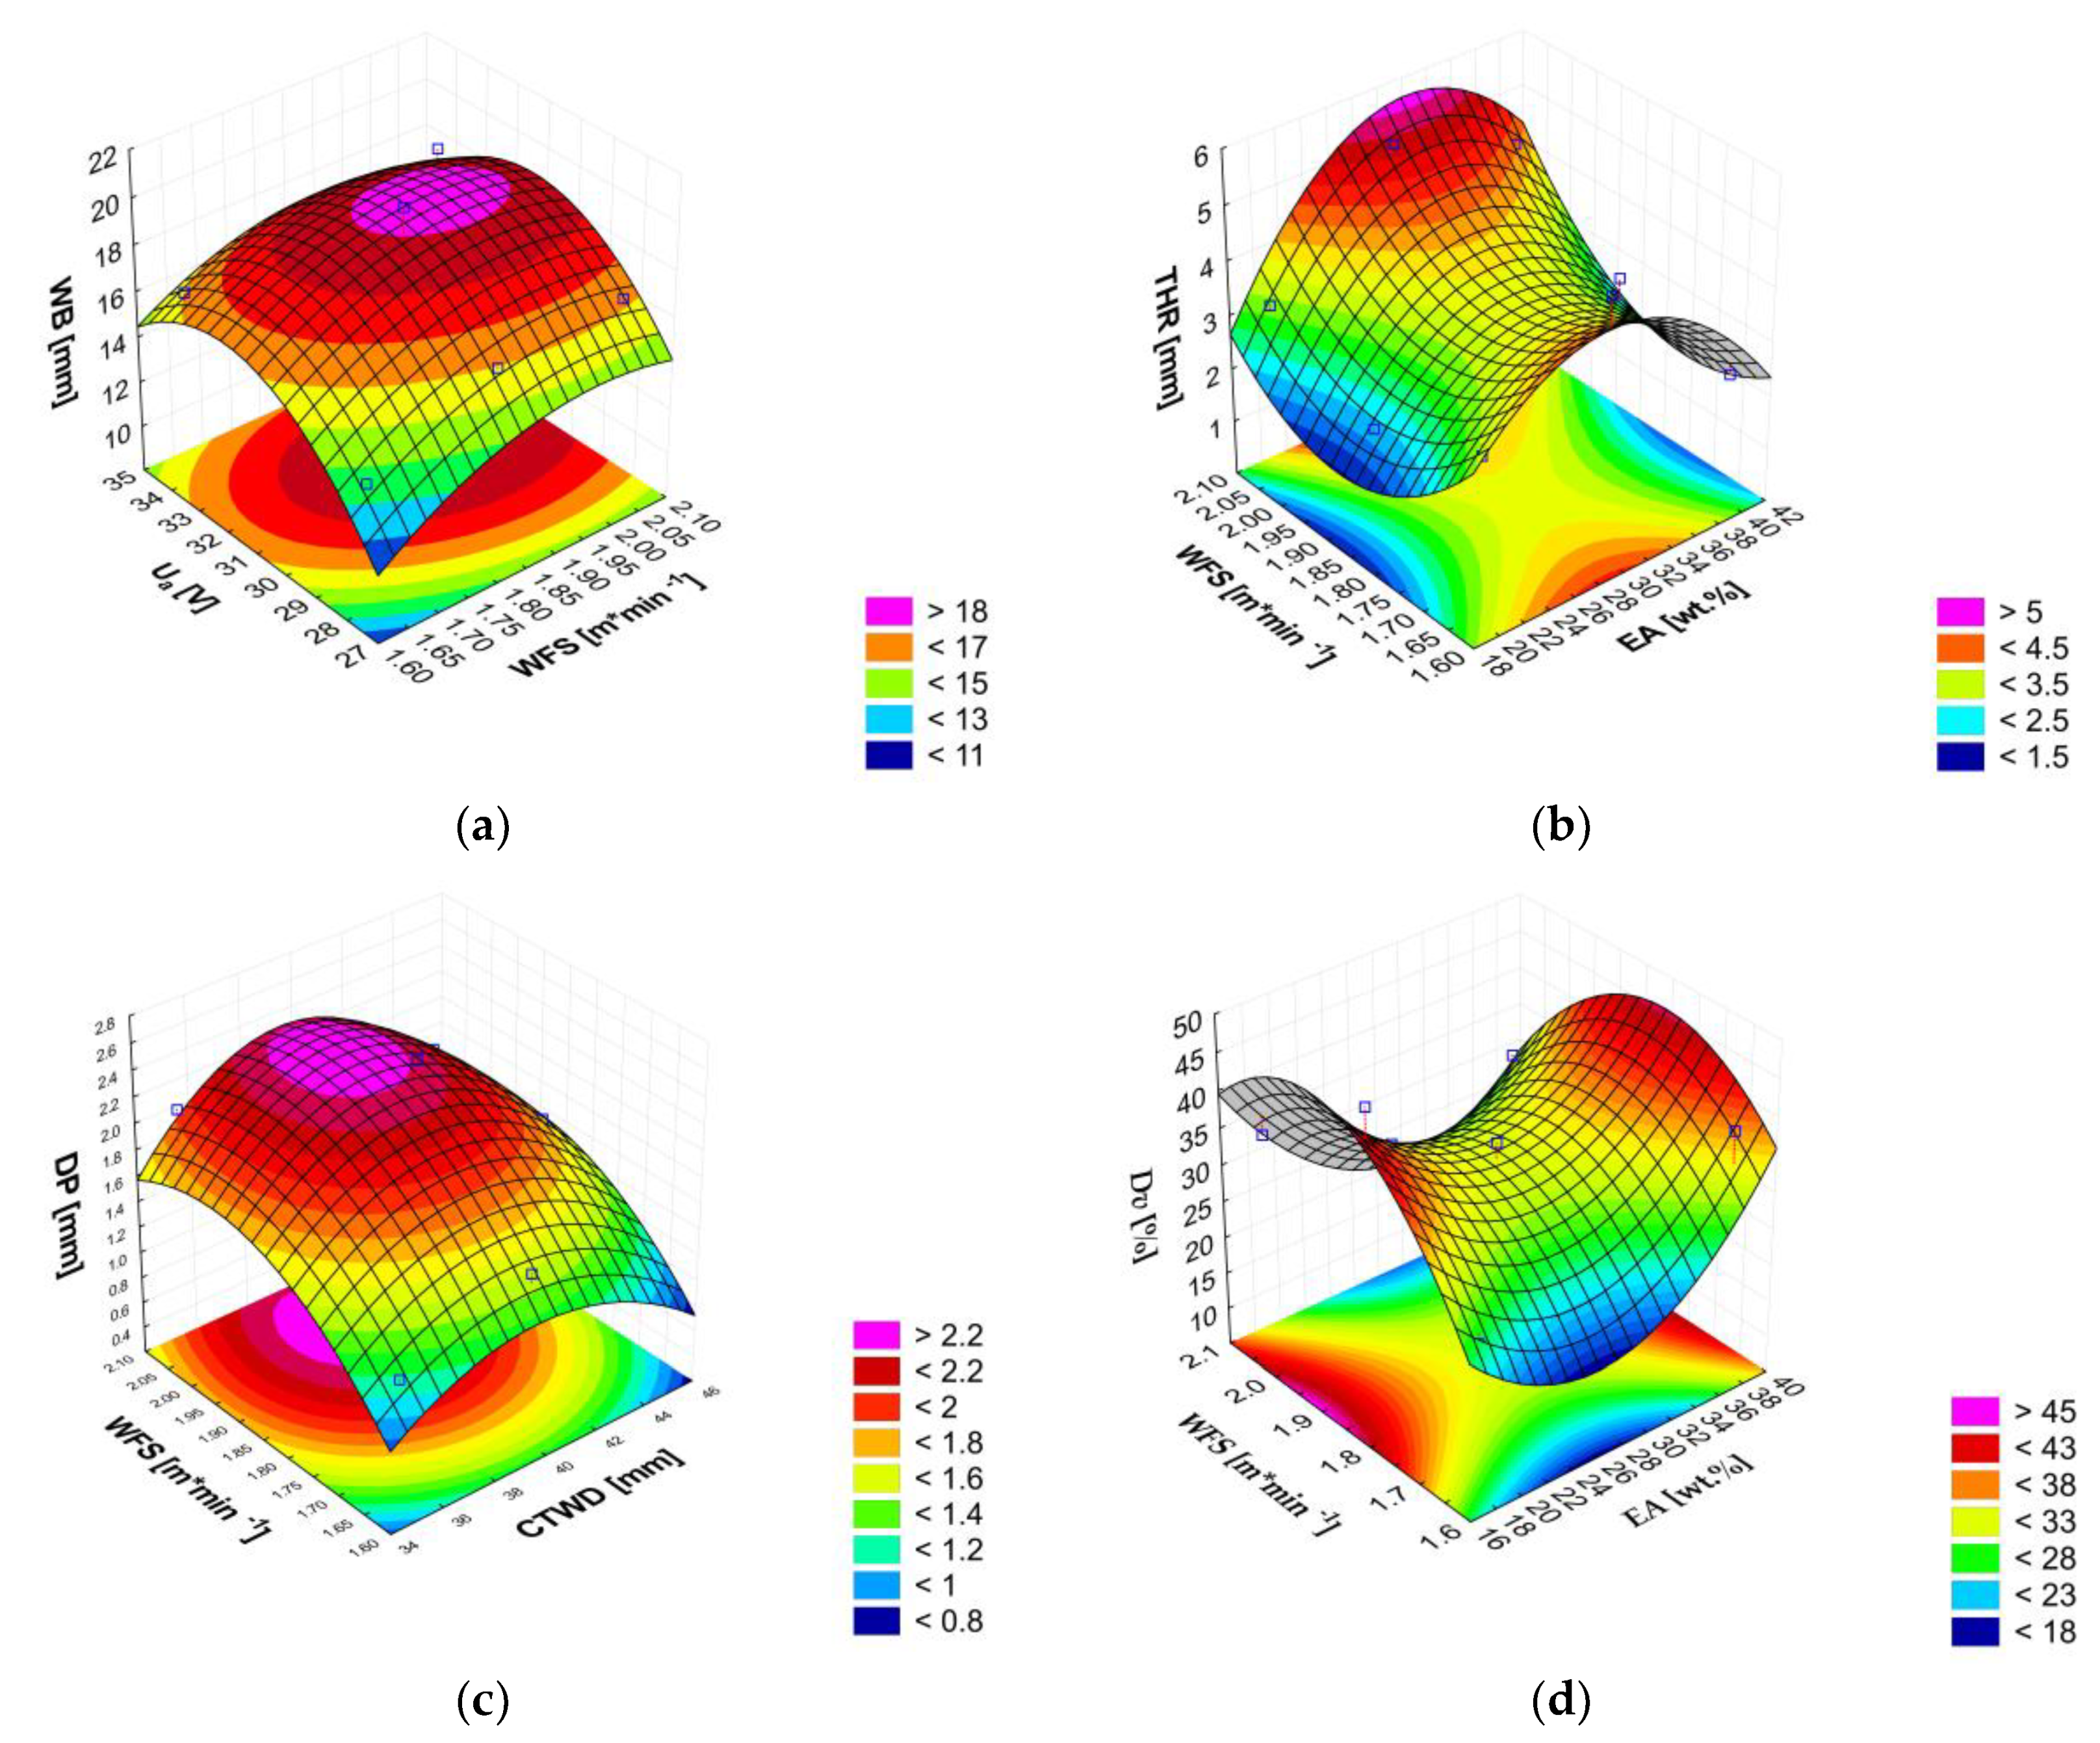
Figure 13.
Response surface with three slump levels for cross-sectional area of reinforcement (Ar): (a) high of percentage of exothermic mixture in the core filler (EA=38 wt.%), (b) medium of wire fide speed (WFS=1.85 m·min-1) and (c) medium of set voltage on the power source (Uset =31 V).
Figure 13.
Response surface with three slump levels for cross-sectional area of reinforcement (Ar): (a) high of percentage of exothermic mixture in the core filler (EA=38 wt.%), (b) medium of wire fide speed (WFS=1.85 m·min-1) and (c) medium of set voltage on the power source (Uset =31 V).
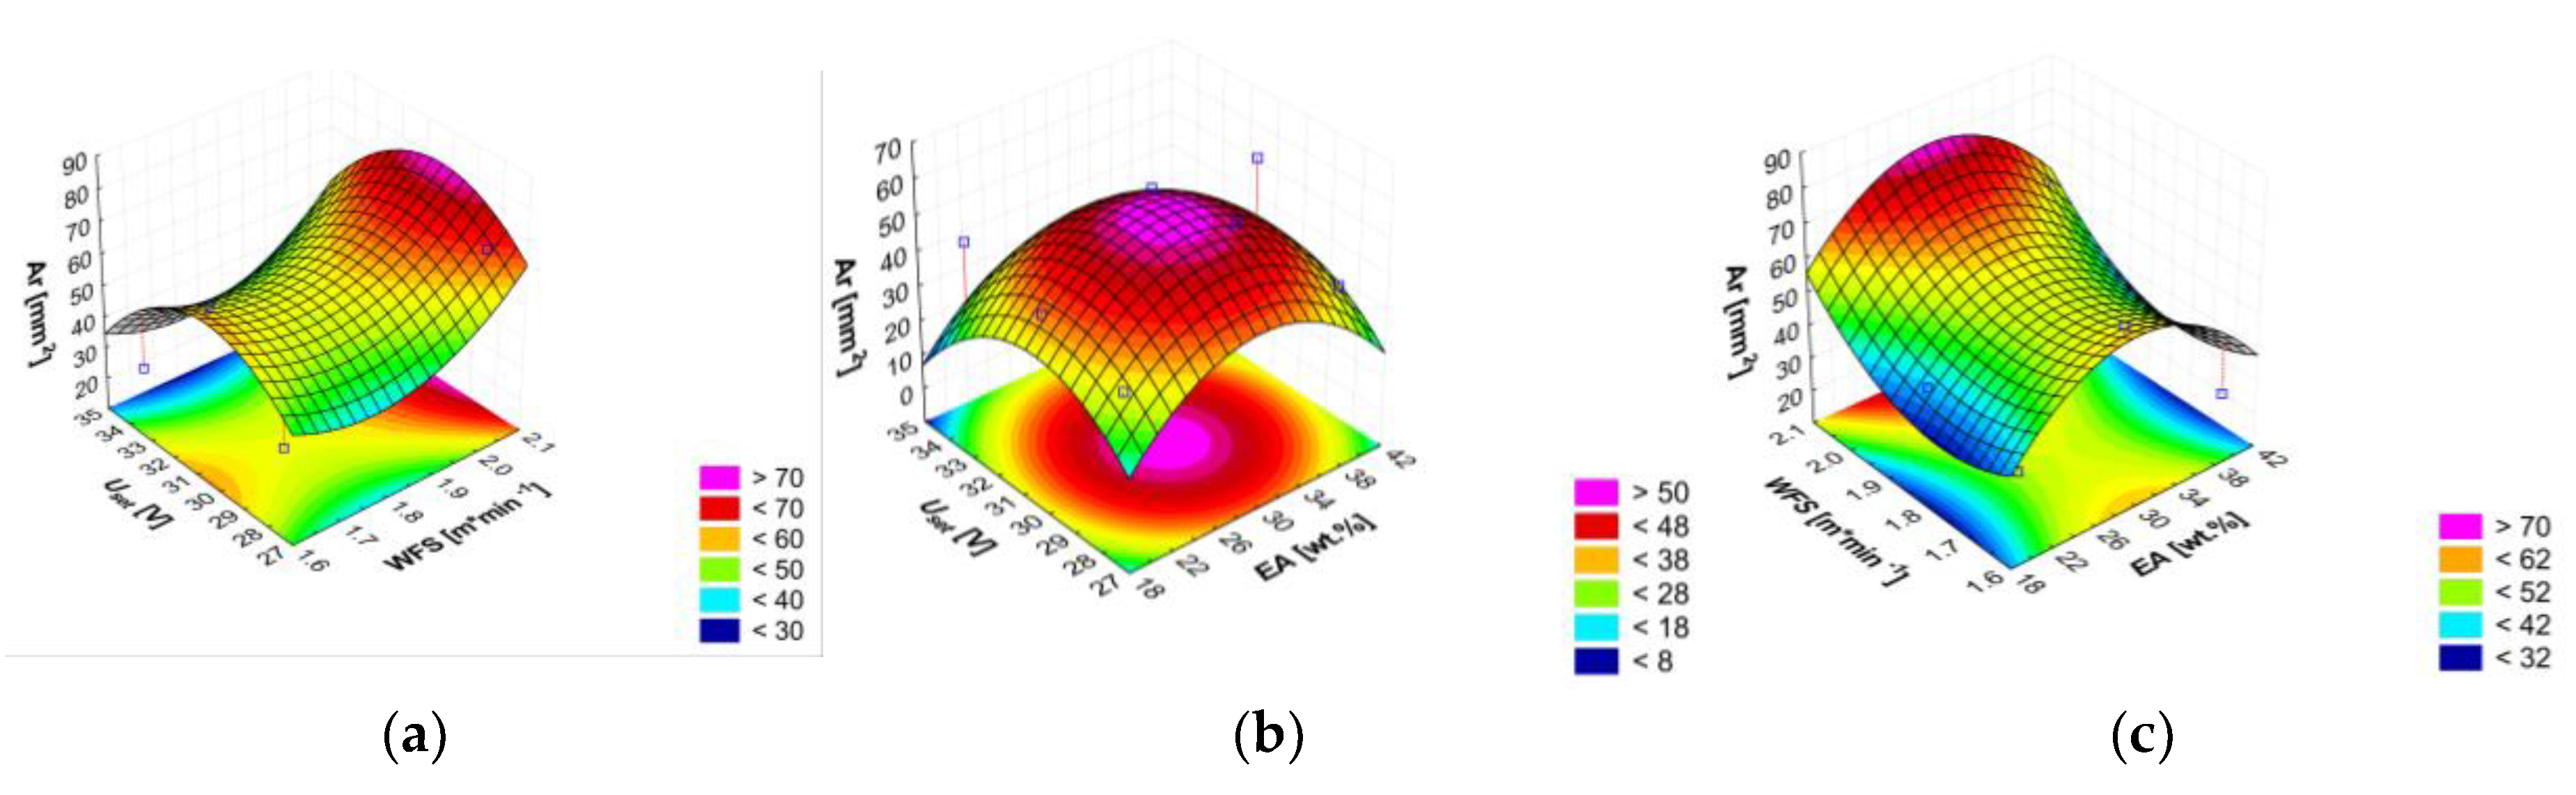
Figure 14.
Response surface with three slump levels for Cross-sectional area of penetration (Ap): (a) medium of wire fide speed (WFS=1.85 m·min-1), (b) high of contact tip-to-work distance (CTWD=45 mm) and (c) medium of set voltage on the power source (Uset =31 V).
Figure 14.
Response surface with three slump levels for Cross-sectional area of penetration (Ap): (a) medium of wire fide speed (WFS=1.85 m·min-1), (b) high of contact tip-to-work distance (CTWD=45 mm) and (c) medium of set voltage on the power source (Uset =31 V).
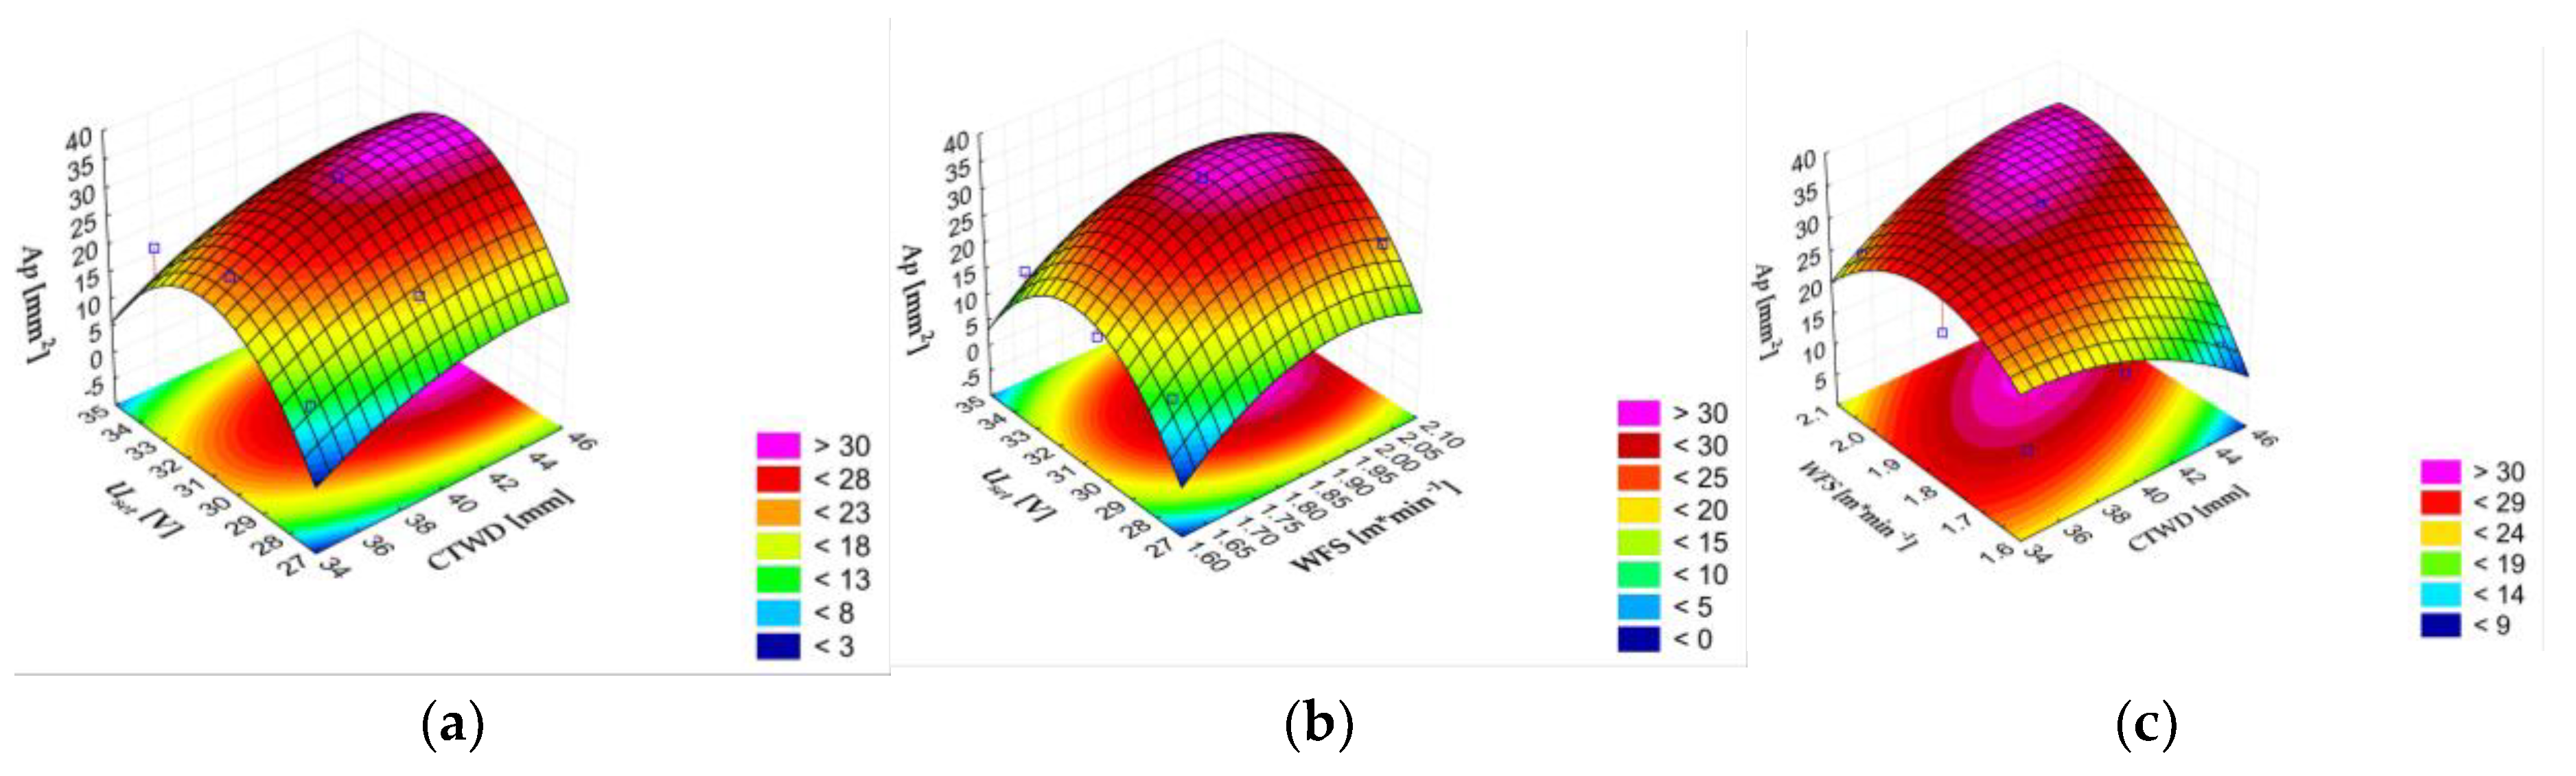

Table 1.
Input variables selected and their levels.
| Code | Input variable (Factor) | Unit | Notation | Level | ||
|
Low (1) |
Average (2) |
High (3) |
||||
| A | Percentage of exothermic mixture in the core filler | [m·min-1] | EA | 1.63 | 1.85 | 2.07 |
| B | Contact tip-to work distance | [mm] | CTWD | 35 | 40 | 45 |
| C | Wire feed speed | [m·min-1] | WFS | 1.50 | 2.07 | 2.73 |
| D | Set voltage on the power source | [V] | Uset | 26.0 | 31 | 34 |
Table 2.
Design matrix of the experiment of full factor analysis using the orthogonal array by the method.
Table 2.
Design matrix of the experiment of full factor analysis using the orthogonal array by the method.
|
№ Exp. |
Fact mean | |||
| ЕМ, [wt.%] | CTWD, [mm] | WFS, [m·min-1] | Uset, [V] | |
| 1 | 18 | 35 | 1.63 | 28 |
| 2 | 18 | 40 | 1.85 | 31 |
| 3 | 18 | 45 | 2.07 | 34 |
| 4 | 28 | 35 | 1.85 | 34 |
| 5 | 28 | 40 | 2.07 | 28 |
| 6 | 28 | 45 | 1.63 | 31 |
| 7 | 38 | 35 | 2.07 | 31 |
| 8 | 38 | 40 | 1.63 | 34 |
| 9 | 38 | 45 | 1.85 | 28 |
Table 3.
Selected categories for melting indices.
| Parameters | Melt-off rate (MOR) | Deposition rate (DR) | Spattering factor (SF) |
| Selected category |
Larger the better | Larger the better | Smaller the better |
| Parameters | Width bead (WB) | Top high of reinforcement (THR) | Bottom depth of penetration (DP) |
| Selected category |
Smaller the better | Large the better | Smaller the better |
| Parameters | Cross-sectional area of reinforcement (Ar) | Cross-sectional area of penetration (Ap) | Dilution variation (Dv) |
| Selected category |
Large the better | Smaller the better | Smaller the better |
Table 4.
Composition of core filler FCAW-SS, wt.%.
| The name of the component | Content of the components in core filler of FCAW-S, [wt.%] | ||
| Е1 | Е2 | Е3 | |
| Gas-slag-forming components | |||
| Fluorite concentrate GOST 4421-73 | 12 | 12 | 12 |
| Rutile concentrate GOST 22938-78 | 7 | 7 | 7 |
| Calcium carbonate GOST 8252-79 | 4 | 4 | 4 |
| Zirconium dioxide GOST 21907-76 | 15 | 5 | 0 |
| Components of exothermic addition | |||
| Oxide of copper powder GOST 16539– 79 | 15 | 23.3 | 32.5 |
| Aluminum powder PA1 GOST 6058-73 | 3 | 4.7 | 6.5 |
| Alloying and deoxidizers | |||
| Ferromanganese FMN-88A GOST 4755-91 | 6 | 6 | 6 |
| Ferrosilicon FS-92 GOST 1415-78 | 4 | 4 | 4 |
| Ferrovanadium FVd–40 GOST 27130–94 | 4 | 4 | 4 |
| Titanium powder PTM-3 TU 14-22-57-92 | 5 | 5 | 5 |
| Metal Chrome X99 GOST 5905-79 | 14.5 | 14.5 | 6.5 |
| Graphite | 4.5 | 4.5 | 4.5 |
| Iron powder PZhR-1 GOST 9849-86 | 10 | 5 | 10 |
Table 5.
Experimental and calculated values of melting characteristics such as: melting rate (MOR); deposition rate (DR); spatter factor (SF); deposition efficiency (De).
Table 5.
Experimental and calculated values of melting characteristics such as: melting rate (MOR); deposition rate (DR); spatter factor (SF); deposition efficiency (De).
|
№ Exp. |
Melt-off rate MOR, [kg·hr-1] | Deposition rate DR, [kg·hr-1] | ||||||||||||||
| MOR(e) | MOR(с) | Difference | Deviation | DR(e) | DR(с) | Difference | Deviation | |||||||||
| 1 | 4.43 | 4.43 | 0.001 | 0.01% | 3.88 | 3.88 | 0.0043 | 0.11% | ||||||||
| 2 | 4.83 | 4.83 | 0.000 | 0.00% | 4.28 | 4.28 | 0.0000 | 0.00% | ||||||||
| 3 | 5.04 | 5.04 | 0.000 | 0.01% | 4.52 | 4.52 | 0.0043 | 0.09% | ||||||||
| 4 | 5.38 | 5.38 | 0.003 | 0.06% | 4.79 | 4.81 | 0.0171 | 0.36% | ||||||||
| 5 | 5.73 | 5.72 | 0.003 | 0.04% | 5.07 | 5.07 | 0.0000 | 0.00% | ||||||||
| 6 | 4.85 | 4.85 | 0.001 | 0.01% | 4.51 | 4.49 | 0.0171 | 0.38% | ||||||||
| 7 | 5.52 | 5.52 | 0.002 | 0.04% | 5.16 | 5.15 | 0.0086 | 0.17% | ||||||||
| 8 | 4.37 | 4.37 | 0.001 | 0.03% | 3.98 | 3.98 | 0.0000 | 0.00% | ||||||||
| 9 | 5.04 | 5.04 | 0.003 | 0.07% | 4.83 | 4.84 | 0.0086 | 0.18% | ||||||||
|
№ Exp. |
Spattering factor SF [%] | Deposition efficiency De [%] | ||||||||||||||
| SF(e) | SF(с) | Difference | Deviation | De(e) | De(с) | Difference | Deviation | |||||||||
| 1 | 9.68 | 9.73 | 0.050 | 0.52% | 87.55% | 87.79% | 0.24% | 0.27% | ||||||||
| 2 | 8.45 | 9.16 | 0.707 | 8.51% | 88.70% | 88.28% | 0.42% | 0.47% | ||||||||
| 3 | 10.12 | 9.36 | 0.757 | 7.71% | 89.68% | 89.86% | 0.18% | 0.20% | ||||||||
| 4 | 10.15 | 10.86 | 0.707 | 6.89% | 89.09% | 88.67% | 0.42% | 0.47% | ||||||||
| 5 | 11.12 | 10.36 | 0.757 | 6.80% | 88.53% | 88.71% | 0.18% | 0.20% | ||||||||
| 6 | 6.02 | 6.07 | 0.050 | 0.83% | 93.02% | 93.26% | 0.24% | 0.25% | ||||||||
| 7 | 5.35 | 4.44 | 0.757 | 14.55% | 93.54% | 93.72% | 0.18% | 0.19% | ||||||||
| 8 | 7.9 | 8.05 | 0.050 | 0.62% | 91.00% | 91.24% | 0.24% | 0.26% | ||||||||
| 9 | 3.52 | 3.91 | 0.707 | 22.08% | 95.76% | 95.34% | 0.42% | 0.44% | ||||||||
The indices on the right side of the geometric parameter notation have the following meanings: (e)–experimental values; (c)–calculated values obtained by introducing the corresponding values of variables into the developed mathematical models.
Table 6.
Result of analysis of variance for the applied conditions on melting characteristics.
| Criteria | Mathematical model | |||
| Y(MOR) | Y(DR) | Y(SF) | Y(De) | |
| Coefficient of Determination (R sqr) | 0.9998 | 0.9855 | 0.9999 | 0.9738 |
| Adjusted Sum of Squares (R Adj) |
0.9994 | 0.9422 | 0.9989 | 0.9301 |
| Model quality | Very good | Very good | Very good | Very good |
Table 7.
Experimental and calculated values of melting characteristics such as: melting rate (MOR); deposition rate (DR); spatter factor (SF); deposition efficiency (De).
Table 7.
Experimental and calculated values of melting characteristics such as: melting rate (MOR); deposition rate (DR); spatter factor (SF); deposition efficiency (De).
|
№ Exp. |
Width bead | Top high of reinforcement | ||||||||||||||||||||||||
| Experimental |
WB(с) [mm] |
Diff. [mm] |
Dev. [%] |
Experimental |
THR(с) [mm] |
Diff. [mm] |
Dev. [%] |
|||||||||||||||||||
| 1 | 2 |
WB(e) [mm] |
1 | 2 |
THR(e) [mm] |
|||||||||||||||||||||
| 1 | 13.85 | 13.25 | 13.55 | 13.812 | -0.262 | 1.93 | 3.08 | 3.08 | 3.08 | 3.301 | -0.221 | 7.18 | ||||||||||||||
| 2 | 20.343 | 19.89 | 20.12 | 19.046 | 1.070 | 5.32 | 2.72 | 1.69 | 2.20 | 2.101 | 0.099 | 4.50 | ||||||||||||||
| 3 | 18.77 | 17.29 | 18.03 | 17.820 | 0.210 | 1.16 | 3.20 | 3.15 | 3.17 | 3.079 | 0.094 | 2.95 | ||||||||||||||
| 4 | 16.315 | 18.154 | 17.23 | 18.069 | -0.834 | 4.84 | 3.26 | 3.04 | 3.15 | 3.663 | -0.513 | 16.28 | ||||||||||||||
| 5 | 16.63 | 16.06 | 16.35 | 15.847 | 0.498 | 3.05 | 5.32 | 5.00 | 5.16 | 5.156 | 0.001 | 0.02 | ||||||||||||||
| 6 | 17.54 | 15.26 | 16.40 | 16.763 | -0.363 | 2.21 | 5.11 | 4.60 | 4.86 | 4.296 | 0.561 | 11.54 | ||||||||||||||
| 7 | 19.18 | 17 | 18.09 | 18.798 | -0.708 | 3.91 | 3.46 | 5.03 | 4.24 | 4.339 | -0.095 | 2.23 | ||||||||||||||
| 8 | 16.32 | 16.5 | 16.41 | 15.785 | 0.625 | 3.81 | 2.32 | 2.49 | 2.41 | 2.746 | -0.340 | 14.11 | ||||||||||||||
| 9 | 16.43 | 15.29 | 15.86 | 16.096 | -0.236 | 1.49 | 3.11 | 2.74 | 2.93 | 2.515 | 0.414 | 14.13 | ||||||||||||||
|
№ Exp. |
Bottom depth of penetration | Cross-sectional area of reinforcement | ||||||||||||||||||||||||
| Experimental |
DP(с) [mm] |
Diff. [mm] |
Dev. [%] |
Experimental |
Ar(с) [mm2] |
Diff. [mm2] |
Dev. [%] |
|||||||||||||||||||
| 1 | 2 |
DP(e) [mm] |
1 | 2 |
Ar(e) [mm2] |
|||||||||||||||||||||
| 1 | 1.242 | 1.149 | 1.20 | 1.03 | 0.17 | 13.83 | 33.14 | 32.446 | 32.79 | 34.39 | -1.60 | 4.83 | ||||||||||||||
| 2 | 2.6 | 2.543 | 2.57 | 2.28 | 0.30 | 11.49 | 44.75 | 32.97 | 38.86 | 39.64 | -0.78 | 1.74 | ||||||||||||||
| 3 | 2 | 1.486 | 1.74 | 1.75 | -0.01 | 0.45 | 47.78 | 41.455 | 44.62 | 42.24 | 2.38 | 4.98 | ||||||||||||||
| 4 | 1.6 | 1.458 | 1.53 | 1.74 | -0.21 | 13.88 | 39.483 | 37.44 | 38.46 | 40.06 | -1.60 | 4.05 | ||||||||||||||
| 5 | 1.829 | 2.2 | 2.01 | 2.15 | -0.14 | 6.91 | 69.36 | 60.74 | 65.05 | 65.83 | -0.78 | 1.12 | ||||||||||||||
| 6 | 0.858 | 1 | 0.93 | 0.94 | -0.01 | 0.95 | 70.29 | 50.7 | 60.50 | 58.12 | 2.38 | 3.38 | ||||||||||||||
| 7 | 1.916 | 2.286 | 2.10 | 1.95 | 0.15 | 7.00 | 51.254 | 61.382 | 56.32 | 57.92 | -1.60 | 3.12 | ||||||||||||||
| 8 | 1.315 | 1.72 | 1.52 | 1.67 | -0.16 | 10.31 | 24.453 | 27.816 | 26.13 | 26.91 | -0.78 | 3.18 | ||||||||||||||
| 9 | 1.77 | 1.657 | 1.71 | 1.70 | 0.02 | 0.98 | 34.853 | 33.94 | 34.40 | 32.02 | 2.38 | 6.82 | ||||||||||||||
|
№ Exp. |
Cross-sectional area of penetration | Dilution variation | ||||||||||||||||||||||||
| Experimental |
Ap(с) [mm2] |
Diff. [mm2] |
Dev. [%] |
Experimental | Dv(с) | Diff. | Dev. [%] |
|||||||||||||||||||
| 1 | 2 | Ap(e) | 1 | 2 | Dv(e) | |||||||||||||||||||||
| 1 | 12 | 10.78 | 11.39 | 13.28 | -1.89 | 15.72 | 26.58 | 24.94 | 25.76 | 27.19 | -1.43 | 5.54 | ||||||||||||||
| 2 | 35.917 | 31.878 | 33.90 | 33.07 | 0.83 | 2.30 | 44.53 | 49.16 | 46.84 | 42.74 | 4.10 | 8.75 | ||||||||||||||
| 3 | 27.385 | 19.128 | 23.26 | 25.03 | -1.78 | 6.48 | 36.43 | 31.57 | 34.00 | 37.15 | -3.14 | 9.25 | ||||||||||||||
| 4 | 17.423 | 23.87 | 20.65 | 21.71 | -1.07 | 6.12 | 30.62 | 38.93 | 34.78 | 32.64 | 2.13 | 6.13 | ||||||||||||||
| 5 | 20.776 | 23.17 | 21.97 | 20.33 | 1.65 | 7.92 | 23.05 | 27.61 | 25.33 | 23.67 | 1.66 | 6.57 | ||||||||||||||
| 6 | 14.1 | 12.24 | 13.17 | 14.13 | -0.96 | 6.78 | 16.71 | 19.45 | 18.08 | 21.07 | -2.99 | 16.56 | ||||||||||||||
| 7 | 25.82 | 23.26 | 24.54 | 24.41 | 0.13 | 0.50 | 33.50 | 27.48 | 30.49 | 29.01 | 1.48 | 4.85 | ||||||||||||||
| 8 | 17.37 | 14.89 | 16.13 | 13.29 | 2.84 | 16.36 | 41.53 | 34.87 | 38.20 | 33.78 | 4.42 | 11.57 | ||||||||||||||
| 9 | 20.66 | 16.76 | 18.71 | 18.47 | 0.24 | 1.17 | 37.22 | 33.06 | 35.14 | 41.37 | -6.23 | 17.73 | ||||||||||||||
The indices on the right side of the geometric parameter notation have the following meanings: (e)–experimental values; (c)–calculated values obtained by introducing the corresponding values of variables into the developed mathematical models.
Table 8.
Result of analysis of variance for the applied conditions on melting characteristics.
| Criteria | Mathematical model | |||||
| Y(WB) | Y(THR) | Y(DP) | Y(Ar) | Y(Ap) | Y(Dv) | |
| Coefficient of Determination (R sqr) | 0.87505 | 0.94837 | 0.97622 | 0.98189 | 0.99316 | 0.95465 |
| Adjusted Sum of Squares (R Adj) |
0.75009 | 0.86231 | 0.90489 | 0.92756 | 0.97263 | 0.87907 |
| Model quality | Good | Good | Good | Very good | Very good | Good |
Table 9.
Normalized data of response characteristics.
|
№ Exp. |
DRn | SFn | Ar | Dv n |
| 1 | 0.000000 | 0.179293 | 0.171120 | 0.717582 |
| 2 | 0.312500 | 0.356061 | 0.327081 | 0.000000 |
| 3 | 0.500000 | 0.164141 | 0.475077 | 0.257960 |
| 4 | 0.710938 | 0.109848 | 0.316804 | 0.466082 |
| 5 | 0.929688 | 0.000000 | 1.000000 | 0.880018 |
| 6 | 0.492187 | 0.643939 | 0.883094 | 1.000000 |
| 7 | 1.000000 | 0.747475 | 0.775694 | 0.633595 |
| 8 | 0.078125 | 0.393939 | 0.000000 | 0.413475 |
| 9 | 0.742188 | 1.000000 | 0.212487 | 0.292570 |
Table 10.
PCA Components (Loadings).
| Principal component | MOR | DR | SF | De |
| PC1 | 0.591220 | 0.063572 | 0.672680 | 0.440362 |
| PC2 | 0.354118 | 0.845546 | -0.148242 | -0.371048 |
| PC3 | -0.521316 | 0.511276 | -0.036763 | 0.682257 |
| PC4 | -0.503278 | 0.140025 | 0.723999 | -0.450478 |
Table 11.
Grey Relational Grades.
|
№ Exp. |
GRA | Rank |
| 1 | 0.433296 | 7 |
| 2 | 0.402523 | 8 |
| 3 | 0.445944 | 6 |
| 4 | 0.487322 | 5 |
| 5 | 0.778055 | 1 |
| 6 | 0.722851 | 3 |
| 7 | 0.745481 | 2 |
| 8 | 0.396078 | 9 |
| 9 | 0.598183 | 4 |
Disclaimer/Publisher’s Note: The statements, opinions and data contained in all publications are solely those of the individual author(s) and contributor(s) and not of MDPI and/or the editor(s). MDPI and/or the editor(s) disclaim responsibility for any injury to people or property resulting from any ideas, methods, instructions or products referred to in the content. |
© 2025 by the authors. Licensee MDPI, Basel, Switzerland. This article is an open access article distributed under the terms and conditions of the Creative Commons Attribution (CC BY) license (http://creativecommons.org/licenses/by/4.0/).
Copyright: This open access article is published under a Creative Commons CC BY 4.0 license, which permit the free download, distribution, and reuse, provided that the author and preprint are cited in any reuse.


